Embed Size (px)
Citation preview
Integrated Systems View on Networking by Hormonesin Arabidopsis Immunity Reveals Multiple Crosstalkfor Cytokinin W
Muhammad Naseem,a Nicole Philippi,a,1 Anwar Hussain,b,2 Gaby Wangorsch,a Nazeer Ahmed,c
and Thomas Dandekara,3
a Department of Bioinformatics, Biocenter, D-97074 Wuerzburg, GermanybDepartment of Microbiology and Molecular Genetics, University of the Punjab, Lahore 54590, PakistancDepartment of Biotechnology and Informatics, Balochistan University of Information Technology, Engineering and ManagementSciences, Quetta 87300, Pakistan
Phytohormones signal and combine to maintain the physiological equilibrium in the plant. Pathogens enhance hostsusceptibility by modulating the hormonal balance of the plant cell. Unlike other plant hormones, the detailed role ofcytokinin in plant immunity remains to be fully elucidated. Here, extensive data mining, including of pathogenicity factors, hostregulatory proteins, enzymes of hormone biosynthesis, and signaling components, established an integrated signalingnetwork of 105 nodes and 163 edges. Dynamic modeling and system analysis identified multiple cytokinin-mediatedregulatory interactions in plant disease networks. This includes specific synergism between cytokinin and salicylic acidpathways and previously undiscovered aspects of antagonism between cytokinin and auxin in plant immunity. Predictedinteractions and hormonal effects on plant immunity are confirmed in subsequent experiments with Pseudomonas syringaepv tomato DC3000 and Arabidopsis thaliana. Our dynamic simulation is instrumental in predicting system effects of individualcomponents in complex hormone disease networks and synergism or antagonism between pathways.
INTRODUCTION
Plant pathogen interactions are the consequence of a dynamic co-evolution. Mounting resistance on the part of the host is balancedby altered virulence on the part of the pathogen. This monolayerparadigm, known as the gene-to-gene concept, turned into a mul-tiphase zigzag logical model when sufficient data became availableon the innate components of plant immunity (Jones and Dangl,2006). Both pathogen-associated molecular patterns (PAMPs)and effectors are pathogenicity factors, which provoke immunetriggers in the host (Schneider and Collmer, 2010). No matterwhether these triggers lead to resistance or susceptibility, plant im-mune networks and the ultimate phenotype (Robert-Seilaniantzet al., 2011a) are often critically determined by small moleculeswith hormonal properties (salicylic acid [SA], jasmonic acid [JA],auxin, ethylene [ET], gibberellic acid [GA], abscisic acid [ABA],and various cytokinins). With the spotlight more on other phy-tohormones, the detailed effects of cytokinin in plant immunity inthis context remain unclear. By modeling and experiments, we
highlight the role of hormone molecules in plant immunity. Inparticular, we provide a new perspective on auxin-cytokinin an-tagonism and insights into cytokinin-SA crosstalk. Our validateddynamic model is a starting point in revealing hormonal impli-cations for plant immunity.In plants, pathogen attack causes hormonal perturbations
both at the host-pathogen interface (local response; Melottoet al., 2006) and beyond (systemic response; Mishina and Zeier,2007). Depending upon the nature of pathogen, either SA-mediated (biotrophs; Glazebrook 2005) or JA/ET-mediated(necrotrophs; Lai et al., 2011) defense pathways are operative inplants (Grant and Jones, 2009). Antagonism of JA to SA andsynergism to ET has long been elucidated (reviewed in Robert-Seilaniantz et al., 2011b). ET-based synergism is not limitedonly to JA; rather, there exists a synergistic crosstalk betweenpathways of ET and SA as well (Pieterse et al., 2009). Recentinvestigations show that SA-JA/JA signaling pathways are in-terconnected, and if nodes are mutated or inhibited, the re-sponse is either shifted toward one or the other counterpart(Sato et al., 2010). Growth regulatory hormones, such as auxin,add to JA-mediated responses and suppress the SA pathway(Wang et al., 2007). Likewise, ABA antagonizes SA-dependentdefense signaling both upstream and downstream of SA bio-synthesis, whereas SA abolishes ABA responses (de TorresZabala et al., 2009; Cao et al., 2011). On the contrary, GA ex-pedites SA accumulation (Navarro et al., 2008; Alonso-Ramírezet al., 2009) and also promotes resistance against Pseudomo-nas syringae pv tomato DC3000 (hereafter referred to as Pst) bydegrading DELLA proteins (Navarro et al., 2008). Taking thisbackground carefully into account, we established an integrated
1Current address: Max Planck Institute for Biology of Aging, Bioinfor-matics Group, Robert-Koch-Strasse 21, D-50931 Cologne, Germany.2 Current address: Department of Botany, Shankar Campus, Abdul WaliKhan University, Mardan 23200, Pakistan.3 Address correspondence to [email protected] authors responsible for distribution of materials integral to thefindings presented in this article in accordance with the policy describedin the Instructions for Authors (www.plantcell.org) are: MuhammedNaseem ([email protected]) and Thomas Dan-dekar ([email protected]).WOnline version contains Web-only data.www.plantcell.org/cgi/doi/10.1105/tpc.112.098335
This article is a Plant Cell Advance Online Publication. The date of its first appearance online is the official date of publication. The article has been
edited and the authors have corrected proofs, but minor changes could be made before the final version is published. Posting this version online
reduces the time to publication by several weeks.
The Plant Cell Preview, www.aspb.org ã 2012 American Society of Plant Biologists. All rights reserved. 1 of 22
network of hormonal interactions to perform dynamic simu-lations on various aspects of plant immunity.
Regarding immunity, it is the collective temporal dynamic ofhormones during infection dictated by the ability of the host tomitigate (Bari and Jones, 2009) and the pathogen to propagate(Robert-Seilaniantz et al., 2007) that determines the outcomeof the plant–microbe interactions. Successful infections propa-gate through multiple phases, the simplest deconstruction beingentry (Melotto et al., 2008), suppression of basal defense (Bollerand He, 2009), reconfiguration of host metabolism (Rico andPreston, 2008), and persistence in an equilibrium related toa metabolic balance between host and pathogen (Rico et al.,2011). However, it is not sufficient to collate a wealth of literatureand infer processes from this. We hence advocate and developa dynamic network model. By virtue of this, the zigzag model ofimmunity (Jones and Dangl, 2006) can be studied in the contextof its hormonal dynamics, including semiquantitative informationon activity and the temporal sequence of activated nodes.Moreover, hormonal poise is fine-tuned through various phasesof infection, and all of the hormones mentioned above partici-pate in this process. Thus, JA, ABA, ET, and GA are equallyrelevant in the infection process (Verhage et al., 2010) and canbe analyzed within the context of our simulation (see Methods;see Supplemental Figures 1 and 2 and Supplemental Methods 1online), but their detailed interplay is not our focus here (in-cluding, for example, their biochemical production as new out-put). We intensively analyzed our model with special referenceto cytokinin and the impact cytokinin has on various compo-nents of plant immunity.
The potential role of cytokinin in plant immunity in generaland a link to the SA-JA/ET backbone in particular is still unclear.Apart from their role in tumor and gall formation (Tzfira andCitovsky, 2006; Siemens et al., 2006) and generation of greenislands around the infection of fungal biotrophs (Walters andMcRoberts, 2006), cytokinin has not been assigned a con-clusive role in plant pathogen interaction. Nevertheless, manybiotrophic and hemibiotrophic pathogens pattern their in plantacytokinin secreting capability to increase uptake of nutrients andhost cell cycle regulation for self-establishment (Walters andMcRoberts, 2006; Pertry et al., 2009). Moreover, there arereports about enhanced plant resistance to viral pathogensin the context of increased cytokinin levels of the plant (Clarkeet al., 1998; Fayza and Sabrey, 2006). It has been shown thatcytokinin promotes resistance in Arabidopsis thaliana to theinfection of Alternaria brassicicola as well as Pst (Choi et al.,2010). Moreover, increased resistance to infection by P. syringaepv tabaci in tobacco (Nicotiana tabacum; Grosskinsky et al.,2011) and reduction in the performance of herbivores in poplars(Populus spp; Dervinis et al., 2010) have been associatedwith higher levels of cytokinin. Recently, Argueso et al. (2012)demonstrated enhanced and reduced susceptibility againstinfection by Hyaloperonospora arabidopsidis (Hpa Noco 2)in Arabidopsis with lower and higher cytokinin levels, re-spectively. Therefore, itis plausible that in plant cellular circuitrycytokinin signaling has multiple interaction possibilities andthat each interaction has its own dynamics in plant pathogenimmune networks with responses that optimize plant defenseagainst the respective pathogen.
Broadly, biological networks are mathematical representa-tions of biological structure where nodes are connected viaedges and thus constitute a graph (Albert, 2005). Based on thetype of interacting nodes, the following networks can be dis-tinguished: metabolic (Schuster et al., 2000), protein–proteininteraction (Li et al., 2006), transcriptional regulation (Sato et al.,2010), and signaling networks (Liu et al., 2010). Depending uponthe network, edges are either nondirectional or directed fromone node to the other. Edges depict processes, which requiretime, context, and kinetics to occur (Pritchard and Birch, 2011).Nodes of maximum connectivity are called hubs. They are ofdifferent functional types, for instance “party” or “date” hubsaccumulating general or specific interactions regarding time andtype of interaction (Han et al., 2004) Depending on the exactcase, they can be of central importance for network structure aswell as biological function (Mukhtar et al., 2011). SA and DELLAproteins are examples of functionally important hub nodes in ournetwork topology. Indicator nodes are densely connected, butunlike a hub, indicator nodes such as pathogenesis-relatedprotein1 (PR-1) have minuscule impact on structural and func-tional orientation of the network but give an indication of the finaloutcome of input stimuli.Network-associated complexity can sometimes be captured
with parametric mathematical approaches, such as ordinarydifferential equation (ODE) models. However, these require de-tailed kinetic data and other parameters (Wangorsch et al.,2011). Alternatively, parameter-free qualitative approaches,such as Boolean networks, can also model complex dynamicbehavior (Ay et al., 2009; Pomerance et al., 2009). “Boolean”refers to dynamic models in which each node is characterizedby two qualitative states (often referred to as on or off) (Philippiet al., 2009). Boolean network models have an advantage overODE-based kinetic models regarding complex networks in-cluding immune and pathogen responses (Wittmann et al.,2009). In contrast with ODE models, Boolean network modelscan also work when kinetic information is scarce and manynodes are involved (Schlatter et al., 2011). SQUAD (Standard-ized Qualitative Dynamical systems; Di Cara et al., 2007) isa powerful modeling package that combines Boolean and ODEmodels. This approach is an extension of Boolean modeling.It creates a system of exponential functions that allows in-terpolation between the step function of Boolean models ac-cording to the sum of activating and inhibitory input (Philippiet al., 2009). It allows qualitative modeling of networks with theadded possibility of quantitative information. Using standardizedqualitative dynamic modeling, we analyzed plant hormone dis-ease networks and performed simulations on pathogen- medi-ated perturbations in Arabidopsis.In this study, we use dynamic modeling to better understand
the complex network interactions around plant immunity afterpathogen attack. We model the interactions following infectionby pathogen Pst in host plant Arabidopsis. Modeled responsesare consistent with reported experimental data. Predictions arenext extended to cytokinin and experimentally validated to showpoints where cytokinin enhances plant immunity. Further anal-ysis shows that protection mediated by cytokinin is due to itspromoting effect on SA signaling as well as inhibiting behavior toauxin. We predict and show experimentally that cytokinin does
2 of 22 The Plant Cell
not influence the early events of recognition between host andpathogen. Furthermore, looking at the established molecularsequence of events, we study the promoting influence of cyto-kinin on camalexin accumulation. Taken together, a model andexperiments highlight in detail the challenged hormonal balancefor plant immune defense. This includes specific events aroundmodulation by cytokinin and implications for crop protection.The model is instrumental in elucidating complex hormonalcrosstalk in plant pathogen interactions.
RESULTS
Boolean Formalism, Network Topology, and InitialConditions and Parameters for Model Simulations
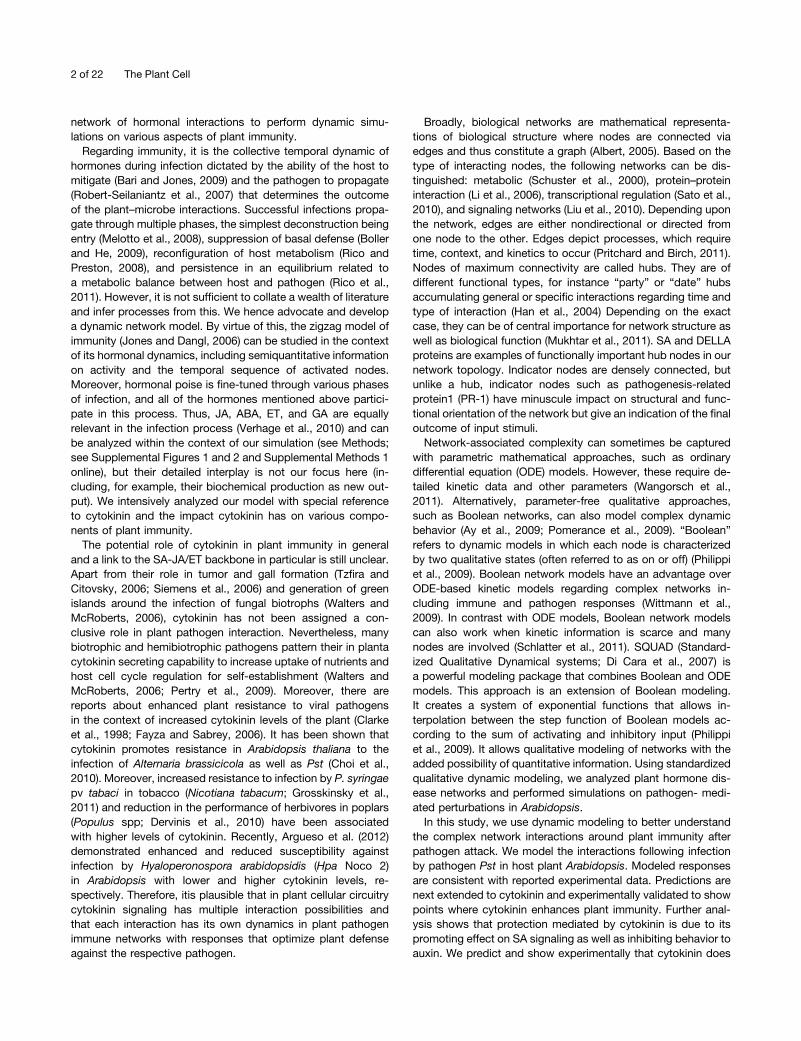
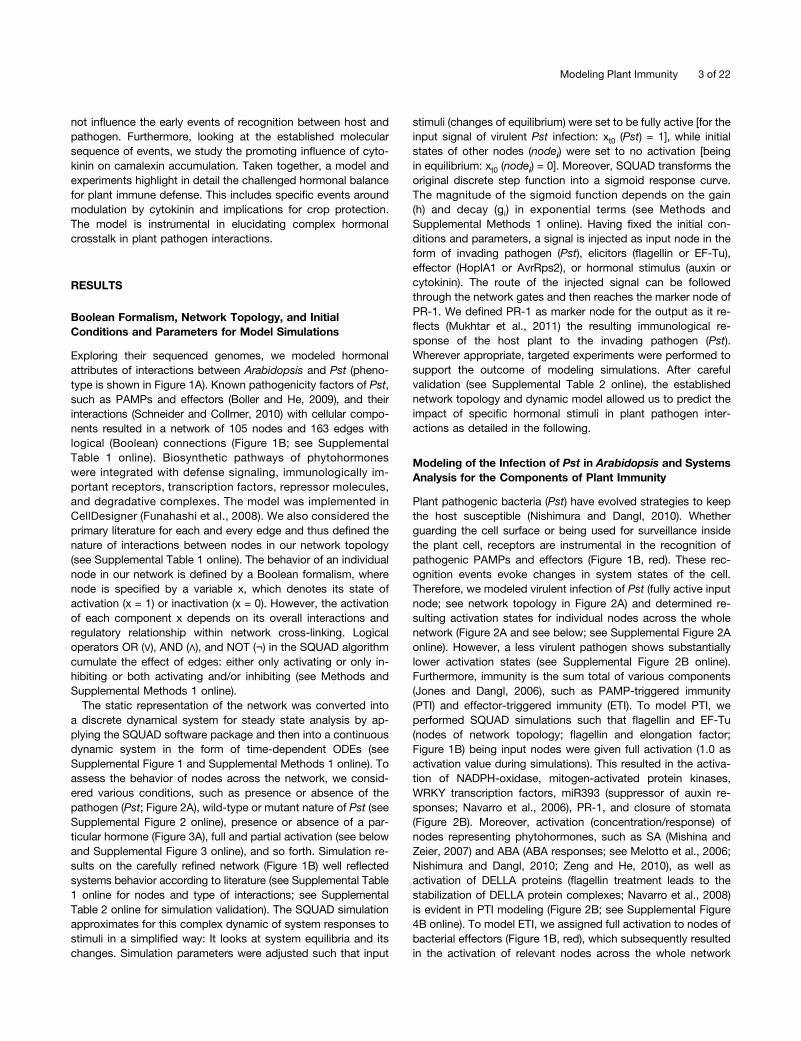
Exploring their sequenced genomes, we modeled hormonalattributes of interactions between Arabidopsis and Pst (pheno-type is shown in Figure 1A). Known pathogenicity factors of Pst,such as PAMPs and effectors (Boller and He, 2009), and theirinteractions (Schneider and Collmer, 2010) with cellular compo-nents resulted in a network of 105 nodes and 163 edges withlogical (Boolean) connections (Figure 1B; see SupplementalTable 1 online). Biosynthetic pathways of phytohormoneswere integrated with defense signaling, immunologically im-portant receptors, transcription factors, repressor molecules,and degradative complexes. The model was implemented inCellDesigner (Funahashi et al., 2008). We also considered theprimary literature for each and every edge and thus defined thenature of interactions between nodes in our network topology(see Supplemental Table 1 online). The behavior of an individualnode in our network is defined by a Boolean formalism, wherenode is specified by a variable x, which denotes its state ofactivation (x = 1) or inactivation (x = 0). However, the activationof each component x depends on its overall interactions andregulatory relationship within network cross-linking. Logicaloperators OR (∨), AND (∧), and NOT (¬) in the SQUAD algorithmcumulate the effect of edges: either only activating or only in-hibiting or both activating and/or inhibiting (see Methods andSupplemental Methods 1 online).
The static representation of the network was converted intoa discrete dynamical system for steady state analysis by ap-plying the SQUAD software package and then into a continuousdynamic system in the form of time-dependent ODEs (seeSupplemental Figure 1 and Supplemental Methods 1 online). Toassess the behavior of nodes across the network, we consid-ered various conditions, such as presence or absence of thepathogen (Pst; Figure 2A), wild-type or mutant nature of Pst (seeSupplemental Figure 2 online), presence or absence of a par-ticular hormone (Figure 3A), full and partial activation (see belowand Supplemental Figure 3 online), and so forth. Simulation re-sults on the carefully refined network (Figure 1B) well reflectedsystems behavior according to literature (see Supplemental Table1 online for nodes and type of interactions; see SupplementalTable 2 online for simulation validation). The SQUAD simulationapproximates for this complex dynamic of system responses tostimuli in a simplified way: It looks at system equilibria and itschanges. Simulation parameters were adjusted such that input
stimuli (changes of equilibrium) were set to be fully active [for theinput signal of virulent Pst infection: xt0 (Pst) = 1], while initialstates of other nodes (nodei) were set to no activation [beingin equilibrium: xt0 (nodei) = 0]. Moreover, SQUAD transforms theoriginal discrete step function into a sigmoid response curve.The magnitude of the sigmoid function depends on the gain(h) and decay (gi) in exponential terms (see Methods andSupplemental Methods 1 online). Having fixed the initial con-ditions and parameters, a signal is injected as input node in theform of invading pathogen (Pst), elicitors (flagellin or EF-Tu),effector (HopIA1 or AvrRps2), or hormonal stimulus (auxin orcytokinin). The route of the injected signal can be followedthrough the network gates and then reaches the marker node ofPR-1. We defined PR-1 as marker node for the output as it re-flects (Mukhtar et al., 2011) the resulting immunological re-sponse of the host plant to the invading pathogen (Pst).Wherever appropriate, targeted experiments were performed tosupport the outcome of modeling simulations. After carefulvalidation (see Supplemental Table 2 online), the establishednetwork topology and dynamic model allowed us to predict theimpact of specific hormonal stimuli in plant pathogen inter-actions as detailed in the following.
Modeling of the Infection of Pst in Arabidopsis and SystemsAnalysis for the Components of Plant Immunity
Plant pathogenic bacteria (Pst) have evolved strategies to keepthe host susceptible (Nishimura and Dangl, 2010). Whetherguarding the cell surface or being used for surveillance insidethe plant cell, receptors are instrumental in the recognition ofpathogenic PAMPs and effectors (Figure 1B, red). These rec-ognition events evoke changes in system states of the cell.Therefore, we modeled virulent infection of Pst (fully active inputnode; see network topology in Figure 2A) and determined re-sulting activation states for individual nodes across the wholenetwork (Figure 2A and see below; see Supplemental Figure 2Aonline). However, a less virulent pathogen shows substantiallylower activation states (see Supplemental Figure 2B online).Furthermore, immunity is the sum total of various components(Jones and Dangl, 2006), such as PAMP-triggered immunity(PTI) and effector-triggered immunity (ETI). To model PTI, weperformed SQUAD simulations such that flagellin and EF-Tu(nodes of network topology; flagellin and elongation factor;Figure 1B) being input nodes were given full activation (1.0 asactivation value during simulations). This resulted in the activa-tion of NADPH-oxidase, mitogen-activated protein kinases,WRKY transcription factors, miR393 (suppressor of auxin re-sponses; Navarro et al., 2006), PR-1, and closure of stomata(Figure 2B). Moreover, activation (concentration/response) ofnodes representing phytohormones, such as SA (Mishina andZeier, 2007) and ABA (ABA responses; see Melotto et al., 2006;Nishimura and Dangl, 2010; Zeng and He, 2010), as well asactivation of DELLA proteins (flagellin treatment leads to thestabilization of DELLA protein complexes; Navarro et al., 2008)is evident in PTI modeling (Figure 2B; see Supplemental Figure4B online). To model ETI, we assigned full activation to nodes ofbacterial effectors (Figure 1B, red), which subsequently resultedin the activation of relevant nodes across the whole network
Modeling Plant Immunity 3 of 22
(Figure 2B; see Supplemental Figure 4B online). Network anal-ysis shows extensive overlap (70%; see Supplemental Figure 5online) between PTI and ETI, whereas system stability analysis(difference in states for ETI and ETI* over time) revealed ro-bustness as well as redundancy in ETI (Figure 2B, middle andbottom panels). Besides inhibiting PTI (see Supplemental Figure4B online), the modeling suggests that bacterial effectors alterthe hormonal profile of the plant cell (Figure 2B; seeSupplemental Figure 4A online). Pst modeling results agree withcurrent literature (see Supplemental Table 2 online). These re-sults demonstrate the behavior of the components of plant im-munity and their innate properties and quantify their mutual
interactions across the hormone disease networks. Moreover,our model envisions the behavior of Pst infection as a source ofhormonal modulation in plants.
Small-Molecule Hormones Modulate PlantImmunity: Cytokinin Crosstalk
Our dynamic model for Pst showed activation for nodes of SA,JA, ET, ABA, and auxin, while demonstrating lack of activationfor GA and cytokinin (Figure 2A; see Supplemental Figure 4Aonline). Lack of activation is not equivalent to repression. Re-pression requires a signal to go from on to off. To model the
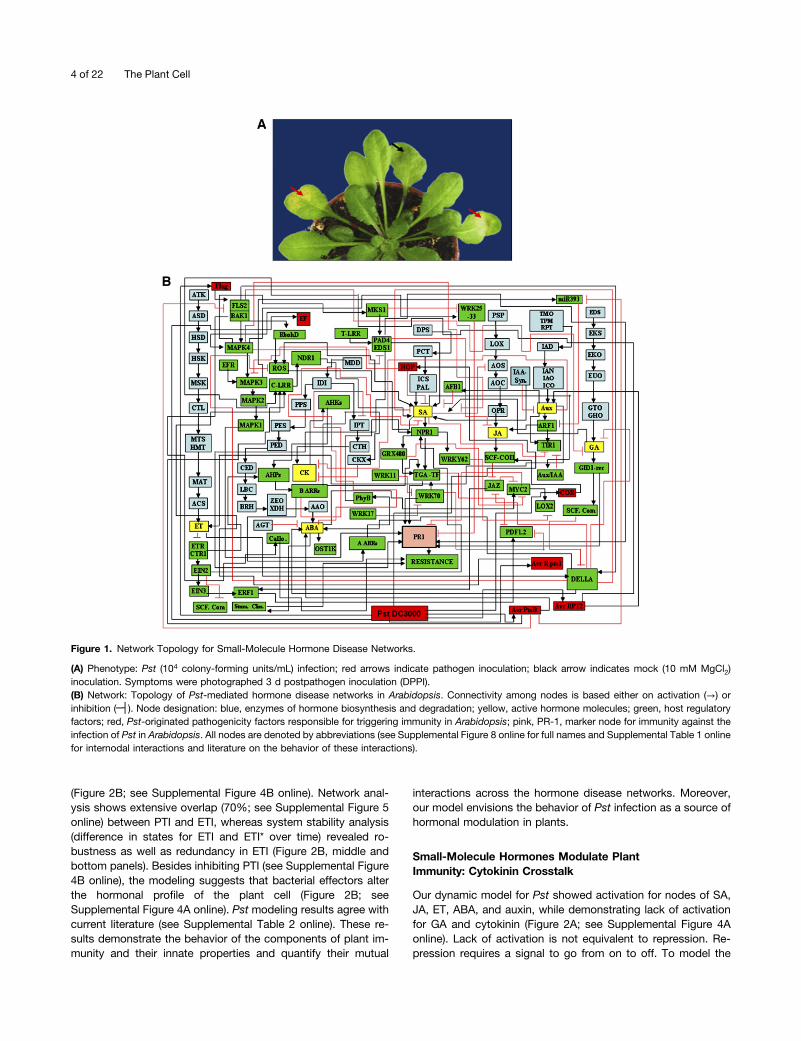
Figure 1. Network Topology for Small-Molecule Hormone Disease Networks.
(A) Phenotype: Pst (104 colony-forming units/mL) infection; red arrows indicate pathogen inoculation; black arrow indicates mock (10 mM MgCl2)inoculation. Symptoms were photographed 3 d postpathogen inoculation (DPPI).(B) Network: Topology of Pst-mediated hormone disease networks in Arabidopsis. Connectivity among nodes is based either on activation (→) orinhibition (─┤). Node designation: blue, enzymes of hormone biosynthesis and degradation; yellow, active hormone molecules; green, host regulatoryfactors; red, Pst-originated pathogenicity factors responsible for triggering immunity in Arabidopsis; pink, PR-1, marker node for immunity against theinfection of Pst in Arabidopsis. All nodes are denoted by abbreviations (see Supplemental Figure 8 online for full names and Supplemental Table 1 onlinefor internodal interactions and literature on the behavior of these interactions).
4 of 22 The Plant Cell
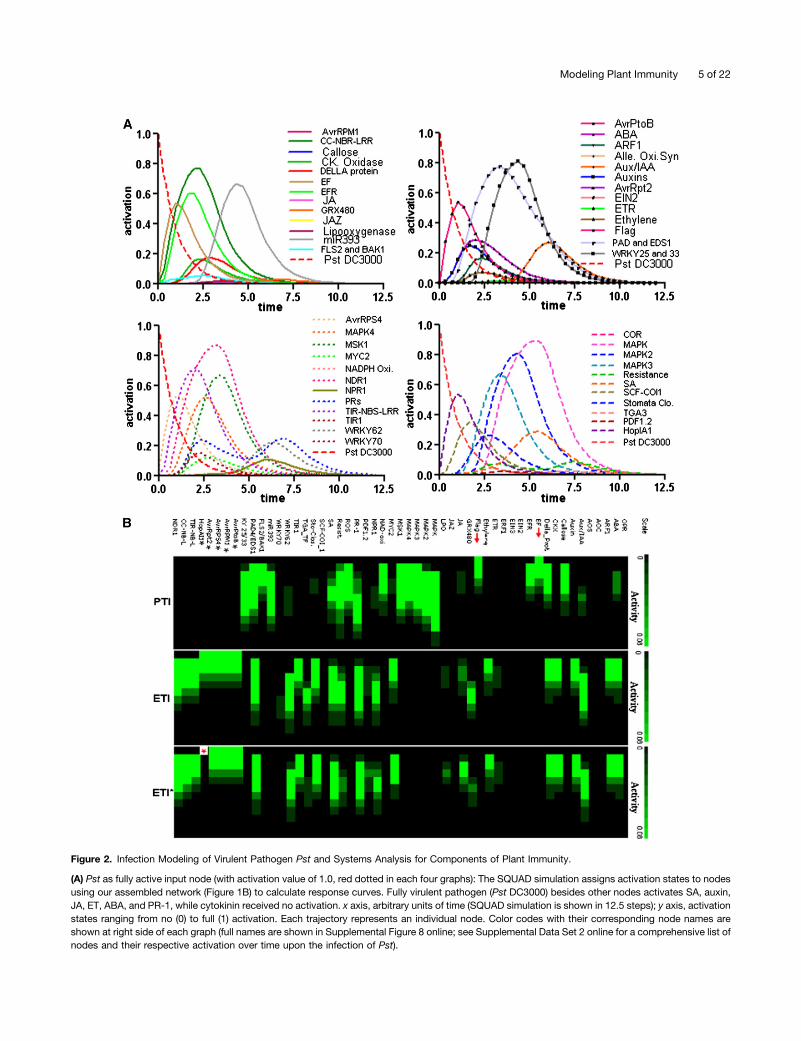
Figure 2. Infection Modeling of Virulent Pathogen Pst and Systems Analysis for Components of Plant Immunity.
(A) Pst as fully active input node (with activation value of 1.0, red dotted in each four graphs): The SQUAD simulation assigns activation states to nodesusing our assembled network (Figure 1B) to calculate response curves. Fully virulent pathogen (Pst DC3000) besides other nodes activates SA, auxin,JA, ET, ABA, and PR-1, while cytokinin received no activation. x axis, arbitrary units of time (SQUAD simulation is shown in 12.5 steps); y axis, activationstates ranging from no (0) to full (1) activation. Each trajectory represents an individual node. Color codes with their corresponding node names areshown at right side of each graph (full names are shown in Supplemental Figure 8 online; see Supplemental Data Set 2 online for a comprehensive list ofnodes and their respective activation over time upon the infection of Pst).
Modeling Plant Immunity 5 of 22
impact of these hormones on plant immunity, we performedSQUAD simulations by taking individual hormones as input ac-tivating node with and without Pst. The activation of PR-1 overtime was used as an index of plant immunity. We found in thesimulations that the three hormones ET, SA, and GA activatePR-1 in contrast with JA, ABA, and auxin (Figure 3A, left panel).Interestingly, SA and GA further enhance the signal of the ac-tivity of PR-1 in the presence of Pst, whereas JA, auxin and ABAdiminish even the residual activity of PR-1 manifested by Pstalone (Figure 3A, right panel). This supports the fact that unlikethe promoting effect of SA and GA on immunity, auxin, JA, andABA mediate susceptibility of Arabidopsis against infection byPst. The simulation data in fact allow us to distinguish whethera signal goes from on to off (repression in an active sense) orwhether there is simply lack of activation (see SupplementalFigure 4A online). In most cases, we observed only lack of ac-tivation (e.g., mitigated pathogen for most system nodes mod-eled). We validated these and further outcomes of SQUADsimulations on hormonal stimuli by detailed comparison withpublished data (see details in Supplemental Table 2 online).
Although implicated both in resistance and susceptibility(Pertry et al., 2009; Argueso et al., 2012), the phytohormonecytokinin seems to have multifaceted signaling roles in plantdiseases. Regarding their connection to the SA-JA/ET backboneof plant immunity, Choi et al. (2010) reported positive crosstalkbetween cytokinin and SA pathway, whereas Argueso et al.(2012) found negative crosstalk among them. However, theirinteraction with the JA pathway is still not known. Our ownobservations from both experiments and modeling intrigued usto investigate the specific crosstalk by cytokinin as this seemedto enhance immunity in plants. We further investigated all theseobservations by setting up and applying our integrated modeland can now provide insights into cytokinin-mediated re-sistance in Arabidopsis to infection with Pst. Modeling in-fection by a virulent pathogen gave no indication of a directactivation of the node representing cytokinin (Figure 2A; seeSupplemental Figure 2A and Supplemental Figure 4A online).However, when set to be fully activated together with Pst asinput activating nodes (modeling the increased cytokininstatus of the plant during pathogen infection), the SQUADanalysis (besides Pst-based node activations; Figure 2A) re-sulted in the activation of nodes such as Arabidopsis HistidineKinases, Arabidopsis homologs of HPt Proteins, ArabidopsisResponse Regulators (ARRs), Cytokinin Oxidase, and PR-1(Figure 3B; see Supplemental Figure 3A online). Subsequent
simulations also highlighted that cytokinin (without Pst) alonecan cause the activation of PR-1 and hence promote plant im-munity (see Supplemental Figure 3B online). To verify modelingpredictions, we applied exogenously kinetin solution (10 µM)and observed clearly reduced Pst disease symptoms comparedwith mock-fed pathogen-infected Arabidopsis leaves (Figure3C, left panel). Moreover, reduced in planta bacterial multipli-cation (Figure 3C, right panel) in cytokinin treated versus controlleaves nicely confirms the simulation. Regarding the cytotoxiceffect of cytokinin on Pst, we demonstrated experimentally thatunlike the antibacterial activity of tetracycline, cultures of Pstgrew equally well with and without the addition of cytokinin (seeSupplemental Figure 6 online). Additionally, feeding of kinetin(without subsequent pathogen infection) solution to detachedleaves of Arabidopsis PR1:GUS (for b-glucuronidase) plantsshowed higher GUS activity compared with mock feeding (seebelow). These results substantiate the fact that enhanced plantcytokinin levels boost immunity against infection of Pst and thatcytokinin has no direct cytotoxic effect on bacterial multiplica-tion.
Cytokinin Overlay with SA in Regulating Genes ofArabidopsis Implicated in Plant Immunity
Cytokinin-mediated protection of Arabidopsis against infectionby Pst (Figure 3C) and its activation of PR-1 (see SupplementalFigure 3B online; see below) pinpoint crosstalk between SA andcytokinin pathways. To explore the mechanism of cytokinin-mediated protection, we investigated genome-wide transcrip-tional overlay between cytokinin and SA and the impact theyhave on the expression of genes related to immune defense inplants. We analyzed microarray data from the Gene ExpressionOmnibus (GEO) on hormonal stimuli of SA (GSE3984; Thibaud-Nissen et al., 2006) and cytokinin (GSE 6832; Hitoshi SakakibaraRIKEN Plant Science Center). After normalization and statisticalanalysis, the up- and downregulated genes of both these hor-monal stimuli are shown in a Venn diagram (Figure 4, left side).We found overlap (an indication of cytokinin-SA crosstalk) be-tween SA- and cytokinin-regulated (regarding both up- anddownregulated) genes. The overlapping genes are shown in theheat map representation, indicating their expression togetherwith their annotation (Figure 4, right side). Immunity-relevantgenes include those encoding glutaredoxins, chitinase, and thewell-known marker PR-1 as an integral part of SA-mediateddefense (Bari and Jones, 2009). These were found in the gene
Figure 2. (continued).
(B) Modeling of PTI and ETI. Top, node names; red arrows: elicitors. PTI system states: Giving full activation (1.0) to elicitors, flagellin and elongationfactor, downstream components, such as FLS2, BAK1, MAPKs, SA, NPR1, TGA-TF, and WRKYs, and PR-1 achieved various states of activation inSQUAD analysis. These are shown as a heat map in terms of activity over time (early time points above and corresponding later time points follow ineach heat map). For details on global activation of nodes across the network as a consequence of PTI, see Supplemental Data Set 2 online. ETI systemstates: All effectors (top left nodes with black asterisks) in the network are given full activation in SQUAD analysis. Robustness in ETI*: HopAI1 (redasterisk at the bottom left) was deleted from the network. This did not significantly change the overall dynamics of components involved in ETI andparticularly the marker node PR-1 time course. ETI is a stable form of the immunity. Comparison between ETI and PTI reveals that both operate throughoverlapping components. See Supplemental Data Set 2 online for details on states during ETI and ETI* and Supplemental Figures 5 and 7 online forsystem stability and robustness.
6 of 22 The Plant Cell
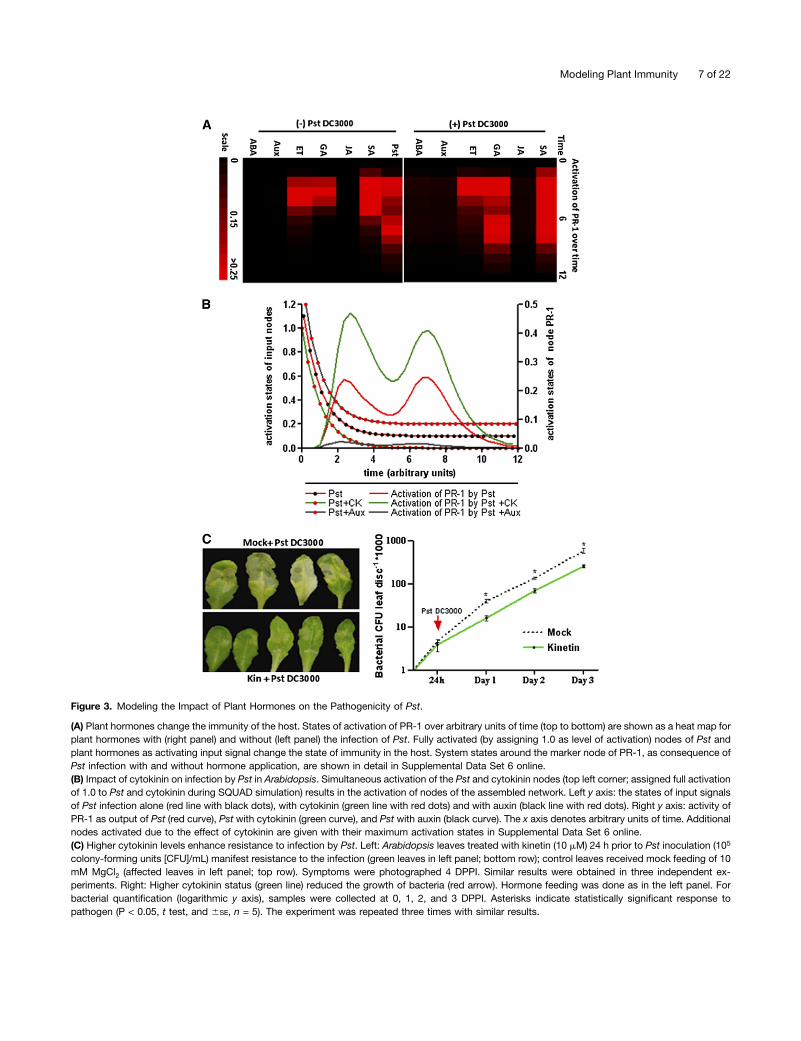
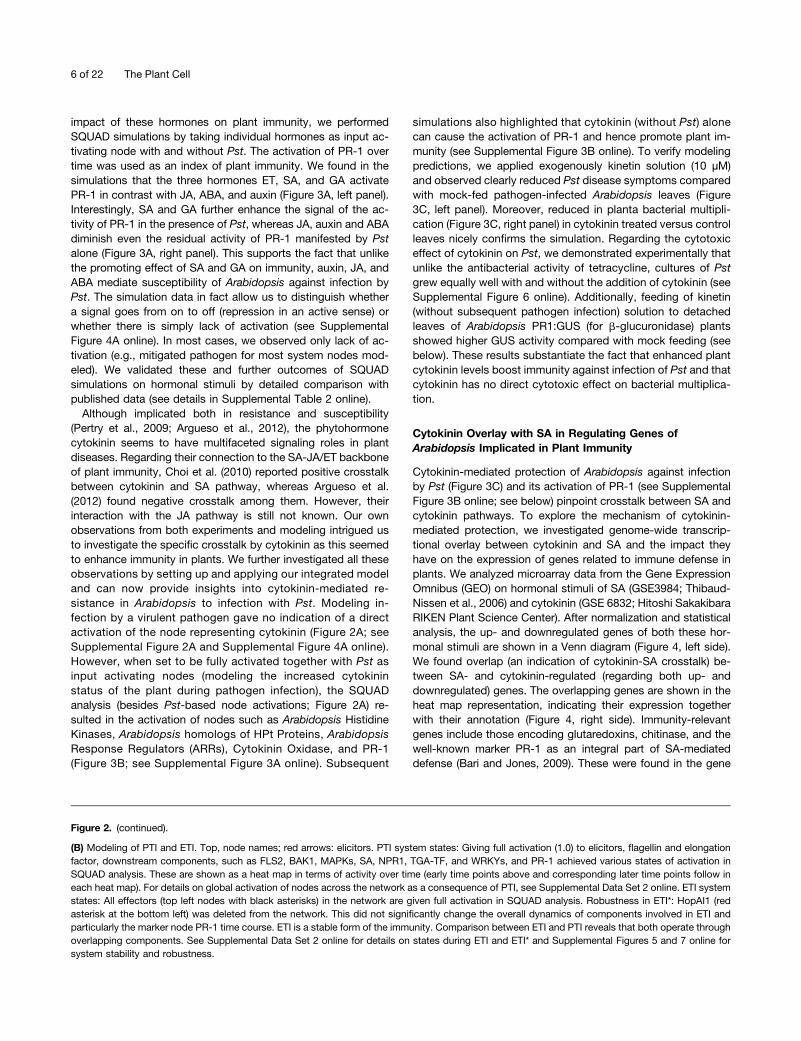
Figure 3. Modeling the Impact of Plant Hormones on the Pathogenicity of Pst.
(A) Plant hormones change the immunity of the host. States of activation of PR-1 over arbitrary units of time (top to bottom) are shown as a heat map forplant hormones with (right panel) and without (left panel) the infection of Pst. Fully activated (by assigning 1.0 as level of activation) nodes of Pst andplant hormones as activating input signal change the state of immunity in the host. System states around the marker node of PR-1, as consequence ofPst infection with and without hormone application, are shown in detail in Supplemental Data Set 6 online.(B) Impact of cytokinin on infection by Pst in Arabidopsis. Simultaneous activation of the Pst and cytokinin nodes (top left corner; assigned full activationof 1.0 to Pst and cytokinin during SQUAD simulation) results in the activation of nodes of the assembled network. Left y axis: the states of input signalsof Pst infection alone (red line with black dots), with cytokinin (green line with red dots) and with auxin (black line with red dots). Right y axis: activity ofPR-1 as output of Pst (red curve), Pst with cytokinin (green curve), and Pst with auxin (black curve). The x axis denotes arbitrary units of time. Additionalnodes activated due to the effect of cytokinin are given with their maximum activation states in Supplemental Data Set 6 online.(C) Higher cytokinin levels enhance resistance to infection by Pst. Left: Arabidopsis leaves treated with kinetin (10 mM) 24 h prior to Pst inoculation (105
colony-forming units [CFU]/mL) manifest resistance to the infection (green leaves in left panel; bottom row); control leaves received mock feeding of 10mM MgCl2 (affected leaves in left panel; top row). Symptoms were photographed 4 DPPI. Similar results were obtained in three independent ex-periments. Right: Higher cytokinin status (green line) reduced the growth of bacteria (red arrow). Hormone feeding was done as in the left panel. Forbacterial quantification (logarithmic y axis), samples were collected at 0, 1, 2, and 3 DPPI. Asterisks indicate statistically significant response topathogen (P < 0.05, t test, and 6SE, n = 5). The experiment was repeated three times with similar results.
Modeling Plant Immunity 7 of 22
expression analysis to be mutually upregulated both by SA andcytokinins. Furthermore, our analysis revealed the RPS4 geneinvolved in resistance to Pst to be downregulated by methyljasmonate upregulated by both cytokinin and SA. The mRNAfor a chitinase-type broad-spectrum mildew resistance protein
MLO11, as well as mRNAs for defensin-related genes, werefound to be upregulated. Similarly, a couple of Toll/interleukin-1receptor domain–containing genes were shown to be mutuallyupregulated by SA and cytokinin. The gene for JAZ1, a positiveregulator of SA responses and CONSTITUTIVE DISEASE
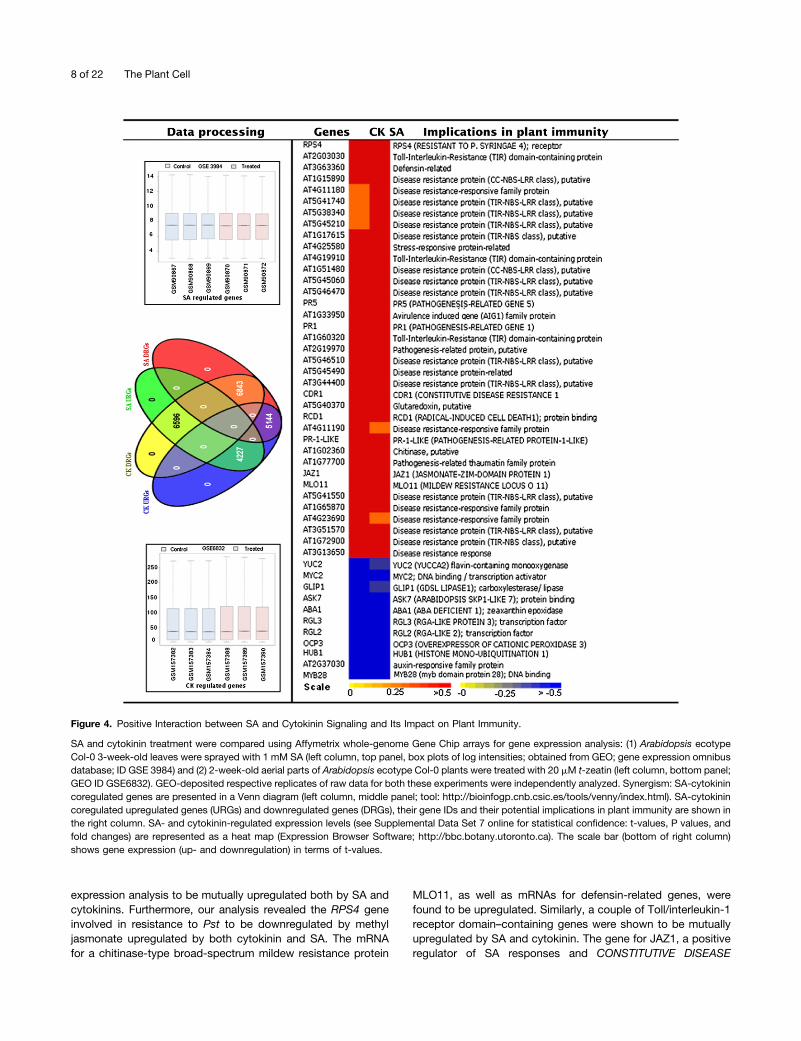
Figure 4. Positive Interaction between SA and Cytokinin Signaling and Its Impact on Plant Immunity.
SA and cytokinin treatment were compared using Affymetrix whole-genome Gene Chip arrays for gene expression analysis: (1) Arabidopsis ecotypeCol-0 3-week-old leaves were sprayed with 1 mM SA (left column, top panel, box plots of log intensities; obtained from GEO; gene expression omnibusdatabase; ID GSE 3984) and (2) 2-week-old aerial parts of Arabidopsis ecotype Col-0 plants were treated with 20 mM t-zeatin (left column, bottom panel;GEO ID GSE6832). GEO-deposited respective replicates of raw data for both these experiments were independently analyzed. Synergism: SA-cytokinincoregulated genes are presented in a Venn diagram (left column, middle panel; tool: http://bioinfogp.cnb.csic.es/tools/venny/index.html). SA-cytokinincoregulated upregulated genes (URGs) and downregulated genes (DRGs), their gene IDs and their potential implications in plant immunity are shown inthe right column. SA- and cytokinin-regulated expression levels (see Supplemental Data Set 7 online for statistical confidence: t-values, P values, andfold changes) are represented as a heat map (Expression Browser Software; http://bbc.botany.utoronto.ca). The scale bar (bottom of right column)shows gene expression (up- and downregulation) in terms of t-values.
8 of 22 The Plant Cell
RESISTANCE1, is also upregulated by both these hormones.Interestingly, more than one and half dozen disease resistanceprotein genes belonging either to the coiled-coil–nucleotidebinding site–leucine-rich repeat or Toll/interleukin-1 receptor–nucleotide binding site–leucine-rich repeat class (Mukhtar et al.,2011) were found to be mutually upregulated by SA and cyto-kinins.
The genes encoding the MYC2 transcription factor, a negativeregulator of SA responses (Figure 4, bottom right panel; Laurie-Berry et al., 2006), and MYB28, which gives protection againstnecrotrophic pathogens (Stotz et al., 2011), are downregulatedby cytokinin and SA. Auxin responses promote susceptibility(Navarro et al., 2006) against biotrophic pathogens; one suchauxin-responsive protein gene (AT2G37030) and a geneencoding an enzyme of the auxin biosynthetic pathway(Moubayidin et al., 2009) were found to be repressed both bycytokinin and SA. ABA mutants impaired in ABA biosynthesis orsensitivity are thought to be resistant to infection with PstDC3000 (de Torres Zabala et al., 2009), and ABA1 is mutuallydownregulated by cytokinin and SA. DELLA proteins are nega-tive regulators of SA-mediated resistance against Pst DC3000(Navarro et al., 2008), and two DELLA-like genes, RGL3 andRGL2, are found to be repressed both by cytokinin as well asSA. The axr1 Arabidopsis mutant showed increased resistanceto Pst (Kazan and Manners, 2009). AXR1 was analyzed andfound to be mutually downregulated by SA and cytokinin. Takentogether, these data demonstrate that cytokinin-SA positivecrosstalk is not limited to a disease marker gene (Choi et al.,2010) but has wide transcriptional overlap.
Modeling the Behavior of Cytokinin Regarding the SAPathway and Camalexin Accumulation
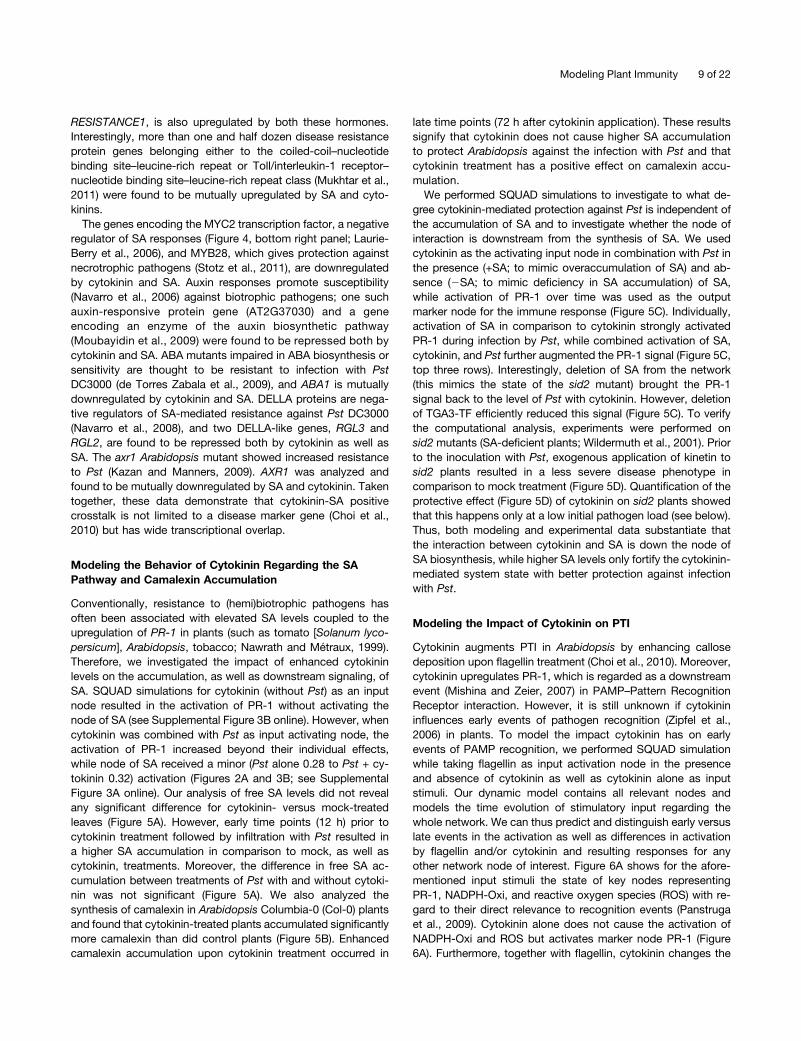
Conventionally, resistance to (hemi)biotrophic pathogens hasoften been associated with elevated SA levels coupled to theupregulation of PR-1 in plants (such as tomato [Solanum lyco-persicum], Arabidopsis, tobacco; Nawrath and Métraux, 1999).Therefore, we investigated the impact of enhanced cytokininlevels on the accumulation, as well as downstream signaling, ofSA. SQUAD simulations for cytokinin (without Pst) as an inputnode resulted in the activation of PR-1 without activating thenode of SA (see Supplemental Figure 3B online). However, whencytokinin was combined with Pst as input activating node, theactivation of PR-1 increased beyond their individual effects,while node of SA received a minor (Pst alone 0.28 to Pst + cy-tokinin 0.32) activation (Figures 2A and 3B; see SupplementalFigure 3A online). Our analysis of free SA levels did not revealany significant difference for cytokinin- versus mock-treatedleaves (Figure 5A). However, early time points (12 h) prior tocytokinin treatment followed by infiltration with Pst resulted ina higher SA accumulation in comparison to mock, as well ascytokinin, treatments. Moreover, the difference in free SA ac-cumulation between treatments of Pst with and without cytoki-nin was not significant (Figure 5A). We also analyzed thesynthesis of camalexin in Arabidopsis Columbia-0 (Col-0) plantsand found that cytokinin-treated plants accumulated significantlymore camalexin than did control plants (Figure 5B). Enhancedcamalexin accumulation upon cytokinin treatment occurred in
late time points (72 h after cytokinin application). These resultssignify that cytokinin does not cause higher SA accumulationto protect Arabidopsis against the infection with Pst and thatcytokinin treatment has a positive effect on camalexin accu-mulation.We performed SQUAD simulations to investigate to what de-
gree cytokinin-mediated protection against Pst is independent ofthe accumulation of SA and to investigate whether the node ofinteraction is downstream from the synthesis of SA. We usedcytokinin as the activating input node in combination with Pst inthe presence (+SA; to mimic overaccumulation of SA) and ab-sence (2SA; to mimic deficiency in SA accumulation) of SA,while activation of PR-1 over time was used as the outputmarker node for the immune response (Figure 5C). Individually,activation of SA in comparison to cytokinin strongly activatedPR-1 during infection by Pst, while combined activation of SA,cytokinin, and Pst further augmented the PR-1 signal (Figure 5C,top three rows). Interestingly, deletion of SA from the network(this mimics the state of the sid2 mutant) brought the PR-1signal back to the level of Pst with cytokinin. However, deletionof TGA3-TF efficiently reduced this signal (Figure 5C). To verifythe computational analysis, experiments were performed onsid2 mutants (SA-deficient plants; Wildermuth et al., 2001). Priorto the inoculation with Pst, exogenous application of kinetin tosid2 plants resulted in a less severe disease phenotype incomparison to mock treatment (Figure 5D). Quantification of theprotective effect (Figure 5D) of cytokinin on sid2 plants showedthat this happens only at a low initial pathogen load (see below).Thus, both modeling and experimental data substantiate thatthe interaction between cytokinin and SA is down the node ofSA biosynthesis, while higher SA levels only fortify the cytokinin-mediated system state with better protection against infectionwith Pst.
Modeling the Impact of Cytokinin on PTI
Cytokinin augments PTI in Arabidopsis by enhancing callosedeposition upon flagellin treatment (Choi et al., 2010). Moreover,cytokinin upregulates PR-1, which is regarded as a downstreamevent (Mishina and Zeier, 2007) in PAMP–Pattern RecognitionReceptor interaction. However, it is still unknown if cytokinininfluences early events of pathogen recognition (Zipfel et al.,2006) in plants. To model the impact cytokinin has on earlyevents of PAMP recognition, we performed SQUAD simulationwhile taking flagellin as input activation node in the presenceand absence of cytokinin as well as cytokinin alone as inputstimuli. Our dynamic model contains all relevant nodes andmodels the time evolution of stimulatory input regarding thewhole network. We can thus predict and distinguish early versuslate events in the activation as well as differences in activationby flagellin and/or cytokinin and resulting responses for anyother network node of interest. Figure 6A shows for the afore-mentioned input stimuli the state of key nodes representingPR-1, NADPH-Oxi, and reactive oxygen species (ROS) with re-gard to their direct relevance to recognition events (Panstrugaet al., 2009). Cytokinin alone does not cause the activation ofNADPH-Oxi and ROS but activates marker node PR-1 (Figure6A). Furthermore, together with flagellin, cytokinin changes the
Modeling Plant Immunity 9 of 22
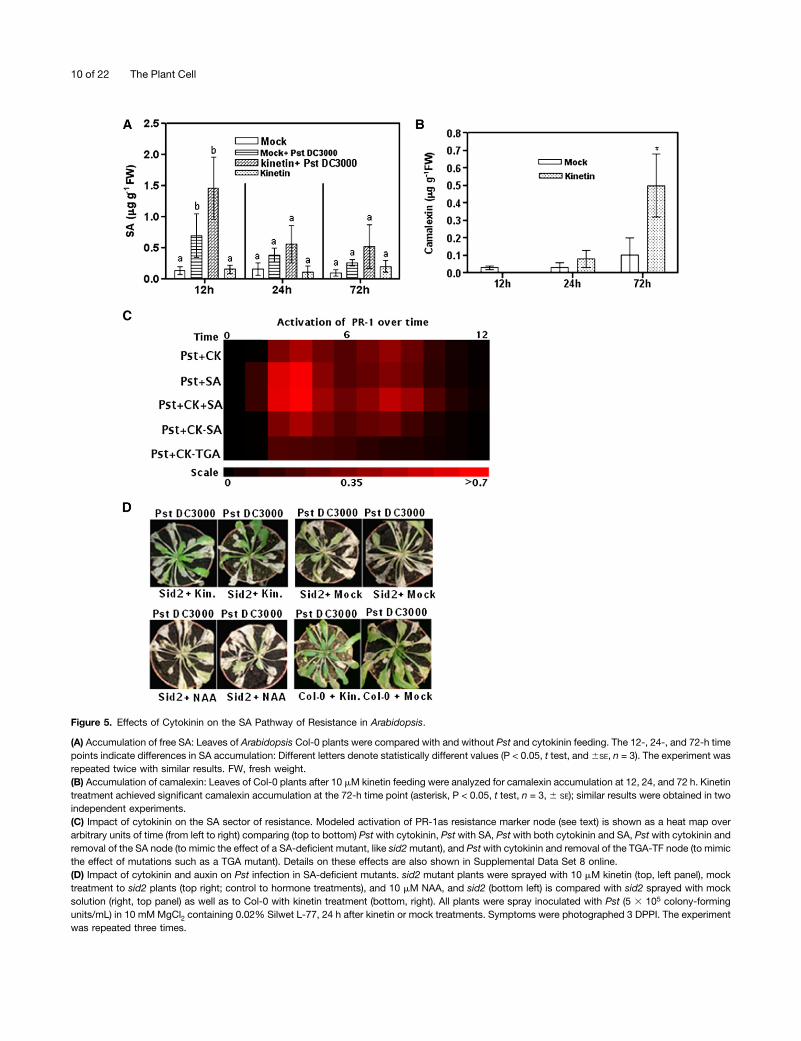
Figure 5. Effects of Cytokinin on the SA Pathway of Resistance in Arabidopsis.
(A) Accumulation of free SA: Leaves of Arabidopsis Col-0 plants were compared with and without Pst and cytokinin feeding. The 12-, 24-, and 72-h timepoints indicate differences in SA accumulation: Different letters denote statistically different values (P < 0.05, t test, and6SE, n = 3). The experiment wasrepeated twice with similar results. FW, fresh weight.(B) Accumulation of camalexin: Leaves of Col-0 plants after 10 mM kinetin feeding were analyzed for camalexin accumulation at 12, 24, and 72 h. Kinetintreatment achieved significant camalexin accumulation at the 72-h time point (asterisk, P < 0.05, t test, n = 3, 6 SE); similar results were obtained in twoindependent experiments.(C) Impact of cytokinin on the SA sector of resistance. Modeled activation of PR-1as resistance marker node (see text) is shown as a heat map overarbitrary units of time (from left to right) comparing (top to bottom) Pst with cytokinin, Pst with SA, Pst with both cytokinin and SA, Pst with cytokinin andremoval of the SA node (to mimic the effect of a SA-deficient mutant, like sid2mutant), and Pst with cytokinin and removal of the TGA-TF node (to mimicthe effect of mutations such as a TGA mutant). Details on these effects are also shown in Supplemental Data Set 8 online.(D) Impact of cytokinin and auxin on Pst infection in SA-deficient mutants. sid2 mutant plants were sprayed with 10 mM kinetin (top, left panel), mocktreatment to sid2 plants (top right; control to hormone treatments), and 10 mM NAA, and sid2 (bottom left) is compared with sid2 sprayed with mocksolution (right, top panel) as well as to Col-0 with kinetin treatment (bottom, right). All plants were spray inoculated with Pst (5 3 105 colony-formingunits/mL) in 10 mM MgCl2 containing 0.02% Silwet L-77, 24 h after kinetin or mock treatments. Symptoms were photographed 3 DPPI. The experimentwas repeated three times.
10 of 22 The Plant Cell
activation state of the PR-1 marker node without influencing thestates of NADPH-Oxi and ROS (Figure 6A). Moreover, the cor-responding calculated detailed activation states over time forthe impact of cytokinin on flagellin-mediated ROS productionare shown in Supplemental Data Set 1 online.
To validate these simulations regarding the impact of cytoki-nin on early events of flagellin/PAMP recognition (Figure 6A),we performed experiments on flagellin elicitation of ROS produc-tion in Arabidopsis leaf fragments. Upon treatment with 10 nMflagellin, leaf fragments produced ROS within 3 min, reacheda maximum level, and then returned back to the initial state(Figure 6B). Addition of t-zeatin (1 µM) did not change theflagellin-mediated amplitude of ROS production (Figure 6B) inArabidopsis leaf fragments. To get further experimental insight,we performed pH experiments (Kunze et al., 2004) on Arabi-dopsis cell suspension cultures and showed that ΔpH (change inmedium alkalinization) for flagellin did not change with the ad-dition of t-zeatin. Furthermore, we did not notice any elicitationeffect of t-zeatin alone on the cultures used in such experiments(Figure 6C). These experiments were repeated with varioustypes and concentrations of cytokinin and similar results wereobtained (data not shown). Taken together, both modeling andexperiments underpin the importance of cytokinin in promotingPTI but show that they seem not to influence the early (PAMP–Pattern Recognition Receptor) events of pathogen recognitionvia ROS production and medium alkalinization.
Contrasting Behavior of Auxin and Cytokinin in PlantImmunity: Transcriptional and Physiological Evidence
Pst DC3000 injects its effector weaponry and hormonalmimicry to render the host more susceptible (Pieterse et al.,2009). Compromised virulence occurs when Pst is kept de-prived of both these tools (Thilmony et al., 2006). Our virulentinfection model revealed that during the course of infection,Pst causes the activation of auxin concentration/response butnot that of cytokinin (Figure 2A; see Supplemental Figure 4Aand Supplemental Data Set 2 online). A Pst mutant (deficient inType three secretion system) grew well in cytokinin-deficient (35S:Cytokinin Oxidase4,) plants compared with higher cytokinin–producing (35S:IPT3) and wild-type Col-0 Arabidopsis plants(Choi et al., 2010). We therefore hypothesized that virulent andavirulent strains of Pst differentially manipulate auxin and cyto-kinin pathways in plants. The mutated pathogen could be con-sidered to represent a mitigated infection, and we compared ourmodeling predictions with the gene expression data. To validatethis notion at the transcriptional level, we retrieved raw butcomplete (genome-wide) microarray data on the infection of thePst wild type (Pst DC3000) and Pst coronatine and hp mutant(Pst Cor– hp2; Thilmony et al., 2006) in Arabidopsis from theGEO database (ID GSE5520; Thilmony et al., 2006) (Figure 7A).Among the significantly regulated genes, we focused only ongenes related to the biosynthesis, signaling, transport, or deg-radation of auxin or cytokinin.
The auxin pathway genes downregulated upon the infectionwith Pst included auxin transporters (PIN3, PIN4, PIN7, AUX1,LAX1, and LAX3) auxin repressors (AUX/IAAs), and small auxinupregulated (SAUR) genes. However, upon the infection with the
mutant pathogen Pst Cor– hp–, the above genes were eitherslightly upregulated or remained unchanged (Figure 7A). Theupregulated genes included those that convert amino acidconjugates of indole-3-acetic acid (IAA) to free IAA (e.g., genesencoding IAA–amino acid hydrolases [ILR1, ILL5, and ILL6] andgenes for IAA-amido synthases [DFL2, GH3.3, and GH3.12]). Incontrast with wild-type infection, infection with the mutant Pststrain caused either repression of these genes or left them un-changed. Genes implicated in the biosynthesis of IAA, such asIAA18 and NIT3, are derepressed upon the infection with Pst(Figure 7A). Genes that are negative regulators (Muller andSheen, 2007) of cytokinin signaling, such as type A responseregulators (ARR4, 5, 6, 7, 9, 15, and 16), are repressed duringthe infection with Pst. However, the contrary is the case for thePst Cor– hp– pathogen in terms of expression. Moreover, theIPT3 gene responsible for cytokinin biosynthesis is down-regulated by Pst and not regulated by the mutant bacterialcounterpart (Figure 7A). In contrast with the infection by Pst Cor–
hp–, we find that genes encoding enzymes of cytokinin degra-dation are upregulated by wild-type Pst in Arabidopsis (Figure7A). Taken together, during infection, Pst promotes auxin ac-cumulation by upregulating biosynthesis and deconjugationenzymes genes, as well as by repressing transporters. Auxinsignaling is enhanced by the repression of auxin repressors. Onthe other hand, repressing a gene encoding an enzyme of cy-tokinin biosynthesis and derepression of the genes for cytokinindegradation enzymes reduces the levels of cytokinin uponpathogen infection.We next studied the impact of the infection of Pst on Arabi-
dopsis promoter-reporter lines (AtDR5:GUS and AtARR5:GUS),designed to show responses/concentrations of auxins and cy-tokinin, respectively (Siemens et al., 2006; Liu et al., 2010). Uponinoculation of AtDR5:GUS plants with Pst, we found sub-stantially stronger GUS activity at the host-pathogen interface,followed by faint staining in the surrounding tissue of the sameleaf and compared this to mock-inoculated leaves (Figure 7B).Pst-inoculated leaves of the AtARR5:GUS line manifested lowGUS activity at the site of infection, while mock-inoculatedleaves showed residual background staining (Figure 7B). Wedetermined the accumulation of auxin and cytokinin with gaschromatography–mass spectrometry and found significantlyhigher free IAA levels at the site of infection of Pst comparedwith the control (Figure 7C). On the other hand, the level oft-zeatin at the site of infection was significantly lower than inmock-inoculated leaves (Figure 7C). These experiments com-plement the virulent pathogen infection modeling (Figure 2A)and gene expression with Pst infection in Arabidopsis (Figure7A) and substantiate that both elevated auxin and repressedcytokinin are part of the infection process that Pst mediates inArabidopsis.SQUAD simulation provided further insight into the con-
trasting behavior of auxin and cytokinin in plant immunity.Auxin together with Pst as input activating nodes resulted inthe reduction of PR-1 signal in comparison to Pst alone (Figure3A). The simulation predicted reduced immunity upon theapplication of auxin (Figure 7D). Prior to Pst inoculation,1-naphthaleneacetic acid (NAA)–fed (10 mM) Col-0 Arabidopsisleaves manifested severely enhanced symptoms compared with
Modeling Plant Immunity 11 of 22
corresponding controls (Figure 7E and see below). This sub-stantiates that auxin promotes susceptibility of Arabidopsis toPst, and cytokinin does not have this effect (Figure 3C). By virtueof their positive crosstalk to SA (down the node of synthesis)cytokinin promotes resistance against the infection with Pst(Figures 5C and 5D). To study how auxin influences the SApathway of resistance, we modeled this interaction with SQUADsimulation. We monitored the activation of the marker node PR-1 in the presence of pathogen as well as modulated (partial orfull activation) conditions of SA versus auxin. Together with Pst,the signal for PR-1 activation was higher when SA was given fullactivation and auxin was kept either partially active or inactive(Figure 7D, middle panel). Decay in the PR-1 signal resultedwhen SA was either partially or completely inactivated whileauxin was given full activation (Figure 7D, right panel). This im-plies that a decrease in the level of plant SA and increase in
auxins further enhance vulnerability. To support this, we dem-onstrated that sid2 mutants exhibited severe Pst disease phe-notypes when given exogenous NAA (Figure 5D). These resultsdemonstrate that unlike cytokinin, which promotes the SAsector of immunity, auxin counterregulates SA responses infavor of susceptibility to infection by Pst in Arabidopsis.
Auxin–Cytokinin Interaction: A New Perspective ofAntagonism in Plant Immunity
Auxin and cytokinin have long been known to interact in growthand development of the plant (Liu et al., 2010). Furthermore,auxin promotes Arabidopsis susceptibility to infection with Pstby its positive and negative crosstalk with JA and SA, re-spectively (Navarro et al., 2006; Chen et al., 2007; Wang et al.,2007; Llorente et al., 2008). On the other hand, cytokinin
Figure 6. The Impact Cytokinin Has on PTI and Early Events of Recognition.
(A) Modeling the impact of cytokinin on PTI. SQUAD simulations for the effect of flagellin treatment with (middle panel) and without (left panel) cytokininas well as cytokinin alone (right panel) were performed to study the impact of cytokinin on PTI and early events of pathogen recognition. States ofactivation over time (from top to bottom) for nodes NADPH-oxidase, PR-1, and ROS are shown as a heat map; also see Supplemental Data Set 1 onlinefor data on activation of more nodes of interest in our network on flagellin treatment, with and without cytokinin.(B) Cytokinin does not change dynamics of the oxidative burst achieved with flagellin in Arabidopsis leaves. ROS production in leaf fragments ofArabidopsis with/without the incubation of 1 nM of flag 22 as well as with and without 1 mM t-zeatin (four conditions) was measured as luminescence incounts per second (y axis) over time (x axis). Results are averages 6 SE (n = 5).(C) Flagellin-based media alkalinization. Induction of medium alkalinization in Arabidopsis cell culture due to flagellin does not change with the additionof 1 mM t-zeatin (see Methods). Cultures with/without flagellin as well as with and without 1 mM t-zeatin were assayed for alkalinization-inducing activity,and the change in extracellular pH in Arabidopsis cells is shown on the y axis and over time on the x axis. Results are averages 6 SE (n = 5).
12 of 22 The Plant Cell
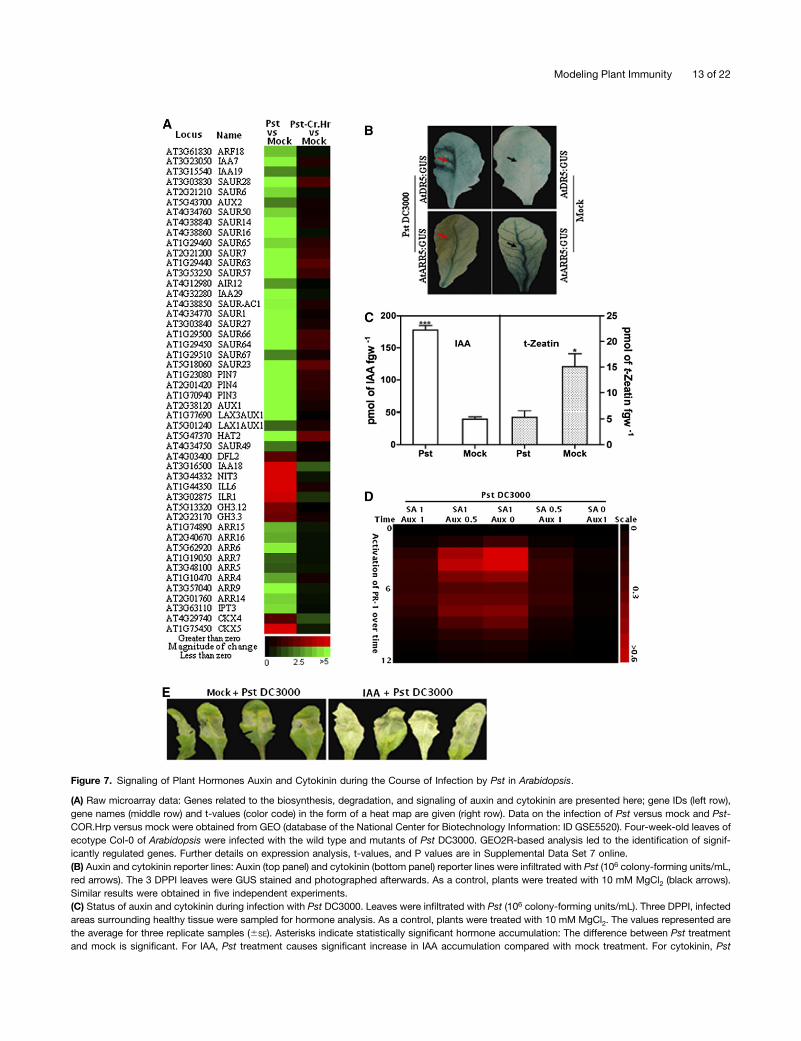
Figure 7. Signaling of Plant Hormones Auxin and Cytokinin during the Course of Infection by Pst in Arabidopsis.
(A) Raw microarray data: Genes related to the biosynthesis, degradation, and signaling of auxin and cytokinin are presented here; gene IDs (left row),gene names (middle row) and t-values (color code) in the form of a heat map are given (right row). Data on the infection of Pst versus mock and Pst-COR.Hrp versus mock were obtained from GEO (database of the National Center for Biotechnology Information: ID GSE5520). Four-week-old leaves ofecotype Col-0 of Arabidopsis were infected with the wild type and mutants of Pst DC3000. GEO2R-based analysis led to the identification of signif-icantly regulated genes. Further details on expression analysis, t-values, and P values are in Supplemental Data Set 7 online.(B) Auxin and cytokinin reporter lines: Auxin (top panel) and cytokinin (bottom panel) reporter lines were infiltrated with Pst (106 colony-forming units/mL,red arrows). The 3 DPPI leaves were GUS stained and photographed afterwards. As a control, plants were treated with 10 mM MgCl2 (black arrows).Similar results were obtained in five independent experiments.(C) Status of auxin and cytokinin during infection with Pst DC3000. Leaves were infiltrated with Pst (106 colony-forming units/mL). Three DPPI, infectedareas surrounding healthy tissue were sampled for hormone analysis. As a control, plants were treated with 10 mM MgCl2. The values represented arethe average for three replicate samples (6SE). Asterisks indicate statistically significant hormone accumulation: The difference between Pst treatmentand mock is significant. For IAA, Pst treatment causes significant increase in IAA accumulation compared with mock treatment. For cytokinin, Pst
Modeling Plant Immunity 13 of 22
promotes plant immunity against Pst (Figure 3). With the spot-light on their individual roles, the combined effect of auxin andcytokinin in plant immunity is still not known. To address thismore closely, we modeled the combined effects of auxin andcytokinin on plant immunity. To mimic modulation in levels ofauxin and cytokinin, we chose various input activation values(partial and full activation) for nodes of auxin and cytokininwithout Pst (Pst is also capable of increasing in planta auxinconcentrations; Figures 7B and 7C) while performing SQUADsimulations. Partially and fully activated nodes of auxin andcytokinin as a combined input signal did change system statesacross the whole network (see Supplemental Data Set 3 online).Furthermore, we monitored states of marker node PR-1 as anindicator of immunity status and presented it as trajectoryover time for each hormonal combination (Figure 8A). Inputactivations of higher (1.0 as input activation) auxin and lower (0.2as input activation) cytokinin resulted in low PR-1 activity. Whenthis combination was reversed, PR-1 gained more activation(Figure 8A). Full to partial input activation of auxin resulted inlow PR-1 activity, whereas partial to full input activation ofcytokinin resulted in an increase in the state of PR-1 (Figure 8A).Furthermore, using SQUAD simulation, we determined valuesof PR-1 activation for combination of auxin and cytokinin atvarious input activating values (ranging from 0 to 1). Three-dimensional visualization of the data provided an overviewshowing that a relative shift of activation from auxin to cytokininresulted in the activation of PR-1, whereas the reverse is ob-served when the trend of activation was directed toward auxin(Figure 8A, bottom panel). More precisely, immunity is com-promised when auxin supersedes the activation of cytokinin,and immunity is achieved when cytokinin attains higher activa-tion than auxin.
Pst inoculation enhances de novo auxin synthesis in Arabi-dopsis and reduces cytokinin levels at the site of infection(Figures 7B and 7C). However, to demonstrate the impact ofinteraction between auxin and cytokinin on plant immunity,we performed experiments (exogenous application of hor-mones) on PR1:GUS Arabidopsis transgenic plants. PR1:GUSplants were induced (via petiole feeding of hormones) with ki-netin and NAA alone, as well as in combination without in-oculation of Pst. Following hormonal induction, leaves weresubjected to histochemical GUS staining. Kinetin-treated PR1:GUS leaves showed higher GUS activity, while NAA treatmentalone did not induce any GUS activity (Figure 8B). However, thecombination of kinetin and NAA manifested low GUS activitycompared with kinetin alone. Taken together, our model and
experimental data substantiate that a balance between auxinand cytokinin modulates plant immunity against infection withPst in Arabidopsis.To confirm that a balance between auxin and cytokinin
affects plant immunity during infection of Arabidopsis by Pst,we next performed simulations using auxin and cytokinin (invarious input activations) as input nodes in the presence of Pst.Activation of PR-1 as function of time (arbitrary units) is shownby a heat map (Figure 9A). In this simulation, the combinationof auxin and Pst (auxin together with Pst) resulted in decay ofthe PR-1 signal generated by Pst alone (Figure 9A, top threerows). However, together with Pst, cytokinin increased thesignal of PR-1. Full activation of both auxin and cytokinin in thepresence of Pst as input nodes diminished the signal of PR-1activation entirely. However, in the presence of Pst, the signalwas regained when auxin was kept partially activated andcytokinin was used as a fully active input node (Figure 9A,bottom and middle rows). Experimentally, exogenous appli-cation of kinetin led to significantly reduced in planta bacterialgrowth, whereas NAA enhanced the sensitivity of the plant toinfection with Pst. When administered exogenously, the com-bination of both auxin and cytokinin led to intermediate bac-terial growth in comparison to auxin and cytokinin alone(Figure 9B). These results suggest that the balance betweenauxin and cytokinin modulates in planta Pst multiplication inArabidopsis.We tested how the interaction between auxin and cytokinin
influences the SA pathway of resistance against infection withPst. Simulations were conducted in the presence (+SA; en-hanced levels) and absence (2SA; mimic SA biosynthesismutants) of SA together with different auxin and cytokinincombinations, as well as Pst as activating input nodes. Weanalyzed further a modified network in which the node of SAwas completely deleted (to mimic a sid2 mutant). In the pres-ence of Pst, the activation of auxin as input node abolished thesignal of PR-1 (Figure 9C). However, the activity of PR-1 wasregained when auxin was replaced with cytokinin. Experimen-tally, we found higher bacterial growth in sid2 mutant plantswhen treated with NAA compared with nontreated and kinetin-treated plants (Figure 9D). Intriguingly, application of auxin andcytokinin in combination on the sid2 mutant resulted in in-termediate bacterial growth in comparison to the individual ap-plication of auxin or cytokinin (Figure 9D). These resultssubstantiate that fine-tuning between auxin and cytokinin hasan impact on the SA pathway of resistance against infectionwith Pst.
Figure 7. (continued).
treatment significantly reduces cytokinin level compared with mock treatment (*P < 0.05, ***P < 0.001; t test). The experiment was repeated three timesand similar results were observed. fgw, fresh gram weight.(D) Modeling the impact of auxin and SA on infection by Pst. In SQUAD simulations, the node of Pst was kept as a fully active (1.0; virulent pathogen)input node, while input activations of auxin and SA were compared for full (1.0) and partial (0.5) levels of activation. Activation of PR-1 over arbitrary unitsof time (left, top to bottom) is shown as a heat map (scale: right) at various activation levels of auxin and SA in combination with Pst. Further details onactivation of other nodes are given in Supplemental Data Set 9 online.(E) Auxin promotes sensitivity in Arabidopsis to infection by Pst. Arabidopsis Pst (105 colony-forming units/mL)-inoculated leaves, pretreated with 10mM NAA. Symptoms were photographed 4 DPPI. Similar results were obtained in three independent experiments.
14 of 22 The Plant Cell
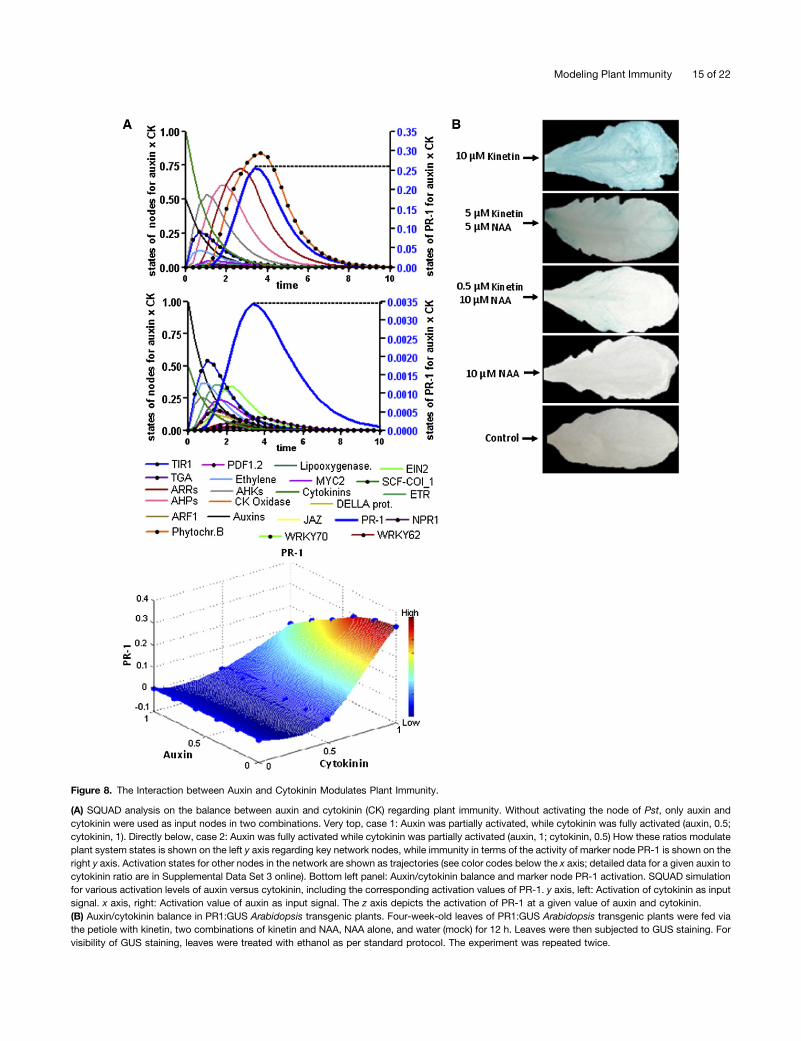
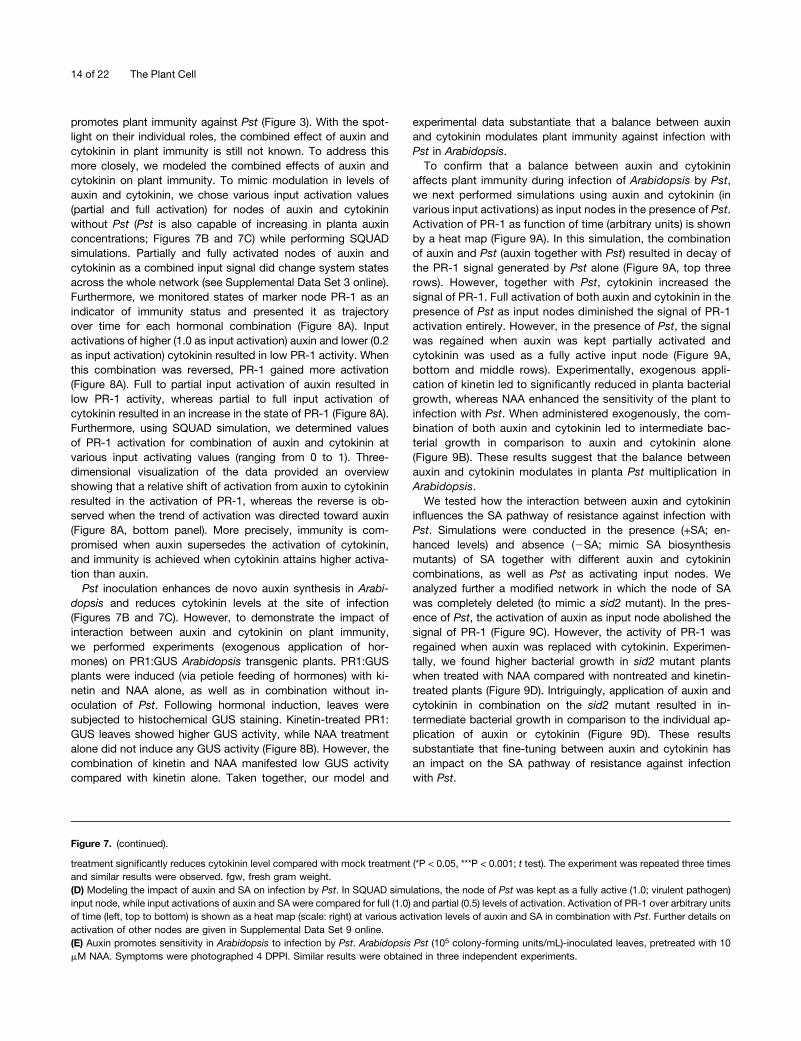
Figure 8. The Interaction between Auxin and Cytokinin Modulates Plant Immunity.
(A) SQUAD analysis on the balance between auxin and cytokinin (CK) regarding plant immunity. Without activating the node of Pst, only auxin andcytokinin were used as input nodes in two combinations. Very top, case 1: Auxin was partially activated, while cytokinin was fully activated (auxin, 0.5;cytokinin, 1). Directly below, case 2: Auxin was fully activated while cytokinin was partially activated (auxin, 1; cytokinin, 0.5) How these ratios modulateplant system states is shown on the left y axis regarding key network nodes, while immunity in terms of the activity of marker node PR-1 is shown on theright y axis. Activation states for other nodes in the network are shown as trajectories (see color codes below the x axis; detailed data for a given auxin tocytokinin ratio are in Supplemental Data Set 3 online). Bottom left panel: Auxin/cytokinin balance and marker node PR-1 activation. SQUAD simulationfor various activation levels of auxin versus cytokinin, including the corresponding activation values of PR-1. y axis, left: Activation of cytokinin as inputsignal. x axis, right: Activation value of auxin as input signal. The z axis depicts the activation of PR-1 at a given value of auxin and cytokinin.(B) Auxin/cytokinin balance in PR1:GUS Arabidopsis transgenic plants. Four-week-old leaves of PR1:GUS Arabidopsis transgenic plants were fed viathe petiole with kinetin, two combinations of kinetin and NAA, NAA alone, and water (mock) for 12 h. Leaves were then subjected to GUS staining. Forvisibility of GUS staining, leaves were treated with ethanol as per standard protocol. The experiment was repeated twice.
Modeling Plant Immunity 15 of 22
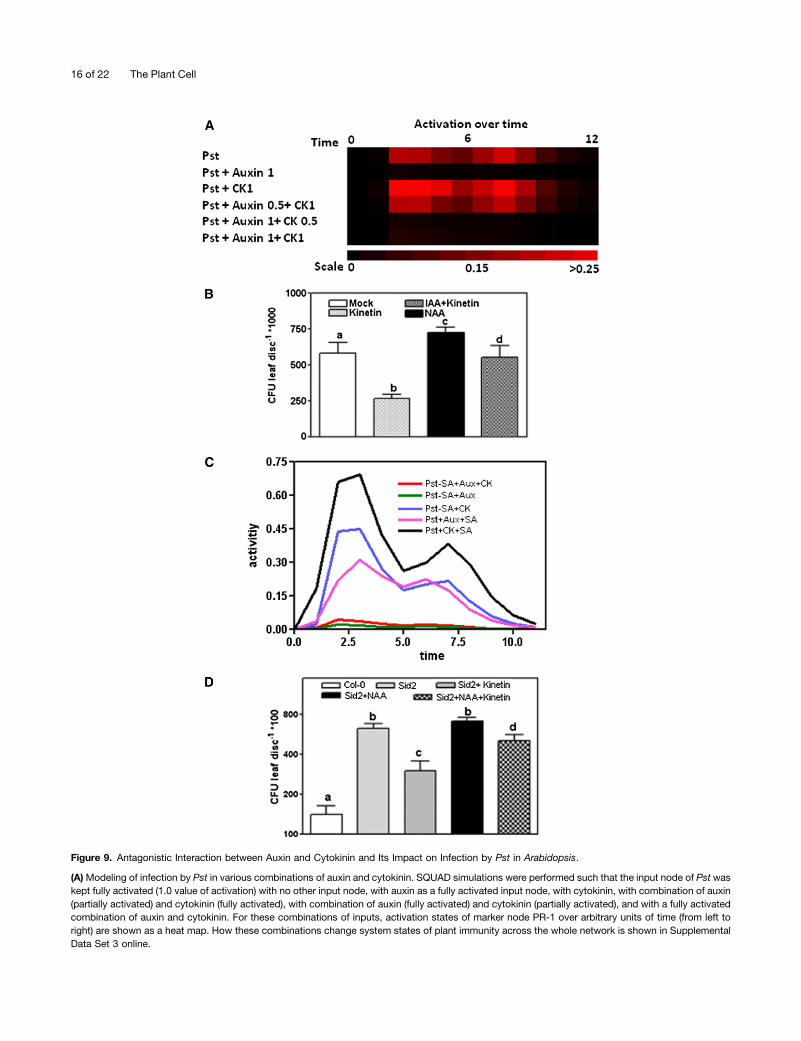
Figure 9. Antagonistic Interaction between Auxin and Cytokinin and Its Impact on Infection by Pst in Arabidopsis.
(A)Modeling of infection by Pst in various combinations of auxin and cytokinin. SQUAD simulations were performed such that the input node of Pst waskept fully activated (1.0 value of activation) with no other input node, with auxin as a fully activated input node, with cytokinin, with combination of auxin(partially activated) and cytokinin (fully activated), with combination of auxin (fully activated) and cytokinin (partially activated), and with a fully activatedcombination of auxin and cytokinin. For these combinations of inputs, activation states of marker node PR-1 over arbitrary units of time (from left toright) are shown as a heat map. How these combinations change system states of plant immunity across the whole network is shown in SupplementalData Set 3 online.
16 of 22 The Plant Cell
DISCUSSION
Networking of small-molecule hormones is a newly emergingaspect of plant immunity where crosstalk between growth reg-ulators and stress-specific hormones modulate plant pathogeninteractions. Pathogen infection profoundly alters the hormonalprofile and network dynamics of the plant cell (Grant and Jones,2009). Therefore, dynamic modeling is required for better un-derstanding of hormonal implications in plant immunity. How-ever, kinetic data on complex hormonal interactions are scarce.A solution is standardized qualitative dynamic modeling in whichconnectivity (Sankar et al., 2011) is emphasized more thankinetics. Our modeling illustrates the impact of integrationbetween bacterial effectors and host hormonal cues andsampling over the whole network and documents the eventualoutcome for the host-pathogen system. Cytokinin is amongthe most important, but immunologically least deciphered, planthormones. With modeling and targeted experiments, we havenow identified previously undiscovered crosstalk in cytokininsignaling.
Pst infection modeling and subsequent systems stabilityanalysis revealed profound overlap between PTI and ETI.However, redundancy and robustness was exclusively found inETI (Figure 2B; see Supplemental Figures 5 and 7 online).Robustness in ETI restricts incompatibilities but allows com-patible pathogens (Tsuda et al., 2009; Nishimura and Dangl,2010) to establish susceptibility of the host. Moreover, Typethree secretion system–deficient mutants failed to mount animmune response equivalent to that of virulence and effector-deficient mutants (see Supplemental Figure 5 online) and weretherefore subject to suboptimal multiplication (Hauck et al.,2003). Such mutants fail to breach the first line of defense (PTI;Figure 2B; see Supplemental Figure 4B online), which is oth-erwise circumvented by effectors of the virulence system (seeSupplemental Figure 4B online) in favor of optimal multiplica-tion. Our modeling envisions zigzag immune responses (Jonesand Dangl, 2006) in dynamic terms and provides relativequantification to various components of plant immunity.
Regarding the first line of defense, SQUAD modeling high-lighted the promoting effect of cytokinin on PTI (Figure 6A).However, the early events of recognition (ROS production andmedia alkalinization; Zipfel et al., 2006) seem to be cytokininindependent. It remains to be elucidated if cytokinin influencesPTI by modulating nitric oxide signaling. However, during theadvanced phase of the infection, repression of the cytokininresponse/concentration (Figure 7) at the host-pathogen in-terface seems to be a virulence strategy Pst has adopted foroptimal in planta bacterial multiplication. Pst, unlike other bio-trophic pathogens (Walters and McRoberts, 2006; Pertry et al.,2009), does not produce cytokinin during infection. Cytokininresponse reporter lines (AtARR5:GUS) demonstrate the re-pression of host cytokinin during pathogen infection in detail(Figure 7B). Additionally, the sequenced genome of Pst (http://www.pseudomonas-syringae.org/pst_DC3000_gen.htm) containsno genes related to biosynthesis or degradation of cytokininotherwise present in Arabidopsis, Agrobacterium tumefaciens,Pseudomonas savastanoi, and Ralstonia fascians, as well asother plant growth-promoting bacteria. The lack of increase incytokinin concentration/response (measurements in Figures 7Band 7C) during the course of infection suggests the absence ofpotential effectors in Pst that would otherwise enhance the level/response of cytokinin in the host.Modeling the impact of phytohormones on Pst infection re-
vealed that JA, auxin, and ABA reduced Pst-mediated PR-1activation and promoted susceptibility. SA and GA further in-creased PR-1 activation and enhanced resistance (Figure 3A).Predicted node switching and model outputs are supported indetail according to current literature (see Supplemental Table 2online). Modeling of increased plant cytokinin with/without theaddition of Pst revealed a boosting effect on plant immunity(Figures 3B and 9A; see Supplemental Figure 3B online). Ex-periments support this by revealing reduced disease symptomswith abrogated in planta bacterial multiplication (Figure 3C) andhigher expression of PR-1 (Figure 8B) upon cytokinin treatment.Moreover, increased cytokinin levels enhanced resistance intransgenic plants to Pst (Choi et al., 2010) and Pst tabaci
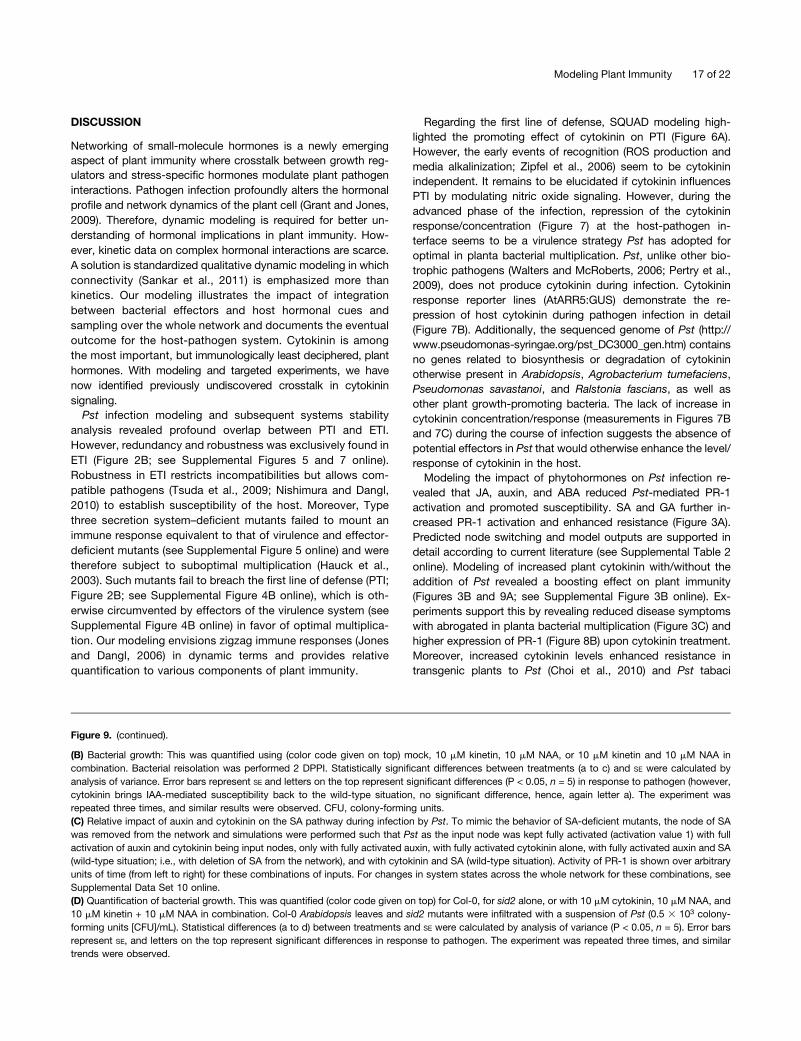
Figure 9. (continued).
(B) Bacterial growth: This was quantified using (color code given on top) mock, 10 mM kinetin, 10 mM NAA, or 10 mM kinetin and 10 mM NAA incombination. Bacterial reisolation was performed 2 DPPI. Statistically significant differences between treatments (a to c) and SE were calculated byanalysis of variance. Error bars represent SE and letters on the top represent significant differences (P < 0.05, n = 5) in response to pathogen (however,cytokinin brings IAA-mediated susceptibility back to the wild-type situation, no significant difference, hence, again letter a). The experiment wasrepeated three times, and similar results were observed. CFU, colony-forming units.(C) Relative impact of auxin and cytokinin on the SA pathway during infection by Pst. To mimic the behavior of SA-deficient mutants, the node of SAwas removed from the network and simulations were performed such that Pst as the input node was kept fully activated (activation value 1) with fullactivation of auxin and cytokinin being input nodes, only with fully activated auxin, with fully activated cytokinin alone, with fully activated auxin and SA(wild-type situation; i.e., with deletion of SA from the network), and with cytokinin and SA (wild-type situation). Activity of PR-1 is shown over arbitraryunits of time (from left to right) for these combinations of inputs. For changes in system states across the whole network for these combinations, seeSupplemental Data Set 10 online.(D) Quantification of bacterial growth. This was quantified (color code given on top) for Col-0, for sid2 alone, or with 10 mM cytokinin, 10 mM NAA, and10 mM kinetin + 10 mM NAA in combination. Col-0 Arabidopsis leaves and sid2 mutants were infiltrated with a suspension of Pst (0.5 3 103 colony-forming units [CFU]/mL). Statistical differences (a to d) between treatments and SE were calculated by analysis of variance (P < 0.05, n = 5). Error barsrepresent SE, and letters on the top represent significant differences in response to pathogen. The experiment was repeated three times, and similartrends were observed.
Modeling Plant Immunity 17 of 22
(Grosskinsky et al., 2011), whereas decreased cytokinin levelreduced the expression of PR-1 (Uchida and Tasaka, 2010).We took up the challenge to create a dynamic model of thesevarious influences. Thus, modulation in plant cytokininchanges infection dynamics such that an increase in cytokininfavors protection, while its decline adds to vulnerability.Argueso et al. (2012) found that comparatively low exogenouscytokinin application lead to higher susceptibility against in-fection with Hpa Noco2 in Arabidopsis. However, (1) unlikeHpa, Pst reduces the level of in planta cytokinin at the site ofinfection (Figure 7C); (2) Pst weakens cytokinin responses(Figures 7A and 7B) to avoid cytokinin-mediated defense (Choiet al., 2010) for self-multiplication; and (3) in contrast with in-fection with Hpa Noco2, where cytokinin operates upstream(EDS16) of SA production, cytokinin-mediated protectionagainst Pst operates downstream (TGA3) of the SA synthesis(Figure 5D); (4) finally, Hpa Noco2 uses type A response regu-lators to suppress SA-mediated defense responses, whereasPst infection downregulates A type ARRs (Figure 7A; Thilmonyet al., 2006), and in the presence of cytokinin, B-type ARR(ARR2) is implicated in immunity (Choi et al., 2010). Trophicnature, in planta cytokinin secreting capabilities, host cell in-oculation, and multiplication are features that further differen-tiate Hpa Noco2 from Pst. We thus argue that infectiondynamics of Hpa Noco2 and Pst regarding cytokinin responsesare out of phase and, hence, not directly comparable.
Cytokinin-mediated increases in the expression of markergene PR-1 (Figure 8B) made SA-cytokinin positive crosstalkquite plausible. However, our simulations on the mode of in-teraction between SA and cytokinin (Figures 4 and 9C) revealedimportant biological inferences. SQUAD modeling and sub-sequent experimental analysis on cytokinin-treated Arabidopsisleaves demonstrated no significant increase for the accumula-tion of SA (Figures 3B and 5A). By contrast, without pathogeninoculation, cytokinin treatment led to significantly higher ca-malexin accumulation in treated versus control leaves (Figure5B). These results prompted experiments on SA-deficient mu-tants for the underlying SA-cytokinin crosstalk. However, theliterature is mired with contrasting conclusions in this regard.Cytokinin-treated, Pst-inoculated NahG Arabidopsis plants (Choiet al., 2010) failed to show rescued susceptibility. By contrast,Pst tabaci–inoculated prior cytokinin-treated NahG tobacco(Grosskinsky et al., 2011) plants showed a completely rescuedsusceptible disease phenotype. We analyzed this dichotomywith SQUAD simulations and found that in Arabidopsis, in-teraction between SA and cytokinin positively influenced plantimmunity against Pst (Figure 5C). However, deletion of SA in thepresence of cytokinin slightly affected the activity of PR-1,whereas deletion of TGA substantially reduced this activity(Figure 5C). In corresponding experiments, we partially restoredresistance against Pst by the application of exogenous cytokininto sid2 mutants (Figures 5D and 9D). This seems to be in con-trast with a previous finding where prior cytokinin treatmentcould not prevent the severe disease phenotype in NahG plants(Choi et al., 2010). This may be due to the nature of the mutantwe investigated. In addition, according to our results, the systemresponse differs according to pathogen load. At low Pst den-sity, cytokinin treatment does prevent the severe phenotype.
Enhanced pathogen resistance by elevated cytokinin is thuspartly a consequence of direct crosstalk between SA and cy-tokinin. However, SA biosynthesis adds up to better protectionby enhancing system states already in place (Figure 5C), andcytokinin-driven phytolaxin (Figure 5B) accumulation andweakening of auxin responses (Figures 8 and 9C) are addi-tional factors contributing to immunity in Arabidopsis againstPst.The Pst infection model determined activation states for
nodes representing hormonal stimuli. In contrast with the lackof activation found for cytokinin, auxin was activated over time(Figure 2A; see Supplemental Figure 4A online). Analysis oflarge-scale gene expression data on Pst infection in Arabi-dopsis also mirrored the notion of repression and derepressionfor cytokinin and auxin responses, respectively (Figure 7A).Moreover, Pst infection experiments on response regulators ofauxin and cytokinin reporter lines (Figure 7B) nicely com-plemented the infection modeling. Significantly higher auxinand reduced cytokinin accumulation at the host-pathogen in-terface due to the infection with Pst (Figure 7C) further sup-ported the outcome of experiments on reporter lines. Thesedifferent and complementary approaches adequately high-lighted the activation of auxin and inhibition of cytokinin asa consequence of infection with Pst in Arabidopsis. However,SQUAD simulations and subsequent experimental analysissupport that both auxin and cytokinin change the infectiondynamics of Pst (Figures 5C, 5D, 7D, and 7E). Cytokinin in-creased protection, whereas auxin enhanced susceptibility ofArabidopsis to infection by Pst. Our findings are in agreementwith previous findings. Increased endogenous cytokinin (35S:IPT; Choi et al., 2010) restricted Pst multiplication, whereasenhanced auxin levels (Wang et al., 2007; Crabill et al., 2010) inArabidopsis led to enhanced sensitivity to infection with Pst.However, rather than investigating the role of auxin (Wanget al., 2007) and cytokinin (Choi et al., 2010) as independentevents in plant immunity, we captured them in concert andsubstantiated that activation of the former with concomitantinhibition of the latter combine to create optimal infectionconditions for Pst in Arabidopsis.Crosstalk between auxin and cytokinin is quite prevalent in
biological processes related to growth and development ofplants (Moubayidin et al., 2009; Liu et al., 2010), but the literatureis scarce regarding its impact on plant immunity. SQUADmodeling and subsequent experimental demonstration eluci-dated the interplay between auxin and cytokinin and revealedthat immunity and susceptibility are a carefully controlled bal-ance (Figure 8A). States of activation of cytokinin over auxindivert the trend toward resistance, and the opposite holds truefor susceptibility (Figure 8A). Experimentally, in comparison toauxin, addition of cytokinin alone resulted in higher PR-1 ex-pression, while their combination minimized this effect (Figure8B). Moreover, higher auxin levels led to severe disease symp-toms coupled with fast bacterial growth (Figures 7E and 9B).Auxin and cytokinin fed to Arabidopsis leaves in combinationand in concentrations as above resulted in an intermediate stateof response (Figure 9B). Intermediate bacterial growth resultedfrom the combined effect of cytokinin and auxin in sid2 mutants(Figure 9D). Mutual regulation between auxin and cytokinin from
18 of 22 The Plant Cell
the perspective of host-pathogen interaction has not been ex-plored so far. The antagonistic effect of auxin on cytokinin levelshas already been investigated for morphogenesis (Nordströmet al., 2004). However, via type B response regulators, cytokinindecreases auxin responses by inducing auxin repressor protein(AUX/IAA; Moubayidin et al., 2009). Cytokinin also affects auxinflux and gradients by decreasing the level of auxin efflux carriers(PIN1) through a transcription-independent mechanism (Stepanovaand Alonso, 2011). Taken together for the host-pathogen system,our modeling and experimental analysis substantiates an antago-nistic interaction between auxin and cytokinin. Stronger resistanceis impaired by auxin and increased sensitivity is diminished bycytokinin. Likely mechanisms to promote resistance involve (1)cytokinin stabilizing the auxin repressors AUX/IAA throughpositive interaction with SA and (2) cytokinin influencing trans-port of auxin away from the site of infection via auxin trans-porters. Likewise, auxins might promote (1) degradation ofcytokinin through oxidation by their activation enzymes or (2)conversion of cytokinin to inactive storage forms. Molecularmechanisms that influence these interactions need detailedfurther experimentation and more resolution.
Tiny and simply structured yet complex in cell signaling,cytokinin is actively involved in vital processes, such as celldivision, tissue differentiation, lateral bud growth, photosyn-thetic activity, and floral development (Kudo et al., 2010). Theythus have immense potential in enhancement of crop yield. Byvirtue of their implications in delaying aging and retaining plantchlorophyll (Gan and Amasino, 1995) cytokinin is instrumentalin increasing crop shelf life, reduction of post-harvest losses,and thus ensuring food security. Elevated cytokinin promotesantioxidative forces, keeps the cellular redox potential high,and protects plants from abiotic environmental extremes(Rivero et al., 2007). Adding further to this list, our systemsbiology–led experiments and modeling suggests crosstalkpossibilities for cytokinin in complex hormonal disease net-works with implications for new yield protection strategies inagriculture.
METHODS
General Network Setup
Data mining and an extensive literature survey established theplant hormone disease network with all undisputed key nodes (seeSupplemental Table 1 online) and inhibitory and/or activatory edges (typeof interactions, references, and evaluation; see Supplemental Tables 1and 2 online). The network was implemented in CellDesigner version 3.5.1and stored in SBML format.
Modeling Strategy
The SQUAD suite (Di Cara et al., 2007) performed steady state analysesand dynamic simulations (see Supplemental Figure 1 online), recognizingnodes and interacting edges automatically. For the discrete dynamicanalysis, SQUAD uses generic assumptions: The presence of any one ofthe activators can effectively activate a target node, and the presence ofany one of the inhibitors can successfully inactivate the target node. Formore complex scenarios, different inputs are each considered and in-tegrated according to the network topology (see details in Supplemental
Methods 1 online; in particular, equation 2). Thereby, SQUAD identifiesthe number of stable steady states located in the network. Furthermore, itcalculates activity values of each node at a given steady state. SQUADsimulations and steady state analyses highlight system equilibria and theirchanges upon signaling stimuli (pathogen and/or hormonal signals). Theactivity value of each node was set to zero (trivial steady state) asa starting point for continuous dynamic simulations to bring the network atequilibrium. To monitor the global system response semiquantitativelytoward pathogen or hormonal stimuli, an input signal of the system wasinitially set to 1. To study the mutual impact of two or more stimuli, wesimultaneously set their initial activation to 1. For partial activation, inputstimuli were initialized with values between 0 and 1. SQUAD convertedthe effect of these perturbations into time-resolved activity curves(sigmoid) for each and every node of the network which then was vi-sualized by means of heat maps and trajectory plots. SupplementalMethods 1 online shows the exact equations and resulting curve shapeused for this and integration of activating as well as inhibitory input (orboth) according to logical connectivity including partial activation ofnodes. Supplemental Data Set 4 online shows for illustration the detailedmodeling of auxin and cytokinin during the infection of Pst DC3000 inArabidopsis thaliana (see also results above). For validation, this can becompared with Supplemental Data Set 5 online, for measured geneexpression values of auxin and cytokinin pathways during infection ofArabidopsis by Pst DC3000 versus mock (see also results above).
To asses the robustness of the network, we randomly added andremoved nodes from the network and performed simulations as detailedabove (see Supplemental Figure 7 online).
Analysis of Microarray Data
We analyzed original submitter-supplied microarray data in the GEOdatabase using the interactiveWeb tool GEO2R (http://www.ncbi.nlm.nih.gov/geo/geo2r/). This allows users to compare two or more sampleswithin the GEO submitted microarray series. GEO2R uses BioconductorR packages GEOquery (Sean and Meltzer, 2007) and limma (LinearModels for Microarray Analysis; Smyth, 2004). GEOquery parses GEOsubmitted array data into R data structures, while limma applies multipletesting corrections on P values to correct the occurrence of falsepositives and identifies differentially (P value # 0.05) expressed genes.We entered GEO accession numbers of the above microarray ex-periments and then defined groups as treated and control with givennumber of replicates found in GEO. We calculated the distribution ofthe values for selected samples via value distribution option in GEO2Rand graphically presented them as box plots to view their suitabilityfor comparison. For multiple-testing corrections, the Benjamini andHochberg false discovery rate method (Benjamini and Hochberg, 1995)was applied. GEO2R provided limma-generated statistical analysis of thedata, such as adjusted and raw P values, t and B values, as well as foldchanges.
Plant Pathogen Experiments
Four- to five-week-old Arabidopsis thaliana Col-0 (see http://www.Arabidopsis.org/) and sid2 mutant plants were used in experiments(Raacke et al., 2006). Plants were grown in soil with 9 to 16 h of light andperiods of 5 weeks in a growth chamber. The bacterial strain Pseudo-monas syringae pv tomato DC3000 was cultured in King’s broth mediumcontaining 50 mg/L rifampicin. Harvested cells were resuspended in 10mM MgCl2. Bacterial inoculations were performed by syringe infiltration.Furthermore, bacterial growth was quantified through a plate countingmethod. Arabidopsis Col-0 and sid2 mutants were sprayed with kinetinand/or NAA solutions. For pathogen inoculation, the spray method wasalso used. PR-1:GUS plants (Gust et al., 2007) were also investigated.GUS staining and subsequent destaining were performed according to
Modeling Plant Immunity 19 of 22
standard procedures. Free SA and phytoalexin were analyzed accordingto Mishina and Zeier (2006), nad t-zeatin and IAA were analyzed as de-scribed by Hussain et al. (2010). ROS and pH experiments were per-formed as described by Ahmed (2010).
Accession Numbers
Data analyzed in this study are available in the GEO database underaccession numbers GSE3984, GSE6832, and GSE5520.
Supplemental Data
The following materials are available in the online version of this article.
Supplemental Figure 1. Key Steps in the Implementation of SQUADMethodology for Investigating Plant Hormones and Disease SignalingNetworks.
Supplemental Figure 2. Infection Modeling of Virulent Pathogen Pstand Fitness of the Pathogen.
Supplemental Figure 3. Modeling the Impact of Plant HormoneCytokinin on the Pathogenicity of Pst.
Supplemental Figure 4. Effectors of Pst DC3000 Change theHormonal Profile in Arabidopsis and Inhibit PTI.
Supplemental Figure 5. Robustness and Redundancy in ETI and ItsOperational Overlap with PTI.
Supplemental Figure 6. Cytokinin Has No Cytotoxic or AntimicrobialEffects on the Multiplication of Pst DC3000.
Supplemental Figure 7. System Stability Analysis and ResultingRobustness of the Network Topology.
Supplemental Figure 8. Network Topology for Hormones andDisease Networks in Arabidopsis.
Supplemental Table 1. Node Interactions and Literature Support.
Supplemental Table 2. Input Signals and SQUAD-Analyzed Outputswith Experimental Validation.
Supplemental Methods 1. Computation of the Dynamic Behavior ofthe Network Components.
Supplemental Data Set 1. Cytokinin Promotes PTI.
Supplemental Data Set 2. SQUAD Modeling for Infection of FullyVirulent Pst DC3000 in Arabidopsis.
Supplemental Data Set 3. Auxin-Cytokinin Antagonism in PlantImmunity.
Supplemental Data Set 4. Modeling the Combination of Auxin andCytokinin during the Infection of Pst DC3000 in Arabidopsis.
Supplemental Data Set 5. Measured Gene Expression Values ofAuxin and Cytokinin Pathways during Infection of Arabidopsis by PstDC3000 versus Mock.
Supplemental Data Set 6. How Plant hormones Influence theInfection of Pst DC3000 in Arabidopsis.
Supplemental Data Set 7. Impact of SA and Cytokinin Signaling onGenes of Immunity in Arabidopsis.
Supplemental Data Set 8. Modeling of the Impact of Cytokinin on SAPathway of Resistance.
Supplemental Data Set 9. Modeling the Impact of SA and Auxin onInfection by Pst DC3000 in Arabidopsis.
Supplemental Data Set 10. Relative Strength of Auxin and CytokininEffects on the SA Pathway.
ACKNOWLEDGMENTS
We thank the German Research Council (Deutsche Forschungsgemein-shaft: Da 208/10-2; 12-1), Bundesministerium für Bildung und Forschung(0315395B), and Land Bavaria for funding.
AUTHOR CONTRIBUTIONS
M.N. and T.D. conceived and planned the project. M.N. and N.P. set upsimulations and M.N., N.P., G.W., and T.D. analyzed them. M.N. (main),A.H., and N.A. performed experiments for verification. T.D. supervisedand guided the study. All authors wrote the article and approved the finalversion.
Received March 15, 2012; revised April 26, 2012; accepted May 10,2012; published May 29, 2012.
REFERENCES
Ahmed, N. (2010). Physiological and Molecular Basis of Azospirillum-Arabidopsis Interaction. PhD dissertation (Würzburg, Germany:University of Wuerzburg).
Albert, R. (2005). Scale-free networks in cell biology. J. Cell Sci. 118:4947–4957.
Alonso-Ramírez, A., Rodríguez, D., Reyes, D., Jiménez, J.A.,Nicolás, G., López-Climent, M., Gómez-Cadenas, A., andNicolás, C. (2009). Evidence for a role of gibberellins in salicylicacid-modulated early plant responses to abiotic stress in Arabi-dopsis seeds. Plant Physiol. 150: 1335–1344.
Argueso, C.T., Ferreira, F.J., Epple, P., To, J.P., Hutchison, C.E.,Schaller, G.E., Dangl, J.L., and Kieber, J.J. (2012). Two-componentelements mediate interactions between cytokinin and salicylic acid inplant immunity. PLoS Genet. 8: e1002448.
Ay, F., Xu, F., and Kahveci, T. (2009). Scalable steady state analysisof Boolean biological regulatory networks. PLoS ONE 4: e7992.
Bari, R., and Jones, J.D. (2009). Role of plant hormones in plantdefence responses. Plant Mol. Biol. 69: 473–488.
Benjamini, Y., and Hochberg, Y. (1995). Controlling the false dis-covery rate: A practical and powerful approach to multiple testing.J. R. Stat. Soc. Ser. 57: 289–300.
Boller, T., and He, S.Y. (2009). Innate immunity in plants: An armsrace between pattern recognition receptors in plants and effectorsin microbial pathogens. Science 324: 742–744.
Cao, F.Y., Yoshioka, K., and Desveaux, D. (2011). The roles of ABAin plant-pathogen interactions. J. Plant Res. 124: 489–499.
Clarke, S.F., Burritt, D.J., Jameson, P.E., and Guy, P.L. (1998). In-fluence of plant hormones on virus replication and pathogenesisrelated proteins in Phaseolus vulgaris L. infected with white clovermosaic potexvirus. Physiol. Mol. Plant Pathol. 53: 195–207.
Crabill, E., Joe, A., Block, A., van Rooyen, J.M., and Alfano, J.R.(2010). Plant immunity directly or indirectly restricts the injection oftype III effectors by the Pseudomonas syringae type III secretionsystem. Plant Physiol. 154: 233–244.
Chen, Z., Agnew, J.L., Cohen, J.D., He, P., Shan, L., Sheen, J., andKunkel, B.N. (2007). Pseudomonas syringae type III effectorAvrRpt2 alters Arabidopsis thaliana auxin physiology. Proc. Natl.Acad. Sci. USA 104: 20131–20136.
Choi, J., Huh, S.U., Kojima, M., Sakakibara, H., Paek, K.H., andHwang, I. (2010). The cytokinin-activated transcription factor ARR2promotes plant immunity via TGA3/NPR1-dependent salicylic acidsignaling in Arabidopsis. Dev. Cell 19: 284–295.
20 of 22 The Plant Cell
Dervinis, C., Frost, C.J., Lawrence, S.D., Novak, N.G., and Davis,J.M. (2010). Cytokinin primes plant responses to wounding andreduces insect performance. J. Plant Growth Regul. 29: 289–296.
de Torres Zabala, M., Bennett, M.H., Truman, W.H., and Grant,M.R. (2009). Antagonism between salicylic and abscisic acid re-flects early host-pathogen conflict and moulds plant defence re-sponses. Plant J. 59: 375–386.
Di Cara, A.D., Garg, A., De Micheli, G., Xenarios, I., and Mendoza,L. (2007). Dynamic simulation of regulatory networks using SQUAD.BMC Bioinformatics 8: 462.
Fayza, A.F., and Sabrey, Y.M.M. (2006). Induction of resistance inPhaseolus vulgaris against TNV by salicylic acid and kinetin. Int. J.Agric. Biol 8: 47–51.
Funahashi, A., Matsuoka, Y., Jouraku, A., Morohashi, M., Kikuchi,N., and Kitano, H. (2008). CellDesigner 3.5: A versatile modellingtool for biochemical networks. Proc. IEEE 96: 1254–1265.
Gan, S., and Amasino, R.M. (1995). Inhibition of leaf senescence byautoregulated production of cytokinin. Science 270: 1986–1988.
Glazebrook, J. (2005). Contrasting mechanisms of defense againstbiotrophic and necrotrophic pathogens. Annu. Rev. Phytopathol.43: 205–227.
Grant, M.R., and Jones, J.D.G. (2009). Hormone (dis)harmonymoulds plant health and disease. Science 324: 750–752.
Grosskinsky, D.K. et al. (2011). Cytokinins mediate resistanceagainst Pseudomonas syringae in tobacco through increased anti-microbial phytoalexin synthesis independent of salicylic acid sig-naling. Plant Physiol. 157: 815–830.
Gust, A.A., Biswas, R., Lenz, H.D., Rauhut, T., Ranf, S.,Kemmerling, B., Götz, F., Glawischnig, E., Lee, J., Felix, G., andNürnberger, T. (2007). Bacteria-derived peptidoglycans constitutepathogen-associated molecular patterns triggering innate immunityin Arabidopsis. J. Biol. Chem. 282: 32338–32348.
Han, J.D., Bertin, N., Hao, T., Goldberg, D.S., Berriz, G.F., Zhang,L.V., Dupuy, D., Walhout, A.J., Cusick, M.E., Roth, F.P., andVidal, M. (2004). Evidence for dynamically organized modularity inthe yeast protein-protein interaction network. Nature 430: 88–93.
Hauck, P., Thilmony, R., and He, S.Y. (2003). A Pseudomonas sy-ringae type III effector suppresses cell wall-based extracellular de-fense in susceptible Arabidopsis plants. Proc. Natl. Acad. Sci. USA100: 8577–8582.
Hussain, A., Krischke, M., Roitsch, T., and Hasnain, S. (2010).Rapid determination of cytokinins and auxin in cyanobacteria. Curr.Microbiol. 61: 361–369.
Jones, J.D.G., and Dangl, J.L. (2006). The plant immune system.Nature 444: 323–329.
Kazan, K., and Manners, J.M. (2009). Linking development to de-fense: Auxin in plant-pathogen interactions. Trends Plant Sci. 14:373–382.
Kudo, T., Kiba, T., and Sakakibara, H. (2010). Metabolism andlong-distance translocation of cytokinins. J. Integr. Plant Biol. 52:53–60.
Kunze, G., Zipfel, C., Robatzek, S., Niehaus, K., Boller, T., andFelix, G. (2004). The N terminus of bacterial elongation factor Tuelicits innate immunity in Arabidopsis plants. Plant Cell 16: 3496–3507.
Lai, Z., Wang, F., Zheng, Z., Fan, B., and Chen, Z. (2011). A criticalrole of autophagy in plant resistance to necrotrophic fungalpathogens. Plant J. 66: 953–968.
Laurie-Berry, N., Joardar, V., Street, I.H., and Kunkel, B.N. (2006).The Arabidopsis thaliana JASMONATE INSENSITIVE 1 gene is re-quired for suppression of salicylic acid-dependent defenses duringinfection by Pseudomonas syringae. Mol. Plant Microbe Interact.19: 789–800.
Li, D., Li, J., Ouyang, S., Wang, J., Wu, S., Wan, P., Zhu, Y., Xu, X.,and He, F. (2006). Protein interaction networks of Saccharomycescerevisiae, Caenorhabditis elegans and Drosophila melanogaster:Large-scale organization and robustness. Proteomics 6: 456–461.
Liu, J., Mehdi, S., Topping, J., Tarkowski, P., and Lindsey, K.(2010). Modelling and experimental analysis of hormonal crosstalkin Arabidopsis. Mol. Syst. Biol. 6: 373.
Llorente, F., Muskett, P., Sánchez-Vallet, A., López, G., Ramos, B.,Sánchez-Rodríguez, C., Jordá, L., Parker, J., and Molina, A.(2008). Repression of the auxin response pathway increases Arabi-dopsis susceptibility to necrotrophic fungi. Mol. Plant 1: 496–509.
Melotto, M., Underwood, W., and He, S.Y. (2008). Role of stomatain plant innate immunity and foliar bacterial diseases. Annu. Rev.Phytopathol. 46: 101–122.
Melotto, M., Underwood, W., Koczan, J., Nomura, K., and He, S.Y.(2006). Plant stomata function in innate immunity against bacterialinvasion. Cell 126: 969–980.
Mishina, T.E., and Zeier, J. (2006). The Arabidopsis flavin-dependentmonooxygenase FMO1 is an essential component of biologicallyinduced systemic acquired resistance. Plant Physiol. 141: 1666–1675.
Mishina, T.E., and Zeier, J. (2007). Pathogen-associated molecularpattern recognition rather than development of tissue necrosiscontributes to bacterial induction of systemic acquired resistance inArabidopsis. Plant J. 50: 500–513.
Moubayidin, L., Di Mambro, R., and Sabatini, S. (2009). Cytokinin-auxin crosstalk. Trends Plant Sci. 14: 557–562.
Mukhtar, M.S. et al, European Union Effectoromics Consortium(2011). Independently evolved virulence effectors converge ontohubs in a plant immune system network. Science 333: 596–601.
Muller, B., and Sheen, J. (2007). Arabidopsis cytokinins signallingpathway. Sci. STKE 407: cm5.
Navarro, L., Bari, R., Achard, P., Lisón, P., Nemri, A., Harberd, N.P.,and Jones, J.D.G. (2008). DELLAs control plant immune responsesby modulating the balance of jasmonic acid and salicylic acid sig-naling. Curr. Biol. 18: 650–655.
Navarro, L., Dunoyer, P., Jay, F., Arnold, B., Dharmasiri, N., Estelle,M., Voinnet, O., and Jones, J.D.J. (2006). A plant miRNA con-tributes to antibacterial resistance by repressing auxin signaling.Science 312: 436–439.
Nawrath, C., and Métraux, J.P. (1999). Salicylic acid induction-deficient mutants of Arabidopsis express PR-2 and PR-5 and ac-cumulate high levels of camalexin after pathogen inoculation. PlantCell 11: 1393–1404.
Nishimura, M.T., and Dangl, J.L. (2010). Arabidopsis and the plantimmune system. Plant J. 61: 1053–1066.
Nordström, A., Tarkowski, P., Tarkowska, D., Norbaek, R., Astot,C., Dolezal, K., and Sandberg, G. (2004). Auxin regulation of cy-tokinin biosynthesis in Arabidopsis thaliana: A factor of potentialimportance for auxin-cytokinin-regulated development. Proc. Natl.Acad. Sci. USA 101: 8039–8044.
Panstruga, R., Parker, J.E., and Schulze-Lefert, P. (2009). Snap-Shot: Plant immune response pathways. Cell 136: 978.e1–978.e3.
Pertry, I. et al. (2009). Identification of Rhodococcus fascians cyto-kinins and their modus operandi to reshape the plant. Proc. Natl.Acad. Sci. USA 106: 929–934.
Philippi, N., Walter, D., Schlatter, R., Ferreira, K., Ederer, M.,Sawodny, O., Timmer, J., Borner, C., and Dandekar, T. (2009).Modeling system states in liver cells: Survival, apoptosis and theirmodifications in response to viral infection. BMC Syst. Biol. 3: 97.
Pieterse, C.M.J., Leon-Reyes, A., Van der Ent, S., and Van Wees,S.C. (2009). Networking by small-molecule hormones in plant im-munity. Nat. Chem. Biol. 5: 308–316.
Modeling Plant Immunity 21 of 22
Pomerance, A., Ott, E., Girvan, M., and Losert, W. (2009). The effectof network topology on the stability of discrete state models ofgenetic control. Proc. Natl. Acad. Sci. USA 106: 8209–8214.
Pritchard, L., and Birch, P. (2011). A systems biology perspective onplant-microbe interactions: Biochemical and structural targets ofpathogen effectors. Plant Sci. 180: 584–603.
Raacke, I.C., von Rad, U., Mueller, M.J., and Berger, S. (2006).Yeast increases resistance in Arabidopsis against Pseudomonassyringae and Botrytis cinerea by salicylic acid-dependent as well as-independent mechanisms. Mol. Plant Microbe Interact. 19: 1138–1146.
Rico, A., McCraw, S.L., and Preston, G.M. (2011). The metabolicinterface between Pseudomonas syringae and plant cells. Curr.Opin. Microbiol. 14: 31–38.
Rico, A., and Preston, G.M. (2008). Pseudomonas syringae pv. to-mato DC3000 uses constitutive and apoplast-induced nutrient as-similation pathways to catabolize nutrients that are abundant in thetomato apoplast. Mol. Plant Microbe Interact. 21: 269–282.
Rivero, R.M., Kojima, M., Gepstein, A., Sakakibara, H., Mittler, R.,Gepstein, S., and Blumwald, E. (2007). Delayed leaf senescenceinduces extreme drought tolerance in a flowering plant. Proc. Natl.Acad. Sci. USA 104: 19631–19636.
Robert-Seilaniantz, A., Grant, M., and Jones, J.D. (2011a). Hormonecrosstalk in plant disease and defense: More than just jasmonate-salicylate antagonism. Annu. Rev. Phytopathol. 49: 317–343.
Robert-Seilaniantz, A., MacLean, D., Jikumaru, Y., Hill, L.,Yamaguchi, S., Kamiya, Y., and Jones, J.D.G. (2011b). The mi-croRNA miR393 re-directs secondary metabolite biosynthesis awayfrom camalexin and towards glucosinolates. Plant J. 67: 218–231.
Robert-Seilaniantz, A., Navarro, L., Bari, R., and Jones, J.D.G.(2007). Pathological hormone imbalances. Curr. Opin. Plant Biol. 10:372–379.
Sankar, M., Osmont, K.S., Rolcik, J., Gujas, B., Tarkowska, D.,Strnad, M., Xenarios, I., and Hardtke, C.S. (2011). A qualitativecontinuous model of cellular auxin and brassinosteroid signalingand their crosstalk. Bioinformatics 27: 1404–1412.
Sato, M., Tsuda, K., Wang, L., Coller, J., Watanabe, Y., Glazebrook,J., and Katagiri, F. (2010). Network modeling reveals prevalentnegative regulatory relationships between signaling sectors inArabidopsis immune signaling. PLoS Pathog. 6: e1001011.
Schlatter, R., Philippi, N., Wangorsch, G., Pick, R., Sawodny, O.,Borner, C., Timmer, J., Ederer, M., and Dandekar, T. (2011).Integration of Boolean models exemplified on hepatocyte signaltransduction. Brief. Bioinform. 13: 365–376.
Schneider, D.J., and Collmer, A. (2010). Studying plant-pathogeninteractions in the genomics era: Beyond molecular Koch’s postu-lates to systems biology. Annu. Rev. Phytopathol. 48: 457–479.
Schuster, S., Fell, D.A., and Dandekar, T. (2000). A general definitionof metabolic pathways useful for systematic organization and analysis ofcomplex metabolic networks. Nat. Biotechnol. 18: 326–332.
Sean, D., and Meltzer, P.S. (2007). GEOquery: A bridge between theGene Expression Omnibus (GEO) and BioConductor. Bioinformatics23: 1846–1847.
Siemens, J., Keller, I., Sarx, J., Kunz, S., Schuller, A., Nagel, W.,Schmülling, T., Parniske, M., and Ludwig-Müller, J. (2006).Transcriptome analysis of Arabidopsis clubroots indicate a key rolefor cytokinins in disease development. Mol. Plant Microbe Interact.19: 480–494.
Smyth, G.K. (2004). Linear models and empirical Bayes methods forassessing differential expression in microarray experiments. Stat.Appl. Genet. Mol. Biol. 3: article3.
Stepanova, A.N., and Alonso, J.M. (2011). Bypassing transcription: Ashortcut in cytokinin-auxin interactions. Dev. Cell 21: 608–610.
Stotz, H.U., Sawada, Y., Shimada, Y., Hirai, M.Y., Sasaki, E.,Krischke, M., Brown, P.D., Saito, K., and Kamiya, Y. (2011). Roleof camalexin, indole glucosinolates, and side chain modification ofglucosinolate-derived isothiocyanates in defense of Arabidopsisagainst Sclerotinia sclerotiorum. Plant J. 67: 81–93.
Thibaud-Nissen, F., Wu, H., Richmond, T., Redman, J.C., Johnson,C., Green, R., Arias, J., and Town, C.D. (2006). Development ofArabidopsis whole-genome microarrays and their application to thediscovery of binding sites for the TGA2 transcription factor in sali-cylic acid-treated plants. Plant J. 47: 152–162.
Thilmony, R., Underwood, W., and He, S.Y. (2006). Genome-widetranscriptional analysis of the Arabidopsis thaliana interactionwith the plant pathogen Pseudomonas syringae pv. tomato DC3000and the human pathogen Escherichia coli O157:H7. Plant J. 46:34–53.
Tsuda, K., Sato, M., Stoddard, T., Glazebrook, J., and Katagiri, F.(2009). Network properties of robust immunity in plants. PLoSGenet. 5: e1000772.
Tzfira, T., and Citovsky, V. (2006). Agrobacterium-mediated genetictransformation of plants: Biology and biotechnology. Curr. Opin.Biotechnol. 17: 147–154.
Uchida, N., and Tasaka, M. (2010). Intersections between immuneresponses and morphological regulation in plants. J. Exp. Bot. 61:2539–2547.
Verhage, A., van Wees, S.C., and Pieterse, C.M.J. (2010). Plantimmunity: It’s the hormones talking, but what do they say? PlantPhysiol. 154: 536–540.
Walters, D.R., and McRoberts, N. (2006). Plants and biotrophs: Apivotal role for cytokinins? Trends Plant Sci. 11: 581–586.
Wang, D., Pajerowska-Mukhtar, K., Culler, A.H., and Dong, X.(2007). Salicylic acid inhibits pathogen growth in plants throughrepression of the auxin signaling pathway. Curr. Biol. 17: 1784–1790.
Wangorsch, G., Butt, E., Mark, R., Hubertus, K., Geiger, J.,Dandekar, T., and Dittrich, M. (2011). Time-resolved in silicomodeling of fine-tuned cAMP signaling in platelets: Feedbackloops, titrated phosphorylations and pharmacological modulation.BMC Syst. Biol. 5: 178.
Wildermuth, M.C., Dewdney, J., Wu, G., and Ausubel, F.M. (2001).Isochorismate synthase is required to synthesize salicylic acid forplant defence. Nature 414: 562–565.
Wittmann, D.M., Krumsiek, J., Saez-Rodriguez, J., Lauffenburger,D.A., Klamt, S., and Theis, F.J. (2009). Transforming Booleanmodels to continuous models: Methodology and application toT-cell receptor signaling. BMC Syst. Biol. 3: 98.
Zeng, W., and He, S.Y. (2010). A prominent role of the flagellin re-ceptor FLAGELLIN-SENSING2 in mediating stomatal response toPseudomonas syringae pv tomato DC3000 in Arabidopsis. PlantPhysiol. 153: 1188–1198.
Zipfel, C., Kunze, G., Chinchilla, D., Caniard, A., Jones, J.D.G.,Boller, T., and Felix, G. (2006). Perception of the bacterial PAMPEF-Tu by the receptor EFR restricts Agrobacterium-mediatedtransformation. Cell 125: 749–760.
22 of 22 The Plant Cell
DOI 10.1105/tpc.112.098335; originally published online May 29, 2012;Plant Cell
DandekarMuhammad Naseem, Nicole Philippi, Anwar Hussain, Gaby Wangorsch, Nazeer Ahmed and Thomas
Crosstalk for Cytokinin Immunity Reveals MultipleArabidopsisIntegrated Systems View on Networking by Hormones in
This information is current as of May 16, 2018
Supplemental Data /content/suppl/2012/05/22/tpc.112.098335.DC1.html
Permissions https://www.copyright.com/ccc/openurl.do?sid=pd_hw1532298X&issn=1532298X&WT.mc_id=pd_hw1532298X
eTOCs http://www.plantcell.org/cgi/alerts/ctmain
Sign up for eTOCs at:
CiteTrack Alerts http://www.plantcell.org/cgi/alerts/ctmain
Sign up for CiteTrack Alerts at:
Subscription Information http://www.aspb.org/publications/subscriptions.cfm
is available at:Plant Physiology and The Plant CellSubscription Information for
ADVANCING THE SCIENCE OF PLANT BIOLOGY © American Society of Plant Biologists