Embed Size (px)
Citation preview

International Research Journal of Engineering and Technology (IRJET) e-ISSN: 2395-0056
p-ISSN: 2395-0072 Volume: 08 Issue: 07 | July 2021 www.irjet.net
© 2021, IRJET | Impact Factor value: 7.529 | ISO 9001:2008 Certified Journal | Page 2618
INTEGRATED TRANSPORTATION AND LAND USE PLANNING FOR
DECREASING TRAFFIC CONGESTION IN KOCHI CITY
Anju Sebastian1, Sangeeth K2
1M.Plan Student (Urban Planning), Dept. of Architecture, TKM College of Engineering, Kollam, India
2Assistant Professor, Dept. of Architecture, TKM College of Engineering, Kollam, India
----------------------------------------------------------------------------------***----------------------------------------------------------------------------------Abstract – Transportation planning is a major component which decides the growth of the city. Integrating transportation and land use is much wanted in urban areas and it will be a best solution for decreasing traffic congestion in developing countries. Integrated Transportation and Land Use Package is composed of a land use allocation, employment allocation and a travel demand model. This integration method helps to decrease the traffic congestion in urban areas. This study aims to prepare a solution for the traffic congestion in Kochi city, Kerala by preparing a traffic management plan by integrating land use and transportation.
Key Words: Transportation, Land use, Traffic congestion, Planning, Urban areas
1. INTRODUCTION
Kochi city faces a high level of traffic congestion compared to other states of Kerala. Controlling traffic congestion in urban areas like Kochi is much wanted to attain a sustainable transport system in future. Kochi experiences world class planning for transportation infrastructure but still the city faces traffic related problems. Traffic congestion in the city shows that there is no interaction with transportation and land use. When land use and social infrastructure components are compared the allocation of job centres, institutions, commercial areas, industrial areas etc does not suit the transport facilities. So both the land use and transportation has to be interlinked for a congestion free mobility. When the needs are accessible at walkable distance then the number of vehicles can be decreased and gradually people will depend on public transport facilities also.
So for this small cities or places with high potential in Kochi City have to be identified and those cities have to be connected to the CBD area. Infrastructural facilities in those small/sub cities have to be improved. Relocation of major hubs is also a part of integration which helps to decrease traffic congestion.
2. AIM & OBJECTIVE
Aim is: To manage traffic congestion by improving accessibility by integrating land use and transportation.
Objectives are: To identify the area with high development
potential delineate the area using GIS. To identify the areas with high traffic volume and to
study the factors responsible for congestion in the study area.
To make a micro level analysis for the land use pattern and transport services and to analyse the traffic based on existing infrastructure.
To prepare a Traffic Management Plan by integrating transportation and land use.
3. STUDY AREA
Kochi City is known as the Commercial Capital of Kerala state, India. Kochi city is surrounded by the Arabian Sea and backwaters. It comprises of two distinct areas, they are the old Kochi City and the mainland, Ernakulam.
Table -1: Details of Kochi City
Average annual population growth rate is 1.28 percent (natpac, 2019). There is a drastic increase seen in the population. This is because of the employment opportunities, development and quality infrastructural services.
Fig -1: Growth pattern of Kochi city Source: A study on inland water transportation in Kochi City
Region, 2012

International Research Journal of Engineering and Technology (IRJET) e-ISSN: 2395-0056
p-ISSN: 2395-0072 Volume: 08 Issue: 07 | July 2021 www.irjet.net
© 2021, IRJET | Impact Factor value: 7.529 | ISO 9001:2008 Certified Journal | Page 2619
Based on the growth pattern, Kochi city faces a drastic growth in the city centre and spreading outwards. Kochi Corporation is considered as the major functional area based on the growth pattern.
Kochi urban area is the most economically active region in the State. This urban region significantly contributes to the economy of the State. City level activities, residential, commercial and industrial, overspill to the outskirts often causing unplanned urban sprawl. The increasing population and its resultant impacts on the land cause concerns related to land use, environment and economy (Department of Town and Country Planning, 2010).
Kochi is located on the southwest coast of India, between 9.48° and 10.50° latitude and 76.5° and 76.58° E longitude. The Kochi City has a flat topography.
Fig -2: Topography of the city Source: Author generated using GIS
4. AREA DELINEATION
The areas selected are two road stretches in Kochi Corporation. They are Mahathma Gandhi Road and Sahodaran Ayyappan Road.
Fig -3: Stretches taken for study
4.1 Importance of the study area
Mahatma Gandhi (MG) Road stretch is considered as the CBD area of Kochi City andSahodaran Ayyappan (SA) is the second main road of CBD area.
SA road starts from MG road and ends at Vyttila which connects the Bypass NH66 with the CBD area.
Metro line passes through MG Road- SA Road- Vyttila.
Vyttila is an area with high potential both in case of infrastructural development and ease of connectivity.
Vyttila Mobility Hub is an integrated transit terminal designed as a converging point of various forms of public transportation, such as local and long distance buses, metro rail and inland water transport.
MG Road and SA Road in Ernakulam are the main arterial roads of the city.
These roads are constructed in 1925 & 1962 respectively, which run parallel and perpendicular to the coast and having the Metro Rail connectivity.
Other major roads in Kochi city includes Chittoor Road (Sub-arterial road), Kaloor- Kadavanthara Road (Sub-arterial road), Park Avenue etc which all comes under the study area.
Fig -4: Major Junctions of the study area Source: Author generated using GIS

International Research Journal of Engineering and Technology (IRJET) e-ISSN: 2395-0056
p-ISSN: 2395-0072 Volume: 08 Issue: 07 | July 2021 www.irjet.net
© 2021, IRJET | Impact Factor value: 7.529 | ISO 9001:2008 Certified Journal | Page 2620
4.2 Characteristics and Nature of MG Road
MG Road has many premium brand stores, leading shops and boutiques.
Large numbers of shops are available for dress and fabrics in MG Road.
The Ernakulam South railway station is on Chittoor road.
There are many bookstores in Convent road. Ernakulam public library is situated in Convent road.
Hospital road in KPCC Junction is known for medical facilities and shops.
Kochi is famous for gold, diamond, silver and platinum jewelry. Most of them are concentrated at Jewel Junction (Woodland Junction), on MG Road.
Medical Trust Hospital in Pallimukku is one of the top hospitals in Kerala.
Govt higher secondary school for girls is also on the Chittoor road.
Cochin Shipyard and National Institute of Fisheries Post Harvest Technology and Training are between Pallimukku and Thevara Junction.
Fig -5: Road network of MG Road Source: Author generated using GIS
Table -2: Details of MG Road
Source: natpac, 2021
4.3 Characteristics and Nature of SA Road
SA Road is also known as Ettomannor- Ernakulam
road Panampilly Nagar has many premium exclusive
designer boutiques SBI is in manorama junction in SA Road
Urban primary health centre one of the top hospital in Elamkulam junction
Panampilly nagar Central park is in Panampilly Ave road and there are many shopping malls near to the park.
Fig -6: Road network of SA Road
Source: Author generated using GIS
Table -3: Details of SA Road
Source: natpac, 2021

International Research Journal of Engineering and Technology (IRJET) e-ISSN: 2395-0056
p-ISSN: 2395-0072 Volume: 08 Issue: 07 | July 2021 www.irjet.net
© 2021, IRJET | Impact Factor value: 7.529 | ISO 9001:2008 Certified Journal | Page 2621
5. STUDY AND ANALYSIS OF STUDY AREA Traffic volume, transportation facilities, land use pattern and transport and land use projection has to be analysed and a comparison has to be made for determining the problems.
5.1 Peak hour traffic volume observed at major intersections and road stretch in Kochi City
Thevara Junction, Madhava Pharmacy and Vyttila carry more than 7,000 PCU per hour. Kadavanthara and Pallimukku hands peak hour traffic volume between 6,000 and 7,000 PCU.
Table -5: Peak hour volume in road stretch
Table -4: Peak hour volume in junctions
Source: natpac, 2021
Fig -7: Traffic volume observed at the major intersections and road stretches
Source: Author generated using GIS
Source: natpac, 2021
The traffic volume ranges between 3,000 and 7,000 PCU on the major travel corridor of the city, namely MG road between Thevara and Madhava Pharmacy. The highest peak hour traffic volume was observed between Thevara and Ravipuram on MG road with more than 7,000 PCU this is because this road connects to the Willingdon Island and Fort Kochi. Between Pallimukku and Thykkoodam Junction on SA road, the peak hour traffic volume was found to be varying from 3,200 PCU on Vyttila-Petta section to 5,300 PCU on Kadavanthara - Vyttila section. Traffic volume ranges between 3,000 and 3,500 PCU on Kaloor - Kadavanthara road. On the Chittoor road the range is between 1,000 and 2,000 PCU.
5.2 Speed and delay characteristics
SA road from Pallimukku to Vyttila clocked 22 kmph in spite of poor road condition and signal delay. With the construction of flyover at Kundannoor, Vyttila and Palarivattam, the travel speed could reach an optimal speed of about 45 kmph. Kaloor - Kadavanthara road is another sub arterial road where traffic flew at a very low speed of 15kmph due to traffic congestion at Kumaranasan and Kathrikadavu Junction (natpac, 2021).

International Research Journal of Engineering and Technology (IRJET) e-ISSN: 2395-0056
p-ISSN: 2395-0072 Volume: 08 Issue: 07 | July 2021 www.irjet.net
© 2021, IRJET | Impact Factor value: 7.529 | ISO 9001:2008 Certified Journal | Page 2622
Table -6: Speed and delay in road stretch
Source: natpac, 2021
Fig -8: Speed and delay along the road stretches Source: Author generated using GIS
5.3 Major parking streets according to parking accumulation
Vyttila to Kadavanthara is having higher number of on street parkings this is because of the mobility hub and bus stand in the Vyttila Junction. Ravipuram to Thevara is also having higher number of on street parking this is becauseof the connectivity towards the Willington Island and Fort Kochi. Parking in Panampilly Nagar Ave can be due
to the park, shopping complex etc.
Fig -9: Major parking streets Source: Author generated using GIS
5.4 Accident Prone Areas
Vyttila stands second with 66 reported accidents after Palarivattam with 80 during the year 2018. Vyttila is a major bus station and developing as a mobility hub. SA Road connects Vyttila with the NH 66. Atlantis Junction is also an accident prone area.
Table -7: Accident prone areas in the study area
Source: natpac, 2021
5.5 Intense pedestrian movements
Peak hour pedestrian movements as per the study conducted by the natpac are as follows: Locations observed to be between 1,000 and 2,000 are (i) Kacherippady (1,900) (ii) Hospital Jn (1,865) - Study Area (iii) Jos (1,614) - Study Area (iv) Town Hall Jn (1,400) (v) Kadavanthara (1,300) - Study Area

International Research Journal of Engineering and Technology (IRJET) e-ISSN: 2395-0056
p-ISSN: 2395-0072 Volume: 08 Issue: 07 | July 2021 www.irjet.net
© 2021, IRJET | Impact Factor value: 7.529 | ISO 9001:2008 Certified Journal | Page 2623
(vi) KPCC Jn (1,091) - Study Area At other pedestrian locations, the peak cross movements were below 1,000 per hour.
Fig -10: Pedestrian flow Source: natpac, 2021
5.6 Level of pedestrian vehicle conflicts on major roads
Pedestrian vehicle is high in Pallimukku to Kadavanthara and in Vyttila Junction. Pallimukku to Vyttila Junction (SA Road) is having higher social infrastructural facilities so people will move towards these areas for buying needs.
Fig -11: Pedestrian vehicle conflicts Source: natpac, 2021
5.7 Public Transport Facilities
A large number of inter-city passengers travel to and from the city from South and North Railway stations in Kochi City. The average daily originating passenger traffic during the year 2018-19 was found to be 25,587 from Ernakulam south station. Eranakulam South station handles about 70% of traffic generated from the city. The South station is one of the busiest railway stations in South India, with more than 128 scheduled train services daily (natpac, 2021) .
Fig -12: Major Public Transport Stations
Source: Author generated using GIS
Most of the city bus services will get converged on MG road, Bannerji road and SA road thus making them the most congested travel corridors. MG road corridor between Thevara and KPCC Junction had bus passenger volume ranging between 5,000 and 10,000. Similar volume of bus passengers are seen between Pallimukku and Vyttila Junction. This shows the importance of the area.
5.8 Density of Bus Passengers
Fig -13: Bus passenger density along road stretches
Source: Author generated using GIS

International Research Journal of Engineering and Technology (IRJET) e-ISSN: 2395-0056
p-ISSN: 2395-0072 Volume: 08 Issue: 07 | July 2021 www.irjet.net
© 2021, IRJET | Impact Factor value: 7.529 | ISO 9001:2008 Certified Journal | Page 2624
Around 2,000 bus trips were handled at Vyttila mobility hub between 7.00 am and 8.00pm which is very high and 351 at KSRTC bus station. Major services are operated at Chittoor also with 13 trips. Some of the corridors along SA road carried less bus passengers because the buses get diverted along other parallel roads. Other major bus corridors are Bannerji road from High Court Junction to Madhava Pharmacy and Vyppin road, Shanmugam Road between Hospital Junction and High Court Junction. All these corridors carry bus passengers above 5,000 and also most of these corridors are served by Kochi metro.
5.9 Vyttila Mobility Hub
5.10 Metro Facility
Metro passes through MG Road - Elamkulam Junction - SA Road. Maharaja’s stands third with 5,635 passengers after Edappally station and Aluva station. MG Road station stands fourth with 4,133 passengers. Other stations handled less than 4,000 passengers per day.
The integrated transit terminal at Vyttila is under 2nd phase of construction. It acts as a hub for long distance bus services far away from the city centre and it also acts as a converging point for different modes of public transport such as local and long distance buses, inland water transport and metro rail. It is spread over an area of 37 acres adjacent to NH bypass. The mobility hub connects Edappally, Kundannoor, Palarivattam, Vyttila junction through Kochi Bypass and exit road links with Ettumanoor road connecting it with Thrippunithura, Petta, Ambalamugal etc.
Impact of Metro
Fig -15: Metro stations
Source: natpac, 2021
Being a multi modal mobility hub, it is connected to Kochi Metro and Kochi Water Metro also. Vyttila Mobility Hub is connected to Vyttila Metro Station of Kochi Metro Line 1(Aluva to Thykkoodam). It is a 160 metres walk to the metro station by Vyttila Mobility Hub Road. Ferry terminal is on the east side of the mobility hub. It is located by Kaniyampuzha river. It is a 76 metres walk to the ferry terminal by Vyttila Boat Jetty Walkway (natpac, 2021).
Fig -14: Proposed Vyttila Mobility Hub Source: kochimetro.org
Impact of Vyttila Mobility Hub
Vyttila Flyover helps to decrease the delay and increases the speed. Traffic congestion and accidents in Vyttila junction will get decreased. SA Road and NH66 will get developed due to the Vyttila Mobility Hub.
There is a traffic reduction seen in Bannerji road, MG road and SA road over which the Kochi Metro passes with 4.7%, 1.5% and 2.6% reduction respectively. Other roads like NH 66, Kaloor-Kadavunthara road and Chittoor road also had traffic reduction of 2.1%, 1.7% and 4.0 in the order. Even there is Kochi metro facility MG road and other north south corridors, Chittoor road and Shanmugham road remain still highly congested.
Table -8: Traffic volume with and without metro
Source: natpac, 2021

International Research Journal of Engineering and Technology (IRJET) e-ISSN: 2395-0056
p-ISSN: 2395-0072 Volume: 08 Issue: 07 | July 2021 www.irjet.net
© 2021, IRJET | Impact Factor value: 7.529 | ISO 9001:2008 Certified Journal | Page 2625
5.11 Water Transport
Kochi has a good network of inland waterway system. It consists of backwaters, canals, lagoons and estuaries. The city alone has about 1,100 km of waterways or canals and out of this, around 40 km of rivers and canals are navigable by motorized crafts. The waterway network is more or less of a grid iron pattern and only a few links are missing. The main routes for water transport in the city are Eranakulam- Fort Kochi, Eranakulam- Mulavukadu, Eranakulam- Varapuzha, Eranakulam- Mattancherry, Eranakulam- Vyppin, Vyttila- Kakkanad and High Court– Mulavukadu.
Proposed development scheme for Water Transport
The proposed water transport passes perpendicular through SA Road.
Fig -16: Water transport path
Source: natpac, 2021
Water Metro
The study area has proposed water metro route. It touches Thevara and Vtyyila of the study area.
Fig -17: Water Metro Path Source: natpac, 2021
The study area has proposed water metro route. It touches Thevara and Vtyyila of the study area.
Fig -18: Vyttila water metro station Source: watermetro
5.12 Land Use
Fig -19: Land use map, 2020 Source: rtp, 2020
Madhava Pharmacy and Vyttila junction is
concentrated with commercial activities. In MG Road, Commercial area is mainly concentrated
along the road network with 200m buffer. Remaining is the residential area.

International Research Journal of Engineering and Technology (IRJET) e-ISSN: 2395-0056
p-ISSN: 2395-0072 Volume: 08 Issue: 07 | July 2021 www.irjet.net
© 2021, IRJET | Impact Factor value: 7.529 | ISO 9001:2008 Certified Journal | Page 2626
• But in SA Road, commercial area is mainly seen till Kadavanthra and then residential area is seen till Vyttila.
• Educational institutions area mainly seen on Madhava Pharmacy Junction and also in SRV Road in Woodlands Junction which is the school area.
• Area near to the south railway station is considered as industrial area.
• Health Service area is seen in hospital road in KPCC Junction.
• Ravipuram - Atlantis - Thevara road is mainly a residential area and also most of the areas area central government property.
• State Government property is seen in Jos Junction and Thevara near the Vikranth - Venduruthy Bridge.
5.13 Land Use Changes
Fig -20: Land use map of 2020 and 2009 Source: rtp 2020 , rtp 2009
In 2020 the 100 - 200m buffer area is fully occupied as commercial area. Residential area is very low compared to 2009. SA Road is having higher residential area. The industrial area in Ravipuram - Thevara Road is same. Cochin Shipyard is in this area.
In 2009 the study area was filled with residential area. Commercial area was very low. In MG Road there were some commercial areas but in SA Road commercial area was very low.
5.14 Comparing Traffic Volume with Land Use
Fig -21: Land use and traffic volume analysis
Source: Author generated using GIS
Ravipuram to Thevara road is having higher traffic volume with more than 6001. This area is central government property. Cochin shipyard is located in this area. This area carries heavy traffic because people travel for job and also this route connects to the Willington Island and Fort Kochi.
Pallimukku Junction to Ravipuram and Kadavanthra to Vyttila Junction has traffic volume ranging between 5001 - 6000. Kadavathra to Vyttila Junction is residential area and also this area connects to NH66 and Kaloor - Kadavanthra road connects to the Banerji Road. Pallimukku to Ravipuram Junction also comes under central government property. National Institute of Fisheries Post Harvest Technology and Training is situated here. This area is also an employment hub. Pallimukku to JOS Junction, KPCC to Madhava Pharmacy and Manorama to Kadavanthra ranges from 4001 to 5000. In Pallimukku to JOS Junction and KPCC to Madhava Pharmacy the stores are congested on the road side. Metro passengers from Madhava Pharmacy to Maharaja’s college are more which helps to decrease the road traffic. But Manorama to Kadavanthra Junction is fully occupied with houses.
JOS to KPCC Junction and Pallimukku to Manorama Junction range 3001 to 4000. JOS to KPCC Junction has maily educational institutions, Hospitals, Religious place and some portion is state government property. Pallimukku to Manorama Junction is a residential area.
Chittoor Road connects North Kochi to Valanjambalam in SA

International Research Journal of Engineering and Technology (IRJET) e-ISSN: 2395-0056
p-ISSN: 2395-0072 Volume: 08 Issue: 07 | July 2021 www.irjet.net
© 2021, IRJET | Impact Factor value: 7.529 | ISO 9001:2008 Certified Journal | Page 2627
Road having a low traffic volume of 1001 to 2000.
Valanjambalam to Ravipuram Junction is having a very low traffic volume of below 1000.
5.15 Traffic Projection
Growth in traffic volume between 2005 and 2019
Table -9: Growth in traffic volume
Source: natpac, 2021
In MG Road Madhava Pharmacy Pallimukku Thevara experience an increase in traffic volume. Out of these Thevera experience drastic growth in traffic which shows that people traveling to and from Willington or Fort Kochi is increasing.
In case of SA Road only Kadavanthara experience growth in traffic volume this is because shops are concentrated in Kadavanthara and also it is near to NH66.
Projected Traffic Volume for 2030 and 2040
Table -10: Projected traffic volume
Source: natpac, 2021
Peak Hour Traffic Volume and Volume to Capacity Ratio in MG Road shows drastic increase. This shows that the demand for CBD area will increase in the coming years but still there is no improvement in the road nature. SA Road also shows increase in the traffic but NH66 road area is under high speed development which will increases the demand for SA road connecting Bypass and CBD area.
Projected Traffic Growth Rates for 2030 and 2040
Table -11: Projected traffic growth rate
Source: natpac, 2021
Traffic growth rate shows decline by 2040. Traffic growth will increase in 2030 and there will be traffic congestion.
International Research Journal of Engineering and Technology (IRJET) e-ISSN: 2395-0056
p-ISSN: 2395-0072 Volume: 08 Issue: 07 | July 2021 www.irjet.net
© 2021, IRJET | Impact Factor value: 7.529 | ISO 9001:2008 Certified Journal | Page 2628
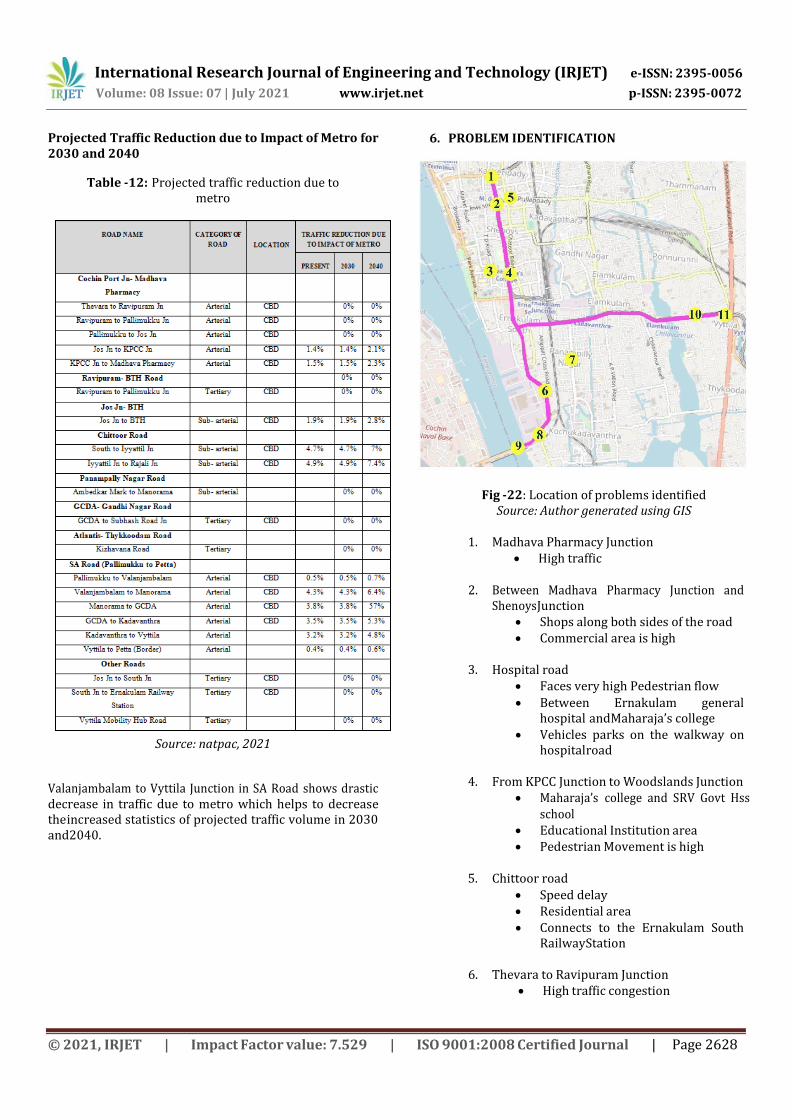
Projected Traffic Reduction due to Impact of Metro for 2030 and 2040
Table -12: Projected traffic reduction due to metro
Source: natpac, 2021
Valanjambalam to Vyttila Junction in SA Road shows drastic decrease in traffic due to metro which helps to decrease the increased statistics of projected traffic volume in 2030 and 2040.
6. PROBLEM IDENTIFICATION
Fig -22: Location of problems identified
Source: Author generated using GIS
1. Madhava Pharmacy Junction High traffic
2. Between Madhava Pharmacy Junction and Shenoys Junction
Shops along both sides of the road Commercial area is high
3. Hospital road Faces very high Pedestrian flow
Between Ernakulam general hospital and Maharaja’s college
Vehicles parks on the walkway on hospital road
4. From KPCC Junction to Woodslands Junction Maharaja’s college and SRV Govt Hss
school Educational Institution area Pedestrian Movement is high
5. Chittoor road
Speed delay Residential area Connects to the Ernakulam South
Railway Station
6. Thevara to Ravipuram Junction High traffic congestion

International Research Journal of Engineering and Technology (IRJET) e-ISSN: 2395-0056
p-ISSN: 2395-0072 Volume: 08 Issue: 07 | July 2021 www.irjet.net
© 2021, IRJET | Impact Factor value: 7.529 | ISO 9001:2008 Certified Journal | Page 2629
Employment centre, Educational
institutions on west and residential area on east side
Speed delay due to bus stop Bus passenger is high
Onstreet parking is high due to employment centre
7. Panampilly Nagar Ave Onstreet parking is high
Panampilly Nagar Central Park and the markets and shops nearby is the reason for parking
Residential- commercial area
8. Thevara Junction High traffic Speed delay due to bus stop delay
9. Vikranth- Venduruthy Bridge Bus passenger density is high
10. Kadavanthara Junction to Vyttila Junction Faces high traffic congestion because
vehicle entering from Vyttila is very high and then diverted to panampally Nagar Ave from Manorama Junction.
Onstreet Parking is high Mainly residential area
11. Vyttila Junction High traffic Accident prone area
7. GUIDELINES AND STANDARDS
Guidelines and standards are to be considered while planning. The required standards recommended by IRC are as following:
7.1 Road Design
Width of carriageway standards
The width of the carriageway recommended by IRC: Table -13: Standard width of various
roads
Source: Code of Practice (Part -1), 2012
Typical Cross Section
The cross section has a 3.5m width carriageway each and 2.5 m width median. The space for cycling and pedestrian movement is also given.
Fig -23: Typical 4 lane urban divided cross section Design Components of Road
Source: googleimage
The components to be considered for designing road are light weight and heavy weight vehicles, cycling and walkability.
Fig -24: Design components of road
Source: Code of Practice (Part -1), 2012
Land Use - Transportation Plan
The design shows the elements to be considered for land use and transport plan.

International Research Journal of Engineering and Technology (IRJET) e-ISSN: 2395-0056
p-ISSN: 2395-0072 Volume: 08 Issue: 07 | July 2021 www.irjet.net
© 2021, IRJET | Impact Factor value: 7.529 | ISO 9001:2008 Certified Journal | Page 2630
Fig -25: Land use and transport design Source: Code of Practice (Part -1), 2012
Design Speed
Design speed for different road classification is as follows:
Table -14: Standard design speed for various roads
Source: IRC 2012
Intersection - Turning Radius
Arterial, Sub arterial and Collector streets shall not exceed 9m. For Local Streets, shall not exceed 4m.
Median
Median provides a safe and easy journey. It helps to decrease the accidents. Median width can be 1.2 m but preferably 2m.
Fig -26: Design of median Source: IRC 2012
7.2 Pedestrian Facilities Design Standards
1. The minimum 1.8m (width) x 2.2m (Height) walking zone should be clear of all obstructions - both horizontally and vertically.
2. No utility ducts, utility poles, electric, water or telecom boxes, trees, signage or any kind of obstruction should be placed within the ‘Walking Zone’.
Fig -27: Design of Pedestrian path Source: IRC 2012
Table -15: Standard width for pedestrian path for
different land use
Source: Code of Practice (Part -1), 2012

International Research Journal of Engineering and Technology (IRJET) e-ISSN: 2395-0056
p-ISSN: 2395-0072 Volume: 08 Issue: 07 | July 2021 www.irjet.net
© 2021, IRJET | Impact Factor value: 7.529 | ISO 9001:2008 Certified Journal | Page 2631
Table -16: Standards for pedestrian path
A. WALKABLE AREA WITHIN THE TRANSIT AREA
The permissible walking distance in transit area is 400m &
the sufficient area for pedestrian to be aware of other
pedestrian in transit area is required to be 1.9 – 3.3 sq
m/person.
The maximum flow of pedestrian for public transit occurs
when transit stops are within a 10 minute walking distance
from source.
B. PEDESTRIAN FACILITIES IN TRANSIT AREAS – WALKWAYS
Pedestrian walkways should be planned with minimum
width of 2 m with accessible grace changes.
Pedestrian should not have to walk more than 200 m to
ramp or elevators to change floor level to access transit.
C. FOOTPATH
1.8 – 2 m footpath for light pedestrian traffic.
5 m footpaths for heavy pedestrian traffic.
To allow walking at near normal speeds, the foot path must
provide continuity without any obstacles.
D. CROSSWALKS
The crosswalks should be provided at every 30 m on the
pedestrian streets.
At the zebra crossing, width of zebra crossing should be
within the range of 2 – 4 m.
The minimum island size should be 15 sq m.
The radii at the corner of the streets varies from 0.7 m to 1.7
m and with curbside parking it can vary from 1.7 to 3.5 m.
In case of raised median, being used as pedestrian refuge,
such portion could be suitable depressed with curb height
not exceeding 150 mm.
E. RAMPS
Ramps must have maximum slope of 1:20. A level walking
space should be provided at the top of the ramp.
The ramps and landings are required where the slope
exceeds 5 per cent.
For ramps maximum permissible slope is 8.33% with
minimum width of 1 m.
The hand rails should be installed along the side of the ramp,
more than 0.15 m or the length should be greater than 2 m.
The diameter of the hand rail should be not more than 35
mm for proper gripping.
F. OTHER PEDESTRIAN FACILITIES IN TRANSIT AREAS
Signage can add several pedestrian qualities to the streets.
Use of special paving to break up an expense or to link
pedestrian path with the transit stop restricting pedestrian
and vehicular conflicts.
Street trees should be placed less than 30 m apart.
Pedestrian Guard Rail
1. Preferably, the guard rails should be set back from edge of the carriageway by at least 150 mm.
2. To be clearly detectable, guardrails should be 1100mm high from the median level and painted to contrast clearly with the surroundings preferably in canary yellow colour.
Fig -28: Design of Pedestrian guard rail Source: IRC, 2012

International Research Journal of Engineering and Technology (IRJET) e-ISSN: 2395-0056
p-ISSN: 2395-0072 Volume: 08 Issue: 07 | July 2021 www.irjet.net
© 2021, IRJET | Impact Factor value: 7.529 | ISO 9001:2008 Certified Journal | Page 2632
7.3 Cycle Path
The minimum width to be provided for cycle path is as follows:
Table -17: Standard width for cycle path
Source: Code of Practice (Part -1), 2012
Fig -30: Design of Zebra cross at intersection
Source: IRC, 2012
Cycle Crossing
Minimum 2.5 m wide cycle crossing must be provided at all road crossings.
Traffic Signal
Fig -29: Design of Cycle path at intersection Source: Code of Practice (Part -1), 2012
7.4 Bus Stop
1. Bus stop should not be placed at the Junction or Intersection point.
2. In Kerala, Bus stops are placed 50 -70 m away from the intersection point.
3. The distance between the bus stops should not exceed more than 1Km.
7.5 Zebra Crossing
1. Mid-Block crossings must be provided for people to cross the street safely between building entries or bus stop locations or active land uses on opposite sides of the street.
2. Crossings must be provided at all T- Junctions.
3. The width of zebra crossing lies within a range of 2-4m.
For a 7.5m crossing, the red phase should keep traffic stopped for minimum 12 seconds to allow disabled pedestrian to complete their crossings.
Refuge Island
1. It is mandatory on all roads with four lanes or more.
2. Recommended width is 2 m.
7.6 Parking
1. No parking on arterial roads where available carriageway width is less than 7.25m (individually in 4 lanes).
2. No parking on sub-arterial roads where available carriageway width is less than 7.5 m.
3. No parking on collector streets where available carriageway width is less than 5.5 m.
4. Parking on one side on local streets where available carriageway is not less than 5.5 m and both sides where carriageway is more than 10.5 m.
7.7 Skywalk
1. Shall be provided within a distance of 200 m from a school or hospital or factory/ industrial area.
2. Minimum width should be 1800 mm.
3. A hand rail set 760 mm- 900 mm above the walking surface should be provided.

International Research Journal of Engineering and Technology (IRJET) e-ISSN: 2395-0056
p-ISSN: 2395-0072 Volume: 08 Issue: 07 | July 2021 www.irjet.net
© 2021, IRJET | Impact Factor value: 7.529 | ISO 9001:2008 Certified Journal | Page 2633
8. PROPOSALS
Fig- 31: Proposed Plan
9. CONCLUSION
Integration was done by analysing the study area in a micro level. In the case of Kochi, the reason for traffic congestion at each junction is due to different factors. The problem identification comparing land use and transportation helps to provide a traffic management plan for decreasing traffic congestion. In Kochi, the possible change that can be made is to modify the existing land use and infrastructure. A traffic management plan has been given as the proposal and
the proposals are based on the guidelines and standards. Proposals such as mixed land use, public transport facility, walkability, cycling, parking facility etc has been provided as a solution based on the land use and transport interaction. When the travel demand and travel length decreases then the traffic congestion also decreases.

International Research Journal of Engineering and Technology (IRJET) e-ISSN: 2395-0056
p-ISSN: 2395-0072 Volume: 08 Issue: 07 | July 2021 www.irjet.net
© 2021, IRJET | Impact Factor value: 7.529 | ISO 9001:2008 Certified Journal | Page 2634
REFERENCES
[1] Singapore Development Agency, S. G. (n.d.). Urban Redevelopment Authority. Retrieved from www.ura.gov.sg: https://www.ura.gov.sg/Corporate/Planning/Maste r-Plan/Regional- Highlights/Central-Area
[2] Balakrishnan, S. (2019, November 29). Integrated
Transportation and Land Use Planning Common Practices and Impacts on Transportation. Retrieved December 2020, from Slideshare: https://www.slideshare.net/SrijithBalakrishnan2/i ntegrated-transportation-and-land-use-planning- common-practices-and-impacts-on-transportation- 69659132
[3] The Transport & Mobility Scenario in Kochi: Past & current Trends.. Challenges.. (n.d.). Retrieved Feb 25, 2021, from codatu.org: http://www.codatu.org/wp- content/uploads/Transportmobility-scenario-in-
Kochi-by-KMRL1.pdf
[4] natpac. (2021). Traffic and Transportation Studies for Six Major Cities/ Towns Under Amrut Scheme in Kerala State.
[5] Development, M. o. (2013). Development of Toolkit under sustainable Urban Transport Project. Smartnet-NIUA.
[6] IT Bombay. (2006). Retrieved from Module 4 - Civil
IITB - IIT Bombay: https://www.civil.iitb.ac.in/
[7] Sun, C., Zhang, Y., & Ma, S. (2019). Optimization and
Application of Integrated Land Use and Transportation Model in Small- and Medium-Sized Cities in China. MDPI, Sustainability, 1.
[8] Soon, L. T. (2020). Integrated Land-Use & Transport Planning. Singapore: LTA Academy Singapore.
[9] Fricker, J. D., & Jin, L. (2008). Development of an
integrated land-use transportation model for Indiana. FHWA/IN/JTRP-2008/15, 1-14.
[10] I.P.Gautam. (2014). integrated land use and transport
planning: ahmedabad city. gandhinagar, Gujarat: Escap.
[11] Padsala, R., Lapsiwala, M., Dhimole, P., & Khan, N. (n.d.). Strategies and Land Use Restructuring for
Transit Oriented Development in Ahmedabad, using Geographical Information System (GIS). Ahmedabad, Gujarat: CEPT University.
[12] Padsala, R., Lapsiwala, M., Dhimole, P., & Khan, N.
(n.d.). Strategies and Land Use Restructuring for Transit Oriented Development in Ahmedabad, using Geographical Information System (GIS). Ahmedabad, Gujarat: CEPT University.
[13] Bhakuni, N. (2016). Integrated Mobility Plan for Greater Ahmedabad Region. 9th Urban Mobility India Conference & Expo 2016 (pp. 1-27). Gujarat: CEPT University.
[14] Chaudhari, P., & Bhagat, S. (2016). Integrated Land
Use-Transport Model Approach in Town Planning for urban Areas. International Journal for scientific Research & Development, Vol. 4, Issue 02, 1718- 1719.
[15] Coppola, P., & Papa, E. (2012). Accessibility Planning
tools for sustainable and integrated Land Use/Transport (LUT) development: an application to Rome. ScienceDirect, 133-146.
[16] Building A Stronger South Australia, The
IntegratedTransport And Land Use Plan/2013
[17] www.urbanmobilityindia.in
[18] Integrated urban land use transport planning.
Retrieved from www.icrier.org
[19] Integrated transport & land use planning- Australia
[20] Urban Development Authority, Land Use Planning:
The Singapore Experience
[21] Babu, A. C. (2013, Dec 28). A study on urban
growth trends in kochi. Retrieved Feb 2021, from Slideshare: https://www.slideshare.net/aruntheacb/a-study- on-urban-growth-trends-in-kochi
[22] JACOB, J., & T, R. M. (n.d.). Strategies For Transit
Ridership Enhancement – A Case Of Kochi Metro. Retrieved March 2021, from WPS presentation - Urban Mobility India: http://www.urbanmobilityindia.in/Upload/Conference/b287cf49-f28d-42e8-a4e3-c9e922e2f58d.pdf