Embed Size (px)
Citation preview

Paper ID #14989
Integrating a 3-D Printer and a Truss Optimization Project in Statics
Dr. Nicholas Andres Brake, Lamar University
Nicholas Brake is currently an Assistant Professor in the civil and environmental department at LamarUniversity. He received his B.S. (2005), M.S. (2008), and Ph.D. (2012) from Michigan State University.His area of expertise is in cementitious composites which includes: fracture and fatigue mechanics ofquasi-brittle materials, recycled concrete, conductive concrete, reinforced concrete, pervious concrete,geopolymer, and structural dynamics. He currently teaches a wide array of courses that includes statics,reinforced concrete design, structural analysis, and materials engineering. Dr. Brake actively integratesproject based and peer assisted learning pedagogies into his curriculum.
Dr. Fatih Alperen Adam
c©American Society for Engineering Education, 2016

Integrating a 3D printer and a truss optimization project in Statics
Abstract
There is a need to integrate hands-on engineering analysis and design problems and exciting
build technology in lower division engineering courses to stimulate interest and increase
students’ capacity to solve divergent, open-ended based problems. In this evidence-based
practice paper, we discuss the development, execution, and impact of a truss optimization project
given to students in Statics. The students were required to optimize two different polyactic acid
(PLA) 3D printed trusses using compression and tensile mechanical strength properties. The
students were required to provide the optimal tension and compression member cross-section to
be 3D printed, provide a three-dimensional drawing using a user-friendly open source CAD
software, and provide a summary of the results in a poster presentation. The optimal truss design
was then printed, assembled, and tested in the classroom and the results were compared to the
engineering design solutions. Students perception of their ability to interpret and analyze data,
organize presentations, solve engineering problems, tinker, engineer, and design was assessed
using a 21 item online survey. The survey items were taken from both validated instruments and
the ABET Criteria 3 course outcomes: a, b, and e. Survey data was collected from the test
population (students given the project) and compared to a control population (students not given
the project) to assess the impact of the project on engineering self-efficacy. The results indicate
there is a statistically significant gain in student engineering skills self-efficacy, student
perception of their ability to analyze and interpret data, ability to solve engineering problems,
and organize a presentation.
Introduction
According to the Accreditation Board of Engineering and Technology (ABET), engineering
graduates must have the ability to apply math and science to engineering problems, conduct
experiments, design a system, function in multi-disciplinary teams, and communicate effectively,
among other skills1. The challenges of student retention are significant and a difficult problem to
solve because of the analytical and technical skills required to succeed in engineering. Students’
decision to leave engineering often depends on self-efficacy and self-confidence2; preparedness,
race, and gender3; and social pressures4,5, among other factors.
Educators have attempted to address the declining numbers of engineering students by changing
the educational paradigm and utilizing project-based and active learning pedagogies to better
engage and prepare them for the rigor of the upper division courses. Project Based Learning
(PBL) is a pedagogy where students learn by completing a series of investigative problems that
require them to develop practical and knowledge-based design solutions, practice effective team

management, and require oral or written communication6,7. PBL has been shown to be effective
in increasing retention and positively changing students’ perception of the complex engineering
design process6 and shown to increase student confidence8.
Statics is a sophomore level engineering mechanics course often taken after completing Calculus
I and Physics I. The course covers topics on two- and three-dimensional rigid body equilibrium,
truss and beam analysis, and moment of inertia, among other topics. It is often recognized as a
gatekeeper course, and certainly is at Lamar University (where the failure rate typically ranges
from 30%-40%). In general, the objective of the course is to improve student ability to solve
engineering problems. At larger universities, the course enrollment in Statics is typically high; in
some cases, surpassing 300 students which places limitations on an instructors’ ability to assign
hands-on projects that require space to tinker with physical objects. Several researchers have
however, reported successful integration of project based assignments, which includes but is not
limited to: analysis, design, and construction of a machine9, truss bridge9,10,11,12,13,14, and a
friction climbing machine9.
Although most students by their sophomore year have taken a computer course requiring them to
use a spreadsheet or other basic programming software, they have not been asked to apply their
current engineering skills and knowledge to solve tangible and realistic engineering design
problems. Integrating project-based engineering design exercises into the curriculum at the lower
levels can reinvigorate student effort and help connect classroom theoretical concepts to real-
world design problems. These design exercises, if implemented properly, can also serve as a
source of student-faculty engagement leading to increases in engineering self-efficacy and self-
confidence.
This evidence-based practice paper describes the implementation, cost, and impact of a low-cost
project-based assignment integrated into a sophomore level Statics course that includes the use
of a 3D printer, Microsoft Excel®, Powerpoint®, and Google SketchUP. The students were
required to analyze, design, and optimize a truss using experimentally obtained mechanical
strength data of tested polyactic acid (PLA) plastic members in both compression and tension.
The students were then asked to construct a poster summarizing their findings, which includes:
final dimensions, member forces, sample calculations, and a three-dimensional drawing of the
final designed truss.

Implementation
The truss optimization assignment was incorporated into the classroom in the Spring 2015
semester, to a class of 57 students. The course topics and associated number of lectures are
summarized in Table 1. Each lecture was 55 minutes.
Table 1. Course Topics
Topic
2D and 3D
vector
resultants;
particle
equilibrium
2D and 3D
moment of a
force; distributed
load; rigid body
equilibrium
Truss analysis:
method of joints
and sections
Beam
analysis Friction
Area
centroids;
moment
of inertia
No. of
Lectures 9 12 5 5 2 5
The students were given two mid-term exams and one comprehensive final exam. The instructor
used Powerpoint® slides to present the lectures via a projector and completed approximately two
hand-worked examples on the blackboard per lecture. The homework assigned to the students
was managed online through MasteringEngineering®, where the students were able to access
their homework problems, submit solutions, and view video tutorials. A total of 12 online
homework assignments were given to the students throughout the semester.
Project Summary
The project was assigned to the students on week 14 (one week after completing mid-term exam
2 and the truss analysis lectures). The instructor allowed the students to work in groups of 4-5 to
complete the assignment. The project was weighted as two homework assignments.
The students were required to minimize the mass of two different trusses (with given geometries)
by selecting the appropriate thickness of each member. The trusses were constrained by
mechanical strength and required to resist a 190 N vertical force placed on the bottom mid-span
joint. The students were provided experimental mechanical strength data and regression
equations that were collected and derived, respectively, by the instructor and teaching assistant.
The regression equations used the geometric dimensions of the truss members as inputs: truss
member thickness in tension; and truss member thickness, truss member length, moment of
inertia, and elastic modulus in compression. The Euler buckling equation was discussed in brief.
The students were required to use the regression equations to calculate the strength of the
members using Excel and submit their optimized solutions on week 16. On the day of the
submission, the instructor demonstrated the 3D printing process by drawing a sample truss
member in an open source CAD software, saving the file with a .stl extension, generating the g-
code with the open-source software Slic3r®, and printing a sample truss member. The instructor

then tested two fully assembled optimized trusses to determine if the strength capacity met the
load demands. The following week, the students were required to submit a poster presentation
which included: sample calculations, a CAD drawing of their final designed truss, the member
forces, and a photograph of the truss loading test setup using a template provided to them in
Powerpoint®. The project statement is provided in the Appendix.
Description of the Printer, Accessories, and other Testing Equipment
The 3D printer used in the demonstration and to construct the truss components was
manufactured by printrbot® which has a 150x150x150 mm build volume and processes 1.75 mm
polyactic acid (PLA) filament. The cost of the printer was $659. The cost of the filament was
$23 for a 1 kg spool and it was mounted on a $12 rack. The software used to generate the. stl file
and g-code was open source: Slic3r®. The total cost of the material and supplies was under
$700.
To collect experimental strength data, the instructor used a hydraulic actuator and unconfined
compression testing apparatus with data acquisition capabilities. For the tension tests, the truss
members were connected to custom-built welded pin connectors. In compression, the members
were pin connected using heavy duty paper clips.
Methods
Survey Instrument
The 3D printer truss project contained multiple tasks that required students to engage in
computer and data processing, truss analysis, optimization, CAD drawing, and the creation of a
poster presentation. A 21 item online survey instrument was given to the students and used to
assess engineering skills self-efficacy, tinkering self-efficacy, engineering design self-efficacy,
and the criteria 3 ABET outcomes a, b, and e. The survey is shown in Table 2. The survey was
given to the students during week 17 of the semester. The survey was comprised of statements
from the questionnaire published by Mamaril15 (items 1-13) that is a modification of previously
published survey instruments16,17,18. The survey uses a six point Likert scale ranging from 1 to 6
with one point increments, and has a good internal group reliability (Cronbach alpha ranges from
0.93 to 0.86; all grouping categories). The remaining items (items 14-21) were taken from the the
Lamar University civil and environmental engineering department criteria 3 ABET assessment
instrument which uses a four point Likert scale ranging from 1 to 4 with one point increments.
Note, quantitative performance data via a midterm or final examination was not included here

since it would only be reflective of one component of the project (truss analysis) and not of the
others (computer and oral presentation skills, CAD, data analysis, and engineering design).
Table 2. Online survey instrument
Statement ID Statement Scale
Skills SE 1 I can perform experiments independently. 1-6
Skills SE 2 I can analyze data resulting from experiments. 1-6
Skills SE 3 I can communicate results of experiments in written form. 1-6
Skills SE 4 I can solve problems using a computer. 1-6
Skills SE 5 I can work with machines. 1-6
Tinkering SE 1 I can build machines. 1-6
Tinkering SE 2 I can manipulate components and devices. 1-6
Tinkering SE 3 I can assemble things. 1-6
Tinkering SE 4 I can disassemble things. 1-6
Design SE 1 I can identify a design need. 1-6
Design SE 2 I can develop design solutions. 1-6
Design SE 3 I can evaluate a design. 1-6
Design SE 4 I can recognize changes needed for a design solution to work. 1-6
ABET Outcome a1 Perform mathematical calculations to solve problems. 1-4
ABET Outcome a2 Apply scientific principles in engineering. 1-4
ABET Outcome a3 Apply engineering knowledge in design and analysis. 1-4
ABET Outcome e1 Perform design process correctly. 1-4
ABET Outcome e2 Identify the type of engineering problems. 1-4
ABET Outcome e3 Solve engineering problems. 1-4
ABET Outcome b1 Organize data for presentation. 1-4
ABET Outcome b2 Interpret data and perform analysis based on data. 1-4
Hypotheses
The objective of this study is to assess the impact of the 3D printed truss optimization project on
student engineering self-efficacy. The hypothesis is the following:
The mean ranks in engineering self-efficacy, which includes student perception to solve
engineering problems, interpret and analyze data, and ability to organize presentations, will
not be significantly different between the students given and not given the project.
Student survey response population and demographics
Tables 3 and 4 show the demographics of the student survey response population. The test
population is defined here as the group of students given the project in the Spring 2015 semester.
The control population includes the group of students not given the assignment, which includes
students from the Summer 2015 and Fall 2015 semesters. A total of 43 and 68 students in the test
and control populations, respectively, fully completed the online survey. Surveys that were not

fully completed were discarded from the analysis. As shown in Tables 3 and 4, the demographics
were very similar between the test and control student group.
The control and test group were given identical homework assignments (administered through
MasteringEngineering®), Powerpoint® lecture notes and in-class sample problems, and given
similar examinations. The Summer 2015 and Fall 2015 control groups were tested for
homogeneity and the results indicate that each of the individual survey item sample populations
do not have a significantly different mean rank (Mann-Whitney U test, p≤0.05), and variance
(non-parametric modified Levene’s, test p≤0.05). The control populations from the Summer and
Fall 2015 semesters were pooled.
Table 3. Demographics: Gender/Race
Course Gender Race
Male Female Asian/Pacific
Islander
African
American Hispanic White
Test,
N= 43 78.3% 21.7% 10.3% 8.6% 15.5% 52.6%
Control,
N=68 78.6% 21.4% 12.8% 8.8% 11.2% 60.8%
Table 4. Demographics: Engineering Major, Academic Standing, Qualitative SAT, GPA
Course Engineering Major Standing Q
SAT GPA
Civil Chem. Elec. Indust. Mech. Sophomore Junior
Test,
N=43 12.2% 37.4% 5.2% 13.0% 32.2% 63.5% 34.8% 551 2.98
Control,
N=68 11.0% 33.3% 3.2% 8.9% 43.6% 68.6% 29.3% 556 2.95
Data analysis
The survey responses were pooled based on engineering dimension, which included: engineering
skills self-efficacy (Skills SE 1-5), engineering tinkering skills self-efficacy (Tinkering SE 1-4),
engineering design self-efficacy (Eng. Design SE 1-4), and Criteria 3 ABET1 outcomes a (ABET
Outcome a1-3), b (ABET Outcome b1-2), and e (ABET Outcome e1-3). Where ABET outcome
a is “an ability to apply knowledge of mathematics, science, and engineering”, ABET outcome b
is “an ability to design and conduct experiments, as well as to analyze and interpret data”, and
ABET outcome e is “an ability to identify, formulate, and solve engineering problems.” The
ABET items were statements obtained from the Lamar University civil and environmental
engineering department. Note, ABET items were preceded by the statement: “Rate your

confidence in performing the following tasks”. This statement is not included in Table 1 for
brevity.
The hypothesis was tested using the non-parametric rank-sums Mann-Whitney U test. Note,
while a significant change cannot be directly attributed to the project itself, the survey provides a
reasonable estimate of how students perceive their skills within a given error.
Results and Discussion
The pooled item means are provided in Table 5 and the individual item means are provided in
Table 6. Items that are significant at both 95% and 85% confidence are demarcated.
The results indicate the test population given the design project has significantly higher
engineering skills self-efficacy, significantly higher perception of their ability to
analyze/interpret data, organize presentations, and solve engineering problems. Students’
tinkering and design self-efficacy, and ability to apply mathematics, science, and engineering
was not significantly higher in the test population. Although not statistically significant, among
the questions in ABET outcome a, question 3: “ability to apply engineering knowledge in design
an analysis”, had a relatively large mean difference at +0.13. The most significant mean rank
differences of the individual items, was item Skill SE 3: “I can communicate results
of experiments in written form”, and ABET outcome b1: “Organize data for presentation”. This
result seems reasonable since the students were required to construct a poster of the design
solutions, which included organizing the three-dimensional CAD drawing, sample calculations,
final design dimensions, and photographs of the in-class tested printed truss.
The evidence collected in this study suggests the 3D printed truss analysis and design project can
yield significant gains to perceived ability in engineering analytical and communication skills.
After the semester was over, the students had positive comments and showed considerable
enthusiasm regarding both the course and project.
Table 5. Results of grouped survey responses
Group ID Test,
N= 43
Control,
N=68
Mean
Difference
Skill SE 4.77 4.57 0.20**
Tinkering SE 4.40 4.40 0.00
Design SE 4.28 4.27 0.01
ABET Outcome a 3.29 3.21 0.08
ABET Outcome e 3.12 3.00 0.12*
ABET Outcome b 3.41 3.21 0.20** ** Statistically significant difference in mean rank between test and control population: p≤0.05 * Statistically significant difference in mean rank between test and control population: p≤0.15
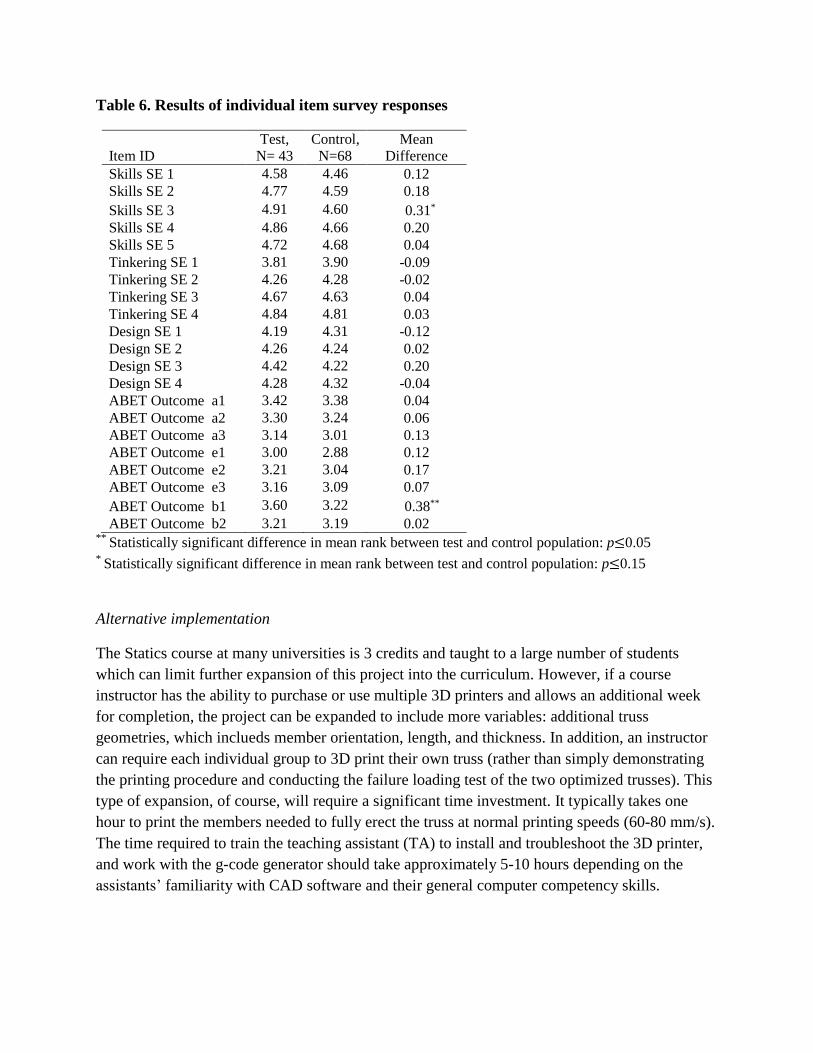
Table 6. Results of individual item survey responses
Item ID
Test,
N= 43
Control,
N=68
Mean
Difference
Skills SE 1 4.58 4.46 0.12
Skills SE 2 4.77 4.59 0.18
Skills SE 3 4.91 4.60 0.31*
Skills SE 4 4.86 4.66 0.20
Skills SE 5 4.72 4.68 0.04
Tinkering SE 1 3.81 3.90 -0.09
Tinkering SE 2 4.26 4.28 -0.02
Tinkering SE 3 4.67 4.63 0.04
Tinkering SE 4 4.84 4.81 0.03
Design SE 1 4.19 4.31 -0.12
Design SE 2 4.26 4.24 0.02
Design SE 3 4.42 4.22 0.20
Design SE 4 4.28 4.32 -0.04
ABET Outcome a1 3.42 3.38 0.04
ABET Outcome a2 3.30 3.24 0.06
ABET Outcome a3 3.14 3.01 0.13
ABET Outcome e1 3.00 2.88 0.12
ABET Outcome e2 3.21 3.04 0.17
ABET Outcome e3 3.16 3.09 0.07
ABET Outcome b1 3.60 3.22 0.38**
ABET Outcome b2 3.21 3.19 0.02 ** Statistically significant difference in mean rank between test and control population: p≤0.05 * Statistically significant difference in mean rank between test and control population: p≤0.15
Alternative implementation
The Statics course at many universities is 3 credits and taught to a large number of students
which can limit further expansion of this project into the curriculum. However, if a course
instructor has the ability to purchase or use multiple 3D printers and allows an additional week
for completion, the project can be expanded to include more variables: additional truss
geometries, which inclueds member orientation, length, and thickness. In addition, an instructor
can require each individual group to 3D print their own truss (rather than simply demonstrating
the printing procedure and conducting the failure loading test of the two optimized trusses). This
type of expansion, of course, will require a significant time investment. It typically takes one
hour to print the members needed to fully erect the truss at normal printing speeds (60-80 mm/s).
The time required to train the teaching assistant (TA) to install and troubleshoot the 3D printer,
and work with the g-code generator should take approximately 5-10 hours depending on the
assistants’ familiarity with CAD software and their general computer competency skills.

Alternative 3D printers
There a several modestly priced 3D printers on the market that can be purchased for this type of
project, which are summarized in Table 6. When choosing a 3D printer, it is also important to
consider available technical support to assist in troubleshooting, replacing broken or missing
parts, or other general inquiries.
Table 6. Low cost 3D printers, and support options
Manufacturer Max. Printing
Volume (mm) Plastic
Min.
Layer
Thickness
(mm)
Technical Support Cost
Pintrbot® 150 x 150 x 150 PLA 0.1 Tutorials, Forum,
Email $659
Dremel® 225 x 150 x 138 PLA 0.1 Tutorials, Forum,
Email, Phone $999
FlashForge® 225 x 145 x 150 PLA, ABS 0.1 Tutorials, Forum,
Email $1,199
XYZprinting® 200 x 200 x 200 PLA, ABS 0.1 Tutorials, Forum,
Email, Phone $499
HICTOP® 270 x 200 x 170 PLA, ABS 0.1 Email, Skype $363
Makerbot® 285 x 153 x 155 PLA 0.1 Tutorials, Forum,
Email, Phone $1,803
LulzBot® 152 x 152 x 152 PLA, ABS, HIPS,
Nylon 0.05
Tutorials, Forum,
Email, Phone $1,250
Ultimaker® 230 x 225 x 205 PLA, ABS, CPE 0.02 Tutorials, Forum,
Email $1,999
Conclusion
This evidence-based practice paper summarizes the details of effectively implementing a project-
based assignment that integrates engineering analysis, design, 3D printing, testing, and a poster
presentation into a Statics course. The students’ overall response to the project and the course
were positive. Student perception of their ability to solve engineering problems, ability to
interpret and analyze data, and organize presentations was shown to be positively affected by the
3D printer project. Expanded implementation of this project can be done if multiple 3D printers
are available to the instructor. It is suggested however, in three credit Statics courses, this project
be implemented in the form described in this paper unless additional time is given to the students
to become familiar with the CAD tools and 3D printers.

Bibliography
1. ABET, “Criteria for accrediting engineering programs.”, http://www.abet.org/wp-
content/uploads/2015/05/E001-15-16-EAC-Criteria-03-10-15.pdf
2. Hutchison-Green, M.A., Follman, D.K. and Bodner, G.M., 2008. Providing a voice: Qualitative investigation of
the impact of a first-year engineering experience on students' efficacy beliefs. Journal of Engineering
Education,97(2), p.177.
3. Mendez, G., Buskirk, T.D., Lohr, S. and Haag, S., 2008. Factors associated with persistence in science and
engineering majors: An exploratory study using classification trees and random forests. Journal of Engineering
Education, 97(1), pp.57-70.
4. Grandy, J., 1998. Persistence in science of high-ability minority students: Results of a longitudinal
study. Journal of Higher Education, pp.589-620.
5. Felder, R.M., Felder, G.N. and Dietz, E.J., 1998. A longitudinal study of engineering student performance and
retention. V. Comparisons with traditionally-taught students. Journal of Engineering Education, 87(4), p.469.
6. Savage, R.N., Chen, K.C. and Vanasupa, L., 2007. Integrating project-based learning throughout the
undergraduate engineering curriculum. Journal of STEM Education: Innovations and Research, 8(3/4), p.15.
7. Blumenfeld, P.C., Soloway, E., Marx, R.W., Krajcik, J.S., Guzdial, M. and Palincsar, A., 1991. Motivating
project-based learning: Sustaining the doing, supporting the learning. Educational psychologist, 26(3-4),
pp.369-398.
8. Shekar, A., 2012. RESEARCH-BASED ENQUIRY IN PRODUCT DEVELOPMENT EDUCATION:
LESSONS FROM SUPERVISING UNDERGRADUATE FINAL YEAR PROJECTS. International Journal of
Industrial Engineering, 19(1).
9. Atadero, R.A., Balgopal, M.M., Rambo-Hernandez, K.E., Casper, A.A., 2014. Project-Based Learning in
Statics: Curriculum, Student Outcomes, and Ongoing Questions. American Society for Engineering Education
Annual Conference and Exposition. Indianapolis, IN., June 15-18
10. Marlor, R.A., 2011. A design project for a mechanics and statics course. In American Society for Engineering
Education, American Society for Engineering Education, Vancouver, B.C., Canada, June 26-29
11. Chang, G., Peterson, W., 2009. Bridge design project: a hands-on approach to statics and strength of materials
learning, In American Society for Engineering Education, American Society for Engineering Education. Austin,
TX, June 14-17
12. Whiteacre, M. and Otey, J.M., 2011. Truss Projects as Aids in Visualizing Internal Forces: Student Perceptions
versus Achievement. In American Society for Engineering Education. American Society for Engineering
Education. Vancouver, B.C., Canada, June 26-29
13. Selvi, E., Soto-Caban, S., Taylor, R.S. and Wilson, W.R., 2011. Similar Consecutive Bridge Design Projects for
Freshmen and Sophomore Level Engineering Courses. In American Society for Engineering Education.
American Society for Engineering Education. Vancouver, B.C., Canada, June 26-29
14. Abramowitz, H., 2008. Basswood Bridges. In American Society for Engineering Education. American Society
for Engineering Education. Pittsburgh, Pennsylvania., June 22-25
15. Mamaril, N.J., 2014, Measuring undergraduate students’ engineering self-efficacy: a scale validation study,
Ph.D. Dissertation. University of Kentucky. Lexington, Kentucky.

16. Bong, M., 2001. Role of self-efficacy and task-value in predicting college students' course performance and
future enrollment intentions. Contemporary educational psychology, 26(4), pp.553-570.
17. Schubert Jr, T.F., Jacobitz, F.G. and Kim, E.M., 2012. Student perceptions and learning of the engineering
design process: an assessment at the freshmen level. Research in Engineering Design, 23(3), pp.177-190.
18. Baker, D., Krause, S., & Purzer, S. 2008 Developing an instrument to measure tinkering and technical self-
efficacy in engineering. In American Society for Engineering Education. American Society for Engineering
Education. Pittsburgh, Pennsylvania., June 22-25,
Appendix: Project statement and sample student poster
Project Statement
You are a structural engineer working for a Toy corporation and asked to design a polyactic acid
(PLA) plastic truss with a span of 150 mm, a height 50 mm, and a width of 50 mm. The truss
must be designed to withstand a vertical concentrated force of 95 N at both mid-span joints using
the least material possible. Your design strategy will be to conduct a series of mechanical tests
on the PLA material in both pure tension and compression, collect data, and design the truss
using your knowledge of statics and known material critical failure forces. Your objective is to
design the thickness, T, of each truss member needed to satisfy the objective.
(a)
(b)
Figure 1. Photograph of assembled Pratt Truss connected with gusset plates and nuts and
bolts and loaded at mid-span: a) side view, b) top view
Objective: i) Determine the member thickness, T, of each truss member needed to withstand a
190 N concentrated force at the mid-span of the truss, ii) minimize the weight of the truss using
the least amount of material possible.
Experimental Program: After deliberation with the Research and Development group, a standard
truss member design was constructed as shown in Figure 2. The length, L, is measured center to

center from the holes located at the ends of the member. The diameter of each hole is 3.4 mm.
The end member width, W, is 7 mm and the interior cross-section is square and has a thickness T.
Figure 2. Standard truss member geometry
A test factorial was constructed to determine the effects of member length, L, and member
thickness, T, on the critical material failure force in both compression and tension. A total of 24
specimens were tested: twelve in tension and twelve in compression. The length was varied from
25 mm to 100 mm and thickness was varied from 1 to 3 mm. The members were loaded until
failure. In tension, failure was defined when the specimen fully ruptured, and in compression
failure was defined when the specimen buckled and was unable to adequately transfer load.
A photograph of the test setup is provided in Figure 3 for both the compression and tension tests.
The tension specimens were pin connected at the holes at both ends of the member using a lab
fabricated pin support as shown in Figure 3a. The compression members were also pin connected
at both ends as shown in Figure 3b.
(a) (b)
Figure 3. a) Tension test setup, b) compression test setup
Experimental Results: Upon completion of the test, the data was tabulated in EXCEL and used to
derive a set of continuous regression functions to predict member mass, critical tensile force, and
critical compressive force.
Tensile Tests: A photograph of the failed tension members is provided in Figure 4a in addition to
a CAD drawing showing the ruptured cross-section (Figure 4b). The specimens failed at the pin
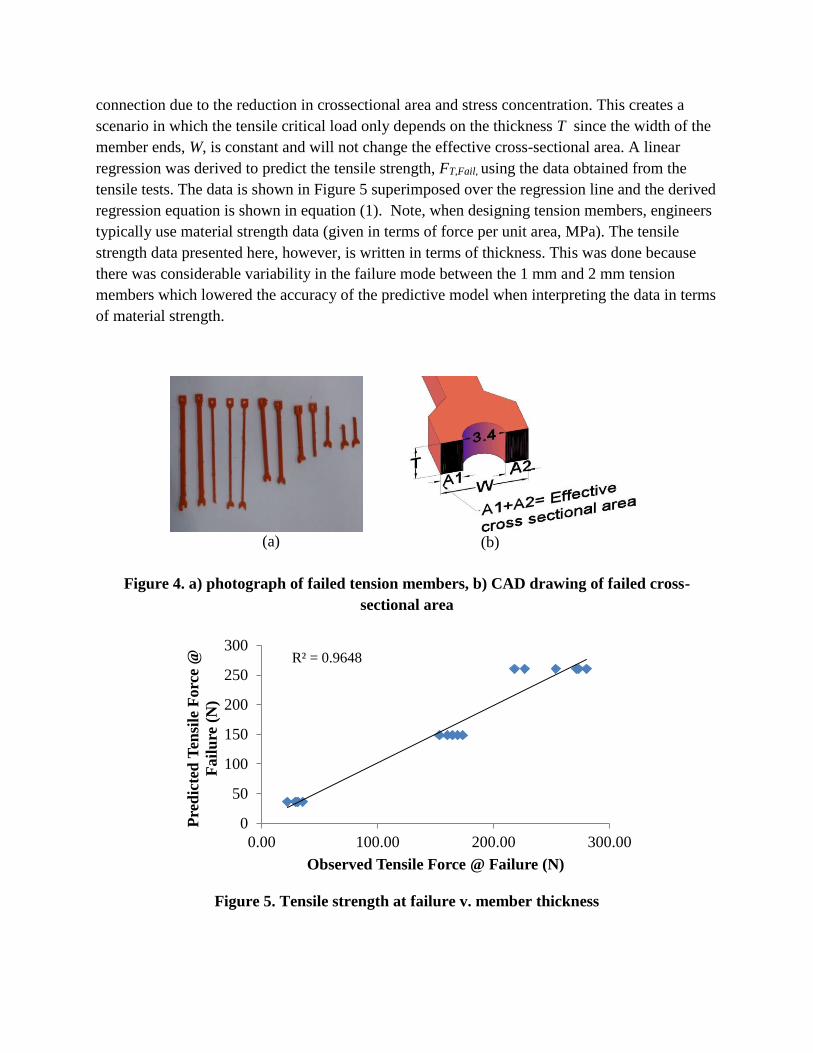
connection due to the reduction in crossectional area and stress concentration. This creates a
scenario in which the tensile critical load only depends on the thickness T since the width of the
member ends, W, is constant and will not change the effective cross-sectional area. A linear
regression was derived to predict the tensile strength, FT,Fail, using the data obtained from the
tensile tests. The data is shown in Figure 5 superimposed over the regression line and the derived
regression equation is shown in equation (1). Note, when designing tension members, engineers
typically use material strength data (given in terms of force per unit area, MPa). The tensile
strength data presented here, however, is written in terms of thickness. This was done because
there was considerable variability in the failure mode between the 1 mm and 2 mm tension
members which lowered the accuracy of the predictive model when interpreting the data in terms
of material strength.
(a)
(b)
Figure 4. a) photograph of failed tension members, b) CAD drawing of failed cross-
sectional area
Figure 5. Tensile strength at failure v. member thickness
R² = 0.9648
0
50
100
150
200
250
300
0.00 100.00 200.00 300.00
Pre
dic
ted
Ten
sile
Forc
e @
Fail
ure
(N
)
Observed Tensile Force @ Failure (N)

𝐹𝑇,𝐹𝑎𝑖𝑙 (𝑁) = 111.9 ∗ 𝑇(𝑚𝑚) − 75.4 (1)
Compression Tests: The strength of the compression members varied as a function of length, L,
and thickness, T. The compressive strength can be predicted using the elastic Euler buckling
equation using an effective length factor, K, of 1.0 and an elastic modulus, E, of 3500 N/mm2, the
moment of inertia, I, and the member length, L. The experimental results are provided in Figure
6 which shows the predictive and observed compressive strength and the regression line. The
compression strength can be predicted by equation (3), which uses Euler’s elastic buckling
formula as an input. Note, the regression equations act as calibration tool to match theory to
observed results.
Figure 6. Predicted v. observed compressive strength
𝐹𝐶,𝐹𝑎𝑖𝑙 (𝑁) = 1.14 ∗𝜋2𝐸𝐼
(𝐾𝐿)2 − 3.88 (2)
Where
K = 1.0, E = 3500 N/mm2 , and 𝐼 =
𝑇4
12 (mm), L = member length (mm)
Member Mass: The mass of each member, Mmem, was also recorded. The effective volume of the
member, LT2, was used to predict the mass using a regression equation. Figure 7 shows the data
and superimposed regression line. The member mass predictive formula is shown in equation
(3).
R² = 0.99
0
10
20
30
40
50
60
70
80
0 20 40 60 80
Pre
dic
ted
Com
pre
ssiv
e
Forc
e @
Fail
ure
(N
)
Observed Compressive Force @ Failure (N)

Figure 7. Member mass v. effective volume
𝑀𝑚𝑒𝑚(𝑔) = 0.00132 ∗ 𝐿𝑇2(𝑚𝑚) + 0.1315 (3)
Truss Geometry: The geometry of each of the proposed trusses is shown in Figure 8 and 9. Truss
# 1 is a Pratt truss and Truss # 2 is a Camelback truss. Each group will be assigned one truss to
design.
Figure 8: Geometry of Truss # 1: Pratt
R² = 0.9839
0.00
0.20
0.40
0.60
0.80
1.00
1.20
1.40
0 0.2 0.4 0.6 0.8 1 1.2 1.4
Pre
dic
ted
Mem
ber
Ma
ss (
g)
Observed Member Mass (g)

Figure 9: Geometry of Truss # 2: Camelback
Each member will be connected with a gusset plate and bolted. The gusset plates are shown at
each joint. The effective length of each truss member are shown in the drawings. Please note
these lengths are NOT equal to the actual member length. The actual member length, in terms of
the effective length is provided in equation (4). The effective length is defined as the distance
between each joint. For example, the effective length of AB in Truss # 2 is 53.03 mm. The actual
length of the member is 53.03 - 2L*. The L* for Truss # 1 is 10 mm and for Truss # 2 is 12 mm.
𝐿 = 𝐸𝑓𝑓𝑒𝑐𝑡𝑖𝑣𝑒 𝐿𝑒𝑛𝑔𝑡ℎ − 2𝐿∗ (4)
Structural Analysis: Each group is to conduct a structural analysis of their assigned truss to
determine the internal forces in each member as a result of the 95 N applied force at midspan
(half of the 190 N load). To determine the internal forces caused by the applied load, you are to
use the effective length of each member given in Figures 8 and 9. To determine member
strength, the actual member length, L, must be used.
Deliverables: Each group is to create an excel spreadsheet (submitted electronically) that shows
the internal forces acting in each of the members as a result of the 95 N concentrated force at
mid-span in addition to the member mass and strengths.
1. Each group must minimize the truss mass while ensuring the internal forces do not
exceed the member strengths.
a. Conditions:
i. All compression members must have the same thickness, T.
ii. All tension members must have the same thickness, T.
iii. The thickness of the compression members do not have to equal the
thickness of the tension members.
2. Each group is to draw a 3D drawing of the design truss using Google SketchUp.
3. Attend the 3D printing demonstration.

4. Attend the truss test day.
5. Each group must submit an electronic copy of a 36 in. x 24 in. (Horizontal x Vertical)
poster presentation that summarizes their findings. This should include the following:
a. Introduction, Experimental results, 2D and 3D Truss drawing (SketchUp),
Photograph of truss, Sample calculations, and the Conclusion/Final design
recommendations
Group Assignments: Groups 1-7 will design Truss # 1 and Groups 8-14 will design Truss # 2.
3D Printing: Upon completion of the design, the dimensions will be submitted to the TA for 3D
printing. One print of each truss will be completed and tested under the 95 N load on the truss
test day.
Figure 10: Photograph of 3D printing with printrbot©
Downloads: Here is a link to Google SketchUp tutorials:
http://www.sketchup.com/learn/videos/58. You can download the SketchUp here:
http://www.sketchup.com/download SketchUp Make is free to download and SketchUp Pro is
free for 30 days.
Truss Testing:
After the students submitted the proposed design, the instructor assembled and tested the
optimized truss as shown in the photographs in Figure 11.

(a)
(b)
Figure 11: Photographs during the truss loading tests: (a) Pratt, (b) Camelback
Sample student poster
Figure 12: Sample student poster