Embed Size (px)
Citation preview
Integrating ecological genomics and eco-evo-devoreveals multiple adaptive peaks in ant populations of
the Arizona Sky Islands
Marie-Julie Fave1,2
and Ehab Abouheif1∗
11205 Dr. Penfield avenue, McGill University, Biology department, Montreal, Canada2Present address: 3175 Chemin de la Cote-Sainte-Catherine, Sainte-Justine research center,
Universite de Montreal, Montreal, Canada
and 661 University Avenue, Suite 510, Ontario Institute for Cancer Research, Toronto, Canada∗To whom correspondence should be addressed; E-mail: [email protected]
Uncovering the genetic basis of adaptation is a great challenge facing evolu-
tionary biologists. We ask where is the locus of adaptation from the per-
spective of ecological genomics (ecogen) and evolutionary developmental bi-
ology (evodevo). Ecogen focuses on identifying loci under selection between
populations in different environments by scanning genome-wide patterns of
genetic divergence, while evodevo focuses on candidate developmental regu-
latory genes and networks underlying phenotypic differences between species
and higher taxa. We attempt to reconcile these different perspectives by study-
ing the response of ant populations to past climate change on the Arizona Sky
Islands - high elevation mountain ranges that represent a replicated natural
experiment. We previously used an evodevo approach to show that adaptation
to climatic changes in the Arizona Sky Islands in the ant species Monomorium
1
peer-reviewed) is the author/funder. All rights reserved. No reuse allowed without permission. The copyright holder for this preprint (which was not. http://dx.doi.org/10.1101/045419doi: bioRxiv preprint first posted online Mar. 27, 2016;
emersoni occurred through repeated changes within the gene network under-
lying the development of alternative dispersal phenotypes: winged and wing-
less queens. Here, using an ecogen approach we uncovered several loci under
positive selection that associate with habitat temperature. These temperature-
associated loci show a repeated increase in frequency following climatic changes
on each of the Sky Islands. Surprisingly, gene flow between locations within
a Sky Island is restricted by temperature adaptation along the ecological gra-
dient and not by dispersal phenotype. This finding suggests that determina-
tion of winged and wingless queens may be developmentally plastic, and this
plasticity may facilitate jumps between adaptive peaks on a fitness landscape.
Integration of evodevo and ecogen reveals multiple adaptive peaks and pre-
dictability at multiple biological levels within a single species.
Introduction
Evolutionary adaptation is key for species persistence in the face of environmental changes
and discovering its genetic basis has become a central focal point of modern evolutionary bi-
ology (1–5). Different approaches have been taken by its practitioners to identify the genes
underlying the evolution and persistence of adaptive phenotypes across different environments
(6–13). In recent years, two parallel yet opposing approaches have emerged from different sub
fields: ecological genomics (14–16) and eco-evo-devo (6, 17, 18). Both of these subfields aim
at discovering genes that underlie phenotypic adaptation to understand the interplay between
an organism’s genes, its phenotypes, and the ecological selective forces at play. Ecological
genomics takes a bottom-up approach, where regions of the genome affected by ecological
selection pressures are first identified by finding genomic regions showing patterns consistent
with divergent natural selection across environments acting on the genome (14, 16). These re-
2
peer-reviewed) is the author/funder. All rights reserved. No reuse allowed without permission. The copyright holder for this preprint (which was not. http://dx.doi.org/10.1101/045419doi: bioRxiv preprint first posted online Mar. 27, 2016;

gions can subsequently inform about ecologically important factors the population is adapting
to. On the other hand, eco-evo-devo takes a top-down approach by first focusing on adaptive
phenotypes expressed differently across environments, and then investigating candidate genes
and gene networks that are likely to be involved in the generation of the adaptive phenotypic
traits (6, 19, 20).
Both ecological genomics and eco-evo-devo have their own inherent strengths, weaknesses
and biases, and the identification of the locus of adaptation by either of these approaches may
lead to different outcomes. An ecological genomics approach allows for the discovery of nat-
ural selection signals in the genome without a priori expectations of the trait showing diver-
gence between environments (16, 21, 22). For example, genomic regions have been identified
for color polymorphism in mouse coat color (23, 24), for reduction in armor plates number in
sticklebacks (13) and for wing color patterns in Helioconius butterflies (9, 25). By comparing
populations of the same species living in divergent ecological conditions, genomic islands of
divergence can be identified using markers distributed along the genome, such as restriction-site
based methods (RFLPs, AFLPs, rad-seq), microsatellites, or single nucleotide polymorphisms
(SNPs). The frequencies of the markers present in these islands of divergence can then be as-
sociated with ecological gradients from where the species have been sampled (26–28). If the
precise location in the genome of the markers are known, candidate genes potentially involved
in the adaptation can be identified and their function experimentally tested in the lab (29–31).
The ecological genomic approach is very powerful to identify the genomic basis for traits (1)
that have experienced a relatively hard selective sweep (22, 32); (2) for which the effect of
recombination is smaller than that of selection (22, 33); and (3) that have a genomic architec-
ture that allows for the identification of the genes under selection - for example, those with a
strong genetic influence, and a reduced environmental contribution. Ecological genomics has
been largely successful to identify the genetic basis of adaptive traits with a strong genetic ba-
3
peer-reviewed) is the author/funder. All rights reserved. No reuse allowed without permission. The copyright holder for this preprint (which was not. http://dx.doi.org/10.1101/045419doi: bioRxiv preprint first posted online Mar. 27, 2016;
sis, and for which a limited number of genes contribute to the trait variation. However, this
approach faces similar challenges to genome-wide association studies (GWAS), where the ge-
netic basis of traits with a large contribution of the environment (plastic traits), traits showing
gene-by-environment interactions, and traits for which a large number of genes of small effect
contribute to the phenotypic variation is difficult without investigating extremely large cohorts
of individuals (34–36).
On the other hand, eco-evo-devo primarily aims at investigating phenotypes known to be
adaptive because of their striking divergence between environments (17, 37, 38). For exam-
ple, evolution of genes involved in adaptive changes between closely related species have been
identified for leg length in semi-aquatic bugs (7, 39), eye-spots in butterflies (6, 20) and flower
color (8). Leveraging the large knowledge from related model organisms, one can identify
candidate genes which are known to be involved in the development of the trait from ho-
mology of gene sequences and functions. Furthermore, candidate genes can also be identi-
fied through comparative transcriptomics, together with established functions of those genes
in model species (40–42). It is then possible to reveal in a favorite organism gene expression
levels, spatial expression patterns, and eventually perform functional tests to determine whether
and how these candidate genes have been modified in their expression and function to give rise
to novel adaptive phenotypes. This approach is highly powerful to uncover genetic mechanisms
underlying phenotypic adaptation and focuses immediately on genes that are likely to be in-
volved in the development of the trait. Moreover, it gives the possibility to study not only the
genetic basis of the trait, but also its dynamic changes during development, revealing changes
that may not be readily observable at the adult stage (42, 43). Eco-evo-devo has the power to
study traits for which the environment plays an overwhelming role in the phenotypic variation,
such as horns in horned beetles (18) or castes in hymenopteran insects (43–45). However, eco-
evo-devo often limits itself to the study of (1) large morphological consequences often resulting
4
peer-reviewed) is the author/funder. All rights reserved. No reuse allowed without permission. The copyright holder for this preprint (which was not. http://dx.doi.org/10.1101/045419doi: bioRxiv preprint first posted online Mar. 27, 2016;
from the action of a few genes of large effect, (2) traits and species that can be experimentally
manipulated, and (3) relies on the assumption of the conservation of function between homol-
ogous gene sequences between related species, which may or may not be true depending on
the trait and organism (46). Eco-evo-devo may therefore be less powerful to detect adaptive
physiological traits and traits controlled by many genes of small effect.
Both approaches have been successful in revealing the genetic basis of adaptation in the
wild (47, 48), but unfortunately very few systems have been studied using both approaches si-
multaneously. Therefore, more studies integrating both approaches are needed and only by
combining both, we may reveal a more complete picture of the locus of adaptation. Here we
ask where is the locus of adaptation from the perspective of ecological genomics and evolu-
tionary developmental biology using a system of replicated populations of the ant Monomorium
emersoni inhabiting five Arizona Sky Islands (49).
The Arizona Sky Islands
The Arizona Sky Islands (Fig.1A and B) are high elevation mountain ranges isolated from each
other by large areas of desert (50, 51). Each Sky Island is a replicate of an environmental
gradient encompassing semi-desertic habitat in the low elevations, temperate forest at the mid-
elevation, and coniferous forests at the highest elevations. These heterogeneous environments
provide tremendous opportunities for diversification and speciation to occur in a wide variety of
organisms. Its key location between the Neotropical and Neartic biomes resulted in biodiversity
not exceeded anywhere else in terrestrial North America, which is reflected in the presence of
numerous endemic species (51). Several ecological factors vary rapidly along these replicated
elevational and ecological gradients, in particular, temperature, precipitation, solar radiation,
habitat productivity, and habitat fragmentation. Environmental changes that would normally be
observed along thousands of kilometers of latitudinal gradients are observed along only a few
5
peer-reviewed) is the author/funder. All rights reserved. No reuse allowed without permission. The copyright holder for this preprint (which was not. http://dx.doi.org/10.1101/045419doi: bioRxiv preprint first posted online Mar. 27, 2016;
hundred meters of elevation change. This imposes unique adaptive challenges for organisms
whose distributional ranges encompass more than one elevation zone. Indeed, dispersal of an
organism over only a few kilometers may impose completely different ecological conditions
and thus challenge reproduction and survival.
Parallel loss of wings in queens of M. emersoni
Two M. emersoni queen phenotypes co-exist: winged and wingless (Fig.1C and D). While the
diversification of the queen caste across ants has been recognized for a long time (52, 53), its
functional and evolutionary importance has only been recently embraced (54–56). Alternative
phenotypes in ant queens differ not only in their dispersal abilities and morphologies, but also
in their resource allocation during colony founding. During this key life history stage, winged
queens hydrolyze their flight muscles for energy, whereas wingless queens rely on workers that
disperse along with them from the mother colony to provide help and resources. This life history
change has evolved multiple times independently in all major ant sub-families and is therefore
considered to be an adaptive trait (54–56).
M. emersoni colonized each Sky Island independently from an ancestral continuous popu-
lation, but nowadays, populations are isolated on each Sky Island without gene flow occurring
between them (49). Inference of demographic changes in M. emersoni populations indicated the
existence of a continuous population around 100,000 years ago, which separated into a Northern
and a Southern groups around 80,000. Eventually each Sky Island population got isolated from
one another following the warm up after the last glacial maximum (49) (Summarized in Fig. 2).
In M. emersoni, the wingless phenotype evolved in parallel, and occurs at higher frequencies at
high elevations and in fragmented habitats on each of the Arizona Sky Islands, suggesting that
wingless queens repeatedly and independently adapted to these elevation gradients on each of
the Sky Islands (49).
6
peer-reviewed) is the author/funder. All rights reserved. No reuse allowed without permission. The copyright holder for this preprint (which was not. http://dx.doi.org/10.1101/045419doi: bioRxiv preprint first posted online Mar. 27, 2016;
Wing development in insects has become a model system to study gene interaction net-
works, and the deep knowledge of the wing patterning network in Drosophila melanogaster
and other holometabolous insects has helped in identifying candidate genes involved in wing
development in ants (43–45, 57). The evolution of the wing patterning gene network between
the 5 replicated populations of M. emersoni on Sky Islands (Fig. 1A) has been studied previ-
ously (49). Each population has independently evolved the loss of wings from a once unique
ancestral population followed by the evolution of high frequencies of winged queens. Wings
originate in queen larvae as imaginal discs, small synchronized groups of cells that will become
wings during metamorphosis. Although lacking wings as adults, wingless queens still produce
rudimentary or vestigial discs as larvae (49). In wingless queens, wing vestigial imaginal discs
express a certain number of genes of the wing patterning gene network, while the expression
of other genes is completely absent (49). The genes for which expression is completely lost in
wingless queen larvae show a similar loss of expression across the five populations. Such genes,
showing similar expression patterns across populations, suggest predictability in the evolution
of gene networks across different replicates. On the other hand, other genes are also expressed,
but their pattern of expression is different between the Northern and Southern populations (49).
Interestingly, these groups of populations also reflect the demographic history patterns of the
populations, suggesting that the expression differences between populations were established
after their separation. For example, the expression of mef2, a key gene for wing muscle de-
velopment, differs between wingless-queen larvae from Northern and Southern Sky Islands
populations (Fig. 2), and shows a signature of the ancient demographic split between these two
groups (49). Another gene exd for which wingless-queen larvae from each Sky Island exhibit
population-specific expression patterns (49), not related to ancient demographic history. This
suggests that these differences arose following the complete isolation of the five Sky Island pop-
ulations around 10,000 years BP and are therefore an indirect consequence of climatic warming
7
peer-reviewed) is the author/funder. All rights reserved. No reuse allowed without permission. The copyright holder for this preprint (which was not. http://dx.doi.org/10.1101/045419doi: bioRxiv preprint first posted online Mar. 27, 2016;
since the last ice age.
In addition to elevation and habitat fragmentation, M. emersoni populations have responded
directly to climatic changes by evolving a temperature tolerance in warmer habitats (49). Heat
shock and chill-coma recovery of M. emersoni individuals coming from different habitats showed
that M. emersoni colonies coming from warm sites (usually lower elevations habitats) can resist
a heat shock much longer than colonies originating from cooler habitats. The reverse is also true
- colonies from cooler sites recover much quicker from a cooling episode than colonies coming
from warmer sites. Temperature tolerance in M. emersoni is therefore variable between sites
with different temperature regimes, and this observation suggests that M. emersoni temperature
adaptation in the Sky Islands may be a response to the Holocene climatic warm up. Given the
former cooler climate across the region, the tolerance to heat shock likely evolved repeatedly
on each Sky Island as an adaptation to the warming climate at lower elevations after the last
glaciation.
Therefore, using an eco-evo-devo approach, we established that the evolution of wingless
queens in the Arizona Sky Islands represents an evolutionary novelty that arose following a
climatic and environmental change: the gain of a developmental switch to generate the wingless
queen phenotype, the complete loss of wings and wing muscles, multiple alterations in the
expression of the core developmental network underlying wing development, and the gain of
a new life history strategy. The repeated wing loss along each ecological gradient provides
support for a predictable and deterministic outcomes of evolution when organisms encountered
similar selection pressures, however, this predictability is accompanied with slight differences in
gene expression patterns between populations that reflect historical demographic events. This
eco-evo-devo approach revealed key genetic and phenotypic events that happened during the
adaptation of M. emersoni in terms of its dispersal abilities when colonizing steep environmental
gradients. However, dispersal abilities may not be the only adaptation that allowed M. emersoni
8
peer-reviewed) is the author/funder. All rights reserved. No reuse allowed without permission. The copyright holder for this preprint (which was not. http://dx.doi.org/10.1101/045419doi: bioRxiv preprint first posted online Mar. 27, 2016;
cope with the changing conditions.
Here, in an effort to combine eco-evo-devo with ecological genomics, we use a bottom-
up approach to uncover whether and how natural selection has shaped M. emersoni genome.
Ecological selective forces during colonization of novel habitats are numerous, and may pro-
duce complex patterns of adaptations on both the genotype and the phenotype. By using a
combination of eco-evo-devo and ecological genomics approaches, we reveal that M. emersoni
populations show genomic signatures consistent with temperature adaptation, that this recur-
rent adaptation is shaping gene flow patterns within Sky Islands. Our data raise the possibility
that the evolution and maintenance of the dispersal phenotype of M. emersoni queens and its
associated gene network may have been facilitated by phenotypic plasticity.
Material and MethodsLarge scale sampling
We collected M. emersoni colonies from 14 sites distributed along the elevation gradients of
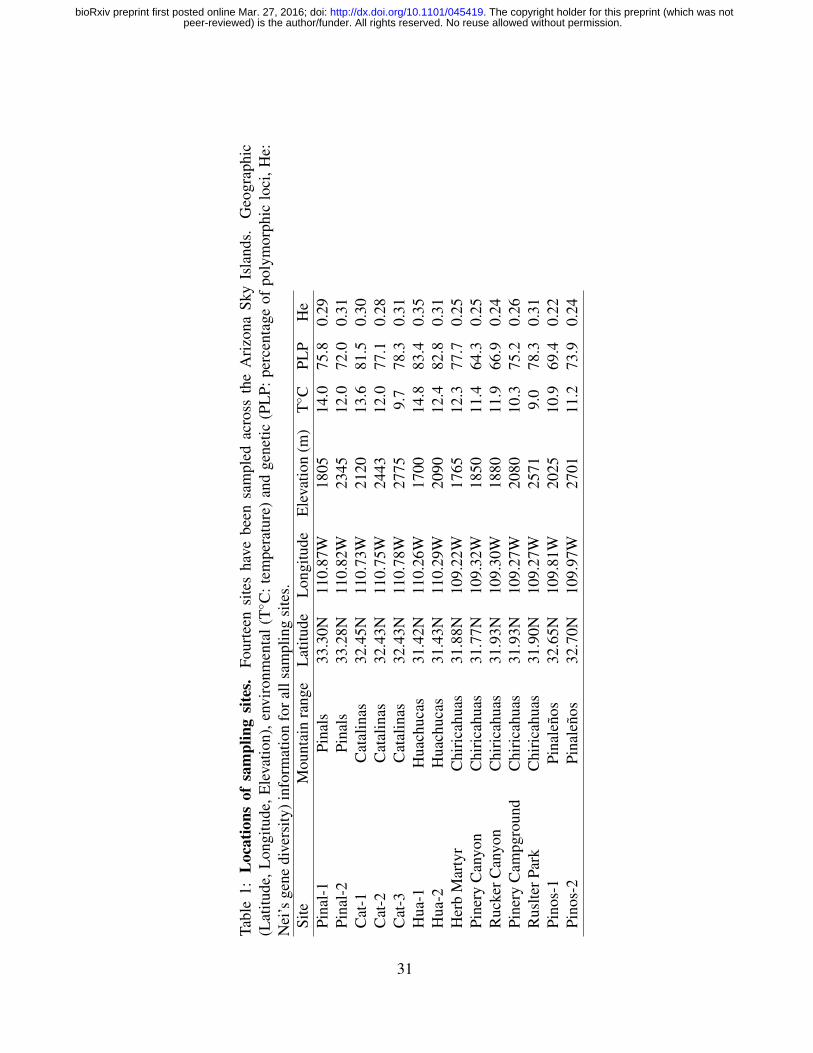
five Sky Island mountains in Southeastern Arizona, USA (Fig. 1, Table 1). For each site, we
measured the latitude and elevation in the field, and we obtained the average annual tempera-
ture, temperature seasonality, annual precipitation from WorldClim Atlas and the vegetational
growth average were obtained from the National Atlas (Table 1). Both databases have a 1 km2
resolution. Our personal observations confirmed the databases are of the same magnitude as the
area of our average sampling sites. Ecological gradients along each Sky Island do show similar
trends, but depending on their altitude and their latitudinal location, also show variation in their
absolute values. For example, our sites from the Huachucas show, on average, higher annual
temperatures (Table 1).
9
peer-reviewed) is the author/funder. All rights reserved. No reuse allowed without permission. The copyright holder for this preprint (which was not. http://dx.doi.org/10.1101/045419doi: bioRxiv preprint first posted online Mar. 27, 2016;
Small scale sampling
For our ecological genomics approach, we selected the Chiricahuas Sky Island (Fig. 1) as our
focal Sky Island, and performed a deeper sampling of the ecological gradient and landscape. We
collected colonies from five distinct sites that represent three different types of habitats: Herb
Martyr is situated in lower mid-elevation area, dominated by junipers and subtropical species
such as agave and yucca. Pinery Canyon and Rucker Canyon are situated on opposite sides
of the mountain, but are similar in their habitat, dominated by oak-juniper woodlands. Pinery
Campground is geographically close to Pinery Canyon, at a higher elevation, but is dominated
by Douglas pines and species usually found at higher latitudes. The highest site, Rustler park, is
also dominated by subalpine species such as Douglas fir and Pinyon pines. Our sampling design
in the Chiricahuas consists therefore of an altitudinal and ecological gradient both spanning a
defined geographic area (Fig. 1). We specifically included sites similar in their habitat but
geographically far apart on the mountain as well as sites situated in close vicinity but different
in their habitat. This design allows for the discrimination between geography or habitat as being
the dominant factor in shaping neutral and adaptive divergence in M. emersoni and investigate
the effects of the ecological gradients on gene flow patterns.
DNA extraction and genotyping
We chose only one individual queen per colony for genetic analyses to avoid pseudo-replication
of the genetic data as ants from the same colony are generally closely related individuals. We
extracted DNA from 318 M. emersoni queens, using thoracic tissue from preserved individuals.
We genotyped all individuals for Amplified Fragment Length Polymorphisms (AFLP) markers,
as described in (58). We used four primer combinations to generate 157 unambiguous loci:
MCTA and EACC , MCTA and EACG, MCAG and EACC , MCAG and EACG. We ran the
PCR products on a LiCor DNA analyser 4300 and the same researcher scored them blindly
10
peer-reviewed) is the author/funder. All rights reserved. No reuse allowed without permission. The copyright holder for this preprint (which was not. http://dx.doi.org/10.1101/045419doi: bioRxiv preprint first posted online Mar. 27, 2016;
using the accompanying Saga software. About 10% of the samples were amplified and scored
twice to estimate the error rate in the procedure, which is similar to what was reported in other
studies (59).
Identifying natural selection in M. emersoni
To identify regions of the genome of M. emersoni that are under natural selection, we identified
outlier loci using three different methods, each of which is based on a different framework.
We first used the method of (60) modified for dominant markers (dFdist) and implemented in
Mcheza by (61). This approach is based on the assumption that loci under divergent selection
will display significantly higher Fst values than the majority of loci that are evolving neutrally
or near-neutrally. Loci under stabilizing selection will display lower than expected Fst values.
This model compares the empirical distribution of Fst values to a simulated distribution of Fst
values conditional on heterozygosity in a subdivided population under the infinite island model.
We performed global comparisons over all 5 Sky Islands, pairwise comparisons between Sky
Islands, as well as global and pairwise comparisons between the 5 Chiricahuas sites. We did
not retain any loci with lower than expected Fst because divergence-based methods have little
power to detect stabilizing selection (60,62). Second, we used the method of (63) implemented
in Bayescan to detect outlier loci. Bayescan uses a Bayesian method to directly estimate the
probability of each locus to be under divergent selection. It is considered to be more robust to
deal with complex demographic scenarios, but is also considered to be more conservative in
outlier identification (63). We therefore used the Bayescan approach using data from the 5 Sky
Islands to confirm our outlier identification from dFdist. We used a third approach to gain in-
sights into the genomic adaptive divergence in M. emersoni by identifying loci that co-vary with
environmental parameters. We used the approach of (64) implemented in SAM which performs
regressions between allele frequencies and environmental variables to identify candidate loci
11
peer-reviewed) is the author/funder. All rights reserved. No reuse allowed without permission. The copyright holder for this preprint (which was not. http://dx.doi.org/10.1101/045419doi: bioRxiv preprint first posted online Mar. 27, 2016;
potentially under natural selection. We tested for association with annual average temperature,
temperature seasonality, annual average precipitation level, and habitat vegetation growth. This
approach is complementary to Fst or Bayesian outlier detection and associates polymorphisms
directly with environmental factors. Therefore, if loci previously identified with Fst or Bayesian
methods also show an association with environmental factors, the putative adaptive nature of
these loci is further supported, and a particular ecological pressure can be suggested as being
responsible for the signals of natural selection.
Linkage disequilibrium
We inferred the genomic distribution of outlier loci across the genome by testing for the pres-
ence of linkage disequilibrium among them. The presence of a higher linkage disequilibrium
among outlier loci than among randomly selected neutral loci would indicate that outlier loci
are likely to be physically linked to each other in the genome, or that there is population sub-
structure. We tested for the presence of linkage disequilibrium among the outlier loci using the
program DIS (65), using the maximum-likelihood based method equivalent to that of (66).
Population diversity and structure
After the identification of outlier loci, we removed these loci from the data set and retained
only putatively neutral markers for following analyses: allele frequencies were estimated with
AFLP-SURV (67) using the Bayesian approach of (68) for dominant markers. We calculated
the proportion of polymorphic loci, expected heterozygosity and average gene diversity for
all populations. We calculated pairwise Fst estimates between sites using all loci, and on the
putatively neutral loci data set only.
Within the Chiricahuas, we also reveal genetic structure among sites with STRUCTURE
(69,70). Using multilocus genotypic data, STRUCTURE attempts to form groups of individuals
without any a priori information on their origin. We performed the admixture algorithm for 100
12
peer-reviewed) is the author/funder. All rights reserved. No reuse allowed without permission. The copyright holder for this preprint (which was not. http://dx.doi.org/10.1101/045419doi: bioRxiv preprint first posted online Mar. 27, 2016;

000 iterations, plus a burn-in period of 100 000 iterations. We determined the most likely
number of clusters, K, as the number reached when increasing K further did not show any
improvement in population structuring (71). We then estimated for each K cluster identify by
STRUCTURE the proportion of individuals coming from each site.
Relationships between queen phenotype, habitat type, and gene flow
Queen phenotype frequencies (winged / wingless) at each site were obtained from previous
work (49). Average queen phenotype frequencies was estimated for all pairwise comparisons
within the Chiricahuas as a proxy for dispersal potential between two sites. We tested several
scenarios that could be underlying the gene flow patterns within the Chiricahuas: isolation-by-
distance (3D geographic distance), isolation-by-temperature (average annual temperature), and
isolation-by-phenotype (winged queens). We performed Mantel tests (72), using 1000 replica-
tions for measuring the significance levels, with the R package vegan. We used partial Mantel
tests to test whether the presence of covariates modulates the associations.
ResultsDetection of Fst outliers
To identify regions of the genome of M. emersoni that show variation patterns consistent with
natural selection, we performed a series of comparisons between M. emersoni Sky Island popu-
lations (see Methods and Table 3). Outliers were detected in all 22 comparisons at the 95% level:
the Global Sky Island dataset, 10 Sky Island pairwise comparisons, global Chiricahuas dataset,
and 10 pairwise comparisons between the 5 Chiricahuas sites. Using dFdist, we identified 7
outliers in the global dataset, and 13 in the pairwise comparisons between Sky Islands. The 7
global outliers were also detected in more than one Sky Island pairwise comparison (Table 3).
We then replicated our analyses using only the Chiricahuas data set, in which we also perform
13
peer-reviewed) is the author/funder. All rights reserved. No reuse allowed without permission. The copyright holder for this preprint (which was not. http://dx.doi.org/10.1101/045419doi: bioRxiv preprint first posted online Mar. 27, 2016;
both global and pairwise comparisons between sites. We identified 16 repeated outliers in the
Chiricahuas, and among these, 7 are also replicated in the global Sky Island dataset. Therefore,
based on dFdist analyses, we detected 7 repeated outliers (M1, M36, M37, M63, M115, M135
and M148) that show patterns of divergence coherent with divergent natural selection in the
Arizona Sky Islands (Table 3). We then used the method implemented in Bayescan to identify
outliers in the global dataset to confirm our outlier identification with dFdist. We confidently
identified one outlier loci in the global dataset, which was also repeatedly identified by dFdist at
both the global level and within the Chiricahuas (M37) (Table 3). Given the conservative nature
of Bayescan, this finding further supports the adaptive nature of the outlier locus M37.
Outlier associations with environmental factors
To identify potential environmental variables responsible for the changes in allelic frequen-
cies in the outlier loci, we performed regressions between allele frequencies and environmental
variables showing strong variation along the ecological gradients (annual average temperature,
temperature seasonality, annual average precipitation level, and habitat vegetation growth). We
detected 19 loci associated with annual average temperature, 13 with temperature seasonality, 4
with average annual precipitation level, and none with habitat vegetation growth. The majority
of the loci associated with either temperature seasonality or precipitation levels were also asso-
ciated with annual temperature. These ecological factors tend to covary with one another, and
temperature is generally considered as the most important factor underlying altitudinal zonation
in the Sky Islands (73). We found that the group of 7 repeated outliers identified with dFdist
(M1, M36, M37, M63,M115, M135 and M148) and the one outlier identified with Bayescan
(M37) were also found to be associated with the annual average temperature Fig.3. We therefore
now refer to this group of loci as ‘temperature-associated loci’. This overlap in loci identifica-
tion using three analyses build on different premises and assumptions is compelling, and sup-
14
peer-reviewed) is the author/funder. All rights reserved. No reuse allowed without permission. The copyright holder for this preprint (which was not. http://dx.doi.org/10.1101/045419doi: bioRxiv preprint first posted online Mar. 27, 2016;
ports further the possible adaptive value of these loci. Furthermore, we previously demonstrated
experimentally a strong effect of temperature on M. emersoni survival, where colonies originat-
ing from cold sites were much more sensitive to heat shock than colonies coming from warm
sites (49). Collectively, these results support the hypothesis that M. emersoni has adapted to the
temperature gradient that was established during the climatic change following the Pleistocene
glaciation.
Temperature-associated loci identify a single region in the genome under selection
Loci identified through genome scans can either be segregating independently form each other,
or physically linked to each other and tagging a single region of the genome under selection.
Given a sufficient number of loci distributed randomly across the genome, association signals
are often detected for several loci in physical proximity of each other and therefore are not
segregating independently. We quantified the levels of linkage disequilibrium among our 7
temperature-associated loci by testing whether they segregated independently from each other.
As a negative control, we also tested linkage disequilibrium in a set of 20 randomly selected
neutral loci from our dataset (Fig. 4). We found that linkage disequilibrium is significantly
higher among our 7 temperature-associated loci than among random neutral loci (p < 2.2 x
10e-16). This indicates that these loci segregate together and most likely tag a single region
in the genome where a strong signal of selection exist (one single island of divergence). Our
power to detect several islands of lower divergence is limited by our total number of loci, and
therefore, other regions under selection may eventually be detected with additional loci.
Population structure and gene flow within the Chiricahuas
M. emersoni populations have recurrently adapted on each Sky Island to the ecological chal-
lenges imposed by the changing climate after the Pleistocene glaciation, by (1) evolving a novel
wingless queen phenotype found predominantly in fragmented habitats at higher elevations, and
15
peer-reviewed) is the author/funder. All rights reserved. No reuse allowed without permission. The copyright holder for this preprint (which was not. http://dx.doi.org/10.1101/045419doi: bioRxiv preprint first posted online Mar. 27, 2016;
by (2) adapting to the newly established temperature gradients of each Sky Island on both the
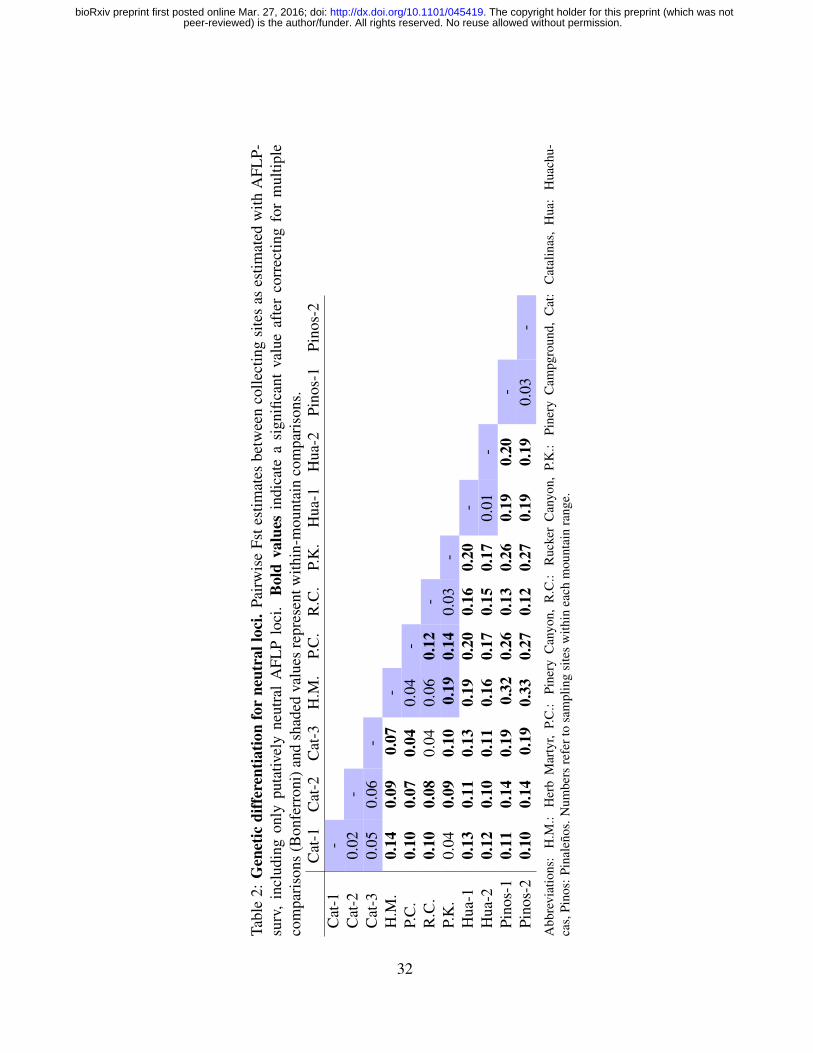
genetic and phenotypic levels. We found that genetic divergence is much higher and significant
between Sky Islands than between sites within one Sky Island (Table 2). However, Sky Islands
are highly ecologically heterogeneous environments, and gene flow within a Sky Island is likely
affected by trade-offs in response to ecological barriers, as often observed between ecologically
divergent sites (74–76). Both adaptations we uncovered in M. emersoni may have affected
population structure and gene flow patterns within a Sky Island. Queens must reconcile two
adaptive phenotypes that respond to different ecological selective pressures: the queen wing
phenotype (winged or wingless) must be adapted to fragmented and high elevation habitats,
but simultaneously, the queen has to adapt to the local temperature of the habitat it disperses
to. Moreover, the queen wing phenotype itself will most likely influence the dispersal of virgin
queens and consequently, affect the gene flow patterns and population structure within a Sky
Island.
To reveal the population structure within the Chiricahuas, we used the STRUCTURE al-
gorithm (69, 70) on the putatively neutral loci. We found that K=3 represents the most likely
number of clusters in the Chiricahuas because an increase in K did not resolve any additional
clusters (71). To highlight similarities and differences between sites, we calculated the propor-
tion of individuals belonging to each of the three K clusters for each of the 5 sites (Fig. 5). We
found that Herb Martyr is mostly composed of individuals from K1, with certain proportion of
K2 individuals. Pinery Campground is dominated by individuals from K2. Pinery Canyon and
Rucker Canyon are relatively similar in their composition, with a large proportion of individu-
als from K3. Ruslter Park shows an admixted composition, with a relatively large proportion of
individuals from K2. The similar composition of Pinery Canyon and Rucker Canyon suggests
higher gene flow of individuals between them, homogenizing the genetic composition between
these two sites. Furthermore, we found a correlation between the K composition of individuals
16
peer-reviewed) is the author/funder. All rights reserved. No reuse allowed without permission. The copyright holder for this preprint (which was not. http://dx.doi.org/10.1101/045419doi: bioRxiv preprint first posted online Mar. 27, 2016;
at each site and the average annual temperature: Herb Martyr, the site with the highest annual
temperature, shows a unique genetic composition dominated by K1 individuals, suggesting lim-
ited successful immigrant individuals into this site coming from other sites that were sampled
in this study. The two sites with intermediate temperatures, Pinery Canyon and Rucker Canyon,
have a similar composition dominated by individuals of K2 group, but also have some propor-
tion of individuals form K1. The two coldest sites, Pinery Campground and Ruslter Park, both
have a significant proportion of individuals with genetic background K3, suggesting a limited
dispersal from other sites sampled.
Isolation-by-temperature modulates gene flow patterns
To test whether geography, temperature, or dispersal phenotype (winged / wingless queen) influ-
ences gene flow patterns and genetic divergence within the Chiricahuas, we performed a series
of analyses testing the interrelations between genetic divergence (Fst) and each of these factors.
We first tested the simplest model of isolation-by-distance (IBD), where gene flow is only lim-
ited by geography. We performed a Mantel test between the Fst matrix within the Chiricahuas
and geographic distance, and we did not find an effect of geographic distance on genetic diver-
gence (Table 4). This indicates that within a Sky Island, gene flow is restricted, or promoted, by
factors other than geographic distance between sites. Second, given the possible adaptation of
Monomorium populations to temperature and the results from STRUCTURE, we tested a model
of isolation-by-environment (IBE), where gene flow is limited by the temperature gradient. We
performed a partial Mantel test between the Fst matrix and temperature distance between sites,
while controlling for differences in elevation. We found a strong (0.64) and highly significant
(p=0.008) effect of temperature on genetic divergence (Table 4), indicating that gene flow be-
tween sites with temperature differences is restricted.
Third, we have also described a repeated adaptation of M. emersoni queen dispersal pheno-
17
peer-reviewed) is the author/funder. All rights reserved. No reuse allowed without permission. The copyright holder for this preprint (which was not. http://dx.doi.org/10.1101/045419doi: bioRxiv preprint first posted online Mar. 27, 2016;
type (winged or wingless) on each of the Arizona Sky Islands (49). We therefore tested a model
of isolation-by-adaptation (IBA), where gene flow patterns are associated with dispersal poten-
tial between the sites. We define dispersal potential as the average winged queen frequency of
the two sites being compared, which reflects how many winged queens are present to mediate
dispersal between the two sites. We performed a Mantel test between Fst matrix and potential
for dispersal between each pairwise comparison, while controlling for elevation, geographic dis-
tance, temperature, or latitude (Table 4). We did not find any significant isolation-by-adaptation
in any of the tests (Table 4), indicating that the presence of winged queens does not influence the
amount of gene flow occurring between two sites. Controlling for the temperature differences
between sites did not improve the model, indicating that dispersal potential does not explain
gene flow patterns within a Sky Island, even between sites of similar temperature. The absence
of an association between a dispersal phenotype and gene flow patterns, even when controlling
for covariates, is unexpected. It indicates that the achieved dispersal of the individual or its
offspring is dissociated from the actual dispersal phenotype of the individual. Together, these
result suggest that gene flow within a Sky Island is mostly shaped by the local adaptation to
temperature rather than the dispersal phenotype of the queens.
Discussion
Using an ecological genomics approach, we reveal that regions of M. emersoni genome show
divergence between populations in a pattern consistent with natural selection caused by temper-
ature. We show that this adaptation appears to influence gene flow patterns within a Sky Island,
and that surprisingly, gene flow is not associated with queen dispersal phenotype. These seem-
ingly contradictory observations may be explained by several possible scenarios: (1) Winged
queens are indeed present, but do not perform dispersal between sites. Given the very high
cost of developing wings and wings muscles (55, 77, 78), this scenario is unlikely and would
18
peer-reviewed) is the author/funder. All rights reserved. No reuse allowed without permission. The copyright holder for this preprint (which was not. http://dx.doi.org/10.1101/045419doi: bioRxiv preprint first posted online Mar. 27, 2016;
be highly costly for the population and probably rapidly lost. (2) Wing phenotype could be
plastic to some extant, and influenced by an environmental factor other than temperature. A
dissociation between the achieved gene flow between two sites (Fst) and the dispersal potential
(percent of winged queens in the two sites) could be explained by winged queens performing
dispersal (gene flow), but giving rise to offspring that are wingless when sensing the right envi-
ronmental cue. Such an effect could change the observed queen phenotype frequencies without
affecting gene flow patterns between sites. We indeed previously found an association between
queen phenotype and habitat fragmentation in M. emersoni (49), indicating that the phenotype
is likely adaptive to some ecological variable. In the light of these results and our previous find-
ings, we propose that the determination of the M. emersoni queen phenotype is environmentally
plastic and may be largely influenced by environmental cues on the Chiricahuas Sky Islands.
Caste polyphenism is a nearly universal feature of ants that highlights their potential for the
evolution and maintenance of environmentally induced morphologies (79,80). Most ant species
show wing polyphenism, meaning that the determination of winged queens or wingless workers
is controlled through an environmentally-controlled switch-like mechanism that is mediated by
juvenile hormone (43, 79, 80). Wing alternative phenotypes in reproductive castes of some
ant species have been found to be under the control of environmental factors (81, 82). In M.
emersoni, using an eco-evo-devo approach, we previously showed that the queen phenotype is
found in fragmented and high elevation habitats, and postulated that an ancestral developmental
potential of Monomorium queens for wing loss has facilitated the repeated adaptive evolution
of wingless queens in M. emersoni and its associated gene regulatory network (49). Here, using
an ecological genomics approach, we show evidence for a repeated adaption of M. emersoni
to temperature gradients in the Arizona Sky Islands following the Pleistocene glaciation, and
that this adaptation in the ecologically heterogeneous landscape has shaped gene flow patterns
within a Sky Island.
19
peer-reviewed) is the author/funder. All rights reserved. No reuse allowed without permission. The copyright holder for this preprint (which was not. http://dx.doi.org/10.1101/045419doi: bioRxiv preprint first posted online Mar. 27, 2016;
It has been postulated that gene flow between different selective regimes may be promoted
by the presence of phenotypic plasticity that facilitates phenotypic adaptation to the diverg-
ing ecological conditions (75). Organisms living in ecologically heterogeneous landscapes
disperse across divergent environments where some of their adaptive phenotypes are advan-
tageous, while other phenotypes may not be a good match for the new environment. In such
a case, phenotypic plasticity can facilitate reaching a new optimal phenotypic combination of
traits that matches the newly colonized environment (83–85). Indeed, within a single popu-
lation, the number ecologically divergent loci that can be maintained by natural selection is
limited (74, 86), and a mismatch in the combination of niche specific traits can reduce fitness
of individuals (87). Phenotypic plasticity can therefore facilitate the coexistence of multiple
optimal adaptive phenotypes within a population (83, 84).
In M. emersoni, synthesizing data from both eco-evo-devo and ecological genomics, we
raise the possibility that there exists a rugged fitness landscape, where wing polyphenism and
temperature tolerance both play a role in the ecological adaptation of M. emersoni to climate
change in the Arizona Sky Islands (Figure 6). For each individual queen, the optimal pheno-
typic state at each of these two traits depends on the local environment, where local selection
pressures may change rapidly over short geographical scales. A good match between the het-
erogeneous environment and the two distinct adaptive phenotypes (wing and temperature) can
be attained by the combination of a genetic adaptation to temperature, which influences gene
flow between sites, and an immediate plastic modulation of the offsprings dispersal phenotype
to match more adequately its dispersal abilities to the environment where it now inhabits.
Evolutionary strategies following environmental change in replicated and heterogeneouslandscapes
Environmental change imposes challenges to organisms during which they must either disperse,
adapt, or adjust their phenotypes to the new environments (6, 88, 89). Synthesizing data from
20
peer-reviewed) is the author/funder. All rights reserved. No reuse allowed without permission. The copyright holder for this preprint (which was not. http://dx.doi.org/10.1101/045419doi: bioRxiv preprint first posted online Mar. 27, 2016;
eco-evo-devo and ecological genomics, we show that M. emersoni possibly adopted both strate-
gies repeatedly to survive climatic change in the Arizona Sky Islands; after the last glaciation,
the once continuous population of M. emersoni was divided into isolated populations on each
of the Sky Islands. M. emersoni moved to refugias in the cooler, higher elevation habitats that
resemble most the habitat that was found at lower elevations during the glaciation (50) and that
they were adapted to. In addition, M. emersoni could persist in the warmer lower mid-elevations
of the Sky Islands by adapting to the warmer temperature. This can now be observed by the
allelic frequencies of loci in islands of genomic divergence matching the temperature gradi-
ent, heat-shock tolerance of individuals coming from warmer habitats, and restricted gene flow
between habitats divergent for temperature. Furthermore, this temperature adaptation occurred
repeatedly across replicated populations: M. emersoni from each of the 5 Sky Islands we studied
show outlier loci frequencies that are associated with temperature, and heat-shock tolerance was
observed in colonies coming from different Sky Islands (49). The same loci across populations
are repeatedly associated to the temperature gradient, suggesting a repeated and predictable
evolution of temperature adaptation across independent replicates. However, a more detailed
genomic mapping of the loci responsible for this adaptation may reveal more subtle differences
across replicates that we were not able to identify with our analyses.
Simultaneously, M. emersoni queens also adjusted to the high elevation and fragmented
habitats post-glaciation by repeatedly activating an ancestral developmental potential for wing
loss in queens (44, 49). We found that the underlying wing patterning gene network repeatedly
evolved similar changes across Sky Islands in wingless queens, but also shows differences in ex-
pression across Sky Islands that are unpredictable and that are contingent on population history.
Here, we suggest that the wing phenotype in queens may be influenced by the environment, and
that such phenotypic plasticity may facilitate gene flow within each Sky Island, across differ-
ent habitats. We raise the possibility that the maintenance of genetic temperature adaptation of
21
peer-reviewed) is the author/funder. All rights reserved. No reuse allowed without permission. The copyright holder for this preprint (which was not. http://dx.doi.org/10.1101/045419doi: bioRxiv preprint first posted online Mar. 27, 2016;
M. emersoni in the Sky Islands was in part facilitated by the presence of an environmentally
determined queen phenotype, which relaxed genetic constraints on adaptation across ecologi-
cally divergent environments. A relaxation of the genetic constraints imposed by ecologically
divergent adaptations could explain the coexistence of a mosaic of different phenotypes within
the same individual that best matches its environment (75, 85). On rugged fitness landscapes,
phenotypic plasticity may help jump across valleys of low fitness by immediately matching the
phenotype to the environment an individual disperses to (or its offspring) (85), and therefore
optimizing multiple adaptive traits simultaneously.
Where is the locus of adaptation?
Experimental studies seeking to identify the locus of adaptation have been numerous (8, 12–
14, 19, 20, 23, 43, 90–92), and an emerging question concerns our ability to discover adaptive
genetic loci given the particular genetic architecture of each trait of interest (35, 93). Past de-
mographic events, population stratification, genetic pleiotropy, recombination rate variability,
and phenotypic plasticty can alter our ability to identify loci underlying adaptations (36, 94).
More specifically, phenotypic plasticity and gene-by-environment interactions are likely to be
pervasive in nature, and they can modulate the associations between the genotype and the phe-
notype (35, 36, 94). Our quest of revealing the genetic mechanisms and architecture under-
lying adaptive phenotypes will likely benefit from a combination of top-down and bottom-up
approaches by leveraging their respective strengths. Organisms face a multitude of novel eco-
logical pressures during climatic change, from changes in physical factors (temperature, precip-
itation), changes in species interactions, and changes in ecological communities (88,89,95,96).
The selective environment often presents more than one ecological challenge at a time, and there
may exist a variety of adaptive strategies adopted by a population living in a heterogeneous en-
vironment to persist in the face of environmental change. In the last decades, considerable
22
peer-reviewed) is the author/funder. All rights reserved. No reuse allowed without permission. The copyright holder for this preprint (which was not. http://dx.doi.org/10.1101/045419doi: bioRxiv preprint first posted online Mar. 27, 2016;
attention has been given to demographic and genetic mechanisms to understand how species
cope with climatic changes, but the role of development has been largely ignored. Integrating
results from both approaches may reveal evolutionary strategies adopted by populations that
would not be discovered by relying on only either of those approaches alone.
References and Notes
1. K. Laland, et al., Nature 514, 161 (2014).
2. M. J. West-Eberhard, Proceedings of the National Academy of Sciences of the United States
of America 102, 6543 (2005).
3. D. Futuyma, Evolutionary Biology (Sinauer, 1998).
4. H. E. Hoekstra, J. A. Coyne, Evolution 61, 995 (2007).
5. G. A. Wray, Nature Reviews Genetics 8, 206 (2007).
6. P. Beldade, A. R. A. Mateus, R. A. Keller, Molecular Ecology 20, 1347 (2011).
7. A. Khila, E. Abouheif, L. Rowe, Evolution 68, 2159 (2014).
8. J. M. Sobel, M. A. Streisfeld, Frontiers in plant science 4, 321 (2013).
9. R. Wallbank, et al., PLoS biology 14 (2016).
10. L. Bernatchez, A. Chouinard, G. Lu, Biological Journal of the Linnean Society 68, 173
(2008).
11. M. Roeasti, A. Hendry, W. Salzburger, D. Berner, Molecular Ecology (2012).
12. Y. Chan, et al., Science pp. 302–305 (2010).
23
peer-reviewed) is the author/funder. All rights reserved. No reuse allowed without permission. The copyright holder for this preprint (which was not. http://dx.doi.org/10.1101/045419doi: bioRxiv preprint first posted online Mar. 27, 2016;
13. P. Colosimo, et al., Science pp. 1928–1933 (2005).
14. P. Nosil, D. Funk, D. Ortiz-Barrientoz, Molecular Ecology 18, 375 (2009).
15. R. J. Haasl, B. A. Payseur, Molecular ecology 25, 5 (2016).
16. J. D. Jensen, M. Foll, L. Bernatchez, Molecular ecology 25, 1 (2016).
17. E. Abouheif, et al., Ecological Genomics (Springer, 2014), pp. 107–125.
18. A. P. Moczek, Frontiers in Ecology and Evolution 3, 7 (2015).
19. A. Khila, E. Abouheif, L. Rowe, Science 336, 585 (2012).
20. P. Brakefield, et al., Nature 384, 236 (1996).
21. P. C. Sabeti, et al., Nature 449, 913 (2007).
22. P. Tiffin, J. Ross-Ibarra, Trends in ecology & evolution 29, 673 (2014).
23. C. R. Linnen, E. P. Kingsley, J. D. Jensen, H. E. Hoekstra, Science 325, 1095 (2009).
24. C. Steiner, H. Rompler, L. Boettger, T. Schoneberg, H. Hoekstra, Molecular Biology and
Evolution 26, 35 (2009).
25. M. A. Supple, R. Papa, H. M. Hines, W. O. McMillan, B. A. Counterman, BMC evolution-
ary biology 15, 204 (2015).
26. J. Prunier, S. Gerardi, J. Laroche, J. Beaulieu, J. Bousquet, Molecular Ecology (2012).
27. F. Jones, et al., Current Biology (2011).
28. J. DeFaveri, P. R. Jonsson, J. Merila, Evolution 67, 2530 (2013).
29. M. D. Shapiro, et al., Nature 428, 717 (2004).
24
peer-reviewed) is the author/funder. All rights reserved. No reuse allowed without permission. The copyright holder for this preprint (which was not. http://dx.doi.org/10.1101/045419doi: bioRxiv preprint first posted online Mar. 27, 2016;
30. B. A. Counterman, et al., PLoS Genet 6, e1000796 (2010).
31. F. C. Jones, et al., Nature 484, 55 (2012).
32. K. E. Lotterhos, M. C. Whitlock, Molecular ecology 24, 1031 (2015).
33. X. Thibert-Plante, A. Hendry, Journal of evolutionary biology 24, 326 (2011).
34. U. M. Marigorta, G. Gibson, Frontiers in genetics 5 (2014).
35. G. Gibson, Nature Reviews Genetics 9, 575 (2008).
36. T. A. Manolio, et al., Nature 461, 747 (2009).
37. C. C. Ledon-Rettig, D. W. Pfennig, Evolution & development 13, 391 (2011).
38. M. E. Santos, C. S. Berger, P. N. Refki, A. Khila, Briefings in functional genomics p. elv003
(2015).
39. A. Khila, E. Abouheif, L. Rowe, PLoS Genet 5, e1000583 (2009).
40. P. N. Refki, D. Armisen, A. J. J. Crumiere, S. Viala, A. Khila, Developmental biology 392,
441 (2014).
41. E. C. Snell-Rood, et al., Evolution 65, 231 (2011).
42. S. Pantalacci, M. Semon, Journal of Experimental Zoology Part B: Molecular and Devel-
opmental Evolution 324, 363 (2015).
43. E. Abouheif, G. A. Wray, Science 297, 249 (2002).
44. R. Rajakumar, et al., Science 335, 79 (2012).
45. S. Shbailat, A. Khila, E. Abouheif, Evolution and Development 12, 579 (2010).
25
peer-reviewed) is the author/funder. All rights reserved. No reuse allowed without permission. The copyright holder for this preprint (which was not. http://dx.doi.org/10.1101/045419doi: bioRxiv preprint first posted online Mar. 27, 2016;
46. G. A. Wray, E. Abouheif, Current opinion in genetics & development 8, 675 (1998).
47. B. Deagle, et al., Proceedings of the Royal Society B: Biological Sciences 279, 1277 (2012).
48. P. J. Wittkopp, et al., Science 326, 540 (2009).
49. M.-J. Fave, et al., BMC evolutionary biology 15, 1 (2015).
50. M. Lomolino, J. Brown, R. Davis, Ecology pp. 180–194 (1989).
51. P. Warshall, RM-GTR-264 : Biodiversity and management of the madrean archipelago: the
sky islands of southwestern United States and northwestern Mexico, L. DeBano, et al., eds.
(US Department of Agriculture, Forest Service, Fort Collins, 1994), pp. 6–18.
52. M. DuBois, The University of Kansas Science Bulletin pp. 1–55 (1986).
53. B. Bolton, Journal of Natural History 20, 267 (1986).
54. J. Heinze, L. Keller, Trends in Ecology & Evolution 15, 508 (2000).
55. C. Peeters, Myrmecological News pp. 75–91 (2012).
56. C. Peeters, M. Molet, Ant Ecology, L. Lach, C. Parr, K. Abbott, eds. (Oxford University
Press, New-York, 2010), pp. 159–176.
57. J. H. Bowsher, G. A. Wray, E. Abouheif, Journal of Experimental Zoology Part B: Molec-
ular and Developmental Evolution 308, 769 (2007).
58. P. Vos, et al., Nucleic Acids Research 23, 4407 (1995).
59. A. Bonin, D. Ehrich, S. Manel, Molecular Ecology 16, 3737 (2007).
60. M. Beaumont, D. Balding, Molecular ecology 13, 969 (2004).
26
peer-reviewed) is the author/funder. All rights reserved. No reuse allowed without permission. The copyright holder for this preprint (which was not. http://dx.doi.org/10.1101/045419doi: bioRxiv preprint first posted online Mar. 27, 2016;
61. T. Antao, M. Beaumont, Bioinformatics 27, 1717 (2011).
62. M. Beaumont, R. Nichols, Proceedings of the Royal Society of London. Series B: Biological
Sciences 263, 1619 (1996).
63. M. Foll, O. Gaggiotti, Genetics 180, 977 (2008).
64. S. Joost, et al., Molecular Ecology 16, 3955 (2007).
65. K. Dasmahapatra, et al., Evolution 56, 741 (2002).
66. W. Hill, et al., Heredity 33, 229 (1974).
67. X. Vekemans, T. Beauwens, M. Lemaire, I. Roldan-Ruiz, Molecular ecology 11, 139
(2002).
68. L. A. Zhivotovsky, Molecular Ecology 8, 907 (1999).
69. J. Pritchard, M. Stephens, P. Donnelly, Genetics 155, 945 (2000).
70. D. Falush, M. Stephens, J. Pritchard, Molecular Ecology Notes 7, 574 (2007).
71. G. Cooke, N. Chao, L. Beheregaray, Molecular Ecology (2012).
72. N. Mantel, Cancer Research 27, 209 (1967).
73. E. Solomon, L. Berg, D. Martin, Biology (Brooks/Cole, 2004).
74. B. J. Shapiro, M. F. Polz, Trends in microbiology 22, 235 (2014).
75. E. Crispo, Journal of evolutionary biology 21, 1460 (2008).
76. S. D. Schoville, et al., Annual Review of Ecology, Evolution, and Systematics 43, 23 (2012).
77. D. Roff, Evolution pp. 1009–1020 (1986).
27
peer-reviewed) is the author/funder. All rights reserved. No reuse allowed without permission. The copyright holder for this preprint (which was not. http://dx.doi.org/10.1101/045419doi: bioRxiv preprint first posted online Mar. 27, 2016;
78. D. A. Roff, Quarterly Review of Biology 71, 3. Ue275 year = 1996.
79. B. Holldobler, E. O. Wilson, The Ants (The Belknap Press of Harvard University Press,
Cambridge, 1990).
80. E. Wilson, Paleobiology pp. 44–53 (1987).
81. S. Cremer, J. Heinze, Current Biology pp. 219–223 (2003).
82. T. Murakami, K. Ohkawara, S. Higashi, Annals of the Entomological Society of America
95, 577 (2002).
83. X. Thibert-Plante, A. Hendry, Journal of evolutionary biology 24, 326 (2011).
84. M. R. Morris, et al., Molecular ecology 23, 3226 (2014).
85. M. Morris, S. M. Rogers, Ecological Genomics (Springer, 2014), pp. 73–105.
86. D. Campbell, L. Bernatchez, Molecular Biology and Evolution 21, 945 (2004).
87. M. E. Arnegard, et al., Nature (2014).
88. M. Berg, et al., Global Change Biology 16, 587 (2009).
89. J. Hill, H. Griffiths, C. Thomas, Annual review of entomology 56, 143 (2011).
90. M. Shapiro, M. Bell, D. Kingsley, Proceedings of the National Academy of Sciences of the
United States of America pp. 13753–13758 (2006).
91. J. Stinchcombe, H. Hoekstra, Heredity 100, 158 (2007).
92. P. Nosil, S. Egan, D. Funk, Evolution 62, 316 (2007).
28
peer-reviewed) is the author/funder. All rights reserved. No reuse allowed without permission. The copyright holder for this preprint (which was not. http://dx.doi.org/10.1101/045419doi: bioRxiv preprint first posted online Mar. 27, 2016;
93. P. M. Visscher, M. A. Brown, M. I. McCarthy, J. Yang, The American Journal of Human
Genetics 90, 7 (2012).
94. E. E. Eichler, et al., Nature Reviews Genetics 11, 446 (2010).
95. M. Davis, R. Shaw, Science 292, 673 (2001).
96. G.-R. Walther, et al., Nature 416, 389 (2002).
Acknowledgements
We thank Robert A. Johnson for his indispensable help during field work and for discussions
about the Arizona Sky Islands and its ant fauna. for We thank N. Aubin-Horth, L. Nilson,
A. Hendry, J. Marcus, D. Schoen, and the Abouheif lab members for providing comments on
this manuscript, as well as for instigating discussions on ecological genomics and evo-devo
perspectives on the genetic basis of adaptation. This work was supported by grants from Fonds
de la Recherche du Quebec - Nature et Technologies, Canada Research Chairs program, and
National Sciences and Engineering Research Council (NSERC) to E.A., NSERC postgraduate
scholarship to M-J.F.
Data Availability
The environmental data is available through the World Clim database. Files with genotyping
and phenotypic data are available from authors upon request.
29
peer-reviewed) is the author/funder. All rights reserved. No reuse allowed without permission. The copyright holder for this preprint (which was not. http://dx.doi.org/10.1101/045419doi: bioRxiv preprint first posted online Mar. 27, 2016;

Tables and Figures
30
peer-reviewed) is the author/funder. All rights reserved. No reuse allowed without permission. The copyright holder for this preprint (which was not. http://dx.doi.org/10.1101/045419doi: bioRxiv preprint first posted online Mar. 27, 2016;
T abl
e1:
Loc
atio
nsof
sam
plin
gsi
tes.
Four
teen
site
sha
vebe
ensa
mpl
edac
ross
the
Ari
zona
Sky
Isla
nds.
Geo
grap
hic
(Lat
itude
,Lon
gitu
de,E
leva
tion)
,env
iron
men
tal(
T◦ C
:tem
pera
ture
)an
dge
netic
(PL
P:pe
rcen
tage
ofpo
lym
orph
iclo
ci,H
e:N
ei’s
gene
dive
rsity
)inf
orm
atio
nfo
rall
sam
plin
gsi
tes.
Site
Mou
ntai
nra
nge
Lat
itude
Lon
gitu
deE
leva
tion
(m)
T◦ C
PLP
He
Pina
l-1
Pina
ls33
.30N
110.
87W
1805
14.0
75.8
0.29
Pina
l-2
Pina
ls33
.28N
110.
82W
2345
12.0
72.0
0.31
Cat
-1C
atal
inas
32.4
5N11
0.73
W21
2013
.681
.50.
30C
at-2
Cat
alin
as32
.43N
110.
75W
2443
12.0
77.1
0.28
Cat
-3C
atal
inas
32.4
3N11
0.78
W27
759.
778
.30.
31H
ua-1
Hua
chuc
as31
.42N
110.
26W
1700
14.8
83.4
0.35
Hua
-2H
uach
ucas
31.4
3N11
0.29
W20
9012
.482
.80.
31H
erb
Mar
tyr
Chi
rica
huas
31.8
8N10
9.22
W17
6512
.377
.70.
25Pi
nery
Can
yon
Chi
rica
huas
31.7
7N10
9.32
W18
5011
.464
.30.
25R
ucke
rCan
yon
Chi
rica
huas
31.9
3N10
9.30
W18
8011
.966
.90.
24Pi
nery
Cam
pgro
und
Chi
rica
huas
31.9
3N10
9.27
W20
8010
.375
.20.
26R
uslte
rPar
kC
hiri
cahu
as31
.90N
109.
27W
2571
9.0
78.3
0.31
Pino
s-1
Pina
leno
s32
.65N
109.
81W
2025
10.9
69.4
0.22
Pino
s-2
Pina
leno
s32
.70N
109.
97W
2701
11.2
73.9
0.24
31
peer-reviewed) is the author/funder. All rights reserved. No reuse allowed without permission. The copyright holder for this preprint (which was not. http://dx.doi.org/10.1101/045419doi: bioRxiv preprint first posted online Mar. 27, 2016;
Tabl
e2:
Gen
etic
diff
eren
tiatio
nfo
rne
utra
lloc
i.Pa
irw
ise
Fste
stim
ates
betw
een
colle
ctin
gsi
tes
ases
timat
edw
ithA
FLP-
surv
,in
clud
ing
only
puta
tivel
yne
utra
lA
FLP
loci
.B
old
valu
esin
dica
tea
sign
ifica
ntva
lue
afte
rco
rrec
ting
for
mul
tiple
com
pari
sons
(Bon
ferr
oni)
and
shad
edva
lues
repr
esen
twith
in-m
ount
ain
com
pari
sons
.C
at-1
Cat
-2C
at-3
H.M
.P.
C.
R.C
.P.
K.
Hua
-1H
ua-2
Pino
s-1
Pino
s-2
Cat
-1-
Cat
-20.
02-
Cat
-30.
050.
06-
H.M
.0.
140.
090.
07-
P.C
.0.
100.
070.
040.
04-
R.C
.0.
100.
080.
040.
060.
12-
P.K
.0.
040.
090.
100.
190.
140.
03-
Hua
-10.
130.
110.
130.
190.
200.
160.
20-
Hua
-20.
120.
100.
110.
160.
170.
150.
170.
01-
Pino
s-1
0.11
0.14
0.19
0.32
0.26
0.13
0.26
0.19
0.20
-Pi
nos-
20.
100.
140.
190.
330.
270.
120.
270.
190.
190.
03-
Abb
revi
atio
ns:
H.M
.:H
erb
Mar
tyr,
P.C
.:Pi
nery
Can
yon,
R.C
.:R
ucke
rC
anyo
n,P.
K.:
Pine
ryC
ampg
roun
d,C
at:
Cat
alin
as,
Hua
:H
uach
u-ca
s,Pi
nos:
Pina
leno
s.N
umbe
rsre
fert
osa
mpl
ing
site
sw
ithin
each
mou
ntai
nra
nge.
32
peer-reviewed) is the author/funder. All rights reserved. No reuse allowed without permission. The copyright holder for this preprint (which was not. http://dx.doi.org/10.1101/045419doi: bioRxiv preprint first posted online Mar. 27, 2016;
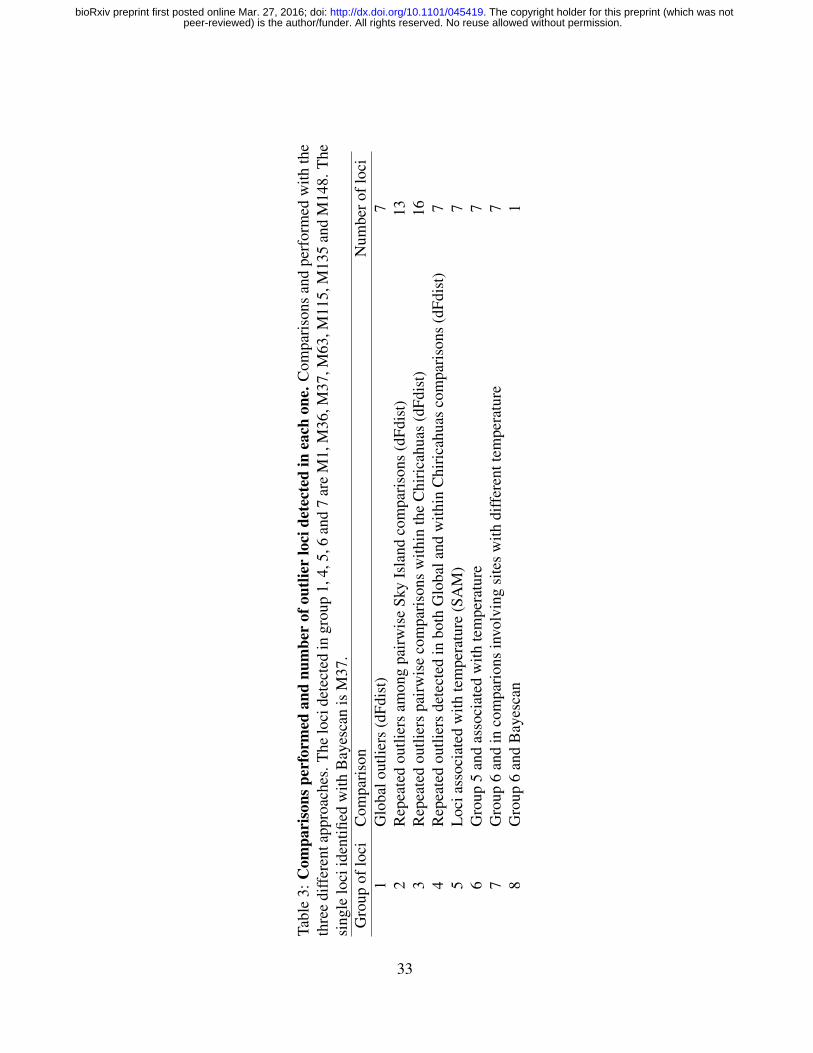
T abl
e3:
Com
pari
sons
perf
orm
edan
dnu
mbe
rof
outli
erlo
cide
tect
edin
each
one.
Com
pari
sons
and
perf
orm
edw
ithth
eth
ree
diff
eren
tapp
roac
hes.
The
loci
dete
cted
ingr
oup
1,4,
5,6
and
7ar
eM
1,M
36,M
37,M
63,M
115,
M13
5an
dM
148.
The
sing
lelo
ciid
entifi
edw
ithB
ayes
can
isM
37.
Gro
upof
loci
Com
pari
son
Num
bero
floc
i1
Glo
balo
utlie
rs(d
Fdis
t)7
2R
epea
ted
outli
ers
amon
gpa
irw
ise
Sky
Isla
ndco
mpa
riso
ns(d
Fdis
t)13
3R
epea
ted
outli
ers
pair
wis
eco
mpa
riso
nsw
ithin
the
Chi
rica
huas
(dFd
ist)
164
Rep
eate
dou
tlier
sde
tect
edin
both
Glo
bala
ndw
ithin
Chi
rica
huas
com
pari
sons
(dFd
ist)
75
Loc
iass
ocia
ted
with
tem
pera
ture
(SA
M)
76
Gro
up5
and
asso
ciat
edw
ithte
mpe
ratu
re7
7G
roup
6an
din
com
pari
ons
invo
lvin
gsi
tes
with
diff
eren
ttem
pera
ture
78
Gro
up6
and
Bay
esca
n1
33
peer-reviewed) is the author/funder. All rights reserved. No reuse allowed without permission. The copyright holder for this preprint (which was not. http://dx.doi.org/10.1101/045419doi: bioRxiv preprint first posted online Mar. 27, 2016;
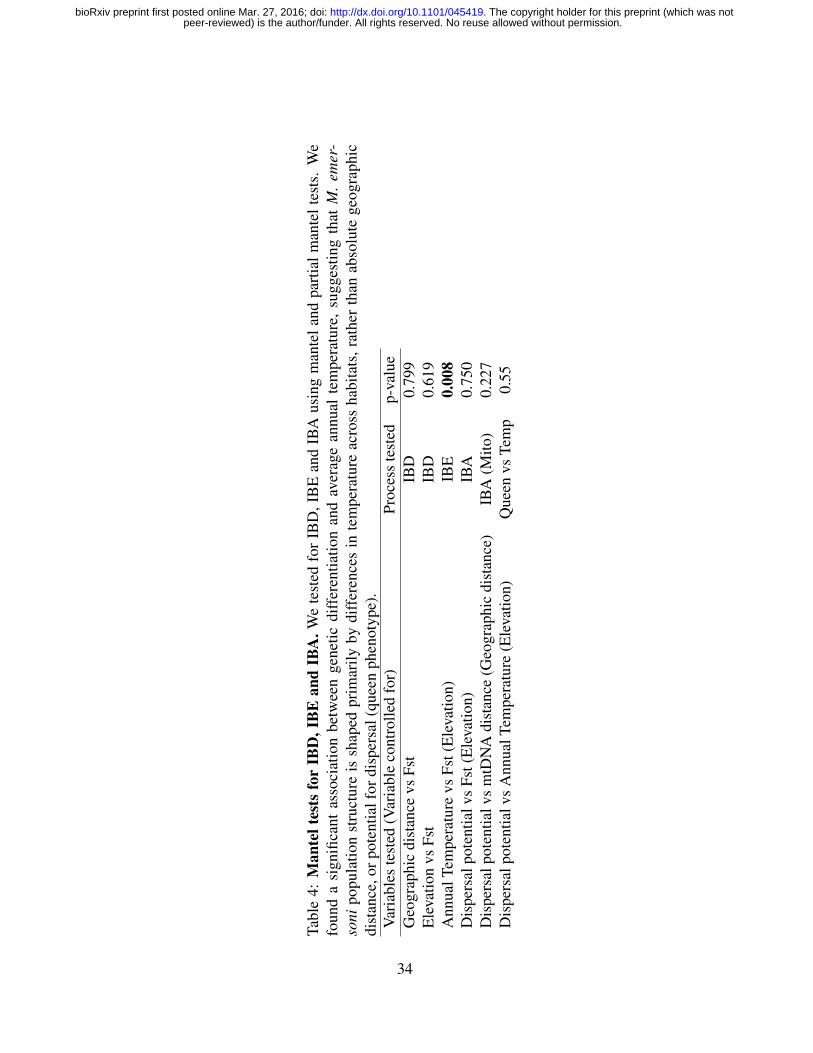
Tabl
e4:
Man
telt
ests
for
IBD
,IB
Ean
dIB
A.W
ete
sted
for
IBD
,IB
Ean
dIB
Aus
ing
man
tela
ndpa
rtia
lman
telt
ests
.W
efo
und
asi
gnifi
cant
asso
ciat
ion
betw
een
gene
ticdi
ffer
entia
tion
and
aver
age
annu
alte
mpe
ratu
re,
sugg
estin
gth
atM
.em
er-
soni
popu
latio
nst
ruct
ure
issh
aped
prim
arily
bydi
ffer
ence
sin
tem
pera
ture
acro
ssha
bita
ts,r
athe
rth
anab
solu
tege
ogra
phic
dist
ance
,orp
oten
tialf
ordi
sper
sal(
quee
nph
enot
ype)
.V
aria
bles
test
ed(V
aria
ble
cont
rolle
dfo
r)Pr
oces
ste
sted
p-va
lue
Geo
grap
hic
dist
ance
vsFs
tIB
D0.
799
Ele
vatio
nvs
Fst
IBD
0.61
9A
nnua
lTem
pera
ture
vsFs
t(E
leva
tion)
IBE
0.00
8D
ispe
rsal
pote
ntia
lvs
Fst(
Ele
vatio
n)IB
A0.
750
Dis
pers
alpo
tent
ialv
sm
tDN
Adi
stan
ce(G
eogr
aphi
cdi
stan
ce)
IBA
(Mito
)0.
227
Dis
pers
alpo
tent
ialv
sA
nnua
lTem
pera
ture
(Ele
vatio
n)Q
ueen
vsTe
mp
0.55
34
peer-reviewed) is the author/funder. All rights reserved. No reuse allowed without permission. The copyright holder for this preprint (which was not. http://dx.doi.org/10.1101/045419doi: bioRxiv preprint first posted online Mar. 27, 2016;
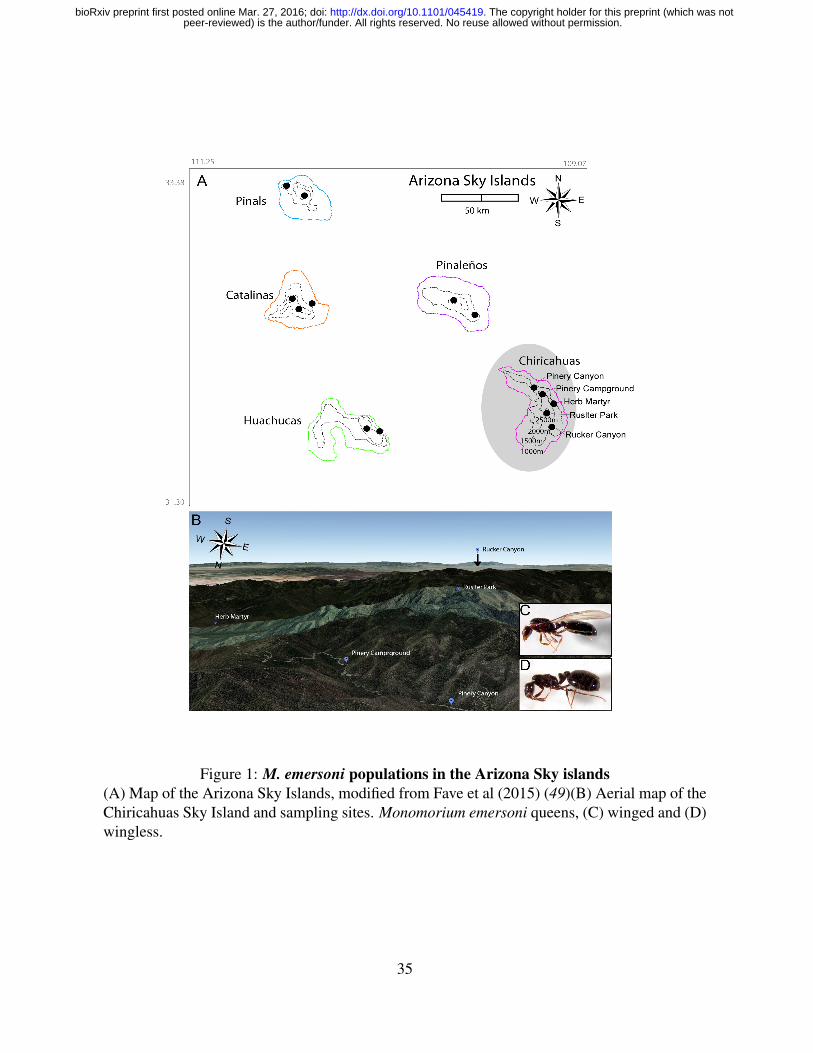
Figure 1: M. emersoni populations in the Arizona Sky islands(A) Map of the Arizona Sky Islands, modified from Fave et al (2015) (49)(B) Aerial map of theChiricahuas Sky Island and sampling sites. Monomorium emersoni queens, (C) winged and (D)wingless.
35
peer-reviewed) is the author/funder. All rights reserved. No reuse allowed without permission. The copyright holder for this preprint (which was not. http://dx.doi.org/10.1101/045419doi: bioRxiv preprint first posted online Mar. 27, 2016;
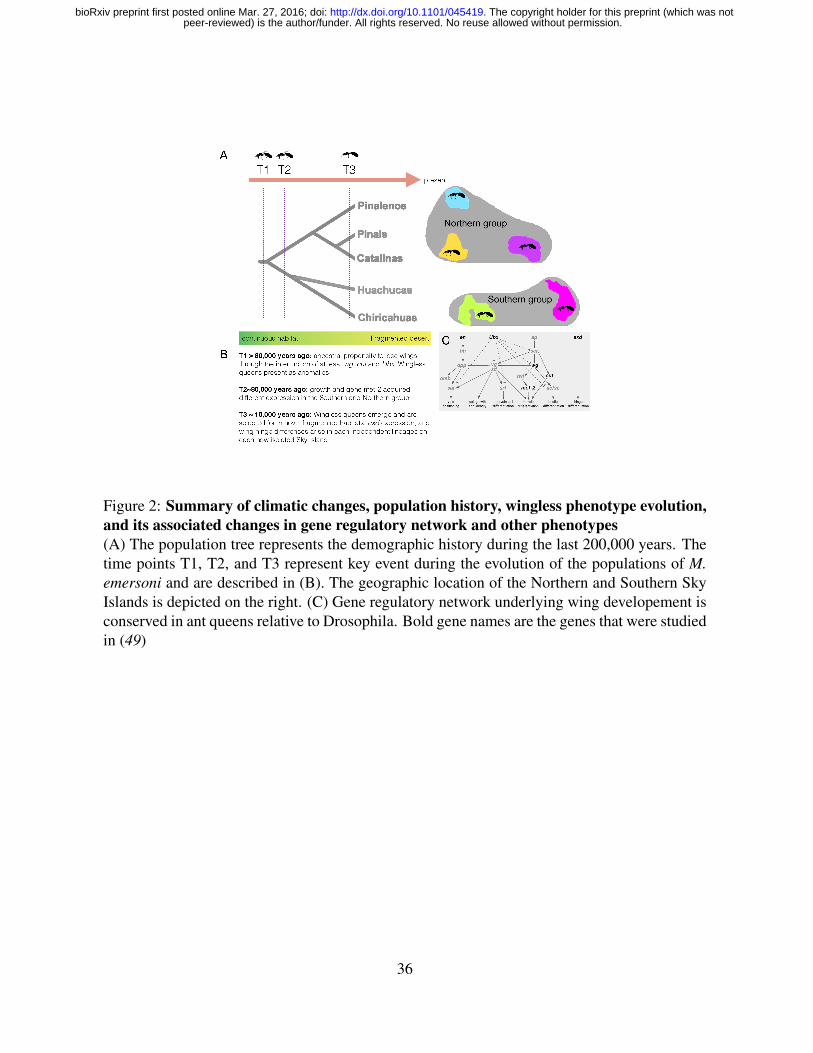
Figure 2: Summary of climatic changes, population history, wingless phenotype evolution,and its associated changes in gene regulatory network and other phenotypes(A) The population tree represents the demographic history during the last 200,000 years. Thetime points T1, T2, and T3 represent key event during the evolution of the populations of M.emersoni and are described in (B). The geographic location of the Northern and Southern SkyIslands is depicted on the right. (C) Gene regulatory network underlying wing developement isconserved in ant queens relative to Drosophila. Bold gene names are the genes that were studiedin (49)
36
peer-reviewed) is the author/funder. All rights reserved. No reuse allowed without permission. The copyright holder for this preprint (which was not. http://dx.doi.org/10.1101/045419doi: bioRxiv preprint first posted online Mar. 27, 2016;
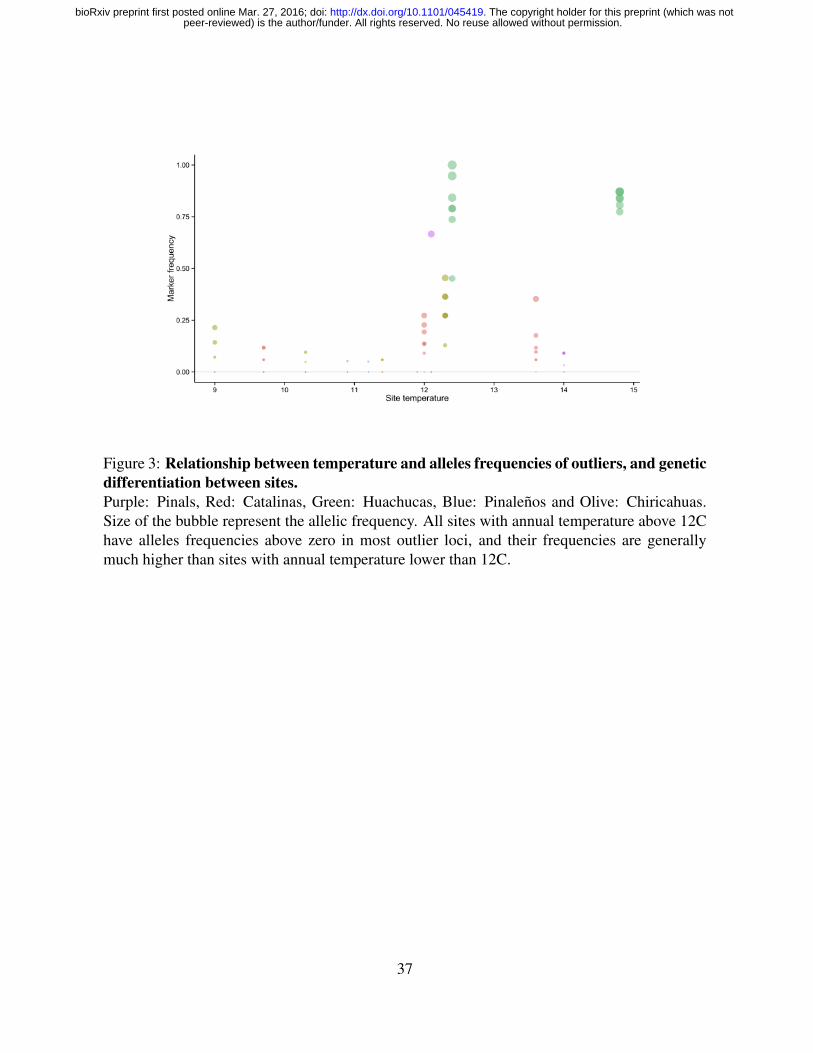
Figure 3: Relationship between temperature and alleles frequencies of outliers, and geneticdifferentiation between sites.Purple: Pinals, Red: Catalinas, Green: Huachucas, Blue: Pinalenos and Olive: Chiricahuas.Size of the bubble represent the allelic frequency. All sites with annual temperature above 12Chave alleles frequencies above zero in most outlier loci, and their frequencies are generallymuch higher than sites with annual temperature lower than 12C.
37
peer-reviewed) is the author/funder. All rights reserved. No reuse allowed without permission. The copyright holder for this preprint (which was not. http://dx.doi.org/10.1101/045419doi: bioRxiv preprint first posted online Mar. 27, 2016;
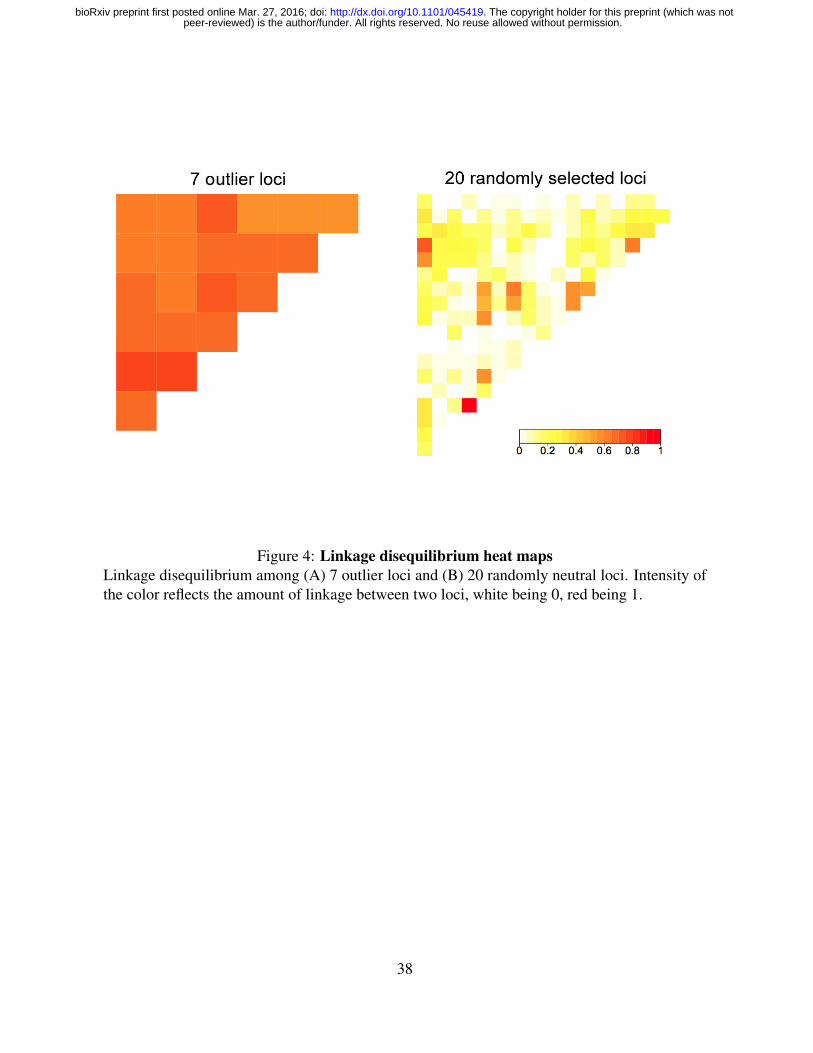
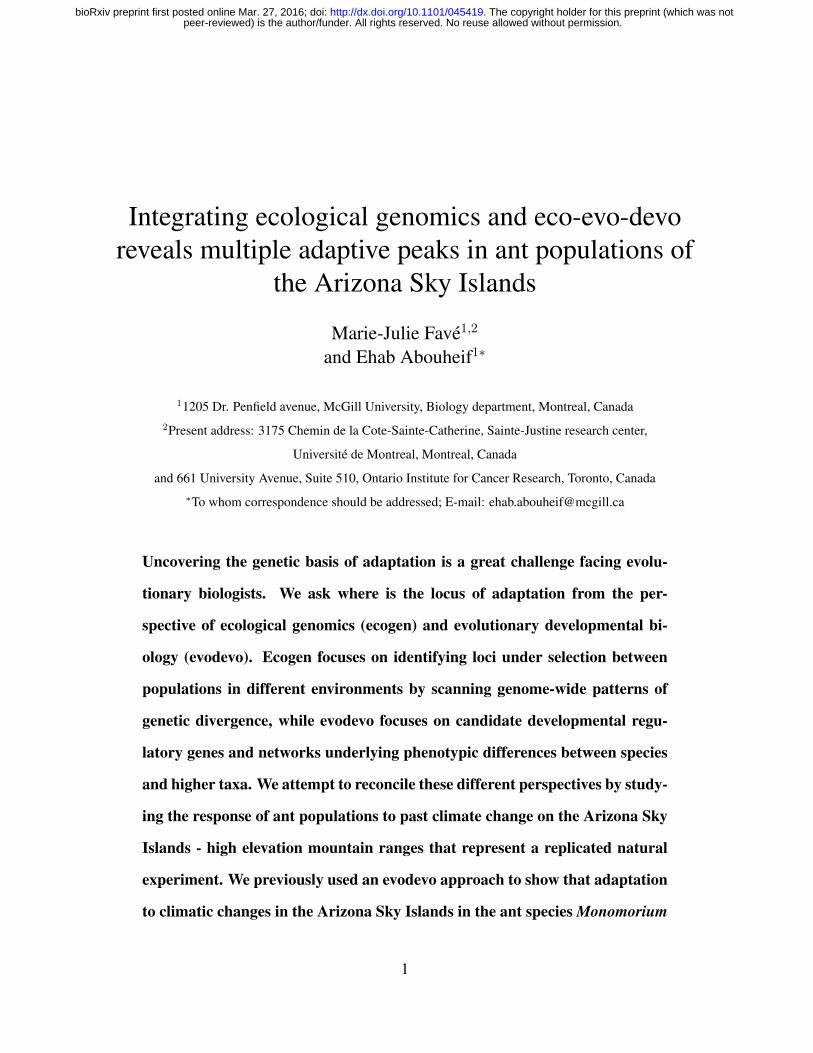
Figure 4: Linkage disequilibrium heat mapsLinkage disequilibrium among (A) 7 outlier loci and (B) 20 randomly neutral loci. Intensity ofthe color reflects the amount of linkage between two loci, white being 0, red being 1.
38
peer-reviewed) is the author/funder. All rights reserved. No reuse allowed without permission. The copyright holder for this preprint (which was not. http://dx.doi.org/10.1101/045419doi: bioRxiv preprint first posted online Mar. 27, 2016;

Figure 5: Population membership of individuals at each site.Population membership of individuals at each site. Herb Martyr is composed in majority ofindividuals from K1 genetic background (green). Pinery campground is composed in majorityof individuals from K2 genetic background (blue), as is Ruslter park but to a lower extant.Pinery Canyon and Rucker Canyon are composed in majority of individuals from K3 geneticbackground (red).
39
peer-reviewed) is the author/funder. All rights reserved. No reuse allowed without permission. The copyright holder for this preprint (which was not. http://dx.doi.org/10.1101/045419doi: bioRxiv preprint first posted online Mar. 27, 2016;
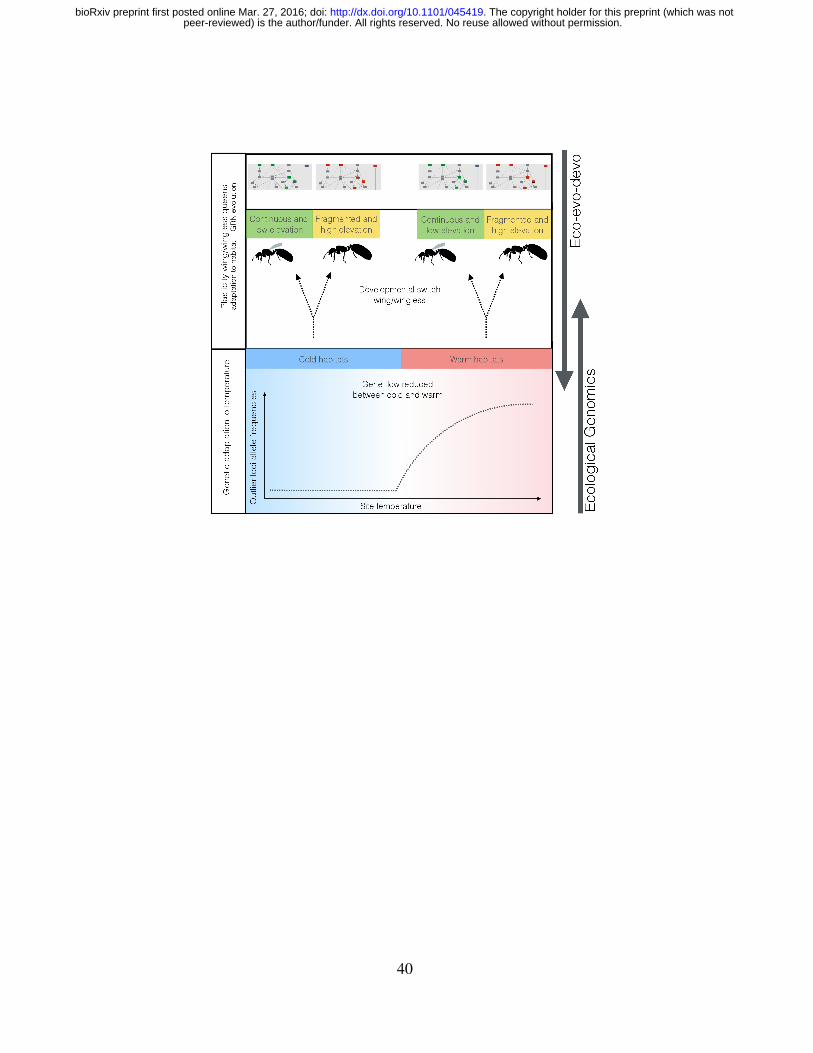
40
peer-reviewed) is the author/funder. All rights reserved. No reuse allowed without permission. The copyright holder for this preprint (which was not. http://dx.doi.org/10.1101/045419doi: bioRxiv preprint first posted online Mar. 27, 2016;
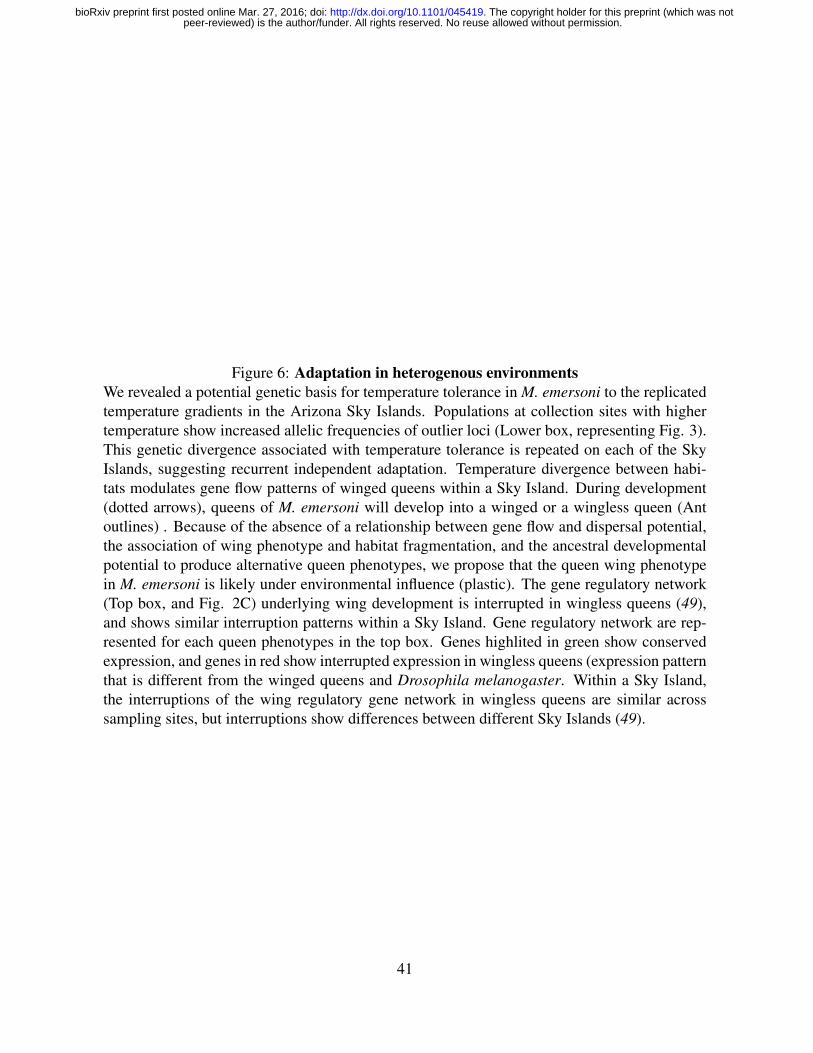
Figure 6: Adaptation in heterogenous environmentsWe revealed a potential genetic basis for temperature tolerance in M. emersoni to the replicatedtemperature gradients in the Arizona Sky Islands. Populations at collection sites with highertemperature show increased allelic frequencies of outlier loci (Lower box, representing Fig. 3).This genetic divergence associated with temperature tolerance is repeated on each of the SkyIslands, suggesting recurrent independent adaptation. Temperature divergence between habi-tats modulates gene flow patterns of winged queens within a Sky Island. During development(dotted arrows), queens of M. emersoni will develop into a winged or a wingless queen (Antoutlines) . Because of the absence of a relationship between gene flow and dispersal potential,the association of wing phenotype and habitat fragmentation, and the ancestral developmentalpotential to produce alternative queen phenotypes, we propose that the queen wing phenotypein M. emersoni is likely under environmental influence (plastic). The gene regulatory network(Top box, and Fig. 2C) underlying wing development is interrupted in wingless queens (49),and shows similar interruption patterns within a Sky Island. Gene regulatory network are rep-resented for each queen phenotypes in the top box. Genes highlited in green show conservedexpression, and genes in red show interrupted expression in wingless queens (expression patternthat is different from the winged queens and Drosophila melanogaster. Within a Sky Island,the interruptions of the wing regulatory gene network in wingless queens are similar acrosssampling sites, but interruptions show differences between different Sky Islands (49).
41
peer-reviewed) is the author/funder. All rights reserved. No reuse allowed without permission. The copyright holder for this preprint (which was not. http://dx.doi.org/10.1101/045419doi: bioRxiv preprint first posted online Mar. 27, 2016;