Embed Size (px)
Citation preview
INTEGRATING LOCAL
KNOWLEDGE IN PLANNING AND
MANAGEMENT OF WATER
SUPPLY PROVISION IN THE
INFORMAL SETTLEMENTS OF
STONE TOWN, ZANZIBAR
MATHENGE MWEHE
March, 2011
SUPERVISORS:
Drs J.J Verplanke
Dr. J.A. Martinez


Thesis submitted to the Faculty of Geo-Information Science and Earth
Observation of the University of Twente in partial fulfilment of the
requirements for the degree of Master of Science in Geo-information Science
and Earth Observation.
Specialization: Urban Planning and Management
SUPERVISORS:
Drs J.J Verplanke: 1st Supervisor
Dr. J.A. Martinez: 2nd Supervisor
THESIS ASSESSMENT BOARD:
Prof. Dr. Ir. M. F. A. M. van Maarseveen: Chairman
Drs. R. Becht: External examiner; ITC, University of Twente
INTEGRATING LOCAL
KNOWLEDGE IN PLANNING AND
MANAGEMENT OF WATER
SUPPLY PROVISION IN THE
INFORMAL SETTLEMENTS OF
STONE TOWN, ZANZIBAR
MATHENGE MWEHE
Enschede, The Netherlands, March, 2011

DISCLAIMER
This document describes work undertaken as part of a programme of study at the Faculty of Geo-Information Science and
Earth Observation of the University of Twente. All views and opinions expressed therein remain the sole responsibility of the
author, and do not necessarily represent those of the Faculty.

Dedicated to
My beloved parents and siblings


i
ABSTRACT
Urban water supply planning and management is confronted by many problems that require urgent
redress if growing water demands resulting from increasing informal urbanization is to be met. A need
arise to find an integrated water supply planning approach since conventional planning approaches seem
unable to successfully address these problems. These approaches heavily rely on scientific knowledge (SK)
as the primary source of information while largely ignoring local knowledge (LK) communities and water
consumers possess. Literature suggests that use of LK can greatly supplement SK thereby enabling water
supply providers to make informed planning decisions. However, two main issues seem to hinder the use
and application of LK: first, lack of a better method that can facilitate collection of LK in a format useful
to decision makers. Secondly, lack of a methodology that can help integrate the two knowledge systems
while addressing the inherent limitations of LK that prevent it to adequately fit into the realms of SK. In
this regard, this research formulated three objectives in trying to address this: Finding out the existing
water supply provision situation in the informal settlements of Zanzibar; Identifying, eliciting, and
collecting LK communities of these area possess and finding out how this knowledge can be integrated
with SK and applied in water supply planning. Using a case study approach, Qualitative GIS methods were
combined with a GIS-based methodological framework to help collect, analyze and integrate LK with SK.
Results reveal communities have useful LK regarding water supply provision that authorities can tap to
improve water supply planning decisions. The resulting integrated knowledge base was disaggregated into
the four dimensions of urban water supply planning that enabled application of this knowledge to water
supply planning process. By using the framework as a guide to apply the integrated knowledge base in
Zanzibar, the discussion demonstrated how LK could be used to address not only the challenges facing
water supply provision in the informal settlement areas, but also address the limitations of conventional
water supply planning approaches. From the discussion also emerged a framework that can enable water
service providers to shift from conventional planning to participatory water planning thereby enabling the
linking of both the “local communities and local knowledge” in the urban water supply planning and
management activities.
Keywords: conventional planning, local knowledge, scientific knowledge, GIS, qualitative GIS
integrated water supply planning, informal settlement, dimensions of urban water supply
ii
ACKNOWLEDGEMENTS
I thank God for fulfilling my dreams. You guided me, without which I would never have managed.
Forever will I be grateful to you.
Many individuals and organisations have provided enormous support for the successful completion of my
MSc studies. First, I would like to acknowledge the financial support I received from the Government of
The Netherlands under the Netherlands Fellowship Programme for funding me to pursues further studies.
For this, I will forever be grateful. Many thanks go to my two supervisors: Drs J.J Verplanke and Dr. J.A.
Martinez. Your professional guidance and constant feedbacks you gave me throughout the research period
is highly appreciated. My sincere thanks go to the entire Urban Planning and Management Department
fraternity in ITC for their amazing generosity of sharing their knowledge with me throughout the entire
course.
I extend my heartfelt gratitude to UN-Habitat for the kind financial support that facilitated all my travels
from The Netherlands to Zanzibar Island to conduct my fieldwork research.
Many thanks goes to Zanzibar Water Authority General Director, Mr. Hemed S. Hemed, Mr Muhamed
Iliyasa (GIS expert, ZAWA,) and other ZAWA officials who gave expert advice, opinions and necessary
assistance I required to accomplish this research. I acknowledge the expert advice from SMOLE2 staff,
and urban planning and survey department officials in Zanzibar who provided me with much information
and guidance during fieldwork. I sincerely thank Mr. Muhammad Salim Sulaiman for giving me important
information and experts contacts in Zanzibar.
To all the community members in the informal settlements of Zanzibar, who happily and willingly shared
with me every bit of information and knowledge I enquired, without which this research would not have
been complete. To all I say, thank you very much indeed.
Thanks to all my fellow UPM colleagues and friends (2009-2011), all over the world you came, and for 18
months we shared our diverse cultures and bonded into a small global family. The precious memories of
the time-shared with this family will remained etched in my mind for a long time to come.
Finally, special and sincere thanks to my beloved family, your prayers, and love I cherish most.
Mathenge Mwehe
March 2011, Enschede, The Netherlands,

iii
TABLE OF CONTENTS
Abstract ............................................................................................................................................................................ i
Acknowledgements ....................................................................................................................................................... ii
List of figures ................................................................................................................................................................. v
List of tables .................................................................................................................................................................. vi
List of Maps ..................................................................................................................................................................... i
1. Introduction ........................................................................................................................................................... 1
1.1. Informal urbanization and the resultant challenge of infrastructure provision ...............................................1 1.2. Urbanization in Zanzibar ...........................................................................................................................................1 1.3. Approaches to providing public infrastructure in the informal areas ................................................................2 1.4. Research Problem and justification ..........................................................................................................................2 1.5. Research objectives and questions ...........................................................................................................................4 1.6. Thesis structure ............................................................................................................................................................5
2. An integrated approach to urban water supply and infrastructure provision ............................................. 7
2.1. Meeting water security needs for the increasing urban population ....................................................................7 2.2. Water resource planning and management approaches .......................................................................................7 2.3. Dimensions of urban water infrastructure planning ......................................................................................... 12 2.4. Principles guiding planning of urban water infrastructure supply ................................................................... 16 2.5. Incorporating the public participation within water infrastructure planning dimensions .......................... 17
3. Urban water supply planning and management in Zanzibar ...................................................................... 21
3.1. Existing policy and institutional frameworks in water provision planning .................................................... 21 3.2. ZAWA planning and management strategies in addressing urban water supply ......................................... 22 3.3. Weakness of ZAWA urban water supply management practices ................................................................. 24
4. Case study area, Stone town, Zanzibar........................................................................................................... 27
4.1. Background to the study area, Zanzibar town ................................................................................................... 27 4.2. Criteria used in choosing the study sites .............................................................................................................. 29 4.3. Case study site A (Formal settlement) .................................................................................................................. 30 4.4. Study site B (Informal settlement) ......................................................................................................................... 31 4.5. The urban water supply situation of zanzibar town ........................................................................................... 32
5. Methodological framework for integrating local knowledge in water supply planning ......................... 35
5.1. Introduction .............................................................................................................................................................. 35 5.2. Local knowledge and scientific knowledge in the perspective of water supply ............................................ 35 5.3. Integrating the two knowledge systems using geographical information technology .................................. 36 5.4. Linking water supply planning with GIS .............................................................................................................. 38 5.5. Conceptual framework for integration of LK and SK into urban water supply planning .......................... 39 5.6. The approach, tools and methods used to collect LK during fieldwork in Zanzibar .................................. 41 5.7. Fieldwork data collection preparation .................................................................................................................. 45
6. Local knowledge on water supply and service situation in the study area................................................ 51
6.1. Criteria for assessing the water supply situation ................................................................................................. 51 6.2. Technical dimension: Water availability in the study area ................................................................................ 52 6.3. Economic dimension: Willingness to pay for Improved water supply services ............................................ 56 6.4. Environmental dimension: quality of water supply ............................................................................................ 59 6.5. Management dimension: Community involvement in water provision management.................................. 61 6.6. Spatial variation of water service provision in the two study areas ................................................................. 65
7. Integrating Local Knowledge and Scientific Knowledge through GIS to improve water supply
planning in Zanzibar ......................................................................................................................................... 73
7.1. Step 1: Collection of Local Knowledge, ............................................................................................................... 73 7.2. Step 2: Integration of LK using GIS ..................................................................................................................... 74 7.3. Step 3: Linking LK to water supply planning dimensions ................................................................................ 76

iv
7.4. Step 4: Application of LK to improve water supply provision in Zanzibar .................................................. 76 7.5. Step 5: Shifting from conventional planning to participatory water supply planning process ................... 80
8. Conclusion and reccomendation...................................................................................................................... 83
8.1. Overall conclusion .................................................................................................................................................... 83 8.2. Water service provision in the study area............................................................................................................. 83 8.3. Available LK for water service provision............................................................................................................. 84 8.4. Integration of LK and convectional knowledge through GIS ......................................................................... 84 8.5. Limitations of this research .................................................................................................................................... 85 8.6. Reccomendation ....................................................................................................................................................... 85 8.7. Further research ........................................................................................................................................................ 85
List of references ......................................................................................................................................................... 87
ANNEXES .................................................................................................................................................................. 92

v
LIST OF FIGURES
Figure 1-1 Research questions ..................................................................................................................................... 4
Figure 2-1 Schematic representation of integrated water management resource ............................................. 10
Figure 2-2 Three pillars of IWRM. .......................................................................................................................... 10
Box 2-3: Instruments of water demand management .......................................................................................... 12
Figure 2-4 Dimension of urban infrastructure management ............................................................................... 13
Figure 4-1 Population growth trend in Zanzibar .................................................................................................. 28
Figure 4-2 Settlement pattern within the formal settlement area ....................................................................... 31
Figure 4-3 Settlement pattern within the informal areas ...................................................................................... 32
Figure 5-1 A conceptual framework for integrating LK with SK into urban water supply planning ........... 40
Figure 5-2 Component of a GIS-based household interview design and preparation .................................... 43
Figure 6-1: Main sources of water for households ................................................................................................ 52
Figure 6-2: Time taken to travel to nearest water source by households .......................................................... 52
Figure 6-3: Household connection to piped water ............................................................................................... 53
Figure 6-4: Household connection to piped water versus daily water availability ........................................... 53
Figure 6-5: Alternative source of water when piped water is not available ....................................................... 54
Figure 6-6 Households satisfaction with ZAWA services ................................................................................... 57
Figure 6-7 Households willingness to pay for improved water services ........................................................... 58
Figure 6-8 Customer service satisfaction versus willingness to pay ................................................................... 59
Figure 6-9 Community involvement by ZAWA .................................................................................................... 61
Figure 6-10 Local community cooperation ............................................................................................................ 61
Figure 6-11 Reporting of water problems .............................................................................................................. 62
Figure 7-1 A flow chart showing steps of integrating LK and SK in GIS database ........................................ 75
Figure 7-2 Emerging framework for integrating “LK + local community” into a participatory water supply
planning ........................................................................................................................................................................ 80

vi
LIST OF TABLES
Box 2:1 The Dublin principles of integrated water resource management. ...................................................... 11
Box 2:2 Methods and techniques of participation ................................................................................................. 18
Table 3:1 Strategies aimed at improving the technical dimension of water supply .......................................... 23
Table 3:2 Strategies aimed at improving socio-economic dimension of water supply .................................... 23
Table 4:1 Land use categories of Zanzibar town ................................................................................................... 28
Table 5:1Contacted people during fieldwork .......................................................................................................... 45
Table 6:1 LK collected during fieldwork and categorised into four dimensions of urban water supply ...... 51
Table 6:2 Number of people diagnosed with various diseases ............................................................................ 60
Table 6:3 Levene‟s test of homogeneity of variances ............................................................................................ 72
Table 6:4 Showing the ANOVA statistics ............................................................................................................... 72
Table 7:1 LK and spatial datasets used in the integration process ...................................................................... 75
Table 7:2 Various ways in which LK can be used in the water planning and management process ............. 76

i
LIST OF MAPS
Map 4:1 Location of Zanzibar town in the national context............................................................................... 27
Map 4:2 Location of the two-study site within Mjini Magharibi District .......................................................... 29
Map 5:1 Random selection of households for questionnaire administration ................................................... 44
Map 6:1 Transect walk route showing alternative community water sources in the informal settlement ... 56
Map 6:2 Daily water availability in the Informal settlement ................................................................................ 68
Map 6:3 Household connections to piped water in the Informal settlement ................................................... 68
Map 6:4 Household service satisfactions in the informal settlement ................................................................. 68
Map 6:5 Willingness to pay for water if services are improved in the informal settlement area ................... 69
Map 6:6 Time taken to travel to nearest water source .......................................................................................... 69
Map 6:7 Quality of water in the informal settlement ............................................................................................ 69
Map 6:8 Household connections to piped water in the formal settlement ....................................................... 70
Map 6:9 Daily availability of water in the formal settlement .............................................................................. 70
Map 6:10 Household service satisfactions in the formal area ............................................................................. 70
Map 6:11 Willingness to pay for water if services are improved in the formal area ........................................ 71
Map 6:12 Time taken to travel to the nearest water source in the formal area ................................................ 71
Map 6:13 Quality of water in the formal area ........................................................................................................ 71


INTEGRATING LOCAL KNOWLEDGE IN PLANNING AND MANAGEMENT OF WATER SUPPLY PROVISION IN THE INFORMAL SETTLEMENT OF STONE TOWN,
ZANZIBAR
1
1. INTRODUCTION
This chapter provides the background information about informal urbanization and the resultant
challenge of urban infrastructure service provision. From this background, the research problem and
knowledge gap are defined.
1.1. Informal urbanization and the resultant challenge of infrastructure provision
According to UN-Habitat (2006a), among the key challenges resulting from rapid urbanization in
developing countries is how to provide adequate level of public infrastructure and services for the
increasing urban population. This challenge is compounded by the fact that most of this rapid
urbanization is taking place informally (UN-Habitat, 2006b). Indeed, many of the problems within slums
and informal settlements can be linked to lack /inadequacy of one or more of public infrastructure and
utilities (UN-Habitat, 2006c). Problems of inadequate water supply, poor sewerage disposal, uncollected
solid waste, poor drainage system, illegal development of land, proliferation of informal housing without
adequate provision of basic infrastructure facilities and services (Abbott, 2002a; Akatch & Kasuku, 2002;
Hasan, 1998; Scholz, 2008; Srinivas, 2010; UN-Habitat, 2006c; WorldBank, 2010) are some of the many
informal settlement dwellers face.
Many reasons can be attributed to this; weak planning by-laws, poor urban governance, inefficient
management practices, and inadequate financial resources (UN-Habitat, 2006c). In the case of inadequacy
water supply to the urban households, the situation is exacerbated by increasing global climatic changes
and environmental degradation (WHO/UNICEF, 2006) and the ever increasing competing demands for
water from other sectors of the urban economy (Biswas & Uitto, 2002; Grey & Sadoff, 2006; Gumbo,
2004; Maganga, Butterworth, & Moriarty, 2002; Rogers, Radhika, & Bhatia, 2002).
Another augment explaining the poor performance of and inadequacy of public infrastructure utilities and
services is that the consumers of these services have been largely ignored by the local authorities and
utility companies (Sanders, 1990; Stubbs, Lemon, & Longhurst, 2000; UN-Habitat, 2006a; Winayanti &
Lang, 2004). For a long time, communities have just been silent recipients without being offered a chance
by professionals in contributing to the planning and management of utility service provision and
management. They are also unable to make their voices heard with decision-makers since they are
disempowered.
1.2. Urbanization in Zanzibar
Unguja Island, Zanzibar is experiencing rapid urbanization (Sulaiman & Ali, 2006). With just a total area
of 2,654 square kilometres, it has been experiencing a high urban growth rate of about 4% per annum
(ZSGRP, 2007) as compared to mainland Tanzania with a total area of 947, 087 square kilometres with
almost the same urban growth rate of about 4.6 % per annum between 2005 and 2010 (NBS, 2011). The
urbanized areas of Zanzibar covers an area of approximately 1,600 hectares and are approximated to be
three times bigger than the official town boundaries (Murage, 2008). This rapid urban sprawl being
experienced in Zanzibar town has led to the town extending even beyond its jurisdictional boundaries of
its master planning areas (GOZ, 2008a; Haji, Azzan, & Ufuzo, 2006; Scholz, 2008; Sulaiman & Ali, 2006).
This is happening at the backdrop of government‟s weak statutory urban planning frameworks. According
to Zanzibar urban services project report (2008a) “the city does not have a physical development plan
which has led to large areas of the Zanzibar Municipal Council‟s (ZMC) physical development to take

INTEGRATING LOCAL KNOWLEDGE IN PLANNING AND MANAGEMENT OF WATER SUPPLY PROVISION IN THE INFORMAL SETTLEMENT OF STONE TOWN,
ZANZIBAR
2
place in unplanned, poorly accessed yet dense locations”. This is compounded by the government
reluctance to officially recognise informal settlements as an integral or equal part of the town development
(Sulaiman & Ali, 2006; UN-Habitat, 2006c).
Zanzibar Island is among the most densely populated countries in Africa with a population density of 400
persons/ sq. km and a total population of 984,625 (Census_2002). In the mainland Tanzania, the
population density is just 38 persons/km2 but with a population of 33,461,849 people as of 2002 (NBS,
2010), whereas neighbouring Kenya have a population density of about 54 persons/sq. km2 with a
population of about 33 million in the same year (CBS, 2010). From the two islands that make Zanzibar,
Unguja with a population of 622,459 (63%) is the most populated while Pemba with 362,166 (37%)
inhabitants ranks second (ZSGRP 2007: quoting Population and Housing Census 2002). Out of this
population, 40% lived in urban area and the remaining 60% settled in rural areas in 2002. This overall
population growth is attributed to high fertility rate of 5.3% per annum (ZSGRP, 2007).
1.3. Approaches to providing public infrastructure in the informal areas
Various approaches have been employed in addressing the challenges of inadequate infrastructure and
service provision within the informal settlements. Many literatures advocate for settlement upgrading
interventions as a remedial measure to providing public infrastructure and services (Abbott, 2002b;
Marcus & Asmorowati, 2006; Mukhija, 2002; Turkstra & Raithelhuber, 2004; WorldBank, 2010) like water
supply and sanitation, roads, electricity, solid waste, wastewater management and street lighting. UN-
habitat have been in the forefront of advocating for a participatory and targeted provision and or
improvement of basic infrastructure within these settlements (UN-Habitat, 2006c). Cities Alliance calls for
an integrated approach in improving the „physical, social, economic, organizational, and environmental
improvements. World Bank (2010) lays emphasis on legalizing and „regularizing‟ the housing in situations
of insecure or unclear tenure that in principle should be accompanied by provision of basic services such
as clean water supply and adequate sewage disposal in order to improve the well-being of the community
at the centre of the intervention.
1.4. Research problem and justification
Many informal settlements are confronted by lack of adequate public utility like water and sanitation
infrastructure (UN-Habitat, 2006a; WHO/UNICEF, 2006). Indeed, in the rapidly urbanizing areas of
developing countries, the demand for water has exceeded the local authorities‟ capacity to supply clean
and adequate water supply. Zanzibar informal areas are not an exception and have been grappling with
problems of inadequate water infrastructure supplies, wastewater management, and basic sanitation
(Scholz, 2008; Sulaiman & Ali, 2006). About 25% of urban residents and 49% of rural residents have no
access to clean and safe water within 400 meters according to estimates contained in Zanzibar Strategy for
Growth and Reduction of Poverty Report (ZSGRP, 2007). This situation is aggravated further by
continued degeneration and densification of previous planned neighbourhoods (Scholz, 2008), thereby
constraining the capacity/performance of existing water supply infrastructure. Moreover, the continued
use of the outdated master plans adopted from the colonial days has failed to accommodate the intricacy
of dynamic urbanization and the resultant problem of infrastructure provision in Zanzibar today (Myers,
1996; Scholz, 2008).
Zanzibar has a thriving informal sector that has to a large extent shaped the character and form of
informal development (Scholz, 2008; Wehremann, 2002). However, the government has largely ignored
this sector (Scholz, 2008; Sulaiman & Ali, 2006; Wehremann, 2002) and neither legally recognizes it nor
accommodates it. This is affirmed by Sulaiman & Ali (2006) who states that the Zanzibar government has
treated informal settlement with hostility and often failed to enact any policy that would lead to their
official recognition, and hence the failure to tap the knowledge these communities face. The lack of their
INTEGRATING LOCAL KNOWLEDGE IN PLANNING AND MANAGEMENT OF WATER SUPPLY PROVISION IN THE INFORMAL SETTLEMENT OF STONE TOWN,
ZANZIBAR
3
official recognition, according to UN-Habitat (2006c), lead to marginalization of informal areas in terms
of service infrastructure provision. With inefficient and overwhelmed municipal and public services, local
governments and public institutions are hard pressed to provide basic services to low-income settlements.
Many studies (Ahamed, et al., 2009; Chambers, 2006; Close, 2003; Elmes, et al., 2005; Elwood, 2002;
Ferreyra, 2006; Kyessi, 2005; McCall, 2003; Peters, 2008; Rambaldi, Muchemi, Crawhall, & Monaci, 2007;
Sedogo, 2002) shows that the knowledge local resource users possess can supplement scientific knowledge
in resource planning and management strategies. However, in Zanzibar and other developing countries,
water supply provision and planning decisions have heavily relied on scientific/convectional knowledge as
the primary source of water resource management while largely ignoring the local knowledge (LK)
communities and consumers of water possess (Close, 2003). The communities‟ knowledge, which largely
relies on local innovativeness and inventions, and the experience gained from prolonged exposure to the
local environmental dynamics, can play a greater role in supplementing the demand for such services as
water, sanitation, waste disposal, drainage in the informal settlements areas (UN-Habitat, 2006c; UN-
Millennium-Project, 2005a; WorldBank, 2010). The communities usually convert the weakness and
ineffectiveness of local authorities service delivery it into a market opportunity (Srinivas, 2010). Poor
infrastructure and service provision is also attributed to the failure of local authorities to involve the
communities in decision-making processes, yet it has been found out that communities possess valuable
local skills and knowledge that can be useful in planning, implementing, and managing of public utilities
(Ha, 2001; Okpala, 1999; UN-Habitat, 2006c; UN-Millennium-Project, 2005a; WorldBank, 2010; Yabes,
2000).
A need arise as to how urban authorities and other utility providers can recognise, elicit, and tap the local
knowledge base and build on it instead of relying solely on scientific knowledge in planning and
management of such utilities. There is also need to adopt an integrated approach in public utility
management that combines inputs, views, opinions and knowledge from all stakeholders (Bertrand-
Krajewski, Barraud, & Chocat, 2000; Biswas & Uitto, 2002; UN-Habitat, 2009; UN-Millennium-Project,
2005b; World_Bank, 2006). This can greatly help in addressing the competing demands for water
especially for the urban poor who are greatly disadvantaged in competing with other users in various
sectors of the urban economy.
To ensure efficient, affordable and high-quality water supply and service provision as envisioned in the
Zanzibar Development Vision 2020 and ZSGRP there is a need to devise ways and mechanism through
which local communities can participate in developing interventions aimed at addressing water supply
problems. This is because local people know better the problems they face and are well versed with the
knowledge of local micro-environments in which they live in (Dunn, 2007; McCall, 2003; Rambaldi, 2006).
Indeed, local knowledge can be used as an entry point for promoting people‟s participation with
government authorities and other institutions. This knowledge becomes vital for the planners and decision
makers while planning, and designing programmes for public utilities provision. As Otiso (2003) and UN-
Habitat (2006c) acknowledge, good urban management policy choices for empowering and uplifting the
poor are best made when local authorities and communities work together and are guided by sound data
and evidence-based analysis.
The development of GIS technology has introduced new and more efficient tools and methodologies for
collecting and analysing local spatial and non-spatial knowledge and for incorporating of this knowledge in
participatory spatial planning. This comes at a time when the policy makers, governments and
developmental organizations are increasingly advocating for a paradigm shift from the traditionally
“planning for the public” to more recognition of the local-based “planning with the public” interventions,
and the important this has to the sustainability of such programmes (Foresster, 1999; Pettit, Keysers,

INTEGRATING LOCAL KNOWLEDGE IN PLANNING AND MANAGEMENT OF WATER SUPPLY PROVISION IN THE INFORMAL SETTLEMENT OF STONE TOWN,
ZANZIBAR
4
Bishop, & Klosterman, 2008). Sulaiman & Ali (2006) points out that it is high time local authorities in
Zanzibar accepted the important role informal settlements dwellers play and therefore need to partner and
support the local people in their attempt at improving their livelihoods.
1.5. Research objectives and questions
1.5.1. Objectives
This study focuses on using local knowledge (LK) to improve urban water supply planning decisions in
Zanzibar. With this regard, three objectives were formulated:
1. To find out the prevailing situation of water supply and infrastructure provision in the informal
settlement and the challenges facing water service provision.
2. To identify, elicit, and collect local spatial and non-spatial knowledge households of informal
settlements poses in regards to water service and infrastructure provision.
3. To find out how this local knowledge can be integrated with the scientific knowledge using GIS
in order to improve water supply provision planning in the informal areas.
1.5.2. Research Questions
Research Objectives
Research Questions
Objective 1:
To find out the prevailing situation of water
service and infrastructure provision in the
informal settlement and the challenges
facing water service provision.
1. What are the water demands for households within
the informal settlements?
2. What is the existing situation of water supply and
infrastructure provision in meeting the household
demand for water in the informal settlement of Stone
town?
3. What challenges do communities and water service
providers face in accessing and providing water service
infrastructure?
Objective 2:
To identify, elicit, and collect local spatial
and non spatial knowledge households of
informal settlements poses in regards to
water service and infrastructure provision
5. What local knowledge does communities living in
informal settlements poses concerning water service
provision?
6. How can this local knowledge be elicited and
collected in a way useful to urban decision makers
Objective 3:
To find out how this local knowledge can be
integrated with the scientific knowledge
using GIS in order to improve water supply
provision planning in the informal areas.
7. How can GIS be used to integrate local knowledge
with the scientific knowledge in planning for water
provision.
8. How can this knowledge be used to improve water
supply planning and management in Zanzibar Figure 1-1 Research questions

INTEGRATING LOCAL KNOWLEDGE IN PLANNING AND MANAGEMENT OF WATER SUPPLY PROVISION IN THE INFORMAL SETTLEMENT OF STONE TOWN,
ZANZIBAR
5
1.6. Thesis structure
Chapter 1 provides the background information about informal urbanization and the resultant challenge
of urban infrastructure service provision. From this background, the research problem and knowledge gap
are defined.
Chapter 2 gives a detailed theoretical foundation of this research by reviewing literatures on traditional and
modern approaches to water resource planning and management. It specifically focuses on integrated
water resource management frameworks and how it is applied within the urban water supply and
infrastructure planning. Also discussed is the rationale of local community participation in planning
Chapter 3 explores how water supply planning and management is carried out in Zanzibar. Specifically, it
analyses existing policy and institutional frameworks guiding water supply management in Zanzibar and
planning strategies ZAWA undertake to meet water demands
Chapter 4 describes the study area. It presents a brief analysis of the socio-economic and spatial
characteristic of the two settlements and the state of urban infrastructure condition in the sites. It also
highlights criteria used to choose the two study sites.
Chapter 5 conceptualizes the integration of LK and SK by developing a GIS-based methodological
framework for integrating the two knowledge bases. It also presents the methods, tools, and approaches
that were employed to collect LK during fieldwork.
Chapter 6 provides the results of the LK and SK gathered through the application of various methods;
household questionnaire survey, experts‟ discussions, focused discussion groups and physical observation
made during the transect walk survey. Also presented are the maps from spatial interpolation of LK.
Chapter 7 discuss the integration of LK and SK using the framework developed in chapter 5. Based on
this it further discuss how LK collected in Zanzibar can be applied within each step of the framework to
improve water supply planning and management decisions.
Chapter 8 gives the conclusion of this research. In addition, it highlights the limitations of this research,
gives recommendations, and proposes further research.


INTEGRATING LOCAL KNOWLEDGE IN PLANNING AND MANAGEMENT OF WATER SUPPLY PROVISION IN THE INFORMAL SETTLEMENT OF STONE TOWN,
ZANZIBAR
7
2. AN INTEGRATED APPROACH TO URBAN WATER SUPPLY AND INFRASTRUCTURE PROVISION
This chapter gives a detailed theoretical foundation of this research by reviewing literatures on traditional
and modern approaches to water resource planning and management. It specifically focuses on integrated
water resource management frameworks and how it is applied within the urban water supply and
infrastructure planning. Also discussed is the rationale of local community participation in planning.
2.1. Meeting water security needs for the increasing urban population
Attaining water security for the urban population especially the urban poor is a major challenge for urban
managers and indeed a top agenda and priority set by many development organizations. In the second
World Water Forum held at The Hague in 2000, countries represented committed themselves to ensuring
that water security for their citizens is met. On the other hand, the millennium development goal 7C
aspires to halve the proportion of urban people without access to potable water by 2015 (UN-Habitat,
2006b, 2006c). Water security in this essence is defined as” the reliable availability of an acceptable
quantity and quality of water for production, livelihoods, and health. Below this set out platform “the
society and the economy are not resilient to the impacts of unreliable water for production or
livelihoods”(David & Sadoff, 2005.). Therefore, every person is entitled access to enough safe water at an
affordable cost to lead a healthy and productive life. This is set as the minimum platform for every water
institution and infrastructure should meet. In this regards, water scarcity becomes a major obstacle to
growth. If this minimum level is not achieved, the society is vulnerable to unpredictable water-related
impacts and its resilience to such setbacks are jeopardized (David & Sadoff, 2005.).
2.2. Water resource planning and management approaches
Planning for water resources encompass water in all its uses and across all sectors. Factors affecting water
resources in all these sectors should be put into consideration while planning. In meeting the basic water
security for every household, there is need to devise and embrace adaptation mechanisms to climatic
change variability since water is a finite resource if not used sustainably. The best strategy that incorporate
all these issues is seen as the adoption of better economic management (sustainable abstraction, use, and
consumption patterns) and integrated management approaches of the available water resources.
2.2.1. Convectional/traditional water planning and management approaches
Traditional (engineering oriented) approaches to water infrastructure management have generally tended
to advocate for application of technical solutions to meet water demand. They rely heavily on the supply
side “predicting and providing” of service provision (Guy & Marvin, 1995).Within these approaches,
increased demands are most often met through supply oriented options like construction of new water
supply lines or sinking new wells to meet the water demand (Kolokytha, Mylopoulos, & Mentes, 2002).
Additionally they rely heavily on forecasts from other ministries, sectors, private consultants from which
they base their planning decisions. These forecasts are most often unreliable and inaccurate (Guy &
Marvin, 1995) since these organizations have no direct link and appropriate knowledge on water resource
management. This results in plans, policies and programmes being formulated that are not able to balance
the “demand and supply” of water. Indeed, in countries where they over rely on these methods, they have
not been able to meet the demand for water with many urban households having large unmet demand. It
is out of this concern that has led to water providers to think of other better management approaches

INTEGRATING LOCAL KNOWLEDGE IN PLANNING AND MANAGEMENT OF WATER SUPPLY PROVISION IN THE INFORMAL SETTLEMENT OF STONE TOWN,
ZANZIBAR
8
that can be able to address all these issues (demand, supply, users, availability of resources) concurrently
when planning for water provision programmes.
On the other hand, the traditional approaches are centralist in nature where water resource planning has
traditionally been carried out at national level. This is where all the decisions about needs/demand
assessment, economic feasibility of water programmes, financial resource allocation, and prioritization of
the water recipient beneficiaries were carried out. Feasibility of individual projects or programmes to
supply these services to the intended beneficiaries was also determined at national level. This was done
without multi sectoral involvement and usually without involving much views and opinions of other
sector professionals. This trend is gradually changing as Snellen & Schrevel (2004) observe,
“environmental, social, and cultural objectives are increasingly being integrated into all levels of planning.”
Engineering-oriented measures are not likely to bring the desired improvement in water service planning
unless they are accompanied by secondary measures affecting other aspect of water resource use (Snellen
& Schrevel, 2004). The intricacy is that many developing countries still have poor water physical
infrastructure and insufficient institutions with which to manage water. Challenges also exist on how to
integrate different objectives and timeframes from different sectors and actors due to weak institutional
base and weak vertical and horizontal coordination among various sectoral departments in many
developing countries.
Unfortunately, these traditional approaches to water management continue to be used in many African
countries as Grey & Sadoff (2006) observe, “Many developing countries, find their physical infrastructure
stocks to be inadequate and therefore see an overarching imperative to invest in new water infrastructure
in an attempt to reduce the destructive costs and increase the productive value of water in their
economies”. Where such infrastructure investments are made, they may only provide little return and
leave many urban poor grappling with water problem since they only address one side of water
management. On the onset, such engineering oriented management approaches can be used in providing
for water infrastructure especially where no such physical infrastructure exist (Aketch, 1992) but they
should not be extended as management tools.
In recent years, these approaches have received much criticism for their narrow scope and rigidity
especially their inability to handle foreseeable changes in water demand more so in urban areas where
urbanization is happening fast. For example, the increasing urbanization has resulted in unprecedented
population concentration in small areas (slums and informal areas) that generate enormous demand per
square area. With use of such methods, they fail to cater for such phenomena and associated complexity
of informal settlement dynamism. Within urban settlements, there are complex, dynamic social-cultural,
economic, and political systems that continually undergo changes (Magigi & Majani, 2006) that need to be
factored in when planning for urban infrastructure provision. This renders the engineering-oriented
approach quite ineffective in addressing the complex and multifaceted problems being experienced in the
urban areas. The traditional water planning approaches are thus seen as fragmented, sectoral, supply-
driven augmentation, uncoordinated development that is inadequate to meet global challenges. In addition
they rely on top-down management, and lack demand management strategies (Kolokytha, et al., 2002).
They are clearly not sufficient and hence the need for better approaches to manage water provision
(Kolokytha, et al., 2002)
INTEGRATING LOCAL KNOWLEDGE IN PLANNING AND MANAGEMENT OF WATER SUPPLY PROVISION IN THE INFORMAL SETTLEMENT OF STONE TOWN,
ZANZIBAR
9
2.2.2. Integrated approaches to water planning and management
Integrated Water Resources Management (IWRM) is a participatory planning and implementation process
that brings stakeholders together to determine how to meet society‟s long-term needs for water while
maintaining essential ecological services and economic benefits (USAID, 2006). Within the IWRM
approach, planning for and management of water resources entails addressing various dimensions;
engineering, social-economic, ecological, quantitative and qualitative aspects, and supply and demand
management (Savenije & Van der Zaag, 2008). According to Savenije (2008), the approach calls for a
consistent and effective planning process. It also advocates for the adoption of an effective decentralized
system where solution to the problem of water supply are determined at the community level (WSAA,
2010).
Integrated water resource management is thus defined as „a process which promotes the co-ordinated development
and management of water, land and related resources, in order to maximize the resultant economic and social welfare in an
equitable manner without compromising the sustainability of vital ecosystems‟ (Global_Water_Partnership, 2006). It is
therefore a problem solving approach that address key water challenges in ways that are economically
efficient, socially equitable, and environmentally sustainable (Global_Water_Partnership, 2006). It offers
mechanism with which to create and implements comprehensive resource management plans from insight
and knowledge of diverse stakeholders of various disciplines in order to devise and implement efficient,
equitable and sustainable solutions to complex and multifaceted water problems
(Global_Water_Partnership, 2006; Snellen & Schrevel, 2004). It also calls for a balance in competing
demands from difference water users and sectors.
Some of the principal components of IWRM as listed by (USAID, 2006) includes;
Optimizing supply. Assessing surface and groundwater supplies, analyzing water balances,
adopting wastewater reuse, and evaluating the environmental impacts of water distribution and
use.
Managing demand. Adopting cost recovery policies, utilizing water-efficient technologies, and
establishing decentralized water management authorities.
Providing equitable access to water resources through participatory and transparent governance
and management. This may include support for effective water users‟ associations, and
consideration of gender issues.
Establishing improved and integrated policy, regulatory, and institutional frameworks. Examples
are implementation of the polluter-pays principle, water quality norms and standards, and market-
based regulatory mechanisms.
Utilizing an inter-sectoral approach to decision-making, where authority for managing water
resources is employed responsibly and stakeholders have a share in the process.
IWRM emphasize the importance of supply providers to engage all the sectors (Snellen & Schrevel, 2004)
concerned (Figure 2-1) including the urban planning managers, environmentalist, housing developers,
politicians, private sector, and NGO‟s in the management of water service provision. The water supply
providers are also required to engage the consumers of water in order to address their demand efficiently.
However, pooling all these together is not an easy task especially in the volatile political situations that
characterize many developing countries and therefore political good will must also be sought. Instruments
like water pricing policies, public participation and awareness, economic incentives, legislative and
institutional instruments are seen as supplementary remedy to the weaknesses of traditional water demand
management approaches (Kolokytha, et al., 2002; Mohamed & Savenije, 2000).

INTEGRATING LOCAL KNOWLEDGE IN PLANNING AND MANAGEMENT OF WATER SUPPLY PROVISION IN THE INFORMAL SETTLEMENT OF STONE TOWN,
ZANZIBAR
10
Figure 2-1 Schematic representation of integrated water management resource
Adapted from (Snellen & Schrevel, 2004)
IWRM is supported by three main pillars (Hassing, Ipsen, Clausen, Larsen, & Lindgaard-Jørgensen, 2009);
first, having in place an enabling environment that is supported by policy instruments and legislative
instruments for sustainable water resources development and management. Second, having institutional
framework through which the policies, strategies, and third, legislation can be implemented and setting up
the management instruments required by these institutions to do their job as illustrated in as Figure 2-2
below.
Economic Efficiency
Management
Instruments
- Assessment- Information- Allocation instruments
Environmental sustainabilityEquity
Balance “ water for livelihood” and “water as a resource”
Institutional
Framework
- Central-local- River Basin- Public-private
Enabling
Environment
- Policies- LegislationStructure
Principles
Figure 2-2 Three pillars of IWRM.
Adopted from (Hassing, et al., 2009)
IWRM is guided by the „Dublin principles‟ which were formulated at the International Conference on
Water and Environment (ICWE) in Dublin, Ireland, in 1992 and adopted by the global community in the
Rio earth summit of 1992. These principles (Box 2:1) calls for a concerted action in order to reverse the
present trends of overconsumption, pollution, and rising threats from drought and floods
(Dublin_Principles, 1992). The Conference advocated for fundamental new approaches in the assessment,
development, and management of freshwater resources. This, it was argued, can only be brought about
through political commitment and involvement from the highest levels of government to the smallest
communities.

INTEGRATING LOCAL KNOWLEDGE IN PLANNING AND MANAGEMENT OF WATER SUPPLY PROVISION IN THE INFORMAL SETTLEMENT OF STONE TOWN,
ZANZIBAR
11
Box 2:1 The Dublin principles of integrated water resource management.
The Local Agenda 21 adopted in the Rio summit also echoes the above principles of IWRM by calling
for integrated approaches to the development, management and use of water resources (Snellen &
Schrevel, 2004). Specifically, chapter 18.9 of the Local Agenda 21 calls for an integrated water resources
management and states that there should be an integration of land and water-related aspects in the
management of water resources. As Snellen & Schrevel (2004) points out, management of water resources
and services need to reflect the interaction between these different demands, and a need for closer
coordination within and across sectors in order to address the many cross cutting challenges facing water
service provision and management..
The new approaches also recognise that water availability is closely related to economic growth and
poverty. There has been correlation found between lack of water access and poverty levels of an individual
household. Water availability and reliability is linked on how effective water management policies and
practices of water use within individual sectors are and across other sectors (David & Sadoff, 2005.). This
justifies the need of having crosscutting views when formulating water policies and inclusion of all
stakeholders when carrying out water reforms and infrastructure investments. Decisions regarding
whether water supply and sanitation services are to be provided, their location, cost and reliability, can all
affect the spatial patterns and rates of urban growth that result from water investments (Grey & Sadoff,
Principle No. 1 – Freshwater is a finite and vulnerable resource, essential to sustain life,
development and the environment.
Since water sustains life, effective management of water resources demands a holistic approach, linking
social and economic development with protection of natural ecosystems. Effective management links land
and water uses across the whole of a catchment area or groundwater aquifer.
Principle No. 2 - Water development and management should be based on a participatory
approach, involving users, planners, and policy makers at all levels
The participatory approach involves raising awareness of the importance of water among policymakers and
the public. It means that decisions are taken at the lowest appropriate level, with full public consultation
and involvement of users in the planning and implementation of water projects.
Principle No. 3 - Women play a central part in the provision, management and safeguarding of
water. This pivotal role of women as providers and users of water and guardians of the living environment
has seldom been reflected in institutional arrangements for the development and management of water
resources. Acceptance and implementation of this principle requires positive policies to address women‟s
specific needs and to equip and empower women to participate at all levels in water resources programmes,
including decision-making and implementation, in ways defined by them.
Principle No. 4 - Water has an economic value in all its competing uses and should be recognized
as an economic good. Within this principle, it is vital to recognize first the basic right of all human beings
to have access to clean water and sanitation at an affordable price. Past failure to recognize the economic
value of water has led to wasteful and environmentally damaging uses of the resource. Managing water as
an economic good is an important way of achieving efficient and equitable use, and of encouraging
conservation and protection of water resources.
Source: (ICWE, 1992.)

INTEGRATING LOCAL KNOWLEDGE IN PLANNING AND MANAGEMENT OF WATER SUPPLY PROVISION IN THE INFORMAL SETTLEMENT OF STONE TOWN,
ZANZIBAR
12
2006). Relating all these spatially can contribute to a better understanding of water poverty levels in any
geographical space.
2.2.2.1. Water demand management practices
Water demand management consist of “formulation and implementation of strategies that are aimed at influencing
demand, so as to achieve efficient and sustainable use of a scarce resource”(Savenije & Van der Zaag, 2002).
Accordingly, water demand management focuses more on the end users (water consumers) as opposed to
the supply side of water with an aim to attain equitable allocations and sustainable use of water resource.
Demand management focus more on non-structural measures like economic and legal incentives in order
to influence water consumers behaviour and to create institutional and policy mechanisms that facilitate
this approach (Savenije & Van der Zaag, 2008). They aim at achieving desirable demands and desirable
uses for every person in society. World Bank water resources sector strategy (2004), lay emphasis on three
themes that an effective water demand planning should address; the institutional frameworks (legal,
regulatory, and organizational roles), the management instruments (regulatory and financial), and
maintenance and operation of water infrastructure (including water storage structures and conveyance,
wastewater treatment, and watershed protection). One way to achieve this is by establishing instruments
geared towards stimulating water demand in those sectors experiencing very low water use. The demand
management placed on the water supply networks should be carried out through the implementation of
water efficiency measures and should avoid environmentally and economically expensive supply
investment” (Guy & Marvin, 1995).
Box 2-3: Instruments of water demand management
1. User charges: pricing of water services related to the type of service and the type of water
use. These charges may include demand management charges or subsidies to stimulate
certain behaviour.
2. Quota: setting an upper limit to the amount of water that may be used for a certain
purpose.
3. Licence to use: issuing licenses for water withdrawals or discharges subject to control, and
for a limited period.
4. Tradable water right: the creation of a water market where stakeholders can buy and sell
water rights within a well-defined legal framework
5. Subsidies, grants, soft loans, product charges, tax differentiation, tax allowances, and other
economic incentives to stimulate the allocation of water to certain preferred water uses, or
to make undesirable behaviour less attractive.
6. Penalties: a system of financial and legal enforcement incentives (fines and premiums)
7. Besides these implementation incentives, an important component of demand management
is awareness raising,
Source: (Savenije & Van der Zaag, 2008);
2.3. Dimensions of urban water infrastructure planning
The planning and management of urban water supply infrastructure (Arnold, 2008) requires incorporation
of a wide range of knowledge from various dimensions (technical aspect, socio-economic aspect,
environmental aspect, managerial aspect) as illustrated in Figure 2-4. This knowledge should play a crucial
role at every stage (e.g. situation analysis, design, alternative & choices, implementation, operation and
monitoring) of planning of water supply networks. IWRM dictates a critical evaluation of these aspects in
the life cycle of water supply infrastructure and also and evaluation of their policy implications (Arnold,
2008). The planners of urban water supply according to Arnold (2008), should concerns themselves in;

INTEGRATING LOCAL KNOWLEDGE IN PLANNING AND MANAGEMENT OF WATER SUPPLY PROVISION IN THE INFORMAL SETTLEMENT OF STONE TOWN,
ZANZIBAR
13
• Matching the actual and future demands and supplies
• Ensuring economical, sustainable, and equitable use of the infrastructure facilities and services.
• Conservation of the environmental resources, especially the improvement of resource-efficiency.
• Establishment of self-sustained organization and stakeholder participation.
Figure 2-4 Dimension of urban infrastructure management
Adopted from (Arnold, 2008)
These urban water supply infrastructure dimensions are elaborated below.
2.3.1. Technical dimension of water infrastructure planning
A main component of the technical dimension includes the water distribution system that forms the most
expensive component in the water distribution network. The technical dimension of a water supply system
may be conceptually considered to have five major components (Yehuda, 1997) which includes: supply
source works (2) treatment plant & pumping stations, (3) transmission pipes, (3) storage facilities
reservoirs, and (5) distribution system.
Factors affecting water supply provision within this dimension include the aging of the water supply
infrastructure, deterioration of the pipes usually from the stress resulting from operational and
environmental conditions. The negative externalities resulting from these stresses (Yehuda, 1997)
manifests themselves from increased operation and maintenance costs, water losses and leakages,
reduction in the quality of service and reduction in the quality of water supplied.
2.3.2. Socio-economic dimension of water infrastructure planning
The Dublin principle number 4 state that “water has an economic value in all its competing uses and
should be recognized as an economic good (Dublin_Principles, 1992). Treating water as an economic
good is an important way of achieving efficient and equitable use, and of encouraging conservation and
protection of water resources (Sadoff, Whittington, & Grey, 2002). According to these authors, past
failures to recognize the economic value of water has led to wasteful and environmentally damaging uses
of the resource. However, they argue that it is imperative to first recognize that everyone person is entitled
to have access to clean water since water is a basic right.
The economic efficiency of water use is concerned with (Sadoff, et al., 2002) satisfying the varying and
often competing demands for water (residential, industrial, domestic) in such a way that every member of
the society as a whole derives maximum value from water supplies at reasonably justifiable costs and

INTEGRATING LOCAL KNOWLEDGE IN PLANNING AND MANAGEMENT OF WATER SUPPLY PROVISION IN THE INFORMAL SETTLEMENT OF STONE TOWN,
ZANZIBAR
14
without putting undue pressure on the existing water resources available. The achievement of economic
efficiency in water resource use in the urban areas is a major economic policy aim for urban decision
makers since the goal of urban water authorities is to ensure efficient, and effective, reliable, and equitable
water distribution to every household at affordable prices and that water resources are guarded against the
risk of overexploitation. This requires exploring alternative sources of water at justifiably fair costs in
order to meet the demand of all users. It also addressees how environmental sustainability can be achieved
and how water supply systems can recover operation and maintenance
There are various socio-economic tools for implementing water supply management under this dimension;
1. Water pricing in accordance with the user pays principle (Smith, 2004)
2. User charges for waste water(Smith, 2004),
3. Charging license fees and permits for ground water abstraction to individual and private
companies (Savenije & Van der Zaag, 2008),
4. Giving subsidies and cost-sharing arrangement;
5. Pollution charges and fines in accordance with the polluter pays principle (Rogers, Bhatia, &
Huber, 1998; Rogers, et al., 2002),
6. Progressive increasing block tariffs that can provide a „lifeline‟ supply to the poor at a below-cost
rate (Sadoff, et al., 2002).
These economic instruments can be used to implement policies designed to achieve equity, and
encouraging efficient consumption of waters (Savenije & Van der Zaag, 2008),. One way to achieve this is
by designing these tools in such a way that they both encourage and discourage behaviour, hence
particularly useful in demand management.
2.3.3. Environmental dimension
This dimension entails all those factors that may result in the pollution, destruction, and unsustainable
abstraction of water sources (Taylor, 1981). It therefore addresses how catchment areas, rivers, boreholes
and other water sources may be cushioned from pollution by human activities and other processes and
approaches that may affect the water quality (Ferreyra, 2006). Environmental dimension is a complex
water management issue that is influenced by the interplay of multiple stakeholder perspectives and other
dimensions of water supply (Ferreyra, 2006; ICWE, 1992.; Savenije & Van der Zaag, 2002). The water
providers are required within the IWRM to engage all the relevant stakeholders (Close, 2003; Savenije &
Van der Zaag, 2002) in addressing these issues when designing water supply system in order to ensure
economic productivity and sustainability of water sources. Environmental dimension cuts across all other
dimensions since it result from the interplay of a whole range of different.
According to Rogers et al., (2002), there are various negative externalities within this dimension that bring
added cost to water provision planning which may results from, reservoir construction, abstraction of
groundwater for major urban centres, pollution of the water supply resulting in health problems of the
households. Water supply pollution may also cause economic externality which may result from pollution
from upstream that causes increased production/consumption costs to the users at downstream. Such
construction externalities can be mitigated by high standards of water supply construction and
management (Rogers, et al., 1998).
Policies to reduce the negative externalities within the environmental dimension that water supply
providers can implement includes; charging water abstraction taxes (Smith, 2004), imposing taxes on
water polluters and effluent discharges (Rogers, et al., 1998; Rogers, et al., 2002), formulating plans to
protect the water catchment areas (ICWE, 1992.), engaging the communities in the protection of these
areas(Close, 2003).

INTEGRATING LOCAL KNOWLEDGE IN PLANNING AND MANAGEMENT OF WATER SUPPLY PROVISION IN THE INFORMAL SETTLEMENT OF STONE TOWN,
ZANZIBAR
15
2.3.4. Management dimension
Better urban water supply management approaches call for water providers to promote five key principles
of management; equity, efficiency, participatory decision-making, sustainability and accountability
(Nichols, Stewart, & Hippel, 2000.). On the other hand, the cost of water distribution system (Rogers, et
al., 1998; Rogers, et al., 2002; Smout, Kayaga, & Muñoz-Trochez, 2008) is comprised of all direct, indirect
and social costs that are associated with:
Capital investment in system design
Input cost for managing and operating distribution systems and treatment plant
Installation and upgrading,
Operation and maintenance costs associated with the daily running of the water supply
system like electricity for pumping, labour, repair materials.
Monitoring and system maintenance - inspection, breakage repair, rehabilitation
Any water supply system should be able to generate revenue that is able to cater for all these costs. This
can be achieved through setting of tariffs to cover full supply costs. Tariffs are the charges paid by the
users for their water service (Speck, 2006). Consumers should also be engaged by payment of water tariffs
in order to recover some of the costs and finance other water related service. According to Speck (2006),
full financial cost recovery requires integration of a capital cost element into the setting of water tariff
covering future investment costs. However, in determining the water pricing, certain issues must be put
into consideration (Savenije & Van der Zaag, 2002);
• due attention should be given to equity considerations to prevent the weakest people
from carrying too high a burden;
• Poor people, in principle, should be provided with a minimum amount of water free;
however, it is considered more sustainable to ask for a nominal connection fee (within
their ability to pay) or charge a subsidised “lifeline” rate, which gives them a claim on a
proper service.
• those who can pay an economic price (in industries and highly developed urban areas)
should pay a high price and by doing so, cross-subsidize the poorer strata of society;
• the institution responsible for the supply of the water should have sufficient autonomy to
operate and maintain the system adequately and sustainably;
• there should be full cost recovery and preferably reservations for future investments;
• The price should be “reasonable,” allowing for full cost recovery, but in line with the
ability to pay of consumers.
2.3.5. Linking community participation and LK within urban water supply dimensions
Incorporating communities and participatory planning approaches and methods in water supply provision
leads to combination of diverse knowledge, from scientific, local, technical, environmental, and socio-
economic point of views in planning for water service provision. Indeed, it is a good remedy to achieving
the water security for increasing urban population (Bertrand-Krajewski, et al., 2000). Accordingly, putting
into consideration local communities‟ views and opinions in urban water supply planning can help to
mitigate adverse effects and increase chance of success of water supply projects and efforts geared towards
protection of such resources. Their inclusion can enable policy makers to reach decisions that are based
on good reasoning rather than one-sided view decision based on professional view. The recognition of
local processes and knowledge thereof can help in supporting such local community initiatives and also
lead to strengthened local institutions, enhanced people‟s organization capabilities and also development
of self-reliance and confidence within the communities (Mirghani & Savenije, 1995). According to World
Bank (2010), ignoring the traditions, values and social organization of the local people can lead to little
chance of success of such projects. Since the local people know well the local socio-cultural conditions

INTEGRATING LOCAL KNOWLEDGE IN PLANNING AND MANAGEMENT OF WATER SUPPLY PROVISION IN THE INFORMAL SETTLEMENT OF STONE TOWN,
ZANZIBAR
16
and needs (Barry & Ruther, 2005), this knowledge can be used to develop monitoring mechanisms, and
develop strategic responses of dynamic changes in their locality. Local knowledge can be used as an entry
point for promoting people‟s participation with government authorities and other institutions in the
planning process.
In participatory management “the authority and responsibility over the management of water and other
local resources is shared between government and local resource users.” This is in accordance to the
“Dublin principle no. 2 which states, “water development and management should be based on a participatory
approach, involving users, planners, and policy makers at all levels”(Dublin_Principles, 1992). The participatory
approach involves raising awareness of the importance of water among policymakers and the public. It
means that decisions are taken at the lowest appropriate level, with full public consultation and
involvement of users in the planning and implementation of water projects (Dublin_Principles, 1992). In
this type of management, the decision making process is decentralized from the local authorities to the
local communities and consumers of water. According to (Close, 2003) “community-based management
approach can be very effective, specifically when dealing with integrating local knowledge into the management approach as
there is a readily available source of local knowledge input to the management decision process.” This method of
management is widely advocated as it empowers the local communities and gives them forum through
which they can raise their concerns and issues affecting them that can be incorporated into water
management practices.
2.4. Principles guiding planning of urban water infrastructure supply
Planning for water supply and infrastructure provision is a complex process considering all those issues
and dimensions discussed above. This was among the many reasons that led to the formulation of
planning guiding principles to guide the integrated management of water resources. The UN Conference
on Environment and Development (UNCED) of 1992, commonly known as the “Earth summit”
formulated key guiding principles to guide the planning process (Nichols, et al., 2000.). According to the
UNCED, planning for water should be adoptive and resilient to the changing trend of development
priorities in the wake of increasing urbanization under poverty. Although most countries have different
hierarchy of planning processes in the water resource development covering different sectors and
geographic areas, these key guiding principles can be applied across the board regardless of planning
structures existing. Snellen & Schrevel argue that the most important thing is the extent to which the
various planning activities support or influence the decision-making environment and not so much on the
existing hierarchies. However, adaptive capacity – both social and physical – should be enhanced to
protect the poorest and most vulnerable populations (Snellen & Schrevel, 2004). This they state,
necessitates for further transformation of institutions and roles of civil society, government, and the
private sector in the water resource planning area and the need to adopt a planning approach that can
guide to achieve this.
The goal of planning should not only be improving or expanding water access and coverage to residents;
rather it should create better understanding of the cost, benefits and impacts of water resources and
incrementally improve transparency and participation in planning processes (Snellen & Schrevel, 2004;
WSAA, 2010). This then creates awareness to all involved stakeholders about the need for efficient
resource use thereby creating sustainability of human use (expressed in term of expanding people„s range
of choices and opportunities) and that of resource ecosystem sustainability (Snellen & Schrevel, 2004). In
order to accommodate these changes, Snellen & Schrevel stipulates that planning processes should be
much more flexible, fluid and interactive and allow evolving trends, needs and perspectives to be brought
into play.

INTEGRATING LOCAL KNOWLEDGE IN PLANNING AND MANAGEMENT OF WATER SUPPLY PROVISION IN THE INFORMAL SETTLEMENT OF STONE TOWN,
ZANZIBAR
17
2.5. Incorporating the public participation within water infrastructure planning dimensions
LK cannot be entirely divorced from the community who not only own it but also are carriers of it. It is
imperative then that urban water supply providers intending to use it should involve them in planning.
Any discussion about eliciting, collecting, and using LK to improve water supply planning would be
incomplete without mentioning how the local communities can be incorporated in planning activities. This
section serves that purpose.
Participatory planning calls for the direct involvement of ordinary people in the planning process in order
to empower them to solve problems that affect their daily lives (Chambers, 2006; United_Nations, 2003).
Participation may broadly be defined as “a process in which stakeholders influence policy formulation,
alternative designs, investment choices and management decisions affecting their communities, and
establish the necessary sense of ownership (Gardiner, 1995 as quoted by Okello, Oenga, & Chege, 2008).
Anstern (1969) defines the concept of public participation as a form of citizen power “the redistribution
of power that enable the have-not citizens, presently excluded from the political and economic processes,
to be deliberately included ”. The commitment that is created by participation leads to significant
empowerment of those who at present have little control over the forces that condition their lives
(Mbilinyi & Rayani, 2010). According to United Nations (2003), Participation may occur in various forms;
group interaction, problem solving, and outreach to involve a diverse range of people in the society as
possible in the research process.
Participation in planning and management of urban facilities and resources (Okello, Oenga, & Chege,
2008) is seen as a positive step towards addressing the disparities between the increasing demand and the
short supply. As Ibem (2009) states, people are capacitated, out of their own free will and initiative, to
participate in the tasks of identifying and prioritizing their needs with or without external assistance. In
participatory processes, there is a deliberate focus on action on the information that is generated from the
process (Sieber, 2006; Yabes, 2000). The citizens not only get a chance to voice on those issues that affect
them but also are empowered, enabling them to develop skills and abilities to become more self-reliant,
and to make decisions and take actions on finding solutions to those problems (Sieber, 2006; Yabes,
2000). It „„changes the fundamental position of people from being viewers and spectators to that of active agents of
development and progress” (Arnstein & Sherry, 1969). They therefore gain significant influence in being part of
the change process and if such interventions becomes successful communities gain confidence in their
ability to address future intervention with the same success (Mbilinyi & Rayani, 2010). In the urban
infrastructure provision, communities may contribute in terms of offering free labour, time and money to
improve those urban services that the government many not have enough resources to provide them.
2.5.1. Methods and techniques of engaging the public to participate in planning
There are different methods and techniques of engaging the communities in planning activities. Excerpts
from a United Nation publication on “guide to the application of public participation in planning and
policy formulation” list these methods to include focus group discussions, community forums, social
survey, consultative forums, and partnership among others. Some of these are explained in Box 2:2. In
achieving the objectives of this research, some of these methods were combined with qualitative GIS
methods in eliciting and documenting LK during fieldwork and will be detailed further in the
methodology chapter.
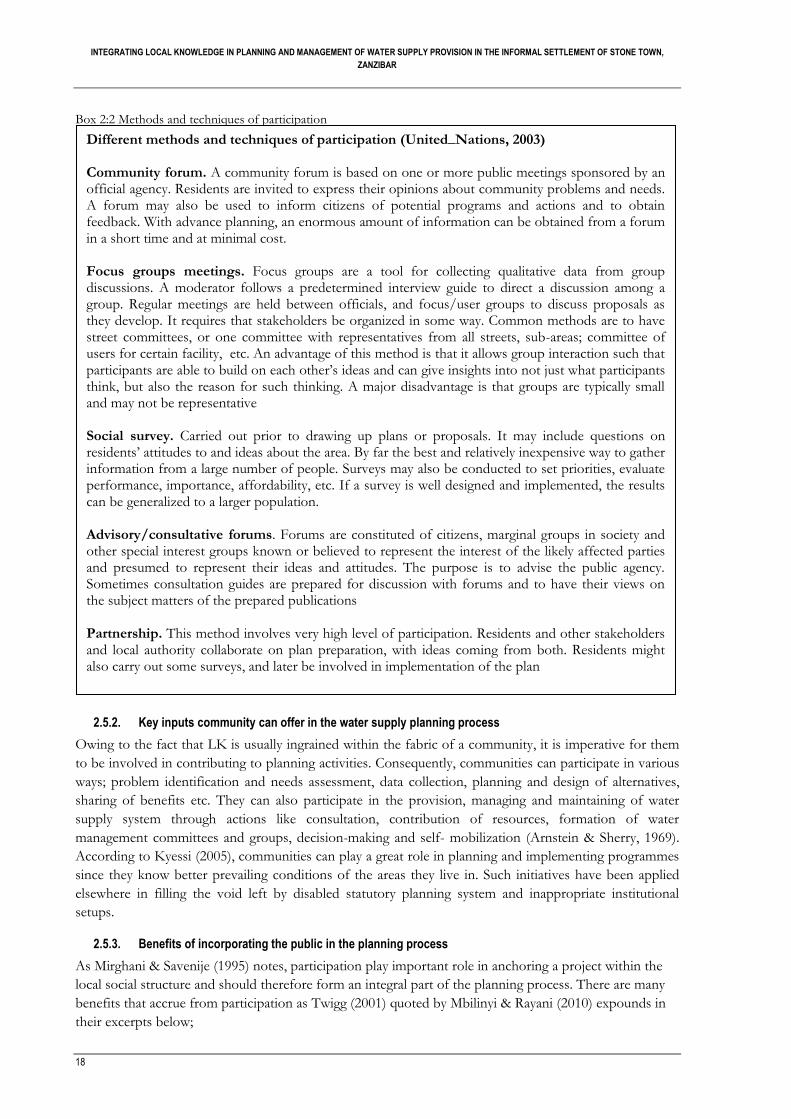
INTEGRATING LOCAL KNOWLEDGE IN PLANNING AND MANAGEMENT OF WATER SUPPLY PROVISION IN THE INFORMAL SETTLEMENT OF STONE TOWN,
ZANZIBAR
18
Box 2:2 Methods and techniques of participation
2.5.2. Key inputs community can offer in the water supply planning process
Owing to the fact that LK is usually ingrained within the fabric of a community, it is imperative for them
to be involved in contributing to planning activities. Consequently, communities can participate in various
ways; problem identification and needs assessment, data collection, planning and design of alternatives,
sharing of benefits etc. They can also participate in the provision, managing and maintaining of water
supply system through actions like consultation, contribution of resources, formation of water
management committees and groups, decision-making and self- mobilization (Arnstein & Sherry, 1969).
According to Kyessi (2005), communities can play a great role in planning and implementing programmes
since they know better prevailing conditions of the areas they live in. Such initiatives have been applied
elsewhere in filling the void left by disabled statutory planning system and inappropriate institutional
setups.
2.5.3. Benefits of incorporating the public in the planning process
As Mirghani & Savenije (1995) notes, participation play important role in anchoring a project within the
local social structure and should therefore form an integral part of the planning process. There are many
benefits that accrue from participation as Twigg (2001) quoted by Mbilinyi & Rayani (2010) expounds in
their excerpts below;
Different methods and techniques of participation (United_Nations, 2003) Community forum. A community forum is based on one or more public meetings sponsored by an official agency. Residents are invited to express their opinions about community problems and needs. A forum may also be used to inform citizens of potential programs and actions and to obtain feedback. With advance planning, an enormous amount of information can be obtained from a forum in a short time and at minimal cost. Focus groups meetings. Focus groups are a tool for collecting qualitative data from group discussions. A moderator follows a predetermined interview guide to direct a discussion among a group. Regular meetings are held between officials, and focus/user groups to discuss proposals as they develop. It requires that stakeholders be organized in some way. Common methods are to have street committees, or one committee with representatives from all streets, sub-areas; committee of users for certain facility, etc. An advantage of this method is that it allows group interaction such that participants are able to build on each other‟s ideas and can give insights into not just what participants think, but also the reason for such thinking. A major disadvantage is that groups are typically small and may not be representative Social survey. Carried out prior to drawing up plans or proposals. It may include questions on residents‟ attitudes to and ideas about the area. By far the best and relatively inexpensive way to gather information from a large number of people. Surveys may also be conducted to set priorities, evaluate performance, importance, affordability, etc. If a survey is well designed and implemented, the results can be generalized to a larger population. Advisory/consultative forums. Forums are constituted of citizens, marginal groups in society and other special interest groups known or believed to represent the interest of the likely affected parties and presumed to represent their ideas and attitudes. The purpose is to advise the public agency. Sometimes consultation guides are prepared for discussion with forums and to have their views on the subject matters of the prepared publications Partnership. This method involves very high level of participation. Residents and other stakeholders and local authority collaborate on plan preparation, with ideas coming from both. Residents might also carry out some surveys, and later be involved in implementation of the plan

INTEGRATING LOCAL KNOWLEDGE IN PLANNING AND MANAGEMENT OF WATER SUPPLY PROVISION IN THE INFORMAL SETTLEMENT OF STONE TOWN,
ZANZIBAR
19
Participatory initiatives are likely to be sustainable as they build on local capacity, the
participants have „ownership‟ of them, and they are more likely to be compatible with long-
term development plans.
Working closely with local people can help professionals gain a greater insight into the
communities that they serve, enabling them to work more effectively, and produce better
results.
They enable people to express their real needs and priorities, allowing problems to be
defined correctly and responsive measures to be designed and implemented
Participatory work takes a multi-track approach. It can combine information from many
different sources, qualitative and quantitative data, and different phases of a process. It is
therefore perfect for dealing with complex issues where there are diverse opinions.
The process of working and achieving things together can strengthen communities. It can
reinforce local organisation, building up confidence, skills, capacity to co-operate,
consciousness, awareness, and critical appraisal. In this way, it increases people‟s potential
for reducing their vulnerability. It empowers people more generally by enabling them to
tackle other challenges, individually and collectively.
Participation in the planning and implementation of projects by stakeholders accords with
people‟s rights to participate in decisions that affect their lives. It is therefore an important
part of democratisation in society and is increasingly demanded by the public.
Participatory approaches may be more cost effective, in the long term, than externally driven
initiatives, partly because they are more likely to be sustainable and because the process
allows the ideas to be tried and tested and refined before adoption.
Box 2.4: benefits accrued from participation
Source: Twigg (2001) as quoted by Mbilinyi & Rayani (2010)

INTEGRATING LOCAL KNOWLEDGE IN PLANNING AND MANAGEMENT OF WATER SUPPLY PROVISION IN THE INFORMAL SETTLEMENT OF STONE TOWN,
ZANZIBAR
20

INTEGRATING LOCAL KNOWLEDGE IN PLANNING AND MANAGEMENT OF WATER SUPPLY PROVISION IN THE INFORMAL SETTLEMENT OF STONE TOWN,
ZANZIBAR
21
3. URBAN WATER SUPPLY PLANNING AND MANAGEMENT IN ZANZIBAR
After having looked at various approaches of urban water supply planning and management in the
previous chapter, this chapter then explores how water supply planning and management is carried out in
Zanzibar. Specifically, it analyses existing policy and institutional frameworks guiding water supply
management in Zanzibar and planning strategies ZAWA undertake to meet water demands.
3.1. Existing policy and institutional frameworks in water provision planning
Policies on IWRM for urban water supply provision are few in Zanzibar. The urban water supply has also
been under much political interference especially the political declaration that has been there of domestic
water being offered free, views of which are still supported by the politicians long after the water billing
system was enforced in 2008. In the year 2004, Zanzibar government drafted the first Zanzibar Water
Policy, and later in 2006, passed an Act for the formation of ZAWA that was established in 2008, together
with adjoining water laws and rules to safeguard the sector. However, the urban land use planning and
associated urban infrastructure provision is still guided by an outdated physical planning Act that was
formulated by the colonial government in 1955. Presently, with the increasing reforms in the water sector,
Zanzibar is in the process of implementing more water supply management strategies. Other
macroeconomic policy frameworks that give policy guidelines to water resource management are
explained below.
3.1.1. Water Institutional frameworks – (Zanzibar water Authority-ZAWA)
ZAWA is a corporate authority that was established following the enactment of the Water Act of 2006
and started its operation in 2008. Its mandate is to provide water service and infrastructure provision in
both urban and rural areas. Among its responsibilities is the mandate to provide clean, reliable, and good
quality water supplies through the operation and maintenance of existing facilities, and development of
new waterworks. It is also bestowed with formulating legal and regulatory frameworks like issuance of
permits for boreholes drilling, for agricultural development and other uses. It also set the water rates and
collects fees for water supplied and services offered to consumers for services rendered. ZAWA has also
the legal mandate to take legal action against defaulters of water payment bills. It is empowered by the law
to initiate any legal suit as appropriate against any person who encroach on the catchments areas.
Although it does not presently have the legal documents for ownership of the land in the catchment areas,
the water Act mandates ZAWA to manage and protect all the water catchment areas in Zanzibar. Apart
from promoting the conservation and proper use of water resources, it also specifies standards of water
quality, effluent, and water drilling equipments as specified in the water regulations Act. Since its
inception, ambitious water management policies, legislation, and management frameworks have been
formulated and are in the process of being implemented
3.1.2. Legislative and policy frameworks
According to administrative officer at ZAWA, the Water Act of 2006 gives the water authority the
responsibilities to implement water regulations, abstraction, and in the management of all water resources.
It places the ownership of all water resources under the government. It states that, water cannot be
abstracted, used, stored, or diverted except for beneficial uses, and in accordance with license granted

INTEGRATING LOCAL KNOWLEDGE IN PLANNING AND MANAGEMENT OF WATER SUPPLY PROVISION IN THE INFORMAL SETTLEMENT OF STONE TOWN,
ZANZIBAR
22
under this act. Any person may dig or construct well, borehole or other work for the purpose of extraction
surface or ground water if the authority has licensed him. It recognises that the objective of water resource
management is to achieve sustainable use of water for the benefit of all users.
The National Water Policy for Zanzibar sets out a comprehensive framework to water resources
management. It stipulates that for an integrated management of water resources in Zanzibar, not only
Inter-sector linkages should be implemented but also inclusion of different stakeholders. However, it does
not give any clear guidelines for achieving the meaningful participation of local communities. The vision
calls for demand driven water supply network in order to meet the growing demand for water. It
recognises the need for the integrated management of all aspects of water resources and delegation of
management functions. The vision also calls for protection of water resources for quality and sets out
target for development and enhancement of local resource base promote the local expertise and
innovation to reduce outside dependence.
Zanzibar Strategy for Growth and Reduction of Poverty (ZSGRP) policy calls for an increased access to
clean, safe and affordable water by setting out targets that ZAWA should meet. The first target sets to
increase water supply in urban areas from 75% in 2005 to 90%, in 2010 and in rural areas from 51% to
65%, in the same period. This policy also calls for promotion of community-based management of water
supply in order to ensure long-term water supply. However, the policy is not clear on the strategy for
achieving the meaningful participation of local communities
The Zanzibar Development Vision 2020 policy is revolutionary as it calls for the involvement of private
sector and community participation in the water resource management and promoting community
ownership and rights to water supply. The policy vision on water supply and management is to ensure
adequate, affordable and economically accessible and sustained water supplies to all people and sectors
(Vision2020). It also calls for the development and promotion of efficient water supply and management
systems that will ensure reliable water supply for all purposes at a reasonable cost. The vision also
advocate for the development of rainwater harvesting. It calls ZAWA to institute and maintain an efficient
and effective water tariff and timely revenue collection system for all water users.
Zanzibar Poverty Reduction Plan 2002 (ZPRP) policy framework emphasizes the importance of
effective water and sanitation services to combat poverty in achieving the Millennium Development
Goals. It acknowledges that poverty is not only lack of income but also lack of accessibility to the basic
needs of the people and proposes for an improvement of living conditions through better access to basic
physical and social services. ZPRP calls for an establishment of a decentralized approach to the provision
of water supply systems and enhancement of community awareness to observe hygiene and sanitation
requirements and to develop a water supply and sanitation systems capable of supplying rural and urban
communities with potable water. It says that the protection of the quality of water resources is necessary
to ensure sustainability of the nation's water resources in the interests of all water users.
3.2. ZAWA planning and management strategies in addressing urban water supply
Current reports (GOZ, 2008a, 2008b; Murage, 2008; ZAWA, 2008b, 2010) on urban water management
strategies in Zanzibar show that the authorities are concerned mainly with the physical improvement of
water service and infrastructure provision from the traditional (engineering) point of view. Increasing
demand for water service is being met by construction of either new water supply lines or improving the
old system. The planning officer at ZAWA also said that they implement a water-rationing programme
since the supply is way below the demand. Other planning strategies ZAWA is undertaking to meet the
increasing water demand and to improve the urban water supply are summarised in Table 3:1 below.

INTEGRATING LOCAL KNOWLEDGE IN PLANNING AND MANAGEMENT OF WATER SUPPLY PROVISION IN THE INFORMAL SETTLEMENT OF STONE TOWN,
ZANZIBAR
23
Table 3:1 Strategies aimed at improving the technical dimension of water supply
issue Action and strategy being taken Unreliable and inadequate water supply
Improving operation and maintenance through increased budget and logistic allocation Looking for additional water sources
Construction of more boreholes and wells
Low service coverage Rehabilitation of existing network and extension uncovered areas
Water contamination at the sources and network
Fencing all the water sources
Repairing leakages in the pipeline network
Supplying treated water
Carrying out a campaign to sensitize people on water
contamination control
Establishing water quality monitoring, evaluation and management program
Old and dilapidated water infrastructure
Procurement and stoking, of spare parts
Motivating the staffs for timely and effective repair
Rehabilitation and improvement of the system
High unaccounted for water. Establishing a mechanism of reporting leakages, bursts and illegal connection Installing flow meters in water sources
Enforcing law concerning with illegal water users and materials quality control Replacing all existing asbestos pipes by polyethylene/ PVC
enforce laws protect water sources and pipes networks
A key expert at ZAWA (personal communication) said that ZAWA involve communities in various
activities in the water supply planning process. He also said that they support the local community
initiatives in providing for their own water needs like in borehole construction and offer support for
community based projects. According to him, the communities are involved in all stages of water planning
and management process including project identification, appraisals, Stakeholders‟ consultations, surveys
and data collection, and project design and costing.
However, this contrasted sharply with the communities‟ responses on the same issue who said that
ZAWA does not involve them in water provision management or consult them in addressing the water
problems they face, with 80% and 69% of households in the formal and informal settlements respectively
saying they are never involved. (See section 6.5; Figure 6-9).
Other strategies ZAWA had proposed and others were in the process of being implemented, aimed at
improving socio-economic dimension of water supply are summarised in the Table 3:2 below
Table 3:2 Strategies aimed at improving socio-economic dimension of water supply
issue Action and strategy being taken
Inefficient billing procedures
Establishing a billing distribution schedule and streamlining the bill distribution teams Inputting existing customer data into the newly installed computerized customer database Ensuring prompt generation of monthly billing statements
Ensuring that the billing statements delivered to the customers on time
Inefficient revenue collection
Establishing revenue collection zones.
Carrying out M & E of the performance of the revenue collection
Providing incentives for customers who promptly pay their bills
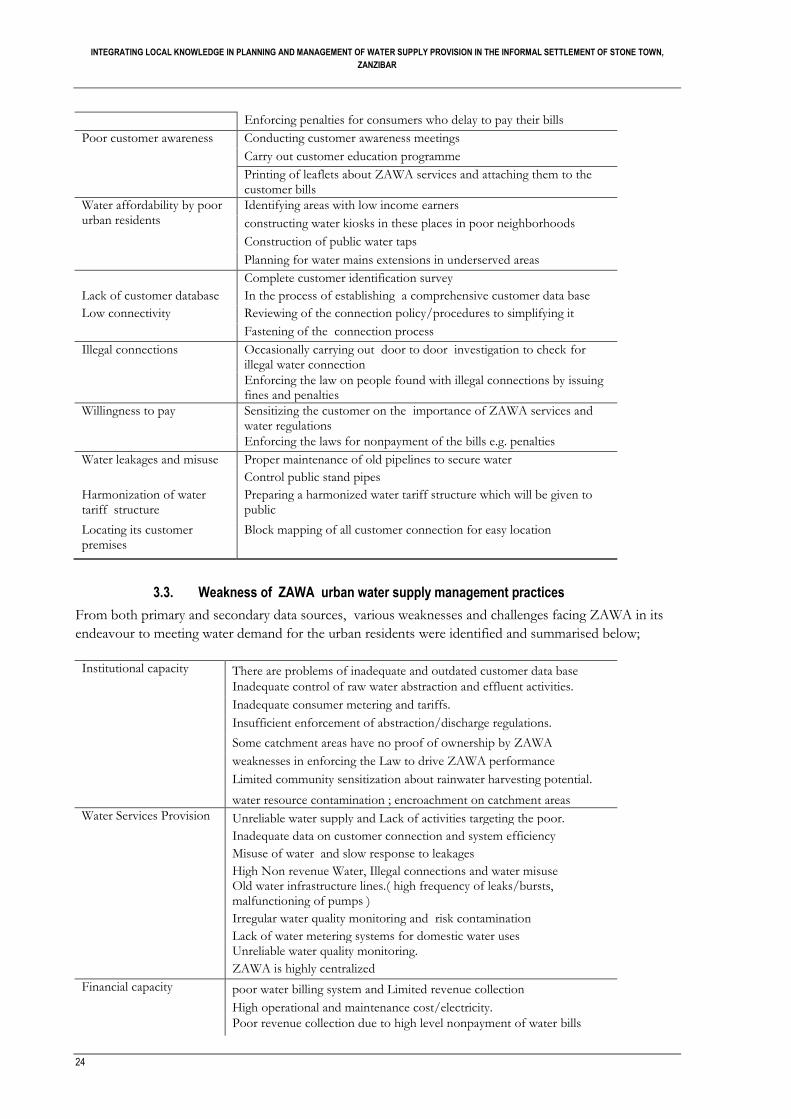
INTEGRATING LOCAL KNOWLEDGE IN PLANNING AND MANAGEMENT OF WATER SUPPLY PROVISION IN THE INFORMAL SETTLEMENT OF STONE TOWN,
ZANZIBAR
24
Enforcing penalties for consumers who delay to pay their bills
Poor customer awareness Conducting customer awareness meetings
Carry out customer education programme
Printing of leaflets about ZAWA services and attaching them to the customer bills
Water affordability by poor urban residents
Identifying areas with low income earners
constructing water kiosks in these places in poor neighborhoods
Construction of public water taps
Planning for water mains extensions in underserved areas
Complete customer identification survey
Lack of customer database In the process of establishing a comprehensive customer data base
Low connectivity Reviewing of the connection policy/procedures to simplifying it
Fastening of the connection process
Illegal connections Occasionally carrying out door to door investigation to check for illegal water connection
Enforcing the law on people found with illegal connections by issuing fines and penalties
Willingness to pay Sensitizing the customer on the importance of ZAWA services and water regulations
Enforcing the laws for nonpayment of the bills e.g. penalties
Water leakages and misuse Proper maintenance of old pipelines to secure water
Control public stand pipes
Harmonization of water tariff structure
Preparing a harmonized water tariff structure which will be given to public
Locating its customer premises
Block mapping of all customer connection for easy location
3.3. Weakness of ZAWA urban water supply management practices
From both primary and secondary data sources, various weaknesses and challenges facing ZAWA in its
endeavour to meeting water demand for the urban residents were identified and summarised below;
Institutional capacity There are problems of inadequate and outdated customer data base
Inadequate control of raw water abstraction and effluent activities.
Inadequate consumer metering and tariffs.
Insufficient enforcement of abstraction/discharge regulations.
Some catchment areas have no proof of ownership by ZAWA
weaknesses in enforcing the Law to drive ZAWA performance
Limited community sensitization about rainwater harvesting potential.
water resource contamination ; encroachment on catchment areas
Water Services Provision Unreliable water supply and Lack of activities targeting the poor.
Inadequate data on customer connection and system efficiency
Misuse of water and slow response to leakages
High Non revenue Water, Illegal connections and water misuse Old water infrastructure lines.( high frequency of leaks/bursts, malfunctioning of pumps )
Irregular water quality monitoring and risk contamination
Lack of water metering systems for domestic water uses Unreliable water quality monitoring.
ZAWA is highly centralized
Financial capacity poor water billing system and Limited revenue collection
High operational and maintenance cost/electricity.
Poor revenue collection due to high level nonpayment of water bills

INTEGRATING LOCAL KNOWLEDGE IN PLANNING AND MANAGEMENT OF WATER SUPPLY PROVISION IN THE INFORMAL SETTLEMENT OF STONE TOWN,
ZANZIBAR
25

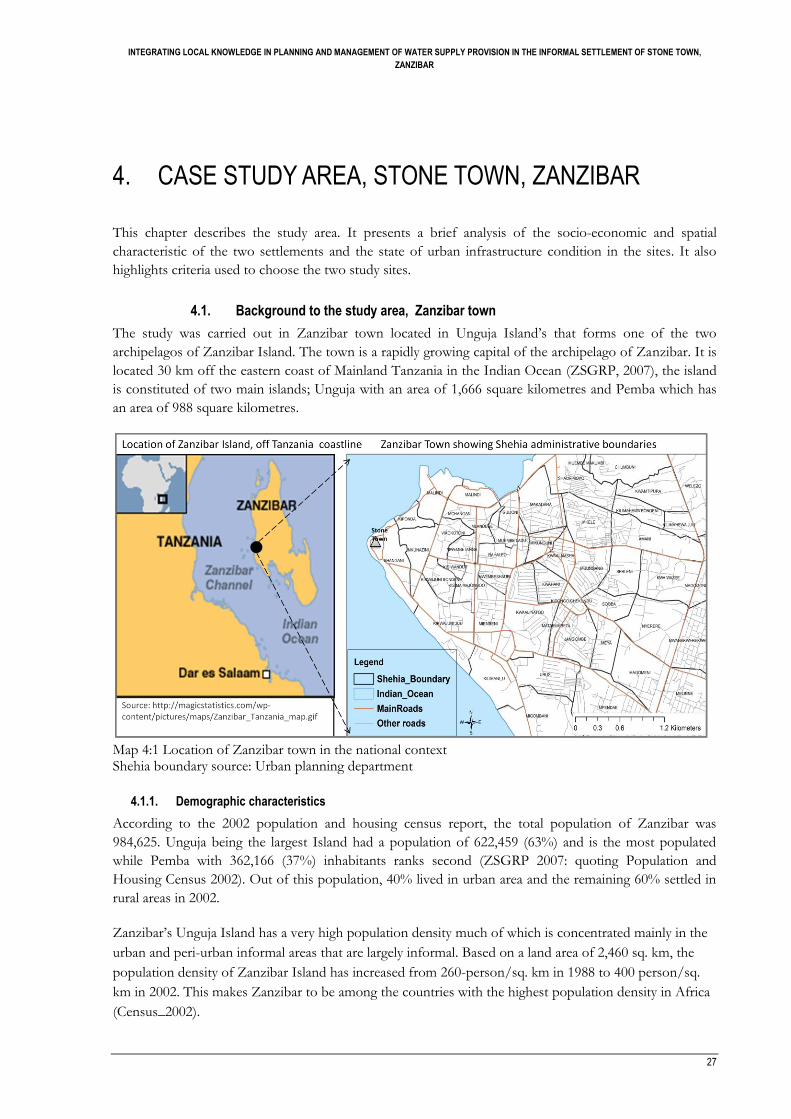
INTEGRATING LOCAL KNOWLEDGE IN PLANNING AND MANAGEMENT OF WATER SUPPLY PROVISION IN THE INFORMAL SETTLEMENT OF STONE TOWN,
ZANZIBAR
27
4. CASE STUDY AREA, STONE TOWN, ZANZIBAR
This chapter describes the study area. It presents a brief analysis of the socio-economic and spatial
characteristic of the two settlements and the state of urban infrastructure condition in the sites. It also
highlights criteria used to choose the two study sites.
4.1. Background to the study area, Zanzibar town
The study was carried out in Zanzibar town located in Unguja Island‟s that forms one of the two
archipelagos of Zanzibar Island. The town is a rapidly growing capital of the archipelago of Zanzibar. It is
located 30 km off the eastern coast of Mainland Tanzania in the Indian Ocean (ZSGRP, 2007), the island
is constituted of two main islands; Unguja with an area of 1,666 square kilometres and Pemba which has
an area of 988 square kilometres.
Map 4:1 Location of Zanzibar town in the national context Shehia boundary source: Urban planning department
4.1.1. Demographic characteristics
According to the 2002 population and housing census report, the total population of Zanzibar was
984,625. Unguja being the largest Island had a population of 622,459 (63%) and is the most populated
while Pemba with 362,166 (37%) inhabitants ranks second (ZSGRP 2007: quoting Population and
Housing Census 2002). Out of this population, 40% lived in urban area and the remaining 60% settled in
rural areas in 2002.
Zanzibar‟s Unguja Island has a very high population density much of which is concentrated mainly in the
urban and peri-urban informal areas that are largely informal. Based on a land area of 2,460 sq. km, the
population density of Zanzibar Island has increased from 260-person/sq. km in 1988 to 400 person/sq.
km in 2002. This makes Zanzibar to be among the countries with the highest population density in Africa
(Census_2002).

INTEGRATING LOCAL KNOWLEDGE IN PLANNING AND MANAGEMENT OF WATER SUPPLY PROVISION IN THE INFORMAL SETTLEMENT OF STONE TOWN,
ZANZIBAR
28
Figure 4-1 Population growth trend in Zanzibar
Source: Office of the chief government statistician
The 2002 census figures also confirm the predominance of large households with average size being five
persons. The overall population growth is attributed to high fertility rate of 5.3% per annum (ZSGRP,
2007). The peri-urban areas are attractive for rural urban migrants, because the land is suitable for
agricultural uses and they are very close to town, which offers access to services, job opportunities and
markets for agricultural and livestock products. Zanzibar has a young population whereby those below the
age of 15 years constitute about 50% of the overall population characterizes Zanzibar. Only 6 percent are
older than 60 years (Census_2002).
4.1.2. Informal urbanization in Zanzibar
The urbanized areas of Zanzibar covers an area of approximately 1,600 hectares and are approximated to
be three times bigger the official town boundaries (Murage, 2008). This rapid urban sprawl has led to the
town extending beyond its jurisdictional boundaries of its master planning areas (GOZ, 2008a; Haji, et al.,
2006; Scholz, 2008; Sulaiman & Ali, 2006). According to „Zanzibar urban services project report‟ (2008a)
“the city does not have a current physical development plan and this has led to large areas of the Zanzibar
town physical development to take place in informal, poorly accessed yet densely populated locations”.
4.1.3. Land use in Zanzibar town
About 73 % of the total built area in Zanzibar town municipal area is informal settlements (Khatib,
kombo, & Mmochi, 2009) with total Zanzibar municipal council area covering about 4,424 ha. Of these,
the total built up area is 1,945 ha. Residential area constitutes 43.5 % of the built up area. The land use
distribution is as shown in Table 4:1 below.
Table 4:1 Land use categories of Zanzibar town
Land use category Area (ha) Area (%)
Residential 846 43.5
Public open spaces 108 5.5
Public utilities 59 3.0
Industry 55 2.8
Agricultural 33 1.7
Commercial 18 0.9
Other areas 247 12.7
Adopted from (Khatib, et al., 2009)
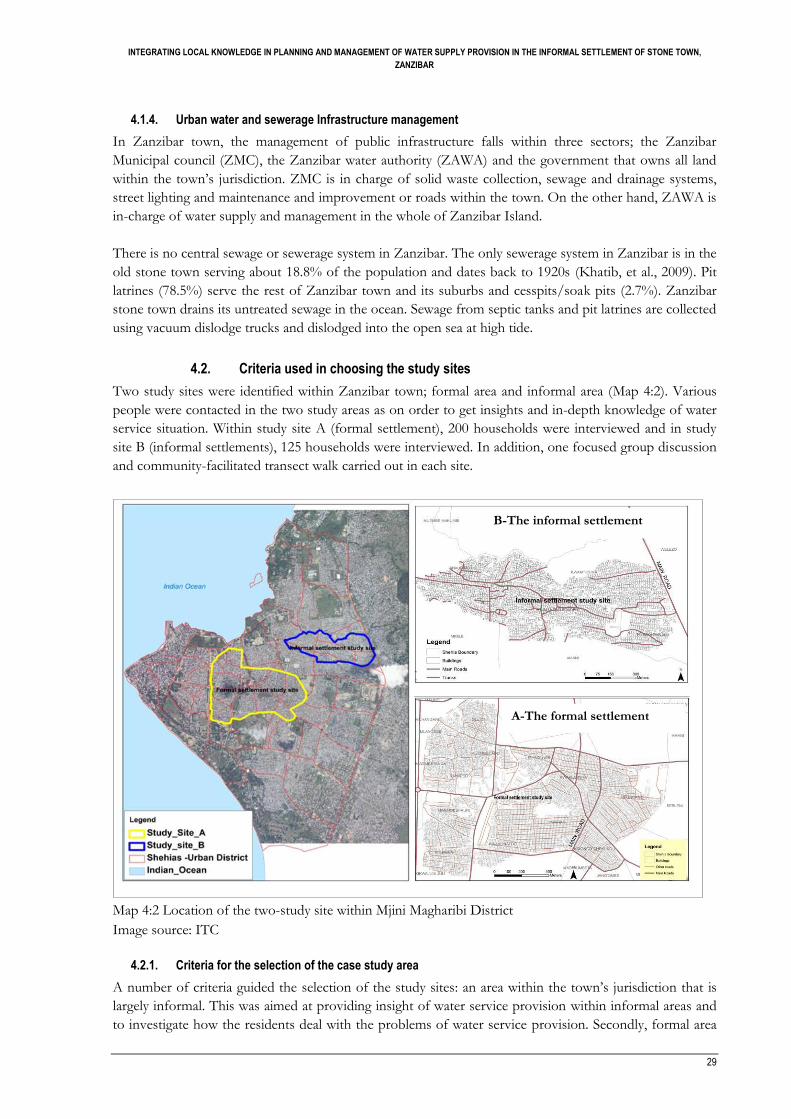
INTEGRATING LOCAL KNOWLEDGE IN PLANNING AND MANAGEMENT OF WATER SUPPLY PROVISION IN THE INFORMAL SETTLEMENT OF STONE TOWN,
ZANZIBAR
29
4.1.4. Urban water and sewerage Infrastructure management
In Zanzibar town, the management of public infrastructure falls within three sectors; the Zanzibar
Municipal council (ZMC), the Zanzibar water authority (ZAWA) and the government that owns all land
within the town‟s jurisdiction. ZMC is in charge of solid waste collection, sewage and drainage systems,
street lighting and maintenance and improvement or roads within the town. On the other hand, ZAWA is
in-charge of water supply and management in the whole of Zanzibar Island.
There is no central sewage or sewerage system in Zanzibar. The only sewerage system in Zanzibar is in the
old stone town serving about 18.8% of the population and dates back to 1920s (Khatib, et al., 2009). Pit
latrines (78.5%) serve the rest of Zanzibar town and its suburbs and cesspits/soak pits (2.7%). Zanzibar
stone town drains its untreated sewage in the ocean. Sewage from septic tanks and pit latrines are collected
using vacuum dislodge trucks and dislodged into the open sea at high tide.
4.2. Criteria used in choosing the study sites
Two study sites were identified within Zanzibar town; formal area and informal area (Map 4:2). Various
people were contacted in the two study areas as on order to get insights and in-depth knowledge of water
service situation. Within study site A (formal settlement), 200 households were interviewed and in study
site B (informal settlements), 125 households were interviewed. In addition, one focused group discussion
and community-facilitated transect walk carried out in each site.
Map 4:2 Location of the two-study site within Mjini Magharibi District
Image source: ITC
4.2.1. Criteria for the selection of the case study area
A number of criteria guided the selection of the study sites: an area within the town‟s jurisdiction that is
largely informal. This was aimed at providing insight of water service provision within informal areas and
to investigate how the residents deal with the problems of water service provision. Secondly, formal area
B-The informal settlement
A-The formal settlement

INTEGRATING LOCAL KNOWLEDGE IN PLANNING AND MANAGEMENT OF WATER SUPPLY PROVISION IN THE INFORMAL SETTLEMENT OF STONE TOWN,
ZANZIBAR
30
was chosen in order to be able to make inferences of general water supply situation in Zanzibar informal
areas.
In order to come up with the best areas that reflected these conditions, experts from department of survey
and urban planning were contacted to gather information on the urbanization pattern the town. According
to Zanzibar town urban planner, the town has a long history of urban development dating from pre-
colonial era that has shaped the character and form of settlements development.
From the discussion, it emerged that Zanzibar has three types of settlement areas that were developed
following the colonial master plans; Informal areas, semi-planned areas and planned (formal) areas.
Colonial influence formed the Stone town, the historic centre of the town that is largely informal. The
surrounding suburbs outside of this core have evolved following colonial master plans while the newly
developing areas in the town‟s outskirts are largely informal.
With the aid of high-resolution satellite image printed on large AO paper site, the urban planning expert
was able to identify and demarcate the three types of areas from which two study sites were chosen (Map
4:2 above). The housing development pattern was also clearly visible (see Figure 4-2 and Figure 4-3). The
expert also shed light on the forces and mechanisms of informal urbanization. In addition, the ZAWA and
Zanzibar municipal council experts were consulted concerning the final choice of the stud areas by giving
the researcher the general situation of the public service infrastructure development in these areas. A
reconnaissance tour was carried out in these two areas before data collection begun in order to confirm
and delineate the study areas boundary. The characteristics of these areas are explained below.
4.3. Case study site A (Formal settlement)
This covered a formal settlement with planning that dates back to the colonial era that is now
characterised by infill densification of the settlements. It covered partly the Shehia of Kindongo chekundu,
Muungano, Kwaalamsha, Kwahani, kwaalinato, Muembe ladu and Mwebe shauri (Map 4:2). This area is an
old, consolidated formal settlement that was planned during the colonial period and has undergone
transformation since the 1940‟s.
4.3.1. Housing conditions and ownership
The area has high density of housing that exhibit a regularly planned characteristic. In this area, the house
settlement was planned as residential units under the British protectorate master plans of 1923 (personal
communication with Zanzibar urban planner). The housing schemes were based on small housing units
following an identical rigid layout scheme and were constructed in parallel rows. The buildings are of
almost the same size and are oriented face to face and back to back.
In Kidongo Chekundu neighbourhood, the buildings are arranged in curvilinear pattern forming a closed
structure that is bounded by well-planned road network between each row of houses (Figure 4-2).
However, house consolidation is taking place in some areas whereas others are facing the problem of
densification through infill housing development. The extension of building for commercial and
residential development uses especially those facing the roads has led to blocking of access roads and
hence hampering the urban service infrastructure delivery. Originally, the houses were designed for four
persons households but the households size have increased and as many as ten people live in one building
(Scholz, 2008). Most of the new houses are constructed using bricks and plastered walls. Within this
settlement, approximately 166 (83%) of the interviewed households were found to own occupancy license
for their houses with only 16 (8%) responding to have no occupancy licence (Annexe 2). In addition, 81%
of interviewed households were owner-occupiers while 19% were tenants.

INTEGRATING LOCAL KNOWLEDGE IN PLANNING AND MANAGEMENT OF WATER SUPPLY PROVISION IN THE INFORMAL SETTLEMENT OF STONE TOWN,
ZANZIBAR
31
Figure 4-2 Settlement pattern within the formal settlement area
4.3.2. Accessibility and service infrastructure
The area has good accessibility by paved roads (Figure 4-2) although some areas where residents have built
new house extension have narrow roads. There are three-meter wide service roads between the building
rows that provide access to almost every house. The settlement has relatively fair water supply
infrastructure when compared with the informal settlements area although the residents suffer frequent
water supply shortages. “Originally when the settlements were designed it was well served with water and
drainage.” (Interview with Zanzibar urban planner, 2010) However, today the residents of these
settlements suffer from the problem of water shortages and solid waste management. Though the
settlement has good drainage, the problem is that most are blocked by garbage with many residents citing
lack of good maintenance by the municipal council as the main problems of their blockage. The
settlement also has a big open space used for social activities.
4.4. Study site B (Informal settlement)
This is an informal area where informal building activity was taking place and government seemed not to
have any influence in controlling the informal development process. The area covered partly the Shehia of
Kilima Hewa Bondeni, Shauri Moyo, Mkele, Kilima Hewa Juu and Kwamtipura Shehia (Map 4:2). A rapid
process of informal urbanisation is taking place in these areas.
4.4.1. Housing conditions and ownership
The settlement has high dense building and their development seem not to follow any planning guidelines,
as they are irregular in pattern with very narrow paths ways between them (Figure 4-3). Most of the houses
were found to be in good physical condition though. In all the households interviewed, 318 (99%) said
their house wall is build of cement blocks and roof built of iron sheet. The few mud houses observed were
also on the process of being converted into permanent house status.
Contrary to a popular perception that residents of informal settlements areas do not own right of
ownership of their plot, 96 (76.8%) of the interviewed households were found to own occupancy license

INTEGRATING LOCAL KNOWLEDGE IN PLANNING AND MANAGEMENT OF WATER SUPPLY PROVISION IN THE INFORMAL SETTLEMENT OF STONE TOWN,
ZANZIBAR
32
for their houses in this area with only 25 (20%) having no occupancy licence for their plots (Annexe 2).
Overall within the two study areas, majority 262 (80.6%) of all interviewed households were found to have
the right of ownership of their plots with only 41 (13%) of respondents saying they do not have an
occupancy license. In addition, 79% of interviewed households were owner-occupiers with and 21% were
tenants. A higher-level right of plot ownership by informal settlement dwellers has a positive effect to the
introduction and development of physical public infrastructure (UN-Habitat, 2006a, 2006c; UN-
Millennium-Project, 2005a; WorldBank, 2010).
Figure 4-3 Settlement pattern within the informal areas
4.4.2. Accessibility and service infrastructure
This area has very few paved roads that are accessible by car. Resident use narrow foot paths that are were
also found to be blocked in some areas by building extensions and irregular layout of the settlements. The
poor accessibility affects service delivery especially solid waste collection as municipal council deputy
director responded, “We do not have any solid waste collection points in these areas since our trucks
cannot access the areas dues to narrow roads in the area, residents have made their local arrangement of
disposing off their waste” (interview, respondent, 2010).
4.5. The urban water supply situation of zanzibar town
From the key expert‟s discussion held with the planning and policy director at ZAWA, he said that they
get water from three main sources; drilled boreholes that account for 81% of their water source, natural
springs accounting for about 13% and from local shallow wells that account for 6%. He also said that
about 50% of the residents of Zanzibar town get water from communal taps constructed by ZAWA
within the urban neighbourhoods.
The town water supply is a conventional piped water distribution system that was first installed in
Zanzibar‟s old stone town in 1920 and has since been expanded. A number of ground water abstraction
points have been developed which now form the main water source for Unguja. The water production
records at ZAWA indicated that the volume of urban water production is 16,200,000 m3/a. Out of this

INTEGRATING LOCAL KNOWLEDGE IN PLANNING AND MANAGEMENT OF WATER SUPPLY PROVISION IN THE INFORMAL SETTLEMENT OF STONE TOWN,
ZANZIBAR
33
6,480,000m3/a (about 40%) is unaccounted for water. The remaining 9,720,000m3/a is the chargeable
water (ZAWA, 2010).
According to ZAWA‟s commercial director, domestic use accounts for about 70% of total water use in
Zanzibar town. He said that water for domestic consumption has been free until 2008 when ZAWA
introduced charges but for commercial consumptions, they pay on either water meter and/ or flat rate
basis, with those having meters paying around Tshs. 1000 - 2000 per M3. According to him, the water
supply is not sufficient since the supply is considerably smaller than the demand. This, he attributed to
dysfunctional water planning system that is not able to meet the demand for water. He also cited the poor
urban planning practices, where development of plots is done without first providing the necessary basic
infrastructure services.
Zanzibar is also coping with the increased water demand from tourist hotels and lodges that have
gradually increased in recent times. Water demand for tourist resorts and hotels uses are assumed to be in
average of 300 litres/bed/day (ZAWA, 2010). Presently, water for tourism and all other related
commercial uses in Zanzibar is paid at a rate of Tshs 1,000/m3 (approx. USD 0.85/m3) notwithstanding
its availability and reliability (ZAWA, 2010).

INTEGRATING LOCAL KNOWLEDGE IN PLANNING AND MANAGEMENT OF WATER SUPPLY PROVISION IN THE INFORMAL SETTLEMENT OF STONE TOWN,
ZANZIBAR
35
5. METHODOLOGICAL FRAMEWORK FOR INTEGRATING LOCAL KNOWLEDGE IN WATER SUPPLY PLANNING
This chapter conceptualizes the integration of LK and SK by developing a GIS-based methodological
framework for integrating the two knowledge bases. It also presents the methods, tools, and approaches
that were employed to collect LK during fieldwork.
5.1. Introduction
The preceding chapter 2, section 2.5 has identified methods and techniques of eliciting LK and various
inputs LK communities can contribute in the planning process. The benefits accruing from the LK and
participation as Twigg (2001) and Mbilinyi & Rayani (2010) put them are many. Then next question is;
how can this LK be collected, processed, and converted into a more relevant, and useful format for water
supply planning purposes? This chapter tries to answer this question by discussing methods and processes
through which the LK and SK can be collected and integrated into water supply planning.
5.2. Local knowledge and scientific knowledge in the perspective of water supply
As discussed in section 2.4, many local authorities still rely heavily on SK as the primary source of water
resource management and have to a larger extent, ignored LK communities and water consumers possess
(Close, 2003). On the other hand, the planning systems in use do not provide ways of tapping the LK
communities have. Elsewhere it has been urged (Kyessi, 2005) that the LK of the informal systems and
institutions for supplying water may contribute in developing formal water supply. Kyessi (2005) stipulates
that important lessons on how to create systems using non-conventional opportunities and institutions
for community enterprise and management can be deduced from such informal initiatives.
But the major challenge for these local authorities seem to be their inability to differentiate LK from
massive information present in any given society and also their limitation to have methods of indentifying
and documenting the most relevant LK to support their planning actions. What constitute LK and SK
then?
5.2.1. What is Local knowledge and what does it constitute?
There are many connotations that have been put forward to refer to LK (Agrawa, 2011; Chambers, 1994;
Dunn, 2007; Elmes, et al., 2005); local knowledge (internal knowledge); indigenous (technical) knowledge;
indigenous (spatial) knowledge; (Rural) popular knowledge and traditional knowledge. Nevertheless, all
these tend to refer to one thing; the information base within a particular society/community, and their
understanding of the world which facilitates communication and decision-making. Peters, (2008) says that
local knowledge consists of experiences, memories, facts, observations, practices, values and points of
view existing within a community as result of their exposure to poverty condition within their
environment while Raymond, et al. (2010) define LK using three aspect;
Different knowledge types (technical knowledge, ecological knowledge, historical knowledge)
Practices (either individual, household, or community, technical or non technical)
Beliefs, values and views (socio-cultural, religious belief systems, respects, reciprocity, sharing).
INTEGRATING LOCAL KNOWLEDGE IN PLANNING AND MANAGEMENT OF WATER SUPPLY PROVISION IN THE INFORMAL SETTLEMENT OF STONE TOWN,
ZANZIBAR
36
Close (2003) on the other hand, points out that LK draws heavily on local resource users‟
intergenerational knowledge, instinct and experience that are accumulated over time from being exposed
to local systems or being part of a resource user. McCall sums up the LK thus;
LK reflects capability & competence of local community
LK is experience derived through first-hand contact with the local environment
LK works in interactive and holistic systems.
Local knowledge is operational.
LK maybe more accurate because it embodies generations of accumulated practical knowledge
With regard to this study, LK constitutes the households perception, views, opinions, experiences, and
innovations about water supply situation in their locality. This may constitute; household‟s knowledge of
water service performance, their views on efficiency and effectiveness of water service delivery and
problems of water access. Moreover, households‟ adaptation and coping strategies to deal with constant
water shortages, affordability, and willingness to information, Alternative community owned water sources
and projects, their opinions on how to improve water supply situations and service satisfaction feedbacks
among others.
On the other hand, scientific knowledge (SK) is based primarily on the quantitative analysis of natural
resource data and their resource characteristics (Close, 2003). SK is viewed to be open, systematic,
objective, and analytical and advances by building rigorously on prior achievements. It relies on
established laws that are set through the application of the scientific method to a phenomenon. The
scientific method begins with an observation followed by a prediction or hypothesis which is then tested
(Agrawa, 2011). It has dominated as the only accredited and valid source of information to base decisions
from until recently when LK has become eminent and particularly useful source of information especially
in the natural resource management field. This has been facilitated by advancement of geo spatial
technology and method that facilitates it documentation.
With regard to water supply provision, this study considers SK to constitute; all relevant knowledge
ZAWA possesses, adopts, formulates, and uses in order to plan and manage water supply provision. This
knowledge may originate or be inspired from scientific sources, academic generated sources, best water
management practices adopted from elsewhere or the knowledge of professional staff and employees of
ZAWA they may use to devise strategies of water management.
5.3. Integrating the two knowledge systems using geographical information technology
LK and SK are not always so different as McCall (2003) Observes, “LK maybe more accurate because it embodies
generations of practical knowledge and work in interactive, holistic systems”. According to Close (2003), combining
these two knowledge systems can greatly help in making informed resource management decisions, “in
order to create a complete knowledge base, resource managers must combine knowledge gained through observation (SK) and
knowledge gained through experience (LK)”.
GIS technology offer a mixture of geo-spatial information management tools and methods that can be
used to elicit, capture, analyze and visualize local people‟s spatial and non-spatial knowledge with ease
(Dunn, 2007; Ramasubramanian, 1995; Rambaldi, 2006; Rambaldi, McCall, Weiner, Mbile, & Kyem, 2004;
Schlossberg & Brehm, 2009). These methods are also able to link LK with the real world. In recent times,
development of geospatial information technology (i.e. the use of internet GIS, Google earth,
Participatory GIS, Mobile GIS, IPAQ) has made good progress in facilitating the integration of these two
knowledge systems. GIS in particular has demonstrated enormous capability through its various
applications and methodologies on how local spatial and non-spatial knowledge can be elicited, collected,
processed, analysed, and visualized into useful maps that decision makers can infer to make decisions.

INTEGRATING LOCAL KNOWLEDGE IN PLANNING AND MANAGEMENT OF WATER SUPPLY PROVISION IN THE INFORMAL SETTLEMENT OF STONE TOWN,
ZANZIBAR
37
Despite its capabilities, GIS has not been widely used by planners for the incorporation of local
knowledge (Talen, 2000).
Brands (1991) defines GIS as,” a special case of information system where the database consists of observation on
spatially distributed features, activities or events, which are definable in space as points, lines or area” It manipulates data
about these points, lines and areas to retrieve data for ad hoc queries and analyses” (Brand, 1991). This data is stored in
a system consisting of computer databases where it can be manipulated by use of GIS software. Another
definition of GIS given in the report „Handling Geographic Information‟ prepared by Department of the
Environment's Chorley Committee, defines GIS as “A system for capturing, storing, checking, integrating,
manipulating, analysing and displaying data which are spatially referenced to the earth (HMSO 1987, p.132).
From the above definitions, GIS is thus both a tool and a science (Mays, 2002) that has the capability of
combining spatial (geographic) and non-spatial (database) data into a one system (a framework of
computer hardware and software). This system allows the user to interact with both aspects
simultaneously in order to explain geographical phenomena.
5.3.1. The challenge of integrating different Knowledge bases
The integration of local knowledge with scientific knowledge in the planning process is still viewed as
problematic (McCall, 2003; Rambaldi, 2006; Rambaldi, McCall, Chambers, & Fox, 2006). Indeed, many
researchers and scientists have treated LK with scepticism because of its inherent limitations especially the
difficulties that are associated with measuring it and its inability to fit adequately into the realm of SK
methodologies. In addition, LK is localised and often anchored to a particular community in a particular
setting. It is viewed to be non-systematic, holistic, rather than analytical, without an overall conceptual
framework and advances based on new experiences, not based on a deductive judgment. The problems
that hinder LK integration are a resultant of the very nature of the LK as summed up by McCall, (2010),
LK is mostly undocumented,
Most of LK is qualitative
Its inabilities to be precisely measured (Close, 2003)
Still inherently tied up in songs, dances, customs and local traditions,
It does not fit comfortably into the realm of scientific research
In addition, local spatial knowledge is fuzzy and transcends officially set boundaries,
These problems are compounded by the fact that LK systems are dynamic, and are continually influenced
by internal creativity and experimentation as well as by contact with external systems. This makes it to
differ from place to place, and hence its application and usefulness depend mostly of the local prevailing
systems, and the use to which it is being applied. The above factors have contributed to the reluctance of
its acceptance in scientific research. Despite this, decision makers and researchers can learn from its
application in managing resources elsewhere and custom it depending on their own localities to manage
resources.
One of the solutions towards integration lies in the method and format by which LK is collected,
processed, and analysed. When LK is collected, it can be in many formats; qualitative (statements, videos)
vector format (points, poly lines, or polygons) or raster format (photos, images). Most of these formats
may lack spatial reference and therefore linking them can be problematic. GIS methods and tools
facilitates collection of all these data formats with their geographical reference and those without can be
geo referencing in order to reflect their exact geographic positions. On the other hand, the qualitative data;
either in questionnaires or short statements can be processed, coded and quantified using various social
research methods available and also using statistical software like SPSS and then transformed into
spatially referenced datasets within GIS.

INTEGRATING LOCAL KNOWLEDGE IN PLANNING AND MANAGEMENT OF WATER SUPPLY PROVISION IN THE INFORMAL SETTLEMENT OF STONE TOWN,
ZANZIBAR
38
Raster images like digital photos taken from the field are usually in continuous gridded surface where each
cell has an attribute value associated with it. These can directly be input into GIS after geo referencing
since no further interpolation is needed. Further analysis can then be performed (i.e. overlay, spatial
correlation) deduce useful information. For vector data sets, since they are usually in discontinuous or
discrete format, interpolation can be done in order to get values for those areas without recorded data.
Further processing can be carried out to transform these data into useful information that can be used to
make informed decisions
The data fed in a GIS system can be generated by means of; digitizing, GPS mapping, coordinate
geometry and or entering manually using coordinates from the fieldwork (Goodchild, 1987). This data can
then be edited or manipulated and integrated with other data themes to deduce important information.
The spatial referencing of data within GIS can take many forms (Goodchild, 1987), it may locate a points
(i.e. location of public water taps), poly lines (water pipes distribution system), or polygon (i.e. a coverage
area of water supply system in a town). From this information, a GIS database can then be prepared to
include a wide variety of information for example, geographic, social, political, environmental, and
demographic information of all water consumers or community in a town. This information, using the
GIS spatial capabilities can help to; map where water points are; map serviced areas with water pipe; find
location of water pipeline; map water catchment areas; map change in an area to anticipate future
conditions.
According to Talen (2000), “The advantage of using GIS in participatory planning activities is that it
provides spatial complexity, spatial context, and interactivity and interconnection in the articulation of
viewpoints”. This makes it an effective tool that can help in deepening our understanding of community's
perceptions of local issues and preferences. The information generated from GIS can then be used to
facilitate local decision-making processes. This greatly compliments the weaknesses of traditional planning
approaches, which lack this capability (Abbott, 2002a; Hordijk & Baud, 2006). The traditional approaches
largely uses labour intensive methods in data collection and handling and are severely limited in spatial
data analysis capabilities. It also promote participatory methodologies that can lead to improved diagnosis
of community‟s needs and priorities and enhances the capacity in generating, managing, analyzing and
communicating spatial information (Asare, 2008; Rambaldi, et al., 2004).
5.4. Linking water supply planning with GIS
Planning is a conscious process of determining appropriate future action today through a sequence of
choices. It enables us to make intuitive scenarios of a desired future using both scientific and technical
knowledge available. Accordingly, planners focus on comparing alternatives, and making informed choices
among a multitude of available alternatives. Making such choices under uncertain conditions require
planners and decision makers not only to gather comprehensive information but also to have tools and
methods that can aid in coming up with appropriate analysis, relationship, choices and conclusions about
the phenomena under investigation within a geographical space. Planning relies heavily on the availability
and quality of collected information and how this information is processed and analyzed in order to
describe, predict, and prescribe planning decisions. This is where GIS comes in handy since it has such
capabilities.
Planning for the provision of urban water infrastructure supply and service provision consist of various
steps; determining the need for infrastructure, designing appropriate infrastructure; prioritizing for the
best alternative to meet the public need, implementing the preferred alternative and maintaining that
INTEGRATING LOCAL KNOWLEDGE IN PLANNING AND MANAGEMENT OF WATER SUPPLY PROVISION IN THE INFORMAL SETTLEMENT OF STONE TOWN,
ZANZIBAR
39
infrastructure for it to be able to meet the future needs as well. Mobilizing available resources, expertise,
and stakeholders is crucial in all the steps. This necessitates the application of GIS that has the capability
to store all this information and links the spatial information (position or location of consumers, pipes),
economic information of the water supply system and physical information together (Mays, 2002).
Water supply planning always entails a spatial dimension (the spatial location of consumer, water
resources, and water distribution network). The components that make up water supply system that
should be considered concurrently when planning include:
1. Physical infrastructure - This consists of the physical and man-made facilities/equipment such as
equipments and machinery, pipes and pumps provided to support and facilitates water provision.
2. Services - which is a component of infrastructure that support social welfare and enhance quality
of that infrastructure in meeting its intended function. It has a spatial dimension in that the
recipient of water services are distributed within a geographic space and their feedback can be
able to be mapped.
In addition to the above two components, additional information of the water supply system that is
prerequisite in planning include;
3. Economic information of the water supply system e.g. (customers demand, customer location and
addresses, connection types, water usage statistics, income level of the customers, no people per
household).
4. Spatial information about the location of both physical and economic data (location of the mains
water pipes, the distribution pipe layout, the spatial location of the customers in relation to water
network coverage among other). All the information regarding water network system and its
performance can be managed centrally from the geo database.
Decision makers can therefore use the power of GIS to not only collect this information but also execute
basic and complex spatial function within the water supply system. With the incorporation of local
knowledge, pressing needs are able to identified, prioritized, and suitable project interventions made.
5.5. Conceptual framework for integration of LK and SK into urban water supply planning
As discussed earlier, urban manager have tended to rely heavily of SK, which has not managed to address
the current problems facing urban water supply sector. This have prompted not only the investigation of
new approaches to urban water management, but also a search for new sources of knowledge that can
help fill gaps that currently exist in urban water resource knowledge bases (Uchegbu, 2009;
WHO/UNICEF, 2006; World_Bank, 2006). The framework below presents one such investigations and
endeavours to conceptualize an integrated water supply knowledge base by integrating LK with SK to
improve water supply planning. The conceptual framework in Figure 5-1 illustrate five steps for
integrating LK which are expounded below.
Step 1 in the figure start with the collection of relevant LK and SK. In doing so, various methods and
tools are used to elicit, record and documents both knowledge systems. These may include such tools
discussed in section 2.5.1 like, focus group discussions, Community forum, Social survey, consultative
forums, structured households‟ survey, and interviews among others.
Step 2 integrate the LK (from local community responses), SK (from urban water management
authorities), results of which is a hybrid water supply planning knowledge base generated after integration of the
two knowledge sources by use of GIS & T. In the figure, instead of LK being entered directly into the

INTEGRATING LOCAL KNOWLEDGE IN PLANNING AND MANAGEMENT OF WATER SUPPLY PROVISION IN THE INFORMAL SETTLEMENT OF STONE TOWN,
ZANZIBAR
40
water supply knowledge base, it is first processed, transformed and integrated with SK by use of GIS & T in
order to come up with a hybrid knowledge system for use in integrated water planning and management decisions.
As discussed in section 5.3.1 LK has inherent limitations associated with its inability to integrate
adequately into the realm of SK, but GIS methodologies offer various solutions to these difficulties. In
this regard, the use of dotted line in the framework above is to illustrate the perceived difficulties in
integrating the multifaceted and multi-sourced LK with SK. GIS is then used, both as a unifying medium
through which those difficulties can be overcome, and as a medium that can be used to produce a unified
SK-LK referred to as “water supply planning knowledge base.”
Water supply planning process
Water supply planning
Knowledge baseHybrid [LK-SK]
Integrated water planning and
management decisions
Geo Information
Systems and technology
(GIS & T)
Scientific
Knowledge
[SK]
Local
Knowledge
[LK]
Urban authority‟s
management of water
service provision
Local community‟s
responses to water
availability
Situational
analsyis
Engineering
and design
Appraisals and
choiceImplementation Maintenance and
repair
Monitoring & Evaluation
Urban water infrastructure planning
dimensions [IWRM]Water supply
capacityWater demands
Inte
grat
ion
of
LK
Lin
kin
g L
K in
dim
ensi
on
s o
f urb
an
wat
er s
up
ply
[&
IR
WM
]
Technical
dimension
Socio-economic
dimension
Management
dimension
Environmental
dimension
Ap
plic
atio
n o
f
LK
in w
ater
sup
ply
pla
nn
ing
pro
cess
Ste
p 2
Ste
p 3
Ste
p 4
Ste
p 5
Ste
p 1
Applying
methods and tools to
elicit & document
LK and SKCo
llect
ing
LK
Shifting from conventional /
traditional planning to
participatory urban water supply
planning process
Fro
m c
on
vect
. to
Par
ti. w
ater
pla
nn
ing
app
roac
h
Figure 5-1 A conceptual framework for integrating LK with SK into urban water supply planning
As is currently the case, and in the absence of GIS & T, the two knowledge systems have continuously
been used in water supply planning albeit the inherent difficulties mentioned above, that is why solid lines

INTEGRATING LOCAL KNOWLEDGE IN PLANNING AND MANAGEMENT OF WATER SUPPLY PROVISION IN THE INFORMAL SETTLEMENT OF STONE TOWN,
ZANZIBAR
41
are used to link LK and SK directly to the “water supply planning knowledge base” without going first in the
GIS &T for integration purposes.
The output of step 1 enables urban water management authorities to make “Integrated water planning and
management decisions” that can then be used in the execution and management of water supply infrastructure
projects, and for this research, decisions to improve water supply in the informal settlements of Zanzibar.
Step 3 links integrated knowledge base with “urban water infrastructure dimensions.” This step is very crucial as
it helps the water authorities to connect and indeed integrate the LK gathered from the communities with
the best water management practices as spelled out in the IWRM frameworks discussed in section 2.2.2 in
literature review chapter.
In addition to being source of SK, it is the responsibility of urban authorities to provide “water supply” that
has the capacity to meet the generated “water demands” from the communities and other water consumers.
In this respect, urban water infrastructure planning decisions are made based on three inputs; the
communities “water demands” symbolised square with broken lines, the urban authority‟ “water supply
capacity” symbolised also by square with broken lines and the output of step 2 which contain an integrated
package of knowledge to facilitate decision making processes.
This step is also very important as it helps local authorities to dissect the broad packaged LK into various
constituent aspects of each dimensions of urban water infrastructure planning. It thus moves from
generalisation to more specific useful LK components. These components are produced from the GIS
database specifically tailored to suit each dimensions planning theme (for example, efficiency of water
supply is a criteria within water management dimension. To assess this criterion, one can interpolate in the
GIS database, the LK aspect of daily water availability with the spatial coverage of a water supply system).
Step 4 goes further beyond the water dimensions to the actual step by step application of integrated LK in
the water planning process. The input and output of each planning process steps affects and is affected by
the dimensions of urban water supply dimensions. This is may be agued in the sense that water supply
planning and management is a cyclic process that generates both positive and negative externalities to the
users, providers and to the environment (see section 2.3 ). A specific LK is needed to address each step.
For example in the situational analysis step, there is need to gather not only local knowledge of the water
uses and pollution threat only within an urban water supply coverage but also need to LK on action and
activities of water users located in the river upstream that may leads to pollution of water supply
downstream. This in essence will affect how environmental dimension of water planning is carried out; say
like the adoption of „polluter pay principles‟ or even instituting fines and legal measures.
The final step 5 of the framework involves the development of a participatory urban water supply
planning process that shifts the focus of water planning from the traditional/conventional planning
process to a participatory planning process LK is gathered from the people; therefore, the urban authority
should not only gather knowledge from them but should actively involve them in the water planning and
management process. This is the new paradigm shift advocated for by IWRM principles (see section 2.4)
in order to address the water supply problems facing urban areas and especially so the urban poor. This
section will be elaborated in chapter 7.
5.6. The approach, tools and methods used to collect LK during fieldwork in Zanzibar
This research employed a qualitative GIS, usually referred to as mixed method to collect LK. According to
Cope & Elwood (2009), Qualitative GIS facilitates the integration of qualitative research with GIS by
providing methods to collect, analyze and visualize qualitative research findings in any integrated way. The
INTEGRATING LOCAL KNOWLEDGE IN PLANNING AND MANAGEMENT OF WATER SUPPLY PROVISION IN THE INFORMAL SETTLEMENT OF STONE TOWN,
ZANZIBAR
42
overall approach was the use of a case study through which these qualitative GIS methods were used in
order to get a comprehensive understanding of the process of water service and infrastructure provision in
Zanzibar. Case study approach is an approach employed by many social scientists in their qualitative
research (Soy, 1997) to investigate a social phenomena within its real-life context through an analysis of an
individual, group or communities (Kumar, 2005) and using a multiple sources of evidence (Yin, 1984 as
quoted by Soy, 1997). This helps to collect a variety of data and information as it narrows its focus to the
area under investigation and a detailed analysis of various issues under investigation is conducted (Soy,
1997). The research adopted a triangulation approach; which entails the use of mixed methods (Soy, 1997)
to explore the relationships of different variables affecting water service and infrastructure provision. This
is why different participatory tools and methods formed a major part of eliciting, recording, and mapping
local spatial and non-spatial knowledge.
Traditionally, various participatory tools and methods have been applied to collect LK (Chambers, 1994)
like rural rapid appraisal (RRA) and participatory rural appraisal (PRA). The ongoing development of
geospatial technology, specifically Qualitative GIS has led to improvement of these methods while
developing new ones with better capabilities to collect qualitative information (Cope & Elwood, 2009;
Kumar, 2005). During fieldwork, LK was collected by these new improved methods; focused group
discussion, participatory mapping, households‟ questionnaire survey, open-ended and semi-structured
interviews, personal interviews with the communities, geo-coded transect walk, and key experts‟
interviews. According to Close (2003), these participatory methodologies allow researchers to modify their
questions as local situation dictates and allow the researcher to use multi disciplinary approach that enable
to elicit wide-ranging viewpoints of LK. These methods are detailed below.
5.6.1. Structured and unstructured household Interviews facilitated by use of IPAQ, satellite image and GPS
Household interviews were conducted partly through questionnaire administration and face-to-face
interviews in order to gather local people‟s views and responses on a wide range of issues concerning
water supply provision. The households‟ questionnaire survey was aided by use of GPS, IPAQ and
satellite image in order to collect geo referenced LK. 325 questionnaires were retrieved; 125 for the site A
and 200 for site B.
The main variables that were covered by the questionnaire were derived from the underlying independent
and dependent variables of water and infrastructural service provision. The variables included; LK about
the capacity and performance of water supply system (efficiency, reliability of water supply system, water
cost, coverage and daily household water consumption), and LK concerning the assessment of the water
management and service provision (accessibility, consumer‟s satisfaction, reliability, affordability,
acceptability of pricing for water services and household connection to piped water). Other variables of
this research came from the households‟ socio-economic profiles like (household size, educational level,
employment, and income levels). Prior to departing for fieldwork, secondary sources of information and
literature were explored in order to get an in-depth understanding beforehand on all the variables
mentioned above.
5.6.1.1. GIS-based household Interview design and preparation
The interview was designed bearing in mind that the LK to be collected would be easily inputted and
indeed be compatible to the GIS software data handling. Therefore, the questionnaire was properly coded
and spatial coordinate for every household questionnaire points were collected in order to enable easy
processing and input into GIS database. The starting point of fieldwork data collection was to design a
“LK data collection strategy” (Figure 5-2) that would enable a comprehensive assessment of all variables of
water supply situation in the informal settlements of Stone town.

INTEGRATING LOCAL KNOWLEDGE IN PLANNING AND MANAGEMENT OF WATER SUPPLY PROVISION IN THE INFORMAL SETTLEMENT OF STONE TOWN,
ZANZIBAR
43
Satellite imageZnztown.ecw
Base map preparation
HH Interview Design
Local
community
assessment
Map based HH survey Interview
Participatory method
prep.
- FGDTransect walk design- Unstructured interv.- Personal Interv.- Participant observ.
GIS
LK Collection
Data prep
[SPSS]
Figure 5-2 Component of a GIS-based household interview design and preparation
A well planned “household interview design” facilitated the collection of such a big number of household
survey interviews. Each study site was divided into equal grids of 100 by 100 meters and further
subdivided into 50 by 50 meters grids as Map 5:1 illustrates. These were superimposed on a high-resolution
satellite image. In addition, a spatially and evenly distributed households survey points generated from GIS
were also superimposed on the satellite image. By printing this at a scale of 1:4000 on largest paper size
A0, every house and other structures were clearly visible. Since there were only three GPS and one IPAQ
available to correct the coordinates of interviewed households, each research assistant was given the
above-mentioned A0 sized printed satellite image to mark the exact point of where household was
interviewed and later GIS was used to generate these coordinates. Six research assistants from Zanzibar
University selected from within the study areas helped the researcher to administer the questionnaires. For
those absent households earmarked for interview, a replacement was chosen randomly but within a radius
of 25 meters. Reconnaissance and familiarization tours were conducted every time the household survey
interview would take place and every time, the research assistants would be assigned specific areas guided
by the gridlines. A total of 5 days were spent conducting households‟ survey interviews. However, the
fieldwork coincided with election period that proved challenging for a foreigner to interview local
residents but the research assistants helped greatly in the interviewing of the local communities. They
were given prior training on the purpose of the research and how to conduct the questionnaire
administration. A test questionnaire was administered in order to get the relevance of the questions from
the local residents and their understanding of the issue of this research. After this test, the questions were
revised according to the experience and feedbacks from the community.
Base maps were prepared in order to aid the household survey interviews data collection. Various shape files
were superimposed on a geo referenced high satellite image of Zanzibar satellite image in order to make
base maps, including the roads poly lines, building footprints and household random points that were
superimposed on. The geo referenced satellite image was also inputted into IPAQ that also aided in data
collection.
The final part was to prepare issues to be addressed by the participatory methods; this included the setting of
questions for focused group discussions, deliberating on issues to be asked in the personal interviews and
issues to be observed in the transect walks.
For study site, open fields and playgrounds were first excluded in picking the random points since no
households were located in these areas. The random sample points were distributed in such a way that the

INTEGRATING LOCAL KNOWLEDGE IN PLANNING AND MANAGEMENT OF WATER SUPPLY PROVISION IN THE INFORMAL SETTLEMENT OF STONE TOWN,
ZANZIBAR
44
minimum allowed distance between any two points was set to be 25 meters. This was to make sure that
the LK collected would be spatially and evenly distributed in order to produce maps that are more realistic
during the spatial interpolation stage and to overcome the limitation of the IDW spatial interpolation
method (see section 5.7.1).
Map 5:1 Random selection of households for questionnaire administration
5.6.2. Focused group discussion (FGD)
Two focus group discussions with local communities were held on 6/10/2010 at Kwamtipura and
Mlandege Shehia. These aimed at gathering in-depth understanding and insight of local communities‟
opinions, perceptions, and experiences of water service provision and challenges they face in their area.
Prior to starting the group discussion, the purpose of the study was explained to all participants. The
discussion topics were developed beforehand to provide broad theme for discussions but were modified
as situation dictated. After this session, men and women were separated into two different groups where
they discussed commonly shared issues and afterwards the lists from two groups were combined. Picture
5-1 shows a FGD session held at study site B.
In both occasions, the FGD was held in the Sheha resident who also helped to organise these meetings.
At the end of every FGD, one of the participant read out issues discussed in order to validate and verify
information collected.

INTEGRATING LOCAL KNOWLEDGE IN PLANNING AND MANAGEMENT OF WATER SUPPLY PROVISION IN THE INFORMAL SETTLEMENT OF STONE TOWN,
ZANZIBAR
45
Picture 5-1 Focused group discussion Session at Kwamtipura Shehia
5.6.3. Structured and unstructured key informant interviews
Various experts listed below were consulted. The key informant interviews were structured as open
discussions oriented along a list of topics and questions prepared beforehand. This approach was also
made flexible to accommodate for new topics and issues that emerged during the discussion. Key experts
were contacted through snowballing sampling. The snowballing sampling according to Patton (1990) is an
approach used for locating information-rich key informants. It is used to get the most important
informants that poses in-depth knowledge, skills and insight into the issues under investigation (Castillo,
2009; Patton, 1990). Those consulted included:
Source
Respondents No. of interviewees
1. Study site A (formal settlement )
1. Households 2. Village heads (Sheha) 3. Focused group discussion
200 2 1
2. Study site B (informal settlement)
1. Households 2. Village head (Sheha) 3. Focused group discussion
125 2 1
3. Zanzibar water authority (ZAWA)
1. Director General 2. GIS and IT expert 3. Technical and design officer 4. Planning and policy officer 5. Administrative officer 6. Commercial director 8. Legal Officer
1 1 1 1 1 1 1
4. Survey and Urban Planning, Department; Ministry of lands
1. Chief physical planner 2. Chief of cadastre 3. Head of mapping section
1 1 1
5. Zanzibar Municipal Council 1. Deputy director 2. Municipal sewerage engineer 3. Legal Advisor
1 1 1
6. SMOLE 1. Land registration officer 1
Table 5:1Contacted people during fieldwork
5.7. Fieldwork data collection preparation
The fieldwork data collection took place from 10th September to 8th October 2010. Consent to collect
data was sought from ZAWA; the host institution during the one month period of fieldwork in Zanzibar.
In addition, the Chief Minister of Zanzibar together with the District Commissioner of the urban west
district were contacted to seek permission to conduct research. The supervisor was also very helpful in
INTEGRATING LOCAL KNOWLEDGE IN PLANNING AND MANAGEMENT OF WATER SUPPLY PROVISION IN THE INFORMAL SETTLEMENT OF STONE TOWN,
ZANZIBAR
46
establishing initial contacts from relevant government officers and private organizations the researcher
sought to contact. Key informant interviews were scheduled first. This was meant to give focus of broad
issues underlying the water service and infrastructure provision in Zanzibar. Secondly, the discussions
from these meeting and the pilot test of the questionnaire enabled the refining of questions that were then
administered to the larger population within the study site. After the preliminary analysis of household
questionnaires in order to get a cross-sectional picture of main issues of concerns raised by the
community, FGD followed. The topic for discussions revolved around the main issues of concerns
deduced from the questionnaires. The research instruments (GPS and IPAQ) were tested beforehand and
brief practical training was given to research assistants in order to ensure that reliable data was collected.
5.7.1. Spatial interpolation of LK using IDW method
After collection LK, and inputting it in the GIS database, the next step was to carry out a spatial analysis
in order to map and visualize this knowledge. ArcGIS was used to perform spatial interpolation of LK
collected.
Spatial interpolation method is a procedure of estimating the value of properties/ points at un-sampled
sites within the area covered by existing observation (Haithcoat). The process uses points with known
values to estimate values at other unknown points (Sibson, 1981) with an aim of creating a surface that is
intended to best represent empirical reality (Anderson, 2001). The household point, using the associated
attributes information are spatially interpolated to create a raster surface with estimates at those locations
(raster cells) where no samples or measurements were taken in order to generate a continuous map. The
output maps of the interpolation analysis were inferred to make statements of the whole study area.
Inverse Distance Weighting (IDW) raster Interpolation method was used for this analysis.
5.7.1.1. Why raster interpolation method for this study
The raster interpolation method assumes that spatially distributed objects within a certain geographic
space share certain spatial correlation and this was the aim of this research, to be able to map community
perception across the study area using a scientific method instead of making casual generalisation. It has
been found out that things that are close together tend to have similar characteristics, and this research
interpolated the sampled household point assuming that those households near the sampled points also
shared the same views with their neighbors. For instance, households in informal settlements with close
proximity to one another share certain aspects like water sources or lack of it. One can therefore predict
with a certain level of confidence that for those sampled households, the nearby households also shared
the same characteristics in term of water supply situation. This method has the capability of measuring this
phenomenon (Watson, 1999). In setting the household survey points for questionnaire administration, a
rule was used whereby sampling was done in such a way that the minimum distance between any two
household points was set to be 25 meters. This was to ensure that each sampled households predicted a
better spatial representation of the other un-sampled households.
5.7.1.2. Inverse Distance Weighting (IDW) raster Interpolation method
The IDW method assumes that those points closest to the predicting location have most influence on the
predicted value than those farther away and uses measured values of sampled location in order to predict
the values for the unmeasured locations. It is based on the assumption that the interpolating surface
should be influenced most by the nearby points and less by the more distant points (Sibson, 1981). IDW
interpolation determines cell values using a linearly weighted combination of a set of sample points where
the weight becomes a function of inverse (Watson, 1999). It thus assigns more weight to those points
closer to the interpolation point than those farther away hence its name (Watson, 1999). According to
Watson the calculated rates surface will depend on the underlying power value and the neighbourhood
search strategy.

INTEGRATING LOCAL KNOWLEDGE IN PLANNING AND MANAGEMENT OF WATER SUPPLY PROVISION IN THE INFORMAL SETTLEMENT OF STONE TOWN,
ZANZIBAR
47
However, if the sampled data collected is unevenly distributed across the study area, it produces clustered
results of the phenomena being interpolated. To address this problem, this study used a GIS-ruled based
method to generate an “evenly and spatially” distributed sampled household survey points. A minimum
distance between any two points was set to be 25 meters to reduce data clustering (see Map 5:1). Another
problem according to Anderson (2001), is that the output surface is usually sensitive to outliers due to the
inclusion of the original data values at the sample points. This problem was addressed by first using SPSS
to conduct statistical analysis of data to check for outliers before exporting it to ArcGIS.
.
5.7.1.3. Flow chart showing steps of IDW interpolation
From the questionnaire SPSS files, some variables that represent well the spatial characteristic of water
service situation were processed, recoded, and converted to DBF files. These DBF files were then joined
with the 325 household survey sample points in ArcGIS. Using attribute function, the points for
respective study areas were extracted and overlay with Shehia boundaries. By using spatial analytical tools
“raster interpolation” in ArcGIS 9.3, the spatial analysis of various variables across the two study sites
were interpolated and visualized. The steps followed in this process are given in Annex 1.


INTEGRATING LOCAL KNOWLEDGE IN PLANNING AND MANAGEMENT OF WATER SUPPLY PROVISION IN THE INFORMAL SETTLEMENT OF STONE TOWN,
ZANZIBAR
49


INTEGRATING LOCAL KNOWLEDGE IN PLANNING AND MANAGEMENT OF WATER SUPPLY PROVISION IN THE INFORMAL SETTLEMENT OF STONE TOWN,
ZANZIBAR
51
6. LOCAL KNOWLEDGE ON WATER SUPPLY AND SERVICE SITUATION IN THE STUDY AREA
This chapter provides the results of the LK and SK gathered through the application of various methods;
household questionnaire survey, experts‟ discussions, focused discussion groups and physical observation
made during the transect walk survey. Also presented are the maps from spatial interpolation of LK.
6.1. Criteria for assessing the water supply situation
Wide ranges of variables were included in the household survey questionnaire, focussed group discussion
questions and key informant interviews questions to assess water supply situation in Zanzibar. This aimed
at gathering comprehensive information on water supply situation in the two study areas. In addition to
these, use of triangulation method helped the researcher to get an in-depth knowledge of water supply
situation from different perspectives of local communities and experts. In order to place these findings
within the within the conceptual framework developed in section 5.5, and to place them within the IWRM
dimensions of urban infrastructure planning discussed in section 2.3, the results of the assessment are
categorised into four dimensions.
Table 6:1 LK collected during fieldwork and categorised into four dimensions of urban water supply
Dimensions of urban water supply LK collected
1. Technical dimension Responses to water availability in the study area
Household water sources Household connection to piped water, Alternative sources of water for households,
Responses on water accessibility Accessibility of water sources (time taken to nearest water sources by household),
2. Management dimension Views on water service provision Reliability of piped water, (daily water availability)
Efficiency of piped water, Viewpoints, opinions and responses on the problems-causes-effects of water problems of households
Major problems of water supply, causes of these problems and effects of these problems on family Reporting of water problems Prioritization of community infrastructure needs
Community cooperation and participation Local community cooperation, Community involvement by ZAWA inclusion of women in decision making
3. Socio-economic dimension
Perception on ZAWA services and contingency analysis on willingness to pay for water services
Household expenditure on buying water per day Willingness to pay for improved water services, Amount of money willing to pay per month customer service satisfaction,
4. Environmental dimension Perceptions on quality of water
Quality of pipe water, Causes of water pollution and sources, Sewerage disposal system (toilets types)

INTEGRATING LOCAL KNOWLEDGE IN PLANNING AND MANAGEMENT OF WATER SUPPLY PROVISION IN THE INFORMAL SETTLEMENT OF STONE TOWN,
ZANZIBAR
52
6.2. Technical dimension: Water availability in the study area
6.2.1. Households water sources and accessibility
ZAWA piped water was found to be the main source of water for majority of interviewed households in
both formal 105 (52%) and informal areas 57 (46%), followed by shallow boreholes 67 (33%) in the
formal and 47 (38%) in the informal settlement. Others sources included private boreholes and buying
from the vendors as shown in Figure 6-1
Figure 6-1: Main sources of water for households
Households in the informal settlements responded to travel far to access water especially when tap water
was not available, with 28% saying they take 10-15 minutes whereas a higher proportion (34%) of those in
the formal settlement reportedly take 1-3 minutes to travel to the nearest water source. This is illustrated
in the Figure 6-2 below.
Figure 6-2: Time taken to travel to nearest water source by households
More women than men are charged with responsibility of fetching water. This emerged from the focused
group discussion where most women said they are engaged in fetching water in a daily basis as opposed to
men who said they rarely fetch water and viewed that as a responsibility of women and children. Among
issues raised by women, they said they waste many productive person-hours in travelling to fetch water or
in the long queues at water points. They also reported that conflicts and thefts of water buckets are
common at the community boreholes points. On the other hand, men reported that they do help but
9
34
26
4
16 12 11
18
23
6
28
13
-
5
10
15
20
25
30
35
40
0 min 1-3 min 4-6 min 7-9min 10-15 min > 15 min
Perc
en
t
Time taken to travel to the nearest water source by respondents
Formal area
Informal area
52
46
33 38
8 10
7 6
-
10
20
30
40
50
60
Formal area Informal area
Per
cen
t
Main sources of water for households
Piped water from ZAWA
Shallow Borehole
private borehole
buying from vendors

INTEGRATING LOCAL KNOWLEDGE IN PLANNING AND MANAGEMENT OF WATER SUPPLY PROVISION IN THE INFORMAL SETTLEMENT OF STONE TOWN,
ZANZIBAR
53
mostly on technical aspects like repair of water pipe. They said their biggest responsibility is to feed the
family and rarely spend much time at home during the daytime. An observation made by the researcher
during the households‟ survey is that most women were found at home during the daytime while very few
men were found at that time.
On average, households were found to consumes 4-5 Jerry cans of water per day (one Jerry can is 20 litres)
with 109 (33.5%) responding to the affirmative. The main water uses for households were found to
include drinking, cleaning, bathing, washing, and toilet flushing. However, respondents said that this
average consumption varies and can increase up to 10 Jerry cans per day especially when they carry out
laundries activities. Car washing activities were being carried out in the ocean since it was just a walking
distance. No water uses for urban agriculture was found in the two study sites.
6.2.2. Households’ connection to piped water and water availability
Although both study sites had a high percentage (74%) of households connected to piped water, a
moderate percent (38%) of those in the informal area still had no piped water connection as compared to
only 19% in the formal areas that had no piped water connection as Figure 6-3 illustrate. Despite a high
piped water connection, a high percent 178 (75%) of households connected to piped water said that water
is not available in the tap everyday (Figure 6-4). Only 61 (25%) of the households connected said water is
available daily in their taps. Furthermore, more than half of those not connected 51 (59%) still said water
is not available with only 35(41%) saying water is available.
Figure 6-3: Household connection to piped water
Figure 6-4: Household connection to piped water versus daily water availability
81
62
19
38
-
10
20
30
40
50
60
70
80
90
Formal area Informal area
Perc
en
t
Household connection to piped water
yes
no
25
41
75
59
0
10
20
30
40
50
60
70
80
House Connected Not connected
Perc
en
t
Household connection to piped water versus daily water availaility
Water available
Not available

INTEGRATING LOCAL KNOWLEDGE IN PLANNING AND MANAGEMENT OF WATER SUPPLY PROVISION IN THE INFORMAL SETTLEMENT OF STONE TOWN,
ZANZIBAR
54
When tap water was not available, majority 235 (72%) of all interviewed households reported to buy water
from water vendors, 55 (17%) got from public wells/boreholes while 35 (11%) borrowed from their
neighbors as Figure 6-5 shows.
Figure 6-5: Alternative source of water when piped water is not available
The researcher affirmed the lack of water during the transect walk where long queues and overcrowding at
water sources were witnessed as Picture 6-1 confirms. Most of the tap water found were dry.
Picture 6-1 Long queues at a communal water tap and overcrowding at communal borehole
6.2.3. Private and community owned water sources
To supplement the frequent shortage of pipe water, residents especially in the informal settlements had
established alternative water sources, most of which were found to be very shallow and unhygienic water
wells. The transect walk survey (Map 6:1) that was conducted in the area indentified many privately owned
water wells where residents fetched water free. At Kwamtipura Shehia, communities helped to map some
of these privately owned shallow wells, which includes; Kwa Naneru well, Kwa Abdallah, Kwa Amboni,
Msikitini, Kwa Amboni and Kwa Bi Hidaya shallow wells (see pictures embedded in Map 6:1). Some of
these were just small shallow holes dug on the ground; others were dug at the corners of buildings
foundation. As residents pointed out, the water table in Zanzibar is very close to the surface in most areas
and they just dug few centimetres on the ground to get water, and just wondered why ZAWA cannot do
the same to provide them with water. However, due to poor sewerage system, and that majority (74%) of
72
1711
01020304050607080
Buying from water vendors
from public wells/boreholes
from neighbors
Pe
rce
nt
Alternative water source
Alternative water source when piped water is not available
Water source

INTEGRATING LOCAL KNOWLEDGE IN PLANNING AND MANAGEMENT OF WATER SUPPLY PROVISION IN THE INFORMAL SETTLEMENT OF STONE TOWN,
ZANZIBAR
55
the residents were found using pit latrines (see Annexe 7), the risk of water contamination by raw
sewerage was very high.
However, there were very few community owned and managed boreholes found in the formal areas, one
community owned and managed water supply project was found at Kwalaamsha Shehia. The project is
composed of a community borehole connected to two main tanks and a small pump station that pumps
water to these tanks. The communities buy water from these tanks especially when tap water is not
available. The project, according to one of the committee member, was initiated by community themselves
due to persistent water shortages and they decided to dig their own borehole. They bought two 1,500 litres
tanks where water is pumped and stored. The communities contributed some money after which the area
member of parliament was approached to top up what they had managed to contribute since it was not
enough to complete the entire project. The total cost for the whole project was about 1500 Euros (about
Tshs. three million). The community chose amongst themselves a special committee to manage the
project. A 20-litres bucket of water now cost just Tshs 50, which is much cheaper and affordable as
compared to the Tshs 200 a bucket that water vendors charge for the same. The proceeds gotten from the
sale of water is channelled to the maintenance of the project and to pay electricity that is used to pump
water. The main tank is also connected to another tank 100 meters away in the same neighbourhood and
water is pumped to a 1000 litres tank where residents buy water (Picture 6-2). Interviewed residents
expressed satisfaction and much benefit the project has brought to them.
Some of the water project beneficiaries interviewed were very optimistic on the project and the benefits it
has brought to them. An interview excerpts with one of the project committee member is given below.
“Since we established this project, I no longer lack water like I used before, it has also helped me access water nearby
as compared to earlier where I used to go long distance in search of water (interview with a resident of Kwalaamsha
Shehia ). We used to complain often to ZAWA of our water problems but they would not take any action to solve
our water problems. Therefore, we decided it would be better to start this project in order to address the persistent
water shortages we were facing. Our women and children would travel far in search of water and waste a lot of time
in the process. The water they got often was not enough for our family needs. Then we mobilised the community and
told them to contribute any amount they could get, some contributed Tshs. 50, 100 or more. Since the money we got
was not enough to dig the borehole and buying the tanks, we approached the member of parliament who, using the
money that is allocated by the government for Shehia development was able to top up what we had and we were able
to construct this project you see here. When ZAWA water is not available, the residents of this area just come here
and buy. This ensures we have reliable water throughout anytime we need it, the people can now afford to attend to
other business without worrying where they would get water at the end of the day,” (interview with one of the project
committee member)

INTEGRATING LOCAL KNOWLEDGE IN PLANNING AND MANAGEMENT OF WATER SUPPLY PROVISION IN THE INFORMAL SETTLEMENT OF STONE TOWN,
ZANZIBAR
56
Map 6:1 Transect walk route showing alternative community water sources in the informal settlement
Picture 6-2 A community owned and managed water supply project at Kwalaamsha Shehia in the formal settlement
6.3. Economic dimension: Willingness to pay for Improved water supply services
6.3.1. Households expenditure on buying water
Overall, majority of households 116 (35.7%) in both the study areas said they do not buy water (Annex 5).
Although various reasons can be attributed to this, resistance to pay for water use is high since domestic
water use had been offered free of charge for a long time. Those households connected to ZAWA piped
water network are required to pay a flat rate of Tshs 2000 per month. However, many residents do not
accept to pay for water after payment system was introduction in 2008. As one resident pointed out,
“ZAWA want us to pay yet the taps are most of the time dry and they have not even put water meters to indicate how much

INTEGRATING LOCAL KNOWLEDGE IN PLANNING AND MANAGEMENT OF WATER SUPPLY PROVISION IN THE INFORMAL SETTLEMENT OF STONE TOWN,
ZANZIBAR
57
one should pay.” Indeed, majority shared this view as results in figure 6-4 revealed. The residents expressed
dissatisfaction with the flat billing method in place since they are supposed to pay for water that they
rarely receive in their taps.
According to a ZAWA expert, “as long as one receives water from the tap regardless of quantity and its reliability, one
is obliged to pay.” However, the expert could not ascertain how a person is required to pay for water he/she
has not consumed
The discrepancy found was, whereas ZAWA charged people for water use, they offer free water in the
many public taps found across the whole town. In fact, many residents preferred to fetch free water there
since water in those taps was available in most of the times as compared to individual taps in their houses.
It was also observed that many water vendors fetched this free water and sold it to households at
exorbitant prices. Despite this, ZAWA expects every household to pay monthly for water services. Other
factors included the presence of public and privately owned boreholes and shallow wells where people
fetched water free. Nevertheless, a ZAWA officer said acknowledged the challenges of flat rate payment
method and said that they were in the process of installing water meters.
“The flat rate payment method has major setbacks since we cannot be able to know how much water a person use per
month, others exploit this weakness by using water for commercial purposes which has a different pricing system. In
addressing this, we have set out a pilot scheme in two Shehia where water meters have been installed, eventually, we
plan to replicate this to all our water users,” (Interview, key expert, ZAWA).
6.3.2. Households satisfaction with ZAWA services
The survey revealed a very high level of dissatisfaction (84%) with ZAWA services by households within
the informal settlement. In addition, more than half of interviewed households (53%) in the formal areas
also expressed their dissatisfaction with services they received from ZAWA as Figure 6-6 illustrates. Only
a marginal percent expressed their satisfaction in both study areas.
Figure 6-6 Households satisfaction with ZAWA services
Many respondents attributed their dissatisfaction to the poor water management by ZAWA while others
said unreliability of piped water was a cause (Annex 9). The water-rationing schedule where households
are supposed to receive water 3 days in a week depending on zones they are was found to be ineffective.
Instead of 3 days a week as ZAWA stated, many areas water comes sometimes once a week or once a
month as residents indicated. In some areas for example Kwamtipura Shehia, some residents indicated
they had had no water for the last three consecutive months. When water comes, it is only for a few
6 8
41
8
53
84
-
10
20
30
40
50
60
70
80
90
Formal area Informal area
Pe
rce
nt
Households satisfaction with ZAWA services
Satisfied
unsatisfied
very unsatisfied

INTEGRATING LOCAL KNOWLEDGE IN PLANNING AND MANAGEMENT OF WATER SUPPLY PROVISION IN THE INFORMAL SETTLEMENT OF STONE TOWN,
ZANZIBAR
58
hours, either late at night around 8 to 9 pm or very early in the morning around 4 to 6 am when most
people are still sleeping. Respondents said that water comes with very low pressure and rarely do they
fetch enough before it is turned off again. This irritated residents as one respondent retorted, “How do they
expect everybody to fill his Jeri cans yet it takes around 20 minutes to fill a 20 litre Jeri can with an hour they give us to do
so?” this situation was the same in most part of Zanzibar town jurisdiction especially in the low income
areas.
6.3.3. Households’ willingness to pay for improved water service delivery
The respondent were asked their opinion on whether they would be willing to pay specified amount of
money for water use under certain circumstances. The researcher posed respondents a hypothetical
situation in the form of the question,” if you could be connected to ZAWA public piped water scheme
with water being metered and paid for according to how much you use, and on condition that the water is
available every day, then how much would you be willing to pay on a monthly basis?” The hypothetical
situation was carefully explained to ensure that the survey was understood. The respondents were left to
decide their own figure rather than being given some predetermined figures.
The results revealed a high willingness to pay for (improved) water services in both study areas with. 211
(65%) of total interviewed households saying they would be willing to pay if guaranteed daily reliability of
water supply. However, 114 (35%) were unwilling to pay. This may be partly attributed to some of the
residents having their own private boreholes and shallow wells. There was more willingness to pay in the
informal areas as compared to in formal areas as shown in Figure 6-7.
Figure 6-7 Households willingness to pay for improved water services
A similar study conducted by ZAWA “Zanzibar Pilot Citizen Report Card” also revealed a high
willingness to pay for water services. In that study, 65% of all users of public drinking water facilities
reported that they were willing to pay more if better services are assured. The amount people were willing
to pay per month is Tsh. 1000 (median) with 91% quoting monthly remittance as the preferred timing
(ZAWA, 2008a).
Those not willing to pay cited many reasons to justify their response; poor quality of ZAWA water
services, inefficiency of ZAWA water management strategies and the attractiveness of free water. The
study revealed (personal communication) that ZAWA authorities have had little impact in explaining to
consumers the nature and composition of their service charges as a means of raising awareness of the
need to pay for water services. Many of the interviewed persons did not know how much and why they
had to start paying for the water use after it has been free for all the years.
62
70
38
30
0
10
20
30
40
50
60
70
80
Formal area Informal area
Perc
en
t
Households willingness to pay for (improved) water services
Yes
No

INTEGRATING LOCAL KNOWLEDGE IN PLANNING AND MANAGEMENT OF WATER SUPPLY PROVISION IN THE INFORMAL SETTLEMENT OF STONE TOWN,
ZANZIBAR
59
6.3.4. Willingness to pay versus household’s service satisfaction
Those household who expressed high dissatisfaction with ZAWA services also expressed highest
willingness to pay (54%) services are improved as shown in Figure 6-8. In addition, higher willingness to
pay came from those households‟ connected to piped water but dissatisfied with ZAWA water services.
Figure 6-8 Customer service satisfaction versus willingness to pay
6.3.1. Amount of money willing to pay for water consumption per month
Many respondents 114 (35%) still wanted the water services to remain free as has been previously the case
in Zanzibar. 89 (27%) of interviewed households expressed their willingness to pay Tshs 2000 for water
service on a monthly basis. Other amounts of money residents indicated they were willing to pay per
month are shown in Annex 6.
6.4. Environmental dimension: quality of water supply
6.4.1. Quality of piped water and water pollution sources
The overall quality of water was assessed using four criteria: taste, smell, presence of dirt/solid particles
and any other form of contaminations. The residents were asked to give their perceptions based on either
of the above. The results show that quality of water is generally perceived to be good, with 85% and 69%
of households in the formal and informal settlements respectively saying piped water quality is good.
It was observed from the transect walk that some communal an private boreholes and wells were located
near the garbage dumping sites whereas others were located near open sewer lines and chances of cross-
contamination were high as shown in Picture 6-3 below.
As regards water from boreholes and shallow wells, many households said that its quality was not good for
drinking and either boiled it to purify or used it for other household purposes. Most of these were
unprotected as one resident said. In addition, some storm water drainage in some areas were blocked by
garbage as Picture 6-3 also reveal.
4
54
62
30
2
0
10
20
30
40
50
60
satisfactory unsatisfactory no service from ZAWA
pe
rce
nt
Customerservice_satisfaction
yes
No
Willingness to pay

INTEGRATING LOCAL KNOWLEDGE IN PLANNING AND MANAGEMENT OF WATER SUPPLY PROVISION IN THE INFORMAL SETTLEMENT OF STONE TOWN,
ZANZIBAR
60
Picture 6-3 Unprotected communal borehole (left) and private borehole (right) in unhygienic places.
The study found out that majority of households 74% use pit latrines and 26% reported to use flash toilets
(Annex 7) although the sewerage services in the informal areas was reported to be in bad condition. Some
areas where the sewer line was malfunctioning, residents expressed concern of water contamination by
raw sewerage.
According to Zanzibar municipal council (personal communication), the centralized wastewater and
sewerage systems only cover the old Stone town and partly in Kikwajuni and Kilimani housing schemes.
Inadequate sewage disposal results in overflowing from pit latrines, septic tanks, soak pits and drains. Due
to the limited accessibility within the informal areas for sewer trucks to use in empting the septic tanks,
this often results in overflows and contamination of water. During the transect walk the communities
identified dumping sites that caused pollution and contamination of water sources. They were also able to
identify major causes of water pollution and pointed areas where the water infrastructure was at a great
risk of contamination with raw sewerage. The prevalence of waterborne diseases in Zanzibar is very high
as compared to other type of diseases diagnosed (Table 6:2). Secondary data from the ministry of health
revealed a high prevalence of waterborne related diseases such as cholera, dysentery, and typhoid with
diarrhoeal being the most reported diagnosis after malaria and recorded the highest increase in the two
years.
Table 6:2 Number of people diagnosed with various diseases
Diagnosis Year 2006 Year 2007
Malaria 222,323 102,293
TB 344 369
HIV & AIDS 1,206 714
Diarrhoea 46,696 55,774
Dysentery 3,634 4,267
Typhoid 1,815 475
Source: Ministry of Health and Social Welfare,
From the interviews with the director of Zanzibar municipal council, he indicted that Zanzibar town does
not have a centralized sewage system and only 19 percent of all households are served by an old sewer
system that only covers the old stone town area. They also dispose off the raw sewage untreated in the
open sea. This can also be attributed to such high prevalence being reported.

INTEGRATING LOCAL KNOWLEDGE IN PLANNING AND MANAGEMENT OF WATER SUPPLY PROVISION IN THE INFORMAL SETTLEMENT OF STONE TOWN,
ZANZIBAR
61
6.5. Management dimension: Community involvement in water provision management
6.5.1. Community participation in water provision planning
Contrary to claims made by ZAWA official during the key expert interview that they involve the
communities in water supply provision. Almost all, 301 (93%) of interviewed households said they have
never been involved by ZAWA in water provision management, or having been consulted in addressing
the water problems they face. A higher proportion of these households came from the formal areas 190
(95%) as compared to 111 (89%) of households in the informal areas (Figure 6-9). Only few 23 (7%) in
both study areas responded to having been involved by ZAWA in minor activities like offering physical
labour (digging of new water lines trenches, minor repairs and maintenance of public water taps).
Figure 6-9 Community involvement by ZAWA
6.5.2. Local community cooperation
On the other hand, the study sought to find out if people cooperate with one another, either in self-help
groups or in communally formed group to address the water challenges they face. A high proportion, 75%
of residents said they rarely cooperate in finding solution to shared community problems they face, with
159 (49%) and 86 (26%) in the formal and informal areas respectively saying they do not cooperate
(Figure 6-10). They were non committal on the usefulness of coming together into groups since they said
everyone caters for his/her own problems.
Figure 6-10 Local community cooperation
5 11
95 89
-
20
40
60
80
100
Formal area Informal area
Pe
rce
nt
Community involvement by ZAWA in water supply planning
yes
no
Involved
19
30
80
69
1 10
10
20
30
40
50
60
70
80
90
Formal area Informal area
Perc
en
t
Local Community cooperation
Yes
No
Sometimes

INTEGRATING LOCAL KNOWLEDGE IN PLANNING AND MANAGEMENT OF WATER SUPPLY PROVISION IN THE INFORMAL SETTLEMENT OF STONE TOWN,
ZANZIBAR
62
Many said that the government is the one responsible for solving their problems. They questioned why
they should help the government do its work, yet it had resources and capability to solve the problems
they face in their areas.
“Here most people tend to have individualistic altitude, and the mentality that government is supposed to solve
everything. Nevertheless, if someone can be able to bring us together to address this problem of water, I would readily
participate, since I suffer a lot everyday in search for water,” (interview, local resident 30.9.2010).
However, in every Shehia, there is a Community Development Committee (CDC) under the leadership of
the Sheha. The CDC is composed of community representatives and is formed by the local government
forms it and they act as the government entities for reaching out to the communities. The CDC, as the
Sheha of Kwamtipura reported, meets every Tuesdays to discuss community affairs and issues affecting
them. The issues raised are then forwarded to the district commissioners for deliberations and action.
During the FGD, the Sheha of Kwamtipura Shehia said that communities do raise grievances and issues
concerning water supply, which he forwards them to ZAWA management but they rarely address them.
“Every Tuesday, the CDC meets here at in my residence, the issues we discus in these meetings are mostly the
government directives and polices. The community representatives do raise problems facing the Shehia that I forward
during water board meetings at ZAWA, but they only promise to take action which they have not done so up to
now” (interview, Sheha).
6.5.3. Reporting of water problems to ZAWA
On the other hand, the study sought to find out what the respondents do when they have a problem
requiring ZAWA intervention. Overall for both study areas, many (61%) of the households said they do
not report water problems to ZAWA while others said they report to Sheha (figure 5-9). Only a very small
percentage (7.4%) said they report to ZAWA. Some residents said that even if they report, no action is
taken and over time, they have became weary with ZAWA inaction hence their reason of not reporting.
Even the Sheha said that he often raises communities‟ grievances with ZAWA officials any time he
receives them but no action is taken.
Figure 6-11 Reporting of water problems
28 35
63 60
9 5
-
10
20
30
40
50
60
70
Formal area Informal area
Pe
rce
nt
Reporting of water problems by respondents
report to Sheha
don’t report
report to ZAWA
INTEGRATING LOCAL KNOWLEDGE IN PLANNING AND MANAGEMENT OF WATER SUPPLY PROVISION IN THE INFORMAL SETTLEMENT OF STONE TOWN,
ZANZIBAR
63
6.5.4. Challenges facing households in meeting their household water demands
During the household survey, the households were asked to list all the problems they face on a daily bases
related to water. They were then asked to state their possible causes and probable effects these problems
had on their family wellbeing.
6.5.4.1. Main problems of water
Majority of households 102 (31%) said that frequent water shortages is the main problem across the two
study areas (Annex 8). On the other hand, 28% percentage of households within the informal settlements
indicated they travel far in search of water as compared to 22% of households within the formal areas.
The households also indicated they have to withstand long queues at the water point. Other problems
identified included; lack of money to buy water, lack of tap water inside the house, waste of time in search
of water, and over crowding in public taps as shown in the table below. Some of the views expressed by
respondents;
“Lack of water is a big problem especially in this neighbourhood; I would just request the concerned authorities to
find a lasting solution” (Interview, respondent, 28.9.2010).
“We want water; we are tired of waking up with this problem everyday. ZAWA should look for alternative ways to
provide water to us” (interview, respondent, 28. 9.2010)
Although the settlement structure in the formal areas like Kidongo Chekundu Shehia is suitable for
introduction of water infrastructure due to its regular and organized pattern, many residents still
complained about the water shortage problems. One issue contrary to the researcher‟s expectation worth
mentioning here is that residents did not consider lack of settlement planning as a probable cause of water
problem. “The capacity of the main pipe is not sufficient enough to cover the demand of all the
households in the study areas,” as one community member said. Those people located far away from the
main water pipes had more acute shortage of water than those near the mains.
“In this side of the settlement, we rarely receive water in our taps and when we do, the pressure is so low that it can
take up to 20 minutes to fill a bucket of water yet some people on the other side of the settlement receive water often”
(interview, respondent, 28. 9.2010)
According to ZAWA (personal communication), increasing demand for water especially in the urban areas
is among the key challenges facing water service provision. The experts said that ZAWA has not been able
to establish the necessary institutional mechanism to support water service provision since it has only been
operational for only two years. Another problem he cited was lack of professional staff at ZAWA to
manage the increasing water demands. Others included; unsatisfactory planning and management of water
supply, poor implementation of policies, and inadequate financial resources. Further more, the weak
collaboration and coordination between the ministry of land and the water authority contribute greatly to
current situation of water catchment encroachment in the town.
“One problem we are having as an authority is that we do not have full legal ownership of the water catchment areas
as they are under the ministry of land. When we do consult the ministry on this issue, they say that the government
owns the land and it should issue the title deed. They also say that the catchment areas have to be surveyed first by
the survey department. In addition to protecting the catchment areas, the provincial administration must also
contribute by offering security officer to protect the catchment. From my view, this is not a ZAWA affair alone but
need multi departmental corroboration, which is currently lacking. This limits our ability to take action in protecting
the environment and the water catchment resources we have despite these areas being under threat from encroachment.
(Interview, key expert,” ZAWA)
INTEGRATING LOCAL KNOWLEDGE IN PLANNING AND MANAGEMENT OF WATER SUPPLY PROVISION IN THE INFORMAL SETTLEMENT OF STONE TOWN,
ZANZIBAR
64
This disjointed approach to planning is viewed as ineffective in addressing the problem of informal
urbanization and infrastructure service delivery being experienced in Zanzibar. On the other hand, the
director of survey said that they do not involve the communities when making urban development plans
and policies. ZAWA is also under-resourced both in human and financial resources and this hampers
enforcement of policy and planning framework and their implementation. Lack of much needed financial
resources to upgrade the already overstretched existing water infrastructure is hampering the water
authority efforts in meeting its goal.
6.5.4.2. Main causes of water problems as identified by households
Poor management of water supply by the ZAWA was identified to be the main cause of water problems
by about 148 (45%) of interviewed households in both the study areas (Annex 9). Lack of enough public
water points was the second most mentioned cause of water problem (by about 21% of households) in
both study areas. Others causes included, old pipe network, high population increase that has continued to
exert more pressure on the existing old water infrastructure, lack of enough communal boreholes,
frequent electricity failure that affect water pumping, political interference and irregular rationing of water.
From the focused group discussion, many residents expressed the view that the main causes of water
problems in Zanzibar emanate from the poor management practices of water resources in Zanzibar, the
inability of ZAWA to provide enough water to meet the demand and poor water infrastructure
connectivity especially in the informal settlement areas. The participant in the FGD shared these views.
“The boreholes we have here are inadequate and the water pipes are old and worn-out leading to frequent water
supply shortage when they do breakdown. In addition, there is usually a very long queue especially in the morning
and evening when many people are fetching water” (FGD discussion, 24.9.2010).
“If the water supply can be increased and more community standpipe built within this settlement, many of the
problem we are facing can be greatly reduced” (FGD, 24.9.2010)
“The solution to these problem lies with ZAWA. It should improve water supply services by constructing more
water pipelines. It should also involve us (communities) in its decision-making rather than just assuming it knows
our problems better than we do” (FGD, 24.9.2010)
“ZAWA people should come closer to the communities for them to know the problems the communities face in
relation to water” (FGD, 24.9.2010).
“If ZAWA want to solve the water problems facing this Shehia, I would suggest that private water providers to be
allowed to do that task since it seems overwhelmed” (FGD, 24.9.2010)
6.5.4.3. Effects of the these problems on households well being
The major effect of these problems on household was identified to be health problems by 78 (24%), of
interviewed households, lack of enough water (18.5 %) and conflicts at public water taps (17.5%) as
shown in Annexe 10. Other effects included high costs of buying water from vendors, women spending a
lot of time in fetching water, poor hygiene, tiredness because of carrying heavy Jeri cans of water and loss
of sleep (most indicted that the water comes at night or very early in the morning.
6.5.4.4. Households prioritization of their public utility needs
Communities were asked to prioritize, in order of importance which public infrastructure utilities, services
they required most, and would like the government address first. Water supply was identified and
prioritised to be the most needed public utility 113 (41%) of households in the formal areas and 78 (24%)
by those in the informal areas. The second priority was health facilities by 74 (23%) of the households in
the formal areas and still 24 (11%) of those in the informal areas regarded water as their second priority..
The third priority according to the respondents was roads improvement by 47 (15%) by those households
INTEGRATING LOCAL KNOWLEDGE IN PLANNING AND MANAGEMENT OF WATER SUPPLY PROVISION IN THE INFORMAL SETTLEMENT OF STONE TOWN,
ZANZIBAR
65
on the formal areas and 20 (6%) by households residing in the informal settlement areas said schools was
their third priority
6.6. Spatial variation of water service provision in the two study areas
6.6.1. Spatial variation of water service provision in the informal areas
The spatial variability of households‟ perception to daily reliability of piped water and households‟
connection to piped water within the informal settlement areas is shown in Map 6:2 and Map 6:3.
Generally, as can be visually analysed, most households reported erratic water availability across the study
area except for a few areas. For those who reported water is available, the study found out that most of
them were near a public or private water point, owned their own water source, or resided in areas near the
main water pipes where pressure of water was good enough and hence water was available in the taps.
Although many households have piped water connection as seen in Map 6:3, the spatial distribution of
their responses to water unavailability is very high as visualized in Map 6:2. This, on the other hand, can be
used to support the high perception of households‟ dissatisfaction with ZAWA services across the study
area as Map 6:4 shows.
Despite many households being dissatisfied with ZAWA services, majorities of households across the
study area were willing to pay for improved water services as shown in Map 6:5 except for a few areas in
the eastern side of the study area consisting of Kilima Hewa and Kwamtipura Shehia where. Around this
area, as it was found out during the transect walk survey; many residents had dug their own shallow
boreholes and wells (see transect walk route in Map 6:1 in section 6.2.3). From the satellite image, it was
observed that the western side is located on the urban fridge where new urban sprawl was taking place and
there was not high population concentration. In addition, this area has relatively new housing
development as compared to the old, highly dense neighbourhoods in the western side of the study area
that is near the old stone town.
Interpolating community perceptions also helped to map those areas where community reported to taking
more time to access water sources as Map 6:6 shows. The spatial variation of the time taken by
households to travel to the nearest water point was evenly varied but many are those households who take
shorter travel time of zero to 10 minutes (refer to Figure 6-2). Those areas where residents reported to
take more than 10 minutes to the nearest water sources were either un-serviced by the water supply
network or there is not enough public water sources for households. ZAWA can earmark these areas for
spatial interventions purposes, for example in the North-western side of the study area shown in Map 6:6.
The perception of quality of water and those areas with significant negative environmental impact
affecting water quality is shown in Map 6:7. In terms of water quality, there was generally high perception
of good quality of water reported across the study area apart from some areas. For example in the eastern
side of Map 6:7 covering parts of Kilima Hewa Juu and Kwamtipura Shehia, there is an area where the
quality of water was reported to be bad. From the analysis of community feedback and the analysis of the
photos taken from the study area, the problem of water quality was diagnosed to be poor sanitation
services and unconventional solid waste disposal methods in those areas. Of particular interest was the
observation made during the transect walk around that area that revealed a large storm water drainage
trench which has been turned to a dumping site by the communities. Accorded to one resident, this trench
is especially dangerous during the rainy season. The residents said that due to close proximity of some
boreholes with this trench-cum-dumpsite, water contamination occurs. Indeed, some water pipes were

INTEGRATING LOCAL KNOWLEDGE IN PLANNING AND MANAGEMENT OF WATER SUPPLY PROVISION IN THE INFORMAL SETTLEMENT OF STONE TOWN,
ZANZIBAR
66
found loosely traversing this trench as picture 6-4 shows. The resident reported that during the rainy
season, the storm water destroy most of these pipes thereby affecting water supply.
Picture 6-4 A storm water ditch-cum-dumping site showing loosely exposed water pipes traversing across
the ditch and houses located very near the trench
6.6.1. Visualization of households’ perception of water provision in the formal areas
This study also wanted to find out the spatial variation of water service provision in the formal areas; the
results of this area being largely used in this research to make inferences of the gravity and / or magnitude
of water provision situation in the informal areas of Zanzibar
Within the formal areas, (as was also the case in the informal areas), the map shows that majority of
households were connected to piped water but water was not available in those taps as shown in Map 6:8
and Map 6:9 respectively. However, only a few areas on the south-eastern side of Map 6:8 covering partly
Kwahani and Muungano Shehia where residents indicated they had limited water connection. These two
maps give a general impression of water supply shortage deficiency across the study area and the
dissatisfaction the communities have on the services they receive from ZAWA. Majority of respondents
attributed this problem mainly to poor management of water service provision by ZAWA (Annex 9).
Inferring from Map 6:10, majority of households in the formal areas were dissatisfied with services they
receive from ZAWA. The formal planning per se seemed to have had no effect in terms of improved
water service delivery as was generally assumed. This imply that the problem of water supply in Zanzibar
may necessarily not be attributed to a general lack of urban planning regulations but as a consequence of
poor management of water service delivery by those mandated to provide the service.
As depicted by Map 6:11, there is high willingness to pay for improved water services by household apart
from the eastern side covering part of Rahaleo Shehia. However, commercial establishments dominated
this part with few households residing there.
Map 6:12 show spatial variations of the time households take to travel to nearest water source. The spatial
variation of the time taken by households to travel to the nearest water point was evenly varied across the

INTEGRATING LOCAL KNOWLEDGE IN PLANNING AND MANAGEMENT OF WATER SUPPLY PROVISION IN THE INFORMAL SETTLEMENT OF STONE TOWN,
ZANZIBAR
67
study area. Although there were few areas, residents indicated to take more time especially in the south-
western part covering Miembeni Shehia, majority responded to having a piped water connection.
Spatially across the formal study area, residents perceived tap water to be of good quality as map 6:13
illustrate, apart from a few areas. The physical observation made during the transect walk also revealed
that sanitation was generally good in the formal areas and no dumping of waste was found near the water
points. This was in sharp contrast to the informal areas where sanitation condition was found to be poor.
Indeed within the informal areas, there was poor that hindered the waste collection trucks from collecting
the waste. The Zanzibar municipal council director also confirmed this, saying they faced a great challenge
of managing waste collection in the informal areas. Residents in the formal areas reported fewer problems
with accessibility since the area was well served with road network.

INTEGRATING LOCAL KNOWLEDGE IN PLANNING AND MANAGEMENT OF WATER SUPPLY PROVISION IN THE INFORMAL SETTLEMENT OF STONE TOWN,
ZANZIBAR
68
Map 6:4 Household service satisfactions in the informal settlement
Map 6:3 Household connections to piped water in the Informal settlement
Map 6:2 Daily water availability in the Informal settlement

INTEGRATING LOCAL KNOWLEDGE IN PLANNING AND MANAGEMENT OF WATER SUPPLY PROVISION IN THE INFORMAL SETTLEMENT OF STONE TOWN,
ZANZIBAR
69
Map 6:7 Quality of water in the informal settlement
Map 6:6 Time taken to travel to nearest water source
Map 6:5 Willingness to pay for water if services are improved in the informal settlement area

INTEGRATING LOCAL KNOWLEDGE IN PLANNING AND MANAGEMENT OF WATER SUPPLY PROVISION IN THE INFORMAL SETTLEMENT OF STONE TOWN,
ZANZIBAR
70
Map 6:10 Household service satisfactions in the formal
area
Map 6:9 Daily availability of water in the formal settlement
Map 6:8 Household connections to piped water in the formal settlement
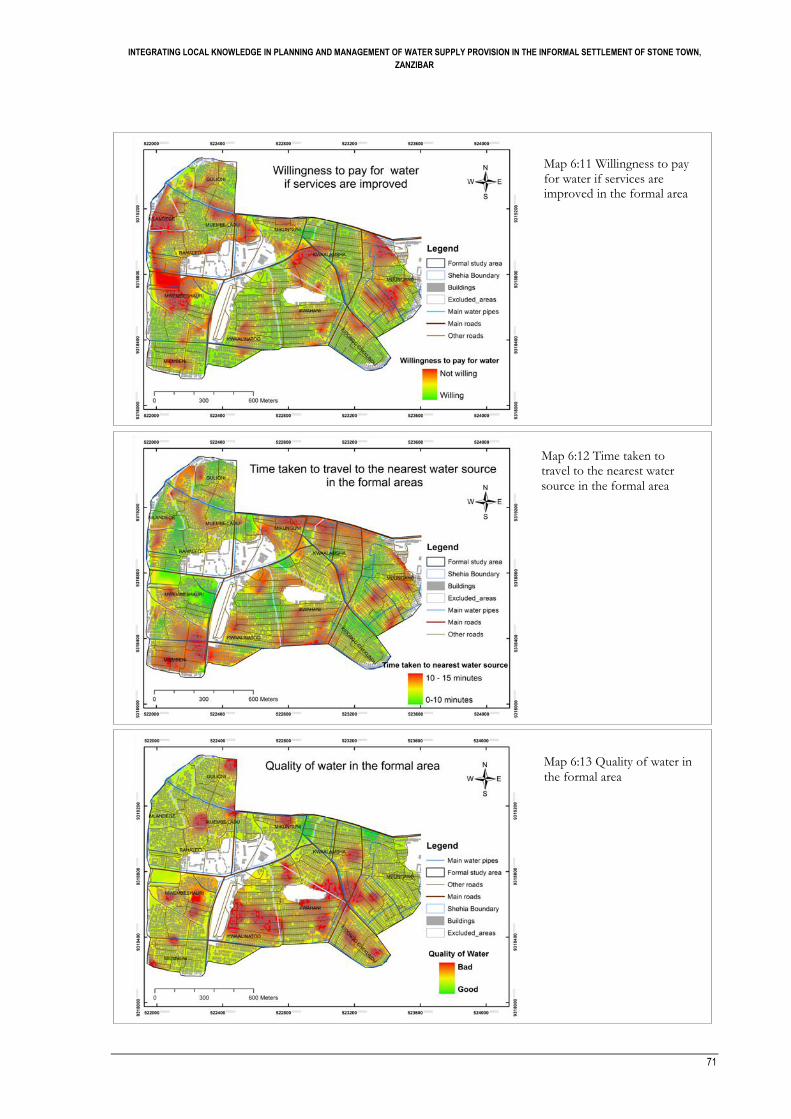
INTEGRATING LOCAL KNOWLEDGE IN PLANNING AND MANAGEMENT OF WATER SUPPLY PROVISION IN THE INFORMAL SETTLEMENT OF STONE TOWN,
ZANZIBAR
71
Map 6:13 Quality of water in the formal area
Map 6:12 Time taken to travel to the nearest water source in the formal area
Map 6:11 Willingness to pay for water if services are improved in the formal area
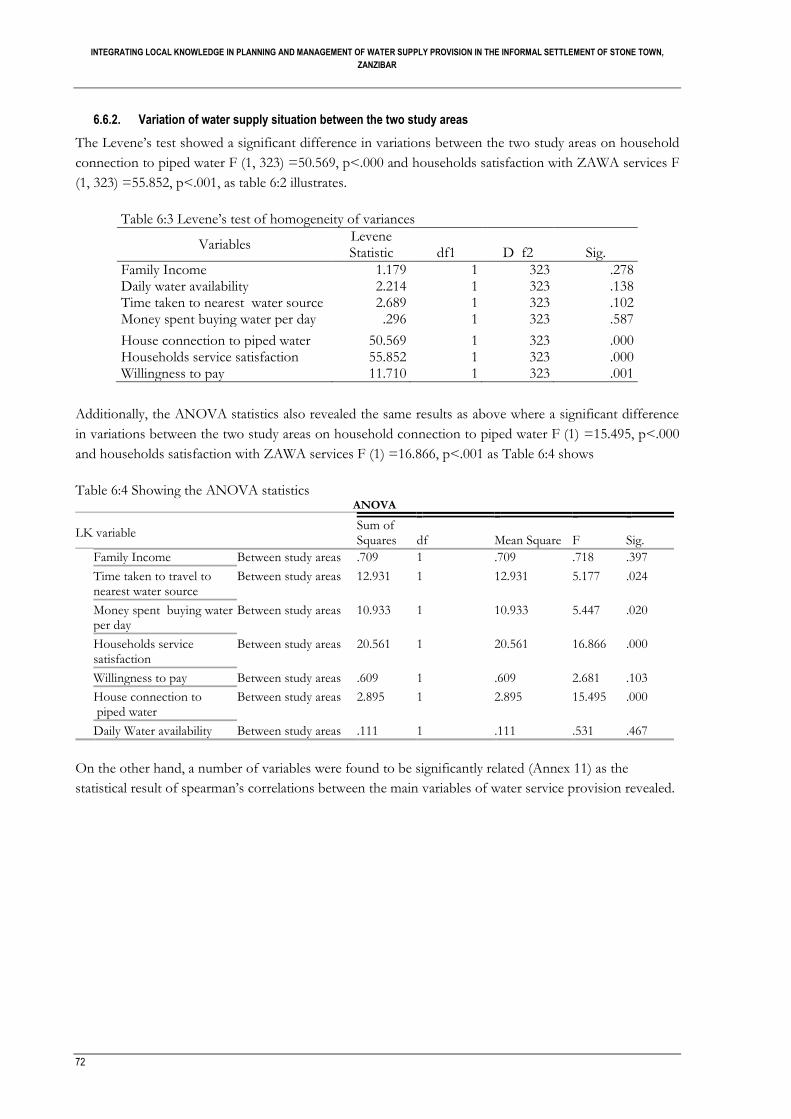
INTEGRATING LOCAL KNOWLEDGE IN PLANNING AND MANAGEMENT OF WATER SUPPLY PROVISION IN THE INFORMAL SETTLEMENT OF STONE TOWN,
ZANZIBAR
72
6.6.2. Variation of water supply situation between the two study areas
The Levene‟s test showed a significant difference in variations between the two study areas on household
connection to piped water F (1, 323) =50.569, p<.000 and households satisfaction with ZAWA services F
(1, 323) =55.852, p<.001, as table 6:2 illustrates.
Table 6:3 Levene‟s test of homogeneity of variances
Variables Levene Statistic df1 D f2 Sig.
Family Income 1.179 1 323 .278 Daily water availability 2.214 1 323 .138 Time taken to nearest water source 2.689 1 323 .102 Money spent buying water per day .296 1 323 .587
House connection to piped water 50.569 1 323 .000 Households service satisfaction 55.852 1 323 .000 Willingness to pay 11.710 1 323 .001
Additionally, the ANOVA statistics also revealed the same results as above where a significant difference
in variations between the two study areas on household connection to piped water F (1) =15.495, p<.000
and households satisfaction with ZAWA services F (1) =16.866, p<.001 as Table 6:4 shows
Table 6:4 Showing the ANOVA statistics
ANOVA
LK variable Sum of Squares df Mean Square F Sig.
Family Income Between study areas .709 1 .709 .718 .397
Time taken to travel to nearest water source
Between study areas 12.931 1 12.931 5.177 .024
Money spent buying water per day
Between study areas 10.933 1 10.933 5.447 .020
Households service satisfaction
Between study areas 20.561 1 20.561 16.866 .000
Willingness to pay Between study areas .609 1 .609 2.681 .103
House connection to piped water
Between study areas 2.895 1 2.895 15.495 .000
Daily Water availability Between study areas .111 1 .111 .531 .467
On the other hand, a number of variables were found to be significantly related (Annex 11) as the
statistical result of spearman‟s correlations between the main variables of water service provision revealed.
INTEGRATING LOCAL KNOWLEDGE IN PLANNING AND MANAGEMENT OF WATER SUPPLY PROVISION IN THE INFORMAL SETTLEMENT OF STONE TOWN,
ZANZIBAR
73
7. INTEGRATING LOCAL KNOWLEDGE AND SCIENTIFIC KNOWLEDGE THROUGH GIS TO IMPROVE WATER SUPPLY PLANNING IN ZANZIBAR
This chapter discus the integration of Local Knowledge (LK) and conventional/Scientific Knowledge
(SK) using the framework developed in chapter 5. It further discuss how LK collected in Zanzibar can be
based on the steps given on the framework to improve water supply planning and management decisions.
Introduction
In retrospect, chapter 2 reviewed various approaches used in water supply planning and management.
While chapter 3 reflected on the existing water supply planning strategies in Zanzibar and their
weaknesses. By identifying various types of LK and SK available concerning water provision in Zanzibar
in chapter 6, this chapter will integrate these knowledge types using the framework developed in chapter 5
and illustrated by Figure 5-1. This chapter will also demonstrate how LK collected applied in order to
improve water service planning in Zanzibar. The framework is divided into five steps below;
Step 1: Collecting LK,
Step 2: Integration of LK using GIS,
Step 3: Linking integrated LK with dimension of water supply planning,
Step 4: Application of LK in water supply planning process in Zanzibar,
Step 5: From conventional planning to an integrated participatory water planning process
7.1. Step 1: Collection of Local Knowledge,
The first step towards integration of LK in figure 5-1 starts with designing a suitable strategy that enables
the collection and processing of LK in a format that will allow its processing within a GIS environment.
While different methods of collecting LK exist, the purpose it is intended to fulfil largely dictates which
method to uses. For this research, the first step started with designing a GIS-based LK data collection
strategy (detailed in section 5.6.1 and illustrated in figure 5-2) where household interview design was
develop using base maps and satellite image of Zanzibar. Owing to the diverse nature of LK and SK, a
mixed method approach was employed that facilitated the collection of diverse knowledge from different
people who were contacted during fieldwork.
As discussed in section 5.4, water supply planning entails a spatial dimension for example the location of
consumer, water sources, and water distribution network. Therefore, the method applied to collect LK
must reflect this dimension so that it becomes possible to connect it with geographical space in which it is
collected. Anchoring these methods within a GIS system enable to solve some problems of its integration
with SK discussed earlier while giving it a geospatial dimension for which it is inherently limited in. Tools
like GPS, IPAQ, and geo-coded transect walk were used in order to enable spatial referencing of LK
collected while use of geo referenced satellite image enabled easier linking of LK collected through
household survey point within GIS database. This helped to address the problem associated with the
integration of LK as discussed in section 5.3.1.

INTEGRATING LOCAL KNOWLEDGE IN PLANNING AND MANAGEMENT OF WATER SUPPLY PROVISION IN THE INFORMAL SETTLEMENT OF STONE TOWN,
ZANZIBAR
74
The major challenge for many local authorities seem to be their inability to differentiate LK from massive
general information existing in any given communities, and also their lack of appropriate methods that can
help sieve and document the most relevant LK from this information to support their planning actions.
The question is; how can water service providers collect most relevant LK that is most useful to them?
Whereas there is no single appropriate method to collect LK, a mixed method approach like the one used
in this research would be most appropriate owing to the diverse nature of LK. It is also paramount for any
water service providers to have an understanding of the type and nature of local knowledge that can be
collected to suit water planning activities while avoiding generalization. This is the reason why part of
developing the methodological framework in chapter 5 stated with defining LK in regards to water service
provision. It then went ahead in section 5.6.1 to explain qualitative GIS approach that can be applied in
collecting comprehensive LK. To avoid collecting generalized LK, the broad concepts of planning for
water supply was disaggregated into specific dimensions and then LK was collected and analysed based on
that.
7.2. Step 2: Integration of LK using GIS
The next step is where the LK and SK are integrated through GIS. This section moves from the
generalized integration illustrated in step 2 of figure 5-1 to more specific systematic process (Figure 7-1) of
integrating collected LK. In this step, the LK was processed, analysed, and integrated with other spatial
data sets. The SPSS statistical analysis that aided in the pre-analysis of LK that was then exported to
ArcGIS database for integration and visualization.
As was discussed in section 2.3, planning, and management of urban water supply requires incorporation
of a wide range of knowledge from various sources. It also relies heavily on the availability and quality of
collected information. How this information is processed and analyzed greatly contribute to the quality of
decisions made. The output maps resulting from this step can greatly aid decision makers in making
appropriate spatial decisions. The conventional water supply planning methods were found to lack this
spatial dimension. In addition, their very narrow scope limits their ability to gather and incorporate diverse
knowledge bases. The use of such methods were found to be a contributing factor to the existence of a
large unmet water demand in Zanzibar. Part of the remedy to these limitations, as demonstrated above, is
seen as the adoption of GIS, which offers a mixture of geo-spatial tools and methods that can be used
collect both spatial and non-spatial LK and integrate it with other knowledge systems to create a
“comprehensive knowledge base” as illustrated in Figure 5-1
The development of a geo database (symbolized with the grey filled cylindrical shape in the Figure 7-1)
plays an important part in the integration process. This is where collected LK from the household survey
interviews having been converted into a GIS compatible „.dbf format‟ is combined with spatial data from
ZAWA where spatial analysis is then carried out. For this study analysis, the LK and SK data that were
used to perform spatial analysis are given in Table 7:1.
This research interpolated the sampled household point assuming that those households near the sampled
points also shared the same views with their neighbors. For instance, households in informal settlements
with close proximity to one another shared water sources. Whereas this assumption can be generally made,
the IDW spatial interpolation method in GIS helped to quantify and to spatially visualize this assumption
(see details in section 5.7.1 and the systematic process of achieving this in Annex 1). The outputs from
IDW spatial interpolation are maps visualizing the integrated LK (see maps in section 6.6.1).

INTEGRATING LOCAL KNOWLEDGE IN PLANNING AND MANAGEMENT OF WATER SUPPLY PROVISION IN THE INFORMAL SETTLEMENT OF STONE TOWN,
ZANZIBAR
75
Figure 7-1 A flow chart showing steps of integrating LK and SK in GIS database
Table 7:1 LK and spatial datasets used in the integration process
LK variables Spatial data sets from ZAWA
-House holds response to water reliability
-Households water service satisfaction
-Households response to water quality issues
-Households connection to piped water
-Household willingness to pay for improved
water services
-Households affordability of water
-Accessibility of water by households
-A geo referenced spatial shape files on main
water distribution pipeline
-A geo referenced spatial shape files on urban
building foot prints
-A geo referenced spatial shape files of roads
centrelines
-A geo referenced data on Shehia
administrative boundaries
- a geo referenced satellite image of Zanzibar
While it is easier to validate scientific knowledge using already established scientific methods and criteria,
validating the LK is usually problematic since most of it may not be precisely measured and quantified.
The literature also yielded unsatisfactory explanation on how to conduct a LK validation.
Despite this, GIS offer a medium through which validation can be performed. From the figure above, it is
possible to verify LK through a spatial comparison process (step symbolized by shaded patterned
cylindrical shape). The output maps can be subjected to a verification by conducting a comparison of
these maps with other spatial geo referenced datasets either collected from fieldwork or from other official
datasets and records from water service providers. In Zanzibar case, verification was done by comparing
output LK maps with other LK data gathered through participatory methods like transect walks route that
was digitized an associated attributes provided information that was very useful in verifying. In addition,
photos taken from the fieldwork had spatial coordinates and were able to be linked to the GIS database
from where comparison.
OU
TP
UT
S M
AP
SZnztown.ecw
[satelliteImage]
HH_WillingPay.map
HH_ServiceSatisf.map
HH_WaterConnect.map
HH_WaterReliab.map
HH_MoneyBuyWat.map
HH_WaterAcess.map
HH_WaterQuality.map
SK collection[spatial & non-spatial data]
WaterInfrastruc.shapefiles
Comparison of LK and
SK for verification
Integrated LK
base and maps
for water supply planning
Water Planning
process
HHQnnre.dbf
GIS
UrbanRoads. polyline
ShehiaBoundary.Polygon
Urban_buildings.polygon
Base map preparation
HH interview design
Local
community
Assessment
Map based HH survey Interview
Participatory methods prep.
- field photos- satellite image- FGD Information- Transect walk info.- Unstructured interv.- Field observation
- water supply maps- Key Experts interviews- Semi structured interviews
LK collection
Start
Start
End

INTEGRATING LOCAL KNOWLEDGE IN PLANNING AND MANAGEMENT OF WATER SUPPLY PROVISION IN THE INFORMAL SETTLEMENT OF STONE TOWN,
ZANZIBAR
76
The final output in figure 7-1 is an “integrated LK base and maps.” These maps provides an interactive way
through which water service providers can support their decision-making. While the above process marks
the end of the GIS-based LK integration process, it becomes the starting point for urban water supply
planning process
As has been demonstrated in this step GIS, is can be an effective tool that can help urban water providers
to integrate LK that in effect help deepen their understanding of community's perceptions and local issues
and preferences. Subsequently, this can greatly supplements the weaknesses of conventional planning
approaches.
7.3. Step 3: Linking LK to water supply planning dimensions
While the developed framework in figure 5-1 starts by integrating all forms of SK and LK into a singe-
integrated knowledge base (in step 2) which is more general, step 3 of the framework disaggregate this
knowledge into four dimensions that were discussed in section 2.3. Specifically, this step not only link this
knowledge to the urban water supply planning process but also provide a means of disaggregating this
knowledge into constituent parts relevant to each dimension of urban water supply planning process. The
framework disaggregates even further these dimensions to various steps of water supply planning process
(described in step 4 below). In illustrating how water service providers can achieve this, the LK collected
in Zanzibar was grouped into four dimensions (refer to Table 6-1 in chapter 6) of urban water supply
planning earlier discussed in chapter 2.
7.4. Step 4: Application of LK to improve water supply provision in Zanzibar
In step 4, the LK collected is applied to guide the decisions made in the water supply planning process.
Every action and decision made at each step of the water supply planning is usually related to a specific
dimension, the arrows in step 4 (figure 5-1) points back to step 3. There are various ways how LK can be
applied to aid water supply and management in Zanzibar should be applied as summarised in Table 7:2
below.
Table 7:2 Various ways in which LK can be used in the water planning and management process
Water planning
dimension
Application of LK (in terms of local community actions)
Technical
dimension
Analysis of water related problems and possible solutions, needs identification
and prioritization, feasibility analysis through consultation, data collection,
Diagnostic survey of water supply networks, problem, developing alternative
project ideas, and plans, Appraisal of water project. Reporting illegal
connections, Cheap Labour force, improving access to water supply, reporting
water pipe leaks, supplements water supply by establishing community,
Economic
dimension
Payment of water user-charges, community contributions, promoting of efficient
water uses, inclusion in planning and implementation of water programmes, can
be incorporated in managing and monitoring water equipments and resources
from theft or damage
environmental
dimension
Implementation of environmental protection programmes, Community
participation in water sources protection and conservation measures,
implementing of proper wastewater, sewerage and solids waste strategies,
hygiene awareness.

INTEGRATING LOCAL KNOWLEDGE IN PLANNING AND MANAGEMENT OF WATER SUPPLY PROVISION IN THE INFORMAL SETTLEMENT OF STONE TOWN,
ZANZIBAR
77
Management
dimension
Assessment of the performance of water supply, helps in the implementation
and monitoring of water supply programmes, formation of water management
committees and water association groups, help in implementing water regulation
measures, giving information on household connections, volunteering
information to help improve water supply delivery, feedback information on
efficiency of water project activities, evaluation of the effectiveness of the water
supply network, assessment of performance of water institutions delivery.
Since LK is intrinsically part of local community, either in their way of doing things or in their way of
interpreting and reacting to their surrounding environment, the water service providers should in essence
facilitate and/or incorporate the local communities to implement water management strategies. With this
regard, this study discusses the application of LK in terms of actions that communities should take to
contribute towards water supply planning and management. The discussion is also based on the limitations
of the existing water supply management in Zanzibar (that were highlighted in chapter 3) and, problems
communities identified (see section 6.5.4).
7.4.1. Improving the technical dimension of water provision planning
7.4.1.1. Applying local knowledge in water supply network maintenance
According to secondary data source from ZAWA, 40% of water produced is unaccounted for. In addition
to water squandering and loss through leaks from the old pipe network, water theft through illegal
connections significantly contributed to un-accounted for water in Zanzibar. In the transect walk survey
conducted during this research; the communities were able to point out areas where illegal connection has
been carried out and areas where there were water pipe leakages. This information is very useful in
managing water supply network and especially so if these communities are engaged in addressing these
issues. The ZAWA strategy that was in use was to carry out period and impromptu inspections of its water
pipe network and where illegal connection is found the individual or household is fined and water
disconnected, whereas this may be an alternative strategy, it cannot in itself solve this problem without
inclusion of those directly involved (the communities). The ZAWA commercial officer also said that they
rely on the customer and community goodwill to report leaks, but their actual inclusion may be a lot better
than relying just on their goodwill. On the other hand, ZAWA can establish mechanism that enables
communities to report (confidentially) illegal connection or to report location in the network demanding
immediate repair. This can be done for example using the mobile technology where communities can
report using short messaging services. The current institutional set up in ZAWA is inadequate in terms of
facilitating communities to give feedback, which is very helpful in improving water monitoring and service
delivery.
7.4.2. Improving the socio-economic dimension of water provision planning
7.4.2.1. Using communities skills in rain water harvesting as an alternative water source
As the research found out, there was a big precipitation potential for rainwater harvesting as an alternative
water source for households, which can supplement the unmet household demand and ZAWA shortfall in
production. The survey found out that majority of house roofing within the study area was in good
condition, with roofing built of galvanized iron sheet in the sampled households (Annex 2). However,
current utilization of rainwater in Zanzibar was found to be too low. The statistics available revealed a

INTEGRATING LOCAL KNOWLEDGE IN PLANNING AND MANAGEMENT OF WATER SUPPLY PROVISION IN THE INFORMAL SETTLEMENT OF STONE TOWN,
ZANZIBAR
78
huge annual rainfall of 2,444.6Mm3 /annum but 36% of this water was reportedly going to waste as
surface run off (Water policy, 2004).
The households can be engaged in harvesting of rainwater. Awareness creation would be an important
entry point to the promotion of rainwater harvesting. Financial support through loans or payment
schemes can also enable communities to construct rainwater-harvesting structures in their houses.
7.4.2.2. Supporting community owned and managed alternative water sources
Community owned and private water vendors were found to be in operation in Zanzibar. A cross-check at
ZAWA showed that none of them is registered despite the role they played in supplementing households‟
water demand especially when the piped water was unavailable. Majority of interviewed households
reported to buying water from the vendors, (refer also to Figure 6-5). However, ZAWA had the sole
monopoly and the only legally recognized provider of water services in Zanzibar. This monopolistic
ownership of water provision rights locks out any private entities who in most cases offer better expertise
and skills in providing such services than government owned institutions. The consumers tend to receive
more benefits and better services where there are many entities competing to provide the same service.
ZAWA services were unsatisfactory (Figure 6-6) to many households. Not surprising then, the major
reason for this dissatisfaction was attributed to poor management of water services (Annex 9). According
to the respondents, they were very optimistic that if other private providers were allowed to operate, the
problem of water shortages they face could have been far much less. The private providers; be it private
persons, user associations or community groups can therefore be used to supplement ZAWA effort in
meeting the increasing demand. It has been found elsewhere (Cain & Mulenga, 2009) that informal water
vendors play a crucial role and most often they have been found to fill the demand gap where
government authorities have been unable to.
7.4.2.3. Cost sharing in meeting operation and maintenance of water supply costs
From the interview carried with ZAWA planning director, the annual government budgetary allocation to
ZAWA is by far not enough to meet both capital and recurrent costs. According to him, this jeopardizes
operation and maintenance capacity of water supply system and affects the up grading of existing
infrastructure. On the other hand, the survey found out a high willingness to for improved water services.
This willingness can be tapped to generate more revenue for ZAWA. However, ZAWA has very weak
established mechanism and customer database to aid in collecting water payment revenue. As discussed in
the literature review chapter, community participation in the management of water supply schemes can
help in the cost recovery and is essential for the sustainability of water supply schemes. Greater
involvement of water users and efficient payment for water services rendered also help water supply
schemes to remain viable (Twigg, 2001). ZAWA should apply the cost recovery principle in meeting its
operation and maintenance costs by establishing proper mechanism to collect water bills from the
communities and water consumers.
7.4.3. Improving the management dimension of water provision planning
7.4.3.1. Decentralizing water management decision to community level
Water provision in Zanzibar was found to be highly centralized. This resulted in highly centralized
decision-making leading to insufficient knowledge of local problems. Many households when asked if
ZAWA officials come to inquire about their water-related problems said they rarely see them, while others
said they have never seen them in their neighbourhoods. Consequently, the respondents reported very
poor technical assistance at local level. In order to place the ownership and management of water supply
INTEGRATING LOCAL KNOWLEDGE IN PLANNING AND MANAGEMENT OF WATER SUPPLY PROVISION IN THE INFORMAL SETTLEMENT OF STONE TOWN,
ZANZIBAR
79
in the hands of the community, one of the suggestions raised by the communities during the FGD was to
decentralize water management decisions at community level. They suggested that ZAWA should allow
and support communities to set up water management schemes at Shehia level. These schemes should
initiate, plan, and manage water provision at Shehia or neighbourhood level. They also said that ZAWA
never consult them when implementing water supply projects. ZAWA should offer facilitative services
towards programmes undertaken by the committees. According to the guiding principles of IWRM (see
Box 2:1), delegating water management and supply at community level facilitates unity and cohesion of the
community and creates self-awareness in wise use of the resource Subsequently, this empowers
communities to tackle other problems facing them. Community involvement in water supply projects is
paramount and often leads to sustainability of such projects (section 2.5.3). Their involvement can occur
right from project inception phase, planning, and implementation to post construction management
through their own water committees. This also has an added advantage in that their sense of ownership
and responsibility is increased.
7.4.3.2. Inclusion of women in water provision planning and management
During the household survey, more women than men were found to be most active in fetching water for
their households, from the review of ZAWA management strategies and existing legislations, (see chapter
3) they give little regards to the role of women in water provision and management in Zanzibar. These
legislation need to be engendered in order for women to have a voice in water management decisions
7.4.3.3. Prioritization of community needs
Participatory planning improves implementation capacities because the communities are able to prioritise
their needs in order of importance and those most urgent receive strong support during implementation.
Majority of households in the two settlement areas (see section 6.5.4.4) prioritised water supply to be the
most needed public utility. Local community knowledge can therefore play a greater role in prioritizing
issues ZAWA proposes for implementation. The communities were able to give real-time information on
issues that statistics and records at ZAWA could not as those records were not up to date. This is because
they interact daily with their environment and know better prevailing problems more than ZAWA officials
who were reported to come occasionally in their neighbourhoods to monitor and gather various issues of
concern.
7.4.4. Improving the environmental dimension of water provision planning
7.4.4.1. Waste water and solid waste management
Zanzibar municipal council is tasked with the management of wastewater and solid waste management.
However, from the discussion with officials of ZMC and ZAWA, there are no mechanisms or linkages to
support coordination of water supply and waste disposal management despite these two sectors having a
close relationship. The deputy director of ZMC revealed that their services of solid waste collection, at the
time of conducting this research not reaching the informal settlement areas.
To ensure good quality of drinking water is achieved, ZAWA should collaborate with ZMC in addressing
this problem. Since communities know better their local environment, they should be commissioned in
solving the existing problems of wastewater and solid waste disposal. On their part, ZAWA together with
ZMC should promote the need for safe disposal of wastewater, solid waste, proper excreta disposal
methods, and awareness on the need to protect the water resources from human waste contamination.
7.4.4.2. Engaging the community in improving water quality and protecting catchment areas
Most shallow wells were found at a risk of bacteriological contamination from solid waste and open
dumping sites. The policy guideline for the protection of the water catchment areas is stipulated in the
water Regulation Act and states “no human settlements should be allowed within at least 500 meters

INTEGRATING LOCAL KNOWLEDGE IN PLANNING AND MANAGEMENT OF WATER SUPPLY PROVISION IN THE INFORMAL SETTLEMENT OF STONE TOWN,
ZANZIBAR
80
upstream of a water source.” Despite this, the catchment area is unprotected from human settlement and
is at risk of pollution from solid waste and sewerage. Delineation and gazetting of catchment areas needs
to be established and communities should be involved in protecting and conserving these areas. From the
literature, it was found out that water resource management is not a one-sector affair. It is therefore
imperative for ZAWA to corroborate with other sector like survey and urban planning in order to prepare
physical development plans that can aid in the management of these catchments areas. Since local
communities know better their environment, they are well placed to implement the protection and
conservation measures as may be stipulated by ZAWA
7.5. Step 5: Shifting from conventional planning to participatory water supply planning process
Step 5 of the integrated framework 5-1 presents a mechanism through which water supply providers can
shift from convectional planning to a participatory planning process. Specifically, it tries to merge “LK
and local communities,” with water supply planning into a single “participatory planning process.” This step is
explained by using the diagram presented by figure 7-2 below.
Reflecting back to section 5.2.1, most of LK, as its definition also suggests, usually relate to an action, a
response, a viewpoint, or an activity of an individual or a group of person or a community. Owing to this,
LK cannot be entirely divorced from the community who not only own it but also are carriers of it. To
improve water supply planning, urban water supply authorities intending to use LK should not just extract
LK from local communities but adopt ways of incorporating them in planning and implementation of
activities to meet their water needs. In the same way, participatory planning methodologies discussed in
section 2.5 also calls for the direct involvement of communities in the planning process.
In this regard, Figure 7-2 below provides an emerging framework on how urban water supply providers
can incorporate local communities in planning and management of water provision. It also goes further to
link LK to each planning phase.
Conventional water planning
process
Maintenance and repair
Appraisal and choice
Engineering & Design Criteria
Formulation of water provision
plans
Situational analysis
Participatory water planning
process
Water supply provider Local KnowledgeScientific
knowledge
Develop alternative
plans & choice
Design criteria and standards
prioritize community
needs
Formulation of Water supply
strategy
Implementation& Operationalize
Water supply situation analysis[SWOT analysis]
Monitoring & Evaluation
Implementation
Prioritization
integrating medium
Figure 7-2 Emerging framework for integrating “LK + local community” into a participatory water supply
planning

INTEGRATING LOCAL KNOWLEDGE IN PLANNING AND MANAGEMENT OF WATER SUPPLY PROVISION IN THE INFORMAL SETTLEMENT OF STONE TOWN,
ZANZIBAR
81
In the above framework, the participatory water planning process enables interaction and collaboration of
local communities, urban water supply decision makers through an “integrating medium” which in this case
becomes the “water supply provider, SK and LK.” In water planning, best practice put key emphasis on
the involvement of a full range of stakeholders in a more or less on-going fashion (Snellen & Schrevel,
2004). The range of interests affected by planning decisions in the first stages affects all other steps in the
process and the outcomes. This necessitates for planners to involve and seek diverse knowledge from the
communities in every stage until the final decisions are reached. Every stage thus calls for constant re-
evaluation depending on the interests and issues at that level. This again justify the need for LK
application and indeed community participation at every process.
In Zanzibar, the sole responsibility for drinking water provision rests with one agency (ZAWA). Cross-
sectoral linkages with other relevant department and institutions were found to be minimal and weak.
Often, lack of coordinated actions leads to uncoordinated water resource management and can result in
conflicting goals, duplication of roles and unsustainable systems. Inputs of different stakeholders in
developing and maintaining water supply schemes need to integrated. The principles of IWRM (Box 2:1)
as stated in the literature review also calls for inclusive and participatory approach where all users,
planners, and policy makers work together in all levels. Local community can apply their knowledge and
experience to implement water catchment conservation and protection measures far more effectively than
ZAWA can. Community participation is essential throughout the water planning cycle from initiation,
planning, construction, operation, maintenance, and monitoring purposes. By using, the emerging
framework in Figure 7-2 water supply providers can be able to integrate communities and LK in their
water supply and management activities.


INTEGRATING LOCAL KNOWLEDGE IN PLANNING AND MANAGEMENT OF WATER SUPPLY PROVISION IN THE INFORMAL SETTLEMENT OF STONE TOWN,
ZANZIBAR
83
8. CONCLUSION AND RECCOMENDATION
This chapter gives the conclusion of this research. It also highlights the limitations of this research, gives
recommendations, and proposes further research.
8.1. Overall conclusion
This research endeavoured at conceptualizing how general Local Knowledge (LK) often ignored by many
decision makers can be collected, processed, and transformed into useful knowledge base, which can then
be integrated with Scientific Knowledge (SK) to aid urban water supply planning and management
decisions. As the study found out in Zanzibar, planning decisions on urban water supply are still pegged
on convectional planning approaches that are seen as inadequate in addressing the growing demand for
water resulting from increasing urbanization. It is not surprising then, that the study found the existence
of a large unmet water demand by the urban households, while the water supply and infrastructure system
were highly incapacitated in handling the increasing pressure exerted on them. The view of this research is
that these problems cannot be solved by solely relying on SK and therefore a need to incorporate other
knowledge systems existing in a society. To achieve this, this research first developed a GIS-based
methodological framework that aided in the collection of LK in the chosen case study site. Afterwards this
knowledge was integrated with SK to come up with an integrated knowledge base that can help water
supply decision makers in addressing these problems. Finally, by using the framework as a guide to apply
the integrated knowledge in the study area, the research demonstrated how LK could be used not only to
address the challenges of water supply provision in Zanzibar, but also the limitations of convectional
water supply planning approaches. From the discussion also emerged a framework that can be used by
water service provider to shift from conventional planning to participatory water planning thereby
enabling to link both the “local communities plus the local knowledge” to water planning activities.
8.2. Water service provision in the study area
The intention of the first objective was to find out the existing water supply provision situation and
challenges thereof. Using a case study approach and mixed methods, assessment of water supply situation
was carried out in the two case study sites.
ZAWA piped water was found to be the main source of water for majority of households in both study
areas. Despite a high-piped water connection by majority of households, majority reported a highly
intermittent water supply. Majority said they buy water from the water vendors especially when the tap
water was not available. Household in the informal settlements travelled far to access water sources. To
supplement the frequent shortage of pipe water, households in the informal settlements had dug shallow
wells most of which were found to be in pathetic and unhygienic condition. The results also revealed a
very high level of dissatisfaction with ZAWA services by majority of households within the informal
settlement. Additionally, more than half of those in the formal areas also expressed their dissatisfaction
with ZAWA services. Many respondents attributed their dissatisfaction to the poor water management by
ZAWA. Despite this, more than half of interviewed households were willing to pay for (improved) water
services. Quality of pipe water was generally perceived to be good by most households although quality of
shallow wells water was reported to be poor. This poor quality of water was attributed to a dysfunctional
sewerage and solid waste collection services that led to contamination of water in the informal settlements.

INTEGRATING LOCAL KNOWLEDGE IN PLANNING AND MANAGEMENT OF WATER SUPPLY PROVISION IN THE INFORMAL SETTLEMENT OF STONE TOWN,
ZANZIBAR
84
Contrary to ZAWA view of involving the communities in water supply provision, almost all interviewed
households said they are not involved by ZAWA. More than half of interviewed households said they do
not report water problems to ZAWA. A high percentage of residents also said they rarely cooperate in
finding solution to shared community problems. Overall, majority of households‟ identified and prioritised
water supply to be the most needed public utility.
Respondents identified a range of problems related to water supply, their causes, and their effects on
family welfare. Frequent water shortages, lack of adequate water source, long queues at the water point,
lack of enough money to buy water, lack of tap water inside the house, waste of time in search of water,
and over crowding in public taps were identified to be among the main problems. These were more
prevalent in the informal than formal settlement. The main cause of these problems included; poor
management of water supply, lack of enough public water points, water leakages, and lack of enough
communal boreholes. The major effect of these problems on household included; health problems,
conflicts at water source, high costs of buying water from vendors, women spending a lot of time in
fetching water, and poor hygienic conditions due to lack of enough water.
8.3. Available LK for water service provision
The second objective sought to find out the available LK regarding water supply provision in the study
area and finding out how this knowledge can be collected in a way useful to decision makers. The research
used a mixed method approach to collect LK where; households‟ questionnaire survey, structured
interviews, personal interviews, FGD, geo-coded transects walk, and key experts‟ interviews were used.
GIS played a central role in designing some of these methods.
Various aspects of LK collected included; Households‟ opinions and views on strategies to improve water
supply provision. Household‟s perceptions of water service performance and water quality, their opinions
on efficiency and effectiveness of water service delivery and their feedbacks on service satisfaction. Views
on problems of water supply, their causes, and effects they have on family wellbeing. Moreover,
households‟ coping strategies to constant water shortages and their responses and perception on
affordability, and willingness to pay well documented.
8.4. Integration of LK and convectional knowledge through GIS
The last objective dwelled on developing a GIS-based methodological framework that can be used to
integrate the collected LK with SK in order to come up with an integrated knowledge base. A five-step
methodological framework was developed to achieve this objective. The first step started with designing a
GIS-based LK data collection strategy where household interview design was develop using base maps
and satellite image of Zanzibar. Owing to the diverse nature of LK and SK a mixed method design was
employed that facilitated the collection of diverse knowledge from different contacted people. In step 2,
this is where the processing, analysis and integration and visualization of LK was carried out using both
the SPSS statistical analysis that aided in the pre-analysis of LK that was then exported to ArcGIS for
integration and visualization. In the third step, the integrated knowledge base was linked with and
disaggregated into the four dimension of urban water supply planning. Step 4 of the framework provided
a forum through which the application of this knowledge was carried out. This was done by suggesting
how the identified weakness and limitations of existing water planning methodologies in Zanzibar, as
discussed in chapter 3, can be solved using this knowledge. The last step presented an emerging
framework from the entire discussion, that can help water supply providers shift from the convectional
planning to a participatory water planning and management process. This step thus provided a
INTEGRATING LOCAL KNOWLEDGE IN PLANNING AND MANAGEMENT OF WATER SUPPLY PROVISION IN THE INFORMAL SETTLEMENT OF STONE TOWN,
ZANZIBAR
85
comparative methodical process of both conventional and participatory planning process and the central
role of both LK and SK within these processes.
8.5. Limitations of this research
There lack a clear border between LK an SK especially in an urban environment setting where
communities thoughts, views, opinions and actions are shaped and influenced by modern urban
lifestyles and academic knowledge which is part of SK.
Due to the dynamic nature of urban population and compounded by the limited fieldwork
research period, it became hard to search for indigenous inhabitants in the study area who possess
much and deeper LK accruing from their long stay and exposure.
Although an attempt was made in validating collected LK in this research, it is by far not
satisfactory since the method used lacked precision. Literatures reviewed also yielded
unsatisfactory method on how to validate LK.
8.6. Reccomendation
In view of the study findings and conclusions, the following measure regarding urban water supply
management in Zanzibar are necessary:
This study has demonstrated how LK can be integrated by use of GIS & T. It therefore
recommends water supply providers to incorporate the LK in their planning activities by adopting
wholesomely or with modification the developed framework into their water supply planning
activities.
It is a strong view of this research that LK cannot be entirely divorced from the local
communities who are both owners and carriers of it. Should water supply providers like to use
LK to solve their planning challenges, it recommends that inclusion of local communities in water
planning and management process be considered paramount. The emerging participatory water
supply planning framework can be used as a guide.
8.7. Further research
As discussed earlier in this research, water resource planning and management calls for a multi
sectoral and multi disciplinary approach. However, this research collected the knowledge from
just few sectors. Further research need to collect and integrate data from all other relevant sectors.
With the increasing telecommunication connectivity in Zanzibar and elsewhere, that makes easier
to collect LK, further research may focus into how this can be combined with qualitative GIS to
advance the developed framework in order to develop a comprehensive urban water supply
planning geodatabase to aid water supply planning and management decisions.

INTEGRATING LOCAL KNOWLEDGE IN PLANNING AND MANAGEMENT OF WATER SUPPLY PROVISION IN THE INFORMAL SETTLEMENT OF STONE TOWN,
ZANZIBAR
86
87
LIST OF REFERENCES
Abbott, J. (2002a). An analysis of informal settlement upgrading and critique of existing methodological approaches. [doi: DOI: 10.1016/S0197-3975(01)00049-2]. Habitat International, 26(3), 303-315.
Abbott, J. (2002b). A method-based planning framework for informal settlement upgrading. [doi: DOI: 10.1016/S0197-3975(01)00050-9]. Habitat International, 26(3), 317-333.
Agrawa, A. (2011, 2008). Living Knowldge, incorpolating Indigenous knowledge into your teaching. Retrieved 4/2/2011, 2011, from http://livingknowledge.anu.edu.au/html/educators/index.htm
Ahamed, T., Khan, M., Takigawa, T., Koike, M., Tasnim, F., & Zaman, J. (2009). Resource management for sustainable development: a community- and GIS-based approach. [10.1007/s10668-008-9159-y]. Environment, Development and Sustainability, 11(5), 933-954.
Akatch, S. O., & Kasuku, S. O. (2002). Informal settlements and the role of infrastructure: The case of Kibera, Kenya. [Review]. Discovery and Innovation, 14(1-2), 32-37.
Aketch. (1992). The Decentralization of Development Planning in Kenya, A case study of Kisumu District. Dortmund University, Germany. .
Anderson, S. (2001). An Evaluation of Spatial Interpolation Methods on Air Temperature in Phoenix, AZ, Department of Geography, Arizona State University Tempe, AZ.
Arnold, U. (2008). Uban infrastructure management. An Introduction to the Scope, Disciplines and Methods of Urban Infrastructure Planning, Management and Financing Berlin, Germany / Bauhaus-Universität Weima.
Arnstein, & Sherry. (1969). A Ladder of Citizen Participation. JAIP, vol. 35( No. 4), 216-224. Asare, K. D. (2008). Can participatory geographic information systems (PGIS) enhance knowledge of customary land
rights and boundaries?: A case study of Gbawe, Greater Accra, Ghana. ITC, Enschede. Barry, M., & Ruther, H. (2005). Data Collection Techniques for Informal settlement. Upgrades in Cape
Town, South Africa. URISA, 17(1), 10. 43-53. Bertrand-Krajewski, J.-L., Barraud, S., & Chocat, B. (2000). Need for improved methodologies and
measurements for sustainable management of urban water systems. [doi: DOI: 10.1016/S0195-9255(00)00044-5]. Environmental Impact Assessment Review, 20(3), 323-331.
Biswas, A. K., & Uitto, J. I. (2002). Water for Urban Areas, Challenges and Perspectives. Brand, M. J. D. (1991). Symposium on Geographic Information Systems: The Northern Ireland
Geographic Information System, Ordnance Survey for Northern Ireland. Journal of the Statistical and Social Inquiry Society of Ireland., VolXXVI, Part III.
Cain, A., & Mulenga, M. (2009). Water service provision for the peri-urban poor in postconflict Angola, Development Workshop - Angola.
Castillo, J. J. (2009). Snow balling sampling,steps of the scientific Methods. Retrieved 28/10/2010, 2010, from http://www.experiment-resources.com/
CBS. (2010). National bureau of Statistics, Kenya. Retrieved 9/12/2010, from http://www.knbs.or.ke/ Census_2002. (2002). Housing and population census. Retrieved 25.08.2010, 2010, from
http://www.zanzinet.org/stati.html Chambers, R. (1994). The Origins and Practice of Participatory Rural Appraisal. World Development, 22(7),
953-969. Chambers, R. (2006). Participatory Mapping and Geographic Information Systems: Whose Map? Who is
Empowered and Who Disempowered? Who Gains and Who Loses? . Electronic Journal of Information Systems in Developing Countries, 25(2): 1-11.
Close, C. H. (2003). Integrating Local Knowledge and Spatial Information Technologies for Marine Species Management: A Case Study in the Turks and Caicos Islands. University of Waterloo, Ontario, Canada,.
Cope, M. S. e., & Elwood, S. e. (2009). Qualitative GIS : a mixed method approach. Los Angeles: Sage. David, G., & Sadoff, C. (2005.). Water Resources, Growth and Development. Paper presented at the Panel of
Finance Ministers, Commission on Sustainable Development. Dublin_Principles. (1992). The Dublin Statement on Water and Sustainable Development. Paper presented at the
International Conference on Water and the Environment (ICWE), Dublin, Ireland, on January 26-31, 1992.
Dunn, C. E. (2007). Participatory GIS - A people's GIS? Progress in Human Geography, 31(GEOBASE), 616-637.
Elmes, G., Dougherty, M., Challig, H., Karigomba, W., McCusker, B., & Weiner, D. (2005). Local Knowledge Doesn‟t Grow on Trees: Community-Integrated Geographic Information Systems and Rural Community Self-Definition (pp. 29-39).
Elwood, S. A. (2002). GIS use in community planning: a multidimensional analysis of empowerment. Environment and Planning A, 34(5), 905-922.

88
Ferreyra, B. C. (2006). Participatory Evaluation: When Communities are the Experts! . Paper presented at the “Innovations in Community Development" 6th Annual Grand River Watershed Water Forum.
Foresster, J. (1999). The deliberative Practitioner: encouraging participatory planning processes: MIT Press, Cambridge.
Global_Water_Partnership. (2006). Integrated Water Resources Management: Strengthening Local Action. Paper presented at the Fourth World Water Forum.
Goodchild, M. F. (1987). A spatial analytical persective on geographical Information systems. International Journal of Geographical Information Systems, VOL. 1,(No. 4), 327-334.
GOZ. (2008a). Project Information Document, Concept stage: Tanzania - Zanzibar Urban Services Project: The World Bank Group. from http://go.worldbank.org/H0NPLTV1009
GOZ. (2008b). Water Resource Management strategy for Zanzibar. Zanzibar Water and Sanitation Project report. Grey, D., & Sadoff, C. (2006). Water for Growth and Development. A Theme Document of the 4th World Water
Forum. Paper presented at the 4th World Water Forum, Mexico. Gumbo, B. (2004). The status of water demand management in selected cities of southern Africa. [doi:
DOI: 10.1016/j.pce.2004.09.029]. Physics and Chemistry of the Earth, Parts A/B/C, 29(15-18), 1225-1231.
Guy, S., & Marvin, S. (1995). Demand Side Management and Urban Infrastructure Provision, ESRC Global Environmental Change Programme. Retrieved 2nd Jan., 2011, from http://www.esrc.ac.uk/my-esrc/grants/L320253149/read
Ha, S.-K. (2001). Developing a community-based approach to urban redevelopment. [10.1023/A:1015845907795]. GeoJournal, 53(1), 39-45.
Haithcoat, T. Spatial Interpolation, University of Missouri Columbia. Haji, H. A., Azzan, R. M., & Ufuzo, S. S. (2006). Evolution of Spatial Planning in Zanzibar and its Influence.
Paper presented at the Shaping the Change XXIII FIG Congress, Munich, German; October 8-13, 2006, .
Hasan, A. (1998). The Informal City. Paper presented at the UNCHS (Habitat) Regional Symposium on Urban Poverty. Retrieved from http://parole.aporee.org/work/hier.php3?spec_id=19878&words_id=912
Hassing, J., Ipsen, N., Clausen, T. J., Larsen, H., & Lindgaard-Jørgensen, P. (2009). Integrated Water Resources Management in Action. Jointly prepared by DHI Water Policy and UNEP-DHI Centre for Water and Environment, The United Nations World Water Assessment Programme.
Hordijk, M., & Baud, I. (2006). The role of research and knowledge generation in collective action and urban governance: How can researchers act as catalysts? [doi: DOI: 10.1016/j.habitatint.2005.04.002]. Habitat International, 30(3), 668-689.
Ibem, E. O. (2009). Community-led infrastructure provision in low-income urban communities in developing countries: A study on Ohafia, Nigeria. [doi: DOI: 10.1016/j.cities.2009.02.001]. Cities, 26(3), 125-132.
ICWE. (1992.). The Dublin Statement and Report of the Conference. International Conference on Water and the Environment: Development Issues for the 21st century. 26–31 January.Dublin.
Khatib, A., kombo, M., & Mmochi, J. (2009). Country report Tanzania. Kolokytha, E. G., Mylopoulos, Y. A., & Mentes, A. K. (2002). Evaluating demand management aspects of
urban water policy--A field survey in the city of Thessaloniki, Greece. [doi: DOI: 10.1016/S1462-0758(02)00024-9]. Urban Water, 4(4), 391-400.
Kumar, R. (2005). Research Methodology. A Step-by-Step Guide for begginers (2nd ed.): SAGE publications, London.
Kyessi, A. G. (2005). Community-based urban water management in fringe neighbourhoods: the case of Dar es Salaam, Tanzania. [doi: DOI: 10.1016/S0197-3975(03)00059-6]. Habitat International, 29(1), 1-25.
Maganga, F. P., Butterworth, J. A., & Moriarty, P. (2002). Domestic water supply, competition for water resources and IWRM in Tanzania: a review and discussion paper. [doi: DOI: 10.1016/S1474-7065(02)00094-3]. Physics and Chemistry of the Earth, Parts A/B/C, 27(11-22), 919-926.
Magigi, W., & Majani, B. B. K. (2006). Community involvement in land regularization for informal settlements in Tanzania: A strategy for enhancing security of tenure in residential neighborhoods. [doi: DOI: 10.1016/j.habitatint.2005.12.002]. Habitat International, 30(4), 1066-1081.
Marcus, A., & Asmorowati, S. (2006). Urban Poverty and the Rural Development Bias: Some Notes from Indonesia. Journal of Developing Societies, 22(2), 145-168.
Mays, L. W. (2002). GIS in water supply system, urban water supply handbook, McGraw Hill.

89
Mbilinyi, M., & Rayani, R. (2010). Research and Social Action with the Grassroots. Retrieved 31.12.2010, from http://wikiadapt.org/index.php?title=Participatory_Processes
McCall, M. K. (2003). Seeking good governance in participatory-GIS: a review of processes and governance dimensions in applying GIS to participatory spatial planning. [doi: DOI: 10.1016/S0197-3975(03)00005-5]. Habitat International, 27(4), 549-573.
McCall, M. K. (2010). Context of PGIS principles and applications, ITC lecture notes series. Mirghani, M. M. O., & Savenije, H. H. G. (1995). Incorporation of people's participation in planning and
implementation of water resources projects. [doi: DOI: 10.1016/0079-1946(95)00033-X]. Physics and Chemistry of The Earth, 20(3-4), 229-236.
Mohamed, A. S., & Savenije, H. H. G. (2000). Water demand management: Positive incentives, negative incentives or quota regulation? [doi: DOI: 10.1016/S1464-1909(00)00012-5]. Physics and Chemistry of the Earth, Part B: Hydrology, Oceans and Atmosphere, 25(3), 251-258.
Mukhija, V. (2002). An analytical framework for urban upgrading: property rights, property values and physical attributes. [doi: DOI: 10.1016/S0197-3975(02)00019-X]. Habitat International, 26(4), 553-570.
Murage, J. (2008). Zanzibar Water and Sanitation Project- Sewerage and Sanitation Working Paper: UN-HABITAT Preparation Report
Myers, G. (1996). Incorporating Indigenous Knowledge into African Planning: a Case Study with Chinese Connections. 1.
NBS. (2010). Government of Tanzania, national bureau of satistics website. Retrieved 9/12/2010, 2010, from http://www.nbs.go.tz/
NBS. (2011). United Republic of Tanzania in Key Statistics, National Bureau of statistics. Retrieved 3/2/2011, from http://www.nbs.go.tz/
Nichols, D., Stewart, & Hippel, D. V. (2000.). Planning Approaches. Paper presented at the Thematic Review V.1 prepared as an input to the World Commission on Dams, Cape Town. Retrieved from www.dams.org
Okello, M., Oenga, I., & Chege, P. (2008). participatory urban planning toolkit based on the kitale experience, A guide to community-based action planning for effective infrastrucutre and service delivery.
Okpala, D. C. I. (1999). Upgrading slum and squatter settlements in developing countries - Is there a cost-effective alternative? [Article]. Third World Planning Review, 21(1), 1-17.
Otiso, K. M. (2003). State, voluntary and private sector partnerships for slum upgrading and basic service delivery in Nairobi City, Kenya. [doi: DOI: 10.1016/S0264-2751(03)00035-0]. Cities, 20(4), 221-229.
Patton, M. (1990). Qualitative evaluation and research methods. Sage Publications, Newbury Park, California. Retrieved 28/10/2010, 2010, from http://www.dse.vic.gov.au/DSE/
Peters, G. G. (2008). Integrating local knowledge into GIS based flood risk assessment, Naga city, The Philippines. Unpublished ITC Dissertation, Wageningen University, ITC.
Pettit, C., Keysers, J., Bishop, I., & Klosterman, R. (2008). Applying the What If? Planning Support System for Better Understanding Urban Fringe Growth. In C. Pettit, W. Cartwright, I. Bishop, K. Lowell, D. Pullar & D. Duncan (Eds.), Landscape Analysis and Visualisation (pp. 435-454): Springer Berlin Heidelberg.
Ramasubramanian, L. (1995). Building communities: GIS and participatory decision making. [Article]. Journal of Urban Technology, 3(1), 67-79.
Rambaldi, G. (2006). Participatory spatial information management and communication in developing countries. The Electronic Journal of Information Systems in Developing Countries. , 25(1), 1-9. Retrieved from www.ejisdc.org
Rambaldi, G., McCall, M., Chambers, R., & Fox, J. (2006). Practical ethics for PGIS practitioners, facilitators, technology intermediaries and researchers. Paper presented at the Participatory learning and action 54.
Rambaldi, G., McCall, M., Weiner, D., Mbile, P., & Kyem, P. (2004, May, 08, 2010). Participatory GIS. Retrieved May, 20, 2004, from http://www.iapad.org/participatory_gis.htm
Rambaldi, G., Muchemi, J., Crawhall, N., & Monaci, L. (2007). Through the Eyes of Hunter-Gatherers: participatory 3D modelling among Ogiek indigenous peoples in Kenya. Information Development, 23(2-3), 113-128.
Raymond, C. M., Fazey, I., Reed, M. S., Stringer, L. C., Robinson, G. M., & Evely, A. C. (2010). Integrating local and scientific knowledge for environmental management. [doi: DOI: 10.1016/j.jenvman.2010.03.023]. Journal of Environmental Management, 91(8), 1766-1777.
Rogers, P., Bhatia, R., & Huber, A. (1998). Water as a Social and Economic Good: How to Put the Principle into Practice." Global Water Partnership, Stockholm.

90
Rogers, P., Radhika, S., & Bhatia, R. (2002). Water is an economic good: How to use prices to promote equity, efficiency and sustainability. Water Policy 4,
1-17]. Sadoff, C. W., Whittington, D., & Grey, D. (2002). Africa‟s International Rivers: An Economic Perspective, The
World bank. Sanders, R. (1990). AFRICAN CITIES IN CRISIS - MANAGING RAPID URBAN-GROWTH -
STREN,R, WHITE,R. [Book Review]. Urban Geography, 11(6), 617-619. Savenije, H. H. G., & Van der Zaag, P. (2002). Water as an economic good and demand management,
paradigms with pitfalls. Water international, 27(1), 98-104. Savenije, H. H. G., & Van der Zaag, P. (2008). Integrated water resources management: Concepts and
issues. [doi: DOI: 10.1016/j.pce.2008.02.003]. Physics and Chemistry of the Earth, Parts A/B/C, 33(5), 290-297.
Schlossberg, M., & Brehm, C. (2009). Participatory Geographic Information Systems and Active Transportation Collecting Data and Creating Change. [Article]. Transportation Research Record(2105), 83-91.
Scholz, W. (2008). Challenges of Informal Urbanization, the Case of Zanzibar, Tanzania (Vol. 50): Spring research series 50, University of Dortmund.
Sedogo, L. G. (2002). Integration of local participatory and regional planning for resource management using remote sensing and GIS. Unpublished PhD Thesis, Wagenigen University.
Sibson, R. (1981). A brief description of natural neighbor interpolation (Chapter 2), In V. Barnett. Interpreting Multivariate Data. Chichester. Retrieved 29/12/2010, from http://www.tiem.utk.edu/~sada/helpv4/natural_neighbor.html
Sieber, R. (2006). Public Participation Geographic Information Systems: A Literature Review and Framework. Annals of the Association of American Geographers, 96(3), 491-507.
Smith, L. E. D. (2004). Water As An Economic Good – A Work In Progress. Paper presented at the ESRC funded "Water Governance - Challenging the Consensus", Imperial College London, University of Bradford. seminar series, November 18-19, 2004.
Smout, I., Kayaga, S., & Muñoz-Trochez, C. (2008). Financial and Economic Aspects of Water Demand Management in the Context of Integrated Urban Water Management. Paper presented at the 3rd SWITCH Scientific Meeting
Snellen, W. B., & Schrevel, A. (2004). IWRM: for sustainable use of water, 50 years of international experience with the concept of integrated water management. Paper presented at the FAO/Netherlands Conference on Water for Food and Ecosystems.
Soy, S. K. (1997). The case study as a research method. Unpublished paper, University of Texas at Austin. Retrieved from http://www.gslis.utexas.edu/~ssoy/usesusers/l391d1b.htm
Speck, S. (2006). Financial aspects of water supply and sanitation in transboundary waters of South-Eastern Europe.
Srinivas, H. (2010). Urban Squatters and Slums. Retrieved 05/08/2010, from http://www.gdrc.org/uem/squatters/define-squatter.html
Stubbs, M., Lemon, M., & Longhurst, P. (2000). Intelligent Urban Management: Learning to Manage and Managing to Learn Together for a Change. Urban Stud, 37(10), 1801-1811.
Sulaiman, M. S., & Ali, M. H. (2006). The Causes and Consequences of the Informal Settlements in Zanzibar. Paper presented at the Shaping the Change, XXIII FIG Congress, Munich, Germany.
Talen, E. (2000). Bottom-Up GIS. A New Tool for Individual and Group Expression in Participatory Planning Journal of the American Planning Association, Volume 66(Issue 3 September 2000), pages 279 - 294.
Taylor, L. E. (1981). Environmental aspects of water-resources planning in England and Wales. [doi: DOI: 10.1016/0022-1694(81)90131-1]. Journal of Hydrology, 51(1-4), 231-243.
Turkstra, J., & Raithelhuber, M. (2004). Urban slum monitoring. Retrieved from http://proceedings.esri.com/library/userconf/proc04/abstracts/a1667.html
Twigg, J. (2001). Guidance Notes on Participation and Accountability, Benfield Grieg Hazard Resaerch Centre, University College, London. Australian Journal of Emergency Management Vol. 14, No. 4, Summer 1999 - 2000: 51-58.
Uchegbu, S. N. (2009). Effective planning and management as critical factors in urban water supply and management in Umuahia and Aba, Abia State, Nigeria. [doi: DOI: 10.1016/j.pce.2008.08.004]. Physics and Chemistry of the Earth, Parts A/B/C, 34(1-2), 23-27.
UN-Habitat. (2006a). Analytical Perspective of Pro-poor Slum Upgrading frameworks. United Nations Human Settlements Programme, Nairobi.
91
UN-Habitat. (2006b). State of the Word Cities2006/2007 Report Paper presented at the The Millennium Development Goals and Urban Sustainability: 30 Years of Shaping the Habitat Agenda, Nairobi.
UN-Habitat. (2006c). Upgrading of urban Slums and Squatter Areas. Retrieved from http://www.unhabitat.org/
UN-Habitat. (2009). Governance and planning for slum upgrading in African, Caribbean and Pacific countries: lessons learned from global experience. Paper presented at the International tripartite conference on urbanization challenges and poverty reduction in African, Caribbean and Pacific countries.
UN-Millennium-Project. (2005a). A Home in the City, Task force on Improving the lives of Slum Dwellers. Available from http://www.unmillenniumproject.org/documents/Slumdwellers-complete.pdf
UN-Millennium-Project. (2005b). Investing in Development: A Practical Plan to Achieve the Millennium Development Goals. New York
United_Nations. (2003). A guide to the Application of Public Participation in Planning and Policy Formulation. Towards sustainable transport Development.
USAID. (2006). What is Integrated Water Resources Management?. United States Agency For International development,. Retrieved 23/1/2011, from http://www.usaid.gov/our_work/environment/water/what_is_iwrm.html
Vision2020. (2000). The Revolutionary Government of Zanzibar Vision 2020. Watson, D. (1999). The natural neighbor series manuals and source codes. [doi: DOI: 10.1016/S0098-
3004(98)00150-2]. Computers & Geosciences, 25(4), 463-466. Wehremann, B. (2002). Urban Land Management. Journal for Planning and Building in the Third World, 3. WHO/UNICEF. (2006). Meeting the MDG drinking water and sanitation target. The urban and rural challenge of the
decade. Winayanti, L., & Lang, H. C. (2004). Provision of urban services in an informal settlement: a case study of
Kampung Penas Tanggul, Jakarta. [doi: DOI: 10.1016/S0197-3975(02)00072-3]. Habitat International, 28(1), 41-65.
World_Bank. (2004). Water Resources Sector strategy, Strategic Directions for World Bank Engagement World_Bank. (2006). Managing Water Resources to Maximize Sustainable Growth: A Country Water
Resources Assistance Strategy for Ethiopia. WorldBank. (2010). Upgrading urban communities. A resources for Practitioners. Retrieved 5/08/2010,
2010, from http://web.mit.edu/urbanupgrading/ WSAA. (2010). Guide to Demand Dangement, Water Services Association of Australia Ltd. . Yabes, R. (Ed.). (2000). Community Participation Methods in Design and Planning: Henry Sanoff, John Wiley &
Sons, New York, 2000, 306 pp (Vol. 50). Yehuda, K. (1997). Water Distribution Network Rehabilitation: Selection and Scheduling of Pipe Rehabilitation
Alternatives. PhD Thesis, University of Toronto, Canada. ZAWA. (2008a). Water users Census Report. ZAWA. (2008b). Zanzibar Water Authority Strategic Business Plan July 2008 – June 2013. ZAWA. (2010). Status report on Zanzibar water supply systems: The united republic of Tanzania, Zanzibar
revolutionary government. ZSGRP. (2007). Zanzibar Strategy for Growth and Reduction of Poverty (ZSGRP), The Revolutionary Government of
Zanzibar.

92
ANNEXES
Annex 1: Flowchart showing raster interpolation steps
Household
survey points
N=325
Recode selected
variables from HH
questionnaire
Join HH_OIDpoints and
DBF file using OBJECTID
Joined table of water
provision questionnaire
variables and HH survey
points
Select by attribute
“Area”=0 (Informal area)
N=125
Select by attribute
“Area”=1 (Formal area)
N=200
Raster
Interpolation
(using IDW )
Rasterized layer of
households‟
response variables
Symbolize
Using; stretch (standard deviation)
Maps showing spatial visualization of
various water provision variables in
the study areas
Informal HH points with
questionnaire variables
Formal HH points
with questionnaire
variables
Water provision
questionnaire variables
(DBF.file) N=325
Shape files
Shehia boundary, Urban
buildings, roads
Overlay
function
Annex 2: Housing roofing and wall condition in the study area
House Built of Frequency Percent
roof Grass 7 2%
iron sheet 318 98%
Total 325 100
wall mud 3 1%
cement block 322 99%
Total 325 100
Annex 3: Cross tabulation of house ownership status within the formal and informal areas
Two study areas Total
Formal Informal
House ownership status
Occupancy license Count 166 96 262
% within Two study areas 83.0% 76.8% 80.6%
temporal occupancy license
Count 12 4 16
% within Two study areas 6.0% 3.2% 4.9%
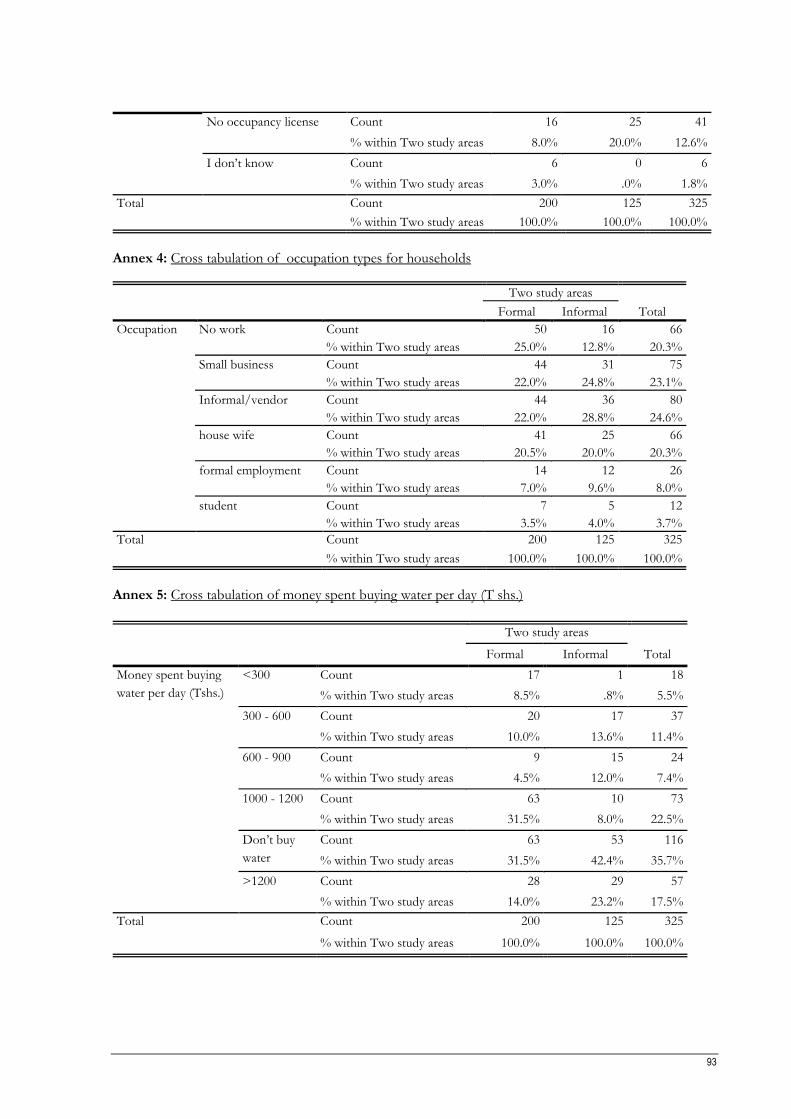
93
No occupancy license Count 16 25 41
% within Two study areas 8.0% 20.0% 12.6%
I don‟t know Count 6 0 6
% within Two study areas 3.0% .0% 1.8%
Total Count 200 125 325
% within Two study areas 100.0% 100.0% 100.0%
Annex 4: Cross tabulation of occupation types for households
Two study areas
Total Formal Informal
Occupation No work Count 50 16 66
% within Two study areas 25.0% 12.8% 20.3%
Small business Count 44 31 75
% within Two study areas 22.0% 24.8% 23.1%
Informal/vendor Count 44 36 80
% within Two study areas 22.0% 28.8% 24.6%
house wife Count 41 25 66
% within Two study areas 20.5% 20.0% 20.3%
formal employment Count 14 12 26
% within Two study areas 7.0% 9.6% 8.0%
student Count 7 5 12
% within Two study areas 3.5% 4.0% 3.7%
Total Count 200 125 325
% within Two study areas 100.0% 100.0% 100.0%
Annex 5: Cross tabulation of money spent buying water per day (T shs.)
Two study areas
Total Formal Informal
Money spent buying
water per day (Tshs.)
<300 Count 17 1 18
% within Two study areas 8.5% .8% 5.5%
300 - 600 Count 20 17 37
% within Two study areas 10.0% 13.6% 11.4%
600 - 900 Count 9 15 24
% within Two study areas 4.5% 12.0% 7.4%
1000 - 1200 Count 63 10 73
% within Two study areas 31.5% 8.0% 22.5%
Don‟t buy
water
Count 63 53 116
% within Two study areas 31.5% 42.4% 35.7%
>1200 Count 28 29 57
% within Two study areas 14.0% 23.2% 17.5%
Total Count 200 125 325
% within Two study areas 100.0% 100.0% 100.0%

94
Annex 6: Cross tabulation of amount of money households willing to pay per month (Tshs)
Two study areas
Total Formal Informal
Amount of money willing to pay per month (T shs.)
500 Count 11 5 16
% within Two study areas 5.5% 4.0% 4.9%
1000 Count 25 17 42
% within Two study areas 12.5% 13.6% 12.9%
2000 Count 54 33 87
% within Two study areas 27.0% 26.4% 26.8%
3000 Count 23 27 50
% within Two study areas 11.5% 21.6% 15.4%
4000 Count 6 4 10
% within Two study areas 3.0% 3.2% 3.1%
5000 Count 5 1 6
% within Two study areas 2.5% .8% 1.8%
Water to remain free
Count 76 38 114
% within Two study areas 38.0% 30.4% 35.1%
Total Count 200 125 325
% within Two study areas 100.0% 100.0% 100.0%
Annex 7: Cross tabulation of toilet types in the study areas
Two study areas
Total Formal Informal
Toilet type pit latrine Count 147 93 240
% within Two study areas 73.5% 74.4% 73.8%
flash toilet Count 53 32 85
% within Two study areas 26.5% 25.6% 26.2%
Total Count 200 125 325
% within Two study areas 100.0% 100.0% 100.0%
Annex 8: Cross tabulation of the main problems facing households in the two study areas
Two study areas
Formal Informal total
Problems Travel far in search of
water
Count 55 26 81
% within Two study areas 27.5% 21.8% 25.4%
Lack of water inside the
house
Count 18 5 21
% within Two study areas 9.0% 2.5% 6.6%
high cost buying water Count 16 10 26
% within Two study areas 8.0% 8.4% 8.2%
Frequent water shortages Count 59 42 101
% within Two study areas 29.5% 35.3% 31.7%
Long queues in water
points
Count 19 17 36
% within Two study areas 9.5% 14.3% 11.3%
buying water everyday Count 1 1 2
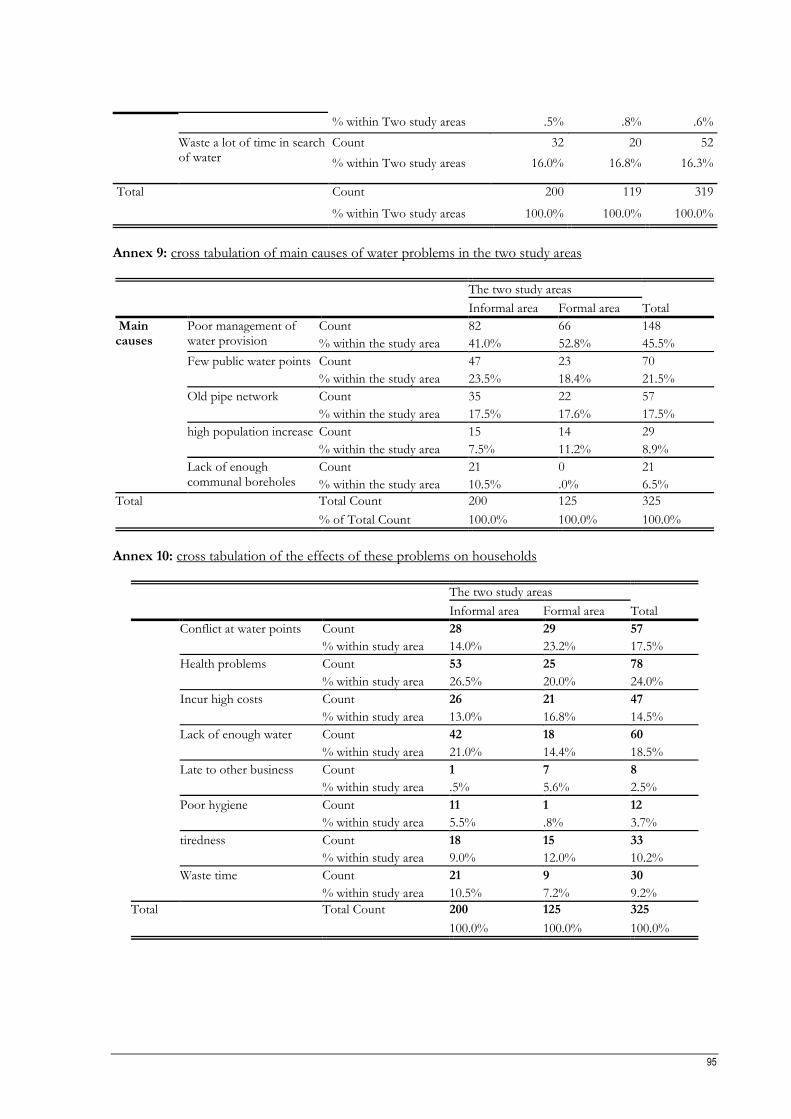
95
% within Two study areas .5% .8% .6%
Waste a lot of time in search of water
Count 32 20 52
% within Two study areas 16.0% 16.8% 16.3%
Total Count 200 119 319
% within Two study areas 100.0% 100.0% 100.0%
Annex 9: cross tabulation of main causes of water problems in the two study areas
The two study areas
Total Informal area Formal area
Main causes
Poor management of water provision
Count 82 66 148
% within the study area 41.0% 52.8% 45.5%
Few public water points Count 47 23 70
% within the study area 23.5% 18.4% 21.5%
Old pipe network Count 35 22 57
% within the study area 17.5% 17.6% 17.5%
high population increase Count 15 14 29
% within the study area 7.5% 11.2% 8.9%
Lack of enough communal boreholes
Count 21 0 21
% within the study area 10.5% .0% 6.5%
Total Total Count 200 125 325
% of Total Count 100.0% 100.0% 100.0%
Annex 10: cross tabulation of the effects of these problems on households
The two study areas
Total Informal area Formal area
Conflict at water points Count 28 29 57
% within study area 14.0% 23.2% 17.5%
Health problems Count 53 25 78
% within study area 26.5% 20.0% 24.0%
Incur high costs Count 26 21 47
% within study area 13.0% 16.8% 14.5%
Lack of enough water Count 42 18 60
% within study area 21.0% 14.4% 18.5%
Late to other business Count 1 7 8
% within study area .5% 5.6% 2.5%
Poor hygiene Count 11 1 12
% within study area 5.5% .8% 3.7%
tiredness Count 18 15 33
% within study area 9.0% 12.0% 10.2%
Waste time Count 21 9 30
% within study area 10.5% 7.2% 9.2%
Total Total Count 200 125 325
100.0% 100.0% 100.0%

96
Annex 11: Spearman‟s Correlations rho (rs) between the main variables of water service provision N= 325
HHI TTW MBY HHC WAV CS QWT WP AWP CPT
HHI rs
Sig. 1 TTW rs .215**
Sig. .000 1 MBY rs .124* .107
Sig. .025 .053 1 HHC rs -.014 -.052 -.052
Sig. .795 .348 .349 1 WAV rs -.100 .150** .010 -.147**
Sig. .070 .007 .862 .008 1 CS rs -.095 .076 .052 .146** .119*
Sig. .088 .174 .346 .009 .032 1 QWT rs -.001 .262** .022 .008 .077 .134*
Sig. .980 .000 .692 .884 .168 .016 1 WP rs -.262** -.181** -.020 -.149** .193** -.145** -.087
Sig. .000 .001 .723 .007 .000 .009 .117 1 AWP rs -.214** -.205** .029 -.079 .126* -.136* -.019 .844**
Sig. .000 .000 .597 .157 .023 .014 .734 .000 1 CPT rs .022 -.085 .159** -.054 .216** .182** -.082 .037 .001
Sig. .691 .125 .004 .329 .000 .001 .138 .508 .989 1
**. Correlation is significant at the 0.01 level (2-tailed). *. Correlation is significant at the 0.05 level (2-tailed). HHI= Household Income, TTW= Time Taken_towater source, MBY= Money buy water, HHC= Household connection to piped water, WAV= daily water availability, CS= customer satisfaction, QWT= quality of water, WP= willing to pay, AWP= amount willing to pay, CPT= community participation)