Embed Size (px)
Citation preview

Journal of Statistics Education, Volume 18, Number 1 (2010)
1
Integrating Real-Life Data Analysis in Teaching Descriptive
Statistics: A Constructivist Approach
Zipora Libman
Kibbutzim College of Education, Technology and the Arts
Journal of Statistics Education Volume 18, Number 1 (2010),
www.amstat.org/publications/jse/v18n1/libman.pdf
Copyright © 2010 by Zipora Libman all rights reserved. This text may be freely shared among
individuals, but it may not be republished in any medium without express written consent from
the author and advance notification of the editor.
Key Words: Constructivism; Statistics Education; Alternative Assessment
Abstract
This article looks at a process of integrating real-life data investigation in a course on descriptive
statistics. Referring to constructivist perspectives, this article suggests a look at the potential of
inculcating alternative teaching methods that encourage students to take a more active role in
their own learning and participate in the process of assessing what they have learned. The article
illustrates how this teaching method enabled students to realize that imparting meaning to sets of
data is a complex activity which involves conceptual flexibility, integration of all the procedures
that one has learned, and creative reasoning.
1. Introduction
As educational reforms lead to additional changes in statistics education, innovative and
effective instructional strategies will continue to be a challenging endeavor, especially for
"occasional users" taking statistics as a service course in preparation for their professional career
(Garfield, Hogg, Schau, & Whittinghill, 2002; Moore, 2001; Nicholls, 2001). This article looks
at a process of integrating real-life data investigation in a course on descriptive statistics at a
teachers college. Theoretically, it is based on the constructivist view of learning which

Journal of Statistics Education, Volume 18, Number 1 (2010)
2
encourages teaching that allows students to construct meaning. The article describes the process
of teaching that was used in this course, which required students to cope with assignments based
on real-life data. Essentially, this article considers implications of this constructivist based
approach in terms of its potential to improve the quality of learning descriptive statistics.
The article has four parts. The first consists of a brief discussion of constructivist theory and its
application to teaching, evaluation and learning. The second part addresses context and its
relevance to learning. The third and main part presents the process of integrating authentic data
analysis in teaching descriptive statistics and highlights insights that arose while the course was
being taught. And finally, the fourth part sums up the article and offers some implications.
2. Constructivism – Teaching, Evaluation, and Learning
Constructivism is a theory about knowledge and learning that deals on the conceptual level with
the question of the nature of knowledge and how a person comes to be a "knower" (Bereiter,
1994; Bransford, Brown, & Cocking, 2000; Driver, Asoko, Leach, Mortimer, & Scott, 1994;
Fosnot, 1996; Larochelle, 2007; Prawat, 1996). Based on research in psychology, philosophy,
and anthropology, constructivist theory describes knowledge as time-bound, evolving, and
subjective. It is constructed within the person as a function of social-cultural processes. From this
angle, learning is seen as a process of self-regulation – or actually as a struggle between the
person's currently held beliefs and attitudes, and different, sometimes even clashing,
conceptualizations. As a result of this struggle the individual constructs a different representation
of reality which is more meaningful to him or her. We could contrast, in general terms, the "old"
positivist approach with the new "constructivist" one: in the older approach, knowledge is
considered static and separate from the knowing subject. Truth, or "truths", are situated outside
the knower, and knowledge consists of the accumulation of truths in a particular subject area.
The more such truths a person collects, the more knowledge he has. Constructivism sharply
opposes this view and claims that knowledge is created by the knowing subject as a function of
beliefs and experiences. Since knowledge consists of what human beings do and express, it is
always tentative, subjective and personal. It cannot be proven true in any absolute sense. Hence,
constructivism does not posit a structure of universal truths. Rather, constructivism refers to
working hypotheses.
Though constructivism is not a theory of teaching, it has powerful implications for teaching and
evaluation whose results may be very different from what usually happens in educational
institutions. From a constructivist viewpoint, the traditional, positivist model of "teaching as
transfer of knowledge", where teachers work with the assumption that they can directly pass on
knowledge and understanding to their students and then evaluate whether they have
accomplished their aims, is invalid. Constructivists would argue that we cannot assume that
meaning can simply be conveyed to students through symbols, formulas and explanations, nor
can students acquire exact copies of their teachers' concepts. Moreover, constructivists claim that
concepts cannot efficiently be broken down into sub-concepts, or taught without reference to
context. By contrast, a constructivist approach to these matters offers students the opportunity to
construct meaning by and for themselves, immersed in context-bound experience in which they

Journal of Statistics Education, Volume 18, Number 1 (2010)
3
look for patterns, raise questions, build models, strategies and approaches (Airasian & Walsh,
1997; Fosnot, 1996; Larochelle, 2007).
In the past 25 years constructivism has swiftly gained prominence. Most recent curricular
reforms, especially in mathematics and the sciences, have referred to constructivism, either
explicitly or implicitly. In the 1980s, the National Council of Teachers of Mathematics published
a position paper which describes mathematics teaching as, among other things, encouraging
students to construct their own problems (NCTM, 1980, 1989, 1995). Similarly, the National
Science Education Teacher Association suggests a science research approach by which students
develop and conduct their own experiments and study their research hypotheses (Van Joolingen,
de Jong, Lazonder, Savelsbergh, & Manlove, 2005). Institutes for higher education, too, have
often mentioned the importance of the constructivist approach to teaching and evaluation (Biggs,
1996; Hendry, 1996; Tynjala, 1999), especially in science and medicine departments (Kirschner,
Sweller, & Clark, 2006; Schmidt, 1998, 2000), as well as in statistics education (Broers &
Imbos, 2005; Chance, 1997; Cobb, 1993; Garfield, 1995; Garfield et al. 2002; Groth, 2007;
Hogg, 1992; Moore, 1997).
In summary, it can be said, that theoretically there is general agreement about the constructivist
aspect of human learning. The experience that this article describes focuses on the importance of
context in learning and evaluation. This idea will be elaborated in the next section.
3. The Importance of Context in Learning
We chose to teach the topics of descriptive statistics with special emphasis on context, both in
the learning stage and in the subsequent evaluation of what had been learned. During the course
the students practiced what they were learning by performing analyses of data they collected
themselves. These exercises formed a significant part of the course evaluation. Exercising the
study material with reference to authentic data added a dimension of significance and challenge.
In this way, we believed, students would learn something beyond mastery of statistical
procedures. Constructivist theory strongly implies that gaining deep understanding, which will
then enable the student to properly apply what he has learned, requires a mode of learning that
allows the learner to investigate freely, in realistic circumstances and meaningful contexts (see,
for instance, Fosnot, 1996; Resnick, 1989; Larochelle, 2007). This actually involves two
requirements: personal investigation, and complex and meaningful context. Contextual learning,
to a substantial degree, dictates teaching and evaluation methods that require the learners to do
their own investigating and cope by themselves in order to create meaning, in this case –
statistical understanding.
Five main features that are typical of authentic contexts have been suggested (Cobb, 1999;
Fosnot, 1996; Tynjala, 1999). These features are the theoretical justification for including
authentic contexts in processes of teaching and evaluation, and they are as follows: practical
significance; complexity and challenge; relevance and motivation; interconnectedness and
transfer and learner empowerment. Though these features are fundamentally interlinked, For the
sake of clarity each of them will be described separately.
Journal of Statistics Education, Volume 18, Number 1 (2010)
4
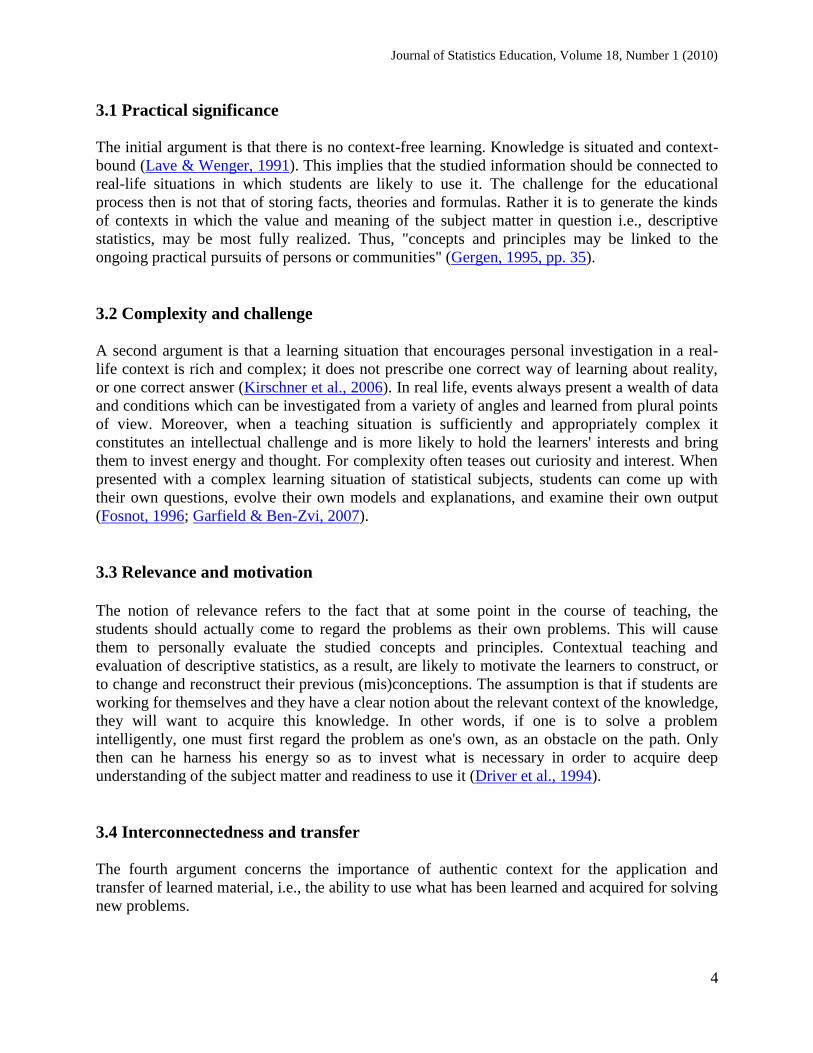
3.1 Practical significance
The initial argument is that there is no context-free learning. Knowledge is situated and context-
bound (Lave & Wenger, 1991). This implies that the studied information should be connected to
real-life situations in which students are likely to use it. The challenge for the educational
process then is not that of storing facts, theories and formulas. Rather it is to generate the kinds
of contexts in which the value and meaning of the subject matter in question i.e., descriptive
statistics, may be most fully realized. Thus, "concepts and principles may be linked to the
ongoing practical pursuits of persons or communities" (Gergen, 1995, pp. 35).
3.2 Complexity and challenge
A second argument is that a learning situation that encourages personal investigation in a real-
life context is rich and complex; it does not prescribe one correct way of learning about reality,
or one correct answer (Kirschner et al., 2006). In real life, events always present a wealth of data
and conditions which can be investigated from a variety of angles and learned from plural points
of view. Moreover, when a teaching situation is sufficiently and appropriately complex it
constitutes an intellectual challenge and is more likely to hold the learners' interests and bring
them to invest energy and thought. For complexity often teases out curiosity and interest. When
presented with a complex learning situation of statistical subjects, students can come up with
their own questions, evolve their own models and explanations, and examine their own output
(Fosnot, 1996; Garfield & Ben-Zvi, 2007).
3.3 Relevance and motivation The notion of relevance refers to the fact that at some point in the course of teaching, the
students should actually come to regard the problems as their own problems. This will cause
them to personally evaluate the studied concepts and principles. Contextual teaching and
evaluation of descriptive statistics, as a result, are likely to motivate the learners to construct, or
to change and reconstruct their previous (mis)conceptions. The assumption is that if students are
working for themselves and they have a clear notion about the relevant context of the knowledge,
they will want to acquire this knowledge. In other words, if one is to solve a problem
intelligently, one must first regard the problem as one's own, as an obstacle on the path. Only
then can he harness his energy so as to invest what is necessary in order to acquire deep
understanding of the subject matter and readiness to use it (Driver et al., 1994).
3.4 Interconnectedness and transfer
The fourth argument concerns the importance of authentic context for the application and
transfer of learned material, i.e., the ability to use what has been learned and acquired for solving
new problems.

Journal of Statistics Education, Volume 18, Number 1 (2010)
5
Researchers believe that constructivist theory is important because it perceives the context of
teaching as interconnected and complex, as ill-structured and irregular. When this is
acknowledged learning processes that allow development of greater cognitive flexibility can be
assimilated – and this, in turn, helps the learners develop their ability to implement knowledge.
Complex and realistic contextual teaching and evaluation conditions are likely to encourage
more meaningful statistical reasoning and conceptual understanding. Such conditions provide
experience in applying the concepts and rules that have been learned. They also illustrate how
the nature of the problem dictates the modes of solution. This facilitates application and transfer:
students learn how, each time, to come up with an appropriate combination of rules and how to
use these rules for problem solving (Gergen, 1995; Hmelo-Silver, 2004; Kirschner et al., 2006).
3.5 Learner empowerment
Teaching and evaluation processes that encourage personal investigation in a realistic context
reinforce the role of the learner (Eisner, 1999; Graves, 2002). Traditionally it is the teacher
exclusively who decides what will be taught and how the student will be evaluated. What it
comes down to is that the teacher usually has a fixed plan in which the student has no say. When,
however, teaching and evaluation conditions include students' personal investigation of statistical
data in a practical-personal context, the student, to an important extent, becomes a partner in
selecting subject-matter to be studied and evaluated and the curriculum is no longer fixed and
rigid. In such a teaching-evaluation framework, the students have a role in adjusting the
curriculum to their needs, because the conditions of discussion and learning demand it. More
dialogue, too, is possible, in this type of setting, between teacher and learners, as well as among
the learners themselves. Since the students are familiar with the situation they are investigating
and studying, they become sort of experts who may initiate, pose questions and problems, and
raise topics for discussion. Thus the student comes to own knowledge regarding the topic under
investigation and may gain a decisive voice in the course of the lesson, its outcomes, and the
mode of evaluation in use.
To conclude this section, it should be pointed out that constructivist theories make no hard and
fast distinction between teaching and evaluation (Eisner, 1999; Shepard, 2000). Evaluation is
seen as integral to teaching because it accompanies and moulds learning processes at every stage.
According to this approach the process of learning is no less important than its outcome. What
matters here is the alignment between teaching methods and evaluation, or instructional
alignment, as it is known among professionals (Cohen, 1987; Nitko, 1989). According to this
notion, teaching is a complex system, all of whose components are aligned in order to maximize
the most important goal: improving student learning.
4. Integrating real-life data analysis
In the study groups that this article describes, the students learned descriptive statistics by
practicing the acquired subject matter on real-life data they collected according to their choice.
During the first lesson of the semester, students were instructed about data collection on a topic
of interest to them. They were told that they would be expected to investigate and describe the
data they collected with the help of the tools for statistical analysis they would acquire in the

Journal of Statistics Education, Volume 18, Number 1 (2010)
6
course. They were also told that the quality of their analysis and the effort they invested in the
analysis would play an important role in determining their final grades.
Three study groups (a total of about 300 students), who were taught by three teachers and three
teacher-assistants, participated in the study. Each teacher taught the lesson in his or her way. At
the end of each lesson, the teacher gave the students a homework assignment. While, however,
the exercises usually used in introductory statistics are the kinds that appear in regular statistics
textbooks, participants in the current study were asked to perform the statistical analyses with
data they had collected themselves. An example of a typical exercise in frequency distributions
tables presented in a textbook might look like this:
There were 50 items in a mathematics test. For each correct answer, students received one
point. The following is a list with the marks of 40 students.
Prepare frequency distribution tables in two forms:
(a) Using a class interval of 6
(b) Using a class interval of 3
Indicate the advantages and disadvantages of each type of representation.
In contrast, the study groups who were practicing descriptive statistics with real-life data were
asked the following open question:
Referring to your data, formulate a question (or questions) that interests you concerning one
of your variables, and that can be answered by means of two different frequency distribution
tables. Write down your question, answer it and draw the necessary conclusions.
When students work with this type of evaluation task, they "use their minds" and they are active
twice over: (a) they formulate questions, and (b) they organize and apply the studied material in
a context that is real and significant for them. Given, in fact, the current nature of studies in
higher education, this kind of teaching is most similar to the one they will encounter at a later
stage, when they will be expected to analyze data by themselves.
The crux of this article is to clarify the insights that arose when we examined students' exercises,
and how they affected the classroom teaching. Below are examples from students' exercises
which aim to illustrate the advantages of this teaching-evaluation method. But before going into
a more analytical discussion of students exercises in this learning situation, one example of
student activity will be presented in greater detail.
This student set out to analyze theater attendance of people in a large community center where he
worked. He compiled a short questionnaire, which included the following variables: age, gender,
occupation, frequency of theater attendance (number of plays seen during the year), type of play
preferred and to what extent the subject enjoyed going to the theater. He then circulated the
questionnaire to 30 people attending the community center who had been randomly selected. The
student then "interrogated" his data on the basis of the course material. He set the following
questions:
What is the distribution of theater attendance of the sample?
What kind of plays do they prefer?
Are there differences in the preferences of men and women?

Journal of Statistics Education, Volume 18, Number 1 (2010)
7
Is there a correlation between the age of the subject and the other variables?
Following is part of the answer to the first question (frequency distributions of theater
attendance) and issues that arose during the analysis:
Number of theater visits: Frequency distribution of theater attendance
Class size=5 Class size=3
No. of visits Frequency No. of visits Frequency
0-4 10 0-2 11
5-9 15 3-5 10
10-14 2 6-8 4
15-20 3 9-11 2
Total 30 12-14 0
15-17 1
18-20 2
Total 30
The discussion concerning the alternative presentations of the data dealt with the following
issues:
What does the distribution of theater attendance look like? Can we draw different
conclusions from the alternative presentations of the data? What are the advantages and
disadvantages of each of the presentations? Should we present the results in graphic
form?
Are these the expected results? Do you think that if someone else analyzed the data he
would get the same frequency distribution?
Without calculating, which distribution seems to be more "scattered"? Why?
Without calculating, what measure of central tendency seems to be most appropriate to
describe this frequency distribution?
In the next sections some more examples will be described and discussed according to the
theoretical framework which defines the five advantages of this kind of intervention: practical
significance, complexity and challenge, relevance and motivation, interconnectedness and
transmission, and learner empowerment.
4.1 Practical significance
In the study groups in which authentic tasks were carried out through real-life data investigation,
the study process received an added practical significance. In the work of these groups, the
message was: Researchers do data analysis when they want to find out something about a
specific issue, and not simply because they want to do statistical analysis.
Students chose research topics and collected data that reflected their interests. The study topics
were practiced by trying to answer questions the students wanted to consider, and which related
to a variety of issues in their personal or professional lives. Trying to answer their own questions
was the incentive for students to examine the data in depth and to apply the concepts and
principles they had acquired in the statistics course.

Journal of Statistics Education, Volume 18, Number 1 (2010)
8
Since most of the students at the college were student teachers, they were most interested in the
school environment and, especially the pupils in the class in which they were doing their
training. Examples of students' choice of subjects included learning achievements of the class
they had taught compared to the achievements of other classes, reading habits of pupils in their
class in terms of quantity and types of literature, progress in reading skills and physical
development of first graders, follow-up of pupils' second language achievements in English and
Arabic from fifth to sixth grade, computer accessibility for classroom teachers as compared to
their pupils, and leisure activities of pupils at various levels of achievement.
Other subjects of interest related to the teachers in the schools where the participants were
trained, such as teacher satisfaction with teaching, and teacher burnout. Other topics, too, were
chosen, like for instance, one student collected data at a basketball trainers course in which he
had participated, referring to background information about the participants and to their
satisfaction with the course. Another student had a look at patterns of theater attendance, and yet
another looked at satisfaction with life on the kibbutz in which she lived, with reference to
respondents' profession and age.
Students used the data they had personally collected in studying all course topics in descriptive
statistics. This, in fact, showed students the practical significance of the concepts they met in
their studies and supported the connection between the study process and the skills that would be
demanded of them in the future: to be able to collect and describe data with the aim of answering
a specific question. As the students in this group progressed, they answered concrete questions
which they themselves had formulated.
4.2 Complexity and challenge
A learning event in which students examine real-life data is complex, rich and challenging. This
section shows how data description ceased to be an automatic process and instead became an
exercise in thinking and judgment. The data with which the students were working were
"natural", i.e. they had not been manipulated to make them easier for use. This is how it is in real
life: surprising, challenging, and unique. So these students worked with a plurality of data and
variables out of which they would have to choose the ones that were relevant to their particular
problem. Since they had to decide on what to focus, and what to ignore, the situation could not
be addressed purely technically and automatically. This kind of practice contrasts with the usual
type of exercise which tends to provide students with the relevant data for dealing with a specific
problem.
Two especially noteworthy issues which are extremely important in understanding descriptive
statistics arise in the study of real-life data: (a) dealing with outliers, and (b) relating to missing
values.
4.2.1 Dealing with outliers
It often happens that students at work on realistic cases run into difficulty when they discover
that a small number of their values are extreme when compared to the majority of the data. So,

Journal of Statistics Education, Volume 18, Number 1 (2010)
9
for instance, one of the participants collected data relating to the social status of pupils in her
classroom. She gave her pupils a short questionnaire which included, among other questions, the
following one: "How many friends do you have in the class?" Most responses indicated between
one to six friends. Two children however, wrote: "All the children in the class are my friends – I
have 30 friends." An extreme value like 30 obviously affects the data organization as well as the
majority of the measures of central tendency and of variation.
This caused a problem that required some considerations. One thing this situation made possible,
was to have a look at what actually happens with statistical measures when extreme outliers are
included, and what happens if they are excluded from the analysis. What's important is that
analysis, here, is not automatic and mechanistic. The problem requires thought and deliberation.
As a result the entire learning situation is richer, more sophisticated, and more likely to stimulate
the students. It is also worth mentioning that this kind of data invites considerations about the
nature and quality of the data collection process and implications concerning validity and
reliability of measurement instruments like questionnaires. Students come to understand that
such information is meaningful in statistical analysis as it provides crucial background material.
They become aware that data do not exist in a vacuum, but that there is a story behind the
numbers; students learn that statistical analysis involves developing the "narrative" of the data,
"unlocking the stories in the data" (Garfield & Ben-Zvi, 2007, pp. 19).
4.2.2 Relating to missing values
Quite often values were missing from the sequence of data that students collected. Here as in real
life, students were required to think and decide how to cope with the missing data. For example,
the data collected by one student included grade point average of first year college students
majoring in the humanities (literature, language, and Bible studies), and the high school
matriculation grades of these same students in literature and Bible studies. For some reason, not
all data were available for all the respondents. Three of them, for instance, did not get a
matriculation grade for literature, and the same was true of Bible studies for another three
students. The student who was doing the analysis wanted to calculate the correlation between
success in high school and success in college, in the context of the humanities. Here, she hit upon
a few questions which complicated the statistical analysis and required special attention rather
than automatically applying the "recipe" for calculating correlations. Her first dilemma was
whether she should calculate two correlation coefficients, one between grade average during the
first year at college and matriculation grade for Bible studies, and one between college grade
average and matriculation grade for literature? Second, the student had to cope with the question
of missing values, since each time the calculation was done only for the group for which there
were data related to the two relevant variables. As a result, the correlation coefficients would
have been calculated each time for a slightly different group. The student herself came up with
an interesting solution: Assign a matriculation grade to each respondent based on the average of
the grades in literature and Bible studies. The correlation with the grade average of year one at
college, then, would be calculated with respect to the average grade in the two matriculation
subjects. Thus the student solved the two problems she encountered very elegantly. She decided
to run one correlation coefficient instead of two, and she also coped with the missing values
obstacle.

Journal of Statistics Education, Volume 18, Number 1 (2010)
10
These are only two instances of how authentic data collection creates conditions that challenge
us to deal with realistic, interesting, and stimulating tasks which require thought, creativity and a
clarification of the learned material. Usually, textbooks don't provide such interesting situations.
From the point of view of constructivism, it should be pointed out that what matters is not
finding an unambiguous solution to a question, but the process of deliberating, the personal
involvement in the active process of finding a solution, supported by conceptual clarification,
logical reasoning and statistical thinking.
Teaching and evaluation that include this type of analysis prepare students for real life situations
rather than keeping them in a sterile bubble characteristic of educational institutions.
4.3 Relevance and motivation
Since the students had been practicing the statistical procedures in real-life situations which
resemble those of actual research, they were challenged and experienced the relevance of the
subject matter. As a result, the students showed interest and enthusiasm and asked countless
questions that arose in doing the assignments. Conversations with teachers and teacher assistants
revealed that the homework assignments came alive and raised students' motivation to deal with
the data. Students were in constant touch with their instructors and asked for further suggestions.
Often, students came up with two possible solutions and asked for their instructor's opinion about
which to prefer. Below are some illustrations.
One of the students looked into the issue of reading habits of pupils in her class. She discovered
that most of her pupils read very little, though there were a few who read quite a bit. This
disparity drew her interest and, based on her familiarity with the children, she hypothesized that
one explanation for the fact that some were "prolific readers" might be that they lived at a greater
distance from the school than the others. According to this theory, living at a distance made it
more difficult for them to meet with their classmates after school. Then the student decided to
interview all the pupils, thus, introducing an additional variable into her study: leisure time spent
with friends. This student put the extra effort into her work not because of the statistics course,
but because of the relevance of the subject to her life and work.
Another student, whose work yielded a correlation coefficient that was very different from the
one he had expected, went to the research literature in order to understand why.
On the whole, there were quite a few students who did not stop at doing the standard statistical
procedures, but went further and related them to background material and made an effort to make
sense of their outcomes. The context of the data allowed them not only to understand how to
organize and to analyze data but also why they should be analyzed. Such expressions of interest
and involvement occurred several times in the process of learning, as teachers as well as teacher
assistants reported.
4.4 Interconnectedness and transfer
Statistics teaching at the college was intended to enable students to apply what they were
learning, with the aim that they should know how to use statistical tools in their continued
Journal of Statistics Education, Volume 18, Number 1 (2010)
11
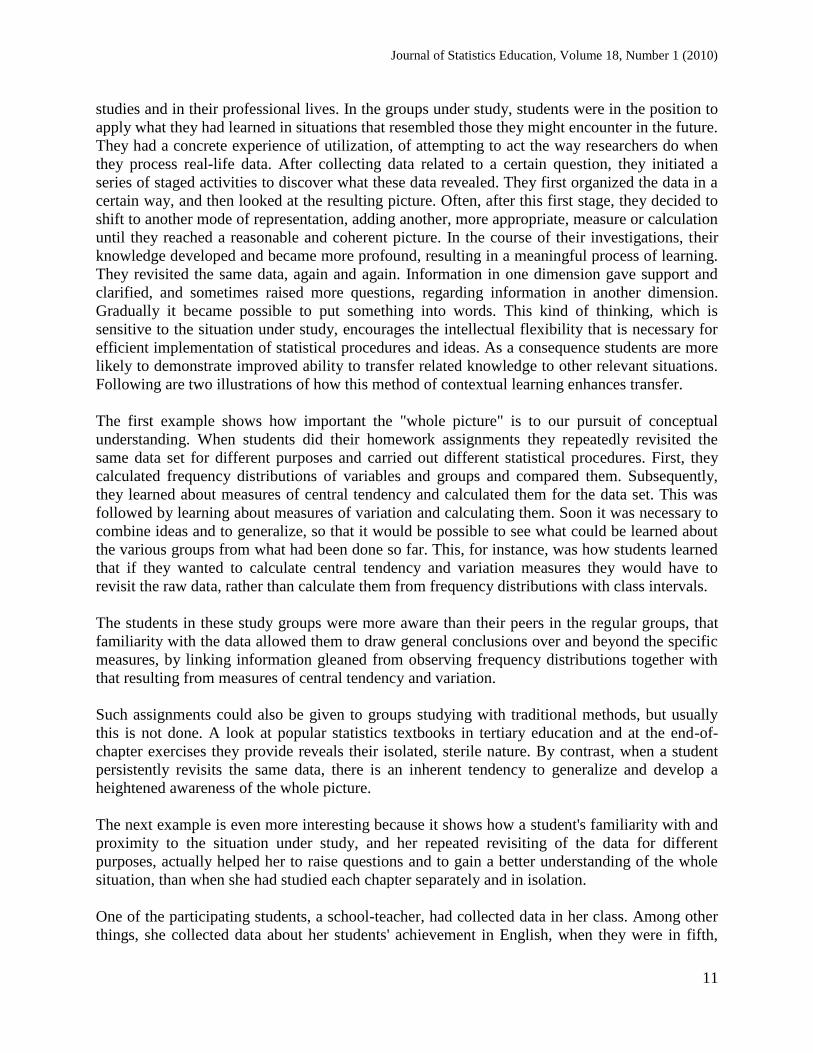
studies and in their professional lives. In the groups under study, students were in the position to
apply what they had learned in situations that resembled those they might encounter in the future.
They had a concrete experience of utilization, of attempting to act the way researchers do when
they process real-life data. After collecting data related to a certain question, they initiated a
series of staged activities to discover what these data revealed. They first organized the data in a
certain way, and then looked at the resulting picture. Often, after this first stage, they decided to
shift to another mode of representation, adding another, more appropriate, measure or calculation
until they reached a reasonable and coherent picture. In the course of their investigations, their
knowledge developed and became more profound, resulting in a meaningful process of learning.
They revisited the same data, again and again. Information in one dimension gave support and
clarified, and sometimes raised more questions, regarding information in another dimension.
Gradually it became possible to put something into words. This kind of thinking, which is
sensitive to the situation under study, encourages the intellectual flexibility that is necessary for
efficient implementation of statistical procedures and ideas. As a consequence students are more
likely to demonstrate improved ability to transfer related knowledge to other relevant situations.
Following are two illustrations of how this method of contextual learning enhances transfer.
The first example shows how important the "whole picture" is to our pursuit of conceptual
understanding. When students did their homework assignments they repeatedly revisited the
same data set for different purposes and carried out different statistical procedures. First, they
calculated frequency distributions of variables and groups and compared them. Subsequently,
they learned about measures of central tendency and calculated them for the data set. This was
followed by learning about measures of variation and calculating them. Soon it was necessary to
combine ideas and to generalize, so that it would be possible to see what could be learned about
the various groups from what had been done so far. This, for instance, was how students learned
that if they wanted to calculate central tendency and variation measures they would have to
revisit the raw data, rather than calculate them from frequency distributions with class intervals.
The students in these study groups were more aware than their peers in the regular groups, that
familiarity with the data allowed them to draw general conclusions over and beyond the specific
measures, by linking information gleaned from observing frequency distributions together with
that resulting from measures of central tendency and variation.
Such assignments could also be given to groups studying with traditional methods, but usually
this is not done. A look at popular statistics textbooks in tertiary education and at the end-of-
chapter exercises they provide reveals their isolated, sterile nature. By contrast, when a student
persistently revisits the same data, there is an inherent tendency to generalize and develop a
heightened awareness of the whole picture.
The next example is even more interesting because it shows how a student's familiarity with and
proximity to the situation under study, and her repeated revisiting of the data for different
purposes, actually helped her to raise questions and to gain a better understanding of the whole
situation, than when she had studied each chapter separately and in isolation.
One of the participating students, a school-teacher, had collected data in her class. Among other
things, she collected data about her students' achievement in English, when they were in fifth,

Journal of Statistics Education, Volume 18, Number 1 (2010)
12
and then in sixth grade. In the first stages of the analysis she compared the children's
achievements in these two consecutive years. Since this school-teacher happened to be the
English teacher in sixth grade, she was, of course, delighted to find that her students'
achievement had improved. The rise in the average grade was clearly reflected in the graphic and
tabular representations. Several weeks later, when the college statistics course was covering
correlation coefficients, the student became curious about whether there was a correlation
between her pupils' achievements in fifth grade and in sixth grade. To her amazement, when she
calculated the correlation coefficient it turned out to be high (r = 0.74). Moreover, her
interpretation of this outcome was well-grounded: "My conclusion is that usually the pupils
who did well in fifth grade also did well in sixth grade, while those who were weak in
English in fifth grade, stayed so in sixth." Still, the student wondered how this was possible:
"Didn't I find in earlier exercises that all the pupils had improved?" Such reflection is not
likely to occur when doing conventional course assignments based on "end-of-chapter
exercises". It was only because the student went back to her own data that this misconception
surfaced as she forged the link between previous and more recently acquired knowledge. She had
not figured out that while all pupils may improve, a high correlation coefficient can still be found
between the test marks in fifth and sixth grades.
This is the linking that creates "big ideas" in relation to the learned material and which will,
eventually enhance conceptual change and allow for transfer of learning. It is the context and
other "background" information that form the scaffolding for understanding statistical concepts
and principles.
4.5 Learner empowerment
This type of teaching which involves students in the learning process requires a more active type
of learning where the students are led to interpret the material they study. As reported previously,
participating students were encouraged to ask questions and focus on difficulties. Obviously,
more questions arose when students were exploring data they had collected themselves than with
conventional modes of teaching. They also tended to express their difficulties in analyzing the
data and often became quite frustrated. In part this was due to their involvement, but it also was
the result of the messy nature of the data. The frequent dialogues between teacher and students
increased student involvement even further and caused the learning process to become more
precisely adjusted to students' needs and hence, more meaningful to them. Moreover, such
dialogues offer teachers and students opportunities to give and get feedback. At times an entire
class session was devoted to the data presented by one student, with the teacher taking the
opportunity to teach the whole class some topic or some aspect of the subject matter that was
highlighted by a student's question.
This type of dialogue, where teachers could not always be ready with solutions they had worked
out beforehand (as is the case in conventional classes), was empowering for the student. Often,
such situations demanded that teachers reveal their own ways of thinking, be more flexible and
show how they coped with unanticipated issues.
Journal of Statistics Education, Volume 18, Number 1 (2010)
13
Below are two illustrations of issues that arose through students' initiative and which we can
reasonably relate to their being exposed to real life data analyses. The first illustration addresses
frequency distributions of nominal variables, and the second relates to drawing conclusions from
authentic distributions. They demonstrate how dealing with authentic data led students to be in a
position of influence and control vis-à-vis the nature of their learning and evaluation and thus to
their empowerment.
4.5.1 Grouping data in nominal variables
When teaching the subject of grouping of data in class intervals, we are usually dealing with
interval, or at least ordinal, variables. Sometimes, teachers explain why it is not suitable to create
class intervals when the variable is nominal. Usually, however, little attention is paid to this point
and surely many students do not grasp the significance of clearly describing the nature of the
variable being dealt with. It is well known that even when the teacher explains a certain issue
during the lesson, we cannot be sure that the students have actually grasped its full meaning. This
example is a good case in point. When the students were asked to formulate a question requiring
an answer in terms of grouping of data in class intervals, it turned out that several students chose
to group nominal variables. When solving the exercise, however, they treated the nominal
variable as an interval variable. So, for instance, when dealing with the variable play area in
kindergarten, one student examined to which play area in kindergarten children choose to go
during break time. This is how she labeled the variable values:
1. Dolls' corner
2. Pet animals
3. Carpentry
4. Book corner
.
.
.
14. Doctor's corner
When the student saw that the variable had many values, she decided to aggregate them into
classes. However, she did this by referring to the code number of the variable. So while the
student was able to state that the variable was nominal, when she was required to further deal
with it, she acted as though the arbitrary code number had quantitative significance. This
problem confronted the teacher with the need to explicitly discuss the issue of grouping nominal
variables – which of course needs to be carried out in reference to the category content and not to
its arbitrary numbering. This type of grouping is essentially unlike grouping of exam grades for
example, where the variables are interval or ordinal.
Another frequent phenomenon basically similar to the one above was observed in students' work
when they produced graphic descriptions of frequency distributions of nominal variables, where
the code numbers are meaningless – yet the students marked the variable values on the X axis as
fully-fledged values. Subsequently, students even drew conclusions on the basis of these
"values", e.g.: "This is a distribution that is negatively skewed".

Journal of Statistics Education, Volume 18, Number 1 (2010)
14
4.5.2 Drawing conclusions on the basis of authentic distributions
The conventional type of exercise that appears in many statistics textbooks uses data that tend to
illustrate in an obvious and artificial way what the exercise is meant to teach. This may have its
advantages. But when students come to do independent research with real-life data, they soon
discover that what is required is very different from what they've studied. Of course, the work in
the study groups described in this paper puts students in a different position.
Questions like the following often arose in these groups: How do we sum up the data when they
are not really unambiguous and clear? How do we draw conclusions on such a basis? What do
we write down? Here, too, outcome is less important than process. There will always be different
ways to organize and study data. What really matters is the thinking itself, the work with the
data, and coping with the need to understand their meaning.
There were additional occasions when issues arose, in class, as a result of students' needs. Some
of them have been described above to illustrate advantages of using real-life data in assignments:
missing data, extreme values, and generalization and reflection based on information acquired in
several statistical procedures. It should be clear that some of these issues arise in regular teaching
sessions in the most conventional of teaching environments. What we wish to emphasize here is
that in the study groups described in this paper, in-depth discussion and reflection on topics
which derived from the analysis of the real-life data were so prominent that they assigned a new
dimension to teaching and learning alike.
Another interesting issue that appeared often in the exercises of students of these groups, and
thus demanded a response from the teacher, was the occurrence of non-linear relationships
between variables. Often, when students asked questions about the relationship between
variables, and when they drew scatter plots of two variables, there was a tendency towards a non-
linear relationship. Again, this situation arising from students' own needs, offered the teacher a
good opportunity to discuss and illustrate the fact that though a Pearson correlation coefficient
(something they had been studying in some depth) works as a measure for a linear relationship,
we are often actually presented with non-linear patterns.
To sum up, students who studied with a teaching-evaluation method that involved dealing with
real-life data had an opportunity, even if on a small scale, to experience some of the joy and
pleasure of data investigation. This method, which used real-life conditions as the basis for
assignments in descriptive statistics, helped the students understand the purpose of data analysis.
Moreover, these students were given the opportunity to discover that data description can not be
covered by one set of rules. Rather, analysis of data requires complex action that is based on
conceptual flexibility, an ability to integrate study material, and creative thinking. To a certain
extent, students in these groups could function like researchers, and hence like knowledge
producers rather than knowledge consumers.
5. Discussion
This article describes an experience with a teaching method, which incorporated alternative
assessment in descriptive statistics classes. A look at the research literature devoted to the

Journal of Statistics Education, Volume 18, Number 1 (2010)
15
teaching of statistics in the last 20 years reflects much disappointment, especially in relation to
students who take statistics as a compulsory service course. Although alternative and diverse
ways of teaching have been emerging, the traditional lecture format and delivery of information
model remains the mainstay of many statistics courses in tertiary education (Chance, delMas &
Garfield, 2004; Garfield & Ben-Zvi, 2007; Groth, 2007; Moore, 1997). The literature is replete
with comments about students who never attain a reasonable grasp of the most basic concepts,
and who don't have the knowledge that allows them to implement what they have studied. Many
of the acquired concepts remain abstract and unrelated to relevant, practical application (cf.,
Coleman, 1999; Drew, 1997; Broers & Imbos, 2005; Garfield & Ahlgren, 1988; Herman, Notzer,
Libman, Braunstein, & Steinberg, 2007; Jolliffe, 1976; Kalton, 1973; Shaughnessy, 1992; Singer
& Willett, 1990). Traditional methods of statistics teaching have come under serious criticism
because of their failure to help students achieve sufficient in-depth understanding of concepts
and principles so as to be able to use them in new situations. Traditional teaching, moreover, has
also been accused of causing students to dislike statistics, to assume that statistics is a
particularly difficult mathematical subject that is superfluous and irrelevant. Even more striking
is that at institutions for higher education, which define themselves as knowledge-creating
communities, the dominant teaching approach is still transmission and transfer of knowledge
(Mandl,Gruber, & Renkl, 1996).
Referring to constructivist perspectives, this article suggests a look at the potential of inculcating
alternative teaching methods that encourage students to take a more active role in their own
learning and participate in the process of assessing what they have learned. Our decision to
introduce alternative assessment in the form of exercises that are based on real-life data collected
by the students was based on the view that learning is essentially a journey of personal
development. Such an approach seems even more valid when we are talking about applied
academic studies such as statistics, whose very objective is to enable students to conduct
independent inquiry through intelligent use of statistical tools. Such tools will also serve them in
their future work either as teachers or as students.
Concluding, in brief, from the experience presented above, we believe that students, who had the
opportunity to practice the material they had learned in the lecture hall on real-life data which
they themselves had collected, almost certainly experienced some of the pleasure of discovery
that comes with data investigation. Furthermore, there is reason to assume that such a teaching
approach will encourage students to take greater interest in statistics and might prompt them to
take advanced statistical courses.
From feedback provided by students as part of the teaching process, it was clear that their
investment in the learning process was considerable. They reported that they were "using their
minds" trying to understand the topic in depth. Students repeatedly stated that "in this course, we
feel that we have learned something that we can use". Students also remarked more than once
that "they had learned something which was not just 'for the exam'". The fact that the material
was close to their own experience and that the statistical knowledge they were supposed to
master was embedded in the practical problems they were called upon to confront, helped to
convince them that "statistics was important for the future".

Journal of Statistics Education, Volume 18, Number 1 (2010)
16
In the final feedback session of the course, many students remarked that they would register for a
more advanced course in statistics, even though they were not required to do so. It would also
seem relevant to point out that the average grade of the students in this course, on the basis of a
similar final exam, was higher by more than 0.5 standard deviation compared to two previous
cohorts. This finding certainly hints that the teaching method we have described has the potential
to enhance learning and that we should continue to investigate it in depth.
Naturally, this is an impression based on informal information that demands empirical validation.
This article also illustrated how this teaching-evaluation method enabled students to realize that
there is no single set of procedures that can be used to describe and analyze all data sets.
Imparting meaning to sets of data is a complex activity which involves conceptual flexibility,
integration of all the procedures that one has learned, and creative reasoning. The use of
performance assessment enabled the course participants to function to a certain extent as true
researchers, and hence as knowledge producers rather than knowledge consumers. It is
important, however, to understand the role of teachers in this process. Students aren't forced to
tackle advanced aspects of learning single-handedly. The involvement of the teachers in their
students' learning process, as guides and supervisors, is crucial – advising students, helping them
in avoiding pitfalls or overcoming them, providing students with the necessary tools to cope with
what these demanding learning methods require.
This article looks at the potential of incorporating alternative assessment components to improve
instructional practices and hence to enhance meaningful statistical understanding. Other
important aspects of using authentic assessment, like grading students' assignments or assessing
their outcomes, are beyond the scope of this article. Yet, it seemed that, in spite of the
considerable effort and investment required, students were involved, conducted the exercises
effectively, and usually expressed satisfaction with this learning method. Teachers and teacher
assistants reported that students frequently commented that they had personally developed and
acquired knowledge they thought they would be able to utilize in the future. These are of course
subjective impressions which cannot serve as scientific proof of the success of this teaching-
evaluation method. It should be remembered, however, that constructivism maintains that
conceptual change and personal development are not exclusively the outcome of cognitive
factors. Beliefs, expectations, and subjective perceptions, too, play a crucial role in impacting
human development and growth.
Another issue worth mentioning is the question of cooperation on the part of teachers in higher
education in changing attitudes and habits as far as teaching and assessment practices are
concerned. Teachers play a crucial role in successfully revising and implementing teaching
methods. It is common knowledge that teachers in higher education feel strongly responsible for
the curriculum, the rigid syllabus of their course, and finally examination and assessment of
learning outcomes. They usually insist on sticking to timetables and worry about losing control
in class (Biggs, 1996; Good, Clark, & Clark, 1997). Experts in their disciplines but often having
limited training as teachers, they have developed their own working methods, tests, materials,
and examples (Biggs, 1996; Good et al., 1997). Those among them with more experience are
unable, and often unwilling, to reconsider their teaching and evaluation methods (Biggs, 1996;
Good et al., 1997; Maurer, Bell, Woods, & Allen, 2006; Watt, 2005). This is, to some extent,

Journal of Statistics Education, Volume 18, Number 1 (2010)
17
true as well for the teachers who worked with the study groups described in this study. All three
of them were experienced teachers with their own teaching habits, practices, lesson plans, and
stores of examples, illustrations, and evaluation tools.
Including an alternative assessment component affected class sessions, with the teachers and
trainers having to deal with questions and issues arising from the students' work on the exercises.
This required improvisation and flexibility. Teachers reported that the experience was
challenging and stimulating but also extremely demanding. Indeed, one of the conclusions that
can be drawn from this study is that if teachers are to "take off" with alternative methods of
teaching statistics and discover their potential, they will have to adjust their perceptions, beliefs,
work methods, and their readiness to invest in teaching improvement (Brown & Palincsar, 1989;
Eisner, 1999; Fullan, 1985, 1993; Volet, McGill, & Pears, 1995; Watt, 2005). This issue, which
has recently received more attention as a result of increasing awareness of the quality of teaching
in tertiary institutions, is especially problematic in the context statistics education (Biggs, 1996;
Broers & Imbos, 2005; Chang, 2000; Ding & Sherman, 2006; Volet et al., 1995; Wollert &
West, 2000).
Finally, there is the question of learning outcomes. Are constructivist teaching-evaluation
methods a success story? Are they more effective than their traditional counterparts? Are the
effort and investment worth our while? The results of many recent studies are contradictory and
unconvincing (Cobb & Jackson, 2008; Eisner, 1999; Larochelle, 2007; Maurer et al., 2006; Watt,
2005). These methods have very enthusiastic supporters but they have also aroused much
opposition and disappointment. It can however be added that, like in other education-related
issues, this one too has a profoundly ideological aspect. Many would argue that a constructivist
approach is democratic and egalitarian and that the difficulty in proving its effectiveness is of
less importance.
The experience described in this article taught us a great deal about student learning, about ways
of thinking and perceiving concepts and ideas in statistics. It seems to us that this experience
improved participants' teaching and their students' learning processes. We therefore decided to
continue our research into the effectiveness of constructivist teaching methods in descriptive
statistics with special emphasis on methodological rigor and controls. Preliminary results
concerning this research seem very promising and indicate a significant advantage of the
teaching method discussed in this paper (Libman, 2009).
References
Airasian, P. W. & Walsh, M. E. (1997). Constructivist cautions. Phi Delta Kappan, 78, 444-450.
Bereiter, C. (1994). Constructivism, socioculturalism and Popper's world 3. Educational
Researcher, 23, 21 - 23.
Biggs, J. (1996). Enhancing teaching through constructive alignment. Higher Education, 32,

Journal of Statistics Education, Volume 18, Number 1 (2010)
18
347 - 364.
Bransford, J., Brown, A. L., & Cocking, R. R. (Eds.) (2000). How people learn: Brain, mind,
experience, and school. Washington DC: Nationa Academy Press.
Broers N. J. & Imbos T. (2005). Charting and manipulating propositions as methods to promote
self-explanation in the study of statistics. Learning and Instruction, 15, 517 - 538.
Brown, A. L. & Palincsar, A. S. (1989). Guided cooperative learning and individual knowledge
acquisition. In L. B. Resnick (Ed.). Knowing, learning, and instruction: Essays in honor of
Robert Glaser (pp. 393 - 451). Erlbaum, Hillsdale, NJ.
Chance, B. (1997). Experiences with authentic assessment techniques in an introductory statistics
course. Journal of Statistics Education [Online], 5(3). Retrieved from:
http://www.amstat.org/publication/jse/v5n3/chance.html.
Chance, B., delMas, R., & Garfield, J. (2004). Reasoning about sampling distributions. In D.
Ben-Zvi & J. Garfield (Eds.). The challenge of developing statistical literacy, reasoning, and
thinking (pp. 295 – 323).
Chang, T. (2000). Student rating: What are teacher college students telling us about them? Paper
presented at the Annual Meeting of the American Educational Research Association. LA: New
Orleans.
Cobb, G. (1993). Reconsidering statistics education: a national science foundation conference.
Journal of Statistics Education [Online], 1(1). Retrieved from:
http://www.amstat.org/publication/jse/v1n1/cobb.html.
Cobb, P. (1999). Individual and collective mathematical development: the case of statistical data
analysis. Mathematical Thinking and Learning, 1(1), 5 -43.
Cobb, P. & Jackson, K. (2008). The consequences of experimentalism in formulating
recommendations for policy and practice in mathematics education. Educational Researcher,
37(9), 573 - 581.
Cohen, S. A. (1987). Instructional alignment: Searching for the magic bullet. Educational
Researcher, 16(8), 16 - 20.
Coleman, D. W. (1999). Adapting Deming's funnel experiment to a content-specific area.
Simulation & Gaming, 99, 33-37.
Ding, C., & Sherman, H. (2006). Teaching effectiveness and student achievement: Examining
the relationship. Educational Research Quarterly, 29(4), 39 – 49.
Drew, D. E. (1997). Curriculum reform and talent development. Journal of Science Education
and Technology, 6, 257 - 272.

Journal of Statistics Education, Volume 18, Number 1 (2010)
19
Driver, R., Asoko, H., Leach, J., Mortimer, E., & Scott, P. (1994). Constructing scientific
knowledge in the classroom. Educational Researcher, 23, 5 - 12.
Eisner, E. W. (1999). The uses and limits of performance assessment. Phi Delta Kappan, 80(9),
658 – 660.
Fosnot, C. T. (1996). Constructivism: A Psychological Theory of Learning. In C. T. Fosnot
(Ed.), Constructivism: Theory, perspectives and practice (pp. 8-33). Teachers College, Columbia
University, New York.
Fullan, M. (1985). Curriculum Implementation. In T. Husen & T. N. Postlethwaite (Eds.), The
international encyclopedia of education, Pergamon Press.
Fullan, M. (1993). Change forces: Probing the depth of educational reform. London: The falmer
press.
Garfield, J. (1995). How students learn statistics. International Statistics Review, 63, 25 – 34.
Garfield, J. & Ahlgren, A. (1988). Difficulties in learning basic concepts in probability and
statistics: Implications for research. Journal for Research in Mathematics Education, 19, 44 - 63.
Garfield, J. & Ben-Zvi, D. (2007). How students learn statistics revisited: a current review of
research on teaching and learning statistics. International Statistics Review, 75(3), 372 – 396.
Garfield, J., Hogg, B., Schau, B., & Whittinghill, D. (2002). First courses in statistical science:
the status of educational reform efforts. Journal of Statistics Education [Online], 10(2).
Retrieved from: http://www.amstat.org/publication/jse/v1n1/garfield.html
Gergen, K. J. (1995). Social construction and the educational process. In L. P. Steffe & E. J. Gale
(Eds.), Constructivism in education (pp. 17-40). Erlbaum, Hillsdale, NJ.
Good, T. L., Clark, S. N., Clark, D. C. (1997). In B. J. Biddle, T. L. Good, I. F. Goodson (Eds.),
International handbook of teachers and teaching, (Vol. 2, pp. 1387-1427). Kluwer Academic
Publishers, Dordrecht.
Graves, D. H. (2002). Testing is not teaching. Portsmouth, NH: Heinemann.
Groth, R. E. (2007). Toward a conceptualization of statistical knowledge for teaching. Journal
for Research in Mathematics Education, 38(5), 427 – 432.
Hendry, D. H. (1996). Constructivism and educational practice. Australian Journal of Education,
40, 19 - 45.
Herman A., Notzer N., Libman Z., Braunstein R., & Steinberg D. (2007). Statistical Education
for medical students. Statistics in Medicine, 26(23).

Journal of Statistics Education, Volume 18, Number 1 (2010)
20
Hogg R.V. (1992). Towards lean and lively courses in statistics. In F. Gordon & S. Gordon
(Eds.), Statistics for the Twenty First Century (pp. 3 - 13). Washington, DC: Mathematical
Association of America.
Hmelo-Silver, C. E. (2004). Problem-based learning: What and how do students learn?
Educational Psychology Review, 16, 235 – 266.
Jolliffe, F. R. (1976). A continuous assessment scheme for statistics courses for social sciences.
International Journal of Mathematical Education in Science and Technology, 7, 97 - 103.
Kalton, G. (1973). Problems and possibilities with teaching introductory statistics to social
scientists. International journal of Mathematical Education in Science and Technology, 4, 7 - 16.
Kirschner, P. A., Sweller, J., & Clark, R. E. (2006). Why minimal guidance during instruction
does not work: An analysis of the failure of constructivist, discovery, problem-based,
experiential, and inquiry-based teaching. Educational Psychologist, 41(2), 75 – 86.
Libman, Z. (2009). Improving outcomes in descriptive statistics using a constructivist-based
approach. Paper presented at the 2009 AERA Meeting in San Diego.
Larochelle, M. (Ed.). (2007). Key works in radical constructivism. Rotterdam: Sense Publishers.
Lave, J., & Wenger, E. (1991). Situated learning: Legitimate peripheral participation.
Cambridge University Press, UK.
Mandl, H., Gruber, H., & Renkl, A. (1996). Communities of practice toward expertise: Social
foundation of university instruction. In P. B. Baltes & U. M. Staudinger (Eds.), Interactive
minds: Life-span perspectives on the social foundation of cognition (pp. 394 – 412). Cambridge
university press, UK.
Maurer, M. M., Bell, E. C., Woods, E., Allen, R. (2006). Structured discovery in cane travel:
Constructivism in action. Phi Delta Kappan, 88(4), 304 – 307.
Moore, D. S. (1997). New pedagogy and new content: the case of statistics. International
Statistics Review,65(2), 123 – 165.
Moore, D. S. (2001). Undergraduate programs and the future of academic statistics. The
American Statistician, 55(1), 1 – 6.
National Council of Teachers of Mathematics. (1980). An agenda for action. NCTM, Inc.,
Reston, VA.
National Council of Teachers of Mathematics. (1989). Curriculum and evaluation standards for
school mathematics. NCTM, Inc., Reston, VA.

Journal of Statistics Education, Volume 18, Number 1 (2010)
21
National Council of Teachers of Mathematics. (1995). The assessment standards for school
mathematics. NCTM, Inc., Reston, VA.
Nicholls, D. F. (2001). Future directions for the teaching and learning of statistics at the tertiary
level. International Statistics Review, 69(1), 11 – 15.
Nitko, A. J. (1989). Designing tests that are integrated with instruction. In R. Linn (Ed.),
Educational measurement, 3rd
. edition (pp. 447-472). Macmillan, New York.
Prawat, R. S. (1996). Constructivisms, modern and postmodern. Educational Psychologist, 31,
215-225.
Resnick, L. B. (1989). Introduction. In L. B. Resnick (Ed.), Knowing, learning, and instruction:
Essays in honor of Robert Glaser (pp. 1-24). Erlbaum, Hillsdale, NJ.
Schmidt, H. G. (1998). Problem-based learning: Does it prepare medical students to become
better doctors? The Medical Journal of Australia, 168, 429 – 430.
s
Schmidt, H. G. (2000). Assumptions underlying self-directed learning may be false. Medical
Education, 34, 243 – 245.
Shaughnessy, J. M. (1992). Research in probability and statistics: Reflections and directions. In
D. A. Grouws (Ed.), Handbook on research in mathematics education, (pp. 465-494).
Macmillan, New York.
Shepard, L. A. (2000). The role of assessment in a learning culture. Educational Researcher,
29(7), 4 – 14.
Singer, J. D. & Willett, J. B. (1990). Improving the teaching of applied statistics: Putting the data
back into data analysis. American Statistical Association, 44, 223 - 230.
Tynjala, P. (1999). Towards expert knowledge? A comparison between a constructivist and a
traditional learning environment in the university. International journal of educational research,
31, 357 - 442.
Van Joolingen, W. R., de Jong, T., Lazonder, A. W., Savelsbergh, E. R., & Manlove, S. (2005).
Co-lab: Research and development of an online learning environment for collaborative scientific
discovery learning. Computers and Instruction, 7, 1 – 39.
Volet, S., McGill, T., & Pears, H. (1995). Implementing process-based instruction in regular
university teaching: Conceptual, methodological and practical issues. European Journal of
Psychology of Education, 10, 385 - 400.
Watt, H. M. G. (2005). Attitudes to the use of alternative assessment methods in mathematics: A
study with secondary mathematics teachers in Sydney, Australia. Educational Studies in
Mathematics, 58, 21 – 44.

Journal of Statistics Education, Volume 18, Number 1 (2010)
22
Wollert, M. H., & West, R. F. (2000). Differences in Student Rating of Instructional
Effectiveness Based on the Demographic and Academic Characteristics of Instructors. Paper
presented at the Annual Meeting of the Mid-South Educational Research Association. KY:
Bowling Green.

Journal of Statistics Education, Volume 18, Number 1 (2010)
23
Zipora, Libam Ph.D.
Dept of Methodology and Statistics
Kibbutzim College of Education, Technology and the Arts
Tel-Aviv, Israel
E-mail: [email protected]
Volume 18 (2010) | Archive | Index | Data Archive | Resources | Editorial Board |
Guidelines for Authors | Guidelines for Data Contributors | Home Page | Contact JSE |
ASA Publications