Embed Size (px)
Citation preview
Integrating Science into the clinic :
Current and Future use of Integrase inhibitors
Anton Pozniak
Consultant Physician,
Director of HIV Services
Chelsea and Westminster Hospital and SSAT
London

Current situation and Future uses
• Guidelines
• What to start
• Second Line
• Switch
• Women and ART
• Nuke-limiting
• PrEP

Starting TreatmentA Global Unified Approach
3
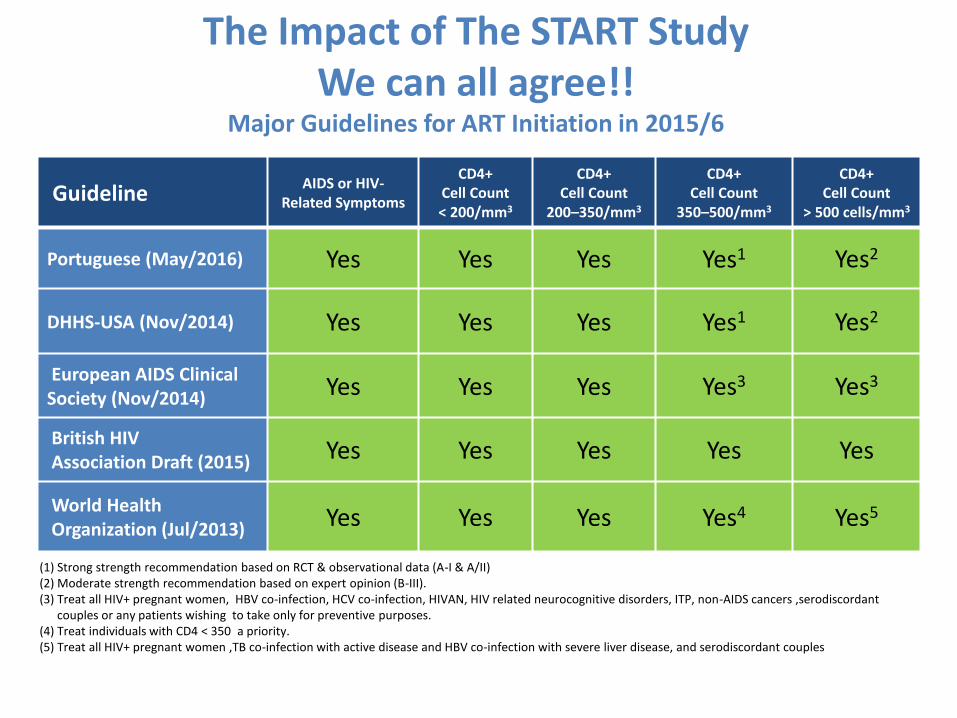
Guideline AIDS or HIV-
Related Symptoms
CD4+Cell Count < 200/mm3
CD4+Cell Count
200–350/mm3
CD4+Cell Count
350–500/mm3
CD4+Cell Count
> 500 cells/mm3
Portuguese (May/2016) Yes Yes Yes Yes1 Yes2
DHHS-USA (Nov/2014) Yes Yes Yes Yes1 Yes2
European AIDS Clinical Society (Nov/2014) Yes Yes Yes Yes3 Yes3
British HIV Association Draft (2015) Yes Yes Yes Yes Yes
World Health Organization (Jul/2013) Yes Yes Yes Yes4 Yes5
(1) Strong strength recommendation based on RCT & observational data (A-I & A/II)(2) Moderate strength recommendation based on expert opinion (B-III).(3) Treat all HIV+ pregnant women, HBV co-infection, HCV co-infection, HIVAN, HIV related neurocognitive disorders, ITP, non-AIDS cancers ,serodiscordant
couples or any patients wishing to take only for preventive purposes. (4) Treat individuals with CD4 < 350 a priority.(5) Treat all HIV+ pregnant women ,TB co-infection with active disease and HBV co-infection with severe liver disease, and serodiscordant couples
The Impact of The START StudyWe can all agree!!
Major Guidelines for ART Initiation in 2015/6

Treatment Guidelines
The Problem of What to Start?A Problem of Data Interpretation?

Summary of key randomized clinical trials in ARV-naïve patients
1. Molina J-M, et al. Lancet 2011;478: 238–246; 2. Cohen CJ, et al. Lancet 2011; 378:229–237; 3. Daar E, et al. Ann Intern Med 2011;154:445–456; 4. Ortiz R, et al. AIDS 2008;22:1389–1397; 5. Lennox JL, et al. Lancet 2009;374:796−806; 6. Riddler SA, et al. N Engl J Med 2006;358:2095−2106; 7. Molina J-M, et al. Lancet 2008;372:646–655
EFVvs.
NNRTI2NN, ECHO1,
THRIVE2
vs. PIACTG 52023
ACTG
51426
vs. INI
STARTMRK5
ATV/rvs.
NNRTIACTG 52023
vs. PI
CASTleACTG5257
DRV/rvs. PI
ARTEMIS4
ACTG5257
RALvs.
NNRTISTARTMRK5
NNRTI = non-nucleoside reverse transcriptase inhibitor; PI = protease inhibitor; INI = integrase inhibitor.
EVG/cvs.
NNRTIQUAD102
vs. PI
QUAD103
DTGvs.
NNRTISingle
vs. INI
Spring
vs. PI
Flamingo
vs. INI
QUAD103
vs. INI
Spring
vs.
PI / NRTI
ACTG5257NEAT001
vs. INI
ACTG5257

Regimen EACS/DHSS Spain BHIVA IAS-USA
EFV/TDF/FTC Alternative Alternative AlternativeAlternative
RPV/TDF/FTC*+ ABC/3TC
Recommended Alternative RecommendedAlternative
DRV/r + TDF/FTC Recommended Alternative RecommendedAlternative
ATV/r + TDF/FTC Alternative Alternative RecommendedAlternative
EVG/c+TDF/FTC Recommended Alternative Recommended Recommended*TAF not TDF
RAL + TDF/FTC Recommended Recommended RecommendedRecommended*TAF not TDF
DTG + ABC/3TC
DTG + TDF/3TCRecommended Recommended Recommended Recommended*
TAF not TDF
How experts interpret this Same data Comparison Guidelines 2015/16 Naïve Patients
ATRIPLA (EFV/TDF/FTC) is not approved for naïve patients in the EU" and the references for BHIVA and EACS Guidelines (“BHIVA Guidelines for the treatment of HIV-1 positive Adults with antiretroviral therapy 2015” and “EACS Guidelines Out2015”IAS-USA JAMA July 2016

Agree to Disagree

Efficacy of initial ART associated with NRTI
backbone, third drug, other factors
• Mean efficacy 70% vs 62% with baseline VL < vs ≥ 100,000 copies/mL
• Mean efficacy 75% vs 65% with DHHS ‘preferred’ vs ‘alternative’ ART
• Number of pills or doses per day did not predict overall efficacy
Lee FJ, et al. IAS 2013. Abstract WEAB0104.
Efficacy, % (SD) Coefficient (95% CI) P value
Third drug class
NNRTI 61 (15) Ref
INSTI 84 (5) 11.9 (4.6 to 19.2) 0.002
Boosted PI 67 (9) -0.9 (-4.7 to 3.0) 0.660
Adjusted for multivariable analysis including year of commencement, other drugs received, baseline patient characteristics, and duration of follow-up.

HIV NAIVE PATIENTSTHE RISE OF INTEGRASE
DECREASE IN EFAVIRENZ AND PI/r POPULARITY

Efavirenz/Atriplathe former “Gold Standard”
● UNTIL RECENTLY WAS – Never surpassed for efficacy– But…has come in 2nd for tolerability
– Versus – Raltegravir ( Startmrk)– Dolutegravir (Single)– Rilpivirine (Star)– Elvitegravir ( Gilead 102)
● Worries re toxicity
● Worries re suicidality
Rockstroh, JAIDS, 2013; Landowitz, CROI 2014; Elion CROI 2013; De Jesus, CROI; 2013; Raffi, Lancet, 2013; Walmsley NEJM, 2013, Clotet, Lancet, 2014

0
5
10
15
20
25
24 48 72 96
Common Neuropsychiatric AEs (All Grades)Combined Study GS-102 and -103 – Week 96
Zolopa A. Presented at CROI 2013, poster 553
Bar (incidence): Patients with new onset or worsening AEs at each 4-week windowLine (prevalence): Patients with ongoing events in the window
Most were Grade 1 (STB 91% vs. EFV/FTC/TDF 86% vs. ATV+RTV+FTC/TDF 85%)
Dizziness
1%1%
4%
STB (n=701) EFV/FTC/TDF (n=352) ATV+RTV+FTC/TDF (n=355)
1%2%
5%
Weeks
Pati
ents
wit
h A
E (%
)

Risk of Suicidality Increased in Pts
Treated With EFV-Containing Regimens
Treatment with EFV associated with increased risk of suicidality
– Absolute risk is small
Mollan K, et al. IDWeek 2013. Abstract 40032.
HR: 2.28
(95% CI 1.27-4.10; P = .006)
47 events/5817
PY (8.08/1000 PY)
15 events/4099
PY (3.66/1000 PY)
EFV
EFV-free
0.05
0.04
0.03
0.02
0.01
0
Pro
babili
ty
1920 24 48 72 96 120 144 168
Wks to Suicidality

Using Real World Data to Assess the Risk of Suicidality among Patients Initiating an Efavirenz versus an Efavirenz-Free
Antiretroviral Regimen
.Nkhoma E et al IDWeek 2014. October 8-12, 2014, Philadelphia. Abstract 818

-12% +12%
-1.1 4.1 9.2
4.2 10.3-1.9
-1.6 3.6 8.8
5.1 9.40.7
2.5 7.4 12.3
Differences in percentages (95% CI)
1.1 7.2 13.4
9.5 17.31.7
-20 -15 -10 -5 0 5 10 15 20
Favours EFV Favours comparator
GS-1021 (STB vs ATR) N=700
88% vs 84% (snapshot)
GS-102/103/1042 (STB vs ATR) N=1,124
89% vs 84% (snapshot)
STaR3 (CPA vs. ATR) N=786
86% vs 82% (snapshot)
89% vs 82% (snapshot)
BLVL ≤100,000cpm
STARTMRK4 (RAL vs EFV) N=566
86% vs 82% (ITT, NC=F)
71% vs 61% (ITT, NC=F)
SINGLE5 (DTG vs ATR) N=833
88% vs 81% (snapshot)
Newer ARVs have demonstrated higher rates of virologic suppressioncompared with EFV-based regimens in HIV-1 infected ART-naive patients
Week 48: non-inferiority shown
Week 48 (pooled): statistically significant higher VL response
Week 48: non-inferiority shown
Week 48: statistically significant higher VL response
Week 48: non-inferiority shown
Week 48: statistically significant superior VL response
Week 240: statistically significant higher VL response
1. Sax P, et al. Lancet 2012;379:2429–382. Ward D, et al. ICAAC 2012; San Francisco, CA. Oral H-5553. Cohen C, et al. HIV-11 2012; Glasgow. O425; Data on File
4. Rockstroh J, et al. IAC 2012; Washington, DC. LBPE0195. Walmsley S, et al. ICAAC 2012; San Francisco, CA. Oral H-556b6. Cohen C, et al. JAIDS 2012;60:33-42
ECHO/THRIVE6 (RPV vs ATR) N=1,368
83% vs 80% (snapshot)
90% vs 84% (TLOVR)
BLVL ≤100,000cpm
-1.7 2.4 6.6
1.6 6.6 11.5
Week 48: non-inferiority shown
Week 48: statistically significant higher VL response
A new era in HIV treatment
Efficacy: newer treatments outperform EFV

STARTMRK: efficacy of RAL vs EFV
Durability… long-term side-effects• RAL is BID vs EFV but fewer adverse events (52% vs 80%)
Rockstroh JK, et al. J Acquir Immune Dis Syndr. 2013;63:77-85.
ITT, NC = F
281 278 279 280 281 281 277 280 281 281 277 279
282 282 282 281 282 282 281 281 282 282 282 279
RAL 400mg BID
EFV 600mg QHS
Pts at Risk, n
0 12 24 48 72 96 120 144 168 192 216 240Wks
0
20
40
60
80
100
HIV
-1 R
NA
<5
0c/
mL
(%)
86
82
81
79
75
6
9
76
67
71
61
CD4+ gain:
+374
+312
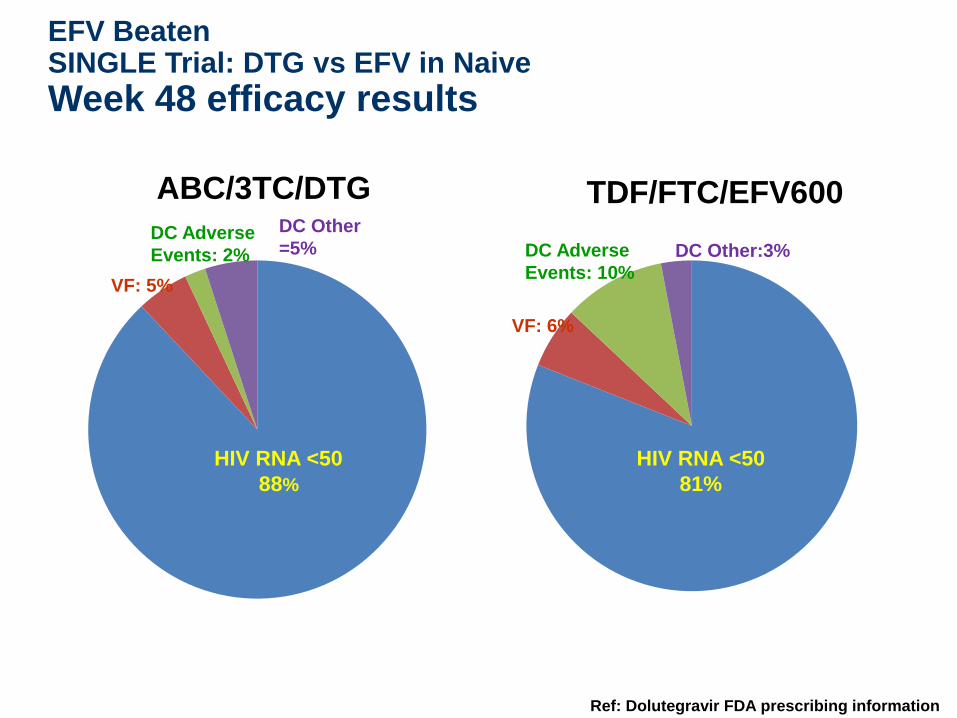
EFV Beaten SINGLE Trial: DTG vs EFV in Naive
Week 48 efficacy results
ABC/3TC/DTG TDF/FTC/EFV600
Ref: Dolutegravir FDA prescribing information
HIV RNA <50
88%
HIV RNA <50
81%
VF: 5%
VF: 6%
DC Adverse
Events: 2% DC Adverse
Events: 10%
DC Other
=5% DC Other:3%

Summary of Adverse Events Leading
to Discontinuation
Walmsley et al. CROI 2014; Boston, MA. Poster 337.
ParameterDTG + ABC/3TC QD
(n=414)EFV/TDF/FTC QD
(n=419)
Body system (at least 2% in either arm)
Psychiatric disorders 4 (<1%) 23 (5%)
Nervous system disorders 1 (<1%) 17 (4%)
Skin and subcutaneous tissue disorders 2 (<1%) 9 (2%)
General disorders and administration site conditions
0 10 (2%)
Gastrointestinal disorders 0 8 (2%)

Study 236-102: Stribild vs Atripla
Primary Endpoint: HIV-1 RNA <50 copies/mL
+3.6%,
95% CI (-1.6% to +8.8%)
CD4+ change: Quad+239 vs EFV+206c/mm3
(P=0.009)
Sax P, et al. 19th CROI; Seattle, WA; March 5-8, 2012. Abst. 101.
STRIBILD

Groups not well represented in trialsWomen living with HIV: A growing population
1. UNAIDS. UNAIDS Report on the Global AIDS Epidemic 2010. Available from: http://www.unaids.org/GlobalReport/documents/20101123_GlobalReport_full_en.pdf. Accessed Apr 2012; 2. Health Protection Agency. HIV in the United Kingdom: 2011 Report. Available from: http://www.hpa.org.uk/webc/HPAwebFile/HPAweb_C/1317131685847. Accessed Apr 2012.
26,000
31%
2,500
31%
8,200
30%
12,000
18%
48,000
32%
4,600
31%
32,000
25% 48,000
34%
Estimated number of women with HIV by country, as a % of people with HIV aged ≥15 years, 20091
31%
28,100
UK Data
20102

% Women enrolled varies greatly between major RCTs
Created from: 1. Riddler SA, et al. NEJM 2008;358:2095–106. 2. Ortiz R, et al. AIDS 2008;22:1389–97. 3. Molina J-M, et al. Lancet 2008;372:646–55. 4. Lennox JL, et al. Lancet 2009;374:796–806. 5. Cooper DA, et al. JID 2010;201:803–13. 6. Daar ES, et al. Ann Intern Med. 2011;154:445–56. 7. Cohen CJ, et al. JAIDS 2012;60:33–42. 8. Zolopa A, et al. CROI 2013. Poster 553. 9. Stellbrink HJ, et al. CROI 2012; Oral presentation 102. NATAP report available at http://www.natap.org/2012/CROI/croi_22.htm (accessed May 2014); 10. Walmsley S, et al. ICAAC 2012; Oral abstract H-556b. NATAP report available at http://www.natap.org/2012/ICAAC/ICAAC_06.htm (accessed May 2014); 11. Feinberg et al. ICAAC 2013; Oral presentation H1464a. NATAP report available at http://www.natap.org/2013/ICAAC/ICAAC_24.htm (accessed May 2014); 12. Landovitz RJ, et al. CROI 2014; Oral presentation 85. NATAP report available at http://www.natap.org/2014/CROI/croi_30.htm (accessed May 2014).*Edurant and Celsentri SmPCs. Available at: http://www.medicines.org.uk/emc/ (accessed May 2014).
*RPV is approved in Europe for treatment-naïve adults with HIV-1 infection with a baseline viral load ≤100,000 copies/mL
*MRV is not licensed for use in naïve patients in Europe†EFV/FTC/TDF not licensed for use in naïve patients in Europe
SPRING-29ACTG
52026
17
ACTG
51421
20
14
START
MRK4
19
MERIT5
29**
ARTEMIS2
30
CASTLE3
31
0
20
40
60
80
100
% w
om
en
en
roll
ed
in
tre
atm
en
t b
etw
een
20
08
‒2
014
ECHO/
THRIVE7
24
10†
Study
103/1028SINGLE10
16 †
FLAMINGO11 ACTG
525712
24
15
322151 141105 206209 277 331 28 133 73 435Women, n=

International, randomized, double-blind, phase III trial
Patients generally well-matched at baseline
– Patients with HIV RNA > 100,000 copies/mL: EVG/COBI/TDF/FTC arm, 24%; ATV/RTV + TDF/FTC arm, 25%
WAVES: EVG/COBI/TDF/FTC vs ATV/RTV +
TDF/FTC in Treatment-Naive Women
Squires K, et al. IAS 2015. Abstract MOLBPE08.
EVG/COBI/TDF/FTC QD +
Placebos for ATV, RTV, and TDF/FTC QD
(n = 289)
ATV/RTV + TDF/FTC QD +
Placebo for EVG/COBI/TDF/FTC QD
(n = 286)
HIV-infected women
with HIV-1 RNA
≥ 500 copies/mL ;
no previous ART;
and eGFR ≥ 70 mL/min
(N = 575)
Wk 48
Open-
label
extension
ATV 300 mg; RTV 100 mg; TDF/FTC 300/200 mg; EVG/COBI/TDF/FTC 150/150/300/200 mg.

WAVES: Key Results
• No significant differences between arms
– Change from BL eGFR, spine or hip BMD, LDL or HDL cholesterol, total cholesterol to HDL ratio, or triglycerides
• Significantly greater increase in total cholesterol with EVG/COBI/TDF/FTC
• Lower rate of discontinuations due to AEs with EVG/COBI/TDF/FTC vs ATV/RTV + TDF/FTC (2.4% vs 7.0%)
Squires K, et al. IAS 2015. Abstract MOLBPE08.
HIV
-1 R
NA
< 5
0 c
/mL (
%)
100
80
60
40
20
0Overall ≤ 100,000 > 100,000
HIV-1 RNA (copies/mL)
EVG/COBI/TDF/FTC ATV/RTV + TDF/FTC
8781
8682
90
78
n = 289 286 220 214 69 72
Emergent ResistanceEVG/COBI/FTC/TDF
n = 289ATV/RTV + TDF/FTC
n = 286
Resistance-associated population
19 21
Developed resistance mutations to study drugs
0 3

Regimen EACS/DHSS Spain BHIVA IAS-USA
EFV/TDF/FTC Alternative Alternative AlternativeAlternative
RPV/TDF/FTC*+ ABC/3TC
Recommended Alternative RecommendedAlternative
DRV/r + TDF/FTC Recommended Alternative RecommendedAlternative
ATV/r + TDF/FTC Alternative Alternative RecommendedAlternative
EVG/c+TDF/FTC Recommended Alternative Recommended Recommended*TAF not TDF
RAL + TDF/FTC Recommended Recommended RecommendedRecommended*TAF not TDF
DTG + ABC/3TC
DTG + TDF/3TCRecommended Recommended Recommended Recommended*
TAF not TDF
How experts interpret this Same data Comparison Guidelines 2015/16 Naïve Patients
ATRIPLA (EFV/TDF/FTC) is not approved for naïve patients in the EU" and the references for BHIVA and EACS Guidelines (“BHIVA Guidelines for the treatment of HIV-1 positive Adults with antiretroviral therapy 2015” and “EACS Guidelines Out2015”IAS-USA JAMA July 2016

PIs
● Why no preferred PIs in Spanish and IAS Guidance
● Why both in UK and only DRV in EACS/DHHS
● Way you interpret data?

End of PIs first Line?

ACTG 5257: Study Design
• Primary Endpoints*
– Time to HIV-1 RNA >1000 c/mL wk 16 to before wk 24, or >200 c/mL at or after wk 24 (VF)
– Time to discontinuation of randomized component for toxicity (TF)
• Pre-planned Composite Endpoint– The earlier occurrence of either VF or TF in a given participant
Landovitz L, et al. 21st CROI; Boston, MA; March 3-6, 2014. Abst. 85.
HIV-infected patients, ≥18 yr, with no previous ART,VL ≥ 1,000 c/mL at U.S. Sites
(N=1,809)
ATV 300 mg QD + RTV 100 mg QD + FTC/TDF 200/300 mg QD
(N=605)
RAL 400 mg BID + FTC/TDF 200/300 mg QD (N=603)
DRV 800 mg QD + RTV 100 mg QD + FTC/TDF 200/300 mg QD
(N=601)
Randomized 1:1:1 to Open Label TherapyStratified by screening HIV-1 RNA level (≥ vs. <100,000 c/mL),A5260s metabolic substudy participation, cardiovascular risk
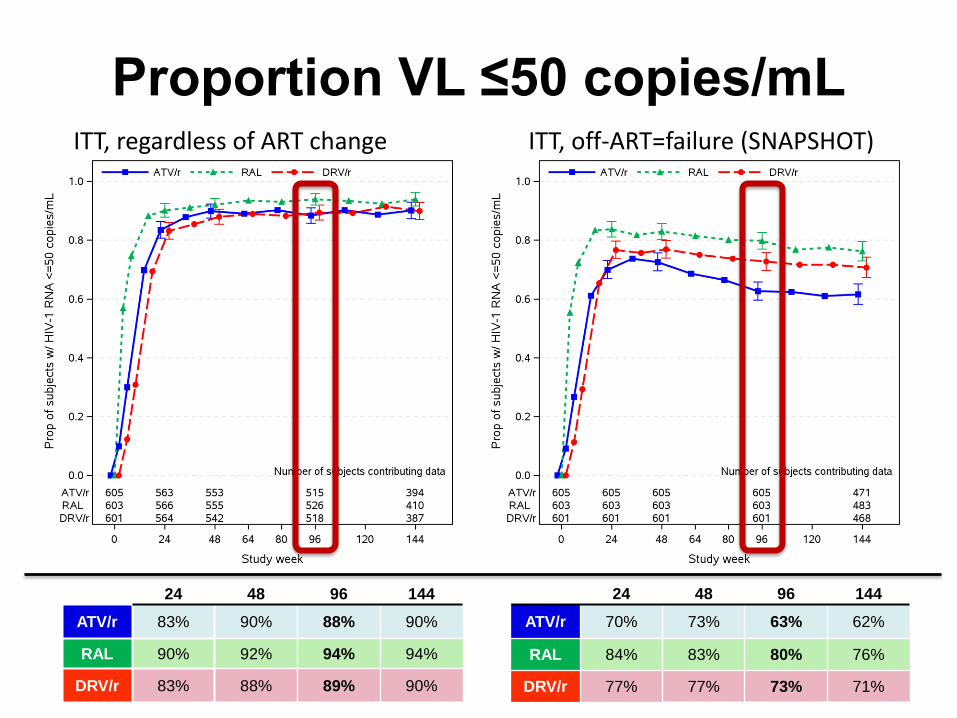
Proportion VL ≤50 copies/mLITT, regardless of ART change ITT, off-ART=failure (SNAPSHOT)
24 48 96 144
ATV/r 83% 90% 88% 90%
RAL 90% 92% 94% 94%
DRV/r 83% 88% 89% 90%
24 48 96 144
ATV/r 70% 73% 63% 62%
RAL 84% 83% 80% 76%
DRV/r 77% 77% 73% 71%

ACTG 5257: Toxicity Associated Discontinuation
ATV/r
(N=605)
RAL
(N=603)
DRV/r
(N=601)
Any Toxicity Discontinuation 95 (16%) 8 (1%) 32 (5%)
Gastrointestinal Toxicity 25 2 14
Jaundice/Hyperbilirubinemia 47 0 0
Other Hepatic Toxicity 4 1 5
Skin Toxicity 7 2 5
Metabolic Toxicity 6 0 2
Renal Toxicity (All Nephrolithiasis) 4 0 0
Abnormal Chem/Heme (Excl. LFTs) 0 0 2
Other Toxicity 2 3 4
Landovitz L, et al. 21st CROI; Boston, MA; March 3-6, 2014. Abst. 85.

Results confirmed in per protocol analysis: 91% DTG versus 84% DRV/r, ∆ (CI): 7.4 (1.4-13.3)
FLAMINGO: DRV/r vs DTGProportion (95% CI) of Individuals With
HIV-1 RNA <50 c/mL Over Time – Snapshot
Feinberg et al. ICAAC 2013; Denver, CO. Abstract H-1464a.
a Adjusted difference (DTG - DRV/r) based on CMH stratified analysis adjusting for baseline HIV RNA and background NRTI therapy.
DTG: 90%
DRV/r: 83%
Week
BL 4 8 12 16 3624 48
Pro
po
rtio
n (
%) 95% CI for differencea
FavorsDRV/r
FavorsDTG
-20% 0 20%
7.10.9 13.2
-12%
Test for superiority: P=0.025

The Future of integrase?Dual versus triple therapy –
randomised studies

7 randomised trials of PI/r + RAL versus PI/r + 2NRTIsHIV RNA <50 copies/mL (switch = failure endpoint)
Overall, in 7 randomised trials of 1266 patients, PI/r + raltegravir showed HIV RNA suppressionrates 10% lower than PI/r + 2NRTIs (p=0.008).
However there was evidence for heterogeneity between the trials (p=0.03).
Favours 3-drug treatment
Favours 2-drug treatment

Randomization 1:1
stratified by country and participation in virology/immunology substudy
First-Line ART NEAT 001:
DRV/r + RAL vs. DRV/r + TDF/FTC
• 78 sites, 15 European countries
• Composite virological and clinical primary endpoint (6 components)
Raffi F, et al. 21st CROI; Boston, MA; March 3-6, 2014. Abst. 84LB.
HIV-1 ART-naïve
≥18 years
HIV-1 RNA >1,000 c/mL
CD4 ≤500/mm3
HBsAg negative
No major IAS-USA
resistance mutations
DRVr 800+100 mg QD + RAL 400 mg BID
DRV/r 800+100 mg QD + TDF/FTC FDC QD
Minimum
Week 96

0,00
0,25
0,50
0,75
1,00
0 8 18 32 48 64 80 96 112 128 144
Time (weeks)
RAL + DRV/r TDF/FTC + DRV/r
log rank
P=0.12
NEAT 001: Primary AnalysisPrimary Endpoint
RAL
+ DRV/r
TDF/FTC
+ DRV/r
N 401 404
N with Primary Endpoint 76 (19%) 61 (15%)
V1. Regimen Change
for Insufficient Response
<1 log10 c/ml HIV RNA
Reduction W181 0
HIV RNA ≥400 c/ml
W241 0
V2. HIV RNA ≥50 c/ml
at W3227 28
V3. HIV RNA ≥50 c/ml
after W3232 22
C1. Death 3 1
C2. AIDS Event 5 3
C3. SNAIDS Event 7 7
Raffi F, et al. 21st CROI; Boston, MA; March 3-6, 2014. Abst. 84LB.
N at Risk
400 384 375 347 329 317 308 211 90 11
402 395 393 361 350 340 331 215 90 12
Estimated proportion reaching primary endpoint at W96
RAL: 17.4% vs TDF/FTC: 13.7%
Adjusted Difference: 3.7% (95% CI: -1.1, 8.6%)
Probability of Reaching Primary Endpoint
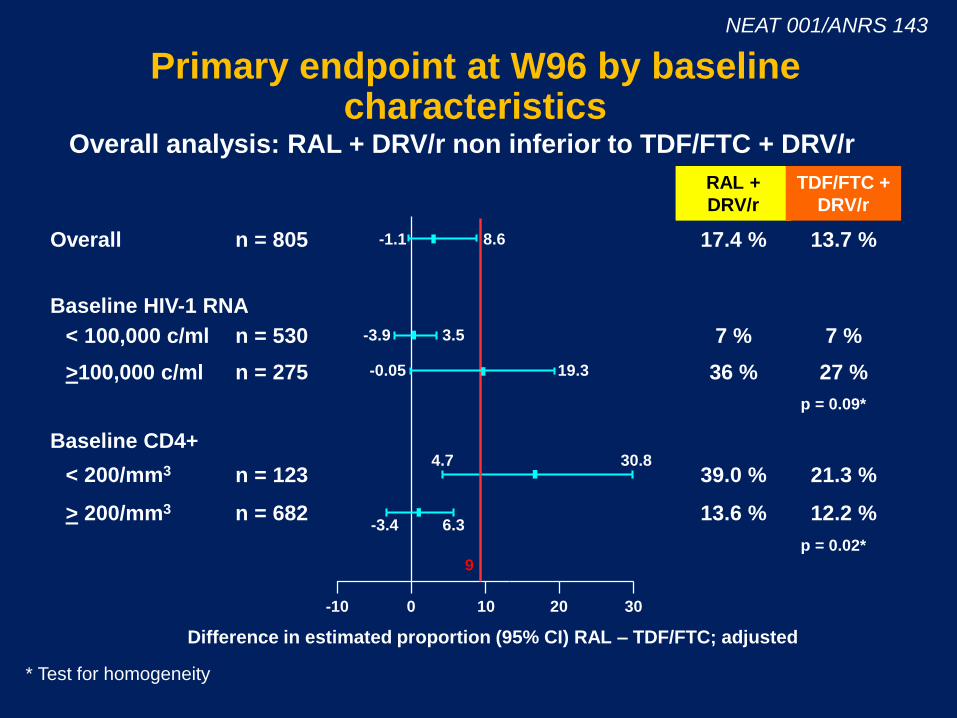
Overall analysis: RAL + DRV/r non inferior to TDF/FTC + DRV/r
Primary endpoint at W96 by baselinecharacteristics
n = 805
n = 530
n = 275
n = 123
n = 682
Overall
< 100,000 c/ml
>100,000 c/ml
< 200/mm3
> 200/mm3
Baseline HIV-1 RNA
Baseline CD4+
17.4 %
7 %
36 %
39.0 %
13.6 %
13.7 %
7 %
27 %
21.3 %
12.2 %
RAL +
DRV/r
TDF/FTC +
DRV/r
100-10 20 30
9
Difference in estimated proportion (95% CI) RAL – TDF/FTC; adjusted
* Test for homogeneity
p = 0.09*
p = 0.02*
-1.1 8.6
-3.9 3.5
-0.05 19.3
4.7 30.8
-3.4 6.3
NEAT 001/ANRS 143

Second-line Antiretroviral Therapy
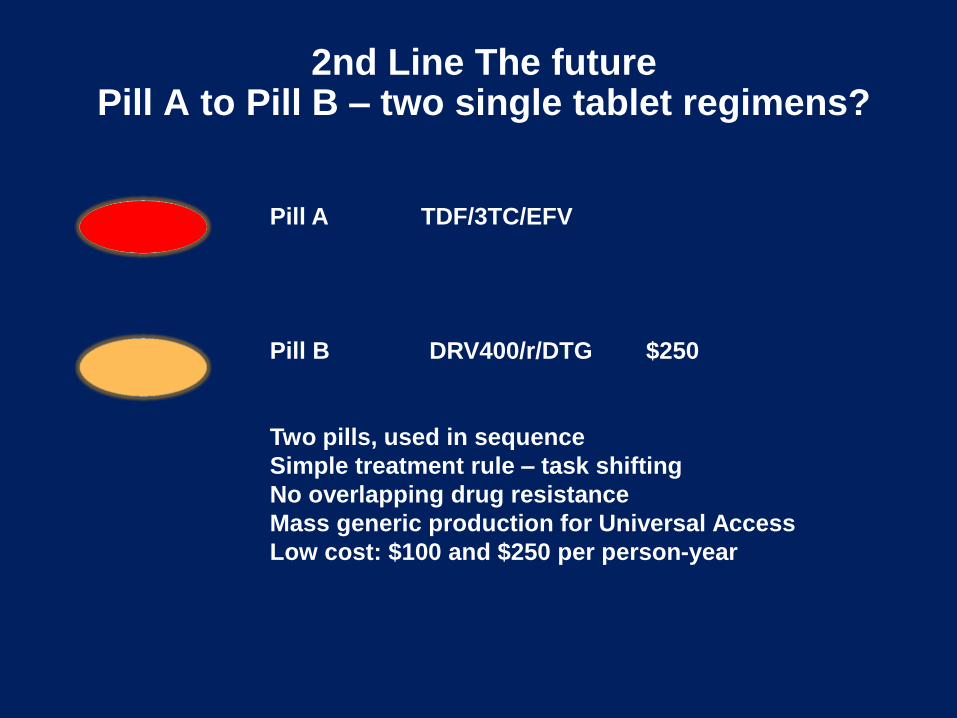
2nd Line The futurePill A to Pill B – two single tablet regimens?
Pill A TDF/3TC/EFV
Pill B DRV400/r/DTG $250
Two pills, used in sequence
Simple treatment rule – task shifting
No overlapping drug resistance
Mass generic production for Universal Access
Low cost: $100 and $250 per person-year

EARNEST: Second-Line LPV/RTV-Based ART After Initial NNRTI Failure
• Randomized, controlled, open-label, phase III trial
• Baseline demographics (medians): HIV-1 RNA 69,782 copies/mL; CD4+ 71 cells/mm3; time on ART 4 yrs
Paton N, et al. IAS 2013. Abstract WELBB02.
WHO, World Health Organization.*Including clinical, CD4+ cell count (viral load confirmed), or virologic criteria.†Selected by physician according to local standard of care.
HIV-infected adults and adolescents, received
first-line NNRTI-based ART > 12 mos, > 90% adherence in
previous mo,treatment failure by WHO
(2010) criteria*(N = 1277)
LPV/RTV + 2-3 NRTIs†
(n = 426)
LPV/RTV + RAL(n = 433)
LPV/RTV + RAL(n = 418)
Wk 144Wk 12
LPV/RTV monotherapy(n = 418)

EARNEST: Clinical Outcomes at Wk 96
• “Good disease control” at Wk 96 defined as pt alive, no new WHO 4 events from Wks 0-96, and CD4+ cell count > 250 cells/mm3, and HIV-1 RNA < 10,000 copies/mL or > 10,000 copies/mL without PI resistance mutations
Paton N, et al. IAS 2013. Abstract WELBB02.
100
80
60
40
20
0Good Disease
ControlHIV-1 RNA
< 400 copies/mL
HIV-1 RNA < 50 copies/mL
PI/NRTIPI/RALPI Mono60
6456
86 86
61
74 73
44

ACTG 5273: Second-line LPV/RTV + NRTIs vsLPV/RTV + RAL in African Settings
• Open-label, noninferiority phase III study– Primary endpoint: time to VF (confirmed HIV-1 RNA > 400 c/mL at or after 24 wks)
HIV-infected pts with HIV-1 RNA
> 1000 copies/mL after initial ART with
NNRTI + NRTIs(N = 512)
Wk 48:primary endpoint
Lopinavir/Ritonavir + Raltegravir(n = 258)
Lopinavir/Ritonavir + Best Available NRTIs*(n = 254)
Wk 96†
*NRTIs selected according to algorithm, including substitution of zidovudine for tenofovir DF and vice versa. †Shortened to 52 wks after last enrollment.
La Rosa AM, et al. CROI 2016. Abstract 30.

ACTG 5273:Virologic Failure and Toxicity
• No differences in number of AIDS events, serious non-AIDS events, or deaths between arms
• Difference in VF through Wk 48:
– RAL – NRTIs: -3.4% (95% CI: -8.4% to 2.5%)
– Upper bound of CI < 10%: RAL noninferior
• Cumulative probability of grade ≥ 3 toxicity event higher with LPV/RTV + NRTIs vs LPV/RTV + RAL
– Stratified log-rank P = .040
La Rosa AM, et al. CROI 2016. Abstract 30. Slide credit: clinicaloptions.com

The Future Switch Strategies for
Virologically Suppressed Patients

Carr A, et al. PLoS Med, 2012

What is the optimum switching strategy Patients with undetectable VL?
• Guidelines say: no history of prior failure or potentially important resistance mutations.
• ? Need more precision
EACS Guidelines Version 7.1 (Nov 2014); Personal communication. Pozniak A. Sep 2015

A lesson: SWITCHMRK -1 and -2:Switch from stable LPV/RTV to RAL-based HAART
Virologic outcomes at Wk 24, NC = F
Median previous antiretroviral drugs, n (range)
RAL5.0 (4.0-16.0)
LOP/r5.0 (2.0-15.0)
RAL5.5 (3.0-13.0)
LOP/r6.0 (4.0-14.0)
Eron J, et al. CROI 2009. Abstract 70aLB. Adapted with permission of Merck & Co., Inc., Whitehouse Station, New Jersey, USA. Copyright © 2009 Merck & Co., Inc., Whitehouse Station, NJ, USA. All rights reserved.
RAL + ARVs, n 174 166 169 173 172 176 176 176 176 175
LPV/RTV + ARVs, n 174 171 171 171 174 178 178 177 177 178

SPIRAL: Switch to RAL non-inferior to maintaining PI/RTV regimens
Patients with VF RAL(n = 4)
PI/RTV(n = 6)
Prior VF 1 3
Prior suboptimal ART 2 3
Prior resistance mutations 1 5
Resistance test at VF 1 4
Mutations 0 3 (PR, RT)
Martinez E, et al. AIDS. 2010;24(11):1697–1707
Mean change from baseline to Wk 48, %
Switch to RAL
Continue PI/RTV p value
Triglycerides -22.1 +4.7 < .0001
TC -11.2 +1.8 < .0001
LDL-C -6.5 +3.0 < .001
HDL-C -3.2 +5.8 < .0001
Total to HDL-C ratio -4.9 -1.3 < .05
0
20
40
60
80
100
Pat
ien
ts (
%)
Switch to RAL
Continue PI/RTV
86.689.2
Free of treatment failure at Wk 48 (ITT, S = F)
Median duration of virologic suppression before switch: >6 yrs

Other Strategies for Switch STRATEGY-PI Change to EVG/COBI or maintaining bPIs at Wk 48
• Regimens: ATV, 40%; DRV, 40%; LPV, 17%; FPV, 3%; SQV, < 1%; 79% on first regimen
• Results similar across all baseline virologic and demographic subgroups
• 2 pts with VF in each arm but no pts with resistance in either arm
• 5 in the switch arm and 2 in the boosted PI arm discontinued due to adverse event
• Lipids in switch pts– TGs vs all bPIs
– TC, TG, HDL-C vs LPV/RTV
– HDL-C vs DRV/RTV
*HIV-1 RNA < 50 c/mL as defined by FDA Snapshot algorithmDiscontinued for AE, death, or missing data.
Arribas J, et al. CROI 2014. Abstract 551LB.
< 12
Pat
ien
ts (
%)
9487
Δ +6.7%(95% CI: 0.4-13.7)
EVG/COBI/TDF/FTC (n=290)
Stable boosted PIs(n=139)
0
20
40
60
80
100
12
612
Virologicsuccess*
Virologicnon-response
No datan = 272 121 16 16

Virologic outcome at W48 (mITT, snapshot)
Pozniak A. Lancet Infect Dis 2014;14:590–9
93
88
Difference (95% CI)= 5.3% (-0.5 to 12.0)
1 1
n=3 n=1
611
%
0
20
40
60
80
100
HIV RNA<50 c/mL
HIV RNA≥50 c/mL
No virologicdata
STRATEGY-NNRTI Study: Switch NNRTI to EVG/c
EVG/c/FTC/TDF
NNRTI + FTC + TDF

52
STRIIVING: Switch From Suppressive ART to Fixed-Dose DTG/ABC/3TC
Virologic Outcomes at Wk 24
● Switch to DTG/ABC/3TC noninferior to maintaining baseline ART
● No cases of protocol-defined virologic failure
– 3 pts in DTG/ABC/3TC arm (1%) and 4 pts in BL ART arm (1%) had HIV-1 RNA > 50 but < 100 copies/mL through Wk 24
Trottier B, et al. ICAAC 2015. .
Primary Efficacy Analysis: ITT-Exposed and Per Protocol Populations
100
80
60
40
20
0VirologicSuccess
VirologicNonresponse
No Virologic Data
HIV
-1 R
NA
< 5
0 c
/mL
(%)
DTG/ABC/3TC (ITT-E, n = 274)
Baseline ART (ITT-E, n = 277)
DTG/ABC/3TC (PP, n = 220)
Baseline ART (PP, n = 215)
85 8893 93
1410
61 1 < 1
12-12 -8 -4 0 4 8
12-12 -8 -4 0 4 8
-4.9
-0.3
4.4
2.3-9.1
ITT-E Population
PP Population
-3.4
DTG/ABC/3TCBaseline ART

STRIIVING: Adverse Events and Treatment Satisfaction
● 10 pts discontinued for AEs in DTG/ABC/3TC arm vs 0 in baseline ART arm
● However, significantly greater increase in treatment satisfaction score from baseline to Wk 24 in DTG/ABC/3TC arm vs baseline ART arm
– Adjusted mean difference: 2.4 (P < .001)
Trottier B, et al. ICAAC 2015. Reproduced with permission.
AEs in 10 Pts Who Withdrew* Grade
Insomnia 2
Diarrhea, flatulence, rash
Abdominal pain, anxiety, nausea, body ache
1
2
Euphoric mood
Headache
1
2
Abdominal cramps, chills, diarrhea, dizziness,
headache2
Pruritus 2
Abdominal pain, diarrhea, flulike syndrome,
profuse sweating, change in body odor
Fatigue,† malaise, depression
1
2
Nasal congestion
Worsening fatigue
Nausea
1
2
3
Alopecia 1
Fatigue† 1
Homicide† N/A
*None serious AEs except homicide. †Not drug related.

ATV/r 300/100 mg qd + TDF/FTCN = 37
N = 72
ATV/r 300/100 mg qd + RAL 400 mg bid
Design Randomisation2 : 1
Open-label
Objective– Primary Endpoint: proportion with treatment success at W24
(HIV-1 RNA < 40 c/mL)
• No power calculation
• Descriptive analysis
HARNESS Van Lunzen J. JAIDS 2016
AdultsStable 2 NRTI + 3rd drug regimen
No previous treatment failureHIV RNA < 40 c/mL > 3 months
Switch for safety and/or tolerability issues
No resistance to study medicationsHBs Ag negative
W24 W48
HARNESS Study: switch to ATV/r + RAL

HIV RNA < 40 c/mL (ITT)
ATV/r + RALATV/r + TDF/FTC
Confirmed virologic rebound at W48, N
Efficacy and Safety results
ATV/r + TDF/FTC ATV/r + RAL
N 1 9
Tested isolates 0 5
PI resistance
1*L10V, G16Q, L33F, P39Q,
M46L, G48V,Q58E, I62V, L63I/T, I64L, A71V, I72V, V77I, V82A,
T91S, I93L
INI resistance2*
F21YY143C + N155H
* 1 patient with both PI and INSTI mutations
HARNESS
HARNESS Study: switch to ATV/r + RAL
Van Lunzen J. IAC 2014, Melbourne, Abs. LBPE19, Van Lunzen JAIDS 2016
0
100 94.6
80.6
20
40
60
80
%
W24 (primary endpoint)
W48
86.5
69.4
Virologic rebound 2 consecutive on-treatment HIV RNA > 40 c/mL
Last on-treatment HIV RNA > 40 c/mL followed by
discontinuation

ATV/r + TDF/FTC
N = 37
ATV/r + RAL
N = 72
Grade 3-4 AEs 5 13
Grade 2-4 drug-related AEs
Grade 3-4 total bilirubin
8
3
12
5
Renal toxicity 6 1
Discontinuation due to AE 1 4
Safety at W48, N
HARNESS Van Lunzen J. JAIDS 2016
HARNESS Study: switch to ATV/r + RAL
ATV and RAL geometric mean Ctrough values, available for most patients, were within therapeutic ranges over the study course

Open-label, single-arm phase IV exploratory trial
– Primary endpoint: HIV-1 RNA < 50 copies/mL at Wk 48 (ITT-e, FDA snapshot analysis)
Lets treat an Integrase like a boosted PI!PADDLE: Dolutegravir + Lamivudine in Treatment-
Naive Pts
Figueroa MI, et al. EACS 2015. Abstract 1066.
Treatment-naive pts with HIV-1 RNA
5000-100,000 copies/mL; CD4+ cell count
≥ 200 cells/mm3;HBsAg negative
(N = 20)
Second Cohort
DTG 50 mg QD +Lamivudine 300 mg QD
(n = 10)
Dolutegravir 50 mg QD +Lamivudine 300 mg QD
(n = 10)
First Cohort
Second cohort to be enrolled following confirmation of
first cohort success at Wk 8

PADDLE: All Pts Virologically Suppressed by Wk8 of Dolutegravir + Lamivudine
● Included 4 pts with HIV-1 RNA > 100,000 copies/mL at BL
Figueroa MI, et al. EACS 2015. Abstract 1066. Reproduced with permission.
Pt #
HIV-1 RNA, copies/mL
Screen BL Day 2 Day 4 Day 7 Day 10 Wk 2 Wk 3 Wk 4 Wk 6 Wk 8 Wk 12 Wk 24
1 5584 10,909 3701 383 101 71 < 50 < 50 < 50 < 50 < 50 < 50 < 50
2 8887 10,233 5671 318 < 50 < 50 < 50 < 50 < 50 < 50 < 50 < 50 < 50
3 67,335 151,569 37,604 1565 1178 266 97 53 < 50 < 50 < 50 < 50 < 50
4 99,291 148,370 11,797 3303 432 179 178 55 < 50 < 50 < 50 < 50 < 50
5 34,362 20,544 4680 1292 570 168 107 < 50 < 50 < 50 < 50 < 50 < 50
6 16,024 14,499 3754 1634 162 < 50 < 50 < 50 < 50 < 50 < 50 < 50 < 50
7 37,604 18,597 2948 819 61 < 50 < 50 < 50 < 50 < 50 < 50 < 50 < 50
8 25,071 24,368 6264 1377 Not done 268 105 < 50 < 50 < 50 < 50 < 50 < 50
9 14,707 10,832 Not done 516 202 < 50 < 50 < 50 < 50 < 50 < 50 < 50 < 50
10 10,679 7978 5671 318 < 50 < 50 < 50 < 50 < 50 < 50 < 50 < 50 < 50
11 50,089 273,676 160,974 68,129 3880 2247 784 290 288 147 < 50 < 50 < 50
12 13,508 64,103 3496 3296 135 351 351 84 67 < 50 < 50 < 50 < 50
13 28,093 33,829 37,350 26,343 539 268 61 < 50 < 50 < 50 < 50 < 50 < 50
14 15,348 15,151 3994 791 198 98 < 50 61 64 < 50 < 50 < 50 < 50
15 23,185 23,500 15,830 4217 192 69 < 50 < 50 < 50 Not done < 50 < 50 < 50
16 11,377 3910 370 97 143 < 50 < 50 < 50 < 50 < 50 < 50 < 50 < 50
17 39,100 25,828 11,879 1970 460 147 52 < 50 < 50 < 50 < 50 < 50 < 50
18 60,771 73,069 31,170 2174 692 358 156 < 50 < 50 < 50 < 50 < 50 < 50
19 82,803 106,320 35,517 2902 897 352 168 76 < 50 < 50 < 50 < 50 < 50
20 5190 7368 3433 147 56 < 50 < 50 < 50 < 50 < 50 < 50 < 50 < 50

Don’t do this at Home..2 Switch studies From Suppressive ART to Dolutegravir
Monotherapy
● Single-arm, 24-wk pilot study
– Primary endpoint: HIV-1 RNA < 37 c/mL at Wk 24 (ITT, NC=F)
● Eligibility: HIV-1 RNA < 50 c/mL on ART for ≥ 12 mos
Rojas J, et al. EACS 2015. Abstract 1108
Katlama C, et al. EACS 2015. Abstract 714..
Reasons for Switch, %Patients(N = 33)
Underlying cause• Comorbidities 97• DDIs 85• ART-related AEs 76• Resistance 48
Immediate cause• DDIs 39• GI symptoms 33• Dyslipidemia 27
In separate study of switch from
suppressive ART to DTG monotherapy, 89% of pts maintained virologic suppression 24 wks after switch; 3 had VF
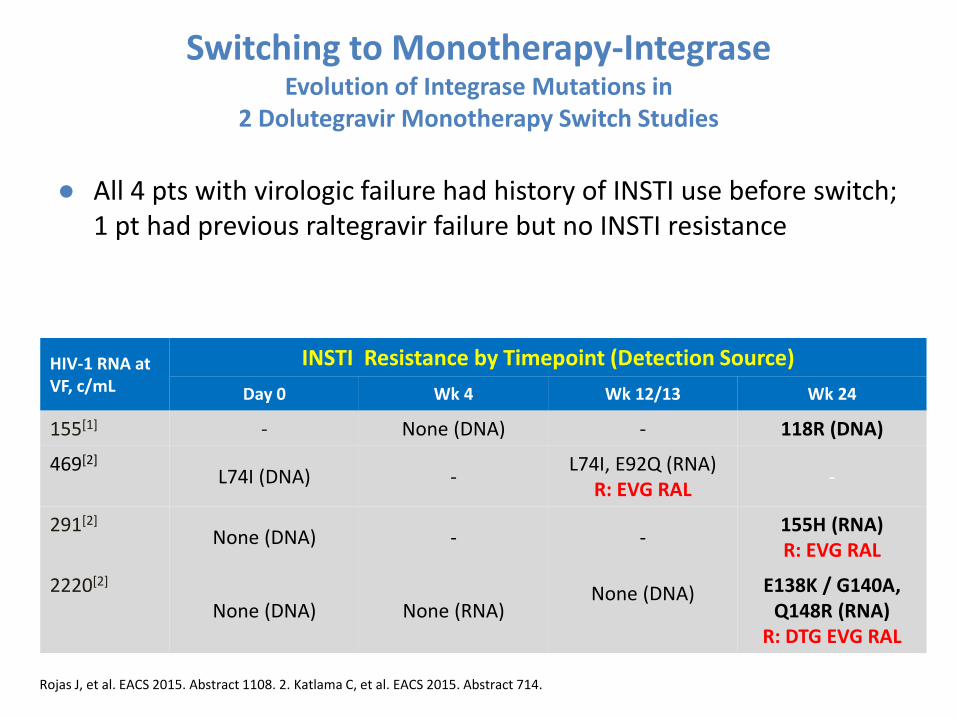
Switching to Monotherapy-IntegraseEvolution of Integrase Mutations in
2 Dolutegravir Monotherapy Switch Studies
● All 4 pts with virologic failure had history of INSTI use before switch; 1 pt had previous raltegravir failure but no INSTI resistance
Rojas J, et al. EACS 2015. Abstract 1108. 2. Katlama C, et al. EACS 2015. Abstract 714.
HIV-1 RNA at VF, c/mL
INSTI Resistance by Timepoint (Detection Source)
Day 0 Wk 4 Wk 12/13 Wk 24
155[1] - None (DNA) - 118R (DNA)
469[2]
L74I (DNA) -L74I, E92Q (RNA)
R: EVG RAL-
291[2]
None (DNA) - -155H (RNA)R: EVG RAL
2220[2]
None (DNA) None (RNA)None (DNA) E138K / G140A,
Q148R (RNA)R: DTG EVG RAL

Novel approach
● Long acting Injectables
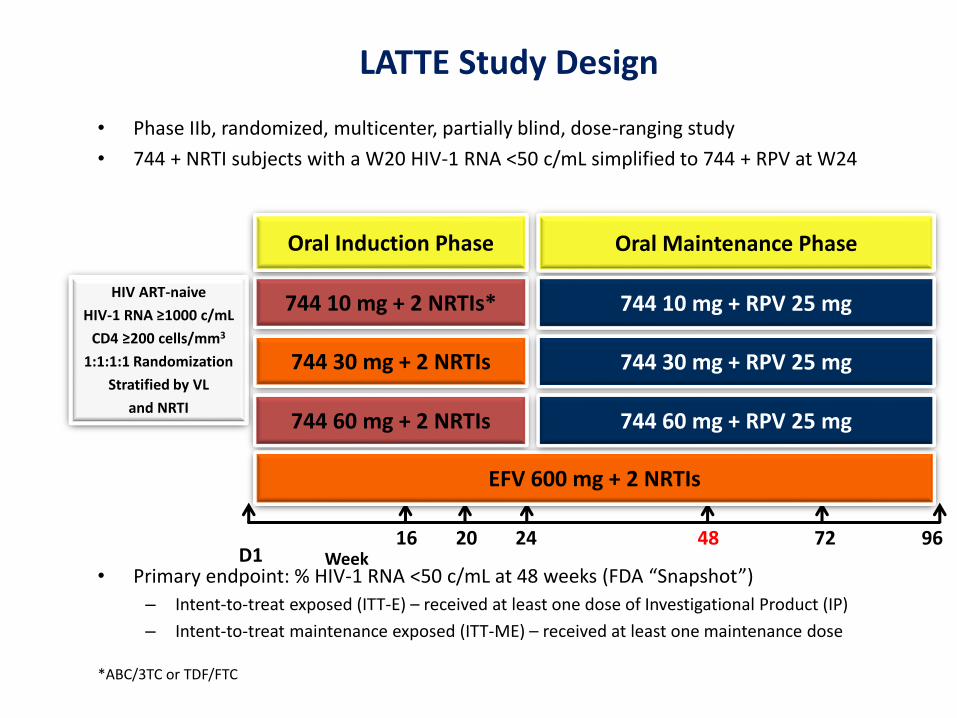
• Phase IIb, randomized, multicenter, partially blind, dose-ranging study
• 744 + NRTI subjects with a W20 HIV-1 RNA <50 c/mL simplified to 744 + RPV at W24
• Primary endpoint: % HIV-1 RNA <50 c/mL at 48 weeks (FDA “Snapshot”)
– Intent-to-treat exposed (ITT-E) – received at least one dose of Investigational Product (IP)
– Intent-to-treat maintenance exposed (ITT-ME) – received at least one maintenance dose
LATTE Study Design
*ABC/3TC or TDF/FTC
2416 20 48 9672
HIV ART-naive
HIV-1 RNA ≥1000 c/mL
CD4 ≥200 cells/mm3
1:1:1:1 Randomization
Stratified by VL
and NRTI
744 30 mg + 2 NRTIs
744 10 mg + 2 NRTIs*
Oral Induction Phase
744 60 mg + 2 NRTIs
EFV 600 mg + 2 NRTIs
Oral Maintenance Phase
744 10 mg + RPV 25 mg
744 30 mg + RPV 25 mg
744 60 mg + RPV 25 mg
WeekD1

Margolis et al. CROI 2015; Seattle, WA. Poster 554LB.
Cabotegravir and Rilpivirine As Two-Drug Oral Maintenance Therapy: LATTE Week 96 Results
HIV-1 RNA <50
INI resistance 2x E138E/A and Q148R

Protocol-Defined Virologic Failure
744 totaln=181
EFVn=62
Subjects with PDVF during Induction 3* (2%) 3 (5%)*1 subject per 744 doseNo NRTI, NNRTI or INI treatment-emergent mutations
PDVF: <1.0 log10 c/mL decrease in plasma HIV-1 RNA by Week 4 OR confirmed HIV-1 RNA ≥200 c/mL at or after Week 16 or after prior suppression to <200 c/mL
744 totaln=160
EFVn=47
Subjects with PDVF during Maintenance 2** (1%) 1 (2%)IN genotypic results at BL and time of PDVF 1 1
INI-r mutations 1 0PR/RT genotypic results at BL and time of PDVF
2 1
NRTI-r mutationsNNRTI-r mutations
01
00
**744 10 mg – treatment emergent INI (Q148R) and NNRTI (E138Q) at W48; 744 FC = 3; RPV FC = 2744 and RPV concentrations <50% of expected; extreme calorie restricted diet W40-W48
**744 30 mg – PDVF at W36; no treatment-emergent mutations
Margolis et al. CROI 2014; Boston, MA. Abstract 91LB.

744 10 mg n=60
744 30 mgn=60
744 60 mgn=61
EFV 600 mg
n=62Grade 2-4 drug-related events (total) 5 (8) 8 (13) 13 (21) 12 (19)(>3% any arm)Insomnia 1 (2) 2 (3) 0 4 (6)Nausea 0 2 (3) 3 (5) 1 (2)Fatigue 0 2 (3) 1 (2) 1 (2)Headache 1 (2) 1 (2) 3 (5) 0Rash 0 0 1 (2)* 5 (8)
Grade 2-4 drug-related events (W24+)† 1 (2) 2 (4) 3 (5) 2 (4)
Serious adverse events (all) 6 (10) 2 (3) 3 (5) 3 (5)‡
AEs leading to withdrawal 1(2) 1 (2) 4 (7) 8 (13)Events with >1 subjectDizziness 0 0 0 2 (3)ALT increased 0 0 2 (3)** 0
*Grade 2; concomitant acute syphilis†All Grade 2‡One drug-related SAE: suicide attempt (EFV)**Two subjects with steatohepatitis developed asymptomatic Grade 4 ALT elevations, with normal bilirubin levels, at Week 4 and Week 8, which resolved off IP.
• Neuropsychiatric AEs more commonly seen with EFV
• Headache was more commonly seen with 744 (22%) than EFV (11%)
– Predominantly Grade 1 and 2; no withdrawals due to headache
Adverse Events

001/IHQ/16-01//1004p April 2016
LATTE-2: Cabotegravir IM + Rilpivirine IM for Long-Acting Maintenance ART
• Multicenter, open-label phase IIb study– Primary endpoints: HIV-1 RNA < 50 c/mL by FDA snapshot, PDVF, and safety at maintenance Wk 32
Margolis DA, et al. CROI 2016. Abstract 31LB.
CAB 400 mg IM + RPV 600 mg IM Q4W(n = 115)
CAB 600 mg IM + RPV 900 mg IM Q8W(n = 115)
*Pts with HIV-1 RNA < 50 c/mL from Wk 16 to Wk 20 continued to maintenance phase. 6 pts discontinued for AEs or death in induction analysis.
ART-naive HIV-infected pts withCD4+ cell count >
200 cells/mm3
(N = 309) CAB 30 mg PO + ABC/3TC PO QD(n = 56)
CAB 30 mg PO QD +ABC/3TC
Wk 32primary analysis;
dose selection
Wk 20
Induction Phase* Maintenance Phase
Wk 1 Wk 96Wk 16: RPV PO added
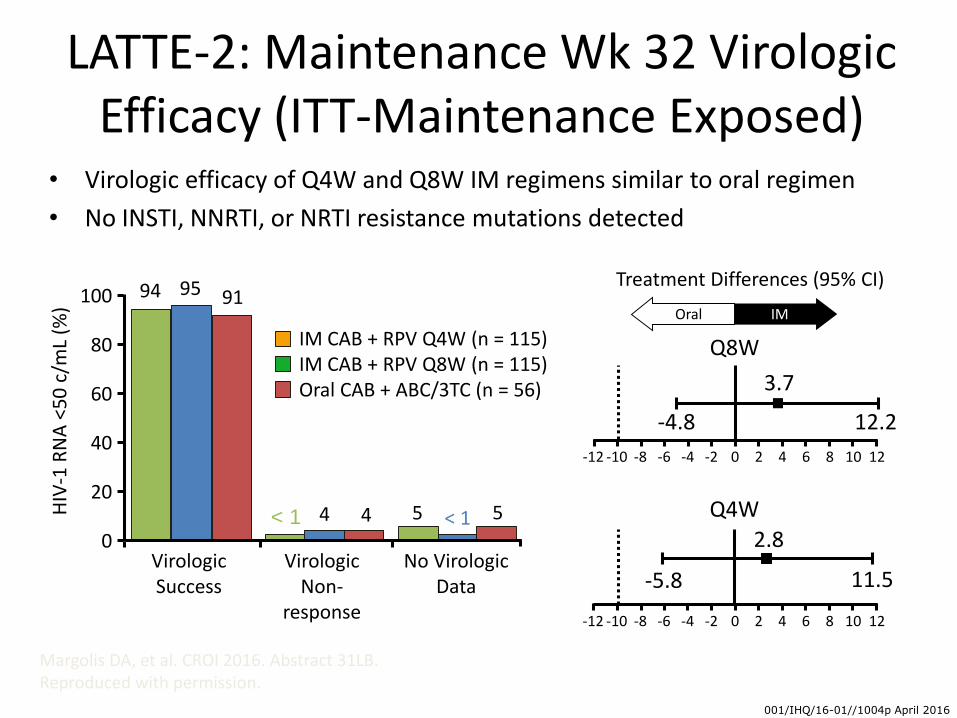
001/IHQ/16-01//1004p April 2016
LATTE-2: Maintenance Wk 32 Virologic Efficacy (ITT-Maintenance Exposed)
• Virologic efficacy of Q4W and Q8W IM regimens similar to oral regimen
• No INSTI, NNRTI, or NRTI resistance mutations detected
Margolis DA, et al. CROI 2016. Abstract 31LB. Reproduced with permission.
9594 91
4< 1 4 < 15 5
VirologicSuccess
VirologicNon-
response
No VirologicData
HIV
-1 R
NA
<50
c/m
L (%
)
100
80
60
40
20
0
IM CAB + RPV Q4W (n = 115)IM CAB + RPV Q8W (n = 115)Oral CAB + ABC/3TC (n = 56)
Treatment Differences (95% CI)
Q8W
-4.8
3.7
12.2
IMOral
-12 -10 -8 -6 -4 -2 0 2 4 6 8 10 12
Q4W
-5.8
2.8
11.5
-12 -10 -8 -6 -4 -2 0 2 4 6 8 10 12

001/IHQ/16-01//1004p April 2016
LATTE-2: Safety Through Maintenance Wk 32
• Most frequent ISRs were pain (67%), swelling (7%), and nodules (6%)
– ISR events/injection: 0.53
– 99% of ISRs grade 1/2; none grade 4
– Proportion of pts reporting ISRs decreased with time from 86% on Day 1 to 33% at Wk 32; 1% of pts withdrew for ISRs
Margolis DA, et al. CROI 2016. Abstract 31LB.
AEs, % Pooled CAB + RPV IM Arms(n = 230)
Oral CAB + ABC/3TC(n = 56)
Drug-related grade 3/4 AEs (excluding ISRs)
3 0
Serious AEs 6 5
AEs leading to withdrawal 3 2
001/IHQ/16-01//1004p April 2016
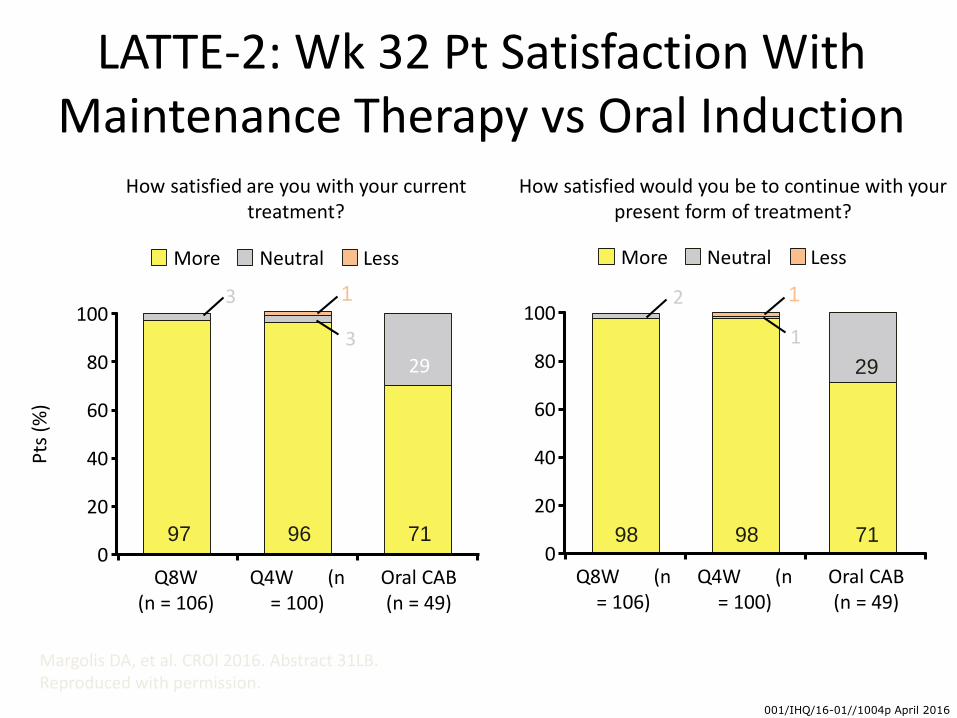
LATTE-2: Wk 32 Pt Satisfaction With Maintenance Therapy vs Oral Induction
Margolis DA, et al. CROI 2016. Abstract 31LB. Reproduced with permission.
Pts
(%
)
How satisfied are you with your current treatment?
100
80
60
40
20
0Q8W
(n = 106)Q4W (n
= 100)Oral CAB(n = 49)
More Neutral Less
100
80
60
40
20
0Q8W (n
= 106)Q4W (n
= 100)Oral CAB(n = 49)
More Neutral Less
How satisfied would you be to continue with your present form of treatment?
97 96 71
29
3 1
3
98 98 71
29
2 1
1

Other Challenges-for Integrases
• Role in Pregnancy-few data
• Role in TB trial with RTG and PK with DTG and trial ongoing
• Role in acute HIV infection-? On reservoir and symptoms
• Role in PrEP

001/IHQ/16-01//1004p April 2016
We need PrEP!
UNAIDS 2016

UAI in MSM using club drugs
57.1
87.1* (p<0.05)
0102030405060708090
100
HIV-negative/unknown HIV-positive
%
HIV status
Unprotected anal sex in MSM using club-drugs by HIV status
Kurka, T. Sex Transm Infect. 2015 Sep;91(6):394

0 12 24 36 48 60 0 12 24 36 48 60
Immediate PrEP Deferred PrEP
Weeks since enrolment
PREP daily for high risk MSM Individual incident HIV infections
PROUD Study
N=19N=3
86% reduction

PREP “on demand”
PREP
PREP
PREP

ÉCLAIR: Cabotegravir LA in HIV-Negative Men at Low Risk for HIV Infection
Cabotegravir: potent INSTI formulated as oral tablet and for LA IM injection
Randomized, double-blind phase IIa trial
– Primary endpoint: safety, tolerability of CAB LA IM injections
– 2 HIV seroconversions, none during CAB LA dosing period
CAB LA 800 mg IM every 12 wks(n = 106)
Saline Placebo IM every 12 wks(n = 21)
Healthy adult men at low risk of HIV infection
(N = 127)
Oral Phase Injection Phase
CAB 30 mg PO QD
Placebo PO QD
Wk 4 Wk 41
Markowitz M, et al. CROI 2016. Abstract 106.
40-Wks of follow-up

ÉCLAIR: Predicted vs Observed Cabotegravir LA Pharmacokinetics
Peak CAB LA exposure higher and trough exposure lower than predicted because of more rapid absorption and release after injection
– ~ 70% of pts had Ctrough < 4 x protein-binding adjusted IC90; every-8-wk dosing now under investigation
Mea
n (
SD)
Pla
sma
CA
B
Co
nce
ntr
atio
n (
μg
/mL)
Time From First IM Dose (Wks)Markowitz M, et al. CROI 2016. Abstract 106. Reproduced with permission.
Geometric mean Ctrough
with 10 mg PO QD: 1.35 μg/mL (LATTE)
4 x Protein-binding adjusted IC90: 0.664 μg/mL
Protein-binding adjusted IC90: 0.166 μg/mL
10
1
0.1
0.010 1 4 8 1213 18 2425 30 36
Observed CAB 800 mg IM every 12 wks (ÉCLAIR; n = 94)Simulated CAB 800 mg IM every 12 wks (males)

ÉCLAIR: Injection Safety and Pain Outcomes
ISR events occurred in 93% of pts with IM CAB vs 57% with placebo
No discontinuations for AEs during inj. phase; however, 4 pts who withdrew consent noted inj. tolerability as reason
On 0 (none of time) to 6 (all of time) pain/discomfort scale assessed at Wk 30, 6% of pts in CAB arm reported pain/ discomfort all of the time
– 21% of pts in CAB arm reported being dissatisfied with study medication AEs
Markowitz M, et al. CROI 2016. Abstract 106. Murray M, et al. CROI 2016. Abstract 471. Reproduced with permission.
ISR Event
CAB (n = 94) Placebo (n = 21)
Events, %
Mean Duration,
Days
Events, %
Mean Duration,
Days
Pain 92 5.4 27 2.0
Gr 1 45 26
Gr 2 37 2
Gr 3 10 0
Pruritus 10 2.5 6 1.8
Swelling 8 3.8 0
Nodule/ bump
8 9.7 0
Warmth 7 3.2 0
Bruising 6 3.3 2 2.0
Induration 6 4.3 0

ÉCLAIR: Patient Satisfaction With IM Therapy vs Oral Phase
Pt satisfaction assessed by questionnaire at Wk 18 of IM treatment;
1. Markowitz M, et al. CROI 2016. Abstract 106. 2. Andrews CD, et al. CROI 2016. Abstract 105. Reproduced with permission.
Pts
(%
)
How satisfied are you with
your current treatment?
100
80
60
40
20
0Placebo (n = 21)CAB (n = 91)
More Neutral Less100
80
60
40
20
0
How satisfied would you be to
continue with your present form of
treatment?
62
23
71 29 7481
1524
5
Placebo (n = 21)CAB (n = 91)
15 1119
0

New Integrase in Phase 3
Bictegravir or GS 9883
76
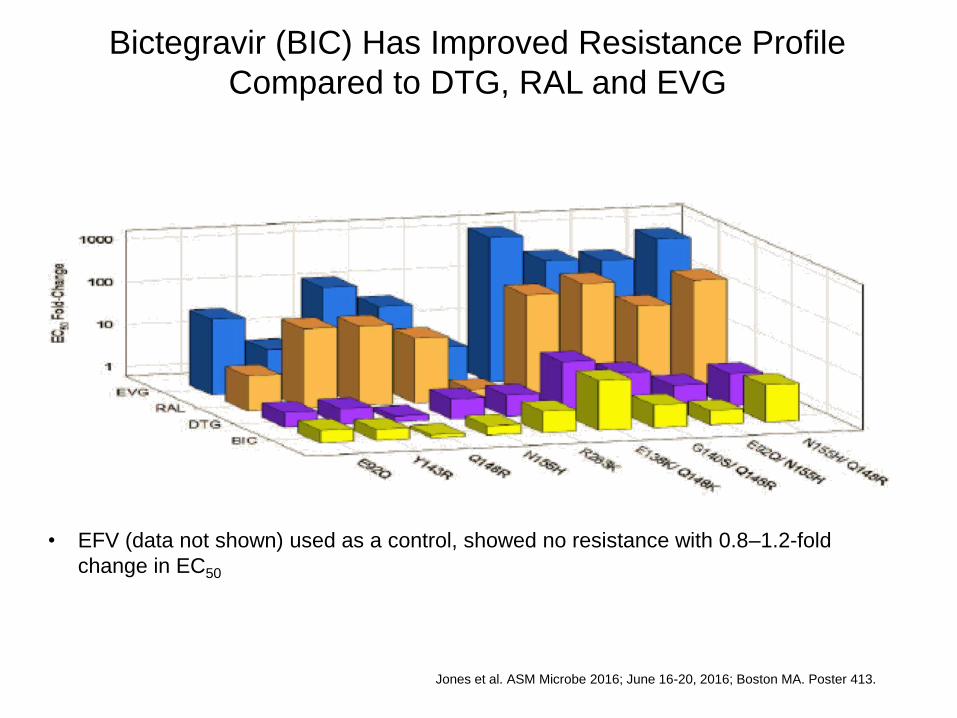
Bictegravir (BIC) Has Improved Resistance Profile
Compared to DTG, RAL and EVG
Jones et al. ASM Microbe 2016; June 16-20, 2016; Boston MA. Poster 413.
• EFV (data not shown) used as a control, showed no resistance with 0.8–1.2-fold
change in EC50

Novel lntegrase Strand
Transfer Inhibitor Bictegravir
10 Day Monotherapy in
HIV-1–lnfected Patients
Joel Gallant,1 Melanie Thompson,2 Edwin DeJesus,3
Gene Voskuhl,4 Xuelian Wei,5 Julia Zack,5 Kirsten White,5
Hal Martin,5 Javier Szwarcberg5
1Southwest CARE Center, Santa Fe, NM; 2AIDS Research Consortium of
Atlanta, GA; 3Orlando Immunology Center, Orlando, FL; 4AIDS Arms, Inc.,
Dallas, TX; 5Gilead Sciences, Inc., Foster City, CA

• In part 1, 10 patients were randomized
1:1 to Cohort 1 (BIC 25 mg) or Cohort 2
(BIC 100 mg)
– Within each cohort, patients were assigned
in a 4:1 ratio to receive active BIC or
matching PBO
Methods (cont)
Gallant et al. ASM Microbe 2016; June 16-20, 2016; Boston MA. Poster 415.

Mean Change (95% Confidence Interval) in HIV-
1 RNA
Gallant et al. ASM Microbe 2016; June 16-20, 2016; Boston MA. Poster CROI 2016; Boston, MA. Poster 415.

The Future
The rise of Integrase-dominance in guidelines
Globally still EFV but Igs are alternative
Integrase plus one nuke in naives
Integrase in switch 3drugs or 2 or one?
Long-acting injectable integrase plus NNRTI for RX
Long-acting injectable integrase for PrEP
New Integrases