Embed Size (px)
Citation preview

Integration Index
for Latin America and the Caribbean
XLII Regular Meeting of the Latin American Council Caracas, Venezuela 26 to 28 October 2016
SP/CL/XLII. O/Di N° 1-16

Integration Index
for Latin America and the Caribbean
Intra-Regional Relations
XLII Regular Meeting of the Latin American Council Caracas, Venezuela 26 to 28 October 2016
SP/CL/XLII. O/Di N° 1-16

Copyright © SELA, October 2016. All rights reserved.
Printed in the Permanent Secretariat of SELA, Caracas, Venezuela.
The Press and Publications Department of the Permanent Secretariat
of SELA must authorise reproduction of this document, whether
totally or partially, through [email protected]. The Member States and
their government institutions may reproduce this document without
prior authorisation, provided that the source is mentioned and the
Secretariat is aware of said reproduction.

Integration Index for Latin America and the Caribbean SP/CL/XLII. O/Di N° 1-16
C O N T E N T S
FOREWORD
EXECUTIVE SUMMARY 3
INTRODUCTION 5
CHAPTER I. INTEGRATION AS A PROCESS AND AS A SITUATION 6
1. Stages of integration 6
2. Subregional Integration Mechanisms 7
3. Background 8
CHAPTER II. INTEGRATION INDEX FOR LATIN AMERICA
AND THE CARIBBEAN (IINTALC) 10
1. Structure of the IINTALC 10
2. Categorization of information 11
CHAPTER III. MEASURING THE IINTALC 13
1. Dealing with missing data 13
2. Methodology 14
CHAPTER IV. RESULTS 17
CONCLUSIONS 25
ANNEXES 27
BIBLIOGRAPHY 43


Integration Index for Latin America and the Caribbean SP/CL/XLII. O/Di N° 1-16
F O R E W O R D
This study has been prepared in compliance with Activity I.2.2 of the Work Programme of SELA for 2016
entitled “Integration Index for Latin America and the
Caribbean".
The document consists of an Executive Summary, an
Introduction, four chapters and the Conclusions.
Chapter I presents a brief review of the forms that
integration can take on, conceptually and in its
different stages or phases, a description of the
subregional integration mechanisms which are the
subjects of this study, and an excerpt of some existing indicators within and outside the region. Chapter II
contains a description of what the Integration Index of
Latin America and the Caribbean is, as created by
SELA, its structure and the way in which the variables
that form it have been categorized. Chapter III is
dedicated to explaining the estimation methodology
of the index, and its data processing. Chapter IV
presents the main results produced by the study. And
lastly, the document presents the Conclusions.
The Permanent Secretariat of SELA wishes to thank economists Virginia Cartaya, Javier Rodríguez, Laura
Méndez, Lucimar Ponce and Karla Sánchez, for their
dedication in drafting this document.


Integration Index for Latin America and the Caribbean SP/CL/XLII. O/Di N° 1-16
3
3
[Capte la atención de los lectores mediante una cita importante extraída del documento o utilice este
EXECUTIVE SUMMARY
This document deals with the Integration Index for Latin America and the Caribbean
(IINTALC) by taking into consideration a broad series of economic, social, environmental and
cultural indicators. It estimates the weightings of the index by means of the main components
technique and the results are presented for the different integration mechanisms of the region
during 2005, 2010 and 2014. Starting from there, a cluster analysis is made, seeking common
patterns that could explain or influence the integration processes. In this way, the methodology
allows for identifying those countries that show greater similarities when considering a broad
range of dimensions and indicators. It is important to point out that these classifications are not
expected to qualify the countries in terms of their general performance, but in terms of the
homogeneity shown in regard to their peers following the proposed criteria and inside the
integration agreement.
An initial analysis of the IINTALC suggests that within the countries of the Pacific Alliance, Chile
and Colombia are the ones that converge faster than their partners towards the goals of the
mechanism. In the case of the member countries of the Common Market of the South
(MERCOSUR), the 2014 results indicate that Uruguay is the country that has the IINTALC greatest
mark, followed by Argentina and Brazil, leaving Venezuela and Paraguay at the rear. Regarding the
Andean Community (CAN), the results obtained in the IINTALC suggest that Peru has the leading
mark although it shows a small difference with respect to Colombia, and these last two countries
show a high level of convergence when compared with Bolivia and Ecuador. As regards the Central
American Integration System (SICA), the group formed by Nicaragua, Honduras, Guatemala y El
Salvador displays less heterogeneity (especially the first two countries); the second group that
consists of the Dominican Republic, Panama, Costa Rica and Belize, is more heterogeneous, and
the last one stands out as the country with less similarities than the other members in 2014.
Regarding CARICOM, Saint Vincent and the Grenadines are the countries that seem to converge
with the fastest speed than their partners towards the goals of the mechanism.

Integration Index for Latin America and the Caribbean SP/CL/XLII. O/Di N° 1-16
5
5
[Capte la atención de los lectores mediante una cita importante extraída del documento o utilice este
INTRODUCTION
Economic integration is a process that encompasses measures aimed at reducing the
several economic, social and even cultural barriers between countries. This phenomenon had a
significant boom mainly from the 1980s, time in which a considerable increase is recorded in
several trade agreements between developed and developing countries. This situation has fostered
the interest in measuring and following up the integration processes, understood as a
multidimensional phenomenon, in which other aspects in addition to the economic one, have
equal relevance and must be considered as part of the process and its measurement.
The integration mechanisms allow that the countries progressively broaden their field of action in
search for lower costs, greater performance and new markets, which promotes the insertion into
international markets and fosters the creation of common spaces that facilitate the free mobility of
the production factors. This document proposes the formulation of an index that evaluates the
progress of the different integration mechanisms in Latin America and the Caribbean. Specifically,
the tool presented here, is a weighted indicator used to measure the degree of integration in: the
Common Market of the South (MERCOSUR), the Central American Integration System (SICA), the
Pacific Alliance (AP), the Caribbean Community (CARICOM) and the Andean Community (CAN).
Due to the multidimensional nature of integration, the IINTALC proposes to quantify the degree of
proximity between the countries of a certain mechanism through economic, social, demographic,
political and environmental variables, in order to demonstrate the degree of convergence. In this
sense, the index offers an extended outlook of the current situation of each country in regard to
their pairs by identifying the more relevant strengths and weaknesses, which would contribute with
the design of assertive public policies. On the other hand, the IINTALC allows for estimating the
future impact of said policies from the current evaluation, with which it becomes a long range
instrument for development, integration and growth.
Because it is an added indicator, econometric techniques are used for the calculation of the
weightings of each variable considered in the analysis, specifically the Multivariate Analysis of main
components is used, as well as various options for data processing aimed at minimizing the errors
brought by information gathering and data handling from the primary source that somehow might
generate distortions in the indicator.
The document was written and thought to give a summarized and simple vision to the reader of
the way to formulate the index and its main conclusions, so it accounts for how the results are
obtained and opens a way towards possible new incorporations and poses the next steps to follow
for future updating. The document is divided into: Chapter I, which presents a brief review of the
forms that integration can take on, conceptually and in its different stages or phases, a description
of the sub regional integration mechanisms, subjects of this study, and an excerpt of some existing
indicators within and outside the region. Chapter II, which contains a description of what the
Integration Index of Latin America and the Caribbean is, as created by SELA, its structure and the
way in which the variables that formed it have been categorized. Chapter III is dedicated to
explaining the estimation methodology of the index, and its data processing. Chapter IV presents
the main results obtained from the study. And lastly, the document presents the Conclusions.

Permanent Secretariat Intra-Regional Relations
6
CHAPTER I. Integration as a process and as a situation
The integration of several countries is a complex process that carries not only economic, but
also political, legal and social consequences.
According to Balassa (1961), the word "integration" in its everyday use refers to the union of parts
within a whole. However, the term "economic integration" does not have a precise and universally
accepted meaning, because the reasoning about the elements that set out a true economic
integration varies very much. Therefore, economic integration should be understood as a process
that includes the different forms of international cooperation and social integration, whereas for
others, the pure existence of trade relations between two countries is a synonym of integration.
The definition of economic integration of Balassa (1961) is understood as a process and as a
situation. As a process, when considering the dynamism in decision-making aimed at the abolition
of any sign of discrimination between economic units pertaining to different countries; and as a
situation, when evaluating at any given time the absence of a form of discrimination between
national economies. In this way, it is implied that a greater fluidity of the institutional,
entrepreneurial and state relations between one or more countries is the natural counterpart of all
integration process (Urrutia, 2011); whose success additionally depends on the political, economic
and social will of the countries.
Perhaps a more standard definition corresponds to those that interpret economic integration as a
process through which a group of countries eliminate certain economic barriers between them,
where the different types of economic borders that separate markets, as well as the commitments
made by the participating countries, lead to different forms or phases of integration
(Maesso, 2011). In any case, integration is considered as a useful mechanism facing new conditions
of international competitiveness. It is conceived as an instrument for the promotion of
international trade and to confront the challenges of economic and financial globalization.
Integration has been adapted to the dominant economic logic, whose pillars are external opening
and insertion into global markets (Briceño, 2011). This document will assess the forms of economic
integration, according to the adopted schemes between more than two countries or between
groups, and will review the degrees reached, in accordance with each goal or aim originally
proposed in their creation.
1. Stages of integration
Thus, according to the goals of each integration mechanism, integration between two or
more countries can be described in accordance with the following phases or stages:
Free Trade Area
This phase refers to the free circulation of merchandise between the countries that form it.
This mobility is carried out through the elimination of tariff and non-tariff barriers in trade, for
exports and imports of the products coming from economies belonging to the free trade area. It
should be noted that each one of the member countries maintains its own tariff policy for the
countries that are not part of the free trade area.

Integration Index for Latin America and the Caribbean SP/CL/XLII. O/Di N° 1-16
7
7
[Capte la atención de los lectores mediante una cita importante extraída del documento o utilice este
Customs Union
In this phase of economic integration, the member countries continue with the adoption of
a common external tariff, which translates into the establishment of common external barriers
vis-à-vis the rest of the world. This phenomenon brings along the need for coordination of trade
policy of the Member States of the Customs Union.
Common Market
When the customs union eliminate barriers, not only for the movements of merchandise but
also production factors, it becomes a common market characterized by the free circulation of
merchandise, services, capital and people. Therefore, in this stage of the process of integration
there should not be any type of restriction or barrier at the entry or exit of the production factors
in any of the States that form the common market.
Economic Union
Once that the countries allow the free mobility of the production factors between them, that
is that they form a common market, the next step in the process of integration is the coordination
and harmonization of the policies of the member countries aiming at favouring regional
development and reducing internal asymmetries.
Economic Integration
This is the last phase of the process of integration; it supposes compliance with each one of
the previous phases joined with the existence of a unique supranational authority that coordinates
each one of the Member States.
It should be noted that the decision of a country to join an integrating process resides in the
comparative advantages that this country gains, obtaining a higher level of well-being, speeding
up the processes of negotiation between the countries, improving the processes of
industrialization and direct foreign investment among others. Although these are the economic
reasons of integration, there are other consequences in the processes of integration, which can
have a social, political or simply strategic nature.
2. Subregional Integration Mechanisms
In Latin America and the Caribbean there are five integration mechanisms that according to
their constitutive treaties have as a goal to move forward through the various phases of
integration, although with different emphasis as regards the priorities or features that such process
should assume.
Pacific Alliance (PA): This mechanism is formed by four (4) countries, namely Chile, Colombia,
Mexico and Peru. It is the most recent subregional integration project in Latin America. This
initiative has as a background the free trade agreements of the member countries and its goal is to
deepen integration in this trade block by means of an opening-up vision of their economies
through the liberalization of the flows of trade, goods and investments. Therefore, the search for
an area of deep integration implies to create an area of free circulation of goods, services, capital,
and people, and improve the insertion into global markets.

Permanent Secretariat Intra-Regional Relations
8
Caribbean Community (CARICOM): In accordance with the Chaguaramas Treaty, the member
countries of CARICOM agreed on the promotion of a "functional integration" that implied policy
harmonization in key sectors such as transport, communications, health, education, agriculture
among other aspects related with the creation of a common market. This integration mechanism is
the one that gathers the largest number of countries, 15 in total: Antigua and Barbuda, Belize,
Bahamas, Barbados, Dominica, Grenada, Guyana, Haiti, Jamaica, Saint Kitts and Nevis, Saint Lucia,
Saint Vincent and the Grenadines, Suriname, Montserrat and Trinidad and Tobago.
Andean Community (CAN): The principles of the Cartagena Agreement include the mandate for
the creation of a customs union and a common capital and labour market. For this purpose, the
member countries of this mechanism have as a common goal the harmonization of economic and
social policies, channelling internal and external resources of the subregion to promote investment
financing, attaining the free circulation of the human factor, the development of programmes of
cooperation in science and technology and the acknowledgement of the higher education
degrees. On the other hand, the decision on the liberalization of financial services will be discussed
in 2017. CAN is formed by Bolivia, Ecuador, Colombia and Peru; these last two are members at the
same time of the Pacific Alliance.
Common Market of the South (MERCOSUR): This integration mechanism is formed by five (5)
countries, namely Argentina, Brazil, Paraguay, Uruguay and Venezuela. The Asunción Treaty of
1991 envisages the following objective: "the free circulation of goods, services and production
factors between countries". Nevertheless, the protocols have not entered into force. Even so,
efforts have been made towards the harmonization of social, labour and migratory policies aimed
at allowing for the free mobility of jobs, residency, right to work and equal treatment. In addition,
the common external tariff is in force between the member countries of MERCOSUR with the
exception of Venezuela.
Central American Integration System (SICA): The Central American Common Market (CACM) was
established with the signing of the General Treaty of Central American Economic Integration
(TGIECA). In this market, the aim is to enhance a free trade zone among the signatory countries,
which is intended to adopt a common tariff. As regards the efforts to facilitate trade in goods,
impressive progress has been made with the adoption of the common external tariff, whereas for
the free circulation of the workforce and taking advantage of human resources for development
programmes have been promoted for cooperation in science and technology, as well as
programmes for the acknowledgement of higher education degrees. The countries that make up
this mechanism are: Belize, Costa Rica, El Salvador, Guatemala, Honduras, Nicaragua, Panama and
the Dominican Republic.
3. Background
Although progress has been made the different regional integration mechanisms, it is
important to have tools that would allow for clearly quantifying the current status of the
integration processes. Therefore, there are several proposals that look for adding different types of
indicators statistically, in spite of using different methodologies, study period and number of
countries (Maesso, 2011). Within this context, we have identified the Migrant Integration Policy
Index (MIPEX), the European Union Economic Integration Index and the KOF Globalization Index.
The Migrant Integration Policy Index (MIPEX) consists of 167 policy indicators through which there
are estimated the level of integration of the immigrants and their opportunities for participation in
society. This tool has three editions, the first one was presented in 2004, and its main goal was to

Integration Index for Latin America and the Caribbean SP/CL/XLII. O/Di N° 1-16
9
9
[Capte la atención de los lectores mediante una cita importante extraída del documento o utilice este
close the gap of information on policies of migration, inclusion and civil citizenship for 15
countries in Europe.
The second edition of the MIPEX was made in 2007 in which, through six dimensions, there are
assessed the policies of immigrants for their access to full citizenship, access to labour market,
long-term residency, political participation, and discrimination. In addition, this edition of the
indicator had the participation of 25 organizations, like universities, research institutes, foundations
and nongovernmental organizations. In 2011, the third edition of the MIPEX emerged; it includes
31 countries and manages to assess 148 integration policies classified in 7 dimensions: mobility of
the labour market, family reunion, education, political participation, long-term residency, access to
nationality and anti-discrimination.
Later on, the last measurement of the MIPEX, made in 2014, has an additional dimension linked to
health. In this way, the indicator is made up by 8 dimensions and 167 policy indicators that allow
for a multidimensional vision of the opportunities of the immigrants in the countries assessed,
facilitating the process of policy assessment and identification of best practices in this area.
On their part, the countries of the European Union (EU) have an indicator that assesses the
economic relations of the member countries: the European Union Economic Integration Index,
developed by König and Ohr (2012). It should be noted that the main objective of the European
Union is to foster the economic links and promote the social and territorial development of their
member countries. However, there exists a meaningful heterogeneity in the economic structures
and performance of the countries, and because of this a composed indicator was developed to
measure the degree of economic integration of the member countries of the EU, additionally, the
tool analyses the existing time lag in the process of integration.
The EU index consists of 25 indicators, grouped in four (4) dimensions: First, the EU single market,
which assesses intra-regional trade, movement of capital and workforce. Second, EU homogeneity,
which deals with the level of convergence of the countries through indicators like per capita GDP,
labour costs, long-term interest rates, public debt, consumption tax and capital tax. Third, the EU
symmetry dimension, which gathers figures from the main macroeconomic variables, such as GDP
growth rate, inflation and unemployment. Fourth, a dimension called EU agreements, which
assesses the EU rule of law and the institutional participation.
Finally, a third index that quantifies, to a certain extent, integration processes is the KOF
Globalization Index, which makes an assessment of the proximity between regions, countries and
individuals localized in different continents. This index consists of three dimensions: economic
globalization, political globalization and social globalization. The first one, just like the EU
integration index, assesses trade in goods, services and capital, highlighting the existence of trade
barriers and restrictions to foreign capital. The political dimension analyses the degree of
cooperation between countries and the participation in international organizations and treaties, as
well as the democratization and the respect from governments for the dissemination of ideas. The
social dimension includes indicators linked with the freedom of information, quality of life of
inhabitants and cultural proximity. The data is available for 207 countries and covers the period
1970-2013.

Permanent Secretariat Intra-Regional Relations
10
CHAPTER II. Integration Index for Latin America and the Caribbean (IINTALC)
The Integration Index of Latin America and the Caribbean (IINTALC) is a multidimensional indicator
to assess the progress made by each country in its respective regional integration mechanism. The
tool has five dimensions: economic, political, social, cultural and environmental, in this way aspects
linked with the economic performance are addressed such as intra mechanism trade, trade
opening, but also there are assessed aspects related with the institutional dynamics, environmental
sustainability, poverty, access to basic services and life conditions.
The IINTALC thus becomes a pioneering tool for the region, which quantifies the progress of the
integration processes according to their constitutive goals, facilitating in this way the identification
of opportunities and time lags in the dynamics of the countries, aimed at the optimization of
decision-making processes to promote the full integration of the nations.
1. Structure of the IINTALC
Chart 1 shows the five global dimensions with which the Index was organized during its
formulation.
CHART 1
Structure of the IINTALC
Source: Prepared by the authors.
Economic Dimension: Just as other indicators that quantify the degree of connection and
homogeneity between countries, the IINTALC quantifies the degree of convergence of the
members of an integration mechanism. Thus, variables such as intra mechanism trade, trade
opening, trade concentration (Herfindahl Index), and economic complexity will allow for inferring
the degree of trade complementarity of the countries. In addition, the analysis of the evolution of
the main macroeconomic variables like inflation, public debt, public expenditure, allows knowing
how the macroeconomic environment influences the processes of convergence at the inside of the
integration mechanism.

Integration Index for Latin America and the Caribbean SP/CL/XLII. O/Di N° 1-16
11
11
[Capte la atención de los lectores mediante una cita importante extraída del documento o utilice este
Political Dimension: Along with the economic variables, it is necessary to assess the institutional
quality of the countries. It should be noted that homogeneous and sound policies facilitate, to a
certain extent, the decision-making processes and speed up the implementation of policies that
would favour and put energy into the economic and social relations between countries. The
political dimension is constituted by indicators that measure the control of corruption, government
effectiveness, political stability, regulatory quality, rule of law and accountability.
The inherent complexity of regional integration is increased due to the problems presented by the
international economic political situation. On the other hand, there are differences in regard to the
role that each country defines for the integration policy, because this depends on the conceptions,
goals and modes of carrying out the integration processes. Within this framework, the political and
economic dimensions are mutually influenced. Trade policy should not only result compatible with
the demands of the economic theory and praxis, but it will have to adapt itself to different political
criteria.
Social Dimension: One of the common and essential goals of the integration mechanisms in Latin
America is to promote the free circulation of people between countries. But this should be done
considering several aspects related with health, education and income. Therefore, the IINTALC
considers the assessment of variables such as: life expectancy at birth, public expenditure in health
and education, poverty, destitution, unemployment, per capita GDP, and neonatal mortality,
among others.
Environmental Dimension: It is acknowledged the need for addressing the economic
development from a sustainable standpoint. So the environmental dimension is positioned in the
same "value" plane as the economic and social topics. This aimed at considering the design and
implementation of public policies and, in particular, sectorial policies that would promote the
development of "green" economies. Therefore, it is necessary a greater and more effective
inter institutional collaboration, the intensification of job networks and the strengthening of
synergies between the member countries of the integration mechanisms. The indicators addressed
in this dimension are: intensity in fertilizer use, emissions of carbon dioxide, GDP energy intensity
and consumption of ozone-depleting substances.
Cultural Dimension: Although each one of the Latin American and Caribbean countries has its
own cultural taxonomy, there are points of coincidence. The consideration of these aspects can
facilitate the insertion of the human factor and the creation of new markets, promoting in this way
the integration process of the nations. Therefore, the cultural dimension includes indicators linked
with the access to information technology, the dynamics of the tourism sector and trade in intra-
mechanism cultural goods.
2. Categorization of information
To calculate the Integration Index for the mechanisms of Latin America and the Caribbean, it
was necessary to use a large number of variables and indicators. First of all, it was decided to
categorize the data in five dimensions: economic, social, political, cultural and environmental. Each
one of these dimensions, considered for all the countries, consists of a set of variables and
indicators that encompasses the period 1990-2014.
Table I presents a brief description of the indicators that are grouped in each one of the
dimensions used.

Permanent Secretariat Intra-Regional Relations
12
Table 1
Description of the indicators1 Dimension Indicator Description
Policy Control of Corruption Index on the perception in which public power is exerted for private benefit.
Government Effectiveness
Index on the perception of the quality of public services, administration, degree of independence from political pressure, quality of policy formulation and application, and the credibility of the government's commitment to those policies.
Political Stability
Index on the perception of the probability of political instability and/or violence.
Regulatory Quality
Index on the perception of the government capacity to formulate and apply correct policies and regulations that would allow and promote the development of the private sector.
Rule of Law
Index on the perception in which the agents trust when complying with the rules of society, the quality of execution of contracts, property rights, the police and the courts.
Accountability
Index on the perception in which citizens can participate in the governmental elections, as well as the freedom of expression, freedom of association and free mass media.
Environmental Intensity in fertilizer use Percentage of tons per 1,000 hectares of cultivatable land.
CO2 Emissions Tons of CO2
GDP energy intensity
Total energy consumption in thousands of oil equivalent barrels per GDP $ million (constant prices in 2010).
Consumption of ozone-depleting substances Tons of ozone-depleting potential (ODP).
Cultural Internet Users Rate per 100 inhabitants.
Mobile Phone Users Rate per 100 inhabitants.
Computer Users Rate per 100 inhabitants.
Tourism International tourism received as a percentage of total exports.
Exports of intra mechanism cultural goods Exports of cultural goods of each country as a percentage of the total exports of these goods made by each mechanism.
Imports of intra mechanism cultural goods
Imports of cultural goods of each country as a percentage of total imports of these goods made by each mechanism.
Social Life expectancy at birth Years.
Public expenditure in health Public expenditure in health as a GDP percentage.
Neonatal mortality Neonatal mortality rate per 1000 per live births.
Public expenditure in education Public expenditure in education as a percentage of Gross Domestic Product.
Poverty
Destitution
Improving water services Improved water supply as a percentage of population with access to safe water.
Teenage fertility Live births per 1000 women 15 to 19 years of age.
Unemployment Unemployment rate.
Employment in agriculture
Workers employed in the agricultural sector as a percentage of total employment.
Employment in industry Workers employed in the industrial sector as a percentage of total employment.
Employment in services Workers employed in the service sector as a percentage of total employment.
GDP per capita GDP per capita at current prices
Economic Intra mechanism exports Exports of intra mechanism goods and services of each country as a percentage of total exports.
Intra mechanism imports
Imports of intra mechanism goods and services of each country as a percentage of total imports.
Trade opening Exports plus imports as a share of the Gross Domestic Product.
Net terms of trade Index of net terms of trade (2000 = 100).
HH concentration index Market concentration index of Herfindahl and Hirschman.
Cross-border trade Time and costs associated with the process of merchandise exports and imports.
Total public debt Total public debt as a share of the Gross Domestic Product.
Inflation Annual variation of the consumer price index.
Gross capital formation
Gross capital formation as a percentage of the Gross Domestic Product.
Economic Complexity Index
Index that classifies exports according to their level of complexity and diversity.
Total Public Expenditure Total public expenditure as a share of the Gross Domestic Product.
Source: Prepared by the authors.
1 For more details about the sources consulted, see Annex 1.

Integration Index for Latin America and the Caribbean SP/CL/XLII. O/Di N° 1-16
13
13
[Capte la atención de los lectores mediante una cita importante extraída del documento o utilice este
The study considered a total of 5 dimensions and 40 indicators. The statistical information used
comes from international organizations with a wide experience in data processing and gathering:
the World Bank, the Inter-American Development Bank, the International Monetary Fund, and the
Economic Commission for Latin America and the Caribbean (ECLAC). Although these sources have
the indicators required by the index, there were certain limitations due to the fact that some
variables are not available for all the countries of the study and/or the time range considered. The
opportunity of choosing the indicators that adjust with greater precision to the research work is
rather low, working with little information and a reduced range of indicators becomes a major
limitation to do the job.
CHAPTER III. MEASURING THE IINTALC
1. Dealing with missing data
There is a wide range of literature on the treatment of samples when the variables are not
completely visible, Kohn and Ansley (1986) explain how to estimate, foresee and interpolate
missing data from uni-variable models. Anderson and Moore (1979), and De Jong (1989) use
algorithms of smoothing for the process of interpolation values that are obtained by filtering.
In the statistics data base considered in this document, there are series with missing information
for certain years, and it was therefore decided, for maximum use of the missing information, to
proceed with interpolating the years with information gaps. It was by the use of the econometric
technique, known as status space, using an interpolation algorithm known as fixed interval
smoothing, that completion of all the information for the data base was accomplished.
This document pays special attention to the use of these algorithms to interpolate missing data
inside the sample, in the cases where it is reduced, and can therefore be calculated based on the
information provided by the rest of the data, in such cases, the predictor in finite sample is defined
by a projection originated inside the set of variables observed.
In a structural equation system where we assume that the variables observed it is not the m
components of the vector ,tz but only the
m components of the vector ,t so that:
ttt zH =
Where t represents that proportion observed.
The objective is to calculate that proportion of information that is not observed and obtain
a model from the data that is observed.
Some possibilities that arise are:
1. When 0,=
tH the m observations are absent for the period of time t .
2. When 0= 1mt IH
the latter 1mm
components of the vector tz are not
observable.
3. When H is given by the expression:

Permanent Secretariat Intra-Regional Relations
14
1
1
0
0=
mm
m
tI
iH
where 1mi is a vector line of 1m ones.
Means that the sum of the first 1m components of the vector tz
and the remaining
)( 1mm components are observed.
The resolution of this system is carried out by the methodology of State Space with methods of
numeric optimization and with the use of the verisimilitude function. For a technical briefing, see
Annex 17.
2. Methodology
a. Standardization
The first step towards the construction of the index is to standardize the information in such
a way so as to work them in bloc, and avoid the different measuring units in which the data is
originally received. One of the forms of normalization, commonly known as series standardization,
which allows data structuring in a precise manner in order to represent the relations between the
observations inside a given variable, thus transforming the data to a common level. In this case, it
is assumed that the data is distributed as a normal with a zero media and variance equals to the
unit (DX~N(μ;σ)).2
This standardization process, obtained by all the indicators in each integration mechanism, was
carried out by the following transformation:
Where X represents the values of each indicator of the country in the year t, μ and σ are the media
and standard deviation, respectively, from the series for each indicator corresponding to the
member countries of each integration mechanism J in the period T, spanning the sample 1990-
2014.
b. Ponderation
IINTALC being an aggregate index, it is necessary to take into consideration that, in the
analysis, different types of variables are included, with differences in their importance within the
sector to which they belong and also the notable differences between the countries of the region.
Thus the procedure for aggregation should be carefully considered and agreed upon, especially
with regard to the ponderations of each variable in its corresponding dimension. Sometimes the
selection of these ponderations occurs by incorporating the judgment of the researcher who
somehow has experience in this type of analysis; however, the use of this approach itself runs the
risk of falling into subjectivities and therefore in simplifications that result in contradictions from
the point of view of the theory and/or inappropriate results on the underlying empirical behaviour
of the data, thus diverting the understanding of what really happened.
2 It is worth mentioning that various forms of standardization of the series were tested and reasonable results were not
obtained for the index.

Integration Index for Latin America and the Caribbean SP/CL/XLII. O/Di N° 1-16
15
15
[Capte la atención de los lectores mediante una cita importante extraída del documento o utilice este
In order to add, in an optimum way, the variables comprising IINTALC, these were statistically
pondered according to their relevance in each dimension, so that the ponderations collect both
their own characteristics of the data as well as the underlying theoretical framework. The end result
is that the ponderations reflect the relative importance for integration of the indicators and
dimensions into each mechanism (OECD and JRC, 2008).
The statistical method used to obtain the ponderations was Multivariate Analysis using the
Principal Component Analysis technique (PCA). This technique was initially developed by Karl
Pearson in the late XIX century and was later strengthened by the statistician Harold Hotelling in
1933; indicating that, to study the relationships that occur between p correlated variables
(containing common information) the original set of variables can be transformed into another set
of new variables not correlated with each other (thereby lowering or eliminating repetition or
redundancy of information) called principal components set.
c. Main Components
From n observations of p variables, the objective of the analysis of main components is to
verify if it is possible to adequately represent this information with a lower number of variables,
built as lineal combinations from the originals. This is the mathematic technique that does not
require the assumption of multivariate normality of the data, although, if the latter is carried out, a
more profound interpretation can be given to said components. Its utility is double: 1) It allows for
optimum representation in a small space, observations of a general space with p-dimensions. In
this sense, the analysis of main components is the first step to identifying the possible latent or
unobserved variables that generate the data; and 2) It allows for transformation of the original
variables, which are generally correlated, into new non-correlated variables, facilitating
interpretation of the data.
In academic literature, the analysis of main components is used in different ways in the
development of composed indicators. Some studies such as Lockwood (2001), Gwartney and
Lawson (2001) and Dreher (2006) use PCA to obtain the weights of the first component,
independently of the general aptness of the data set, from the size of their own values and from
the weight of the factors of the remaining components (König y Ohr, 2012).
In contrary, this study uses the PCA in like manner as that carried out by König and Ohr (2012),
Noorbakhsh (1998) and Nicoletti et al. (000), where information provided by the data is considered
both before and after applying PCA. In this approach, the correlation structure of the data set is
considered in order to assess the suitability of the indicators used in the PCA. The components
obtained are analysed in order to derive the optimum size of the components retained and; finally,
the rotation of the weights of the factors were analysed in order to assign adequate ponderations
to each one of the indicators. In the same way as König and Ohr (2012), the oblique rotation used
enables the correlations among the factors to take into account the nature of the variables in a
more realistic manner.
d. Statistical tests
The following table shows the results by Coefficient Alpha mechanism, initially developed by
Cronback (1951), to estimate the reliability of the measuring instruments through internal
consistency analysis of the compound punctuations; the Bartlett sphericity test which is used to
test whether k samples come from populations with the same variance, to the same variances
through the samples called homoscedasticity or homogeneity of variances; and the adequacy
Permanent Secretariat Intra-Regional Relations
16
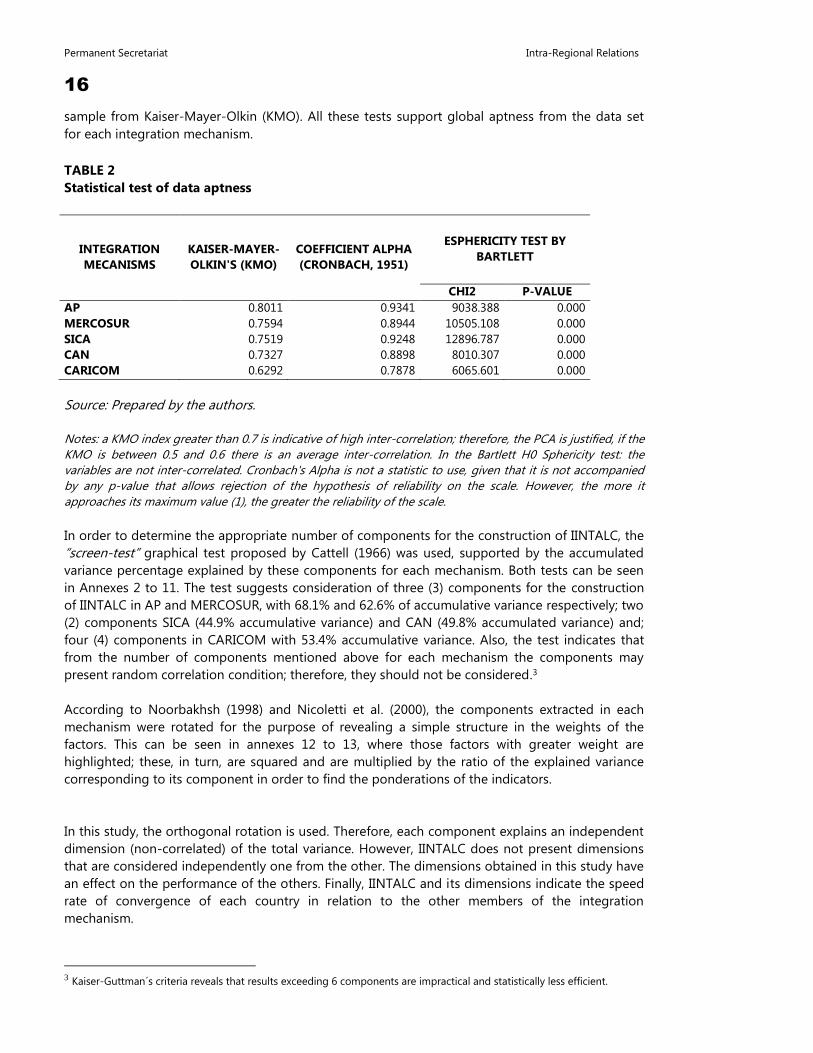
sample from Kaiser-Mayer-Olkin (KMO). All these tests support global aptness from the data set
for each integration mechanism.
TABLE 2
Statistical test of data aptness
INTEGRATION
MECANISMS
KAISER-MAYER-
OLKIN'S (KMO)
COEFFICIENT ALPHA
(CRONBACH, 1951)
ESPHERICITY TEST BY
BARTLETT
CHI2 P-VALUE
AP 0.8011 0.9341 9038.388 0.000
MERCOSUR 0.7594 0.8944 10505.108 0.000
SICA 0.7519 0.9248 12896.787 0.000
CAN 0.7327 0.8898 8010.307 0.000
CARICOM 0.6292 0.7878 6065.601 0.000
Source: Prepared by the authors.
Notes: a KMO index greater than 0.7 is indicative of high inter-correlation; therefore, the PCA is justified, if the
KMO is between 0.5 and 0.6 there is an average inter-correlation. In the Bartlett H0 Sphericity test: the
variables are not inter-correlated. Cronbach's Alpha is not a statistic to use, given that it is not accompanied
by any p-value that allows rejection of the hypothesis of reliability on the scale. However, the more it
approaches its maximum value (1), the greater the reliability of the scale.
In order to determine the appropriate number of components for the construction of IINTALC, the
“screen-test” graphical test proposed by Cattell (1966) was used, supported by the accumulated
variance percentage explained by these components for each mechanism. Both tests can be seen
in Annexes 2 to 11. The test suggests consideration of three (3) components for the construction
of IINTALC in AP and MERCOSUR, with 68.1% and 62.6% of accumulative variance respectively; two
(2) components SICA (44.9% accumulative variance) and CAN (49.8% accumulated variance) and;
four (4) components in CARICOM with 53.4% accumulative variance. Also, the test indicates that
from the number of components mentioned above for each mechanism the components may
present random correlation condition; therefore, they should not be considered.3
According to Noorbakhsh (1998) and Nicoletti et al. (2000), the components extracted in each
mechanism were rotated for the purpose of revealing a simple structure in the weights of the
factors. This can be seen in annexes 12 to 13, where those factors with greater weight are
highlighted; these, in turn, are squared and are multiplied by the ratio of the explained variance
corresponding to its component in order to find the ponderations of the indicators.
In this study, the orthogonal rotation is used. Therefore, each component explains an independent
dimension (non-correlated) of the total variance. However, IINTALC does not present dimensions
that are considered independently one from the other. The dimensions obtained in this study have
an effect on the performance of the others. Finally, IINTALC and its dimensions indicate the speed
rate of convergence of each country in relation to the other members of the integration
mechanism.
3 Kaiser-Guttman´s criteria reveals that results exceeding 6 components are impractical and statistically less efficient.

Integration Index for Latin America and the Caribbean SP/CL/XLII. O/Di N° 1-16
17
17
[Capte la atención de los lectores mediante una cita importante extraída del documento o utilice este
CHAPTER IV. RESULTS
This chapter presents the general results of INTALC and its dimensions for each integration
mechanism during 2005, 2010 and 2014. These years provide a time range so as to observe the
possible existence of significant changes in the evolution of the index. Additionally, and for the
purpose of complementing the results, a cluster analysis was carried out with the same set of
indicators.
In principle, the most homogeneous countries are more likely to implement similar integration
methods based on common preferences (König and Ohr, 2012). Therefore, identification of the
groups of homogenous countries can increase the possibility of their committal, in a flexible
manner, to the integration process of the agreement to which they belong. To identify the group
of homogenous countries, in each mechanism, an analysis of the hierarchical cluster was carried
out (through Ward grouping) using the same set of indicators that was used to calculate the
IINTALC.
The cluster analysis allows for identifying those countries that are most closely interlinked. To this
end, squared Euclidian distances were used to group the Member States. The results of this
analysis are provided in the dendrograms for the years 2010 and 2014.
Pacific Alliance (PA)
Table 3 shows the results of IINTALC for the member countries of the Pacific Alliance. Chile
is in the lead with a rating of 71.86 followed by Colombia (64.95), Peru and Mexico with 60.37 and
57.77 points, respectively. The results of IINTALC for 2005 and 2010 reflect that Chile has been the
country that has recorded the highest ratings of the indicator. However, Colombia and Peru
showed the most notable progress recording variations of 20.5% and 18.0% respectively during
the period considered.
The methodology of the main components used for the calculation of the ponderations of the
indicators used in building IINTALC showed that the social and economic dimensions are the most
relevant for the Pacific Alliance, representing 29% and 28%, respectively, (See Annex 12).
The results by country show a heterogeneous panorama, Chile being the country that obtained the
highest ratings in the social and political dimension, thus favouring its performance in the final
indicator, whereas Colombia exhibited the best ratings in three dimensions: economic,
environmental and cultural positioning itself in second place within the group of countries.
Meanwhile, Mexico obtained the lowest values of the mechanism, specifically in the dimensions:
environmental and economic.

Permanent Secretariat Intra-Regional Relations
18
TABLE 3
Results from IINTALC in the PA
COUNTRY YEARS DIMENSIONS
IINTALC ABSOLUTE
VAR. RELATIVE
VAR. POLITICAL ENVIRONMENTAL CULTURAL SOCIAL ECONOMIC
CHILE
2005 55.86 49.65 50.80 54.75 51.22 62.28
2010 55.75 50.57 52.12 56.92 52.13 67.49 5.21 8.4%
2014 55.68 51.99 53.11 58.81 52.27 71.86 4.37 6.5%
COLOMBIA
2005 47.32 52.11 48.78 49.60 52.38 50.19
2010 48.09 53.58 52.33 52.49 54.00 60.50 10.31 20.5%
2014 48.65 53.04 54.42 54.52 54.32 64.95 4.45 7.4%
MEXICO
2005 49.16 47.59 52.78 52.31 48.03 49.87
2010 48.81 48.37 52.76 54.37 49.71 54.01 4.14 8.3%
2014 48.66 49.02 53.62 55.60 50.87 57.77 3.76 7.0%
PERU
2005 47.58 52.22 48.66 47.42 51.09 46.98
2010 48.69 52.29 51.93 51.17 51.34 55.42 8.44 18.0%
2014 48.75 52.65 53.11 53.43 52.43 60.37 4.95 8.9%
Source: Prepared by the authors.
Note: Both the absolute and relative variations refer to the change between the years selected for
the general index (IINTALC).
The results of IINTALC for the countries of the Pacific Alliance prove the level of convergence of
the mechanism. In this regard, Chile and Columbia are the countries that are converging faster
towards the objectives of the mechanism with regard to their partners. In the case of the Pacific
Alliance, these objectives are aimed at a profound integration that contemplates the creation of an
area of free circulation of goods, services, capital, individuals and to facilitate the insertion of the
countries into world markets.
CHART 2
Dendrograms for PA, 2010-2014
Source: Prepared by the author.
Chart 2 shows how the existing heterogeneity among the countries of the bloc, identifying a
homogeneous group comprising Columbia and Peru which, by 2014, reduced their structural gap,
facilitating their integration. While Mexico and Chile are the countries showing greater differences
with regard to the other members accruing in 2014. However, Mexico and Chile are tending to
reduce the heterogeneity between them.
Common Market of the South (MERCOSUR)
In the case of the member countries of MERCOSUR, the results from 2014 show that
Uruguay is the country with the highest value of IINTALC, followed by Argentina, Brazil, Venezuela
and Paraguay. The evolution of the indicator for 2005 and 2010 indicates that Venezuela, despite
having the lowest rating of the bloc in 2005 and 2010, is the country undergoing the greatest

Integration Index for Latin America and the Caribbean SP/CL/XLII. O/Di N° 1-16
19
19
[Capte la atención de los lectores mediante una cita importante extraída del documento o utilice este
variations on the indicator. It is noteworthy that it was in 2012 when Venezuela became a full
member of the mechanism.
The dimensions with greatest relevance for MERCOSUR, according to the methodology used in
building IINTALC, are economic and social with ponderations of 28% and 25% respectively. (See
annex 13). The political dimension has a weight of 18%, in which 16% is cultural and 12% is
environmental. This ponderative structure enabled Uruguay to obtain the highest final rating,
registering favourable ratings in the political, environmental, social and economic dimensions
while, with regard to the cultural dimension, it ranks in fourth position.
Meanwhile, Argentina is the country showing the highest rating in the economic dimension in
2014, followed by Uruguay and Brazil. In the social area, the rating is led by Venezuela, Uruguay
and Argentina. In the case of Brazil, the results are heterogeneous. Even though the country
obtained favourable results in the cultural and political dimensions, the ratings registered in the
social and environmental sectors are among the lowest.
TABLE 4
Results from IINTALC in MERCOSUR
COUNTRY YEARS DIMENSIONS
IINTALC ABSOLUTE
VAR. RELATIVE
VAR. POLITICAL ENVIRONMENTAL CULTURAL SOCIAL ECONOMIC
ARGENTINA
2005 49.64 50.54 50.74 52.01 50.25 53.19
2010 49.34 50.85 52.80 54.61 51.58 59.19 6.00 11.3%
2014 48.65 50.69 53.17 54.94 52.90 60.35 1.16 2.0%
BRAZIL
2005 50.72 48.32 50.45 49.24 50.98 49.72
2010 51.80 47.32 53.19 53.01 51.23 56.56 6.85 13.8%
2014 50.88 46.10 55.06 54.32 51.77 58.13 1.56 2.8%
PARAGUAY
2005 46.20 50.09 48.22 46.83 52.84 44.18
2010 47.54 50.20 50.56 49.40 51.76 49.47 5.29 12.0%
2014 48.07 49.83 51.98 52.57 51.11 53.56 4.09 8.3%
URUGUAY
2005 54.84 52.94 49.45 54.29 51.69 63.20
2010 55.74 52.41 51.96 55.45 53.19 68.75 5.55 8.8%
2014 55.95 52.41 52.94 57.33 52.61 71.23 2.48 3.6%
VENEZUELA
2005 45.15 48.16 51.48 48.01 45.79 38.59
2010 43.53 47.65 52.54 55.05 45.92 44.69 6.10 15.8%
2014 42.96 48.48 54.25 61.31 49.06 56.05 11.36 25.4%
Source: Prepared by the authors.
Note: Both the absolute and relative variations refer to the change between the years selected for
the general index (IINTALC).
Overall, the results obtained by the member countries of MERCOSUR show that the integration
process of the group is led by Uruguay and Argentina, being the countries that are converging
faster towards the objectives of the mechanism with regard to their partners. It is noteworthy that
free circulation of factors among member countries is a principle of the Common Market of the
South.
On the other hand, the analysis of cluster enables identification of important structural similarities
between Argentina and Brazil as shown in the strong trade link between them. While the
heterogeneity with the rest of the member countries prevails both in 2010 and 2014, highlighting
the case of Venezuela which shows the greatest structural differences with its partners.

Permanent Secretariat Intra-Regional Relations
20
CHART 3
Dendrograms for MERCOSUR 2010-2014
Source: Prepared by the authors.
Andean Community (CAN)
The integration Index in the countries of the Andean Community is led by Peru, obtaining a
rating of 69.81 in 2014. However, the ratings of the CAN countries show the greatest similarities in
contrast to the results from the other integration mechanisms. In like manner, in 2014, the
developments of the indicator were similar in countries such as Ecuador, Bolivia and Columbia,
while Peru experienced a variation of 6.0%.
The main components technique showed as a result that the dimensions of greater relevance in
CAN are Social with a ponderation of 37%, Economy with a participation of 25%, followed by
Cultural (15%), Environmental (12%) and Political (11%). In the social area, the country with the
highest rating was Peru which had significant impact in its lead in the final rating of IINTALC.
Meanwhile, outstanding in the economic dimension, are the results obtained from Ecuador and
Bolivia that rank in first and second places, respectively.
In the case of the cultural dimension, the ratings are led by Colombia, followed by Ecuador and
Peru. In the environmental aspect, the results are homogeneous; the differences in the ratings are
relatively small. Finally, in the political dimension, Peru and Colombia are the countries registering
the best ratings.
TABLE 5
Results from IINTALC in CAN
COUNTRY YEARS DIMENSIONS
IINTALC ABSOLUTE
VAR. RELATIVE
VAR. POLITICAL ENVIRONMENTAL CULTURAL SOCIAL ECONOMIC
2005 49.43 51.45 48.03 46.71 50.21 45.83
BOLIVIA 2010 50.30 51.26 49.88 52.23 52.06 55.74 9.90 21.6% 2014 50.19 51.57 51.50 55.27 54.22 62.76 7.02 12.6%
2005 49.48 48.45 51.64 53.05 48.93 51.55
COLOMBIA 2010 50.75 48.56 54.62 56.29 50.71 60.93 9.38 18.2% 2014 51.49 49.48 56.28 59.44 52.14 68.82 7.89 13.0%
2005 48.48 49.93 49.49 50.69 50.76 49.34
ECUADOR 2010 48.70 49.39 53.85 54.78 53.78 60.50 11.16 22.6% 2014 49.74 49.34 55.98 58.22 54.49 67.78 7.28 12.0%
2005 50.85 50.76 49.81 52.10 51.44 54.96
PERU 2010 51.92 50.06 53.21 57.38 53.31 65.89 10.93 19.9% 2014 52.33 50.73 54.65 59.83 52.26 69.81 3.92 6.0%
Source: Prepared by the authors.
Note: Both the absolute and relative variations refer to the change between the years selected for
the general index (IINTALC).

Integration Index for Latin America and the Caribbean SP/CL/XLII. O/Di N° 1-16
21
21
[Capte la atención de los lectores mediante una cita importante extraída del documento o utilice este
The results obtained in IINTALC for the Andean Community show that, although Peru holds the
highest rating, the little difference between the ratings of this country and Columbia confirm that
the convergence process of both countries towards the objectives of the mechanism is accelerated
in contrast with Bolivia and Ecuador.
The cluster analysis of the Andean Community confirms the results of IINTALC, given that they
identify two groups of countries; the first comprising Columbia and Peru who have notable
homogeneous structures, which facilitates the integration process of these economies; the second
group is comprised by Bolivia and Ecuador, countries that, although they are similar, do so to a
lesser extent than the first group.
CHART 4
Dendrograms for the Andean Community 2010-2014
Source: Prepared by the author.
Central American Integration System (SICA)
Table 6 shows the results from IINTALC for the member countries of the Central American
Integration System, where Costa Rica is seen leading with a rating of 71.59, followed by Belize and
Panama with 70.18 and 69.40 points respectively. The results from IINTALC for 2005 and 2010
show that Costa Rica has been the country registering the best ratings of the indicator. However, El
Salvador and Panama showed the most significant progress, with variations of 11.8% and 10.7%
respectively during those years.
The main components methodology used for the calculation of the ponderations of the indicators
used in building IINTALC showed that the social and economic dimensions were the most relevant
for SICA, representing 38% and 25% respectively (See Annex 14).
Within this group of countries, Belize obtained the best results in the social and economic
dimensions, ranking in second place within the group of countries. However, the highest rating in
IINTALC came from Costa Rica who showed the best results in the political and cultural dimensions
which represented 16% and 13% of the total ponderations respectively. It should be noted that the
differences of the ratings between these two countries are insignificant, thus indicating the
reduced heterogeneity between these countries.
Meanwhile, the Dominican Republic and Guatemala obtained the lowest ratings of the mechanism,
specifically in the dimensions: environmental, social and economic which was a determinant in the
final result.

Permanent Secretariat Intra-Regional Relations
22
TABLE 6
Results from IINTALC in SICA
COUNTRY YEARS DIMENSIONS
IINTALC ABSOLUTE
VAR. RELATIVE
VAR. POLITICAL ENVIRONMENTAL CULTURAL SOCIAL ECONOMIC
BELIZE
2005 52.15 51.75 52.72 52.00 53.71 62.33
2010 50.91 51.79 53.10 57.49 53.68 66.97 4.64 0.07
2014 49.65 51.56 53.98 60.10 54.88 70.18 3.21 4.8%
COSTA RICA
2005 55.79 49.36 53.13 58.72 49.77 66.78
2010 56.38 49.79 53.30 60.65 49.93 70.05 3.27 4.9%
2014 56.69 49.68 54.74 59.56 50.92 71.59 1.54 2.2%
EL SALVADOR
2005 50.13 50.12 49.93 51.03 49.51 50.72
2010 50.98 50.20 50.65 53.60 51.25 56.69 5.98 11.8%
2014 51.10 49.96 52.77 55.47 50.83 60.12 3.43 6.1%
GUATEMALA
2005 46.54 48.29 48.70 48.47 48.31 40.32
2010 47.15 48.92 49.44 49.95 48.76 44.22 3.91 9.7%
2014 47.14 48.96 49.85 50.57 48.01 44.53 0.31 0.7%
HONDURAS
2005 47.06 49.46 48.64 48.32 51.74 45.22
2010 47.16 49.96 49.55 51.56 50.44 48.67 3.45 7.6%
2014 46.81 50.03 49.64 53.08 52.08 51.64 2.97 6.1%
NICARAGUA
2005 47.92 51.00 48.74 47.67 51.13 46.45
2010 46.84 51.00 48.81 50.64 49.93 47.23 0.78 1.7%
2014 47.77 50.81 49.41 52.81 50.36 51.16 3.93 8.3%
PANAMÁ
2005 51.94 50.42 50.02 54.33 54.51 61.21
2010 52.58 50.06 52.32 57.46 55.38 67.79 6.58 10.7%
2014 53.00 49.37 52.94 59.97 54.13 69.40 1.61 2.4%
DOMINICAN REPÚBLIC
2005 0.00 48.54 47.58 52.92 46.61 45.17
2010 48.76 47.18 52.50 47.45 47.55 43.44 -1.73 -3.8%
2014 50.32 46.91 53.29 48.46 48.18 47.16 3.72 8.6%
Source: Prepared by the authors.
Note: Both the absolute and relative variations refer to the change between the years selected for
the general index (IINTALC).
The results from IINTALC for the countries of SICA show the level of convergence of the
mechanism. In this sense, Costa Rica and Belize are the countries that are converging faster
towards the objectives of the mechanism with regard to their partners. In the case of SICA, these
objectives are aimed towards the creation of a free trade zone among the signatory countries,
proposing the adoption of a common tariff.
CHART 5
Dendrograms for SICA 2010-2014
Source: Prepared by the authors.
Chart 5 shows the heterogeneity among the countries of the bloc, identifying two homogeneous
groups for 2014. The first comprised by Nicaragua, Honduras, Guatemala and El Salvador and the
second comprised by the Dominican Republic, Panama, Costa Rica and Belize. It can be seen that
the first group was the one showing less heterogeneity for that year, highlighting the closeness
between Nicaragua and Honduras, while Belize was the country with less similarities with regard to
the other members in 2014.
Integration Index for Latin America and the Caribbean SP/CL/XLII. O/Di N° 1-16
23
23
[Capte la atención de los lectores mediante una cita importante extraída del documento o utilice este
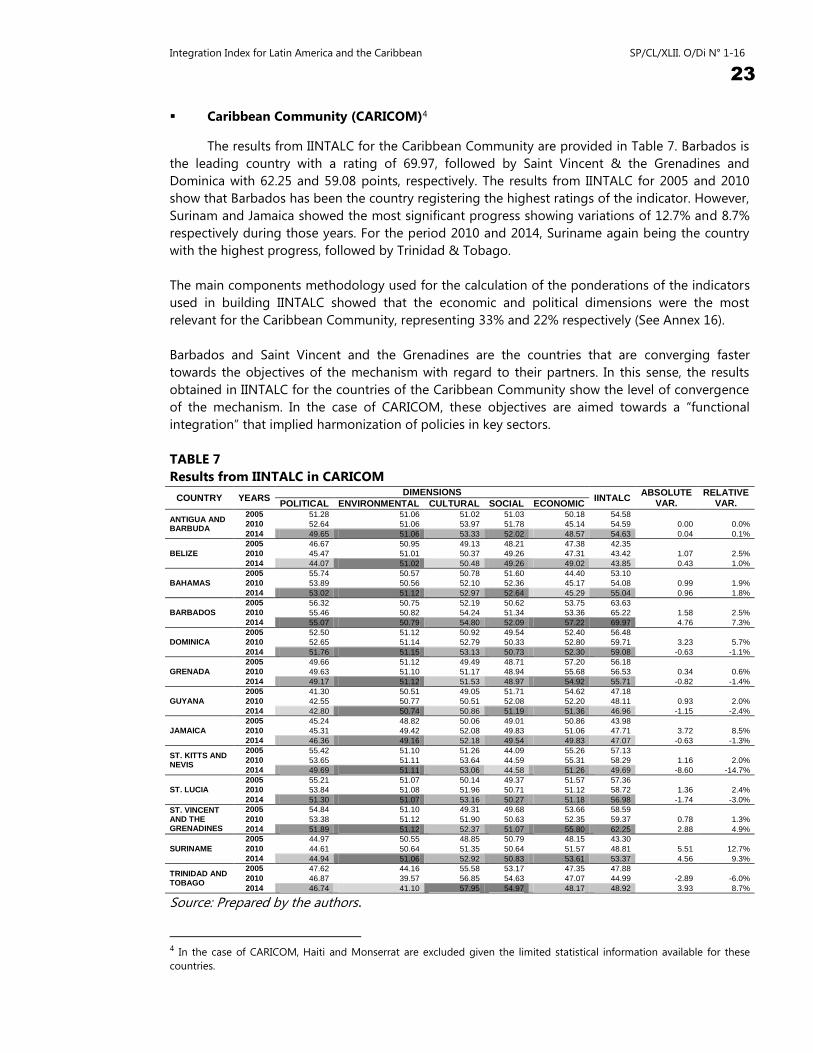
Caribbean Community (CARICOM)4
The results from IINTALC for the Caribbean Community are provided in Table 7. Barbados is
the leading country with a rating of 69.97, followed by Saint Vincent & the Grenadines and
Dominica with 62.25 and 59.08 points, respectively. The results from IINTALC for 2005 and 2010
show that Barbados has been the country registering the highest ratings of the indicator. However,
Surinam and Jamaica showed the most significant progress showing variations of 12.7% and 8.7%
respectively during those years. For the period 2010 and 2014, Suriname again being the country
with the highest progress, followed by Trinidad & Tobago.
The main components methodology used for the calculation of the ponderations of the indicators
used in building IINTALC showed that the economic and political dimensions were the most
relevant for the Caribbean Community, representing 33% and 22% respectively (See Annex 16).
Barbados and Saint Vincent and the Grenadines are the countries that are converging faster
towards the objectives of the mechanism with regard to their partners. In this sense, the results
obtained in IINTALC for the countries of the Caribbean Community show the level of convergence
of the mechanism. In the case of CARICOM, these objectives are aimed towards a “functional
integration” that implied harmonization of policies in key sectors.
TABLE 7
Results from IINTALC in CARICOM
COUNTRY YEARS DIMENSIONS
IINTALC ABSOLUTE
VAR. RELATIVE
VAR. POLITICAL ENVIRONMENTAL CULTURAL SOCIAL ECONOMIC
ANTIGUA AND BARBUDA
2005 51.28 51.06 51.02 51.03 50.18 54.58
2010 52.64 51.06 53.97 51.78 45.14 54.59 0.00 0.0%
2014 49.65 51.06 53.33 52.02 48.57 54.63 0.04 0.1%
BELIZE
2005 46.67 50.95 49.13 48.21 47.38 42.35
2010 45.47 51.01 50.37 49.26 47.31 43.42 1.07 2.5%
2014 44.07 51.02 50.48 49.26 49.02 43.85 0.43 1.0%
BAHAMAS
2005 55.74 50.57 50.78 51.60 44.40 53.10
2010 53.89 50.56 52.10 52.36 45.17 54.08 0.99 1.9%
2014 53.02 51.12 52.97 52.64 45.29 55.04 0.96 1.8%
BARBADOS
2005 56.32 50.75 52.19 50.62 53.75 63.63
2010 55.46 50.82 54.24 51.34 53.36 65.22 1.58 2.5%
2014 55.07 50.79 54.80 52.09 57.22 69.97 4.76 7.3%
DOMINICA
2005 52.50 51.12 50.92 49.54 52.40 56.48
2010 52.65 51.14 52.79 50.33 52.80 59.71 3.23 5.7%
2014 51.76 51.15 53.13 50.73 52.30 59.08 -0.63 -1.1%
GRENADA
2005 49.66 51.12 49.49 48.71 57.20 56.18
2010 49.63 51.10 51.17 48.94 55.68 56.53 0.34 0.6%
2014 49.17 51.12 51.53 48.97 54.92 55.71 -0.82 -1.4%
GUYANA
2005 41.30 50.51 49.05 51.71 54.62 47.18
2010 42.55 50.77 50.51 52.08 52.20 48.11 0.93 2.0%
2014 42.80 50.74 50.86 51.19 51.36 46.96 -1.15 -2.4%
JAMAICA
2005 45.24 48.82 50.06 49.01 50.86 43.98
2010 45.31 49.42 52.08 49.83 51.06 47.71 3.72 8.5%
2014 46.36 49.16 52.18 49.54 49.83 47.07 -0.63 -1.3%
ST. KITTS AND NEVIS
2005 55.42 51.10 51.26 44.09 55.26 57.13
2010 53.65 51.11 53.64 44.59 55.31 58.29 1.16 2.0%
2014 49.69 51.11 53.06 44.58 51.26 49.69 -8.60 -14.7%
ST. LUCIA
2005 55.21 51.07 50.14 49.37 51.57 57.36
2010 53.84 51.08 51.96 50.71 51.12 58.72 1.36 2.4%
2014 51.30 51.07 53.16 50.27 51.18 56.98 -1.74 -3.0%
ST. VINCENT AND THE GRENADINES
2005 54.84 51.10 49.31 49.68 53.66 58.59
2010 53.38 51.12 51.90 50.63 52.35 59.37 0.78 1.3%
2014 51.89 51.12 52.37 51.07 55.80 62.25 2.88 4.9%
SURINAME
2005 44.97 50.55 48.85 50.79 48.15 43.30
2010 44.61 50.64 51.35 50.64 51.57 48.81 5.51 12.7%
2014 44.94 51.06 52.92 50.83 53.61 53.37 4.56 9.3%
TRINIDAD AND TOBAGO
2005 47.62 44.16 55.58 53.17 47.35 47.88
2010 46.87 39.57 56.85 54.63 47.07 44.99 -2.89 -6.0%
2014 46.74 41.10 57.95 54.97 48.17 48.92 3.93 8.7%
Source: Prepared by the authors.
4 In the case of CARICOM, Haiti and Monserrat are excluded given the limited statistical information available for these
countries.

Permanent Secretariat Intra-Regional Relations
24
Note: Both the absolute and relative variations refer to the change between the years selected for
the general index (IINTALC).
It is important to note that the results obtained for the Caribbean Community lack sturdiness given
the limited statistical information available for these countries. As a result, it was imperative to
eliminate certain key and important indicators5 of the work methodology, implying possible
alterations in the results.
CHART 6
Dendrograms for CARICOM 2010-2014
Source: Prepared by the authors.
Chart 6 reveals the heterogeneity among the countries of the bloc for the years 2010 and 2014,
identifying three groups of countries with low heterogeneity. For the year 2010, the first group of
similar countries is comprised by Suriname, Guyana, Jamaica and Belize, the second comprising
Dominica, Grenada, Saint Lucia, Saint Vincent & the Grenadines and Barbados, and the last group
of homogenous countries comprising Saint Kitts & Nevis, the Bahamas and Antigua & Barbuda.
For the year 2014, generally, a greater heterogeneity is observed among the countries, bringing
about changes in those groups. Saint Lucia and Saint Vincent & the Grenadines in 2010 were two
very homogeneous countries and for 2014, despite them being similar, their structural gap
increased. The same happened with Trinidad & Tobago and Dominica, who, in 2014, showed
greater heterogeneity.
5 For the purpose of calculating the index in CARICOM, the following indicators were eliminated due to insufficient
statistical information available: energy intensity in GDP, computer users, poverty, homelessness, ECI, agricultural workers,
service employees, industry employees, and educational expenses, use of fertilizers, adolescent fertility, border trade,
tourism and unemployment.

Integration Index for Latin America and the Caribbean SP/CL/XLII. O/Di N° 1-16
25
25
[Capte la atención de los lectores mediante una cita importante extraída del documento o utilice este
CONCLUSIONS
The Integration Index of Latin America and the Caribbean measures the degree of
convergence of the countries conforming the integration mechanisms, by means of a quantitative
and multidimensional indicator. In this regard, the study shows that members of each mechanism
all have different levels of integration and different pace towards convergence, within their groups.
It should be noted, that this study represents a first step to measuring the level of integration of
Latin American and Caribbean countries. In this regard, for subsequent editions it is expected to
include new components and indicators, as well as the contrast with other methods of calculation
in order to raise the level of trust in the indicator. This investigation offers a solid theoretic and
statistic basis that will serve to support the discussions regarding the status and advancement of
the integration processes in the region.
In the case of the Pacific Alliance, Chile and Colombia are the countries with the fastest pace of
convergence. The performance achieved by Chile in the political and social dimension is
outstanding; while Colombia reached its highest values in the economic, environmental and
cultural dimensions. Mexico registered a significant gap with respect to the rest of the mechanism,
while Colombia and Peru are the countries with the largest structural proximity, which will enable
achievement of the constitutive objectives of their mechanism.
Meanwhile, in MERCOSUR, Uruguay registered the best performance in the dimensions considered
by the index, except with respect to the cultural indicators, which favours their convergence toward
the objectives of the mechanism. The remaining countries of the bloc, exhibited a heterogeneous
behaviour in all the dimensions. In the case of Venezuela, despite having the highest increases in
its scores, this has not allowed it to improve its position in the total result of the IINTALC. Brazil
and Argentina are the countries with the most structural similarities. In the case of the remaining
countries of the mechanism, for 2014, they showed significant heterogeneous nature, highlighting
the case of Venezuela.
The Andean Community is the mechanism with the least dispersion in the results of the index, led
by Peru, followed by Colombia, Ecuador and Bolivia. In the case of Peru, its performance in the
social and political dimensions was outstanding. With regard to Colombia, this was only seen in
the cultural dimension, Ecuador in the economy and Bolivia in the environment. The analysis of
Cluster has allowed us to identify two homogenous groups, on the one hand Colombia and Peru,
and on the other, Ecuador and Bolivia, although the latter at a lesser extent.
The Central American Integration System is characterized for having two groups of countries: the
first comprising Costa Rica, Belize and Panama with an average value of 70,39 and the second
integrated by Guatemala, Honduras, Nicaragua and the Dominican Republic, which average 48,62.
Meanwhile, El Salvador obtained a qualification of 60.12 points. However, the cluster analysis
showed that Honduras, Nicaragua, Guatemala and El Salvador showed the highest structural
homogeneity.
Finally, despite the fact that the results obtained for the Caribbean Community lack robustness,
given the little statistical information available, the cluster analysis showed three groups of
countries with structural similarities: the first comprising Saint Lucia, Saint Vincent and Grenadines,
Grenada and Barbados; the second consisting of Jamaica, Belize, Guyana and Suriname, and the
third group conforming Saint Kitts and Nieves, the Bahamas and Antigua and Barbuda.


Integration Index for Latin America and the Caribbean SP/CL/XLII. O/Di N° 1-16
27
27
[Capte la atención de los lectores mediante una cita importante extraída del documento o utilice este
A N N E X E S
METHODOLOGIES AND RESULTS


Integration Index for Latin America and the Caribbean SP/CL/XLII. O/Di N° 1-16
29
29
[Capte la atención de los lectores mediante una cita importante extraída del documento o utilice este
ANNEX 1
Description and sources of the indicators used in the IINTALC
Dimension Indicators Description Sources
Political
Control of Corruption Index on the perception in which the Government works for private benefit.
Worldwide Governance Indicators (WGI)
Government Effectiveness
Index on the perception of the quality of public services, the administration, the level of Independence from political pressure, the quality of formulation and application of policies, and the credibility of the commitment of the Government to these policies.
Worldwide Governance Indicators (WGI)
Political Stability Index on the perception of the probability of political instability and/or violence
Worldwide Governance Indicators (WGI)
Regulatory Quality Index on the capability of the Government to formulate and apply correct policies and regulations that allow and promote development of the private sector.
Worldwide Governance Indicators (WGI)
Estado de la Ley Index on the perception on which the agents trust in the compliance of the rules of society, the quality of execution of contracts, property rights, law enforcement and the courts.
Worldwide Governance Indicators (WGI)
Accountability Index on the perception that citizens can participate in governmental election, as well as freedom of expression, freedom of association and freedom of the press
Worldwide Governance Indicators (WGI)
Environmental
Intensity in the use of fertilizers
Percentage of tonnes per 1.000 hectares of agricultural land. ECLAC
CO2 Emissions Tonnes of CO2 ECLAC
Intensity of Energy on GDP
Total consumption of energy in thousands of barrels, equivalent to petroleum per millions of dollars of GDP (consistent prices from 2010).
ECLAC
Use of substances that may deplete the ozone layer
Tonnes of potential depletion of the ozone (PAO). ECLAC
Cultural
Internet Users Rate on every 100 inhabitants. World Bank
Cell phone Users Rate on every 100 inhabitants World Bank
Computer Users Rate on every 100 inhabitants World Bank
Tourism International tourism received as a percentage on the total exports. WITS-COMTRADE-BM
Exports of intra-mechanism cultural goods
Export of Cultural Goods of each country as a percentage of the total export of these goods for each mechanism.
COMTRADE
Imports of intra-mechanism cultural goods
Import of Cultural Goods of each country as a percentage of the total import of these goods for each mechanism...
COMTRADE
Social
Life expectancy at birth Years. World Bank
Public spending on health
Public expenditure on health as a percentage of the Gross Domestic Product.
World Bank
Infant mortality Infant mortality for every 1000 live birth. World Bank
Public spending on education
Public spending on education as a percentage of the Gross Domestic Product.
World Bank
Poverty Incidence rate of Poverty of $ 2 per day as a percentage Gross Domestic Product
World Bank
Extreme Poverty Incidence rate on poverty of $ 1.5 per day as a percentage of GDP World Bank
Improvement in the supply of water
Improvement in the supply of water as a percentage of the population with access to water.
World Bank
Fertility in adolescents Live births per 1000 women between 15 and 19 years. World Bank
Unemployment Unemployment rate. World Bank
Employment in Agriculture
Employment in the Agricultural Sector as a percentage of the Total Employment.
World Bank
Employment in Industry Employment in the Industry Sector as a percentage of the Total Employment.
World Bank
Employment in Services
Employees in the service sector as percentage of the Total Employment. World Bank
Per capita GDP GDP per capita at current prices International Monetary Fund
Economic
Intra-mechanism Exports
Export of intra-mechanism goods and services of each country as a percentage of the total export
International Monetary Fund
Intra-mechanism Imports
Import of intra-mechanism goods and services of each country as a percentage of the total import.
International Monetary Fund
Trade Opening Export plus import as a proportion of the Gross Domestic Product. International Monetary Fund
Net conditions for interchange
Index of net conditions of interchange (2000 = 100) WITS-COMTRADE-BM
Index of concentration of HH
Index on the concentration of the market of Herfindahl and Hirschman. IDB-Number for the Development
Trans border trade Time and cost associated with the process of import and export of merchandise.
Doing Business - Banco Mundial
Total public debt Total Public Debt in proportion to the Gross Domestic Product. International Monetary Fund

Permanent Secretariat Intra-Regional Relations
30
Inflation Annual variation of the consumer price index International Monetary Fund
Gross Formation of Gross Capital
Gross formation of capital as a percentage of the Gross Domestic Product.
World Bank
Index of economic complexity
Index that classifies exports according to their level of complexity and diversity.
Hausmann and Hidalgo (2012).
Total public spending Total Public Spending in proportion to the Gross Domestic Product.
International Monetary Fund
Source: Prepared by the authors.
ANNEX 2
Graphic test to select the number of components in the PA
Source: Prepared by the authors.
ANNEX 3
Eigenvalues and variance of the main components of the PA
Components Eigenvalue Difference Explained Variance (%) Accumulated Variance (%)
Comp1 14.477 7.07214 36.2 36.2
Comp2 7.40482 2.04148 18.5 54.7 Comp3 5.36334 1.76766 13.4 68.1 Comp4 3.59568 1.33686 9.0 77.1 Comp5 2.25883 0.804628 5.7 82.8 Comp6 1.4542 0.36545 3.6 86.4 Comp7 1.08875 0.084781 2.7 89.1 Comp8 1.00397 0.308393 2.5 91.6 Comp9 0.695574 0.116363 1.7 93.4 Comp10 0.579212 0.148946 1.5 94.8
. . . . .
. . . . .
. . . . . Comp40 0.00061734 - 0.0 100.0
Source: Prepared by the authors.

Integration Index for Latin America and the Caribbean SP/CL/XLII. O/Di N° 1-16
31
31
[Capte la atención de los lectores mediante una cita importante extraída del documento o utilice este
ANNEX 4
Graphic test to select the number of components in MERCOSUR
Source: Prepared by the authors.
ANNEX 5
Eigenvalues and variance of the main components of MERCOSUR
Components Eigenvalue Difference Explained Variance (%) Accumulated Variance (%)
Comp1 11.0212 2.7779 27.6 27.6
Comp2 8.24333 2.47537 20.6 48.2 Comp3 5.76796 1.70927 14.4 62.6
Comp4 4.0587 1.75361 10.2 72.7
Comp5 2.30508 0.616227 5.8 78.5
Comp6 1.68886 0.336743 4.2 82.7 Comp7 1.35211 0.322987 3.4 86.1 Comp8 1.02913 0.219819 2.6 88.7 Comp9 0.809309 0.0232435 2.0 90.7 Comp10 0.786066 0.209181 2.0 92.7
. . . . .
. . . . .
. . . . . Comp40 0.00099089 - 0.0 100.0
Source: Prepared by the authors.

Permanent Secretariat Intra-Regional Relations
32
ANNEX 6
Graphic test to select the number of components in SICA
Source: Prepared by the authors.
ANNEX 7
Eigenvalues and variance of the main components of SICA Components Eigenvalue Difference Explained Variance (%) Accumulated Variance (%)
Comp1 12.6395 7.34075 31.6 31.6 Comp2 5.2988 1.34571 13.3 44.9 Comp3 3.95309 1.03306 9.9 54.7 Comp4 2.92003 0.167786 7.3 62.0 Comp5 2.75225 0.738545 6.9 68.9 Comp6 2.0137 0.155926 5.0 73.9 Comp7 1.85778 0.674865 4.6 78.6 Comp8 1.18291 0.0649873 3.0 81.6 Comp9 1.11792 0.21613 2.8 84.3 Comp10 0.901793 0.113059 2.3 86.6
. . . . .
. . . . .
. . . . . Comp40 0.00595981 - 0.0 100.0
Source: Prepared by the authors.

Integration Index for Latin America and the Caribbean SP/CL/XLII. O/Di N° 1-16
33
33
[Capte la atención de los lectores mediante una cita importante extraída del documento o utilice este
ANNEX 8
Graphic test to select the number of components in the Andean Community
Source: Prepared by the authors.
ANNEX 9
Eigenvalues and variance of the main components of the Andean Community Components Eigenvalue Difference Explained Variance (%) Accumulated Variance (%)
Comp1 10.8303 1.75294 27.1 27.1
Comp2 9.07741 4.68977 22.7 49.8
Comp3 4.38764 0.0698395 11.0 60.7 Comp4 4.3178 1.46573 10.8 71.5 Comp5 2.85206 1.04941 7.1 78.7 Comp6 1.80266 0.215276 4.5 83.2 Comp7 1.58738 0.453851 4.0 87.1 Comp8 1.13353 0.381418 2.8 90.0 Comp9 0.75211 0.170061 1.9 91.9 Comp10 0.582049 0.0790671 1.5 93.3
. . . . .
. . . . .
. . . . . Comp40 0.00040794 - 0.0 100.0
Source: Prepared by the authors.

Permanent Secretariat Intra-Regional Relations
34
ANNEX 10
Graphic test to select the number of components in CARICOM
Source: Prepared by the authors.
ANNEX 11
Eigenvalues and variance of the main components of CARICOM
Components Eigenvalue Difference Explained Variance (%) Accumulated Variance (%)
Comp1 5.75476 2.80588 22.1 22.1 Comp2 2.94888 0.188038 11.3 33.5 Comp3 2.76084 0.340648 10.6 44.1 Comp4 2.42019 0.576814 9.3 53.4 Comp5 1.84338 0.26931 7.1 60.5 Comp6 1.57407 0.247169 6.1 66.6 Comp7 1.3269 0.135646 5.1 71.7 Comp8 1.19125 0.168076 4.6 76.2 Comp9 1.02318 0.194287 3.9 80.2 Comp10 0.828891 0.176255 3.2 83.4 . . . . . . . . . . . . . . . Comp26 0.044329 - 0.2 100
Source: Prepared by the authors.

35
Inte
gra
tion
Ind
ex fo
r Latin
Am
erica a
nd
the C
arib
bean
SP
/CL/X
LII. O/D
i N° 1
-16
[Capte la atención de los lectores mediante una cita importante extraída del documento o utilice este
ANNEX 12
Rotating factors and ponderations in the PA
Dimensions Indicators Promax Rotation * Weights of indicators** Total weight on Index (%) Weight on the dimensions (%)
Comp1 Comp2 Comp3 Comp1 Comp2 Comp3 Value Accumulated Value Accumulated
Political
Control of Corruption 0.195 0.038 -0.244 1.3 0.0 1.9 2.5
15
17
15
Government Effectiveness 0.209 -0.048 -0.193 1.6 0.1 1.2 2.1 14
Political Stability 0.194 -0.058 -0.222 1.3 0.1 1.6 2.1 14
Regulatory Quality 0.171 -0.001 -0.281 1.0 0.0 2.5 3.3 22
State of Law 0.223 0.026 -0.182 1.8 0.0 1.0 2.3 16
Accountability 0.231 -0.059 -0.136 1.9 0.1 0.6 2.5 17
Environmental
Intensity in the use of Fertilizers -0.232 -0.053 0.020 1.9 0.1 0.0 2.5
15
17
15 CO2 Emissions 0.003 0.333 -0.134 0.0 3.5 0.6 4.6 31
Energy Intensity in the GDP 0.100 0.080 0.339 0.4 0.2 3.6 4.8 32
Use of substances that could deplete ozone layer 0.109 0.278 0.055 0.4 2.4 0.1 3.2 21
Cultural
Internet Users 0.194 0.050 0.234 1.3 0.1 1.7 2.3
13
29
59 Cell phone users 0.186 0.052 0.257 1.2 0.1 2.1 2.8 35
Computer Users 0.185 0.036 0.258 1.2 0.0 2.1 2.8 36
Tourism -0.109 -0.027 0.024 0.4 0.0 0.0 0.6 10
41 Exports of intra-mechanism cultural goods -0.028 -0.126 0.163 0.0 0.5 0.8 1.1 20
Imports of intra-mechanism cultural goods 0.029 -0.300 0.022 0.0 2.8 0.0 3.8 69
Social
Life expectancy at birth 0.242 -0.097 0.041 2.1 0.3 0.1 2.8
29
14
69
Public spending on health -0.005 0.111 0.265 0.0 0.4 2.2 2.9 14
Infant mortality 0.229 -0.073 0.061 1.9 0.2 0.1 2.5 12
Public spending on education 0.097 -0.136 0.272 0.3 0.6 2.3 3.1 15
Poverty 0.239 -0.039 0.013 2.0 0.0 0.0 2.7 13
Extreme Poverty 0.221 -0.079 -0.013 1.7 0.2 0.0 2.3 11
Improvement in the supply of water 0.202 -0.088 0.060 1.5 0.2 0.1 1.9 9
Fertility in adolescents 0.210 0.153 0.014 1.6 0.7 0.0 2.1 10
Unemployment rate 0.031 -0.181 -0.059 0.0 1.0 0.1 1.4 15
31
Employment in agriculture 0.051 -0.214 0.046 0.1 1.4 0.1 1.9 22
Employment in industry 0.086 -0.041 -0.186 0.3 0.1 1.1 1.4 16
Employment in services -0.081 0.218 0.083 0.2 1.5 0.2 2.0 22
Per capita GDP 0.216 -0.125 0.133 1.7 0.5 0.6 2.2 25
Economic
Intra-mechanism exports 0.022 0.340 0.000 0.0 3.7 0.0 4.8
28
47
37 Intra-mechanism imports 0.065 0.266 0.133 0.1 2.2 0.6 3.0 29
Trade Openness 0.231 -0.068 -0.037 1.9 0.1 0.0 2.5 24
Net Terms for Exchanges 0.109 0.149 0.123 0.4 0.7 0.5 0.9 14
23 HHI Concentration Index 0.073 0.324 -0.092 0.2 3.3 0.3 4.4 69
Cross-border Trade 0.149 -0.074 0.005 0.8 0.2 0.0 1.1 17
Total Public Debt -0.186 -0.126 0.093 1.2 0.5 0.3 1.6 15
40
Inflation 0.131 0.030 0.156 0.6 0.0 0.8 1.0 9
Gross Formation of Fixed Capital 0.161 0.015 0.057 0.9 0.0 0.1 1.2 11
Economic Complexity Index -0.032 -0.330 0.110 0.0 3.4 0.4 4.5 41
Total Public Spending -0.021 0.025 0.251 0.0 0.0 2.0 2.6 24
Explained Variance 5.490 4.867 5.066
Ratio of total variance (%) 35.597 31.554 32.849
Source: Prepared by the authors.
Notes: (*) Method of rotation: (oblique) Promax rotation with Kaiser-normalization. (**) Table of rotated factors, multiplied by the ratio of
explained variance of the corresponding component.

36
Perm
anen
t Secre
tariat
Intra
-Reg
ion
al R
ela
tion
s
ANNEX 13
Rotating factors and ponderations in MERCOSUR
Dimensions Indicators Promax Rotation * Weights of indicators** Total weight on Index (%) Weight on the dimensions (%)
Comp1 Comp2 Comp3 Comp1 Comp2 Comp3 Value Accumulated Value Accumulated
Political
Control of Corruption 0.263 -0.060 -0.005 2.3 0.1 0.0 3.1
18
17
18
Government Effectiveness 0.283 -0.071 -0.059 2.7 0.2 0.1 3.6 19
Political Stability 0.266 -0.081 0.007 2.3 0.2 0.0 3.1 17
Regulatory Quality 0.191 -0.213 -0.104 1.2 1.6 0.4 2.1 11
State of Law 0.263 -0.132 -0.006 2.3 0.6 0.0 3.0 17
Accountability 0.275 -0.073 0.032 2.5 0.2 0.0 3.4 18
Environmental
Intensity in the use of Fertilizers 0.005 -0.211 0.072 0.0 1.5 0.2 2.0
12
17
12 CO2 Emissions 0.002 -0.170 0.280 0.0 1.0 2.7 3.6 30
Energy Intensity in the GDP 0.259 0.029 -0.154 2.2 0.0 0.8 3.0 24
Use of substances that could deplete ozone layer -0.002 0.113 0.279 0.0 0.4 2.7 3.6 29
Cultural
Internet Users 0.094 0.281 0.125 0.3 2.7 0.5 3.6
16
38
59 Cell phone users 0.067 0.262 0.156 0.1 2.4 0.8 3.2 33
Computer Users 0.079 0.244 0.086 0.2 2.0 0.3 2.7 29
Tourism 0.239 -0.081 0.070 1.9 0.2 0.2 2.5 38
41 Exports of intra-mechanism cultural goods 0.114 0.033 -0.192 0.4 0.0 1.3 1.7 25
Imports of intra-mechanism cultural goods -0.099 0.149 -0.232 0.3 0.8 1.8 2.5 37
Social
Life expectancy at birth 0.181 0.197 0.165 1.1 1.3 0.9 1.8
25
10
68
Public spending on health 0.212 -0.031 0.027 1.5 0.0 0.0 2.0 12
Infant mortality 0.172 0.217 0.110 1.0 1.6 0.4 2.1 13
Public spending on education -0.086 0.273 -0.001 0.2 2.6 0.0 3.4 20
Poverty 0.052 0.199 0.144 0.1 1.4 0.7 1.8 11
Extreme Poverty 0.019 0.208 0.130 0.0 1.5 0.6 2.0 12
Improvement in the supply of water 0.195 0.162 -0.096 1.3 0.9 0.3 1.7 10
Fertility in adolescents 0.225 0.065 0.182 1.7 0.1 1.1 2.2 13
Unemployment rate -0.032 -0.023 0.130 0.0 0.0 0.6 0.8 10
32
Employment in agriculture -0.156 -0.086 0.060 0.8 0.3 0.1 1.1 14
Employment in industry 0.131 -0.041 -0.144 0.6 0.1 0.7 0.9 12
Employment in services 0.154 0.135 -0.017 0.8 0.6 0.0 1.0 13
Per capita GDP 0.111 0.297 -0.030 0.4 3.0 0.0 4.1 51
Economic
Intra-mechanism exports 0.004 -0.182 0.312 0.0 1.1 3.3 4.5
28
31
50 Intra-mechanism imports 0.071 -0.149 0.344 0.2 0.8 4.1 5.4 38
Trade Openness -0.169 -0.043 0.310 0.9 0.1 3.3 4.4 31
Net Terms for Exchanges -0.028 0.267 0.086 0.0 2.4 0.3 3.3 51
22 HHI Concentration Index 0.178 -0.043 0.105 1.1 0.1 0.4 1.4 22
Cross-border Trade 0.198 -0.038 0.096 1.3 0.1 0.3 1.7 27
Total Public Debt -0.068 0.110 -0.040 0.2 0.4 0.1 0.6 7
27
Inflation 0.013 0.085 0.164 0.0 0.2 0.9 1.2 16
Gross Formation of Fixed Capital -0.071 0.158 -0.140 0.2 0.9 0.7 1.1 15
Economic Complexity Index 0.178 -0.063 -0.254 1.1 0.1 2.2 2.9 38
Total Public Spending 0.026 0.149 -0.206 0.0 0.8 1.5 2.0 25
Explained Variance 5.229 5.423 5.151
Ratio of total variance (%) 33.089 34.315 32.595
Source: Prepared by the authors.
Notes: (*) Method of rotation: (oblique) Promax rotation with Kaiser-normalization. (**) Table of rotated factors, multiplied by the ratio
of explained variance of the corresponding component.

37
Inte
gra
tion
Ind
ex fo
r Latin
Am
erica a
nd
the C
arib
bean
SP
/CL/X
LII. O/D
i N° 1
-16
[Capte la atención de los lectores mediante una cita importante extraída del documento o utilice este
ANNEX 14
Rotating factors and ponderations in SICA
Dimensions Indicators Promax Rotation * Weights of indicators** Total weight on Index (%) Weight on the dimensions (%)
Comp1 Comp2 Comp3 Comp1 Value Accumulated Value Accumulated
Political
Control of Corruption 0.168 -0.097 1.5 0.5 1.7
16
11
16
Government Effectiveness 0.217 -0.037 2.5 0.1 2.9 18
Political Stability 0.221 -0.045 2.6 0.1 3.0 19
Regulatory Quality 0.211 0.016 2.3 0.0 2.7 17
State of Law 0.214 0.046 2.4 0.1 2.8 17
Accountability 0.220 -0.043 2.5 0.1 3.0 18
Environmental
Intensity in the use of Fertilizers -0.117 0.075 0.7 0.3 0.8
8
10
8 CO2 Emissions -0.004 0.291 0.0 4.0 4.8 58
Energy Intensity in the GDP 0.081 -0.006 0.3 0.0 0.4 5
Use of substances that could deplete ozone layer 0.024 0.196 0.0 1.8 2.2 26
Cultural
Internet Users 0.190 0.020 1.9 0.0 2.2
13
39
44 Cell phone users 0.121 0.078 0.8 0.3 0.9 16
Computer Users 0.206 0.039 2.2 0.1 2.6 46
Tourism 0.103 -0.319 0.6 4.8 5.7 78
56 Exports of intra-mechanism cultural goods 0.104 0.156 0.6 1.2 1.4 19
Imports of intra-mechanism cultural goods 0.025 0.070 0.0 0.2 0.3 4
Social
Life expectancy at birth 0.223 0.099 2.6 0.5 3.1
38
13
63
Public spending on health 0.143 0.273 1.1 3.6 4.2 18
Infant mortality 0.198 0.218 2.0 2.3 2.7 11
Public spending on education 0.109 0.207 0.6 2.0 2.4 10
Poverty 0.193 -0.102 1.9 0.5 2.3 10
Extreme Poverty 0.205 -0.180 2.2 1.5 2.6 11
Improvement in the supply of water 0.235 -0.026 2.9 0.0 3.4 15
Fertility in adolescents 0.214 0.075 2.4 0.3 2.8 12
Unemployment rate -0.081 0.205 0.3 2.0 2.4 17
37
Employment in agriculture -0.196 0.189 2.0 1.7 2.4 17
Employment in industry 0.008 -0.233 0.0 2.6 3.1 22
Employment in services 0.224 -0.073 2.6 0.3 3.1 22
Per capita GDP 0.224 -0.024 2.6 0.0 3.1 22
Economic
Intra-mechanism exports -0.092 0.122 0.4 0.7 0.8
25
13
25 Intra-mechanism imports -0.149 0.213 1.2 2.2 2.6 41
Trade Openness 0.124 0.225 0.8 2.4 2.9 46
Net Terms for Exchanges -0.104 -0.061 0.6 0.2 0.7 11
25 HHI Concentration Index 0.130 0.266 0.9 3.4 4.0 64
Cross-border Trade 0.157 -0.016 1.3 0.0 1.5 25
Total Public Debt -0.052 0.254 0.1 3.1 3.6 29
50
Inflation 0.044 -0.034 0.1 0.1 0.1 1
Gross Formation of Fixed Capital 0.052 0.175 0.1 1.5 1.7 14
Economic Complexity Index 0.219 0.043 2.5 0.1 3.0 24
Total Public Spending -0.001 0.266 0.0 3.4 4.0 32
Explained Variance 5.606 5.110
Ratio of total variance (%) 52.317 47.683
Source: Prepared by the authors.
Notes: (*) Method of rotation: (oblique) Promax rotation with Kaiser-normalization. (**) Table of rotated factors, multiplied by the ratio
of explained variance of the corresponding component.

38
Perm
anen
t Secre
tariat
Intra
-Reg
ion
al R
ela
tion
s
ANNEX 15
Rotating factors and ponderations in the Andean Community
Dimensions Indicators Promax Rotation * Weights of indicators** Total weight on Index (%) Weight on the dimensions (%)
Comp1 Comp2 Comp1 Comp2 Adjusted Value Adjusted Accumulated Value Accumulated
Political
Control of Corruption 0.145 -0.050 1.0 0.1 1.2
11
11
11
Government Effectiveness 0.075 -0.124 0.3 0.8 0.9 8
Political Stability -0.060 0.210 0.2 2.2 2.6 24
Regulatory Quality -0.021 -0.181 0.0 1.6 1.9 18
State of Law -0.114 -0.026 0.6 0.0 0.7 7
Accountability 0.026 0.238 0.0 2.9 3.3 31
Environmental
Intensity in the use of Fertilizers -0.207 -0.023 2.1 0.0 2.5
12
20
12 CO2 Emissions -0.231 0.193 2.6 1.9 3.1 25
Energy Intensity in the GDP 0.168 -0.175 1.4 1.6 1.8 15
Use of substances that could deplete ozone layer -0.007 0.284 0.0 4.1 4.7 39
Cultural
Internet Users 0.248 0.132 3.0 0.9 3.5
15
35
66 Cell phone users 0.247 0.152 3.0 1.2 3.5 35
Computer Users 0.226 0.114 2.5 0.7 2.9 29
Tourism -0.032 0.065 0.1 0.2 0.2 5
34 Exports of intra-mechanism cultural goods 0.135 -0.259 0.9 3.4 3.9 78
Imports of intra-mechanism cultural goods 0.123 -0.074 0.8 0.3 0.9 17
Social
Life expectancy at birth 0.249 -0.016 3.1 0.0 3.5
37
16
59
Public spending on health 0.134 -0.098 0.9 0.5 1.0 5
Infant mortality -0.274 0.047 3.7 0.1 4.3 20
Public Infant mortality spending on education 0.004 0.185 0.0 1.7 2.0 9
Poverty 0.215 0.052 2.3 0.1 2.6 12
Extreme Poverty 0.205 0.023 2.1 0.0 2.4 11
Improvement in the supply of water 0.240 -0.061 2.8 0.2 3.3 15
Fertility in adolescents 0.217 0.016 2.3 0.0 2.7 12
Unemployment rate -0.053 0.248 0.1 3.1 3.6 24
41
Employment in agriculture 0.031 0.223 0.0 2.5 2.9 19
Employment in industry -0.099 -0.184 0.5 1.7 2.0 13
Employment in services 0.015 -0.180 0.0 1.6 1.9 13
Per capita GDP 0.286 0.019 4.1 0.0 4.7 31
Economic
Intra-mechanism exports -0.114 0.151 0.6 1.2 1.3
25
16
34 Intra-mechanism imports 0.014 0.205 0.0 2.1 2.5 29
Trade Openness 0.032 0.286 0.1 4.1 4.8 56
Net Terms for Exchanges 0.188 0.186 1.7 1.8 2.0 37
22 HHI Concentration Index 0.043 0.116 0.1 0.7 0.8 14
Cross-border Trade 0.100 0.215 0.5 2.3 2.7 49
Total Public Debt -0.222 0.009 2.4 0.0 2.8 25
45
Inflation 0.026 0.038 0.0 0.1 0.1 1
Gross Formation of Fixed Capital 0.230 0.050 2.6 0.1 3.0 27
Economic Complexity Index 0.114 -0.252 0.6 3.2 3.7 33
Total Public Spending 0.055 0.169 0.1 1.4 1.7 15
Explained Variance 5.224 5.329
Ratio of total variance (%) 49.504 50.496
Source: Prepared by the authors.
Notes: (*) Method of rotation: (oblique) Promax rotation with Kaiser-normalization. (**) Table of rotated factors, multiplied by the ratio
of explained variance of the corresponding component.

39
Inte
gra
tion
Ind
ex fo
r Latin
Am
erica a
nd
the C
arib
bean
SP
/CL/X
LII. O/D
i N° 1
-16
[Capte la atención de los lectores mediante una cita importante extraída del documento o utilice este
ANNEX 16
Rotating factors and ponderations in CARICOM
Dimensions Indicators Promax Rotation * Weights of indicators** Total weight on Index (%) Weight on the dimensions (%)
Comp1 Comp2 Comp3 Comp4 Comp1 Comp2 Comp3 Comp4 Adjusted Value Adjusted Accumulated Value Accumulated
Political
Control of Corruption 0.304 -0.038 -0.113 0.176 2.4 0.0 0.3 0.7 3.5
22
16
22
Government Effectiveness 0.285 0.081 -0.067 0.212 2.1 0.2 0.1 1.1 3.0 14
Political Stability 0.314 -0.108 -0.011 0.051 2.5 0.3 0.0 0.1 3.7 17
Regulatory Quality 0.303 -0.019 -0.263 0.104 2.3 0.0 1.6 0.3 3.4 16
State of Law 0.316 -0.148 -0.151 -0.013 2.6 0.5 0.5 0.0 3.7 17
Accountability 0.338 -0.047 -0.069 -0.048 2.9 0.1 0.1 0.1 4.3 20
Environmental CO2 Emissions -0.092 0.474 -0.191 0.065 0.2 5.3 0.9 0.1 7.8
10 75
10 Use of substances that could deplete ozone layer 0.204 -0.131 0.273 -0.062 1.1 0.4 1.8 0.1 2.6 25
Cultural
Internet Users 0.176 0.341 0.328 -0.040 0.8 2.8 2.6 0.0 4.0
14
50 60
Cell phone users 0.148 0.343 0.326 -0.087 0.6 2.8 2.5 0.2 4.1 50
Exports of intra-mechanism cultural goods -0.008 0.392 -0.219 0.180 0.0 3.6 1.1 0.8 5.3 96 40
Imports of intra-mechanism cultural goods -0.062 0.053 -0.077 -0.040 0.1 0.1 0.1 0.0 0.2 4
Social
Life expectancy at birth -0.004 0.002 -0.053 0.423 0.0 0.0 0.1 4.2 6.2
21
40
74 Public spending on health -0.126 -0.097 0.231 0.331 0.4 0.2 1.3 2.6 3.8 25
Infant mortality -0.349 0.009 -0.030 0.074 3.1 0.0 0.0 0.1 4.6 29
Improvement in the supply of water -0.012 0.101 -0.061 -0.162 0.0 0.2 0.1 0.6 0.9 6
Per capita GDP 0.179 0.399 -0.066 -0.142 0.8 3.8 0.1 0.5 5.5 100 26
Economic
Intra-mechanism exports 0.172 -0.048 0.167 0.346 0.8 0.1 0.7 2.8 4.2
33
37
34 Intra-mechanism imports 0.069 -0.169 0.395 0.091 0.1 0.7 3.7 0.2 5.4 48
Trade Openness -0.216 -0.050 0.071 0.192 1.2 0.1 0.1 0.9 1.7 15
Net Terms for Exchanges -0.088 0.178 0.009 0.230 0.2 0.7 0.0 1.3 1.8 35 16
HHI Concentration Index -0.002 -0.097 0.045 0.313 0.0 0.2 0.0 2.3 3.4 65
Total Public Debt -0.010 0.065 0.343 -0.134 0.0 0.1 2.8 0.4 4.1 24
50 Inflation 0.236 -0.002 0.035 -0.063 1.4 0.0 0.0 0.1 2.1 12
Gross Formation of Fixed Capital 0.004 -0.147 0.005 -0.419 0.0 0.5 0.0 4.2 6.1 36
Total Public Spending 0.019 0.211 0.363 0.053 0.0 1.1 3.1 0.1 4.6 27
Explained Variance 4.035 3.749 3.961 4.052
Ratio of total variance (%) 25.544 23.730 25.076 25.650
Source: Prepared by the authors.
Notes: (*) Method of rotation: (oblique) Promax rotation with Kaiser-normalization. (**) Table of rotated factors, multiplied by the ratio of
explained variance of the corresponding component.


Integration Index for Latin America and the Caribbean SP/CL/XLII. O/Di N° 1-16
41
41
[Capte la atención de los lectores mediante una cita importante extraída del documento o utilice este
ANNEX 17
Models formulated within the space of statuses.
The technique of the models written in the form of space within statuses seeks, by means
of linear systems, to extract the dynamics entailed in the relations between unobserved variables,
commonly known as status, in function of observed variables called measured or observed
variables.
What is really observed and what can be concluded from the observation is written, as a
matrix, based on two equations, in the following manner:
tttt xHz =
tt xx =1
Through this system, it is possible to infer the properties of the status variable x, based on
the information provided by the observed vector of variables zt, and the structure of the relation
existing between the statuses over several periods of time; in this case, it is assumed that the status
variable continues an order 1 Markovian process.
It is possible to further expand the system with the purpose of incorporating ut exogenous
variables, and add the information provided by the noise component, both that of the status and
that of the vt and wt observation, which constitutes a representation for the dynamic trend of the
status variable, as shown as follows (Terceiro, 1990):
tttt Ewuxx =1 (1)
ttttt CvDuxHz = (2)
In summary, the equation (1) is the equation of the statuses and describes the evolution of
the vector of status tx of dimension 1n , whilst the equation (2) generates the vector of
measurement tz, of dimension
1,m tu is a vector of exogenous variables, tw
and tv are
processes of white noise, such that:
SvwcovRIIDvQIIDw tttt =),(y)(0,),(0, ::
WhereRQECDH ,,,,,,,
and S are matrixes with coefficient relation, which for the
purpose of this paper are considered fixed or invariants in time.
Smoothing algorithm of fixed interval
In this paper, smoothing is considered to include the missing information in the model, on
the basis of the information available, j to
jt =; this is
jJj uuuZZZ ,...,,,,...,,= 2121
and
referring to the conditional moments of first and second order of the vector of status, such as:
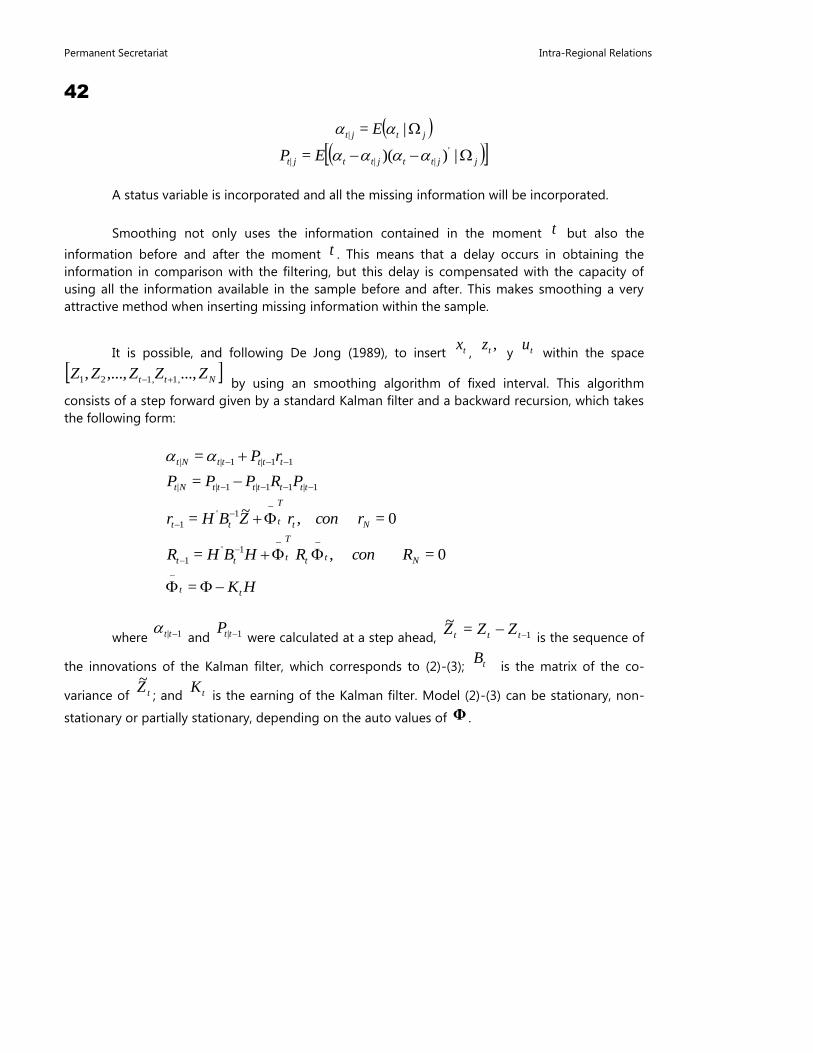
Permanent Secretariat Intra-Regional Relations
42
jtjt E |=|
j
'
jttjttjt EP |))(= |||
A status variable is incorporated and all the missing information will be incorporated.
Smoothing not only uses the information contained in the moment t but also the
information before and after the moment t . This means that a delay occurs in obtaining the
information in comparison with the filtering, but this delay is compensated with the capacity of
using all the information available in the sample before and after. This makes smoothing a very
attractive method when inserting missing information within the sample.
It is possible, and following De Jong (1989), to insert tx,
,tz y tu
within the space
Ntt ZZZZZ ...,,...,, 1,1,21 by using an smoothing algorithm of fixed interval. This algorithm
consists of a step forward given by a standard Kalman filter and a backward recursion, which takes
the following form:
11|1|| = tttttNt rP
1|11|1|| = tttttttNt PRPPP
0= ,
~= 1'
1 Nt
T
ttt rconrZBHr
0= ,= 1'
1 Ntt
T
ttt RconRHBHR
HKtt
=
where 1| tt and 1| ttP
were calculated at a step ahead, 1=~
ttt ZZZ is the sequence of
the innovations of the Kalman filter, which corresponds to (2)-(3); tB is the matrix of the co-
variance of tZ~
; and tK is the earning of the Kalman filter. Model (2)-(3) can be stationary, non-
stationary or partially stationary, depending on the auto values of Φ .

Integration Index for Latin America and the Caribbean SP/CL/XLII. O/Di N° 1-16
43
43
[Capte la atención de los lectores mediante una cita importante extraída del documento o utilice este
BIBLIOGRAPHY
Adler, G., and Sosa, S. (2013). External Conditions and Debt Sustainability in Latin America.
Washington: International Monetary Fund.
AIR (2013). ASEAN Investment Report 2012: The Changing FDI Landscape. The ASEAN Secretariat,
Jakarta.
Amato, J., and Gerlach, S. (2002). Inflation targeting in emerging market and transition economies:
Lessons after a decade. European Economic Review, 781-790.
ASEAN Secretariat and UNCTAD (2014). ASEAN Investment Report: FDI Development and Regional
Value Chains. Jakarta: ASEAN Secretariat.
Balasa, B. (1961). The Theory of Economic Integration. Irwin: Homewood, Illinois.
Barro, R. J. (1989). Economic growth in a cross section of countries (No. w3120). National Bureau of
Economic Research.
Basu, S. R., and Das, M. (2011). Export Structure and Economic Performance in Developing
Countries: Evidence from Non-parametric Methodology. UN.
Bengoa, M., and Sánchez-Robles, B. (2003). Foreign direct investment, economic freedom and
growth: new evidence from Latin America. European journal of political economy, 19(3), 529-
545.
Bleaney, M. F. (1996). Macroeconomic stability, investment and growth in developing countries.
Journal of Development Economics, 48(2), 461-477.
Briceño, J. (2011). La integración regional en América Latina y el Caribe: Procesos Históricos y
realidades comparadas. Universidad de los Andes. Vicerrectorado Académico, CODEPRE.
Centro Editorial Litorama C.A.
CAF (2004). “Reflexiones para retomar el crecimiento: Inserción internacional, transformación
productiva e inclusión social”. Dirección de Estudios Económicos. Vicepresidencia de
Estrategias de Desarrollo. Caracas.
Calderón, C., and Schmidt-Hebbel, K. (2003). Macroeconomic policies and performance in Latin
America. Journal of International Money and Finance, 895-923.
ECLAC. (2012). Estudio Económico de América Latina y el Caribe: Las políticas ante las adversidades
de la economía internacional. Santiago: ECLAC.
ECLAC. (2013). La Inversión Extranjera Directa en América Latina y el Caribe. Santiago: ECLAC.
ECLAC. (2015). La Inversión Extranjera Directa en América Latina y el Caribe. Santiago: ECLAC.
Corbo, V., and Rojas, P. (2010). Investment, macroeconomic stability and growth: The Latin
American experience. Revista de Análisis Económico–Economic Analysis Review, 8(1), 19-35.
Cattell, R. (1966). The screen test for the number of factors. Multivariant Behaviour Research, Vol. 1,
245-276.

Permanent Secretariat Intra-Regional Relations
44
Cronbach, L. (1951). Coefficient alpha and the internal structure tests. Psychometrika, Vol. 16, 297-
334.
Dhar, B. (2011). Trade Integration and Growth of Regional Value Chains: The Future Looks
Promising. Asia-Pacific Forum. Taipei: Asia-Pacific Forum.
Dreher, A. (2006). Does Globalization Affect Growth? Evidence from a new Index of Globalization.
Applied Economics, Vol. 38 (10), 1091-1110.
Elms, D., and Low, p. (2013). Global value chains in a changing world. Geneva: World Trade
Organization.
Gwartney, J. and Lawson, R. (2001). Economic Freedom of the World: 2001 Annual Report. The
Fraser Institute: Vancouver.
Hidalgo, C., and Hausmann, R. (2009). The building blocks of economic complexity. Proceedings of
the National Academy of Sciences, 10570-10575.
Kim, S., Kim, S., and Choi, Y. (2014). Financing Investment in East Asia: Regional or Global Savings?
Japan and the World Economy, 1-7.
KOF Globalization Index (2016). Economic Research Institute Konjunkturforschungsstelle (KOF).
Web page: http://globalization.kof.ethz.ch/. Consulted on 01 August 2016.
König, J. and Ohr, R. (2012). Homogeneous groups within a heterogeneous community – Evidence
from an index measuring European economic integration.
Lall, S. (2000). Export performance, technological upgrading and foreign direct investment
strategies in the Asian newly industrializing economies with special reference to Singapore.
ECLAC. Santiago, Chile.
Lall, S. (2000). The Technological structure and performance of developing country manufactured
exports, 1985‐98. Oxford Development Studies, 28(3), 337-369.
Lucas, R. (1988). On the mechanics of economic development. Journal of Monetary Economics,
22(1), 3-42.
Maesso, M. (2011). La Integración Económica. Tendencias y Nuevos Desarrollos de la Teoría
Económica. January-February 2011. N° 858, 119-132.
Manuelito, S., and Jiménez, L. (2014). La inversión y el ahorro en América Latina: nuevos rasgos
estilizados, requerimientos para el crecimiento y elementos de una estrategia para fortalecer
su financiamiento. Serie Macroeconomía del Desarrollo, ECLAC.
Martínez Piva, J. M. (2015). Incentivos públicos de nueva generación para la atracción de inversión
extranjera directa (IED) en Centroamérica.
Migrant Integration Policy Index (2015). Web page: http://www.mipex.eu/. Consulted on 01 August
2016.

Integration Index for Latin America and the Caribbean SP/CL/XLII. O/Di N° 1-16
45
45
[Capte la atención de los lectores mediante una cita importante extraída del documento o utilice este
Moreno-Brid, J., and Pérez, E. (2003). Liberalización comercial y crecimiento económico en
Centroamérica. Revista de la CEPAL 81, 157-174.
Nicoletti, G., Scarpetta, S. and Boylaud, O. (2000). Summary Indicators of Product Market
Regulation with an Extension to Employment Protection legislation. OECD Economics
Department Working Papers, N° 226.
Noorbakhsh, F. (1998). The human development index: some technical issues and alternative
indices. Journal of International Development, Vol. 10 (5), 589-605.
OECD and JRC (2008). Handbook on Constructing Composite Indicators: Methodology and Users
Guide. Paris: OECD Publishing.
Snedecor, George W. and Cochran, William G. (1989), Statistical Methods, Eighth Edition, Iowa
State University Press.
Pisano, G. and Shih, W. (2013). Producing Prosperity. Why America Needs a Manufacturing
Renaissance. Harvard Business Review Press.
Poon, W. C., and Lee, Y. S. (2014). Inflation Targeting in ASEAN‐10. South African Journal of
Economics, 82(1), 141-157.
Romer, P. M. (1986). Increasing returns and long-run growth. The journal of political economy,
1002-1037.
Rosales, O. Inoue, K. and Mulder, N. (2015) “Rising concentration in Asia-Latin America value
chains: Can small firms turn the tide?” ECLAC. Santiago, Chile.
SELA (2014). Las relaciones América Latina, el Caribe y la Cuenca del Pacífico: Sociedad, política,
empresas y tecnología. Latin American and Caribbean Economic System (SELA), Extra-
Regional Relations. Caracas.
Solimano, A. (2013). Comercio exterior, cadenas globales de producción y financiamiento:
Conceptos y relevancia para América Latina y el Caribe. ECLAC. Santiago, Chile.
Ulvedal, P. B. (2013). Macroeconomic stability and economic growth in developing countries.
UNCTAD (2004). World Investment Report, the shift towards Services. United Nations Conference
on Trade and Development, UNCTAD. New York.
UNCTAD (2005). World Investment Report, Transnational corporations and the internationalization
of R&D. United Nations Conference on Trade and Development, UNCTAD. New York.
UNCTAD (2013). World Investment Report, global value chains: investment and trade for
development. United Nations Conference on Trade and Development, UNCTAD. New York.
UNCTAD (2014). World Investment Report, investing in the SDGs: An action plan. United Nations
Conference on Trade and Development, UNCTAD. New York.