Embed Size (px)
Citation preview

INL is a U.S. Department of Energy National Laboratory operated by Battelle Energy Alliance, LLC
INL/EXT-20-57712 Revision 0
Integration of a Microturbine Power Conversion Unit in MAGNET
August 2020
Analysis of a Power Conversion Unit (PCU) for the Microreactor Agile Non-nuclear Experimental Testbed (MAGNET)
Donna Post Guillen Daniel S. Wendt Idaho National Laboratory

DISCLAIMER This information was prepared as an account of work sponsored by an
agency of the U.S. Government. Neither the U.S. Government nor any agency thereof, nor any of their employees, makes any warranty, expressed or implied, or assumes any legal liability or responsibility for the accuracy, completeness, or usefulness, of any information, apparatus, product, or process disclosed, or represents that its use would not infringe privately owned rights. References herein to any specific commercial product, process, or service by trade name, trade mark, manufacturer, or otherwise, does not necessarily constitute or imply its endorsement, recommendation, or favoring by the U.S. Government or any agency thereof. The views and opinions of authors expressed herein do not necessarily state or reflect those of the U.S. Government or any agency thereof.

INL/EXT-20-57712 Revision 0
Integration of a Microturbine Power Conversion Unit in MAGNET
Analysis of a Power Conversion Unit (PCU) for the Microreactor Agile Non-nuclear Experimental Testbed (MAGNET)
Donna Post Guillen Daniel S. Wendt
Idaho National Laboratory
August 2020
Idaho National Laboratory Originating Organization NS&T Microreactor Program
Idaho Falls, Idaho 83415
http://www.inl.gov
Prepared for the U.S. Department of Energy Office of Nuclear Energy
Under DOE Idaho Operations Office Contract DE-AC07-05ID14517

Page intentionally left blank

iii
ABSTRACT
The Microreactor Agile Non-nuclear Experimental Testbed (MAGNET) facility is being constructed at Idaho National Laboratory’s (INL’s) Energy Systems Laboratory to assist with the development, demonstration, and validation of microreactor components and systems. MAGNET will accommodate various types of test articles representative of different microreactor designs. A power conversion unit (PCU) simulator loop was proposed to use the rejected heat from the test article and mimic the thermal hydraulic conditions (e.g., temperature, pressure and flow rate) that would be experienced if an actual Brayton cycle PCU was attached. However, due to the high-estimated cost of the PCU simulator and the availability of a turbogenerator used for previous testing at Sandia National Laboratories, the PCU simulator design was abandoned in favor of integrating an actual PCU into MAGNET. A commercial Capstone C30 was modified by Sandia to use external electrical heating, rather than combustion heating, to provide a power output from 1 to ~30 kWe. The C30 has a single-stage centrifugal combustor, a static radial heat exchanger, and a radial inflow turbine arranged on a single shaft with a high-speed alternator. Since the operating temperature and energy transfer per unit working fluid mass are comparable, the MAGNET PCU will provide researchers with the ability to evaluate the test article heat transfer under representative operating conditions with the transient system behavior associated with a closed Brayton cycle PCU. This report examines the integration of a modified commercial Capstone C30 turbogenerator into MAGNET, outlines a proposed set of tests, and describes future work.

iv
Page intentionally left blank

v
EXECUTIVE SUMMARY Efficient operation of the power conversion unit (PCU) is essential to
facilitate the widespread deployment of nuclear microreactors. For these systems, the advantages offered by Brayton power cycles make them attractive for integration with microreactors. Integration of a modified Capstone C30 turbine-alternator-compressor (TAC) unit from Sandia National Laboratories into the Microreactor Agile Non-nuclear Experimental Testbed (MAGNET) testbed was evaluated. Commercially available C30 TACs are designed to operate with natural gas as the fuel source. However, this C30 unit was modified to use external electrical heating to simulate a nuclear heat source. A 75 kWt electrically heated test article and heat exchanger providing a turbine inlet temperature of 600°C was evaluated for operation with the modified C30 in MAGNET. Operation of a test article supplying a maximum thermal power of 250 kWt was also considered. Additionally, the open-cycle configuration of the commercial C30 was reconfigured as a closed Brayton cycle (CBC) using nitrogen as the working fluid. The key components of the PCU to be installed in MAGNET are the compressor, turbine, alternator, internal recuperator, and Basco®/Whitlock® gas cooler. Recommendations on using the Sandia Basco®/Whitlock® gas cooler and the MAGNET XLG® cooler are provided based upon heat transfer analyses. Turbine and compressor flow curves are used to characterize performance over a range of expected operating conditions. The integration of the C30 unit into the MAGNET loop provides an opportunity for operator training on a small PCU. Users will have the ability to interface with the controls and obtain feedback on certain aspects the integrated microreactor PCU cycle.
The key points resulting from the CBC process modeling evaluation are summarized below.
• The Capstone C30 TAC and Basco®/Whitlock® gas cooler have equipment performance specifications that are compatible with MAGNET, and these components are well-suited for closed Brayton cycle testing in conjunction with 75 kWt MAGNET test articles. If MAGNET PCU testing is performed with a microreactor test article exceeding 75 kWt thermal capacity, use of the XLG® heat exchanger may be required in place of, or in addition to, use of the Basco®/Whitlock® heat exchanger.
• When the Capstone C30 microturbine inlet temperature is decreased to 600°C from the typical combustion-fired scenario with 877°C turbine inlet temperature while holding the total thermal power input constant at 75 kWt, the decrease in thermal efficiency associated with the decreased heat source temperature results in a significant reduction in the overall net power generation (11.4 kWe net at 600°C versus 25.2 kWe at 877°C).
• Evaluation of selected control schemes, including TAC shaft speed, turbine inlet temperature, gas (working fluid) inventory, gas cooler duty, and throttling valve control, indicated that each of these strategies could be used to control net power output of the MAGNET PCU. The net power output at the simulated design point is slightly higher than the ~30 kWe rating of the Capstone C30 generator.

vi
• A throttling valve is not required for control of the MAGNET PCU, but inclusion of one would provide the ability to test additional control schemes and gain further insight into the transient operating characteristics of reactor-driven closed Brayton cycles. A throttling valve with a Cv of 150 (USGPM at 60°F and 1-psi differential pressure) is recommended for providing accurate control of the MAGNET PCU configured with a 75 kWt test article.
Areas for future work include the construction of a digital twin to facilitate further understanding of the interaction between the reactor and the PCU. Data from the coupled reactor-PCU could be used to develop and validate anomaly detection algorithms to facilitate remote or autonomous operations. The coupled system could also be used to test novel waste heat recovery systems. A dynamic system model should be developed to further investigate the transient operation (response times, system performance, control system parameters, etc.) of the coupled reactor-PCU system. Additionally, grid connectivity could be explored using the microgrid available at the Energy Systems Laboratory.

vii
ACKNOWLEDGMENT This report was co-authored by Battelle Energy Alliance, LLC, under
Contract No. DE-AC07-05-ID14517 with the U.S. Department of Energy, Office of Nuclear Energy. This research made use of the resources of the High Performance Computing Center at Idaho National Laboratory, which is supported by the Office of Nuclear Energy of the U.S. Department of Energy and the Nuclear Science User Facilities under Contract No. DE-AC07-05ID14517.

viii
Page intentionally left blank

ix
CONTENTS 1. INTRODUCTION ............................................................................................................................... 1
2. INTEGRATION OF POWER CONVERSION UNIT IN MAGNET ................................................ 2
2.1 PCU Testing Objectives ........................................................................................................... 4
2.2 Microturbine PCU Equipment Specifications .......................................................................... 4
2.2.1 Gas Heating ................................................................................................................. 6 2.2.2 Compressor and Turbine ............................................................................................. 7 2.2.3 Recuperator ............................................................................................................... 11 2.2.4 Gas Cooler ................................................................................................................ 14 2.2.5 Instrumentation ......................................................................................................... 27
2.3 Microturbine PCU Process Design ........................................................................................ 28
3. CAPSTONE C30 OPERATION AND PERFORMANCE ............................................................... 32
3.1 Normal Operations ................................................................................................................. 32
3.1.1 Capstone C30 Operating Curve ................................................................................ 32 3.1.2 Comparison of Capstone C30 CBC Process Conditions with Optimized Recuperated
Open Brayton Cycle .................................................................................................. 33 3.2 Off-Design Process Operation ............................................................................................... 35
3.2.1 Partial Load Modeling Assumptions ......................................................................... 36 3.2.2 Turbine and Compressor Characteristic Curves ....................................................... 36 3.2.3 Predicted MAGNET CBC PCU Off-Design Performance ....................................... 42
3.3 Control Schemes .................................................................................................................... 45
3.3.1 TAC Shaft Speed Control ......................................................................................... 46 3.3.2 Turbine Inlet Temperature Control ........................................................................... 48 3.3.3 Turbine Bypass Valve Control .................................................................................. 50 3.3.4 Throttling Valve Control ........................................................................................... 51 3.3.5 Gas Inventory Control ............................................................................................... 55 3.3.6 Gas Cooler Outlet Temperature Control ................................................................... 58
3.4 Process Startup/Shutdown ...................................................................................................... 60
3.4.1 Startup ....................................................................................................................... 60 3.4.2 Shutdown .................................................................................................................. 64
3.5 Dynamic Stability .................................................................................................................. 64
4. PROPOSED TESTS .......................................................................................................................... 65
4.1 Basic Operability Testing ....................................................................................................... 65
4.2 Transient Behavior ................................................................................................................. 66
4.2.1 Control Scheme Testing ............................................................................................ 66 4.2.2 Testing of Dynamic Response to System Perturbations ........................................... 68
5. SUMMARY AND RECOMMENDATIONS ................................................................................... 70
6. REFERENCES .................................................................................................................................. 72
x
Appendix A PCU Controls .......................................................................................................................... 1
FIGURES Figure 1. MAGNET deployment in INL’s Energy Systems Laboratory building, Systems
Integration Laboratory. ................................................................................................................. 2
Figure 2. MAGNET subsystems. .................................................................................................................. 3
Figure 3. Equipment layout in MAGNET. ................................................................................................... 3
Figure 4. The heat exchanger removes heat from the test article and supplies it to the PCU. ...................... 3
Figure 5. Schematic of CBC loop in MAGNET. .......................................................................................... 5
Figure 6. (a) Cross section of 37 heat pipes core block geometry, (b) test article core, and (c) heat removal section. ............................................................................................................................ 6
Figure 7. Cutaway view of the commercial Capstone C30 TAC unit [11]. .................................................. 7
Figure 8. Compressor and turbine arrangement of the Capstone C30 TAC ................................................. 7
Figure 9. Cross-sectional view of Capstone C30 microturbine assembly. The orange and red lines indicate the gas flow path including the region of the unit housing modified to allow external heat addition. The flow path through the compressor and recuperator are shown by the orange line. The flow path through the turbine and recuperator are shown by the red line [14]. ....................................................................................................................... 9
Figure 10. Photograph of Capstone C30 piping modifications to divert the recuperator cold-side outlet stream to external heater unit. ........................................................................................... 10
Figure 11. Photograph of Capstone C30 turbine ......................................................................................... 11
Figure 12. Capstone microturbine annular recuperator [15]. ...................................................................... 12
Figure 13. Schematic of a cross-wavy recuperator surface [16]. ................................................................ 12
Figure 14. Single-pass counterflow heat exchanger effectiveness versus NTU [22]. ................................. 14
Figure 15. MAGNET gas cooler specifications (Sheet 1 of 2). .................................................................. 16
Figure 16. MAGNET gas cooler specifications (Sheet 2 of 2). .................................................................. 17
Figure 17. XLG® shell and tube exchanger without tube internal enhancements EDR rating analysis results (U.S. units). ....................................................................................................... 18
Figure 18. XLG® shell and tube exchanger without tube internal enhancements EDR rating analysis results (SI units). ........................................................................................................... 19
Figure 19. XLG® shell and tube exchanger with tube internal enhancement EDR rating analysis results (U.S. units). ..................................................................................................................... 20
Figure 20. XLG® shell and tube exchanger with tube internal enhancement EDR rating analysis results (SI units). ......................................................................................................................... 20
Figure 21. XLG® I-6 in./19 × 1 in.-60 in.-304/304-X shell and tube exchanger EDR simulation results (U.S. units). ..................................................................................................................... 21
Figure 22. XLG® I-6 in./19 × 1 in.-60 in.-304/304-X shell and tube exchanger EDR simulation results (SI units). ......................................................................................................................... 22

xi
Figure 23. XLG® I-6 in./19 × 1 in.-60 in.-304/304-X shell and tube exchanger EDR simulation stream temperature profiles (TS=tube side, SS=shell side). ....................................................... 22
Figure 24. Specification sheet of Basco®/Whitlock® shell and tube heat exchanger used for Sandia CBC gas cooling application. ......................................................................................... 23
Figure 25. Basco®/Whitlock® 08-114 shell and tube exchanger EDR rating analysis results (U.S. units). ................................................................................................................................. 24
Figure 26. Basco®/Whitlock® 08-114 shell and tube exchanger EDR rating analysis results (SI units). .................................................................................................................................... 24
Figure 27. Basco®/Whitlock® 08-114 shell and tube exchanger EDR simulation results (U.S. units). ................................................................................................................................. 25
Figure 28. Basco®/Whitlock® 08-114 shell and tube exchanger EDR simulation results (SI units). .................................................................................................................................... 25
Figure 29. Basco®/Whitlock® 08-114 shell and tube exchanger EDR simulation stream temperature profiles. ................................................................................................................... 26
Figure 30. MAGNET PCU preliminary process design P&ID. .................................................................. 27
Figure 31. MAGNET Microturbine PCU design point operating conditions based on Capstone C30 TAC and Basco®/Whitlock® gas cooler specifications. .................................................... 29
Figure 32. MAGNET microturbine PCU design point process operating conditions summary. ................ 30
Figure 33. Process flow diagram of MAGNET and microturbine PCU integration. .................................. 32
Figure 34. HYSYS off-design operating curve (black line) compared to Capstone C-30 operating curve (red dotted line based on NASA off-design performance curve mean line flow analysis models as described in [8]). Compressor characteristic curves are designated with black lines and turbine curves with blue lines. ................................................................... 33
Figure 35. Optimized recuperated air Brayton cycle nominal operating conditions. ................................. 34
Figure 36. MAGNET PCU predicted operating conditions with air working fluid, turbine inlet temperature of 600°C, gas cooler outlet temperature of 21.1°C, and compressor pressure ratio of 2.12. ................................................................................................................. 34
Figure 37. Compressor temperature ratio mean line flow curves plot from Wright et al. [8]. .................... 37
Figure 38. Compressor efficiency mean line flow curves plot from Wright et al. [8]. ............................... 37
Figure 39. Compressor pressure ratio mean line flow curves plot from Wright et al. [8]. ......................... 38
Figure 40. Capstone C30 compressor and turbine pressure ratio mean line flow curves plot from Wright et al. [8]. ......................................................................................................................... 39
Figure 41. Microturbine PCU process operating conditions at 75 kWt reactor heat input, 877°C turbine inlet temperature, 96,300 RPM turbine speed (gas inventory control scheme). ............. 43
Figure 42. Microturbine PCU process operating conditions at 75 kWt reactor (RX) heat input, 600°C turbine inlet temperature, 96,300 RPM turbine speed (gas inventory control scheme). ...................................................................................................................................... 43
Figure 43. Microturbine PCU process operating conditions at 75 kWt RX heat input, 877°C turbine inlet temperature, 1.01 bar compressor inlet P (shaft speed control scheme). ............... 44
Figure 44. Microturbine PCU process operating conditions at 75 kWt RX heat input, 600°C turbine inlet temperature, 1.01 bar compressor inlet P (shaft speed control scheme). ............... 45

xii
Figure 45. Reactor thermal power as a function of TAC shaft speed with turbine inlet temperature as a parameter. ............................................................................................................................ 47
Figure 46. Net power as a function of TAC shaft speed with turbine inlet temperature as a parameter. ................................................................................................................................... 47
Figure 47. Cycle thermal efficiency as a function of TAC shaft speed with turbine inlet temperature as a parameter. ........................................................................................................ 48
Figure 48. Reactor power as a function of turbine inlet temperature with TAC shaft speed as a parameter. ................................................................................................................................... 49
Figure 49. Net power as a function of turbine inlet temperature with TAC shaft speed as a parameter. ................................................................................................................................... 49
Figure 50. Cycle efficiency as a function of turbine inlet temperature with TAC shaft speed as a parameter. ................................................................................................................................... 50
Figure 51. MAGNET PCU preliminary process design P&ID for configuration with throttling valve. .......................................................................................................................................... 51
Figure 52. MAGNET PCU operating point with throttling valve 100% open (877°C turbine inlet T, 96,300 RPM TAC shaft speed, 1 bar compressor inlet pressure). ......................................... 52
Figure 53. MAGNET PCU operating point with throttling valve 25% open (877°C turbine inlet T, 96,300 RPM TAC shaft speed, 1 bar compressor inlet pressure). .............................................. 52
Figure 54. Throttling valve pressure drop (flow coefficient Cv of 150) versus position. ........................... 53
Figure 55. Reactor thermal power as a function of throttling valve pressure drop with turbine inlet temperature as a parameter. ........................................................................................................ 54
Figure 56. PCU net power as a function of throttling valve pressure drop with turbine inlet temperature as a parameter. ........................................................................................................ 54
Figure 57. PCU cycle efficiency as a function of throttling valve pressure drop with turbine inlet temperature as a parameter. ........................................................................................................ 55
Figure 58. Reactor thermal power as a function of compressor inlet pressure with TAC shaft speed as a parameter. .................................................................................................................. 56
Figure 59. Net power as a function of compressor inlet pressure with TAC shaft speed as a parameter. ................................................................................................................................... 57
Figure 60. Cycle thermal efficiency as a function of compressor inlet pressure with TAC shaft speed as a parameter. .................................................................................................................. 57
Figure 61. Gas cooler duty as a function of compressor inlet pressure with TAC shaft speed as a parameter. ................................................................................................................................... 58
Figure 62. Reactor thermal power as a function of gas cooler outlet temperature with turbine inlet temperature as a parameter. ........................................................................................................ 59
Figure 63. Cycle net power as a function of gas cooler outlet temperature with turbine inlet temperature as a parameter. ........................................................................................................ 59
Figure 64. Cycle thermal efficiency as a function of gas cooler outlet temperature with turbine inlet temperature as a parameter. ................................................................................................ 60
Figure 65. Net power versus TAC shaft speed. .......................................................................................... 62

xiii
Figure 66. Working fluid mass flow rate as function of TAC shaft speed with 500°C turbine inlet temperature and 1 bar compressor inlet pressure. ....................................................................... 62
Figure 67. Reactor thermal power as function of TAC shaft speed with 500°C turbine inlet temperature and 1 bar compressor inlet pressure. ....................................................................... 63
Figure 68. Reactor thermal power as function of turbine inlet temperature with 80,000 RPM TAC shaft speed and 1 bar compressor inlet pressure. ........................................................................ 63
Figure 69. Excess power versus TAC shaft speed for a fixed reactor power. When Px > 0 RPM increases, when Px < 0 RPM decreases. ..................................................................................... 65
Figure A-1. Cycle net power as a function of TAC shaft speed with turbine inlet temperature as a parameter. ..................................................................................................................................... 1
Figure A-2. Reactor thermal power as a function of TAC shaft speed with turbine inlet temperature as a parameter. .......................................................................................................... 1
Figure A-3. Working fluid mass flow rate as a function of TAC shaft speed with turbine inlet temperature as a parameter. .......................................................................................................... 2
Figure A-4. Cycle thermal efficiency as a function of TAC shaft speed with turbine inlet temperature as a parameter. .......................................................................................................... 2
Figure A-5. Compressor outlet pressure as a function of TAC shaft speed with turbine inlet temperature as a parameter. .......................................................................................................... 3
Figure A-6. Recuperator effectiveness as a function of TAC shaft speed with turbine inlet temperature as a parameter. .......................................................................................................... 3
Figure A-7. Gas cooler duty as a function of TAC shaft speed with turbine inlet temperature as a parameter. ..................................................................................................................................... 4
Figure A-8. Cycle net power as a function of turbine inlet temperature with TAC shaft speed as a parameter. ..................................................................................................................................... 4
Figure A-9. Reactor thermal power as a function of turbine inlet temperature with TAC shaft speed as a parameter. .................................................................................................................... 5
Figure A-10. Working fluid mass flow rate as a function of turbine inlet temperature with TAC shaft speed as a parameter. ........................................................................................................... 5
Figure A-11. Cycle thermal efficiency as a function of turbine inlet temperature with TAC shaft speed as a parameter. .................................................................................................................... 6
Figure A-12. Compressor outlet pressure as a function of turbine inlet temperature with TAC shaft speed as a parameter. ........................................................................................................... 6
Figure A-13. Recuperator effectiveness as a function of turbine inlet temperature with TAC shaft speed as a parameter. .................................................................................................................... 7
Figure A-14. Gas cooler duty as a function of turbine inlet temperature with TAC shaft speed as a parameter. ..................................................................................................................................... 7
Figure A-15. Cycle net power as a function of throttling valve pressure drop with turbine inlet temperature as a parameter. .......................................................................................................... 8
Figure A-16. Reactor thermal power as a function of throttling valve pressure drop with turbine inlet temperature as a parameter. .................................................................................................. 8
xiv
Figure A-17. Working fluid mass flow rate as a function of throttling valve pressure drop with turbine inlet temperature as a parameter. ...................................................................................... 9
Figure A-18. Cycle thermal efficiency as a function of throttling valve pressure drop with turbine inlet temperature as a parameter. .................................................................................................. 9
Figure A-19. Compressor outlet pressure as a function of throttling valve pressure drop with turbine inlet temperature as a parameter. All data points based on compressor inlet pressure specification of 1 bar. ................................................................................................... 10
Figure A-20. Recuperator effectiveness as a function of throttling valve pressure drop with turbine inlet temperature as a parameter. .................................................................................... 10
Figure A-21. Gas cooler duty as a function of throttling valve pressure drop with turbine inlet temperature as a parameter. ........................................................................................................ 11
Figure A-22. Cycle net power as a function of compressor inlet pressure with TAC shaft speed as a parameter. ................................................................................................................................ 11
Figure A-23. Reactor thermal power as a function of compressor inlet pressure with TAC shaft speed as a parameter. .................................................................................................................. 12
Figure A-24. Working fluid mass flow rate as a function of compressor inlet pressure with TAC shaft speed as a parameter. ......................................................................................................... 12
Figure A-25. Cycle thermal efficiency as a function of compressor inlet pressure with TAC shaft speed as a parameter. .................................................................................................................. 13
Figure A-26. Compressor outlet pressure as a function of compressor inlet pressure with TAC shaft speed as a parameter. ......................................................................................................... 13
Figure A-27. Recuperator effectiveness as a function of compressor inlet pressure with TAC shaft speed as a parameter. .................................................................................................................. 14
Figure A-28. Gas cooler duty as a function of compressor inlet pressure with TAC shaft speed as a parameter. ................................................................................................................................ 14
Figure A-29. Cycle net power as a function of gas cooler outlet temperature with turbine inlet temperature as a parameter. ........................................................................................................ 15
Figure A-30. Reactor thermal power as a function of gas cooler outlet temperature with turbine inlet temperature as a parameter. ................................................................................................ 15
Figure A-31. Working fluid mass flow rate as a function of gas cooler outlet temperature with turbine inlet temperature as a parameter. .................................................................................... 16
Figure A-32. Cycle thermal efficiency as a function of gas cooler outlet temperature with turbine inlet temperature as a parameter. ................................................................................................ 16
Figure A-33. Compressor outlet pressure as a function of gas cooler outlet temperature with turbine inlet temperature as a parameter. .................................................................................... 17
Figure A-34. Recuperator effectiveness as a function of gas cooler outlet temperature with turbine inlet temperature as a parameter. ................................................................................................ 17
Figure A-35. Gas cooler duty as a function of gas cooler outlet temperature with turbine inlet temperature as a parameter. ........................................................................................................ 18

xv
TABLES Table 1. Description of components in the PCU loop. ................................................................................. 5
Table 2. Capstone C30 performance specifications. ..................................................................................... 8
Table 3. MAGNET Microturbine PCU design parameters. ........................................................................ 28
Table 4. Proposed MAGNET PCU control scheme testing. ....................................................................... 67
Table 5. Proposed MAGNET PCU system perturbation testing. ................................................................ 69

xvi
ACRONYMS CBC Closed Brayton Cycle
CIP Compressor Inlet Pressure
EDR Exchanger Design and Rating
HX Heat Exchanger
INL Idaho National Laboratory
MAGNET Microreactor Agile Non-nuclear Experimental Testbed
NTU Number of transfer units
P&ID Piping and Instrumentation Diagram
PCU Power Conversion Unit
PFD Process Flow Diagram
PID Proportional–Integral–Derivative
PMAD Power Management and Distribution
REFPROP REFerence fluid PROPperties
RPM Revolutions per Minute
RHX Reactor Heat Exchanger
RX Reactor
SI System International
SS Shell side
Sandia Sandia National Laboratories
TAC Turbine-Alternator-Compressor
TS Tube side

xvii
Page intentionally left blank
1
Integration of a Microturbine Power Conversion Unit 1. INTRODUCTION
Microreactors, also known as very-small modular reactors or special purpose reactors, are being considered for use in unique applications where other methods of megawatt-level energy production are uneconomical or unavailable. These microreactors are envisioned to be:
• Factory manufacturable
• Transportable by truck, plane, train, and/or ship
• Able to produce <20 megawatt thermal (MWth) energy (to qualify as Hazard Category 2 under 10 CFR 830)
• Capable of semi- or fully autonomous operation.
Various types of microreactors are under development, including gas-, liquid-metal-, molten-salt-, and heat-pipe-cooled concepts. In the United States (U.S.), microreactors could be deployed as early as the mid-2020s.
The Microreactor Agile Non-nuclear Experimental Testbed (MAGNET) facility (illustrated in Figure 1) is being constructed to assist with the development, demonstration, and validation of microreactor components and systems [1]. The purpose of the test bed is to support technology maturation that will reduce uncertainty and risk relative to the operation and deployment of this unique class of systems. Within MAGNET, systems and components can be safely tested, providing valuable information on failure modes, operating regimes, and thresholds. The goal is to provide a testbed that is broadly applicable to multiple microreactor concepts. Performance testing of relevant components will be conducted under prototypical conditions to ensure safe operation of the microreactor.
The test bed is not required to simulate all of the physical processes and phenomena, just those that either directly yield certain safety and performance figures of merit or provide data that can be used in the broader evaluation to yield other important information. To increase the technological maturity of these reactors, MAGNET is being designed to simulate the reactor core and heat removal section thermal hydraulic performance data for prototypical geometries and operating designs and demonstrate integration with relevant power conversion units (PCUs). The MAGNET facility will be used for evaluating microreactor test article performance at representative operating conditions [2]. The test articles evaluated in the MAGNET facility will be non-nuclear units heated using electrical resistance heaters. MAGNET experiments will evaluate heat transfer and materials performance during tests in which the test article transfers heat to a working fluid coolant that is circulated through the system.
MAGNET will have the ability to simulate the certain aspects of the microreactor envelope of the microreactor, mainly focusing on thermal and structural evaluations [3]. Test articles are being developed to demonstrate the performance of key components of proposed microreactor systems that represent components that have not been previously tested and deployed in nuclear reactors, such as heat pipes or printed circuit heat exchangers. Auxiliary systems to produce electricity or commodities, such as the PCU, desalination equipment, chemical conversion, and waste heat recovery, can be attached to the test bed to demonstrate the utility of these systems. MAGNET is located in a high bay in INL’s Energy Systems Laboratory facility, where there are other research capabilities, including facilities for testing electrolysis (High-Temperature Steam Electrolysis), transportation battery systems, real-time grid simulation, and thermal energy storage. The MAGNET PCU could integrate with any of these systems in future testing to evaluate system integration, controls, and performance of integrated energy systems with microreactor-based energy input.

2
Figure 1. MAGNET deployment in INL’s Energy Systems Laboratory building, Systems Integration Laboratory.
This report provides an analysis of integrating the PCU into MAGNET. Section 2 describes the integration of the PCU in the MAGNET loop and the testing objectives. The PCU components and process design are provided. Section 3 includes the PCU operation and performance normal, off-design, control schemes, and process start up and shut down. Section 4 outlines proposed static, dynamic, and control systems testing.
2. INTEGRATION OF POWER CONVERSION UNIT IN MAGNET PCUs are required to convert the nuclear heat to useable power. As such, the integration of PCUs
with the various reactor concepts under development is an essential element to the successful deployment of microreactors. The MAGNET facility provides a test platform for evaluating the integration of PCUs with electrically heated core designs and compact heat exchangers. MAGNET has an environmental chamber capable of 10-3 torr vacuum to atmospheric pressure, a heat removal capacity of 250 kW, a design pressure of 22 bar, and a maximum test article temperature of 750°C. The coolant, limited to 650°C, is either compressed N2 or He flowing in a closed loop with a recuperative heat exchanger, and heat rejection is provided by chilled water (see Figure 2). The compressor and chiller are located on an outdoor pad separated from the test chamber by a rollup door as illustrated in Figure 3. MAGNET provides connectivity to test a variety of electrically heated microreactor core concepts, heat exchangers, and auxiliary systems (such as PCUs and process heat or cooling systems) as illustrated in Figure 4. The heat exchanger is a key component necessary to remove the heat from the test article and supply it to the PCU.

3
Figure 2. MAGNET subsystems.
Figure 3. Equipment layout in MAGNET.
Figure 4. The heat exchanger removes heat from the test article and supplies it to the PCU.
Test article PCUHeat exchanger

4
Brayton cycles, including open air, recuperated air, helium, and supercritical CO2, have been investigated for coupling with microreactors [4,5]. In a previous study, a concept for PCU simulators was investigated to extract the heat from the heat exchanger and mimic the thermal hydraulic conditions that would be experienced if an actual Brayton cycle power conversion unit is attached. To appropriately simulate the effects of the power and/or thermal conversion units, a set of thermal hydraulic conditions was developed using process modeling. A separate flow loop was designed to incorporate a standalone compressor and valve/heat exchanger combination to emulate a turbine to produce Brayton cycle flow conditions [7]. The initial PCU simulator design was being revised to match not only turbine outlet, but turbine inlet, conditions when an actual PCU used for previous testing at Sandia National Laboratories became available at minimal cost to the program. Due to the high-estimated cost of the PCU simulator and the option of using the Sandia PCU, the simulator concept was abandoned in favor of using an actual PCU.
2.1 PCU Testing Objectives Integration of microturbine hardware with the MAGNET test facility will provide the capability to
perform PCU tests relevant to microreactor electrical power generation applications. Potential MAGNET PCU tests include: (1) replication of optimized PCU operating conditions, (2) transient testing, (3) control system testing, and (4) integrated energy systems testing. The data from these tests will provide a basis for comparing and validating aspects of the steady-state and dynamic models being used to design Brayton cycles for microreactor power generation.
Brayton cycles are ideal for microreactor PCUs since they have the advantage of not needing to be tied to a water supply for removing the waste heat from the power cycle. Therefore, they can be deployed to remote areas or anywhere a water supply is not readily available. Few nuclear reactors have been coupled to a CBC besides the ML-1 experimental reactor, which first generated electricity in 1962 and operated for 3 years. This compact, mobile reactor was coupled directly to a recuperated closed-cycle, gas-driven turbomachine [8]. There are potential issues associated with the controllability of reactors and CBC systems. Because of the limited experience of coupling reactors and CBC systems, accurate modeling of these systems is extremely important. Most land-based gas turbine power generation systems operate with open cycles using air as the working fluid. In open-cycle systems, the compressor inlet pressure is one atmosphere if operated at sea level, less if it is operated at high altitude. An advantage of CBCs is the ability to operate well above atmospheric pressures.
There are many potential electrical power generation applications for microreactor-based PCUs. Demonstrating that the test article (hereafter also referred to as “reactor”) heat exchanger is able to achieve the design heat output performance at representative PCU operating conditions (specifically reactor heat exchanger temperature, pressure, and flow rate) is important for verifying that simulated PCU performance levels can be attained. Most, if not all, applications would experience transient operating conditions associated with changes in load and/or process operating conditions. Example transient conditions include PCU startup/shutdown, load-following operations, safety events, such as reactor loss of power, etc. Transient testing would assess PCU performance in dynamic operating scenarios to provide the data necessary to evaluate and improve the PCU hardware and control system configurations.
2.2 Microturbine PCU Equipment Specifications The microturbine PCU to be used in MAGNET is a modified Capstone C30 unit that was previously
used for closed Brayton cycle (CBC) testing by Sandia. Standard Capstone C30 microturbine units are designed for terrestrial power generation using a natural gas fuel source, which is combusted within an internal combustion chamber. The modified Capstone C30 has been reconfigured to allow heat input from an external source. Therefore, repurposing the Sandia unit will provide a microturbine unit with specifications well suited for PCU testing with heat sources that generally match the thermal capacity ratings of the test articles that will be tested in the MAGNET facility.

5
Figure 5 shows a schematic of the turbine-alternator-compressor (TAC) CBC integrated into MAGNET. The cycle is completely closed and gas flows through the compressor and recuperator into the reactor heat exchanger, into the turbine, back into the recuperator, and finally into the waste heat rejection system (i.e., gas cooler). The turbine, compressor, and alternator are all mounted on the same shaft; therefore, they rotate at the same speed. The TAC recuperator is a gas-gas heat exchanger, whereas the reactor heat exchanger can be gas-gas or liquid-gas depending upon the reactor design. The Power Management and Distribution subsystem rectifies and regulates the three-phase voltage and current, and distributes power to the load and bus. It is also used to regulate the total electrical load and the frequency rotational speed of the TAC. Power generated by the TAC can be fed to the electrical heaters in MAGNET. A description of the various legs comprising the CBC loop is given in Table 1.
Figure 5. Schematic of CBC loop in MAGNET.
Table 1. Description of components in the PCU loop. Leg Inlet Component Outlet Component
1 Gas Cooler Outlet Compressor Inlet 2 Compressor Outlet Recuperator Inlet Low-Temperature (LT) Leg 3 Recuperator Outlet LT Leg Reactor Heat Exchanger Inlet 4 Reactor HX Outlet Turbine Inlet 5 Turbine Outlet Recuperator Inlet High-Temperature (HT) Leg 6 Recuperator Outlet HT Leg Gas Cooler Inlet
The following subsections provide details of the MAGNET PCU major process equipment
components, including the gas heater, compressor and turbine, internal recuperator, and gas cooler. Details presented for each component include the configuration, specifications, operating conditions, and approach for modeling performance at design and partial load conditions, as applicable.
ReactorHX
PMAD
Turbine
Compressor
Alternator
Gas cooler
Recuperator
MAGNET test loop
1
3
5
4
2
6

6
2.2.1 Gas Heating The heat input to the PCU working fluid will be obtained from the MAGNET test articles, with the
heat transfer taking place through the reactor heat exchanger (RHX). With this arrangement, the heat is transferred at a lower temperature (since MAGNET is limited to a maximum temperature of 750°C) than in the original C30 configuration with natural gas combustion.
MAGNET provides the ability to test different types of microreactor components. The first test article for MAGNET shakedown testing will be a heat pipe design with six electrical resistance heaters and a single sodium-filled heat pipe. Following that initial test, a 2-m-long test article with 37 high-temperature, sodium-filled heat pipes that extend from the core to the heat removal section (see Figure 6) will demonstrate an electrically heated test article connected to the PCU in MAGNET. The 37 heat pipes test article will use 54 electrical resistance cartridge heaters that will provide a total power of ~75 kWt [9]. The heat pipe nominal operating temperature is 650°C. The 37 heat pipes test article employs a double-pipe type heat exchanger that is bonded directly to the test article, whereas follow-on test articles will likely use a compact platelet type heat exchanger.
(a)
(b) (c)
Figure 6. (a) Cross section of 37 heat pipes core block geometry, (b) test article core, and (c) heat removal section.
Core
Heat Exchanger
Tube sheet
Cap
Heat Pipes
eFill Interface

7
2.2.2 Compressor and Turbine The Capstone C30 is a microturbine unit designed for electrical power generation from hydrocarbon
fuel combustion. The C30 is a commercially available product that includes the TAC components packaged in a compact unit. The C30 includes a single-stage centrifugal compressor to pressurize the inlet gas and a radial turbine to expand the heated high-pressure gas. The unit also includes an integrated recuperator to recover thermal energy from the turbine exhaust stream for use in preheating the heater inlet stream. A cutaway view of a C30 TAC assembly is shown in Figure 7.
Figure 7. Cutaway view of the commercial Capstone C30 TAC unit [11].
The TAC components operate on a common shaft such that all components rotate at the same speed. The shaft is supported via gas bearings that enable it to spin at rotational speeds approaching 100,000 revolutions per minute (RPM). The maximum rated power is ~30 kWe at 96,000 RPM and the minimum power is 1 kW at 45,000 RPM. A photograph showing the compressor and turbine arrangement of the C30 TAC unit is shown in Figure 8.
Figure 8. Compressor and turbine arrangement of the Capstone C30 TAC (photo courtesy of NASA Glenn Research Center) [14].

8
The C30 process controller allows the C30 shaft speed to be varied to modulate power output for load-following applications, and the system power electronics convert direct current power generated at the varying shaft speeds to alternating current power at a frequency that can be exported to the electrical grid. A summary of the Capstone C30 TAC specifications is listed in Table 2. As will be discussed below, a C30 unit modified to allow external heat addition will be used for microreactor CBC testing at the MAGNET facility. While the specifications listed in Table 2 apply to the natural gas combustion application, these specifications remain applicable for applications with similar heat input and operating conditions. MAGNET facility testing of the C30 TAC unit is expected to utilize a 75 kWt test article in a CBC configuration (as compared to 115 kWt in an open Brayton cycle configuration for the natural gas combustion application), so the performance of the C30 during MAGNET PCU testing is not expected to exactly match the conditions listed in Table 2. Further evaluation of the C30 TAC performance over a range of MAGNET PCU test conditions is included in Section 3.2
Table 2. Capstone C30 performance specifications. Specification Value Reference or note
Design Application Natural gas combustion [8, 12] Net power ~30 kWe [8, 10, 12] System efficiency 26% Lower Heating Value [12]; cited value is for hydrocarbon
fuel combustion applications Heat load 115 kWt [12]; calculated from net power and
system efficiency (Lower heating value basis)
Compressor type/size Centrifugal/109.2 mm diameter [8] Compressor efficiency 79% [10] Turbine type/size Radial/101.6 mm diameter [8] Turbine efficiency 84.3% [10] Pressure ratio 3.7 [8] Maximum pressure 413 kPa gauge (60 psig) [13] Shaft speed 96,000 RPM [8, 10] Turbine inlet temperature 824°C [10] Turbine exit temperature 593°C [10] Temperature ratio 1.27 Calculated from turbine inlet and
exit temperatures listed in [10] Exhaust gas flow rate 0.31 kg/s [8] Recuperator Effectiveness 0.86 [10] Recuperator Pressure Drop 5.01% [10] Total pressure loss 7.49% [10] Acoustic emissions 65 dBA (full power at 10 m) [13]
In the natural gas power generation application, the elevated temperature and pressure gas that is sent
to the C30 turbine is produced by using the compressor to pressurize inlet air before combusting the high-pressure air with natural gas in the combustion chamber. The combustion chamber is located inside the unit immediately adjacent to the turbine, as shown in Figure 6. In the MAGNET microturbine PCU application, heat addition will be provided by an electrically powered test article configured to provide thermal hydraulic performance representative of a nuclear microreactor. The test article is significantly larger in physical dimensions than the C30 microreactor combustion chamber; therefore, a modified

9
working fluid flow path is necessary to allow heat addition to the turbine inlet stream to occur external to the Capstone C30 microturbine unit.
The Capstone C30 microturbine unit to be tested in the MAGNET facility is a unit that will be obtained from Sandia. Sandia used the Capstone C30 unit to perform CBC testing as described in Sandia reports [14]. Working fluids including N2, Ar, CO2, He, 90%N2–10%Ar, 90%Ar–10%He, 80%Ar–20%He, and 70%N2–30%He, were used for flow characterization, transient modeling, static loop performance or inventory control tests [14]. The CBC testing performed by Sandia also investigated cases where the heat addition would be from a nuclear heat source. As is planned for the MAGNET performance evaluation of microreactor test articles, the Sandia CBC testing simulated the performance of a nuclear heat source using electric resistance heaters. The Sandia electric heaters were too large to be placed within the existing Capstone C30 combustion chamber; therefore, modifications to the C30 unit were performed to accommodate external heat addition.
Figure 9 shows a cross-sectional view of the Capstone C30 unit as modified by Sandia. The orange line depicts the flow path of the working fluid through the compressor and cold side of the recuperator. The red line depicts the flow path of the working fluid through the turbine and the hot side of the recuperator. The Sandia modifications allow the working fluid from the cold side of the recuperator to exit the C30 unit and flow to an external heating chamber (terminus of orange line). Following a heat addition in the external heater, the working fluid flows through an array of tubes (origin of red line) that penetrate the turbine exit dome, combustor annulus, and turbine inlet dome, respectively, to deliver the heated working fluid into the combustion chamber, at which point it is routed to the turbine inlet.
In the original unmodified Capstone C30 configuration, the gas stream does not leave the assembly at any point between the compressor inlet and the recuperator hot-side outlet. The high-pressure gas exiting the compressor flows into the cold side of the recuperator. The recuperator cold-side outlet stream flows through an annular duct positioned between the inner and outer turbine exhaust ducts before being redirected by 180 degrees in the reverse axial direction to the combustion chamber inlet. The heated gas leaving the combustion chamber enters the turbine in the radial direction and exits the turbine to the inner turbine exhaust duct. The inner turbine exhaust duct directs the stream away from the turbine exit in the axial direction. A turbine exit dome redirects the exhaust gas stream by 180 degrees to the outer turbine exhaust duct where it flows in the reverse axial direction to enter the hot side of the recuperator in a countercurrent heat exchange direction. The recuperator hot-side outlet stream is then exhausted from the assembly. The flow configuration described above is shown in Figure 9 by the path that starts by following the orange line, transitions to the white line, and ends with the red line.
Figure 9. Cross-sectional view of Capstone C30 microturbine assembly. The orange and red lines indicate the gas flow path including the region of the unit housing modified to allow external heat addition. The flow path through the compressor and recuperator are shown by the orange line. The flow path through the turbine and recuperator are shown by the red line [14].

10
In the modified C30 unit, the combustion chamber is bypassed to allow heat addition via an external gas heater. The modified configuration uses a set of ports that are retrofitted into the recuperator cold-side outlet (annular) duct to allow gas to exit the C30 assembly in a radial direction, as shown in Figure 8. The positioning of the outlet ports and the piping connecting the ports to the external heater inlet manifold are shown in Figure 10. The high-pressure fluid collected in the heater inlet manifold then is directed into the gas heater. In the Sandia CBC testing the gas heater was an electric unit that simulated heat input from a nuclear source. Similarly, in MAGNET testing the gas heater will be performed in an electrically heated microreactor test article that simulates heat addition at conditions representative of a full-scale microreactor unit.
Figure 10. Photograph of Capstone C30 piping modifications to divert the recuperator cold-side outlet stream to external heater unit.
Modifications performed by Sandia visible in Figure 10 include piping connecting four outlet ports to the heater inlet manifold [8]. For MAGNET testing, the externally heated working fluid will be reintroduced to the C30 assembly via the piping modifications implemented by Sandia. In the modified configuration, the working fluid flows from the external gas heater into the combustion chamber instead of from the recuperator cold-side outlet duct into the combustion chamber (the fluid is removed from the assembly via the recuperator cold-side outlet duct per the description above). To deliver the externally heated working fluid to the combustion chamber located in the interior of the C30 assembly, six ports were drilled in each of the three surfaces that form the ducts for transporting the working fluid into and out of the turbine. The three surfaces in which ports were added include the turbine exit dome, combustor annulus dome, and turbine inlet dome. Six tubes pass through the ports in each of these three surfaces and transport the heated working fluid into the combustion chamber. A photograph of the six tubes traversing each of the duct boundary surfaces is shown in Figure 11. Downstream of the combustion chamber the working fluid flows through the C30 assembly in a manner identical to the unmodified configuration, except for the fact that the flow travels around the tubes that penetrate each of the turbine exhaust ducts.
11
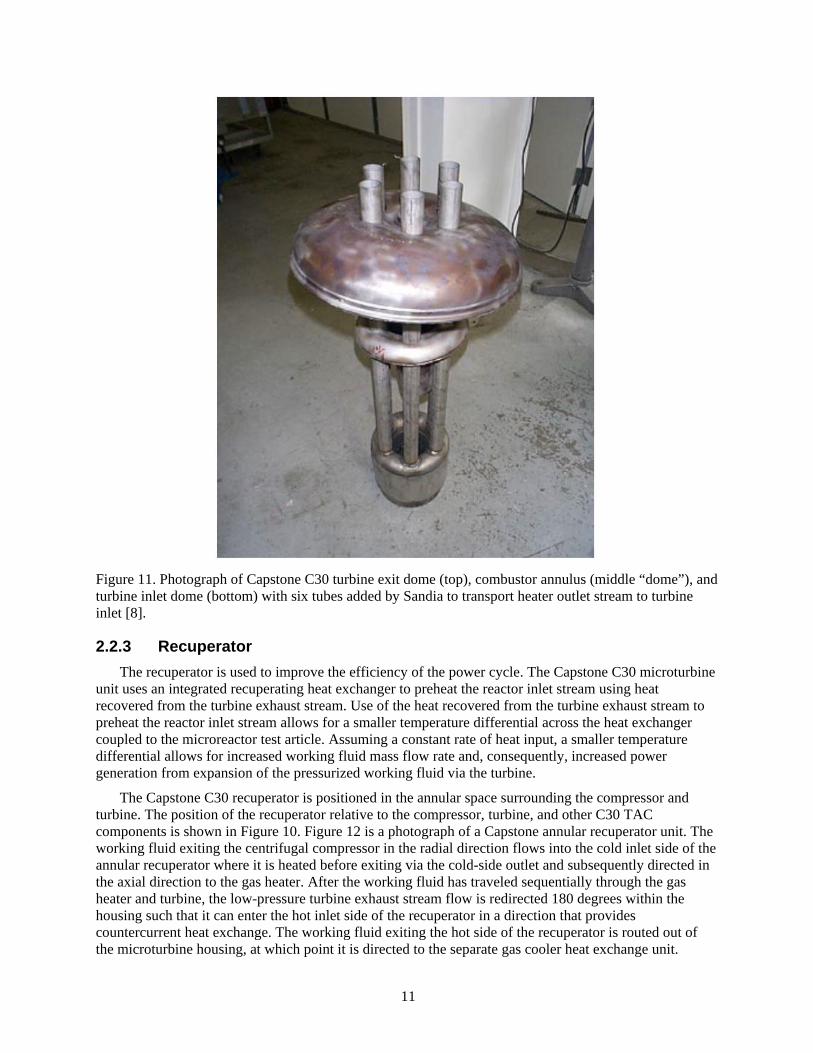
Figure 11. Photograph of Capstone C30 turbine exit dome (top), combustor annulus (middle “dome”), and turbine inlet dome (bottom) with six tubes added by Sandia to transport heater outlet stream to turbine inlet [8].
2.2.3 Recuperator The recuperator is used to improve the efficiency of the power cycle. The Capstone C30 microturbine
unit uses an integrated recuperating heat exchanger to preheat the reactor inlet stream using heat recovered from the turbine exhaust stream. Use of the heat recovered from the turbine exhaust stream to preheat the reactor inlet stream allows for a smaller temperature differential across the heat exchanger coupled to the microreactor test article. Assuming a constant rate of heat input, a smaller temperature differential allows for increased working fluid mass flow rate and, consequently, increased power generation from expansion of the pressurized working fluid via the turbine.
The Capstone C30 recuperator is positioned in the annular space surrounding the compressor and turbine. The position of the recuperator relative to the compressor, turbine, and other C30 TAC components is shown in Figure 10. Figure 12 is a photograph of a Capstone annular recuperator unit. The working fluid exiting the centrifugal compressor in the radial direction flows into the cold inlet side of the annular recuperator where it is heated before exiting via the cold-side outlet and subsequently directed in the axial direction to the gas heater. After the working fluid has traveled sequentially through the gas heater and turbine, the low-pressure turbine exhaust stream flow is redirected 180 degrees within the housing such that it can enter the hot inlet side of the recuperator in a direction that provides countercurrent heat exchange. The working fluid exiting the hot side of the recuperator is routed out of the microturbine housing, at which point it is directed to the separate gas cooler heat exchange unit.

12
Figure 12. Capstone microturbine annular recuperator [15].
According to Xiao et al [16], Capstone recuperators are a primary surface type recuperator with a cross-wavy flow pattern. A diagram of the cross-wavy surface construction is shown in Figure 13. A numerical investigation by Utriainen and Sundén [17] indicated that the cross-wavy duct configuration increases the Nusselt number by 600% compared to straight ducts. Correlations for cross-wavy recuperator Nusselt number and friction factor as functions of Reynolds number are provided in several studies [18–20].
Figure 13. Schematic of a cross-wavy recuperator surface [16].
Despite the availability of correlations for evaluating heat transfer and pressure drop, this analysis implemented a simplified evaluation of recuperator performance based on the number of transfer units (NTU)-effectiveness method due to minimal information availability regarding the details of the recuperator geometry and associated flow conditions.
2.2.3.1 NTU-Effectiveness Method The NTU-effectiveness method can be used to calculate the rate of heat transfer in various heat
exchanger geometries based on the inlet stream temperatures and the flow rate and heat capacity of the hot- and cold-side fluids. Heat exchanger effectiveness ε is defined as the ratio of actual heat transfer to the maximum possible heat transfer that could be obtained in a counterflow heat exchanger with infinite surface area.

13
𝜀𝜀 = 𝑞𝑞𝑞𝑞𝑚𝑚𝑚𝑚𝑚𝑚
(1)
The maximum possible heat transfer qmax is obtained by evaluating expressions for the heat capacity rates (product of mass flow rate and specific heat) of the hot- and cold-side fluids and then multiplying the minimum heat capacity rate by the maximum possible temperature difference. Expressions for Cmin and qmax are included below:
𝐶𝐶𝑚𝑚𝑚𝑚𝑚𝑚 = 𝑚𝑚𝑚𝑚𝑚𝑚��̇�𝑚𝑐𝑐𝑐𝑐𝑝𝑝,𝑐𝑐 , �̇�𝑚ℎ𝑐𝑐𝑝𝑝,ℎ , � (2)
𝑞𝑞𝑚𝑚𝑚𝑚𝑚𝑚 = 𝐶𝐶𝑚𝑚𝑚𝑚𝑚𝑚�𝑇𝑇ℎ,𝑚𝑚 − 𝑇𝑇𝑐𝑐,𝑚𝑚� (3)
where:
�̇�𝑚 designates the mass flow rate
𝑐𝑐𝑝𝑝 designates the fluid specific heat
T designates the stream temperature
Subscript i designates stream inlet conditions
Subscript c and h designate the cold and hot streams, respectively.
NTU is defined as:
𝑁𝑁𝑇𝑇𝑁𝑁 = 𝑈𝑈𝑈𝑈𝐶𝐶𝑚𝑚𝑚𝑚𝑚𝑚
(4)
where:
U is the overall heat transfer coefficient
A is the heat transfer area.
Mathematical expressions for effectiveness are available for many heat exchanger types. The effectiveness correlations generally take the form of 𝜀𝜀 = 𝑓𝑓(𝑁𝑁𝑇𝑇𝑁𝑁, 𝑐𝑐), where:
𝑐𝑐 = 𝐶𝐶𝑚𝑚𝑚𝑚𝑚𝑚𝐶𝐶𝑚𝑚𝑚𝑚𝑚𝑚
=��̇�𝑚𝑐𝑐𝑝𝑝�𝑚𝑚𝑚𝑚𝑚𝑚��̇�𝑚𝑐𝑐𝑝𝑝�𝑚𝑚𝑚𝑚𝑚𝑚
(5)
In this analysis a double-pipe counterflow heat exchanger recuperator model is used to evaluate the heat exchanger effectiveness. Although the recuperator geometry differs from a double-pipe configuration, the countercurrent, single-pass flow arrangement of this configuration is representative of the recuperator configuration. The effectiveness correlation for a double-pipe counterflow heat exchanger (coaxial configuration with single pass for both hot and cold fluids) can be calculated from the following relation [21]:
𝜀𝜀 = 1−𝑒𝑒𝑚𝑚𝑝𝑝[−𝑁𝑁𝑁𝑁𝑈𝑈(1−𝑐𝑐)]1−𝑐𝑐⋅𝑒𝑒𝑚𝑚𝑝𝑝[−𝑁𝑁𝑁𝑁𝑈𝑈(1−𝑐𝑐)] (6)
In the microturbine recuperator application the hot and cold-side fluids, and the flow rates of these fluids, are equal such that Cmin = Cmax and the above expression can be simplified to [21]:
𝜀𝜀 = 𝑁𝑁𝑁𝑁𝑈𝑈1+𝑁𝑁𝑁𝑁𝑈𝑈
(𝑓𝑓𝑓𝑓𝑓𝑓 𝑐𝑐 = 1) (7)
A plot of counterflow heat exchanger effectiveness as a function of NTU is given in Figure 14 [22].

14
Figure 14. Single-pass counterflow heat exchanger effectiveness versus NTU [22].
Knowledge of the effectiveness value and inlet stream temperatures allows the heat transfer rate to be calculated as follows:
𝑞𝑞 = 𝜀𝜀𝐶𝐶𝑚𝑚𝑚𝑚𝑚𝑚�𝑇𝑇ℎ,𝑚𝑚 − 𝑇𝑇𝑐𝑐,𝑚𝑚� (8)
Additionally, if the heat exchanger effectiveness is known (or equivalently, if all inlet and outlet stream temperatures are known), the NTU for the heat exchanger can be calculated providing insight as to the physical size of the exchanger in terms of the UA (product of overall heat transfer coefficient, U, and exchanger heat transfer surface area, A). The NTU for a double-pipe counterflow heat exchanger can be calculated from [22]
𝑁𝑁𝑇𝑇𝑁𝑁 = 1𝑐𝑐−1
𝑙𝑙𝑚𝑚 � 𝜀𝜀−1𝜀𝜀𝑐𝑐−1
� (𝑓𝑓𝑓𝑓𝑓𝑓 𝑐𝑐 < 1) (9)
When c=1 the expression for double-pipe counterflow heat exchanger NTU is [22]:
𝑁𝑁𝑇𝑇𝑁𝑁 = 𝜀𝜀1−𝜀𝜀
(𝑓𝑓𝑓𝑓𝑓𝑓 𝑐𝑐 = 1) (10)
2.2.3.2 Microreactor PCU Recuperator Performance Evaluation The Capstone C30 microturbine recuperator effectiveness at the design operating point was assumed
equal to a value of 86% [10]. Based on the equations presented above, for an effectiveness ε = 0.86 the corresponding double-pipe counterflow heat exchanger NTU = 6.1. At the microturbine PCU design operating point shown in the HYSYS model process flow diagram (Section 2.3, Figure 31), the heat capacity rate Cmin is equal to 0.28 W/K such that the recuperator overall UA is equal to 1.7 W/K. This value agrees with recuperator UA value calculated in the HYSYS process simulator using a weighted end point heat exchanger model (in the HYSYS model, the recuperator outlet stream temperatures were calculated based on the specified recuperator effectiveness).
2.2.4 Gas Cooler Two options exist for heat exchangers that could be used for the MAGNET PCU gas cooler. The first
option is to utilize the XLG® shell and tube heat exchanger that will be used to provide gas cooling during testing of MAGNET microreactor test articles. The second option is to use the Basco®/Whitlock®

15
shell and tube heat exchanger that was used with the modified Capstone C30 microturbine during Sandia CBC testing. The configuration and specifications of the XLG® and Basco®/Whitlock® heat exchangers are described in the following subsections.
2.2.4.1 MAGNET Gas Cooler The MAGNET facility includes a heat exchanger for cooling the working fluid prior to entering the
gas compressor (see Figure 4). The MAGNET gas cooler is specified as an XLG® I-6 in./19 × 1 in.–60 in. -304/304-X shell and tube heat exchanger with 24 ft² of heat transfer surface area.
The MAGNET gas cooler design is based on operating conditions that correspond to use of a 250 kWt test article. The MAGNET gas cooler has a nominal heat rejection capacity of 275 kWt; therefore, it may be suitable for providing heat rejection for microturbine PCU testing with 75 kWt test articles (the heat input of the microturbine PCU tests is limited by the capacity of the Capstone C30 TAC).
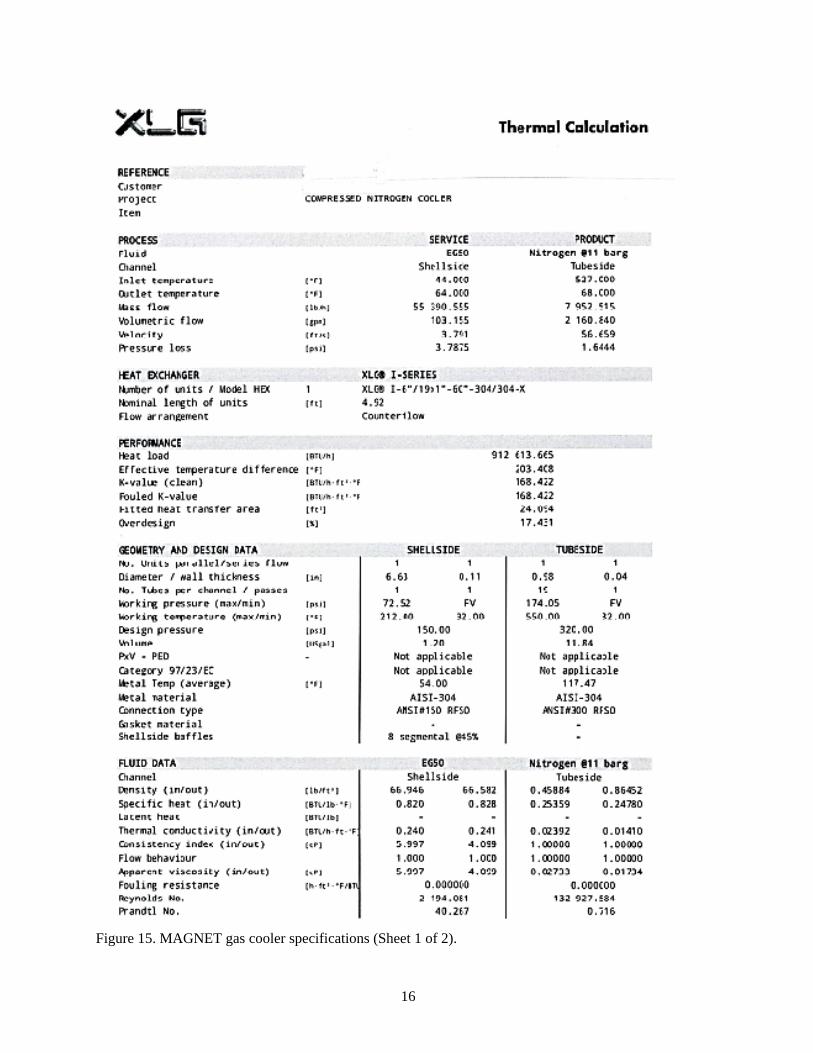
Specifications for the XLG® heat exchanger are shown in Figure 15 and Figure 16. The XLG® heat exchanger specification sheet indicates that a tube-side corrugated pattern heat transfer surface is used. INL representatives requested additional information from XLG® regarding the specifications of the corrugated heat transfer surface but were unsuccessful in obtaining this information.
16
Figure 15. MAGNET gas cooler specifications (Sheet 1 of 2).

17
Figure 16. MAGNET gas cooler specifications (Sheet 2 of 2).
250 kWt Test Article MAGNET Operations

18
Heat exchanger performance was simulated at design conditions to compare predicted performance with that of the manufacturer. The gas cooler design condition corresponds to operation of the MAGNET test loop with a 250 kWt test article and nitrogen working fluid.
AspenTech Exchanger Design and Rating (EDR) software in rating mode was used to predict heat exchanger performance. The EDR heat exchanger rating mode requires the user to input heat exchanger geometry specifications along with the relevant inlet and outlet process conditions. The software then evaluates the heat exchanger performance, including the ratio of the actual-to-required heat exchanger area. If the actual/required area ratio is less than one, the heat exchanger is predicted to have insufficient heat transfer surface area, while if the actual/required area ratio is greater than one, excess heat transfer area is predicted. If the actual/required area ratio is equal to one, it is predicted that the exchanger will provide exactly the heat load that corresponds to the specified inlet and outlet conditions.
As a baseline estimate of the heat exchanger performance, a heat exchanger configuration matching the XLG® exchanger specifications except with plain tube construction was specified in the EDR analysis. Assuming equal tube length and tube diameter, the heat transfer area associated with plain tubes is less than that for tubes with internal corrugation. Therefore, the reduced heat transfer area of the plain tube configuration would be expected to result in decreased heat transfer capacity at otherwise equal process operating conditions.
Results of the AspenTech EDR rating analysis for the plain tube construction are shown in Figure 17 and Figure 18. The results of this analysis are consistent with the expectation that excluding heat transfer enhancements from the tubes would decrease exchanger duty. As can be observed from these figures, the actual/required area without use of internal tube heat transfer enhancements is 18% indicating that the heat exchanger would not be expected to satisfy the heat load at design conditions.
Figure 17. XLG® shell and tube exchanger without tube internal enhancements EDR rating analysis results (U.S. units).

19
Figure 18. XLG® shell and tube exchanger without tube internal enhancements EDR rating analysis results (SI units).
A subsequent analysis was also performed in which the EDR input was modified to replicate the manufacturer design specifications. Since no details of the tube corrugation were available, this analysis did not attempt to modify the geometry of the tubes but instead iteratively change the heat transfer specification for the tube enhancements to identify input parameters that result in the exchanger matching the manufacturer’s published specifications. The EDR software includes the ability to specify the Sieder-Tate coefficient to account for the presence of tube internal enhancements. The Sieder-Tate correlation predicts the Nusselt number in turbulent pipe flow [21]:
𝑁𝑁𝑁𝑁 = 0.023𝑅𝑅𝑅𝑅𝐷𝐷0.8𝑃𝑃𝑓𝑓1 3⁄ � 𝜇𝜇𝜇𝜇𝑤𝑤�0.14
(11)
where:
ReD is the Nusselt number based on the inside diameter D of the pipe
Pr is the Prandtl number
μ is the fluid viscosity at the bulk fluid temperature
μw is the fluid viscosity at the heat transfer boundary surface temperature.
The Sieder-Tate is used for flows with large temperature differences and accounts for the variation in fluid viscosity with temperature. Modifications to the Sieder-Tate coefficient will have a linear effect on the value of the Nusselt number and the corresponding tube-side convective heat transfer coefficient. The Sieder-Tate coefficient value selected to achieve an actual/required area value of 1.0 was selected by trial and error. It was determined that modifying the Sieder-Tate coefficient to a value of 0.165 resulted in a required/actual area ratio of 1.0 for the MAGNET 250 kWt test design operating conditions as calculated by Aspen EDR. The heat exchanger overall performance calculation results for the EDR heat exchanger rating calculation using the modified Sieder-Tate coefficient are shown in Figure 19 and Figure 20.

20
Since the updated Sieder-Tate coefficient does not attempt to incorporate details of the tube geometry, it is unknown exactly what type of tube internal enhancement geometry(ies) would correspond to the updated coefficient of 0.165. It is worth noting that the EDR output included a warning message that the expected input range for the Sieder-Tate coefficient for tube internal enhancement ranges from 0.01 to 0.1. The Sieder-Tate coefficient value of 0.165 selected to achieve an actual/required area ratio of 1.0 is outside the expected input range, which implies that the corrugated pattern used to enhance the tube-side heat transfer performance provides significant heat transfer performance enhancement. If the corrugated pattern is damaged, becomes fouled, or is otherwise unable to perform as designed, it is expected that the XLG® shell and tube heat exchanger would be unable to achieve the level of heat transfer performance required to meet the design point heat load requirements.
Figure 19. XLG® shell and tube exchanger with tube internal enhancement EDR rating analysis results (U.S. units).
Figure 20. XLG® shell and tube exchanger with tube internal enhancement EDR rating analysis results (SI units).
75 kWt Test Article MAGNET Microturbine PCU Configuration

21
Following evaluation of heat exchanger performance for the MAGNET 250 kWt test article design point conditions, the performance of the XLG® heat exchanger was evaluated to assess its ability to reject heat from the MAGNET microturbine PCU system configured with a 75 kWt test article for heat addition and the Capstone C30 TAC used for power generation. The EDR rating analysis was performed using gas cooler inlet and outlet conditions corresponding to the microturbine PCU with 75 kWt reactor heat input (Section 3.2.3, Figure 44). At the specified microturbine PCU operating conditions, the XLG® heat exchanger configuration with plain tubes resulted in an actual/required area ratio of 0.26, while the corrugated tube configuration with a modified Sieder-Tate coefficient of 0.165 resulted in an actual/required area ratio of 1.77. These results indicate that a heat exchanger with dimensions corresponding to those of the XLG® shell and tube heat exchanger specified in Figure 14 and Figure 15 would require tube-side internal enhancement to meet the gas cooler heat load requirements of the 75 kWt test article microturbine PCU system. The XLG® shell and tube heat exchanger with a corrugated surface tube-side heat transfer enhancement should satisfy heat rejection requirements provided the actual performance is consistent with that reported on the manufacturer-provided thermal calculation sheet.
In addition to the EDR heat exchanger rating analysis, an EDR heat exchanger simulation was performed for conditions corresponding to microturbine PCU operation with a 75 kWt test article. The EDR heat exchanger simulation predicts the exchanger outlet conditions based on specified heat exchanger geometry and inlet conditions. In this analysis, the specified gas cooler inlet conditions corresponded to the MAGNET microturbine PCU operating conditions from Section 3.2.3, Figure 44. The simulated heat exchanger outlet conditions were calculated using a modified Sieder-Tate coefficient of 0.165 to account for the corrugated internal tube surface per the above discussion. The predicted outlet conditions for the XLG® shell and tube heat exchanger are shown in Figure 21 and Figure 22. The temperature profiles of the hot and cold streams along the exchanger length are included in Figure 23. The nitrogen outlet temperature predicted by the EDR simulation is 46.9°F (8.3°C).
Figure 21. XLG® I-6 in./19 × 1 in.-60 in.-304/304-X shell and tube exchanger EDR simulation results (U.S. units).

22
Figure 22. XLG® I-6 in./19 × 1 in.-60 in.-304/304-X shell and tube exchanger EDR simulation results (SI units).
Figure 23. XLG® I-6 in./19 × 1 in.-60 in.-304/304-X shell and tube exchanger EDR simulation stream temperature profiles (TS=tube side, SS=shell side).

23
2.2.4.2 Sandia CBC Gas Cooler Sandia previously tested a CBC for simulated nuclear applications [8]. The Sandia CBC included a
Watlow 80 kWe electric gas heater for heat addition to the working fluid circulating through the ~30 kWe recuperated Capstone C30 TAC unit modified for external heat addition. A Basco®/Whitlock® shell and tube heat exchanger supplied cooling to the working fluid exiting the hot side of the TAC recuperator. The Basco®/Whitlock® shell and tube heat exchanger used by Sandia for CBC testing is rated for 69.4 kWt of heat removal at the design conditions [8]. Gas flows inside of the tubes and water flows in the surrounding space. The Basco®/Whitlock® shell and tube heat exchanger specification sheet are included as Figure 24.
Figure 24. Specification sheet of Basco®/Whitlock® shell and tube heat exchanger used for Sandia CBC gas cooling application.

24
The Basco®/Whitlock® shell and tube exchanger used for Sandia CBC testing could also be used for gas cooling in the MAGNET microturbine PCU testing using a 75 kWt test article and the Capstone C30 microturbine unit. Since the Basco®/Whitlock® shell and tube exchanger has already been demonstrated to effectively reject heat during Sandia CBC testing, it would also be possible to use this exchanger for MAGNET microturbine PCU heat rejection since the heat input would only be approximately 5 kW greater than in the Sandia CBC testing.
The Basco®/Whitlock® shell and tube exchanger specifications listed in Figure 23 were input into Aspen EDR to independently predict heat transfer performance for this exchanger. Although carbon steel baffles are listed on the exchanger specification sheet, no spacing or baffle count information is provided. It was assumed for this analysis that single segmental baffles at a spacing of 18 inches are present in the heat exchanger. The EDR heat exchanger rating analysis results are shown in Figure 25 and Figure 26. The EDR rating analysis indicates that the actual/required area ratio for a clean heat exchanger is 0.98, suggesting that this heat exchanger area is approximately equal to that needed to achieve the design level of heat rejection.
Figure 25. Basco®/Whitlock® 08-114 shell and tube exchanger EDR rating analysis results (U.S. units).
Figure 26. Basco®/Whitlock® 08-114 shell and tube exchanger EDR rating analysis results (SI units).
In addition to the EDR heat exchanger rating analysis, an EDR heat exchanger simulation was performed with inlet conditions corresponding to those listed on the Basco®/Whitlock® exchanger

25
specification sheet. The predicted outlet conditions for the Basco®/Whitlock® shell and tube heat exchanger are shown in Figure 27 and Figure 28. The temperature profiles of the hot and cold streams along the exchanger length are included in Figure 29. The nitrogen outlet temperature predicted by the EDR simulation is 98.6°F (37°C).
Figure 27. Basco®/Whitlock® 08-114 shell and tube exchanger EDR simulation results (U.S. units).
Figure 28. Basco®/Whitlock® 08-114 shell and tube exchanger EDR simulation results (SI units).

26
Figure 29. Basco®/Whitlock® 08-114 shell and tube exchanger EDR simulation stream temperature profiles.
It is worth noting that the design performance is based on a cooling water inlet temperature of 70°F (21.1°C), but in practice it is expected that a lower temperature cooling water source would be available, resulting in a greater mean temperature difference and additional heat removal from the hot-side inlet working fluid stream. For example, if a 50°F (10°C) cooling water source at the 24,750 lb/hr (3.1 kg/s) flow rate specified in the manufacturer specification sheet (Figure 23) were used, an EDR simulation of heat exchanger performance suggests that the 2088-lb/hr (0.26 kg/s) nitrogen hot-side inlet stream could be cooled from 540°F (282.2°C) to 80°F (26.8°C) instead of 95°F (35°C). It is also stated in Sandia reporting that the Basco®/Whitlock® 08-114 heat exchanger is designed to reject 68.9 kW of heat at a cooling water flow rate of 18 gpm, but that the heat exchanger is oversized for the design conditions and is capable of handling cooling water flow rates up to 50 gpm for increased heat rejection [8]. The XLG® heat exchanger specified for use in the MAGNET facility is rated for a cooling water inlet flow rate of 103 gpm (Figure 14) for heat rejection during operations with 250 kWt test articles, indicating that use of valves or a piping arrangement to reduce the cooling water flow rate would be required if the Basco®/Whitlock® exchanger were used in MAGNET operations with test articles having thermal power ratings sufficiently below 250 kWt.
2.2.4.3 MAGNET PCU Gas Cooler Recommendation For 75 kWt microreactor test-article-based PCU operations, is it recommended that the
Basco®/Whitlock® gas cooler be used. Aspen EDR simulations predict a heat transfer rate consistent with the manufacturer-provided specifications sheet (69 kWt) and this unit has been proven during Sandia CBC testing using a heat source rated at approximately 80 kWt [8]. Conversely, the XLG® heat exchanger is predicted by Aspen EDR to have heat removal capacity lower than specified on the manufacturer-provided specification sheet (267.5 kWt). The discrepancy is believed to be attributed to the presence of internal heat transfer enhancements that are not characterized in the manufacturer-provided specification sheet; therefore, these enhancements are not included in the Aspen EDR simulation. Provided the XLG® heat exchanger does meet performance specifications, it would provide heat removal capacity greater than required for testing 75 kWt microreactor test articles. The additional lengths of process piping required to circulate working fluid to the XLG® heat exchanger would increase system heat losses, decreasing net power output and thermal efficiency.

27
If MAGNET PCU testing is performed with a microreactor test article exceeding 75 kWt thermal capacity, use of the XLG® heat exchanger may be required in place of, or in addition to, use of the Basco®/Whitlock® heat exchanger. In general, the heat input and heat rejection required to operate the Capstone C30 microturbine unit do not exceed the heat addition and removal capacities of the 75 kWt microreactor test article and Basco®/Whitlock® gas cooler, respectively. However, as will be shown in the analysis of the gas inventory control scheme (Section 3.3.5), operations using high compressor inlet pressures have the potential to exceed the heat input and removal capacity of the 75 kWt test article and Basco®/Whitlock® gas cooler.
2.2.5 Instrumentation Figure 30 indicates the locations of the MAGNET PCU temperature, pressure, and flow rate
instrumentation necessary to monitor process performance and provide input to the process control system. In addition to the temperature, pressure, and flow rate measurements, instrumentation for reactor thermal power and TAC net power are needed to compute system energy balances as well as for process control. The TAC shaft speed is also required for full process control and data analysis.
Figure 30. MAGNET PCU preliminary process design P&ID.
In previous CBC testing, mass flow rate measurement has been performed by using a flow orifice plate positioned in the gas piping [8]. Installation of the orifice plate in the pipe segment between the recuperator hot-side outlet and the gas cooler inlet is specified to be consistent with the instrumentation configuration used in Sandia CBC testing. Additionally, an orifice plate geometry consistent with the Sandia CBC testing is recommended. In Sandia CBC testing, a flow orifice plate with a diameter equal to ½ pipe diameter (D) was used. The upstream pressure tap was located at a distance D from the orifice plate and the downstream tap was located a distance ½ D from the orifice plate [8]. The mass flow rate can be calculated from the pressure drop over the orifice plate according Equation 12:
�̇�𝑚 = 𝐶𝐶𝑑𝑑𝑆𝑆𝑜𝑜�2 𝜌𝜌 𝑑𝑑𝑝𝑝
1−�𝑆𝑆𝑜𝑜𝑆𝑆1�2 (12)
where:
ṁ is the mass flow rate Cd is the discharge coefficient ρ is the gas density dp is the pressure drop across the orifice plate S1 is the pipe flow area S0 is the orifice plate flow area [8].

28
2.3 Microturbine PCU Process Design The MAGNET PCU design is based on the use of a MAGNET test article heat source in a
recuperated CBC configuration. The external heat source modified Capstone C30 microturbine unit will be used to compress the PCU working fluid prior to heat addition as well as to expand the working fluid to produce electrical power. The modified Capstone C30 microturbine includes a recuperator to preheat the main heat exchanger inlet stream using waste heat from the turbine outlet stream. Heat rejection from the PCU will be achieved using a shell and tube heat exchanger (HX) gas cooler to transfer waste heat from the PCU to a cooling water stream. The MAGNET PCU process design conditions and performance were established using AspenTech HYSYS V10 process simulation software [6]. Process design parameters are listed in Table 3.
Table 3. MAGNET Microturbine PCU design parameters. Parameter Value Reference or Note
Working fluid Nitrogen Inert gas most similar to air used in Capstone C30 natural gas combustion applications; MAGNET PCU will be capable of testing other inert gas mixtures in addition to nitrogen
Turbine inlet temperature 1150 K (877°C) Wright 2006 [8]; p. 25 Turbine shaft speed 96,300 RPM Wright 2006 [8]; p. 58 Turbine efficiency 84.3% Capstone Turbine Corporation [10] Compressor inlet temperature 35°C Based on Basco®/Whitlock® gas
cooler specification sheet [8] design operating conditions
Compressor inlet pressure 1.013 bar Chosen to be consistent with inlet pressure for Capstone C30 open Brayton cycle natural gas combustion application (1 atm)
Compressor efficiency 79.0% Capstone Turbine Corporation [10] Recuperator effectiveness 86% Capstone Turbine Corporation [10] Pipe size 150 mm schedule 40 Chosen to be consistent with design of
Sandia CBC per Wright 2006 [8]; p.190 Heat exchanger pressure drop 2% of inlet pressure 2% ΔP assigned to microreactor main
HX, recuperator shell side and tube side, and gas cooler shell side and tub side
A process flow diagram of the MAGNET PCU at the nominal design conditions is included as Figure
31. Note that the reactor thermal power input exceeds the thermal power rating of the 75 kW test articles designated for microreactor PCU testing, indicating that in practice the PCU operating conditions will differ from those indicated on this diagram when using 75 kW test articles. The MAGNET facility is capable of testing test articles up to 250 kWt. The power output of the 250 kWt test articles could be modulated to provide the heat input required to operate the PCU at the design point operating conditions shown in Figure 31. If testing is performed at powers higher than 75 kWt, then a means for transferring the excess heat to the main MAGNET loop is needed since the C30 cannot accept the entire 250 kW load. However, it is possible to add additional units in parallel to accommodate the higher power. Capstone

29
indicates that the C30 units can be connected to provide up to 30 MW of power [13]. This scenario has not been analyzed here.
Figure 31. MAGNET Microturbine PCU design point operating conditions based on Capstone C30 TAC and Basco®/Whitlock® gas cooler specifications.
A summary of the PCU performance metrics is shown in Figure 32. The net power output at the simulated design point is slightly higher than the ~30 kWe rating of the Capstone C30 generator. During actual operations, the power output would have to be reduced to avoid damaging the generator by changing one or more process variables such as decreasing the shaft speed, decreasing the turbine inlet temperature, throttling the turbine inlet flow using a throttling valve, decreasing the gas inventory, or increasing the gas cooler outlet temperature. The effects of varying these control variables is further investigated in Section 3.3.1.

30
Figure 32. MAGNET microturbine PCU design point process operating conditions summary.
The pressure ratio of the MAGNET PCU is calculated as 3.4, which varies slightly from the design pressure ratio of 3.7 listed in Wright 2006 [8] page 58. This discrepancy is due to the higher temperature compressor inlet specification of 35°C used for the MAGNET PCU as compared to the Sandia CBC compressor inlet temperature specification of 15°C. The 35°C compressor inlet temperature specification used for the MAGNET PCU model is based on the Basco®/Whitlock® gas cooler outlet temperature specification. When the MAGNET PCU HYSYS model compressor inlet temperature is changed to a value of 15°C, the HYSYS model calculates an updated operating point with a compressor pressure ratio that matches the value of 3.7 specified by Wright 2006 [8].
The MAGNET test articles provide a source of heat that can be used by the PCU. Additionally, integration of the MAGNET main heat exchanger with the PCU will allow testing of heat removal from the test articles under the dynamic operating conditions introduced by PCU performance testing.
The MAGNET test bed and the Sandia-modified Capstone C30 CBC systems will be combined to allow the heat output from the MAGNET test articles to be used in the Capstone C30 microturbine. Since both the MAGNET test bed and the Sandia CBC systems include heat sources, compressors, recuperators, and gas coolers, a decision on which of these components to use in the MAGNET CBC PCU testing must be made.
Although the Sandia CBC heat source can supply thermal energy under the conditions required to operate the modified Capstone C30 microturbine, the heat source is not constructed with materials, geometry, or a heat transfer configuration representative of a microreactor core. Conversely, MAGNET test articles are specifically constructed to provide a non-nuclear heat source that is otherwise representative of a microreactor core. Testing of microreactor test articles under different operating conditions is a primary objective of the MAGNET facility for configurations both with and without a coupled PCU. Therefore, use of the MAGNET test articles for CBC PCU testing is critical to achieving the objectives of MAGNET testing. Therefore, the MAGNET test articles will serve as the heat source used for the CBC PCU testing.
The MAGNET facility and Sandia CBC systems both include compressors for gas compression and circulation. The MAGNET system is rated at higher pressure than the PCU loop. The maximum

31
allowable working pressure of the MAGNET loop is 25 bara to allow flexibility to use CO2, N2, or He as a working fluid. The MAGNET facility compressor is a reciprocating unit that utilizes a downstream surge tank to eliminate oscillations in the gas supply pressure and flow rate. The Capstone C30 compressor used in the Sandia CBC is a centrifugal unit that is coupled to the same shaft as the turbine and generator and is installed in the same housing as the recuperator. The integrated configuration of the Capstone C30 TAC makes it impractical to operate the turbine separately from the compressor, recuperator, and generator. Additionally, the highly coupled transient behavior of a CBC system can only be replicated by using a TAC configuration that is representative of the hardware that would be used in actual power generation applications (TAC components are conventionally installed on a common shaft in power generation applications). Since the integrated configuration of the Capstone C30 TAC is more representative of the hardware that would be deployed in non-experimental operations, the modified Capstone C30 hardware, including the turbine, compressor, and generator, will be used for the CBC PCU testing.
The MAGNET shell and tube recuperator can be effectively disabled by using standard piping to bypass the unit. Bypassing the MAGNET recuperator will allow the MAGNET test articles to be used as the heat source while using the Capstone C30 integrated recuperator. Since the MAGNET compressor and recuperator will be bypassed for PCU testing, it is practical to also bypass the MAGNET gas cooler, which is located between the MAGNET recuperator cold-side outlet and the MAGNET compressor inlet. Therefore, the Basco®/Whitlock® unit used for Sandia CBC testing can remain coupled to the modified Capstone C30 unit. Use of the Basco®/Whitlock® gas cooler will allow the PCU cold-side configuration to be remain unchanged from the Sandia CBC testing, which will minimize additional equipment modifications and help to avoid troubleshooting associated with the PCU cooling equipment.
A schematic of the MAGNET and PCU integration is included in Figure 33. In this figure, the MAGNET recuperator does not perform any heat exchange duty; rather, it would either (a) be replaced with a plain pipe section or (b) the cold side of the recuperator would remain in use as a flow path for the cold fluid without gas flow on the hot side to prevent heat transfer from the cold stream (BV-02 and BV-05 closed to prevent flow to the hot side of the recuperator RHX-01). Additionally, the microturbine unit would be isolated from the MAGNET gas cooler and MAGNET gas compressor such that the Sandia CBC gas cooler and Capstone C30 compressor could be used for achieving the specified reactor inlet conditions (BV-01 closed).

32
Figure 33. Process flow diagram of MAGNET and microturbine PCU integration. MAGNET piping and equipment components used for microreactor test article performance evaluation but not used for PCU testing are designated using a lightened coloring scheme.
3. CAPSTONE C30 OPERATION AND PERFORMANCE 3.1 Normal Operations
3.1.1 Capstone C30 Operating Curve The PCU operating point is defined as the set of operating conditions at which the process achieves
steady-state operation for a defined set of input parameters (independent variables that define the system operation such as TAC shaft speed, turbine inlet temperature, gas inventory, etc.). Each point on the steady-state operating curve corresponds to the intersection point of the compressor and turbine characteristic curves (at a defined shaft rotational speed). Therefore, each point on the steady-state operating curve corresponds to a different TAC shaft rotational speed. The operating curve provides an indication of the system performance as a function of the TAC shaft speed, as well as dependent variables such as the working fluid mass flow rate.
Figure 4-5 from Wright 2006 [8], reproduced as Figure 34 for convenience, provides an operating curve that presents pressure ratio as a function of the system mass flow rate. Since the operating curve presented by Wright uses the modified Capstone C30 microturbine unit, this operating curve can be compared against the system performance predicted by the HYSYS MAGNET PCU off-design model. The comparison of the operating curves for the MAGNET PCU and the Sandia CBC (from Wright 2006 [8]) is shown in Figure 34. Minor discrepancy between the MAGNET PCU and Sandia CBC operating lines can be observed, with the HYSYS model predicting a slightly higher-pressure ratio for all gas flow rates. This discrepancy could be due to one or more factors including differences between the Sandia CBC and MAGNET PCU manually input TAC characteristic curve data, differences in process simulator fluid properties, and/or differences in the CBC balance of plant thermal and fluid transport performance, etc.

33
Figure 34. HYSYS off-design operating curve (black line) compared to Capstone C-30 operating curve (red dotted line based on NASA off-design performance curve mean line flow analysis models as described in [8]). Compressor characteristic curves are designated with black lines and turbine curves with blue lines.
3.1.2 Comparison of Capstone C30 CBC Process Conditions with Optimized Recuperated Open Brayton Cycle
The predicted performance of the MAGNET PCU was compared with that of the optimized recuperated air Brayton cycle. To provide as equal a comparison as possible, the MAGNET PCU off-design condition simulation input parameters were adjusted to simulate operating conditions representative of the optimized recuperated air Brayton cycle for a microreactor providing 10 MW of thermal output. Specific input parameter specifications for the MAGNET PCU off-design simulation included use of air as the working fluid, a gas cooler outlet temperature of 21.1°C, a turbine inlet temperature of 600°C, and zero throttling valve pressure drop. A process flow diagram of the optimized recuperated air Brayton cycle is included as Figure 35. A process flow diagram of the MAGNET PCU with operating conditions scaled to those of the optimized PCU is included as Figure 36.

34
Figure 35. Optimized recuperated air Brayton cycle nominal operating conditions.
Figure 36. MAGNET PCU predicted operating conditions with air working fluid, turbine inlet temperature of 600°C, gas cooler outlet temperature of 21.1°C, and compressor pressure ratio of 2.12.
A shaft speed of ~73,000 RPM is required in the MAGNET PCU Capstone C30 microturbine to match the optimized recuperated air Brayton cycle compressor pressure ratio of 2.12. At this shaft speed the calculated Capstone C30 compressor and turbine efficiencies are 72.3% and 84.3%, respectively. These values are considerably lower than the compressor and turbine efficiencies of 85% and 90% specified in the optimized recuperated air Brayton cycle simulation. The MAGNET PCU simulation includes pressure drop and thermal losses associated with the process piping, both of which are excluded from the optimized PCU simulation. Additionally, a recuperator pressure drop of 5% is used in the MAGNET PCU while a recuperator pressure drop of 2% is used in the optimized air Brayton cycle simulation. Another key discrepancy between the optimized PCU and the MAGNET PCU is the recuperator effectiveness; the optimized PCU specified a recuperator minimum internal temperature

35
approach of 25°C, while the MAGNET PCU recuperator off-design effectiveness correlation results in a lower level of heat exchanger performance with a minimum internal temperature approach of ~40°C.
As will be illustrated in Section 3.3, increasing the pressure ratio of the MAGNET PCU to a value greater than specified in the optimized recuperated Brayton cycle simulations allows the MAGNET PCU to operate with a higher cycle efficiency (greater than 15% efficiency for 600°C turbine inlet temperatures). This is due in part to the operating characteristics of the Capstone C30 microturbine, which provides increased operating efficiency at higher pressure ratios (see Figure 38).
The cumulative effect of the discrepancies between the PCU configurations evaluated is that the MAGNET CBC has a thermal efficiency of 12.6% while the optimized recuperated open Brayton cycle has a thermal efficiency of 35%. The significant difference between these efficiency values highlights the importance of the individual component performance on the overall process performance, as well as the adverse impact that operating at partial load conditions can have on PCU performance.
Since the operating temperature (600°C) and energy transfer per unit working fluid mass (~170 kJ/kg) are comparable, the MAGNET PCU will provide the ability to evaluate the test article heat transfer under representative operating conditions with the transient system behavior associated with a CBC PCU. Commercially available equipment with specifications closer to those of the optimized PCU simulations (i.e., nominal operating point efficiencies of 85% and 95% for the compressor and turbine, respectively) could be procured for future microreactor PCU applications. Although use of TAC equipment with operating point efficiency closer to that specified in the optimized PCU simulations would help support performance at near optimal levels, the pressure drop and thermal losses associated with the process piping that will be encountered in field PCU installations would result in performance levels lower than predicted by the optimized PCU process models.
3.2 Off-Design Process Operation Individual equipment component specifications and performance described to this point have been
specific to the design operating conditions for each of the individual equipment items. The system components selected for the MAGNET PCU were not designed as an integrated system, rather the selected components were chosen due to having nominal performance characteristics that are generally compatible with the other process components. While each component is rated for a specific level of performance at a defined operating point, the rated conditions do not necessarily correspond to the same conditions at which each component will operate at the overall system’s nominal operating point.
The nominal operating conditions for the complete MAGNET PCU system described in Section 2.3 are based primarily on the Capstone TAC design operating conditions with several adjustments to account for heat exchanger specific design parameters (the gas cooler design outlet temperature, heat exchanger pressure drop assumptions, etc.). One of the implications of this is that, as indicated in Figure 30 in Section 2.3, reactor power greater than the test article capacity is required to operate the TAC unit at its nominal design output of ~30 kWe. Therefore, the TAC will have to operate at partial load conditions when using a 75 kWt test article, whereas a 250 kWt test article will need to operate at a derated power output to allow the C30 to operate at max capacity, or both the test article and TAC (as well as the other system components, such as the gas cooler) will operate at partial load conditions to meet the target electric load (i.e., load following).
The majority of the PCU testing will be focused on development of operating curves, testing of control strategies, and evaluation of load-following performance capabilities, all of which will be performed primarily at off-design (partial load) operating conditions. To characterize off-design system operating performance, partial load performance models are required for each of the system components. The equipment component performance predicted by these partial load components models is used by the HYSYS process model to predict the overall PCU performance at the specified partial load operating conditions associated with different control strategies, partial load operating conditions, and/or system

36
transient states. The following sections describe the assumptions used in modeling off-design MAGNET PCU performance, as well as descriptions of the partial load models used for each of the PCU equipment components.
3.2.1 Partial Load Modeling Assumptions Major assumptions made in the modeling of MAGNET PCU partial load performance include:
• Quasi-steady-state compressor/turbine speed and inlet/outlet conditions rapidly equilibrate from changes elsewhere in the system. The high-flow velocities through the small compressor and turbine achieve equilibrium flow rates in less than a millisecond [14].
• Constant flow throughout the loop. The mass of the coolant in the loop is only about 20% of the mass of the rotating turbomachinery [14].
These assumptions are in addition to those made for individual equipment component and/or overall system design parameters, as well as equipment and system configuration assumptions.
3.2.2 Turbine and Compressor Characteristic Curves The compressor provides the pressure differential required to circulate the PCU working fluid through
the main heat exchanger. The heated and pressurized working fluid is then expanded through the turbine to drive the shaft and generate electrical power. The compressor and turbine head, flow, and efficiency vary with process conditions, fluid properties, and shaft speed. The compressor and turbine geometry also affect the fluid flow and thermodynamic performance such that different equipment designs will have different flow and efficiency characteristics. Turbine and compressor flow curves are used to characterize performance over a range of operating conditions.
Characteristic flow curves provide temperature ratio, pressure ratio, and efficiency of the turbine and compressor as a function of the working fluid flow rate. When two of these three values are known, thermodynamic relationships for gas compression and expansion can be used to calculate the third value. Compressor and turbine characteristic curve data were included in the HYSYS process model to enable calculation of TAC performance at off-design process operating conditions.
3.2.2.1 Compressor Characteristic Curves Characteristic curve data for the Capstone C30 compressor were obtained from Figures 2-16 in
Wright et al. [8]. The characteristic flow curves for the C-30 turbine and compressor in Wright et al. [8] were generated from NASA off-design performance codes. The data are presented in terms of compressor efficiency, pressure ratio, and temperature ratio as a function of mass flow rate.
To simulate the Capstone C30 TAC in the HYSYS process simulator with various gas compositions, the Capstone C30 characteristic curves were converted to head versus volumetric flow and efficiency versus volumetric flow curves. This conversion requires process operating condition and fluid composition specifications. The compressor inlet conditions for the characteristic curves presented in Figures 2-16 of Wright et al. [8] include an inlet temperature of 15°C and an inlet pressure of 101.325 kPa. The gas composition is assumed to be equal to 79 mol% nitrogen and 21 mol% oxygen as this approximates the composition of air used in the gas combustion application for which the compressor was originally designed.
The Capstone C30 compressor characteristic curves from Wright et al. [8] are presented in Figure 37 through Figure 39. Figure 37 is a plot of the compressor temperature ratio versus the mass flow rate. Figure 38 is a plot of the compressor efficiency versus mass flow rate. Figure 39 is a plot of the compressor pressure ratio versus mass flow rate. Data reproduced from these figures are shown as scatter plot overlays; the reproduced data were subsequently converted to head and efficiency versus volumetric flow for use in the HYSYS process simulation software.

37
Figure 37. Compressor temperature ratio mean line flow curves plot from Wright et al. [8].
Figure 38. Compressor efficiency mean line flow curves plot from Wright et al. [8].

38
Figure 39. Compressor pressure ratio mean line flow curves plot from Wright et al. [8].
As previously indicated, thermodynamic expressions can be used to relate compressor and expander temperature ratio, pressure ratio, and efficiency curves. When data points for two of these quantities are known, the value of the third can be calculated from the following equation (Equation 2-1 page 38, Wright et al. [8]):
𝑁𝑁𝑜𝑜2𝑁𝑁𝑜𝑜1
= 1 +�𝑝𝑝𝑜𝑜2𝑝𝑝𝑜𝑜1
�𝛾𝛾−1𝛾𝛾 −1
𝜂𝜂𝑠𝑠𝑠𝑠= �𝑝𝑝𝑜𝑜2
𝑝𝑝𝑜𝑜1��𝛾𝛾−1𝛾𝛾 �
𝜂𝜂𝑝𝑝𝑠𝑠 (13)
where: To is total temperature
Po is total pressure
γ is the heat capacity ratio
ηsC is the isentropic compressor efficiency
ηpC is the polytropic compressor efficiency
Subscript 1 and 2 indicate compressor inlet and outlet conditions, respectively.
The equation above was used to verify that the reported values in Wright et al. [8] could be reproduced from the imported data. Following data cross checking, the characteristic curve data were converted to head (m²/s²) and isentropic efficiency (%) versus volumetric flow (m³/s) data for entry into the HYSYS PCU process simulation compressor model.
The mass flow rate data were converted to volumetric flow rate using the compressor inlet stream fluid density as calculated using the National Institute of Standards REFerence fluid PROPperties (REFPROP) standard reference data program [23]. Compressor head was calculated from [24–26]:
𝐻𝐻𝑅𝑅𝐻𝐻𝐻𝐻𝑚𝑚𝑖𝑖𝑒𝑒𝑚𝑚 = � 𝛾𝛾𝛾𝛾−1
� �𝑍𝑍𝑚𝑚𝑎𝑎𝑎𝑎𝑅𝑅𝑁𝑁1𝑀𝑀𝑀𝑀
� ��𝑃𝑃2𝑃𝑃1��𝛾𝛾−1𝛾𝛾 �
− 1� (14)

39
where: γ is the heat capacity ratio (calculated using REFPROP based on compressor inlet conditions)
Zavg is the average gas compressibility factor (calculated using REFPROP based on inlet and outlet conditions)
R is the gas constant
MW is the molecular weight
T1 is the suction temperature
P1 and P2 are the suction and discharge pressures, respectively.
Outlet conditions used in this equation were computed based on characteristic curve data (i.e., temperature and pressure ratios were used to determine outlet conditions and associated physical properties).
3.2.2.2 Turbine Characteristic Curves Although correlations for turbine temperature ratio and pressure ratio (from which efficiency could be
computed per the equations in the previous section) are presented in Wright et al. [8], evaluation of these correlations did not successfully reproduce the associated plots. Therefore, the characteristic curve data for the Capstone C30 turbine was obtained from Figure 4-5 in Wright et al. [8], which is included as Figure 40 for the reader’s convenience. The data in this figure are presented in terms of pressure ratio as a function of mass flow rate. Data reproduced from this figure are shown as a scatter plot overlay; the reproduced data were subsequently converted to head versus volumetric flow for use in the HYSYS process simulation software.
Figure 40. Capstone C30 compressor and turbine pressure ratio mean line flow curves plot from Wright et al. [8].

40
As with the Capstone C30 compressor characteristic curves, the C30 turbine characteristic curves were converted to head and efficiency versus volumetric flow curves to simulate the Capstone C30 TAC in the HYSYS process simulator. This conversion requires process operating condition and fluid composition specifications. The turbine inlet conditions for the characteristic curves presented in Figure 4-5 of Wright et al. [8] includes an inlet temperature of 877°C. The turbine inlet pressure was calculated for each of the curves based on the pressure ratio and the assumption that the turbine outlet pressure is equal to 101.325 kPa. The gas composition is assumed to be equal to 79 mol% nitrogen and 21 mol% oxygen as this approximates the composition of air used in the gas combustion application for which the compressor was originally designed.
The turbine characteristic curve data were converted to head (m²/s²) and isentropic efficiency (%) versus volumetric flow (m³/s) data for entry into the HYSYS PCU process simulation compressor model. The mass flow rate data from the Capstone C30 turbine presented in Wright et al. [8] were converted to volume flow rate (specified at turbine inlet conditions) using density of turbine inlet stream (calculated with REFPROP).
The turbine head was calculated from Equation 15 [24–26]. Outlet condition values in this equation were computed assuming an outlet pressure of 1 bar with the corresponding outlet temperature determined from the isentropic flow relation 𝑇𝑇5 𝑇𝑇4⁄ = (𝑃𝑃5 𝑃𝑃4⁄ )(𝛾𝛾−1)/𝛾𝛾 [27], which assumes isentropic flow (and ignores turbine efficiency losses). Since the outlet temperature is only used to estimate fluid physical properties at the turbine outlet the inaccuracy introduced from this calculation procedure is believed to be minimal.
𝐻𝐻𝑅𝑅𝐻𝐻𝐻𝐻𝑚𝑚𝑖𝑖𝑒𝑒𝑚𝑚 = � 𝛾𝛾𝛾𝛾−1
� �𝑍𝑍𝑚𝑚𝑎𝑎𝑎𝑎𝑅𝑅𝑁𝑁4𝑀𝑀𝑀𝑀
� ��𝑃𝑃4𝑃𝑃5��𝛾𝛾−1𝛾𝛾 �
− 1� (15)
where: γ is the heat capacity ratio (calculated using REFPROP based on turbine inlet conditions)
Zavg is the average gas compressibility factor (calculated using REFPROP based on inlet and outlet conditions)
R is the gas constant
MW is the molecular weight
T4 is the inlet temperature
P4 and P5 are the inlet and outlet pressures, respectively.
Sandia reports reviewed for this analysis [8, 14] do not include a (reproducible) characteristic curve for the Capstone C30 turbine efficiency and no other source for turbine efficiency characteristic curve data were found. Since the turbine temperature ratio data were not available, it was not possible to calculate the turbine efficiency from the pressure ratio and temperature ratio data per the gas compression and expansion thermodynamic relations presented in the previous section. Therefore, in this analysis the Capstone C30 turbine efficiency was assumed equal to the design point value of 84.3% as specified in reference [10].
Wright et al. [8] suggests that the heat input to the turbine is scheduled at a rate so that at varying shaft speeds, the head coefficient (the ratio of the gas turbine wheel tip speed to the spouting velocity) is kept near 70%. This roughly keeps the turbine efficiency near its optimum value regardless of speed [8]. Based on this concept, the turbine efficiency is assumed constant at the design point value at all speeds evaluated. This assumption is not valid for the entire turbine curve, but should be a reasonable approximation at all points along the operating line (where turbine pressure ratio and compressor pressure ratio are equal), which is where a converged steady-state model will exist.

41
3.2.2.3 Heat Exchanger Performance at Off-Design Operating Conditions At partial load (off-design) operating conditions, the microreactor main heat exchanger, recuperator,
and gas cooler fluid flow rates, temperatures, and pressures will differ from the design point operating conditions. The changes in fluid velocity, as well as the changes in physical properties associated with the partial load conditions, will affect the heat transfer coefficients on the hot and cold sides of these heat exchangers. Variations in the heat transfer coefficients will result in changes in the exchanger UA product (the heat transfer area remains constant, but the overall heat transfer coefficient will change with the hot-and cold-side heat transfer coefficients). The following text describes the methods used to predict off-design performance for each of the heat exchangers in the MAGNET PCU.
Microreactor Test Article Main Heat Exchanger
The microreactor test article main heat exchanger duty is treated as a control variable and no off-design heat exchanger performance correlations are included since it is assumed that the reactor power will be controlled to achieve the target outlet temperature. However, the separate performance evaluation of MAGNET test articles will establish the heat transfer performance and off-design operating characteristic of the non-nuclear microreactor test articles and the main heat exchanger that couple the heat source with the PCU (Figure 4). Recuperator
Changes in recuperator effectiveness at partial load operating conditions is discussed in several papers that investigate recuperated microturbine performance [28–31]. The correlation presented by Malinowski [28] was used to compute recuperator effectiveness as a function of the deviation of the working fluid mass flow rate from the design operating conditions:
𝜀𝜀 = 𝜀𝜀0𝜀𝜀0+(1−𝜀𝜀0)(𝐺𝐺 𝐺𝐺0⁄ )𝑍𝑍 (16)
where: G is the mass flow rate through the compressor and turbine
Z is equal to a value of 0.7 based on regression of experimental data from the literature
Subscript 0 denotes design point conditions.
As discussed in the literature, when operating at partial load conditions in which the mass flow rate of fluid on both sides of the recuperator is decreased simultaneously, the recuperator effectiveness tends to increase to a value greater than that at the design point [30, 31].
Gas Cooler
The gas cooler performance is simulated using a simple weighted heat exchanger model with a fixed outlet temperature specification of 35°C. In MAGNET PCU experiments it is anticipated that the cooling water flow rate will remain at a constant value and the gas cooler outlet temperature will vary as a function of the process operating conditions (i.e., the working fluid flow rate and gas cooler inlet temperature). The simplified gas cooler simulation approach was used to decrease simulation time and to provide results that can elucidate the impacts of changing individual control variables independent of effects from varying gas cooler outlet temperature.
The heat exchanger duty required to achieve the gas cooler outlet temperature specified in the control scheme analyses (Section 3.3) was compared with the specified cooling capacity of the Basco®/Whitlock® exchanger. For the vast majority of operating conditions, the simulated heat exchanger duty is significantly lower than the rated capacity, suggesting that the gas cooler outlet stream could be cooled to a temperature lower than 35°C. PCU operations in which the gas cooler outlet temperatures are lower than specified would have the effect of increasing power output and cycle thermal efficiency. Conversely, for the small number of operating points for which the simulated gas cooler duty

42
exceeds the Basco®/Whitlock® cooling capacity, the resulting elevated gas cooler outlet temperature would have the effect of decreasing cycle net power output and thermal efficiency. In order to more accurately predict the gas cooler outlet temperature at off-design process operating conditions it is recommended that the HYSYS process models be coupled with Aspen EDR software.
3.2.2.4 Pipe Flow at Off-Design Operating Conditions HYSYS pipe segment models are used to predict heat and pressure losses as a function of the
specified pipe geometry and fluid flow conditions. As listed in Table 3, the HYSYS model specifies 150 mm (6 in.) nominal diameter schedule 40 pipe for circulation of the PCU working fluid. The pipe segment model specifications include an assumed 100 mm (4 in.) of urethane foam insulation on the pipe external surfaces. Since the MAGNET PCU test system will be installed in the INL Energy Systems Laboratory high bay area, a constant ambient temperature of 21.1°C (70°F) is specified for all PCU simulations (both design and off-design cases).
3.2.3 Predicted MAGNET CBC PCU Off-Design Performance The partial load HYSYS model was used to evaluate the off-design performance of the MAGNET
PCU. The quasi-steady-state operating point for each set of input conditions was identified by using a HYSYS “adjust” block to iteratively vary the CBC working fluid mass flow rate until the compressor inlet stream pressure and the turbine outlet stream pressure are equal. This approach allows the pressure drop and thermal load (or losses) from each process component to be accounted for at the specified partial load operating conditions according to the methods discussed in the previous section. The turbine and compressor characteristic curves are implemented to calculate the pressure ratio and efficiency corresponding to the inlet flow conditions; recuperator effectiveness is determined as a function of the mass flow rate relative to design conditions; and pipe pressure and thermal losses are calculated as a function of the fluid flow rate and conditions.
As previously indicated, the PCU heat input required to operate the Capstone C30 microturbine at its nominal operating conditions exceeds the thermal rating of the 75 kWt microreactor test articles. Therefore, when a 75 kWt test article is used, the CBC will operate at partial load operating conditions that differ from the nominal operation conditions identified in Figure 30. The HYSYS process model was used to predict MAGNET PCU performance when operating with heat input from a 75 kWt test article. Two approaches were evaluated for simulating the process operating point with 75 kWt test article heat input. The first approach evaluated was to vary the gas inventory in the system. The second approach evaluated was to vary the TAC shaft speed. Other control schemes are evaluated in greater detail in Section 3.3.
Varying the working fluid inventory has the primary effect of changing the fluid density throughout the system. Increasing the gas inventory (pressure) increases the fluid density, while decreasing the gas inventory decreases the fluid density. When the gas inventory is decreased but the TAC shaft speed remains constant, the volumetric flow rate through the system remains nearly constant but the mass flow rate decreases, which in turn results in less heat transfer from the microreactor to the working fluid in the main heat exchanger.
Predicted MAGNET PCU operating conditions and performance using gas inventory control to limit heat input to 75 kWt for turbine inlet temperatures of 877°C and 600°C are shown in Figure 41 and Figure 42, respectively. The turbine power output and compressor power requirements both decrease with the mass flow rate, but the net effect of the decreased gas inventory is a decrease in the net power generation from the system. For 877°C turbine inlet conditions there is only a small change in the PCU thermal efficiency as a result of changing the gas inventory (33.5% vs 32.7% at nominal conditions), but the net power generation decreases (25 kWe versus 32 kWe at nominal conditions) as a result of the decreased thermal input. However, when the turbine inlet temperature is decreased to 600°C, the decrease in thermal efficiency associated with the decreased heat source temperature results in a significant

43
reduction in the overall net power generation relative to the case with 877°C turbine inlet temperature (11.4 kWe net at 600°C versus 25.2 kWe at 877°C).
Figure 41. Microturbine PCU process operating conditions at 75 kWt reactor heat input, 877°C turbine inlet temperature, 96,300 RPM turbine speed (gas inventory control scheme).
Figure 42. Microturbine PCU process operating conditions at 75 kWt reactor (RX) heat input, 600°C turbine inlet temperature, 96,300 RPM turbine speed (gas inventory control scheme).
Varying the TAC shaft speed has the primary effect of changing the volumetric flow rate through the system. Increasing the TAC shaft speed increases the fluid flow rate, while decreasing the shaft speed decreases the fluid flow rate. The heat input to the working fluid is the product of the mass flow rate, the
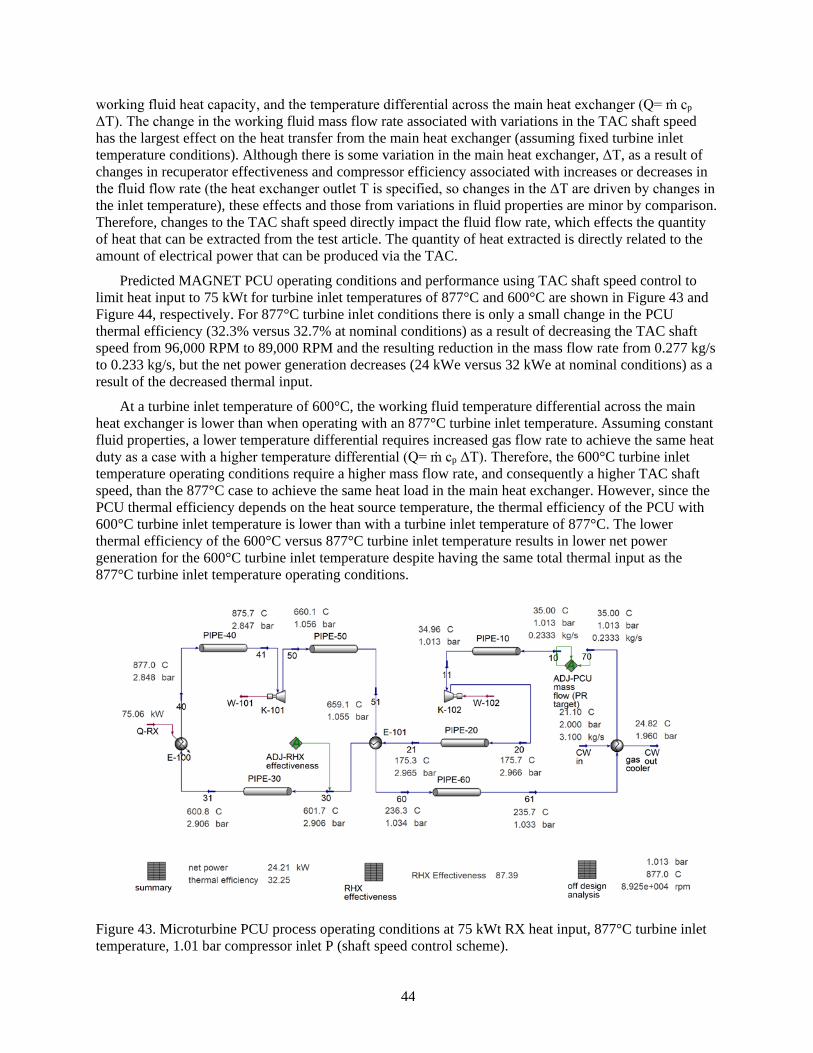
44
working fluid heat capacity, and the temperature differential across the main heat exchanger (Q= ṁ cp ΔT). The change in the working fluid mass flow rate associated with variations in the TAC shaft speed has the largest effect on the heat transfer from the main heat exchanger (assuming fixed turbine inlet temperature conditions). Although there is some variation in the main heat exchanger, ΔT, as a result of changes in recuperator effectiveness and compressor efficiency associated with increases or decreases in the fluid flow rate (the heat exchanger outlet T is specified, so changes in the ΔT are driven by changes in the inlet temperature), these effects and those from variations in fluid properties are minor by comparison. Therefore, changes to the TAC shaft speed directly impact the fluid flow rate, which effects the quantity of heat that can be extracted from the test article. The quantity of heat extracted is directly related to the amount of electrical power that can be produced via the TAC.
Predicted MAGNET PCU operating conditions and performance using TAC shaft speed control to limit heat input to 75 kWt for turbine inlet temperatures of 877°C and 600°C are shown in Figure 43 and Figure 44, respectively. For 877°C turbine inlet conditions there is only a small change in the PCU thermal efficiency (32.3% versus 32.7% at nominal conditions) as a result of decreasing the TAC shaft speed from 96,000 RPM to 89,000 RPM and the resulting reduction in the mass flow rate from 0.277 kg/s to 0.233 kg/s, but the net power generation decreases (24 kWe versus 32 kWe at nominal conditions) as a result of the decreased thermal input.
At a turbine inlet temperature of 600°C, the working fluid temperature differential across the main heat exchanger is lower than when operating with an 877°C turbine inlet temperature. Assuming constant fluid properties, a lower temperature differential requires increased gas flow rate to achieve the same heat duty as a case with a higher temperature differential (Q= ṁ cp ΔT). Therefore, the 600°C turbine inlet temperature operating conditions require a higher mass flow rate, and consequently a higher TAC shaft speed, than the 877°C case to achieve the same heat load in the main heat exchanger. However, since the PCU thermal efficiency depends on the heat source temperature, the thermal efficiency of the PCU with 600°C turbine inlet temperature is lower than with a turbine inlet temperature of 877°C. The lower thermal efficiency of the 600°C versus 877°C turbine inlet temperature results in lower net power generation for the 600°C turbine inlet temperature despite having the same total thermal input as the 877°C turbine inlet temperature operating conditions.
Figure 43. Microturbine PCU process operating conditions at 75 kWt RX heat input, 877°C turbine inlet temperature, 1.01 bar compressor inlet P (shaft speed control scheme).

45
Figure 44. Microturbine PCU process operating conditions at 75 kWt RX heat input, 600°C turbine inlet temperature, 1.01 bar compressor inlet P (shaft speed control scheme).
3.3 Control Schemes Numerous control strategies are potentially applicable to microturbine PCUs. The control strategy
will likely depend on system configuration as well as the application for which the PCU is used. Control strategies that are applicable for open or closed system configurations include controlling the microturbine shaft speed, turbine inlet temperature, and/or throttling valve pressure drop. Control strategies that are applicable for closed system configurations only include controlling gas inventory and gas cooler duty. Each of these control strategies has different characteristics, such as response time and effect on system thermal efficiency. PCU control strategy testing will help to identify the performance attributes of each strategy in various steady stand and transient operating scenarios.
The LabVIEW system integrates the Watlow heaters and Capstone controllers for the PCU loop, as well as the MAGNET loop. Some of the main control approaches for the TAC are given below [8].
1. The PMAD system can be used to increase or decrease the total electrical load by use of a parasitic load resistor that is wired in parallel with the normal system load. This is normally done by using a feedback circuit that adjusts the total load (as seen by the alternator) to force the TAC shaft RPM to follow a reference or requested speed. This is usually the type of control that is proposed for space power applications. For small terrestrial systems, instead of using a parasitic load, the electrical power grid can be used as the load [13]. These types of control (parasitic load resistor or grid loading) are very fast. If the parasitic load is used, it keeps the thermal efficiency very high, but strongly affects the electrical efficiency. If the grid is used as the load, then both electrical and thermal efficiencies can be kept very high, but it assumes that the grid is infinite and is always available.
2. The working fluid turbine inlet temperature can be increased or decreased by adjusting the power from the electrical resistance heaters. The heater power can be adjusted to simulate startup, shutdown, steady-state, accident, off-normal response, or for compensation caused by fuel burnup.
3. Bypass valves may be used for control by rapidly shunting gas from a high-pressure leg to a low-pressure leg. For example, a bypass valve could be used to shunt some of the gas flow from Leg 2 to Leg 6, or Leg 3 to Leg 5 (Figure 4). This approach prevents over-speeding of the TAC shaft by shunting some

46
of the gas around the reactor and turbine. In this way, the power produced by the turbine is reduced, which in turn reduces the shaft speed. This type of control occurs within seconds but has a pronounced effect on overall thermal and electrical power generation efficiency.
4. A throttle valve, placed at a low-temperature location within the loop, can be used for control by restricting gas flow through the loop. It restricts the working fluid flow rate by increasing the loop pressure drop. This type of control is rapid but has a pronounced effect on overall thermal and electrical efficiency.
5. Inventory control can also be used. This type of control uses machinery to increase or decrease the absolute pressure of the loop. Generally, increases in pressure will increase the power generated for the same reactor HX outlet temperature. This is generally a slow process that takes from minutes to hours but can be used to maintain high thermal and electrical efficiency.
6. Another control approach is to adjust the compressor inlet temperature by increasing or decreasing the heat removal capability of the gas cooler. This could be accomplished by increasing or decreasing the coolant flow in the chiller.
3.3.1 TAC Shaft Speed Control The Sandia-modified Capstone C30 microturbine includes a power converter and control unit. A
description of the power converter and control unit is provided by Wright et al. [8]: “The power converter/inverter produces 480-V three-phase power at 60 Hz, regardless of shaft operating speed. This power can be routed to the electrical grid or transferred to a resistive load bank. Because (Sandia) purchased the grid connected version of the Capstone C-30 unit, it allowed (connection of) the power converter/inverter to the grid rather than use a separate load bank. Because the electrical grid is used for the load, most of this power goes right back into the heater. Thus, in effect the heater provides the load, and (use of a) separate load bank (is not required). The Capstone internal controller (power inverter) adjusts the phase difference between the power inverter and the grid to control the power draw by the grid. This is the actual method used by the Capstone controller to regulate/control the shaft speed or RPM. Furthermore, the grid power can also be used as a power source to “motor” the alternator to start the gas turbine. All of these control mechanisms are provided by the Capstone controller, eliminating the need to design, fabricate, and purchase electronics to provide these functions.”
Controlling the TAC shaft speed results in very fast response times and allows the electrical and thermal efficiency of the system to remain high [8]. Figure 45 through Figure 47 include predicted system performance data from the HYSYS partial load model with a TAC shaft speed control strategy. Off-design point equipment component performance is modeled as described in Section 3.2. The data in these figures are based on compressor inlet pressure (CIP) of 1 bar and temperature of 35°C. Separate curves for each of the dependent variables evaluated are given at turbine inlet temperatures of 877°C, 700°C, and 600°C.
Increases in the TAC shaft speed result in greater working fluid flow rates, which increase the reactor power required to achieve the target turbine inlet temperature (Figure 45). The increased working fluid flow rate and reactor heat output associated with increasing TAC shaft speed provide greater thermal energy input to the turbine, which has the effect of increasing net power generation (Figure 46). For all turbine inlet temperatures evaluated, the PCU thermal efficiency increases with TAC shaft speed up to approximately 80,000 RPM, at which point it decreases with further increases in shaft speed (Figure 47). MAGNET PCU operation with higher turbine inlet temperatures results in increased reactor power, increased cycle efficiency, and increased net electrical power generation.

47
Figure 45. Reactor thermal power as a function of TAC shaft speed with turbine inlet temperature as a parameter.
Figure 46. Net power as a function of TAC shaft speed with turbine inlet temperature as a parameter.

48
Figure 47. Cycle thermal efficiency as a function of TAC shaft speed with turbine inlet temperature as a parameter.
The decrease in thermal efficiency at TAC shaft speeds exceeding 80,000 RPM is due primarily to a decrease in compressor efficiency at the flow conditions corresponding to higher shaft speeds; system configurations with increased working fluid flow rate (i.e., systems with decreased pressure losses) at TAC shaft speeds exceeding 80,000 RPM would allow the compressor to operate closer to its peak efficiency. The offset between the operating line predicted by the HYSYS MAGNET PCU model and reported the Sandia CBC analysis also causes the MAGNET system to operate at a point with a lower flow rate (see Figure 34); elimination of this offset would result in HYSYS PCU partial load model predicted operating points closer to the peak efficiency operating points for the turbine and compressor.
The TAC shaft speed control strategy provides an effective way of modulating PCU net power output, while retaining relatively high system efficiency. The rapid response times associated with this control scheme make it well suited for applications that are characterized by sudden load changes of significant magnitude.
Additional plots of PCU performance are included in Appendix A. Additional simulation data presented as functions of TAC shaft speed in Appendix A include working fluid mass flow rate, compressor outlet pressure (P2), and recuperator effectiveness.
3.3.2 Turbine Inlet Temperature Control The turbine inlet temperature can be used to control the CBC PCU. A summary of the turbine inlet
temperature control scheme is provided by Wright et al. [8]: “Another method of control is to increase or decrease the average fuel temperature of the reactor by moving the reactor control rods/elements. This has the effect of continually changing the reactor temperature which may lead to reactor fuel reliability issues due to thermal cycling. It also requires frequent and continuous motion of the control elements and thereby introduces more lifetime/reliability concerns. This type of control is slow and will be dominated by the thermal inertia of the reactor and other hardware components. Control initiated by changing the reactor temperature is normally considered for startup, shutdown, for long term power level changes, for accident and off-normal response, or for compensation caused by fuel burnup.”
Figure 48 through Figure 50 include predicted system performance data from the HYSYS partial load model with a turbine inlet temperature control strategy. Off-design point equipment component performance is modeled as described in Section 3.2. The data in these figures are based on CIP of 1 bar

49
and temperature of 35°C. Separate curves for each of the dependent variables evaluated are plotted at TAC shaft speeds of 50,000, 70,000, and 90,000 RPM.
Increases in the turbine inlet temperature have the primary effect of increasing the turbine inlet enthalpy such that each unit of working fluid flowing through the turbine can be converted to a greater amount of shaft work, and consequently, electrical power. The reactor thermal power slowly increases as a function of the turbine inlet temperature (Figure 48). However, the net power output is a relatively strong function of the turbine inlet temperature, especially with TAC shaft speeds of 90,000 RPM (Figure 49). The significant increases in net power generation combined with the minor increases in reactor thermal power that occur as the turbine inlet temperature is increased have the net effect of increasing the PCU thermal efficiency (Figure 50).
Figure 48. Reactor power as a function of turbine inlet temperature with TAC shaft speed as a parameter.
Figure 49. Net power as a function of turbine inlet temperature with TAC shaft speed as a parameter.

50
Figure 50. Cycle efficiency as a function of turbine inlet temperature with TAC shaft speed as a parameter.
The net power output and reactor thermal power are generally greatest at elevated TAC shaft speeds. However, the highest TAC shaft speed of 90,000 RPM displays the lowest cycle efficiency at a turbine inlet temperature of 600°C and the highest cycle efficiency at a turbine inlet temperature of 877°C. This is attributed in part to the discrepancies between the Sandia CBC and MAGNET PCU operating curves (Figure 33). It is expected that in MAGNET PCU experimental testing, the higher TAC shaft speeds will generally correspond to the highest process efficiencies due to the higher shaft speed operating points being closest to the Capstone C30 TAC nominal operating conditions (96,300 RPM) where the compressor and turbine efficiencies are generally expected to be at their highest values.
Additional plots of PCU performance are included in Appendix A. Additional simulation data presented as functions of turbine inlet temperature in Appendix A include working fluid mass flow rate, compressor outlet pressure (P2), and recuperator effectiveness.
3.3.3 Turbine Bypass Valve Control A turbine bypass valve can be used to shunt working fluid around the turbine, providing the ability to
control PCU power output. A synopsis of the turbine bypass valve control scheme is provided by Wright et al. [8]: “Bypass valves may be used for control because they can rapidly shunt gas from a high-pressure leg to a low-pressure leg. This approach prevents over-speeding of the TAC shaft by shunting some of the gas around the reactor and turbine. In this way the power produced by the turbine is reduced which in turn reduces the shaft speed. This type of control is rapid (within seconds), but severely affects overall thermal and electrical power generation efficiency.”
This control scheme requires modification to the piping configuration of the Capstone C30 microturbine unit. For the purposes of the initial process design, this control scheme has not been modeled or evaluated to date. Due to the inefficient operation associated with PCU operation using this control scheme, it is anticipated that it would only be implemented in applications where very fast system response times are required. It is recommended that this control scheme be evaluated in future analyses of microreactor applications for which rapid response times are necessary and temporary inefficient PCU operation can be tolerated.

51
3.3.4 Throttling Valve Control A throttling valve installed in a low-temperature process location can be used to control PCU power
output [8]. Positioning the throttling valve in a low-temperature process location requires that it be installed between the turbine outlet and compressor inlet as shown in the proposed piping and instrumentation diagram (P&ID) for a MAGNET PCU configuration that includes a throttling valve (Figure 51). The throttling valve increases the pressure drop throughout the CBC loop. The increased pressure drop restricts the gas flow rate and causes the TAC unit to operate at a lower pressure ratio and, therefore, power output. However, since the increased pressure drop associated with use of the throttling valve shifts the PCU operation to a lower flow rate operating point on the turbine and compressor characteristic curves, the overall process efficiency is decreased as a result of operating the turbine and compressor at conditions under which they are less efficient.
Figure 51. MAGNET PCU preliminary process design P&ID for configuration with throttling valve.
The MAGNET PCU partial load HYSYS process model was updated to include a throttling valve immediately downstream from the gas cooler (Figure 52). This location provides the coolest working fluid temperature such that the throttling valve materials of construction and actuating mechanisms are not adversely impacted by high-operating temperatures. The chosen location provides a flow restriction downstream of the turbine, such that the turbine pressure ratio is decreased as a result of applied back pressure. The throttling valve was sized such that at 25% valve opening a negative value for the PCU net power is attained (Figure 53) with all other process components operating at nominal conditions (TAC shaft speed of 96,300 RPM, CIP of 1 bar, compressor inlet temperature of 35°C, turbine inlet temperature of 877°C). This results in a valve flow coefficient Cv with a value of 150 (USGPM @ 60°F and 1 psi differential pressure). The relationship between the throttling valve position and the resulting pressure drop for each of the temperatures evaluated is plotted in Figure 54 .

52
Figure 52. MAGNET PCU operating point with throttling valve 100% open (877°C turbine inlet T, 96,300 RPM TAC shaft speed, 1 bar compressor inlet pressure).
Figure 53. MAGNET PCU operating point with throttling valve 25% open (877°C turbine inlet T, 96,300 RPM TAC shaft speed, 1 bar compressor inlet pressure).

53
Figure 54. Throttling valve pressure drop (flow coefficient Cv of 150) versus position.
Figure 56 through Figure 57 include predicted system performance data from the HYSYS partial load model with use of a throttling valve control strategy. Off-design point equipment component performance is modeled as described in Section 3.2. The data in these figures are based on a TAC shaft speed of 96,300 RPM, a CIP of 1 bar, and a compressor inlet temperature of 35°C. Separate curves for each of the dependent variables evaluated are plotted at turbine inlet temperatures of 877°C, 700°C, and 600°C.
As the throttling valve closes, the differential pressure drop across the valve increases. The flow restriction associated with closure of the valve decreases the working fluid flow rate and causes backpressure that forces the turbine to operate at a lower pressure ratio. As the throttling valve pressure differential increases, the decreased working fluid flow rate causes a decrease in the reactor thermal power (Figure 55) and the PCU net power output (Figure 56). The pressure drop associated with the throttling valve decreases the amount of power generated from the pressurized turbine inlet stream, resulting in a decrease in PCU cycle efficiency with increasing throttling valve pressure drop (Figure 57). These trends are consistent for all turbine inlet temperatures evaluated.
When the throttling valve pressure drop is sufficiently high to result in negative net power generation, the gross turbine power output is less than the compressor power input requirement. Therefore, when negative net power operating conditions exist, the alternator must be used as a motor to drive the compressor and turbine. Use of an external source of electrical power is required when the alternator is used as a motor since the PCU consumes, rather than produces, power when the net power generation is negative.

54
Figure 55. Reactor thermal power as a function of throttling valve pressure drop with turbine inlet temperature as a parameter.
Figure 56. PCU net power as a function of throttling valve pressure drop with turbine inlet temperature as a parameter.

55
Figure 57. PCU cycle efficiency as a function of throttling valve pressure drop with turbine inlet temperature as a parameter.
Additional plots of PCU performance are included in Appendix A. Additional simulation data presented as functions of throttling valve position in Appendix A include working fluid mass flow rate, compressor outlet pressure (P2), and recuperator effectiveness.
3.3.5 Gas Inventory Control CBC power output can be controlled via gas inventory control. This control scheme involves
increasing or decreasing the absolute pressure of the loop by changing the quantity of working fluid used in the closed loop. In general, the low- and high-pressure sides of the CBC will increase or decrease with corresponding changes in the gas inventory. Therefore, the pressure ratios at which the compressor and turbine operate are not directly affected by changes in the gas inventory. However, changes in the fluid density resulting from changes in the system pressure will impact the working fluid mass flow rate and the associated process variables. Increases in pressure will generally increase the power generated for the same reactor temperature [8]. Since changing the gas inventory is a relatively slow process, the gas inventory control scheme is a control scheme that provides a low response time. However, the gas inventory control scheme can be used to vary net power generation while keeping both the thermal and electrical efficiency at relatively high levels [8].
Figure 58 through Figure 61 provide predicted system performance data from the HYSYS partial load model with a gas inventory control strategy. Off-design equipment component performance is modeled as described in Section 3.2. The data in these figures are based on a turbine inlet temperature of 600°C and a CIP (P1) of 1 bar. Separate curves for each of the dependent variables evaluated are plotted at TAC shaft speeds of 50,000, 70,000, and 90,000 RPM.
In general, MAGNET PCU operation with increased working fluid inventory results in increased reactor thermal power, increased net electrical power generation, and a slight decrease in cycle thermal efficiency. Increases in the MAGNET PCU gas inventory result in greater working fluid flow rates, which increase the reactor power required to achieve the target turbine inlet temperature (Figure 58). The increased working fluid flow rate and reactor heat output associated with increasing gas inventory provide greater thermal energy input to the turbine, which has the effect of increasing net power generation (Figure 59). For all TAC shaft speeds evaluated, the PCU thermal efficiency decreases mildly with CIP

56
(Figure 60). The efficiency decrease is attributed to decreased recuperator effectiveness and increased frictional losses with increased fluid density and mass flow rate.
At elevated CIPs (greater than approximately 2 bar) the working fluid density and mass flow rate increase to values larger than predicted for the other control schemes evaluated. The increase in working fluid mass flow rate results in reactor heat input (Figure 58) and gas cooler heat rejection requirements (Figure 61) that exceed the capacity ratings of the 75 kWt microreactor test article and the Basco®/Whitlock® gas cooler, respectively. Therefore, testing the PCU with elevated CIP may require use of a microreactor test article with thermal power output greater than 75 kWt (such as a 250 kWt microreactor test article) as well as heat rejection capacity beyond what can be provided by the Basco®/Whitlock® gas cooler (i.e., use of the XLG® and Basco®/Whitlock® gas coolers in a series configuration may be required).
As described in Section 3.3.1, the relatively low thermal efficiency at a TAC shaft speed of 90,000 RPM is due primarily to a decrease in compressor efficiency at the flow conditions corresponding to higher shaft speeds; system configurations with increased working fluid flow rate (i.e., systems with decreased pressure losses) at TAC shaft speeds exceeding 80,000 RPM would allow the compressor to operate closer to its peak efficiency. The offset between the operating line predicted by the HYSYS MAGNET PCU model and reported the Sandia CBC analysis also causes the MAGNET system to operate at a point with a lower flow rate (see Figure 33); elimination of this offset would result in HYSYS PCU partial load model predicted operating points closer to the peak efficiency operating points for the turbine and compressor.
Figure 58. Reactor thermal power as a function of compressor inlet pressure with TAC shaft speed as a parameter.

57
Figure 59. Net power as a function of compressor inlet pressure with TAC shaft speed as a parameter.
Figure 60. Cycle thermal efficiency as a function of compressor inlet pressure with TAC shaft speed as a parameter.

58
Figure 61. Gas cooler duty as a function of compressor inlet pressure with TAC shaft speed as a parameter.
Additional plots of PCU performance are included in Appendix A. Additional simulation data presented as functions of gas inventory (i.e., CIP) in Appendix A include working fluid mass flow rate, compressor outlet pressure (P2), and recuperator effectiveness.
3.3.6 Gas Cooler Outlet Temperature Control Another control approach is to adjust the gas cooler outlet temperature (compressor inlet temperature)
by changing the heat duty of the gas cooler [8]. Increased compressor inlet temperature decreases the working fluid density and decreases the mass flow rate of fluid that is circulated by the compressor. This shifts the compressor pressure ratio curves (e.g., the black lines in Figure 33) to the left such that the PCU operates at a point with lower pressure ratio. The increased compressor inlet temperature also results in an increased compressor outlet temperature, which has the effect of decreasing the reactor thermal power input required to achieve the target turbine inlet temperature.
The combined effects of increased compressor inlet temperature result in a decrease in the cycle net power generation as well as a decrease in the cycle thermal efficiency. The gas cooler outlet temperature control strategy is characterized by a medium response time, as the cooling water flow rate can be changed relatively quickly but the thermal inertia of the gas cooler will slow the time for the changes to affect process operations.
Figure 62 through Figure 64 include predicted system performance data from the HYSYS partial load model with a gas cooler outlet temperature control strategy. Off-design equipment component performance is modeled as described in Section 3.2. The data in these figures are based on CIP of 1 bar and TAC shaft speed of 96,000 RPM. Separate curves for each of the dependent variables evaluated are plotted at turbine inlet temperatures of 600°C, 700°C, and 877°C.
As the gas cooler outlet temperature increases, the reactor thermal power decreases, the net power decreases, and the cycle thermal efficiency decreases. The reactor thermal power, cycle net power, and cycle thermal efficiency are each at their greatest values when the turbine inlet temperature is highest, and at their lowest values when the turbine inlet temperature is lowest. When operating with a turbine inlet temperature of 600°C, the cycle net power generation becomes negative at a gas cooler outlet temperature of approximately 100°C (i.e., external power addition is required to maintain the TAC shaft speed set point). When the turbine inlet temperature is 700°C, the net power generation becomes negative at a gas cooler outlet temperature of approximately 175°C. Further increases in the gas cooler outlet temperature

59
result in a greater magnitude of negative net power generation. The thermal efficiency also becomes negative at each of the gas cooler outlet temperatures identified above.
Figure 62. Reactor thermal power as a function of gas cooler outlet temperature with turbine inlet temperature as a parameter.
Figure 63. Cycle net power as a function of gas cooler outlet temperature with turbine inlet temperature as a parameter.

60
Figure 64. Cycle thermal efficiency as a function of gas cooler outlet temperature with turbine inlet temperature as a parameter.
Additional plots of PCU performance are included in Appendix A. Additional simulation data presented as functions of gas cooler outlet temperature in Appendix A include working fluid mass flow rate, compressor outlet pressure (P2), and recuperator effectiveness.
3.4 Process Startup/Shutdown 3.4.1 Startup
Initial PCU startup operations are focused on system operability checks and will require net power addition to circulate working fluid. As the reactor power and/or TAC shaft speed are increased the gross turbine power will also increase. At the TAC operating speed referred to as “self-sustaining” conditions the net power generation will be greater than zero and the TAC shaft will not require external power input to sustain the target rotational speed. During startup “Turbine efficiencies must be high enough, at a speed approximately 40% to 85% of its design speed, in order for the engine to sustain itself without starter power” [32].
Heat addition in natural gas fueled turbines is constrained by the air flow rate. During normal natural gas combustion turbine operations, the fuel must be added to the air at near stoichiometric ratios. However, nuclear heat-based microturbines can heat the working fluid to a specified turbine inlet temperature independently of the flow rate. This characteristic provides additional flexibility for the startup and shutdown of nuclear microreactor-based PCUs. A proposed startup routine based in part on the procedure used by Sandia to operate the modified Capstone C30 microturbine unit is provided below:
7. Initiate instrumentation and controls.
8. Purge/charge system with working fluid of desired composition and pressure. Inert gas, such as pure nitrogen, to be used for initial system operability testing.
9. Start flow of cooling water to gas cooler. System interlock to require at least 5 gpm of cooling water flow for the test loop to run.
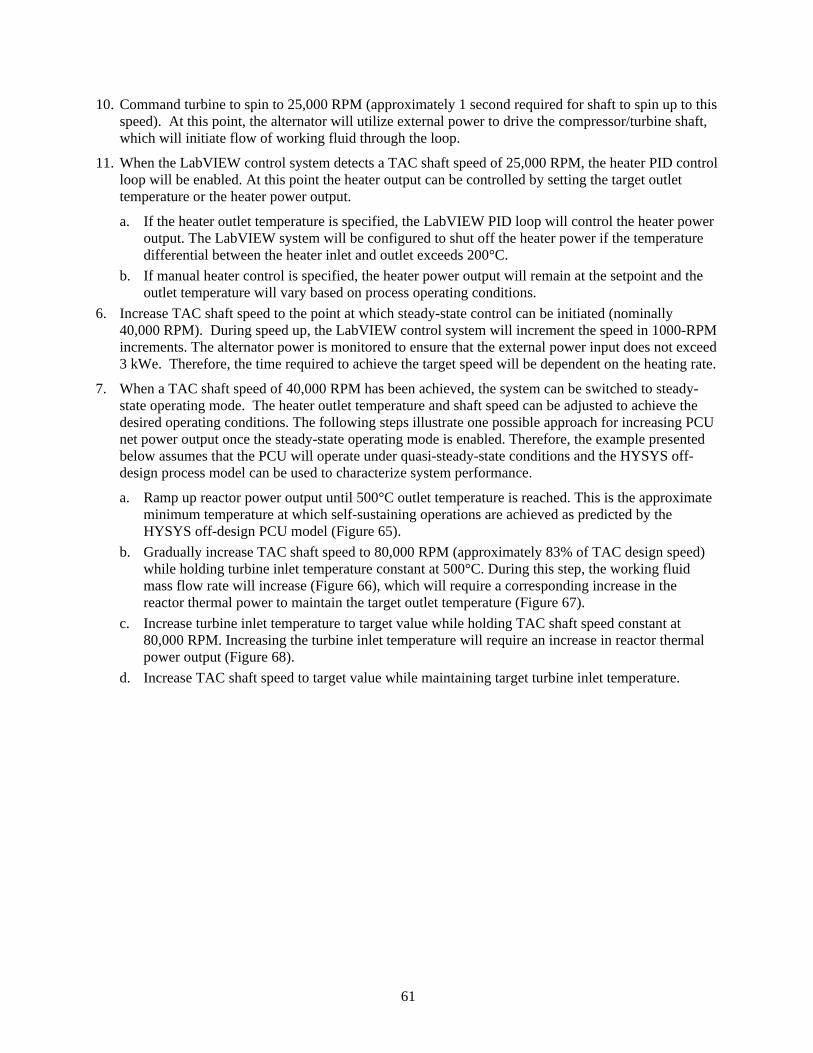
61
10. Command turbine to spin to 25,000 RPM (approximately 1 second required for shaft to spin up to this speed). At this point, the alternator will utilize external power to drive the compressor/turbine shaft, which will initiate flow of working fluid through the loop.
11. When the LabVIEW control system detects a TAC shaft speed of 25,000 RPM, the heater PID control loop will be enabled. At this point the heater output can be controlled by setting the target outlet temperature or the heater power output.
a. If the heater outlet temperature is specified, the LabVIEW PID loop will control the heater power output. The LabVIEW system will be configured to shut off the heater power if the temperature differential between the heater inlet and outlet exceeds 200°C.
b. If manual heater control is specified, the heater power output will remain at the setpoint and the outlet temperature will vary based on process operating conditions.
6. Increase TAC shaft speed to the point at which steady-state control can be initiated (nominally 40,000 RPM). During speed up, the LabVIEW control system will increment the speed in 1000-RPM increments. The alternator power is monitored to ensure that the external power input does not exceed 3 kWe. Therefore, the time required to achieve the target speed will be dependent on the heating rate.
7. When a TAC shaft speed of 40,000 RPM has been achieved, the system can be switched to steady-state operating mode. The heater outlet temperature and shaft speed can be adjusted to achieve the desired operating conditions. The following steps illustrate one possible approach for increasing PCU net power output once the steady-state operating mode is enabled. Therefore, the example presented below assumes that the PCU will operate under quasi-steady-state conditions and the HYSYS off-design process model can be used to characterize system performance.
a. Ramp up reactor power output until 500°C outlet temperature is reached. This is the approximate minimum temperature at which self-sustaining operations are achieved as predicted by the HYSYS off-design PCU model (Figure 65).
b. Gradually increase TAC shaft speed to 80,000 RPM (approximately 83% of TAC design speed) while holding turbine inlet temperature constant at 500°C. During this step, the working fluid mass flow rate will increase (Figure 66), which will require a corresponding increase in the reactor thermal power to maintain the target outlet temperature (Figure 67).
c. Increase turbine inlet temperature to target value while holding TAC shaft speed constant at 80,000 RPM. Increasing the turbine inlet temperature will require an increase in reactor thermal power output (Figure 68).
d. Increase TAC shaft speed to target value while maintaining target turbine inlet temperature.

62
Figure 65. Net power versus TAC shaft speed.
Figure 66. Working fluid mass flow rate as function of TAC shaft speed with 500°C turbine inlet temperature and 1 bar compressor inlet pressure.

63
Figure 67. Reactor thermal power as function of TAC shaft speed with 500°C turbine inlet temperature and 1 bar compressor inlet pressure.
Figure 68. Reactor thermal power as function of turbine inlet temperature with 80,000 RPM TAC shaft speed and 1 bar compressor inlet pressure.

64
3.4.2 Shutdown The MAGNET Capstone C30 microturbine-based PCU shutdown procedure will be programmed into
the system LabVIEW control system. Therefore, the shutdown procedure can be initiated by the system operator by initiating the shutdown command from the control system interface. The shutdown procedure is designed to ensure that the system is shut down without equipment damage (from operation at conditions outside normal operating ranges including component temperatures, speeds, etc.). The following general action list summarizes the shutdown procedure implemented in Sandia testing [8], which will also be applicable for shutdown of the MAGNET PCU:
1. Initiation of the shutdown routine first turns the heater power to zero. From this point the controller monitors the generator power output. Normally the net power output is positive, but as heater output decreases, the net power output will eventually become negative such that the alternator will be motored to maintain the target shaft speed.
2. The RPM is reduced in 5000 RPM increments to keep the motor power to less than 3 kWe. The shaft speed is expected to decrease to 40,000 to 45,000 RPM while maintaining motor power below 3 kWe.
3. During the shaft speed reduction operations, the turbine inlet temperature is monitored. When the turbine inlet temperature gets below the shutoff temperature set point of 200°C, then the turbine is shut down completely. Complete turbine shutdown is achieved by commanding the TAC shaft speed to 25,000 RPM, waiting several seconds, and then sending the final shut down sequence commands to the Capstone controller. At zero RPM the Capstone controller is rebooted.
3.5 Dynamic Stability As noted by Wright et al. [8], reactor-driven CBCs have unique operating characteristics, including
the existence of two steady-state TAC operating points for a given reactor thermal power output. One steady-state TAC operating point occurs at a higher TAC shaft RPM and the other occurs at a lower TAC shaft RPM. The decrease in TAC load at high RPM is due in part to choked flow conditions at higher flow rates. The lower RPM operating point is characterized by a lower reactor thermal power input requirement than the higher RPM operating point. Since both steady-state operating points for a given turbine inlet temperature are characterized by the same net power output, the lower RPM operating point would result in more efficient cycle operation.
To evaluate the stability of the two operating points, a dynamic model (non-steady-state operations) is required. At non-steady-state operating conditions, it is possible that a mismatch can exist between the load and the cycle net power output. The magnitude of this power discrepancy is designated by the excess power. The excess power, Px, is the sum of the load, turbine power, and compressor power per Equation 17.
Px = Pload + Pturbine – Pcomp (17)
Although two steady-state operating points are possible, only the higher RPM operating point is inherently stable (i.e., when a perturbation in the load decreases the shaft speed the excess power is positive for the high RPM operating point), which will result in the shaft speed accelerating back to the steady-state operating condition (“stable operating point” in Figure 69). Conversely, when a load perturbation decreases the shaft speed at the low RPM operating point, the excess power is negative, which further decreases the shaft speed and leads to a condition where the shaft speed will continually decrease leading to a system stall (“unstable operating point” in Figure 69). Additional details and discussion of reactor-driven CBC dynamic stability are provided by Wright et al. [8].

65
Figure 69. Excess power versus TAC shaft speed for a fixed reactor power. When Px > 0 RPM increases, when Px < 0 RPM decreases.
Although two steady-state operating conditions are possible, a dynamic process model is required to model system transient behavior (i.e., the excess power variable is only applicable to dynamic system modeling). It is recommended that a MAGNET PCU dynamic system model be developed to further investigate the transient performance of the specific system to be installed and operated at the INL facility. This dynamic model would include system dimensions and specifications specific to the MAGNET PCU installation for the purposes predicting and verifying control scheme response time and performance, as well as furthering the understanding of reactor-driven CBC system performance and operational characteristics. Information gained from a dynamic system model would be valuable for advancing microreactor PCU technology and useful for designing and deploying future microreactor PCU demonstrations.
As previously discussed, the lower RPM steady-state operating point requires lower reactor thermal power input than the higher RPM operating point while providing the same level of net power generation. Therefore, the lower RPM operating point is more thermodynamically efficient and is the desired operating point. Previous testing by Sandia indicates that use of an active feedback control system can successfully maintain PCU operations at the more efficient, lower RPM operating point [8]. The Capstone microturbine controller that accompanies the Sandia-modified Capstone C30 microturbine unit can provide rapid feedback control. Use of this controller will enable the MAGNET PCU to stably operate at points where net power generation is negative (during process startup, operations with low turbine inlet temperature, operations with high-pressure drop across throttling valve, etc.) as well as at points that are inherently instable (i.e., the unstable but more efficient, low RPM TAC operating point discussed above).
4. PROPOSED TESTS As part of the PCU simulator design, a staged approach for the tests will be outlined with the range of
conditions for each PCU connected to either a heat pipe- or gas-cooled microreactor. The data management plan defines the operating envelope and information needed from tests, as well as the granularity and number of measurements to be made. The focus is on obtaining measurement data that will be useful to evaluate performance and enable trade studies of different PCU configurations. Performance modeling using Aspen HYSYS will be used to guide the testing.
4.1 Basic Operability Testing Initial system testing will emphasize verification of basic system operability and performance. In
addition to demonstrating PCU startup/shutdown functionality, initial testing will collect data necessary to
Stable operating point
Unstable operating point (stall point)
Exce
ss P
ower
(Px)
Px>0 Px=0 Px<0
TAC shaft speed (RPM)

66
evaluate the system energy balance and compute individual equipment component performance (compressor and turbine efficiency, recuperator effectiveness, etc.). Basic operability testing data will be collected primarily at steady-state operating conditions after allowing the process to equilibrate to any control system or equipment configuration changes. Steady-state operating conditions selected for basic operability testing should be attained by adjusting TAC shaft speed and/or turbine inlet temperature, since the TAC and heater controllers must be implemented to achieve the setpoint targets. Therefore, the TAC and heater controller functionality will be demonstrated in collecting the PCU basic operability data. A list of basic system operability data to be collected during initial system operability testing is included below:
1. Startup/shutdown procedures a. Verify positive net power generation at approximate conditions specified in Figure 64. b. Verify functionality of reactor heater control (i.e., validate that heater controller achieves
specified target turbine inlet temperature) c. Verify gas cooler functionality and ability.
2. Energy balance (steady-state operating conditions) a. Verify performance of each component b. Quantify system heat losses
3. Verify predicted characteristic curves a. Turbine head and efficiency versus flow b. Compressor head and efficiency versus flow
4. Establish system operational curves (system pressure ratio versus mass flow rate) a. Power versus RPM at varying turbine inlet T b. Verification of self-starting/self-sustaining conditions c. Identification/verification of operating conditions with multiple operating points (i.e., stable and
unstable operating points).
4.2 Transient Behavior 4.2.1 Control Scheme Testing
The performance of the MAGNET PCU based on use of different control schemes is predicted from the HYSYS off-design process model in Section 3.3. Experimental testing is required to confirm the simulated process performance and to determine the response time, accuracy, and stability of each control scheme. A summary of the experiments proposed to evaluate each of the process control schemes identified for load-following applications is included in Table 4. The dependent variables in each of the proposed tests include the reactor thermal power (controlled to achieve the target turbine inlet temperature), the process pressure ratio, the working fluid mass flow rate, and the cycle net power output. Experimental data collected during control system testing will be used to compute and/or verify the reactor thermal power output, turbine efficiency, compressor efficiency, cycle thermal efficiency, recuperator effectiveness, gas cooler duty, system frictional pressure losses, and overall process energy balances (i.e., difference between energy input and energy output). A minimum data collection rate of 1 Hz for PCU testing is suggested (higher frequency data collection may be required for evaluation of certain control schemes or system perturbations and the corresponding response times). Three sweeps of each independent variable are recommended for each combination of control scheme test input parameters to ensure the replicability of experimental data.
12.
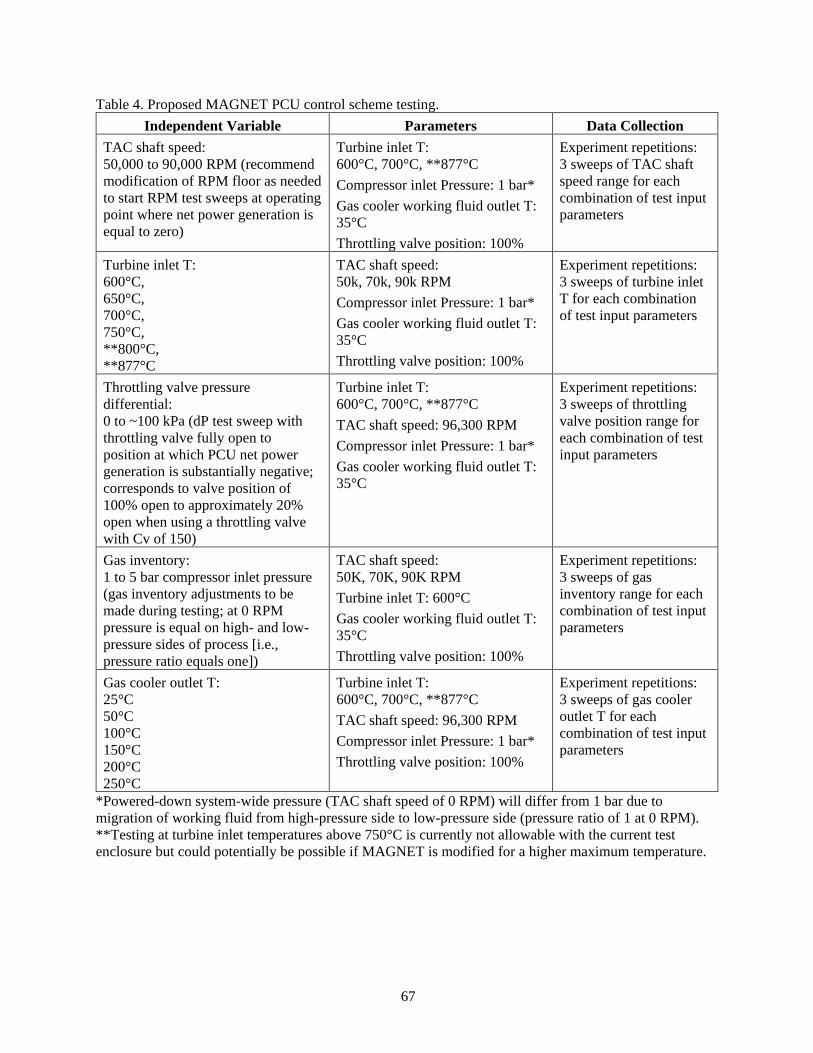
67
Table 4. Proposed MAGNET PCU control scheme testing. Independent Variable Parameters Data Collection
TAC shaft speed: 50,000 to 90,000 RPM (recommend modification of RPM floor as needed to start RPM test sweeps at operating point where net power generation is equal to zero)
Turbine inlet T: 600°C, 700°C, **877°C Compressor inlet Pressure: 1 bar* Gas cooler working fluid outlet T: 35°C Throttling valve position: 100%
Experiment repetitions: 3 sweeps of TAC shaft speed range for each combination of test input parameters
Turbine inlet T: 600°C, 650°C, 700°C, 750°C, **800°C, **877°C
TAC shaft speed: 50k, 70k, 90k RPM Compressor inlet Pressure: 1 bar* Gas cooler working fluid outlet T: 35°C Throttling valve position: 100%
Experiment repetitions: 3 sweeps of turbine inlet T for each combination of test input parameters
Throttling valve pressure differential: 0 to ~100 kPa (dP test sweep with throttling valve fully open to position at which PCU net power generation is substantially negative; corresponds to valve position of 100% open to approximately 20% open when using a throttling valve with Cv of 150)
Turbine inlet T: 600°C, 700°C, **877°C TAC shaft speed: 96,300 RPM Compressor inlet Pressure: 1 bar* Gas cooler working fluid outlet T: 35°C
Experiment repetitions: 3 sweeps of throttling valve position range for each combination of test input parameters
Gas inventory: 1 to 5 bar compressor inlet pressure (gas inventory adjustments to be made during testing; at 0 RPM pressure is equal on high- and low-pressure sides of process [i.e., pressure ratio equals one])
TAC shaft speed: 50K, 70K, 90K RPM Turbine inlet T: 600°C Gas cooler working fluid outlet T: 35°C Throttling valve position: 100%
Experiment repetitions: 3 sweeps of gas inventory range for each combination of test input parameters
Gas cooler outlet T: 25°C 50°C 100°C 150°C 200°C 250°C
Turbine inlet T: 600°C, 700°C, **877°C TAC shaft speed: 96,300 RPM Compressor inlet Pressure: 1 bar* Throttling valve position: 100%
Experiment repetitions: 3 sweeps of gas cooler outlet T for each combination of test input parameters
*Powered-down system-wide pressure (TAC shaft speed of 0 RPM) will differ from 1 bar due to migration of working fluid from high-pressure side to low-pressure side (pressure ratio of 1 at 0 RPM). **Testing at turbine inlet temperatures above 750°C is currently not allowable with the current test enclosure but could potentially be possible if MAGNET is modified for a higher maximum temperature.

68
4.2.2 Testing of Dynamic Response to System Perturbations Power cycle operations are subject to internal and external perturbations that can cause system
operations to deviate from the nominal operating conditions. For the power cycle to operate reliably, it must be able to rapidly and robustly recover from perturbations. Therefore, a series of experiments for evaluating the dynamic response of the MAGNET PCU to system perturbations is proposed. A proposed set of system perturbation tests are included in Table 5. The experiments include simulated loss of reactor power, disturbances in cooling system operation/performance, as well as perturbations to the system pressure and external load.
Note that the C30 is intended for baseload operations rather than for repeated start/stop cycles or fast and frequent steps in active power. Non-baseload operating regimes can induce increased thermomechanical stresses and accelerated aging of generator components. Since the C30 is not designed for flexible power generation including renewables that involve high rates of cycling, this aspect of power generation would be best assessed by computer modeling.
Nuclear reactors include numerous mechanisms and operating procedures to ensure safe and reliable operations. In the event of a safety-related event occurs, it is likely that a nuclear reactor will “trip,” which involves a rapid shutdown by immediately stopping fission reactions. During such an event the residual heat in the reactor core and ancillary equipment must continue to be removed to prevent damage from overheating system components or mechanical stress associated with large thermal gradients. The PCU provides a mechanism for removing the reactor decay heat. Immediately following reactor trip the decay heat is likely to provide PCU heat input sufficient to maintain self-sustaining PCU operations. As heat is removed from the core, the decay heat load will decrease and the PCU heat input will eventually become insufficient to maintain working fluid circulation without alternator motoring using an external electrical power source. The loss of power tests will determine the extent to which the heat source can be cooled without the use of external electrical power. It is proposed that two scenarios are evaluated: (1) instantaneous shutdown of electric resistance heater output, and (2) downward ramp of electric resistance heater power output with time at a rate representative of the thermal decay associated with a nuclear microreactor trip. The rapid temperature decline from electric resistance heater depowering (first scenario) will provide a bounding case for nuclear applications.
Transient gas cooler operations have the potential to significantly impact PCU process performance. Since numerous heat rejection technologies could be applicable for field-deployed microreactor PCU systems, it is important to characterize the impact of cooling system transients on system performance and operability. The MAGNET PCU gas cooler duty can be perturbed by varying the cooling water flow rate. Recommended transient testing includes changes in cooling system duty to simulate changes in heat sink conditions, source, or functionality (ambient temperature, cooling water source, impaired cooling system performance, etc.).
Perturbations to the PCU system pressure could occur during online working fluid inventory refresh (e.g., composition adjustment or system purge), as a result of system configuration changes (bringing units online in a modular system configuration, isolation valve position changes, etc.), from changes in ambient temperature, or incidents resulting in system leakage/loss of pressure. System pressure perturbation testing will be achieved by implementing step changes in the CIP via addition or removal of working fluid from the system. It is recommended that changes to system pressure be initiated and monitored at the compressor inlet. Since differences exist between the high- and low-pressure-side fluid density during system operation, changes in CIP may differ from changes to system pressure at process shutdown conditions.
Variations in the external load occur with high frequency in power generation applications. Variations in load have the potential to disturb or even destabilize PCU operations. The PCU control system must be able to respond to changes in load quickly and accurately. The control system performance and tuning are critical to achieving these requirements. Rapid and stable control system response is needed to ensure that

69
transients do not cause the system to oscillate out of control (e.g., a decrease in load can cause TAC RPM to increase, which increases working fluid flow rate, which may increase reactor power and further imbalance thermal power input requirements relative to the required power output). It is recommended that external load perturbations be investigated by initiating deviations in load with varying magnitude based on scenarios representative of potential field-deployed PCU applications. Additionally, load perturbations should be applied both at the high RPM (stable) and low RPM (unstable) operating conditions. Introducing load perturbations at the high RPM operating point can be performed to verify the dynamic stability at this operating point (i.e., verify that active TAC speed control is not required to recover from external disturbances). Introducing load perturbations at the low RPM operating point should be performed to verify the ability of the TAC controller to maintain operations at this unstable operating point and prevent the system from stalling or accelerating to the high RPM operating point (which is inherently stable but less efficient than the low RPM operating point).
Table 5. Proposed MAGNET PCU system perturbation testing. Perturbation Process Variable Change Data Collection Loss of reactor (resistance heater) power
Reactor (resistance heater) thermal power output reductions.
(1) Instantaneous shutdown of resistance heater thermal power output. (2) Resistance heater thermal power output versus time profile representative of the thermal decay occurring upon nuclear reactor trip.
Change in gas cooler duty
Step change reductions in cooling water flow rate from max value to value where net power generation becomes negative or compressor inlet temperature of 250°C is reached (whichever comes first).
Experiment repetitions: Evaluate 5 different step changes in cooling water flow rate (each starting at max flow rate with a step change to a lower flow rate).
Change in system pressure
Step changes in compressor inlet pressure.
Experiment repetitions: Repeat experiment with rapid compressor inlet pressure changes of approximately 10 kPa, 50 kPa, 100 kPa, and 200 kPa.
External load perturbations
Increases and decreases in alternator load when operating at: (1) High RPM (stable) steady-state operating condition. Test with RPM controller enabled and disabled to verify dynamic stability at this operating point. (2) Low RPM (unstable) steady-state operating condition. Test with RPM controller enabled to prevent stall.
Experiment repetitions: Investigate external load perturbations of varying amplitude. Magnitude of perturbations to be determined based on representative operational scenarios.
During system perturbation testing, comprehensive process condition versus time data will be
collected to enable subsequent evaluation of the system response time as well as to assess the impacts of the perturbations on process performance (changes in performance during the transient event as well as the ability of the system to return to the specified operating conditions). To evaluate whether the system response time is sufficiently rapid to achieve target ramp rates, process condition and system performance data must be collected at a frequency higher than the target response time. A minimum data collection rate of 1 Hz for PCU testing is suggested (higher frequency data collection may be required for evaluation of certain control schemes or system perturbations and the corresponding response times).

70
Data to be recorded during system transient testing include process instrumentation data (temperature, pressure, flow rate), heater controller data (resistance heater electrical power input), TAC controller data (TAC shaft speed, electrical power output), and system configuration/control data (control system setpoint values, computed process performance values, etc.). Process and equipment component performance data to be computed from the experimental data include turbine efficiency, compressor efficiency, cycle thermal efficiency, recuperator effectiveness, reactor thermal power input, gas cooler duty, system frictional pressure losses, and overall process energy balances.
5. SUMMARY AND RECOMMENDATIONS The Capstone C30 microturbine unit (as modified by Sandia for external heat addition) and the
Basco®/Whitlock® gas cooler have been evaluated for PCU testing using the MAGNET test articles as the heat source. It is concluded that the Capstone C30 microturbine and Basco®/Whitlock® gas cooler have equipment performance specifications compatible with the MAGNET testbed, and these equipment components would be well suited for CBC testing in conjunction with the MAGNET 75 kWt test articles. Since the operating temperature (600°C) and energy transfer per unit working fluid mass (~170 kJ/kg) are comparable between the C30 PCU and a full-scale recuperated air Brayton cycle producing 10 MWt, MAGNET can offer the ability to evaluate the test article heat transfer under representative operating conditions with the transient system behavior associated with a CBC PCU.
Use of the Basco®/Whitlock® heat exchanger (unit from Sandia CBC testing) is recommended for MAGNET PCU testing using 75 kWt test articles. Aspen EDR simulations predict that the Basco®/Whitlock® heat exchanger can provide heat rejection capacity consistent with the value listed on the manufacturer-provided specification sheet.
The XLG® exchanger (gas cooler identified for MAGNET test article performance evaluation) is believed to contain internal heat transfer enhancements; however, information about the enhanced heat transfer surfaces is not immediately available. The performance predicted by Aspen EDR for an exchanger with equivalent geometry and no internal enhancements varies significantly from the performance on the manufacturer-provided specification sheet. Additionally, the XLG® heat exchanger will be operated using extended length piping to interface with a cooling source external to the Energy Systems Laboratory. The heat losses associated with the extended piping have the potential to adversely affect PCU testing and a more compact heat rejection system, such as the water cooled Basco®/Whitlock® unit, are, therefore, expected to support more efficient PCU operations due to lower heat losses and lower pressure losses.
Supplemental gas cooling duty would be required if a test article with thermal capacity that significantly exceeds 75 kWt is used with the PCU. The XLG® heat exchanger could be incorporated in a series configuration to provide additional cooling duty.
The MAGNET test article operating temperatures are generally lower than the nominal turbine inlet temperatures achieved for the Capstone C30 original design application of power generation from natural gas combustion. Therefore, the C30 microturbine unit is expected to operate with a lower thermal efficiency in MAGNET PCU testing. At nominal operating conditions of 96,300-RPM TAC shaft speed, 600°C turbine inlet temperature, and 75 kWt reactor thermal power output (achieved using gas inventory control with CIP of 1.026 bar per Figure 42) the predicted MAGNET PCU performance based on HYSYS process modeling is a net power output of 11.4 kWe with a cycle thermal efficiency of 15.2%. To achieve the Capstone C30 rated power output of 30 kWe at this turbine inlet temperature and CIP, thermal input exceeding 75 kWt would be required. Increased thermal input could be provided by a 250 kWt microreactor test article, although this level of thermal power would exceed the input requirements of a single Capstone C30 TAC unit. Therefore, testing with a 250 kWt microreactor test article would require the thermal power output of the test article to be modulated in accordance with the TAC thermal input requirements, or alternatively, use of multiple C30 units installed in parallel to utilize the full 250 kWt microreactor test article thermal power output and to achieve higher electrical power output. PCU

71
operation with microreactor test article thermal power output levels significantly greater than 75 kWt would require increased gas cooler capacity.
The MAGNET test chamber is rated for a pressure of 22 bar, which exceeds the peak operating pressure identified in the HYSYS process modeling evaluation of the MAGNET PCU load following control schemes. The highest localized pressure identified in HYSYS modeling corresponds to compressor outlet pressure of 10.5 bar at the maximum system pressure evaluated in the pressure gas inventory control scheme. A reactor thermal input greater than 250 kWt is required to achieve this operating point; therefore, PCU operating pressures of this magnitude are not expected during MAGNET testing.
Several control strategies were analyzed to predict PCU performance as a function of selected control variables at varying partial load operating conditions. HYSYS process modeling of selected control schemes, including TAC shaft speed, turbine inlet temperature, gas (working fluid) inventory, gas cooler duty, and throttling valve control schemes, indicated that there are numerous strategies that can be used to control net power output of reactor-driven CBC PCUs for load following applications.
Ultimately, each control scheme investigated has different operating characteristics and should be tested to evaluate performance. The control schemes that are expected to result in the greatest thermal efficiency include the TAC shaft speed, gas inventory, and turbine inlet temperature control schemes. The control schemes expected to provide the most rapid response times include the TAC shaft speed and throttling valve control schemes. Experimental testing is necessary to validate the results of the HYSYS control scheme simulations and to verify performance of individual process components (turbine and compressor characteristic curves, recuperator performance, etc.).
For MAGNET PCU testing use of the gas inventory control scheme with compressor inlet pressures exceeding 2 bar may require heat addition and heat rejection at capacities greater than what can be provided by a 75 kWt test article and the Basco®/Whitlock® gas cooler, respectively. Therefore, gas inventory control scheme testing at higher system pressures may require use of 250 kWt test articles and increased gas cooler capacity (e.g., use of the XLG® and Basco®/Whitlock® gas coolers connected in series as described above).
A throttling valve is not required for control of the MAGNET PCU, but inclusion of one would provide the ability to test additional control schemes and to gain further insight into the transient operating characteristics of reactor-driven closed Brayton cycles. A throttling valve with a Cv of 150 (USGPM @ 60°F and 1 psi differential pressure) is recommended for providing accurate control of the MAGNET PCU configured with a 75 kWt test article.
Implementation of the control schemes discussed above will require development of a LabVIEW (or equivalent) control system capable of interfacing with the Capstone C30 TAC controller and the MAGNET test article electrical resistance heater control system. The LabVIEW control system will control these subsystems to operate the PCU at the specified operating conditions and provide global PCU functionality, including data acquisition and startup/shutdown routines. The control system must support feedback control functionality to test the control schemes evaluated in this report (e.g., control of heater thermal power output to achieve a target outlet temperature setpoint).
Due to the quasi-steady-state modeling limitations of ASPEN HYSYS, a dynamic system model should be developed to further investigate the transient operation (response times, system performance, control system parameters, etc.) of the coupled reactor-PCU system. Additionally, grid connectivity could be explored using the microgrid available at the Energy Systems Laboratory. A dynamic model would include system dimensions and specifications specific to the MAGNET PCU installation for the purposes predicting and verifying control scheme response time and performance, as well as furthering the understanding of reactor-driven CBC system performance and operational characteristics. Information

72
gained from a dynamic system model would be valuable for advancing microreactor PCU technology and useful for designing and deploying future microreactor PCU demonstrations.
The integration of the C30 unit into the MAGNET loop provides an opportunity for operator training on a small PCU. Users will have the ability to interface with the controls and obtain feedback on certain aspects the integrated microreactor PCU cycle. Areas for future work include the construction of a digital twin to facilitate further understanding of the interaction between the reactor and the PCU. Data from the coupled reactor-PCU could be used to develop and validate anomaly detection algorithms to facilitate remote or autonomous operations [33]. The coupled system could also be used to test novel waste heat recovery systems.
6. REFERENCES 1. INL, A Microreactor Program Plan for The Department of Energy, Idaho National Laboratory
Report, INL/EXT-20-58919, July 2020. 2. D. P. Guillen, H. Trellue, J. O’Brien, P. Sabharwall, R. S. Reid, T. Unruh, T. Jay Harrison, T.-L.
Sham, “Development of a Non-Nuclear Microreactor Test Bed,” Transactions of the American Nuclear Society, Vol. 121, November 2019.
3. INL, Functional and Operating Requirements for the Microreactor Agile Non-Nuclear Experimental Test Bed (MAGNET), Idaho National Laboratory, FOR-376, March 2020.
4. J. Litrel, D. P. Guillen, and M. McKellar, “Investigation of Performance Enhancements for Air-Brayton/ORC Combined Cycles for Small (~2 MWe) Power Systems and Moderate Heat Source Temperature,” JOM, Vol. 71, No. 5, May 2019, pp. 1616–1622.
5. Y. Ahn. S. J. Bae, M. Kim. S, K. Cho, S. Baik. J. I. Lee, J. E. Cha, “Review of supercritical CO2 power cycle technology and current status of research and development,” Nuclear Engineering and Technology, Vol. 47, No. 6, October 2015, pp. 647–661.
6. AspenTech, “Aspen HYSYS V10 (36.0.2.251),” Aspen Technology, Inc., 2017, www.aspentech.com. 7. M. G. McKellar and C. G. Turner, “Letter Report: Analysis of Micro-Reactor Power Conversion
Systems,” January 2020. 8. S. A. Wright, R. J. Lipinski, M. E. Vernon, and T. Sanchez, Closed Brayton Cycle Power Conversion
Systems for Nuclear Reactors: Modeling, Operations, and Validation, Sandia, Albuquerque, New Mexico SAND2006-2518, April 2006.
9. H. Trellue, J. O’Brien, J. Carpenter, R. Reid, D.P. Guillen, and P. Sabharwall, Microreactor Demonstration and Testing Progress in FY19, Los Alamos National Laboratory Report, LA-UR-19-28768, August 29, 2019.
10. Capstone Turbine Corporation, “Advanced MicroTurbine System (AMTS),” DE-FC26-00CH11058, March 31, 2008.
11. Capstone Turbine Corporation, “P0417 C30 HP Natural Gas Data Sheet CAP135,” www.capstoneturbine.com, Chatsworth, CA, 2017.
12. Capstone Turbine Corporation, Chatsworth, California April 2006.Turbine Corporation, “Technical Reference: Capstone Model C30 Performance,” Capstone Turbine
13. Capstone Turbine Corporation, https://www.capstoneturbine.com/products/c30, accessed August 5, 2020.
14. S. A. Wright, M. E. Vernon, and P. Pickard, Small Scale Closed Brayton Cycle Dynamic Response Experiment Results, Sandia National Laboratory, Albuquerque, New Mexico SAND2006-3485, 2006.
15. B. Treece, P. Vessa, and R. McKeirnan, “Microturbine Recuperator Manufacturing and Operating Experience,” presented at the ASME turbo expo, Amsterdam, The Netherlands, 2002.

73
16. G. Xiao, et al., “Recuperators for micro gas turbines: A review,” Applied Energy, Vol. 197, pp. 83–99, 2017.
17. E. Utriainen and B. Sundén, “A numerical investigation of primary surface rounded cross wavy ducts,” Heat and Mass Transfer, Vol. 38, No. 7–8, pp. 537–542, 2002.
18. E. Utriainen and B. Sundén, “A Comparison of Some Heat Transfer Surfaces for Small Gas Turbine Recuperators,” presented at the Volume 3: Heat Transfer; Electric Power; Industrial and Cogeneration, 2001.
19. E. Utriainen and B. Sundén, “Evaluation of the Cross Corrugated and Some Other Candidate Heat Transfer Surfaces for Microturbine Recuperators,” Journal of Engineering for Gas Turbines and Power, Vol. 124, No. 3, pp. 550–560, 2002.
20. A. Traverso and A. F. Massardo, “Optimal design of compact recuperators for microturbine application,” Applied Thermal Engineering, Vol. 25, No. 14–15, pp. 2054–2071, 2005.
21. F. P. Incropera and D. P. DeWitt, Fundamentals of Heat and Mass Transfer, 4 ed. New York: Wiley, 2000.
22. Y. A. Cengel and A. Ghajar, Heat and Mass Transfer: Fundamentals & Applications, 5th ed. McGraw-Hill Companies, Inc., 2015.
23. E. W. Lemmon, I. H. Bell, M. L. Huber, and M. O. McLinden, “NIST Standard Reference Database 23: Reference Fluid Thermodynamic and Transport Properties-REFPROP Standard Reference Data Program,” Version 10.0 ed. Gaithersburg, Maryland: National Institute of Standards and Technology, 2018.
24. M. Moshfeghian, Compressor Calculations: Rigorous Using Equation of State vs Shortcut Method, May 11, 2011, Available: http://www.jmcampbell.com/tip-of-the-month/2011/11/compressor-calculations-rigorous-using-equation-of-state-vs-shortcut-method/.
25. P. J. Thomas, Simulation of Industrial Processes for Control Engineers. Elsevier, 1999. 26. S. M. Hall, Rules of Thumb for Chemical Engineers, 6 ed., 2018. 27. T. Benson, “Isentropic Flow Equations.” National Aeronautics and Space Administration. June 12,
2014. Available: https://www.grc.nasa.gov/WWW/BGH/isentrop.html 28. L. Malinowski and M. Lewandowska, “Analytical model-based energy and exergy analysis of a gas
microturbine at part-load operation,” Applied Thermal Engineering, Vol. 57, No. 1–2, pp. 125–132, 2013.
29. W. Wang, R. Cai, and N. Zhang, “General characteristics of single shaft microturbine set at variable speed operation and its optimization,” Applied Thermal Engineering, Vol. 24, No. 13, pp. 1851–1863, 2004.
30. T. Kim and S. Hwang, “Part load performance analysis of recuperated gas turbines considering engine configuration and operation strategy,” Energy, Vol. 31, No. 2-3, pp. 260–277, 2006.
31. C. F. McDonald, “Recuperator considerations for future higher efficiency microturbines,” Applied Thermal Engineering, Vol. 23, No. 12, pp. 1463–1487, 2003.
32. J. H. Kim, T. W. Song, T. S. Kim, and S. T. Ro, “Dynamic Simulation of Full Startup Procedure of Heavy-Duty Gas Turbines,” Journal of Engineering for Gas Turbines and Power, Vol. 124, No. 3, 2002, pp. 510–516.
33. A. Y. Al Rashdan, M. Griffel, R. Boza, D.P. Guillen, Subtle Process Anomalies Detection Using Machine Learning Methods, Idaho National Laboratory External Report INL/EXT-19-55629, September 2019.

Appendix A
A-1
Appendix A
PCU Controls A-1. TAC Shaft Speed Control
Figure A-1. Cycle net power as a function of TAC shaft speed with turbine inlet temperature as a parameter.
Figure A-2. Reactor thermal power as a function of TAC shaft speed with turbine inlet temperature as a parameter.

Appendix A
A-2
Figure A-3. Working fluid mass flow rate as a function of TAC shaft speed with turbine inlet temperature as a parameter.
Figure A-4. Cycle thermal efficiency as a function of TAC shaft speed with turbine inlet temperature as a parameter.

Appendix A
A-3
Figure A-5. Compressor outlet pressure as a function of TAC shaft speed with turbine inlet temperature as a parameter.
Figure A-6. Recuperator effectiveness as a function of TAC shaft speed with turbine inlet temperature as a parameter.

Appendix A
A-4
Figure A-7. Gas cooler duty as a function of TAC shaft speed with turbine inlet temperature as a parameter.
A-2. Turbine Inlet Temperature Control
Figure A-8. Cycle net power as a function of turbine inlet temperature with TAC shaft speed as a parameter.

Appendix A
A-5
Figure A-9. Reactor thermal power as a function of turbine inlet temperature with TAC shaft speed as a parameter.
Figure A-10. Working fluid mass flow rate as a function of turbine inlet temperature with TAC shaft speed as a parameter.

Appendix A
A-6
Figure A-11. Cycle thermal efficiency as a function of turbine inlet temperature with TAC shaft speed as a parameter.
Figure A-12. Compressor outlet pressure as a function of turbine inlet temperature with TAC shaft speed as a parameter.

Appendix A
A-7
Figure A-13. Recuperator effectiveness as a function of turbine inlet temperature with TAC shaft speed as a parameter.
Figure A-14. Gas cooler duty as a function of turbine inlet temperature with TAC shaft speed as a parameter.

Appendix A
A-8
A-3. Throttling Valve Control
Figure A-15. Cycle net power as a function of throttling valve pressure drop with turbine inlet temperature as a parameter.
Figure A-16. Reactor thermal power as a function of throttling valve pressure drop with turbine inlet temperature as a parameter.

Appendix A
A-9
Figure A-17. Working fluid mass flow rate as a function of throttling valve pressure drop with turbine inlet temperature as a parameter.
Figure A-18. Cycle thermal efficiency as a function of throttling valve pressure drop with turbine inlet temperature as a parameter.

Appendix A
A-10
Figure A-19. Compressor outlet pressure as a function of throttling valve pressure drop with turbine inlet temperature as a parameter. All data points based on compressor inlet pressure specification of 1 bar.
Figure A-20. Recuperator effectiveness as a function of throttling valve pressure drop with turbine inlet temperature as a parameter.

Appendix A
A-11
Figure A-21. Gas cooler duty as a function of throttling valve pressure drop with turbine inlet temperature as a parameter.
A-4. Gas Inventory Control
Figure A-22. Cycle net power as a function of compressor inlet pressure with TAC shaft speed as a parameter.

Appendix A
A-12
Figure A-23. Reactor thermal power as a function of compressor inlet pressure with TAC shaft speed as a parameter.
Figure A-24. Working fluid mass flow rate as a function of compressor inlet pressure with TAC shaft speed as a parameter.

Appendix A
A-13
Figure A-25. Cycle thermal efficiency as a function of compressor inlet pressure with TAC shaft speed as a parameter.
Figure A-26. Compressor outlet pressure as a function of compressor inlet pressure with TAC shaft speed as a parameter.
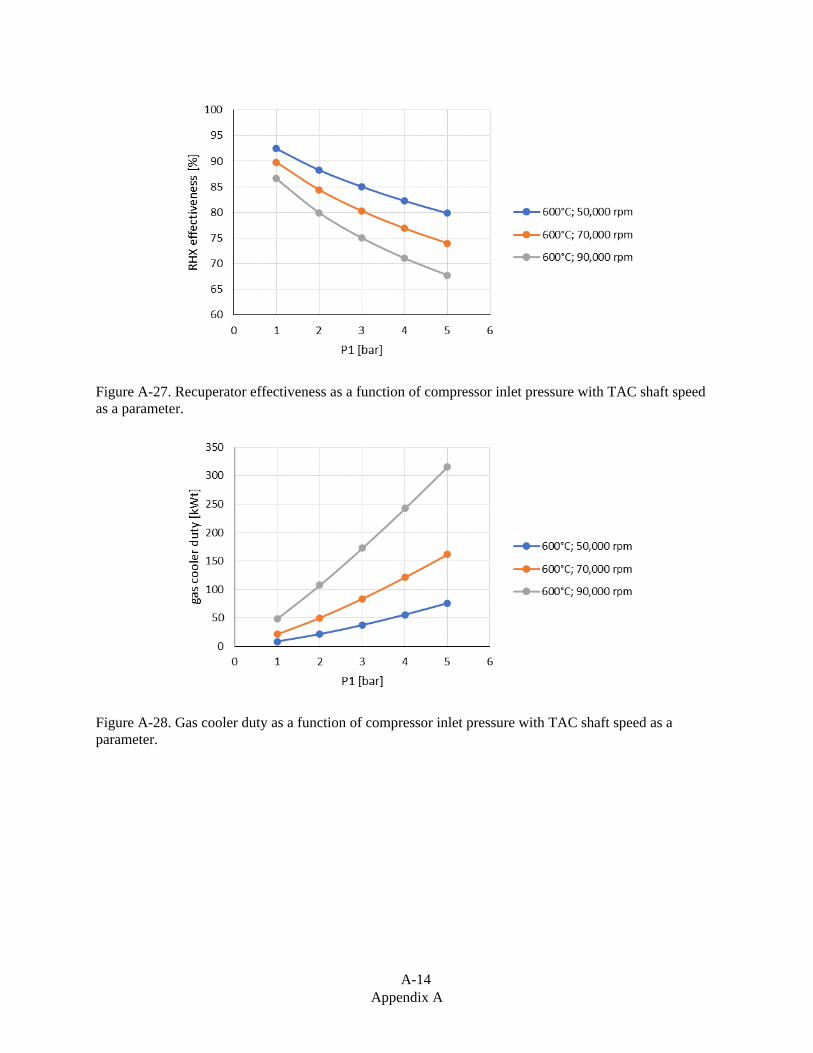
Appendix A
A-14
Figure A-27. Recuperator effectiveness as a function of compressor inlet pressure with TAC shaft speed as a parameter.
Figure A-28. Gas cooler duty as a function of compressor inlet pressure with TAC shaft speed as a parameter.

Appendix A
A-15
A-5. Gas Cooler Outlet Temperature Control
Figure A-29. Cycle net power as a function of gas cooler outlet temperature with turbine inlet temperature as a parameter.
Figure A-30. Reactor thermal power as a function of gas cooler outlet temperature with turbine inlet temperature as a parameter.

Appendix A
A-16
Figure A-31. Working fluid mass flow rate as a function of gas cooler outlet temperature with turbine inlet temperature as a parameter.
Figure A-32. Cycle thermal efficiency as a function of gas cooler outlet temperature with turbine inlet temperature as a parameter.

Appendix A
A-17
Figure A-33. Compressor outlet pressure as a function of gas cooler outlet temperature with turbine inlet temperature as a parameter.
Figure A-34. Recuperator effectiveness as a function of gas cooler outlet temperature with turbine inlet temperature as a parameter.

Appendix A
A-18
Figure A-35. Gas cooler duty as a function of gas cooler outlet temperature with turbine inlet temperature as a parameter.