Embed Size (px)
Citation preview
International Journal of Rock Mechanics & Mining Sciences 53 (2012) 166–178
Contents lists available at SciVerse ScienceDirect
International Journal ofRock Mechanics & Mining Sciences
1365-16
http://d
n Corr
200 Gra
Tel.: þ1
E-m
kyuseok1 N2 N
journal homepage: www.elsevier.com/locate/ijrmms
Integration of field characterisation, mine production and InSAR monitoringdata to constrain and calibrate 3-D numerical modelling of blockcaving-induced subsidence
Kyu-Seok Woo a,1,n, Erik Eberhardt a, Bernhard Rabus b, Doug Stead c, Alex Vyazmensky d,2
a Geological Engineering, EOS, University of British Columbia, Vancouver, Canadab MDA Systems, Ltd., Richmond, Canadac Simon Fraser University, Burnaby, Canadad Rio Tinto Copper Projects, Vancouver, Canada
a r t i c l e i n f o
Article history:
Received 11 April 2011
Received in revised form
23 March 2012
Accepted 3 May 2012Available online 4 June 2012
Keywords:
Block caving
Subsidence
InSAR monitoring
3-D numerical analysis
Model calibration
09/$ - see front matter & 2012 Elsevier Ltd. A
x.doi.org/10.1016/j.ijrmms.2012.05.008
esponding author at: AMC Mining Consulta
nville Street, Vancouver, British Columbia, Ca
604 669 0044; fax: þ1 604 669 1120.
ail addresses: [email protected],
[email protected] (K.-S. Woo).
ow at AMC Mining Consultants (Canada) Syst
ow at Kazakhmys PLC, Almaty, Kazakhstan.
a b s t r a c t
Block caving often leads to significant ground deformations that if not properly assessed and accounted for
may threaten the integrity and safety of overlying mine infrastructure. To mitigate this risk, sophisticated
3-D numerical modelling has been turned to as a means of predicting the extent and magnitudes of caving-
induced surface subsidence. However, the complexity of the rock mass interactions involved, coupled with
the uncertainty associated with geological heterogeneity, rock mass properties and in-situ stresses results
in the need for models to be constrained and calibrated. Results are first presented here from a detailed 3-D
back analysis of a caving-induced open pit mine slope failure, used to constrain the rock mass properties
and far-field in-situ stresses derived from field characterisation data, as well as to bring understanding to
the problem with respect to the cave-pit interactions. The ‘‘best fit’’ set of input properties obtained was
then used for forward modelling of caving-induced subsidence for the period 2009–2010. Further
calibration of this model was performed using high-resolution InSAR monitoring data. The close fit
achieved between the predictive 3-D numerical model and InSAR data demonstrates the promise of InSAR
as a means to calibrate sophisticated numerical models, and thereby contribute to managing block caving
associated subsidence hazards.
& 2012 Elsevier Ltd. All rights reserved.
1. Introduction
The use of block caving to mine deep, massive, low gradeorebodies is often favoured by the mining industry given itsmerits in terms of safety, tonnages produced and costs that canoften compete with those of open pit operations. As an under-ground mass mining method, however, significant ground surfacedeformations often develop. If these are not properly assessed andaccounted for, they may threaten the integrity and safety ofoverlying mine infrastructure. To better manage such risks,detailed engineering studies are undertaken to characterize theground conditions and provide input for empirical and numericaldesign calculations.
Empirical relationships are generally used for preliminary scop-ing calculations, for example to estimate caving angles based on
ll rights reserved.
nts (Canada) Systems, Ltd.,
nada V6C 1S4.
ems, Ltd.
rock mass quality [1]. These do not explicitly account for theinfluence of stress–strain interactions and geological heterogeneitythat may significantly affect the ground deformation profile. Instead,investigators have increasingly turned to advanced 2-D and 3-Dnumerical modelling to improve the assessment and understandingof block-caving subsidence dynamics and surface-undergroundinteractions [2–8].
As in any modelling study, the results depend on the initialconditions and material properties assumed. These can varygreatly in accordance with the geological heterogeneity andvariability encountered on site, with ranges of input propertiesbeing more likely than a single value. Furthermore, the numeroussurface and underground interactions involved – both spatial andtemporal – result in a complex 4-D problem that challenges eventhe most sophisticated numerical models.
The resulting model and parameter uncertainty necessitatesthat the models be constrained and calibrated in order to gainconfidence in their output. This paper examines these issuesbased on detailed back and forward analyses of the Palaborablock caving operation in South Africa. The first part of this paperfocusses on the back analysis of a large 800 m high pit slopefailure that occurred in response to block caving activities below thepit. This was used to constrain a 3-D finite-difference model against

K.-S. Woo et al. / International Journal of Rock Mechanics & Mining Sciences 53 (2012) 166–178 167
the range of rock mass strength values and in-situ stress ratiosderived from field investigation data. The second part of this paperreports the use of these ‘‘best fit’’ input properties to forward modelthe caving-induced subsidence at Palabora for the period 2009–2010. High resolution satellite-based Interferometric SyntheticAperture Radar (InSAR) data was used to further calibrate the 3-Dnumerical model developed. Together, the results presented demon-strate the promise of InSAR as a means to calibrate sophisticated 3-Dsubsidence models, improving our ability to assist mining compa-nies to execute safe, economic and sustainable mining practices.
Fig. 2. Quickbird image of the northwest wall failure at Palabora.
2. Palabora case history
The Palabora copper mine is a large, 30,000 t/day block caveoperation located in the eastern half of Limpopo, South Africa’snorthern most province. Underground mining commenced in April2001 after transitioning from an earlier open pit operation withtarget production being achieved in May 2005. The dimensions ofthe pit are approximately 800 m deep and 1650 to 1900 m indiameter, with slope angles ranging from 371 in the upper half of thepit to 581 in the lower, more competent lithologies. The block caveundercut level is approximately 1200 m below surface, 400 m belowthe pit floor (Fig. 1). The production level below the undercutconsists of 20 cross-cuts spaced across a footprint 650 m long byapproximately 250 m wide [9].
Fig. 1. Digital mine plans of the Palabora open pit and undercut geometries,
showing their proximate location to one another. Modified after Ref. [9].
Three years after the initiation of caving, cracking was observedin the northwest wall of the pit. These evolved over several monthsinto major movements and eventually failure of the 800 m high pitwall shortly after breakthrough of the cave into the bottom of the pit(Fig. 2). The failure extended 300 m beyond the outer perimeter ofthe pit, affecting access and haul roads, tailings, water and powerlines, water reservoirs and a railway line [9]. Fortunately, othercritical mine infrastructure were not affected.
Moss et al. [9] remarked that the failure at Palabora revealeddeficiencies in our understanding of cave–pit interactions. Subse-quently, a number of studies were carried out applying sophisti-cated numerical modelling to back analyse the Palabora failure[4,6–8]. Brummer et al. [4] first examined the failure mechanismusing the 3-D distinct element code 3DEC to model the influenceand kinematic control of major geological structures. Their find-ings showed that the observed movements were potentiallycaused by wedges formed by pervasive joints that daylight intothe cave region below the pit.
Another key study was that by Vyazmensky [7], who applied ahybrid finite-element/discrete-element modelling approach thatsimulates brittle fracturing within a network of non-persistentdiscontinuities. His work highlights the importance of joint setorientation on influencing the direction of cave propagation, aswell as the importance of rock bridges and their incrementalfailure through cave–pit interactions leading to the progressivefailure of the Palabora pit slope [8].
Although the preceding back analyses have made significantcontributions to our understanding of the pit slope failure mechan-ism associated with block caving at Palabora, Moss et al. [9] alsostress that given the level of up-front capital investment in a blockcave, it is extremely important to develop reliable predictive tools.This emphasises the need for reliable, well constrained and cali-brated forward analyses of block caving induced subsidence.
3. Model constraint and calibration through back analysis
3.1. Palabora 3-D model geometry
A detailed 3-D geological model was constructed integratingdigital mine plans (Fig. 1) with mine geology data (Fig. 3).
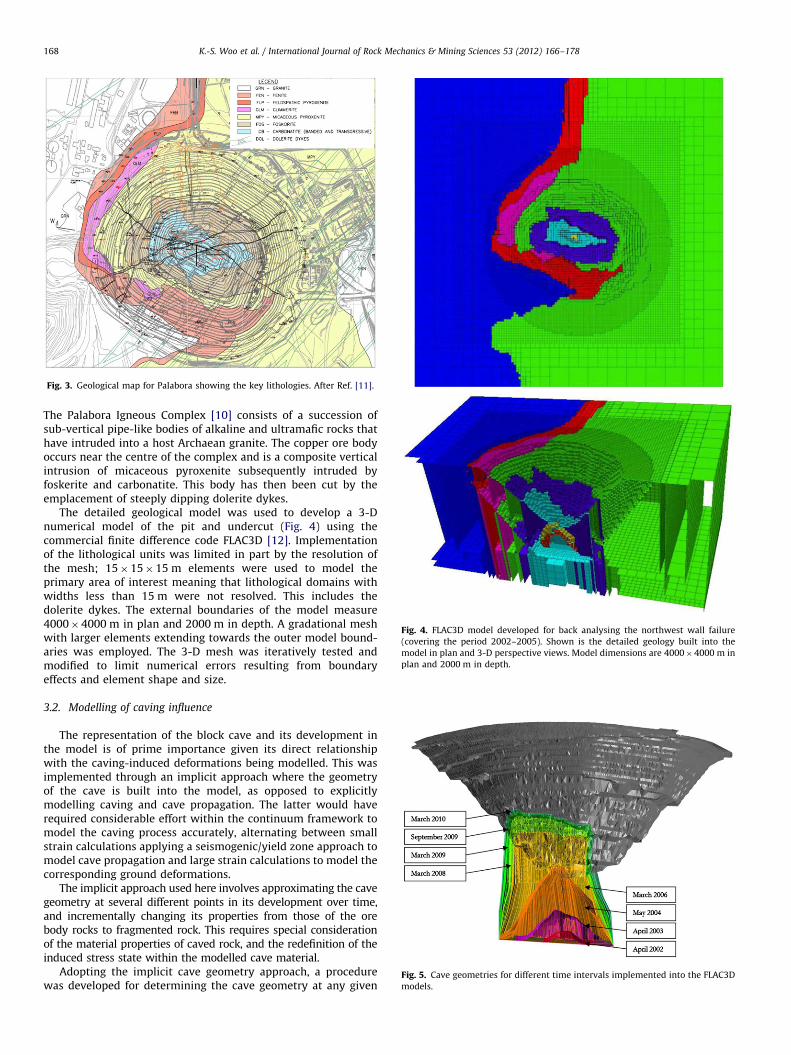
Fig. 3. Geological map for Palabora showing the key lithologies. After Ref. [11].
Fig. 4. FLAC3D model developed for back analysing the northwest wall failure
(covering the period 2002–2005). Shown is the detailed geology built into the
model in plan and 3-D perspective views. Model dimensions are 4000�4000 m in
plan and 2000 m in depth.
Fig. 5. Cave geometries for different time intervals implemented into the FLAC3D
models.
K.-S. Woo et al. / International Journal of Rock Mechanics & Mining Sciences 53 (2012) 166–178168
The Palabora Igneous Complex [10] consists of a succession ofsub-vertical pipe-like bodies of alkaline and ultramafic rocks thathave intruded into a host Archaean granite. The copper ore bodyoccurs near the centre of the complex and is a composite verticalintrusion of micaceous pyroxenite subsequently intruded byfoskerite and carbonatite. This body has then been cut by theemplacement of steeply dipping dolerite dykes.
The detailed geological model was used to develop a 3-Dnumerical model of the pit and undercut (Fig. 4) using thecommercial finite difference code FLAC3D [12]. Implementationof the lithological units was limited in part by the resolution ofthe mesh; 15�15�15 m elements were used to model theprimary area of interest meaning that lithological domains withwidths less than 15 m were not resolved. This includes thedolerite dykes. The external boundaries of the model measure4000�4000 m in plan and 2000 m in depth. A gradational meshwith larger elements extending towards the outer model bound-aries was employed. The 3-D mesh was iteratively tested andmodified to limit numerical errors resulting from boundaryeffects and element shape and size.
3.2. Modelling of caving influence
The representation of the block cave and its development inthe model is of prime importance given its direct relationshipwith the caving-induced deformations being modelled. This wasimplemented through an implicit approach where the geometryof the cave is built into the model, as opposed to explicitlymodelling caving and cave propagation. The latter would haverequired considerable effort within the continuum framework tomodel the caving process accurately, alternating between smallstrain calculations applying a seismogenic/yield zone approach tomodel cave propagation and large strain calculations to model thecorresponding ground deformations.
The implicit approach used here involves approximating the cavegeometry at several different points in its development over time,and incrementally changing its properties from those of the orebody rocks to fragmented rock. This requires special considerationof the material properties of caved rock, and the redefinition of theinduced stress state within the modelled cave material.
Adopting the implicit cave geometry approach, a procedurewas developed for determining the cave geometry at any given

K.-S. Woo et al. / International Journal of Rock Mechanics & Mining Sciences 53 (2012) 166–178 169
point in time (Fig. 5). This involved extracting, for each timeinterval, the tonnages for each draw point from the mineproduction data, applying a 20% swell factor, calculating the caveheight above each draw point, and comparing and modifying theresulting 3-D cave shape according to the mining-induced micro-seismic data for the same period.
3.3. Rock mass properties
The major lithological units represented in the FLAC3D model, andtheir rock mass characteristics, are summarised in Table 1. Rock massproperties were derived for each of these key lithologies (Fig. 4). Thisinvolved compiling data from mine geotechnical reports in which labtesting and rock mass characterisation data were reported. Becausethese reports span several different testing and field characterisationcampaigns (over a period of more than 25 years), all data wascarefully reviewed and evaluated to establish lower and upper boundvalues based on the minimum and maximum values reported,respectively (Table 2). This work was supplemented by field-basedassessments made by the UBC-SFU team during fieldwork carried outat the mine in 2008. The rock mass descriptions and rock strengthsprovided are compiled from several modelling, laboratory testing, andfield measurement sources. Not included in the model are thedolerite dykes, described as being composed of very strong rock,the jointing and several large fault zones.
Table 1Major lithological units incorporated into the FLAC3D model and summary of their roc
Unit Geological description
Carbonatite Igneous rock composed predominantly of carbonate minerals. Represen
by two mineralogically similar units: a fine-grained Transgressive
Carbonatite, which lacks significant foliation, and a medium- to coarse-
grained Banded Carbonatite with vertical to steeply dipping foliation
Foskorite Coarse-grained ultra-basic igneous rock composed of olivine, magnetite
apatite and phlogopite. It occurs on all walls as a broad zone between
Pyroxenite and the Carbonatite
Pyroxenite Ultramafic igneous rock consisting essentially of minerals of the pyroxe
group. Represented by two units: Feldspathic and Micaeous Pyroxenite
Feldspathic Pyroxenite occurs in limited quantities, primarily on the no
and west sides of the pit. Micaceous Pyroxenite occupies a large portio
the north, west and east walls as well as a narrow band within the south
Glimmerite An ultrabasic igneous rock, consisting almost wholly of essential dark m
either phlogopite or biotite. Occurs in limited quantities on the western
and southwest corner of the pit
Fenite Na- and K-rich silicate rock developed through alteration of the Archae
granite contact. Fenite occupies a large portion of the South Wall and a
narrow band behind the western and north-western pit crest
Granite Medium to coarse grained intrusive, felsic, igneous rock. The Archaean
granite surrounds the complex and occupies a small section of the upp
southwest pit wall
Table 2Ranges of intact rock properties and rock mass rating values compiled from mine geote
bound rock mass properties derived.
Rock type Intact rock properties
Density (kg/m3) UCS (MPa) E (GPa) mi
Carbonatite 2760–4720 75–172 30–58 15–17
Foskorite 2850–4420 26–150 40 17
Pyroxenite 2800–3240 39–136 15–38 15–17
Glimmerite 3100 37 6 17
Fenite 2610–2730 133–340 10 15–17
Granite 3100 200–300 31 32–33
UCS¼Uniaxial Compressive Strength; E¼Young’s modulus; mi¼Hoek–Brown intact roc
mass cohesion; Frm¼rock mass friction angle; Trm¼rock mass tensile strength.
From these, rock mass shear strength properties were esti-mated for use with a Mohr–Coulomb strain softening constitutivemodel. Most practitioners have more experience and therefore anintuitive feeling for the physical meanings of cohesion andfriction on which the Mohr–Coulomb criterion is based. Accord-ingly Mohr–Coulomb rock mass shear strength properties for theuse in the FLAC3D numerical modelling were derived throughempirical procedures based on GSI, RMR and Q (e.g. Ref. [13]).Several empirical procedures exist to derive Mohr–Coulomb rockmass shear strength properties, one of the more commonlyused being Hoek et al.’s [13] conversion of Hoek–Brown toMohr–Coulomb achieved by fitting an average linear relationshipto the non-linear Hoek–Brown envelope for a range of minorprincipal stress values with an upper bound of s03max. Analyticalrelationships are provided for estimating s03max, however thesedo not apply to block caving. Consequently, Hoek [14] recom-mends that caving analyses be carried out based either on Hoek–Brown or Mohr–Coulomb parameters, assessed independently,but not on the conversion of one to the other.
The applicability of these scaling relationships is noted here,but is also weighed against their required use: to simply providean initial estimate of the rock mass shear strength properties, thevalues for which will then be varied and refined through the backanalysis calibration exercise. Accordingly, the Hoek–Brown toMohr–Coulomb conversion procedure was deemed adequate
k mass characteristics.
Rock mass characteristics
ted Both units are relatively strong, with average UCS values of 120 MPa. They
are described as being moderately fractured to massive (GSI 50–75) with
mostly vertical jointing. Both are treated as one unit within the numerical
model given their complex boundary contact and similar rock mass
properties
,
the
Typically strong and competent with an average UCS of 90 MPa. This unit
is described as being moderately to highly fractured (GSI 45–75) with
mostly vertical jointing
ne
.
rth
n of
wall
The UCS of Feldspathic pyroxenite is typically higher than the Micaceous,
with average values of 100 and 85 MPa, respectively. These units are
described as being highly fractured to massive (GSI 45–65) with mostly
vertical jointing. Both are treated within the numerical model as one
geomechanical unit
ica,
side
Highly variable strength, with an average UCS of 40 MPa. This unit is
described as being highly fractured and sheared (GSI 35–50) with mostly
vertical jointing. Glimmerite represents the weakest rockmass material
present
an A hard, strong rock with an average UCS of 200 MPa. This unit is described
as being moderately fractured (GSI 50–75) with mostly both vertical and
horizontal jointing
er
A hard, strong rock with an average UCS of 200 MPa. This unit was
described as being relatively massive (GSI 70–80)
chnical reports and internal field assessments, and corresponding lower and upper
Rock mass characteristics & properties
RMR GSI crm (MPa) Frm (1) Trm (MPa)
60–80 50–75 3–8 40–58 0.1–1.5
56–75 45–75 2–7 30–55 0.02–1.3
54–70 45–65 2–5 30–54 0.04–0.6
50–55 35–50 1–3 25–34 0.01–0.05
57–75 50–75 3–10 44–58 0.2–2.9
75 70–80 6–11 55–63 0.5–2.1
k parameter; RMR¼Rock Mass Rating; GSI¼Geological Strength Index; crm¼rock

K.-S. Woo et al. / International Journal of Rock Mechanics & Mining Sciences 53 (2012) 166–178170
and a s03max value of 10 MPa was estimated for the conversionbased on preliminary modelling of the stresses that developbetween the cave and foot of the pit slopes. Table 2 reports thecorresponding ranges of equivalent rock mass cohesion andfriction angle values for the lower and upper bound valuesestablished for each rock mass unit represented in the FLAC3Dmodel. These are in general agreement with values used inprevious mine modelling studies. The lower- and upper-boundvalues were subsequently tested through a parametric analysisusing the FLAC3D model to test the sensitivity of the modelledresponse to the material properties used.
3.4. In-situ stresses
Data for the in-situ stress boundary conditions were compiledbased on regional stresses reported in the published literature andmine specific in-situ stress studies. Regional stress data reported inthe World Stress Map database [15] and those in a study of SouthAfrican mining areas [16] suggest that stress ratios in the region fallsomewhere between 0.5 and 1.5 for the major horizontal to verticalstress ratio, and 0.5–1.0 for the minor horizontal to vertical stressratio. These ranges bracket values obtained from in-situ stressmeasurements at Palabora [17–19], where investigations in 1992and 1999 reported ratios ranging from 0.5 to 1.2 (Table 3). Thevariability seen in Table 3 is not uncommon for in-situ stressmeasurements, and may be due to local effects caused by majorfaults and/or geological heterogeneity.
A number of reports presenting results from numerical mod-elling for Palabora were further reviewed to see how the in-situstress boundary conditions were treated for different aspects ofthe pit and cave designs (Table 4). Early studies assumed an in-situ stress ratio Ko of 1.0 [20], or assumed Ko to be 1.5–2.0 in theupper 200 m of the pit, decreasing linearly to about 1.1 at a depthof 2000 m [21]. More recently, numerical analyses have used a Ko
Table 3Results from Palabora in-situ stress studies and measurement campaigns.
Year [reference] Method Stresses determined
1991 [22] Back analysis sNS¼2.0sV sEW¼1.5sV
1992 [17] Borehole slotter sNS¼0.65sV sEW¼0.51sV
1992 [18] CSIR triaxial sNS¼sV sEW¼0.97sV
1999 [19] CSIRO 12 s1¼46 MPa (161/3231)
s2¼38 MPa (731/1521)
s3¼36 MPa (41/0511)
Table 4Horizontal to vertical in-situ stress ratios (Ko) used in different numerical
modelling studies for Palabora.
Year Method Ko Notes
1991 FLAC 1.0 Assumed for model calibration
1991 UDEC 1.5–2.0 Assumed
1995 FLAC3D sNS¼1 Based on 1992 measurements (Table 2)
sEW¼0.97
1998 UDEC 1.0 Based on 1997 geotechnical review
1999 UDEC 1.2 Based on 1999 measurements (Table 2)
2000a UDEC 1.0 Calibrated and back analysed using
monitoring data for East Wall
2000b UDEC 0.5–1.2 Based on 1992 and 1999 measurements
(Table 2).
2004 3DEC 1.0 Based on modelling report.
2005 3DEC sNS¼1 Based on 1992 measurements (Table 2).
sEW¼1
2008 FLAC3D sNS¼2.0 Based on MMT project results.
sEW¼1.5
2009 FLAC3D sNS¼1.5 Based on MMT project results
sEW¼2.0
varying between 1.5 and 2.0 based on findings from the MassMining Technology (MMT) project of the International CavingStudy.
Based on this review, several different in-situ stress assump-tions were tested in step with the model calibration for the bestfit set of rock mass properties.
3.5. Back analysis and model calibration
FLAC3D modelling of the 2005 northwest wall failure wascarried out to back analyse and constrain the material properties
Fig. 6. Back analysis comparing caving-induced displacements assuming:
(a) average, and (b) lower bound rock mass properties, based on the input ranges
compiled in Table 1. Displacements are reported in metres.

K.-S. Woo et al. / International Journal of Rock Mechanics & Mining Sciences 53 (2012) 166–178 171
and in-situ stresses to be used for subsequent forward modelling.Cave–pit interactions were modelled starting from the time ofinitial underground production in 2002 to the time of failure in2005 in one year increments (Fig. 5). Full implementation of thecaving simulation involved first initialising the stresses in the orezone (i.e. calculated according to the depth of the host rock andacting horizontal in-situ stresses), and then modelling theadvancement of the cave by changing the material properties ofthe ore to those of the caved rock in step with the upwardpropagation of the cave. A key step in this process is that the
Table 5Back-analysed FLAC3D rock mass properties providing the best fit to the observed
outline of the northwest wall failure. K and G denote the bulk and shear modulus,
respectively, as derived from estimates of the rock mass Young’s modulus and
Poisson’s ratio.
Rock Type Elastic Properties Rock Mass Strength Properties
Density
(kg/m3)
K
(GPa)
G
(GPa)
crm
(MPa)
Frm
(1)
Trm
(MPa)
ep
(�)
Carbonatite 3100 8 4 2.5 40 0.15 �
Foskorite 3100 4 2 2.5 35 0.1 �
Pyroxenite 3100 4 2 2 30 0.1 0.01
Glimmerite 3100 1 0.5 1.5 25 0.01 0.005
Fenite 3100 16 10 5 55 0.4 �
Granite 3100 20 12 6 55 0.65 �
Caved Rock 2300 0.2 0.1 � � � �
K¼bulk modulus; G¼shear modulus; crm¼rock mass cohesion; Frm¼rock mass
friction angle Trm¼rock mass tensile strength; ep¼plastic strain threshold for
material strain softening (75%–90% reduction in strength).
Fig. 7. FLAC3D results for several different in-situ stress assumptions. Superimposed ar
metres.
initialised stresses in the elements representing the caved mate-rial must be reset with each modelled advance of the cave tocorrespond with the self-weight of the caved rock and not theinitial tectonic stresses.
Average rock mass properties and in-situ stress ratios from theranges compiled in Tables 1 and 2, respectively, were tested andthen varied depending on the closeness of the fit achievedbetween the modelled displacements and outline of the north-west wall failure. Several limitations in the modelling approachapplied here must be noted. First, the presence of both meso-scalejointing in the northwest wall and major faults in its proximitywould have played a significant role in the caving-induced slopefailure process. These are not considered in the FLAC3D con-tinuum representation of the slope. The results are also limited bythe minimum element size, which influences the ability for afailure surface in the model to localise and develop. Due to theselimitations, it is not possible to explicitly model the pit wallfailure that occurred. Instead, the comparative analysis carriedout relied on the distribution of caving-induced displacements,specifically those arising from strain softening, as the measure tocompare the different back analysis model runs.
Results from the back analysis clearly showed a variedresponse for the different rock mass properties tested. Fig. 6compares the caving-induced displacements modelled assuminga set of average rock mass properties (Fig. 6a) and those assumingthe lower bound properties (Fig. 6b). The latter shows increaseddisplacements in the northwest wall of the pit that approximatelycoincide with the northwest wall failure. Table 5 reports thecalibrated rock mass properties judged as providing the best fit
e the contours outlining the northwest wall failure. Displacements are reported in

Fig. 8. Best fit FLAC3D model comparing modelled vertical displacements (greater
than 3 cm) to the DEM outline of the North wall failure, in plan and along a North–
South section through the centre of the northwest wall failure. NS and EW
horizontal stresses are assumed to be equal to the vertical stresses (Ko¼1).
Displacements are reported in metres.
Fig. 9. RADARSAT-1 data for Palabora recorded for the two-year period following
the 2005 northwest wall failure. The area highlighted by the white dashed box
coincides with the extent of modelled displacements (greater than 3 cm) shown in
Fig. 8.
K.-S. Woo et al. / International Journal of Rock Mechanics & Mining Sciences 53 (2012) 166–178172
for the back analysed northwest wall failure. These includetesting of different strain softening thresholds at which strengthdegradation through brittle fracturing would begin (correlatinginduced plastic strains with reduced post-peak rock massstrengths). Results using the Mohr–Coulomb strain softeningconstitutive model produced significantly improved results overmodels solved assuming a simpler Mohr–Coulomb elasto-plasticconstitutive model. Model calibration suggested that the influ-ence of strain softening was most important for the pyroxeniteand glimmerite units.
Also included in Table 5 are the material properties assumedfor the caved rock. As the material responsible for the relaxationand deformation of the surrounding rock, it was found to have asignificant influence on the magnitude of the modelled displace-ments. A detailed search of the literature proved unsuccessful infinding values for caved rock; several papers were found report-ing values for broken rock as used in the construction of rockfilldams and for mine backfill and these were used as an initialstarting point for the back analysis. However, these requiredadditional calibration. To avoid numerical errors related to severemesh distortion, the caved rock material was modelled as anelastic material, using reduced elastic properties to account for
Fig. 10. Modified model geometry for forward modelling of caving-induced
ground deformations for the period 2009–2010.
K.-S. Woo et al. / International Journal of Rock Mechanics & Mining Sciences 53 (2012) 166–178 173
the reduced deformation modulus that would be expected forcaved rock, as well as allowances for the presence of a smallair gap.
Model calibration of the best-fit material properties wascarried out in step with calibration of the assumed far-field in-situ stress boundary condition (Fig. 7). These showed that auniform stress field where the NS and EW horizontal stressesequal the vertical stresses (i.e. Ko¼1) provided the best fit to theoutline of the northwest wall failure (Fig. 8). This stress field is in
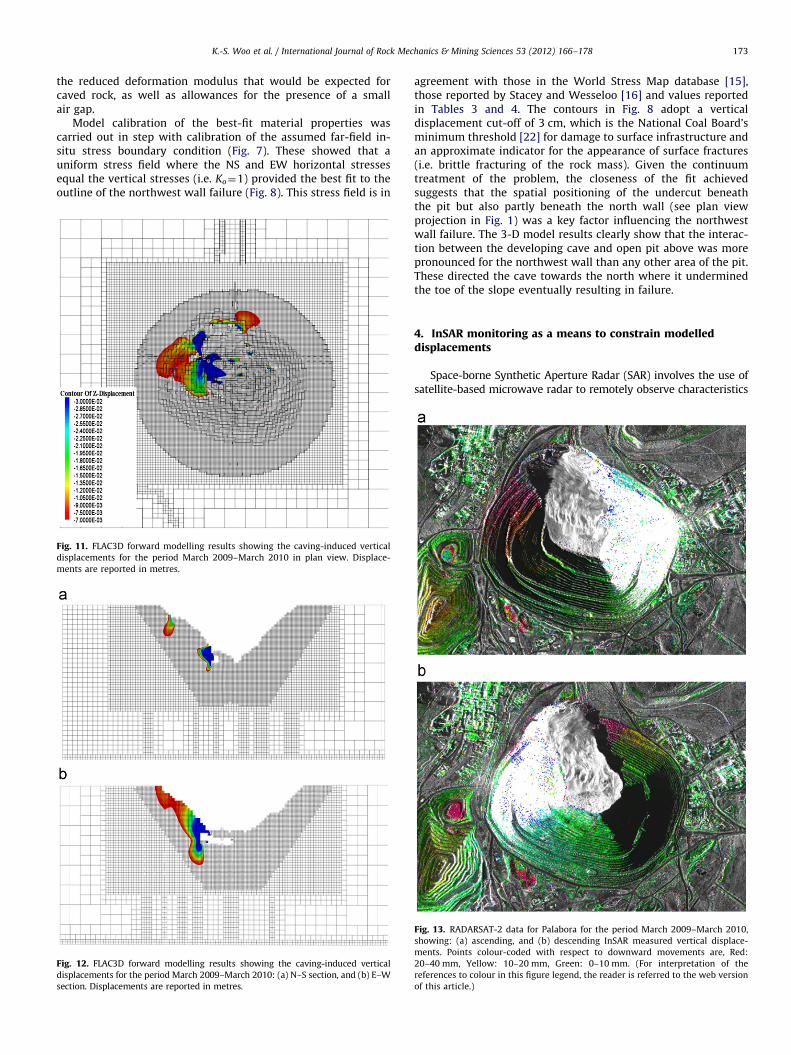
Fig. 11. FLAC3D forward modelling results showing the caving-induced vertical
displacements for the period March 2009–March 2010 in plan view. Displace-
ments are reported in metres.
Fig. 12. FLAC3D forward modelling results showing the caving-induced vertical
displacements for the period March 2009–March 2010: (a) N–S section, and (b) E–W
section. Displacements are reported in metres.
agreement with those in the World Stress Map database [15],those reported by Stacey and Wesseloo [16] and values reportedin Tables 3 and 4. The contours in Fig. 8 adopt a verticaldisplacement cut-off of 3 cm, which is the National Coal Board’sminimum threshold [22] for damage to surface infrastructure andan approximate indicator for the appearance of surface fractures(i.e. brittle fracturing of the rock mass). Given the continuumtreatment of the problem, the closeness of the fit achievedsuggests that the spatial positioning of the undercut beneaththe pit but also partly beneath the north wall (see plan viewprojection in Fig. 1) was a key factor influencing the northwestwall failure. The 3-D model results clearly show that the interac-tion between the developing cave and open pit above was morepronounced for the northwest wall than any other area of the pit.These directed the cave towards the north where it underminedthe toe of the slope eventually resulting in failure.
4. InSAR monitoring as a means to constrain modelleddisplacements
Space-borne Synthetic Aperture Radar (SAR) involves the use ofsatellite-based microwave radar to remotely observe characteristics
Fig. 13. RADARSAT-2 data for Palabora for the period March 2009–March 2010,
showing: (a) ascending, and (b) descending InSAR measured vertical displace-
ments. Points colour-coded with respect to downward movements are, Red:
20–40 mm, Yellow: 10–20 mm, Green: 0–10 mm. (For interpretation of the
references to colour in this figure legend, the reader is referred to the web version
of this article.)
K.-S. Woo et al. / International Journal of Rock Mechanics & Mining Sciences 53 (2012) 166–178174
of ground terrain. With repeated orbits and image capture (referredto as stacks), Interferometric SAR (InSAR) data can be processed toresolve 3-D information of surface deformations by analysingdifferences in the phase between waves being transmitted andreceived by the satellite [23]. Ground deformations can be detectedon the scale of centimetres to millimetres for a surface arearesolution of several square metres using these techniques. Thisability to detect shape changes in a surface area with significantresolution provides a means to monitor mining-induced differentialstrains, including small strain (o1%), that develop across anirregular surface topography.
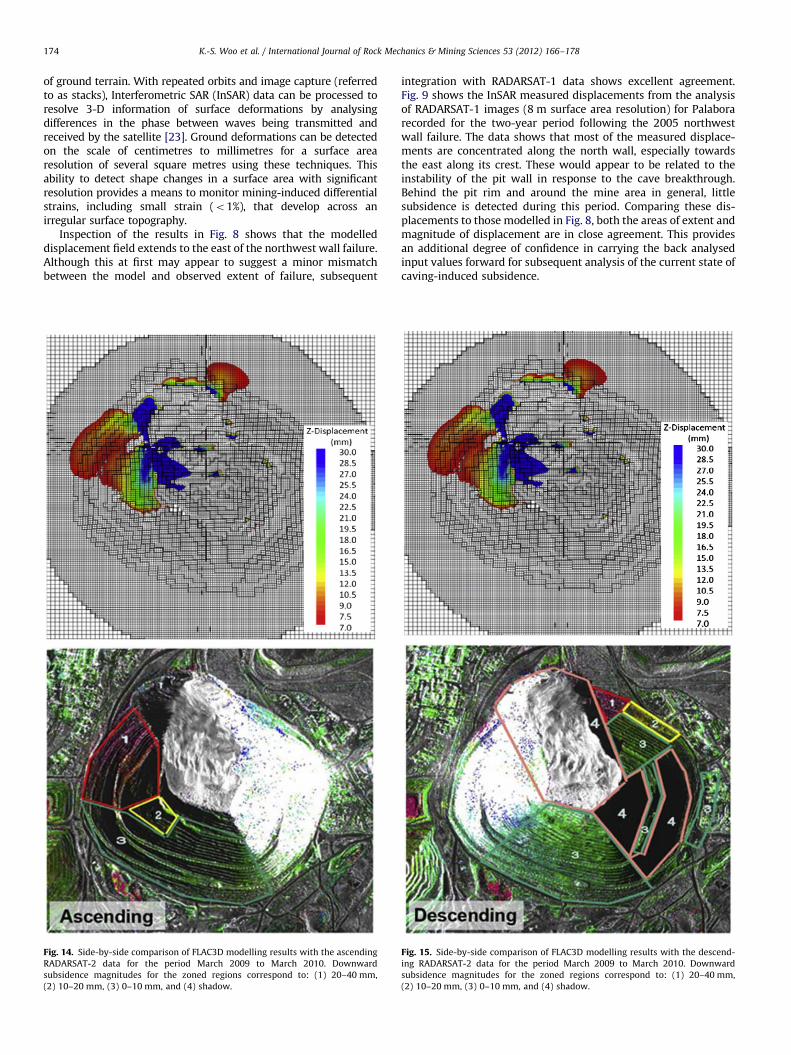
Inspection of the results in Fig. 8 shows that the modelleddisplacement field extends to the east of the northwest wall failure.Although this at first may appear to suggest a minor mismatchbetween the model and observed extent of failure, subsequent
Fig. 14. Side-by-side comparison of FLAC3D modelling results with the ascending
RADARSAT-2 data for the period March 2009 to March 2010. Downward
subsidence magnitudes for the zoned regions correspond to: (1) 20–40 mm,
(2) 10–20 mm, (3) 0–10 mm, and (4) shadow.
integration with RADARSAT-1 data shows excellent agreement.Fig. 9 shows the InSAR measured displacements from the analysisof RADARSAT-1 images (8 m surface area resolution) for Palaborarecorded for the two-year period following the 2005 northwestwall failure. The data shows that most of the measured displace-ments are concentrated along the north wall, especially towardsthe east along its crest. These would appear to be related to theinstability of the pit wall in response to the cave breakthrough.Behind the pit rim and around the mine area in general, littlesubsidence is detected during this period. Comparing these dis-placements to those modelled in Fig. 8, both the areas of extent andmagnitude of displacement are in close agreement. This providesan additional degree of confidence in carrying the back analysedinput values forward for subsequent analysis of the current state ofcaving-induced subsidence.
Fig. 15. Side-by-side comparison of FLAC3D modelling results with the descend-
ing RADARSAT-2 data for the period March 2009 to March 2010. Downward
subsidence magnitudes for the zoned regions correspond to: (1) 20–40 mm,
(2) 10–20 mm, (3) 0–10 mm, and (4) shadow.

K.-S. Woo et al. / International Journal of Rock Mechanics & Mining Sciences 53 (2012) 166–178 175
5. Forward-modelling of caving-induced displacements(2009–2010)
5.1. Modifications to model geometry
The back analysis of the 2005 pit slope failure provided animportant initial step in calibrating and constraining the FLAC3Dsubsidence model. However, the failure also represents a majorchange in the 3-D geometry of the mine model, including a localiseddeviation of the cave. These were accounted for in a modified 3-Dmodel directed towards a forward analysis of caving-induced grounddeformations for the period March 2009 to March 2010. Built into themodel were the changing cave geometries for 2006–2010 (Fig. 5)together with the presence of the pit wall failure debris (Fig. 10).Thus, this modified model represents a continuation of the backanalysis model incorporating the influence of the northwest wallfailure.
Fig. 16. Comparison of FLAC3D modelled and InSAR and mine geodetic measured vertic
prism located near the main access shaft.
The pit wall failure debris was assigned the same properties asthe caved material (i.e. broken rock). In addition, the stress condi-tions in the failed zone were reassigned to represent those of thecollapsed ground (i.e. gravity loading instead of the locked in Ko¼1in-situ stress condition used throughout the rest of the model).The presence of the failure debris also required special considerationin the construction and implementation of the post-failure cavegeometries. A significant amount of slide debris sits above and ontop of the pit floor bottom where the cave has broken through. Mosset al. [9] estimate the failure to be approximately 100 milliontonnes and note that the potential exists for the slide/waste materialto move at a faster rate than the ore rock within the cave as thecave is pulled due to differences in block size between the two(i.e. mechanical sieving). Thus, the production data used to projectthe changing volume of the cave after 2005 would likely includeboth caved rock (associated with the changing cave geometry) andslide debris entering the cave (not associated with the changing cave
al displacements between March 2009 and March 2010, for a history point/survey

K.-S. Woo et al. / International Journal of Rock Mechanics & Mining Sciences 53 (2012) 166–178176
geometry). To correct for this, Digital Terrain Models (DTMs) andQuickBird satellite images for different periods between 2005 and2009 were compared to approximate changes in volume of therockslide material on surface and therefore that entering the cave.This analysis indicated that it is unlikely that debris was entering thecave prior to January 2006. Subsequent to this, however, an averagevolume of 2 million m3 per year was resolved as entering the caveand was corrected for in generating the cave geometries. The cavingintervals analysed include: March 2006, March 2008, March 2009,September 2009, and March 2010, where the last three intervalscoincide with the beginning, mid-point and end of targeted RADAR-SAT-2 SAR data aquisitions carried out as part of this study.
5.2. RADARSAT-2 deformation monitoring
Through a partnership between the Canadian Space Agency,MDA Systems, the University of British Columbia and SimonFraser University, targeted RADARSAT-2 data was collected tomonitor mining-induced ground deformations at several open pit
Fig. 17. Comparison of FLAC3D modelled and InSAR and mine geodetic measured vertic
prism located near the ventilation shaft.
mine sites, including Palabora. Launched in December 2007,RADARSAT-2 is Canada’s second-generation commercial SARsatellite, capable of providing surface area resolutions approach-ing 2�2 m. Together with improvements in data processing andinversion of the phase components (atmosphere, height error anddisplacement corrections), significant gains have been made inthe robustness of the InSAR solution [24].
RADARSAT-2 data was collected for Palabora during the periodMarch 2009 to March 2010, in 28 d intervals. The images weretaken in ascending as well as descending modes. The processedInSAR deformations were then used to compare with the resultsfrom the FLAC3D forward modelling results.
5.3. FLAC3D forward modelling results and comparison
with InSAR data
Figs. 11 and 12 show the FLAC3D forward modelling results forthe caving-induced displacements for Palabora between March2009 and March 2010. These predict total displacements on the
al displacements between March 2009 and March 2010, for a history point/survey
K.-S. Woo et al. / International Journal of Rock Mechanics & Mining Sciences 53 (2012) 166–178 177
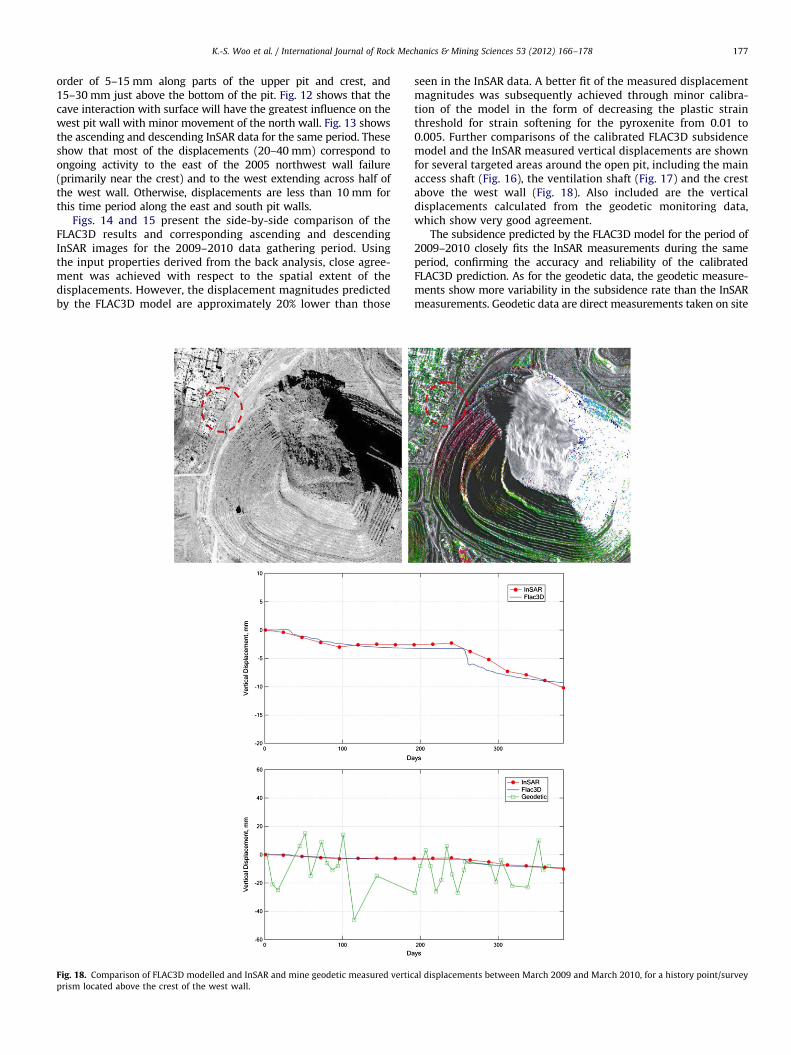
order of 5–15 mm along parts of the upper pit and crest, and15–30 mm just above the bottom of the pit. Fig. 12 shows that thecave interaction with surface will have the greatest influence on thewest pit wall with minor movement of the north wall. Fig. 13 showsthe ascending and descending InSAR data for the same period. Theseshow that most of the displacements (20–40 mm) correspond toongoing activity to the east of the 2005 northwest wall failure(primarily near the crest) and to the west extending across half ofthe west wall. Otherwise, displacements are less than 10 mm forthis time period along the east and south pit walls.
Figs. 14 and 15 present the side-by-side comparison of theFLAC3D results and corresponding ascending and descendingInSAR images for the 2009–2010 data gathering period. Usingthe input properties derived from the back analysis, close agree-ment was achieved with respect to the spatial extent of thedisplacements. However, the displacement magnitudes predictedby the FLAC3D model are approximately 20% lower than those
Fig. 18. Comparison of FLAC3D modelled and InSAR and mine geodetic measured vertic
prism located above the crest of the west wall.
seen in the InSAR data. A better fit of the measured displacementmagnitudes was subsequently achieved through minor calibra-tion of the model in the form of decreasing the plastic strainthreshold for strain softening for the pyroxenite from 0.01 to0.005. Further comparisons of the calibrated FLAC3D subsidencemodel and the InSAR measured vertical displacements are shownfor several targeted areas around the open pit, including the mainaccess shaft (Fig. 16), the ventilation shaft (Fig. 17) and the crestabove the west wall (Fig. 18). Also included are the verticaldisplacements calculated from the geodetic monitoring data,which show very good agreement.
The subsidence predicted by the FLAC3D model for the period of2009–2010 closely fits the InSAR measurements during the sameperiod, confirming the accuracy and reliability of the calibratedFLAC3D prediction. As for the geodetic data, the geodetic measure-ments show more variability in the subsidence rate than the InSARmeasurements. Geodetic data are direct measurements taken on site
al displacements between March 2009 and March 2010, for a history point/survey

K.-S. Woo et al. / International Journal of Rock Mechanics & Mining Sciences 53 (2012) 166–178178
and thus presumed to be reliable. However, there are severalpotential deficiencies: geodetic data are not necessarily collectedon a routine basis, are collected only for selected points, and areprone to measurement errors and inconsistencies, especially wheremultiple mine staff are involved in its collection. The resultingvariability in mine geodetic data has the potential to trigger falsealarms or give misleading trends. For example, the geodetic data forthe ventilation shaft indicates caving-induced movements as shownin Fig. 17 but with significant variability of 760 mm. In themeantime, the InSAR measurements (and the FLAC3D prediction)for the ventilation shaft do not oscillate to the same degree aroundthe mean trend. These observations emphasise the significant valueof the InSAR data and thus the InSAR calibrated FLAC3D modelregarding subsidence prediction.
6. Conclusions
This study presents results from a detailed 3-D back andforward analysis of caving-induced displacements at the Palaboraopen pit/block cave mine in South Africa. Results from the backanalysis of a 2005 pit slope failure were used to constrainuncertainty in the rock mass properties and far-field in-situstresses, as well as to bring understanding to the problem withrespect to the cave–pit interactions. The modelled outcomeunderscores the sensitivity and dependence of numerical resultson the input required and thus the difficulty of using modellingresults for predictive purposes. Agreement was found betweenthe FLAC3D modelled zones of ground movement and the locationof the 2005 northwest wall pit slope failure, as well as withRADARSAT-1 InSAR data from 2005.
A ‘‘best fit’’ set of input properties were obtained and used forforward modelling of the caving-induced subsidence occurring atPalabora for the period 2009–2010. Dedicated high-resolutionInSAR data from the recently launched RADARSAT-2 satellite wascollected for the same period (March 2009–March 2010). Again,close agreement was achieved with respect to the spatial extentand magnitudes of the FLAC3D predicted displacements and thosemeasured using InSAR, allowing further calibration of the model.These were further compared with geodetic monitoring data fromthe mine likewise showing very good agreement.
The close fit achieved between the predictive 3-D numericalmodel and InSAR data demonstrates the promise of InSAR as ameans to calibrate and validate sophisticated numerical models,and thereby contribute to the management of block cavingassociated subsidence hazards. The results demonstrate thatsatellite-based InSAR provides an effective means to identifyand map spatial movements across a large open pit and beyondthe pit limits. This ability is important for protecting key mineinfrastructure. For an existing mine, such as Palabora, the InSAR-calibrated model represents a means to give an advanced warningof any potential subsidence threats or those related to unfavour-able interactions between the advancing cave and overlying pitslopes. For a Greenfield site, the same degree of model calibrationmay not be possible but modelling could still play a key role insafely locating critical infrastructure.
Together, an advanced information product has been devel-oped and demonstrated, integrating geology, geotechnical datasets, and 3-D numerical modelling with InSAR imagery to assistmining decision makers in their development of safe and efficientblock caving and open pit mining operations.
Acknowledgements
This work was funded through a grant from the CanadianSpace Agency (contract#: F028-07-1686) and a CollaborativeResearch and Development grant from the Natural Science andEngineering Research Council of Canada (NSERC) in partnershipwith Rio Tinto. The authors would like to thank Rio Tinto and thePalabora mine staff for providing data, Dr. Andre van As (Rio TintoTechnical Services), Guy Aube (Canadian Space Agency) andChristian Nadeau (MDA Systems) for their technical guidance,and Jordan Severin (University of British Columbia) and Dr. TomStyles (AMC Mining Consultants UK Ltd.) for their assistance indeveloping the cave geometries.
References
[1] Laubscher D. A practical guide manual on block caving. Prepared for theinternational caving study (ICS 1997–2000); 2000.
[2] Karzulovic A, Cavieres P, Pardo C. Caving subsidence at El Teniente mine.1999. [in Spanish].
[3] Gilbride LJ. Free KS, Kehrman R. Modeling block cave subsidence at theMolycorp, Inc., Questa Mine. 2005. Paper 05–881.
[4] Brummer R, Li H, Moss A. The transition from open pit to undergroundmining: an unusual slope failure mechanism at Palabora. 2006; p. 411–20.
[5] Beck D, Pfitzner M. Interaction between deep block caves and existing,overlying caves or large open pits. 2008; p. 381–91.
[6] Sainsbury BL, Pierce M, Mas Ivars D Simulation of rock-mass strengthanisotropy and scale effects using a ubiquitous-joint rock mass (UJRM)model. 2008; Paper 06-02: p. 241–50.
[7] Vyazmensky A. Numerical modelling of surface subsidence associated withblock cave mining using a finite element/discrete element approach. PhDthesis. Burnaby (British Columbia): Simon Fraser University; 2008.
[8] Vyazmensky A, Stead D, Elmo D, Moss A. Numerical analysis of block caving-induced instability in large open pit slopes: A finite element/discrete elementapproach. Rock Mech Rock Eng 2010;43:21–39.
[9] Moss A, Diachenko S, Townsend P. Interaction between the block cave andthe pit slopes at Palabora mine. J S Afr Inst Min Metall 2006;106:479–84.
[10] Palabora Mining Company Limited. Mine geological and mineralogical staff.The geology and the economic deposits of copper, iron, and vermiculite in thePalabora igneous complex: a brief review. Econ Geol 1976;71(1):177–92.
[11] Piteau Associate Engineering LTD. Assessment of pit wall instability andslope displacement as a result of interaction between the pit and under-ground mine. Report to Rio Tinto Management Services SA (Pty) Ltd; January2005.
[12] Itasca Consulting Group. FLAC3D—Fast Lagrangian analysis of continua in 3dimensions, version 4.0. Minneapolis: Itasca Consulting Group, Inc.; 2009.
[13] Hoek E, Carranza-Torres CT, Corkum B. Hoek–Brown failure criterion—2002edition. 2002; p. 267–73.
[14] Hoek E. Practical rock engineering. Toronto: Rocscience, e-book; 2007.[15] Heidbach O, Tingay M, Barth A, Reinecker J, Kurfeß D, Muller B. The world
stress map database release 2008. http://dx.doi.org/10.1594/GFZ.WSM.Rel2008; 2008.
[16] Stacey TR, Wesseloo J. In situ stresses in mining areas in South Africa. J S AfrInst Min Metall 1998;98(7):365–8.
[17] SRK Consulting Group. Measurement of in situ stresses at Palabora mine.Report to Rio Tinto Management Services SA (Pty) Ltd. 179447/2; 1992.
[18] SRK Consulting Group. Measurement of in situ stresses at Palabora mine.Report to Rio Tinto Management Services SA (Pty) Ltd. 179447/5; 1992.
[19] Gash, P. Analysis and interpretation of the in situ stress measurement carriedout in raw#1 on the production level; 1999.
[20] Martin DC, Newcomen HW. Palabora Mining Company, Phalaborwa, SouthAfrica, copper open pit 1991 geotechnical studies, geotechnical assessmentsand numerical modelling for the west wall. Piteau Associates, Report toPalabora Mining Company. 91-686J; August 1991.
[21] SRK Consulting Group. Palabora underground mine pre-feasibility study, 1.Report to Rio Tinto Management Services SA (Pty) Ltd. 179447; 1991.
[22] National Coal Board. Subsidence engineers handbook. 2nd edn. London: CoalBoard Mining Department; 1975.
[23] Zebker HA, Rosen PA. On the derivation of coseismic displacement fieldsusing differential radar interferometry: the Landers earthquake. J GeophysRes 1994;99(B10):19,617–9.
[24] Rabus B, Eberhardt E, Stead D, Ghuman P, Nadeau C, Woo K, et al. Applicationof InSAR to constrain 3-D numerical modelling of complex discontinuous pitslope deformations. 2009.


![3D Data Integration for Exploration and Mine Planning · 3D Data Integration for Exploration and Mine Planning Pretorius, C . C. [3][1], Chunnett, G. K. [2], Chalke, T . W. ... This](https://img.pdfslide.net/doc/110x75/5e6d1b4bcc7c6f22615da8a3/3d-data-integration-for-exploration-and-mine-planning-3d-data-integration-for-exploration.jpg)