Embed Size (px)
Citation preview

1 ORNL is managed by UT-Battelle for the US Department of Energy
Integration of Physics and Statistics in Imaging Via Deep Data
Guiding the design of materials tailored for functionality
Sergei V. Kalinin
Institute for Functional Imaging of Materials

2
More than imaging
Atomic positions can be determined to <10-pm precision
Bond length: Chemical reactivity,
catalytic activity
Bond angles: Magnetism
and transport
Configurations and repeating
elements?
J.J. Guo et al., Nat. Comm. 5, 5389 (2014)
Nature 515, 487 (2014)
3
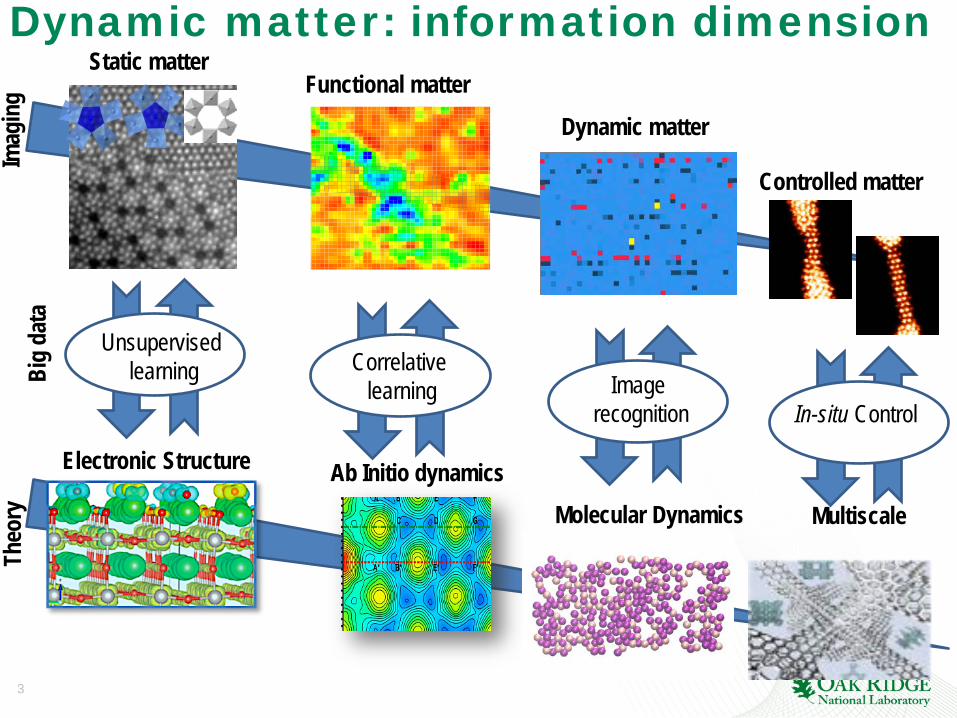
Dynamic matter: information dimension
Static matter Functional matter
Dynamic matter
Controlled matter
Unsupervised learning
Theo
ry
Correlative learning Image
recognition In-situ Control
Big
data
Im
agin
g
Electronic Structure
Molecular Dynamics Multiscale
Ab Initio dynamics

4
Imaging: What do the atoms do?
Classical concept • Synthesis • Characterization • Theory • Computation
Expanding to include • Data mining • Correlative functional imaging • Local theory-experiment matching
of multi-dimensional (multi-modal), spatially and temporally resolved information
Institute for Functional Imaging of Materials (IFIM) • Establish synergy between imaging disciplines • Bridge physical imaging with theory via big data
and data analytics to design new materials • Leverage ORNL strengths in
– Physics and chemistry on the atomic scale in real space – Mesoscale structure and functional probing – Big data and predictive theories
Our scientific paradigm is shifting

5
Approach
• Unsupervised learning, clustering, and visualization
• Biggest hurdle: Language/ elementary tools
1. Big data: How does it happen?
• Physics informed data analytics/ supervised methods
• Biggest hurdles: Mathematical framework, scalability of computational tools
2. Deep data: How can we understand?
• Feedback and expert/AI systems
• Biggest hurdles: Don’t know where to start, but it is possible
3. Smart data: How can we do better?
Physics: Why something happens
0. Getting big data: making imaging tools a part of data infrastructure

6
Level 0: Getting big data 1. Synergy of microscopies 2. Enabling technologies 3. Novel probes
Chemistry
Materials Science
Global Security
Biology
Environment
Biomedical Technology
INSTITUTE FOR FUNCTIONAL IMAGING OF MATERIALS
Atom Probe Tomography
Scanning Probe
Microscopy
Chemical Imaging
Neutron Imaging
Optical Imaging
Electron Microscopy
Mass Spectrometry

Kalinin, Jesse, Proksch, Information Acquisition & Processing in Scanning Probe Microscopy, RD Mag 2008
Data Generation and Utilization in SPM
Single frequency methods:
Band excitation:
We realized we are doing big
data
• SPM tip confines electric/thermal field in material and probes associated responses • Fundamental physics of stimulus-induced transformation requires high (3,4,5) dimensional
measurements -> large data volumes/analysis times • Need approaches to visualize and reduce data (big data) and extract relevant information
(deep data)

G-mode: Full Information Recovery
Applications: • Fast ferroelectric loop imaging
(x7,000 compared to standard method)
• Full dynamics in Kelvin Probe Force Microscopy (x1,000 to classical method)
• W2 spectroscopic imaging (no classical analogs)
Future: • Fast force-distance curve imaging • Detection of spurious and transient
phenomena • Variable density imaging
A. Belianinov et al., Nat. Comm 6, 6550 (2015)
Instrumental limit: photodetector bandwidth (~10 MHz) x DAQ performance (32 Bit) • Single frequency/heterodyne: lock-in compression to ~ 1 kHz • Band excitation: 102 bins at ~ 1 kHz = 100 kHz • G-mode: full streaming at ~10 MHz

9
Data Generation in Electron Microscopy
electron beam
Specimen
Sub-Å probe
Advanced DAQ
Fast Direct Electron Detection
To scan coils
One dimensional excitation signal Complex detection signals • 0D: bright/dark field intensity • 1D: energy loss spectra • 2D: ptychography/diffraction
Can be realized on 2D (image) and 3D (focal series, tilt series) spatial grids

10
Instrumental limit: Electron flux (2 108 e/s) x detector performance (1 Bit/electron) • Detectors: Information per electron? • Storage, visualization, and curating
Data Generation in Electron Microscopy

11
Ptychographic Imaging
• The standard STEM is exquisitely tuned to capture material structure (in projection)
• However, the transmitted electrons carry far more information than is captured by monolithic detectors: sub-atomic diffraction pattern
• Capture full information stream • Emulate monolitic detectors: any geometry • Multivariate analysis
Grain boundary in BiFeO3

R. Ishikawa et al., Nano Lett. 14, 1903 (2014)
• Can we use induced single atom dynamics to fabricate bulk 3D structures?
• Synergy of e-beam writing and advanced feedback and control
• 3D atomic fabrication: quantum computing, spintronics, etc.
D. Eigler Long long time ago SPM facility far far away
Material Sculpting and Electrochemical writing?
A. Borisevich S. Jesse Q. He

13
Level 1: Big Data Unsupervised Learning and classification

Imaging: A. Borisevich Q. He
Sample: V. Guilants Image analysis: S. Jesse A. Belianinov
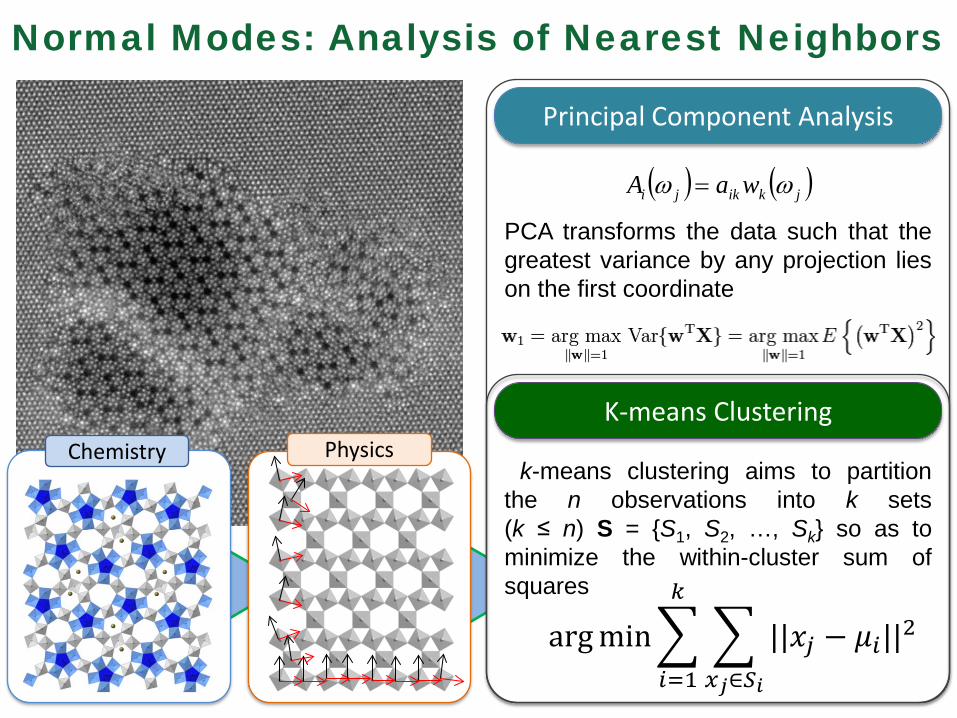
Normal Modes: Analysis of Nearest Neighbors
( ) ( )jkikji waA ωω =
PCA transforms the data such that the greatest variance by any projection lies on the first coordinate
k-means clustering aims to partition the n observations into k sets (k ≤ n) S = {S1, S2, …, Sk} so as to minimize the within-cluster sum of squares
arg min� � ||𝑥𝑥𝑗𝑗 − 𝜇𝜇𝑖𝑖||2𝑥𝑥𝑗𝑗∈𝑆𝑆𝑖𝑖
𝑘𝑘
𝑖𝑖=1
Principal Component Analysis
K-means Clustering Chemistry Physics
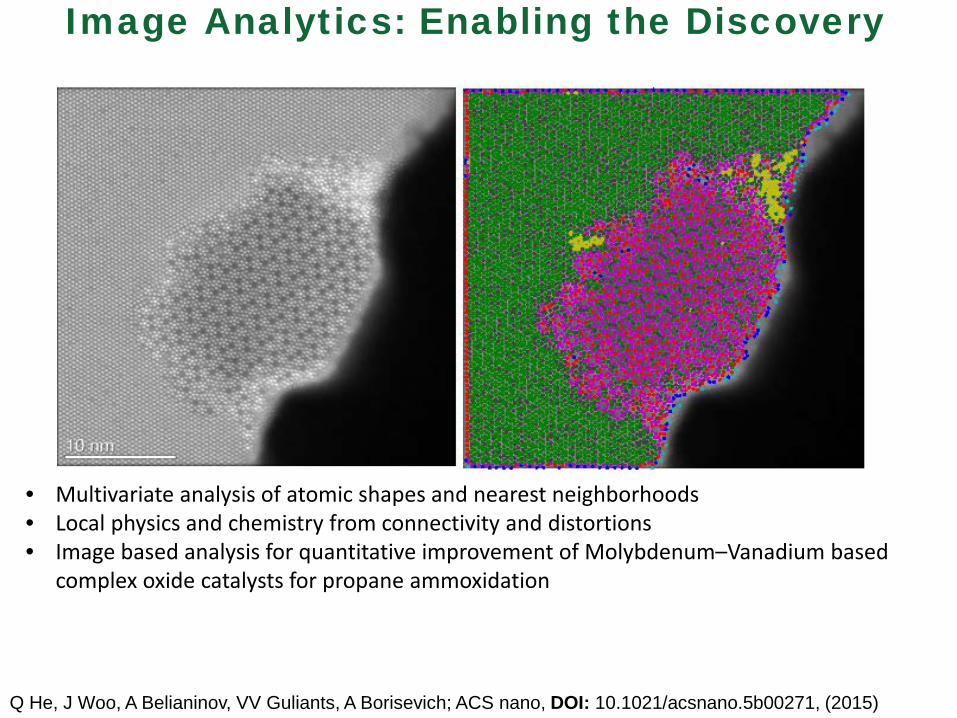
Image Analytics: Enabling the Discovery
• Multivariate analysis of atomic shapes and nearest neighborhoods • Local physics and chemistry from connectivity and distortions • Image based analysis for quantitative improvement of Molybdenum–Vanadium based
complex oxide catalysts for propane ammoxidation
Q He, J Woo, A Belianinov, VV Guliants, A Borisevich; ACS nano, DOI: 10.1021/acsnano.5b00271, (2015)

15°
a b
a
1.5
2.3
0 3 nm -0.01 0.00 0.01
dI/d
V(a.
u.)
Bias (V)
STM image of (11) at L-He Superconductive gap map
Filtered STM Image Local crystallography
The defect preserves lattice continuity, but is associated with change in molar volume and lattice parameter - Guinier-Preston zone. Superconductivity is suppressed at the defect.
Local property mapping

18
Local structure-property coupling Surface atomic structure Tunneling spectral image
Structure descriptors: 1. Atom height 2. Molar volume 3. ….
Electronic property descriptors: 1. PCA components of spectra 2. Superconductive gap 3. ….
Phase 1
Phase 2
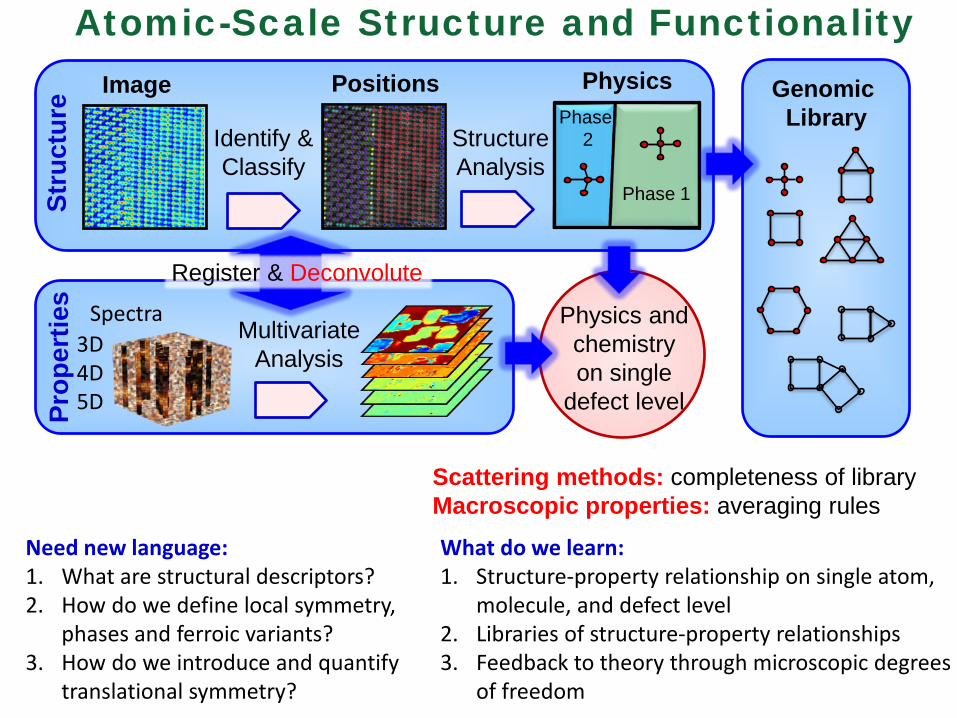
Image Positions Physics St
ruct
ure
3D 4D 5D
Spectra Multivariate
Analysis
Prop
ertie
s
Physics and chemistry on single
defect level
Identify & Classify
Structure Analysis
Register & Deconvolute
Genomic Library
Atomic-Scale Structure and Functionality
Need new language: 1. What are structural descriptors? 2. How do we define local symmetry,
phases and ferroic variants? 3. How do we introduce and quantify
translational symmetry?
What do we learn: 1. Structure-property relationship on single atom,
molecule, and defect level 2. Libraries of structure-property relationships 3. Feedback to theory through microscopic degrees
of freedom
Scattering methods: completeness of library Macroscopic properties: averaging rules

20
Imaging to materials by design
“Stochastic” library
Future: • Libraries of preferred local configurations: what is relevant • Structural + functional imaging: stochastic combinatorial libraries • Theory based prediction
Classical approach: Synthesis → Characterization → Theory
Need: • Functional probes • High-resolution structural
imaging • Theoretical models • Big/Deep/smart data
Tm γ Y P Ρ …
Bulk Crystal Chemical Space
Functional Properties
φ (x,y,V,…) Y (x,y,V,…) P (x,y,V,…) …
Big data from imaging:

21
Level 2: Deep Data
1. “Theoretical microscope” 2. Physics-constrained un-mixing 3. Inverse problems
Transition from correlative to causative analysis
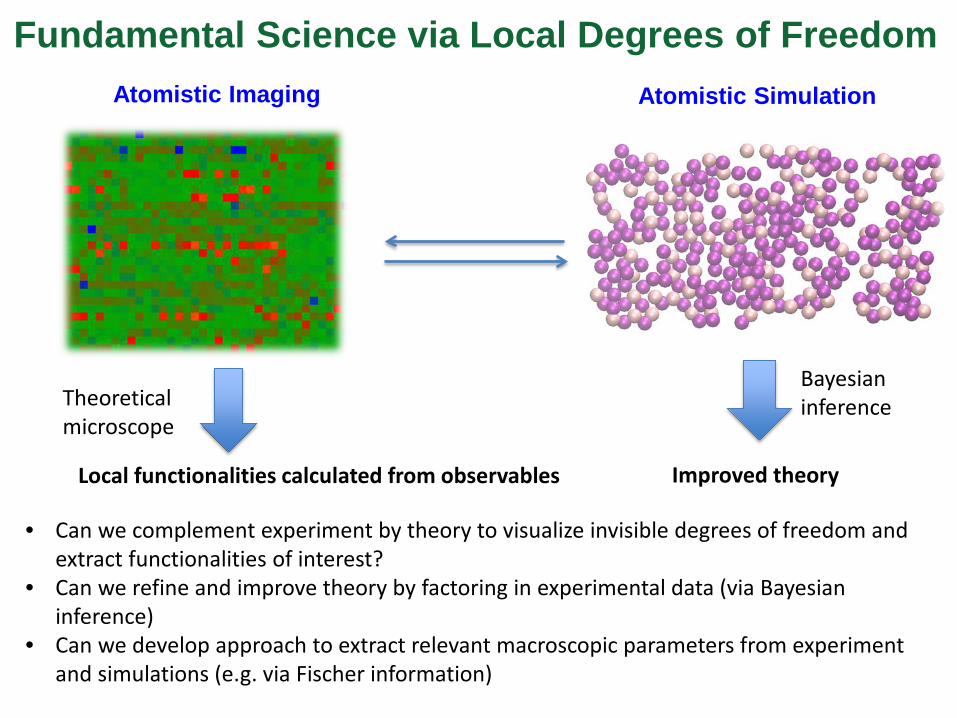
Atomistic Imaging Atomistic Simulation
Fundamental Science via Local Degrees of Freedom
• Can we complement experiment by theory to visualize invisible degrees of freedom and extract functionalities of interest?
• Can we refine and improve theory by factoring in experimental data (via Bayesian inference)
• Can we develop approach to extract relevant macroscopic parameters from experiment and simulations (e.g. via Fischer information)
Theoretical microscope
Local functionalities calculated from observables Improved theory
Bayesian inference

Physics-constrained un-mixing
Needs
Bottom electrode
CFO
BFO
A
R1 R2 R2
R1
4D dataset I = f(x, y, V, Vp)
0 1 2 -5
0
5
time (s)
Volta
ge (V
)
0
1
Cur
rent
(nA
) Vp
Current-voltage curves
at each location
x
y
Fitting to physical models
Extracting Physical meaning
Eigenvector 1 Loading 1
Eigenvector 2 Loading 2 Need: • Un-mixing with user-defined constraints on the
endmembers or loading maps • Combined spatial and spectral unmixing • Incorporate physics (symmetry, non-negativity, material
parameter/models, etc.)
Strelcov et al, ACS Nano 2014, 2015
Vasudevan et al submitted
Real space Spectral space

Mesoscale Structure and Dynamics: Inverse Problem
Can we learn: • Free energy expansions • Thermodynamics • Universality classes • Frozen disorder • Reaction/diffusion kinetics
Mesoscale dynamics • Reaction/transport • Ginzburg-Landau Theory • Molecular Dynamics
Pt nanoparticle growth under e-beam
R. Unocic
Source image Binary image Detected particles
COMSOL Multiphysics
PDA solution Concentration
Matlab
• Exp. boundary detection • Data comparison
Particles boundary
Simulated concentration field
cDtc
∆=∂∂
Growth controlled by Pt transport:
Particle boundary conditions: qcdndc
boundary
−=
kcvgrowth =Local growth velocity:
Simulation workflow

STEM/EELS, SPM
Transfer files to HPC storage and convert data to HDF5 format
Massively parallel Image processing/ feature detection
Massively parallel electronic structure
calculation • High throughput
image capture • Multi-modal: -High-angle annular dark field (HAADF) detector - Electron energy loss spectroscopy • O(1000) of images
per experiment
• Data motion via BBCP/GridFTP
• Data conversion from DM3 stacks to HDF5 slices
• Standard data format (HDF5)
• Data layout conducive to HPC algorithms
• Denoise Image • Identify atoms • Identify lattice • Thousands of
images/sec • Built on
MPI+Fortran • Near linear scaling
– some limitations as file counts get extremely large
• Massively parallel
study of hundreds to thousands of individual configurations
• Calculation of electronic structure
• Based on Density Functional Theory
• 0(1000) of configurations
Minutes Seconds Minutes Seconds
Need: Supporting real-time image analytics

Level 3: Smart Data - Supervised Learning - Context - History

Expert Control
Automatic Expert System
Decision making User
Model Experimental data
Timeline
-10 -5 0 5 10-2.8
-1.4
0.0
1.4
2.8
PFM
Sig
nal (
a.u.
)
Bias (V)
From Human Expert to Automatic Systems
Future: • Automated analysis of routine data • Identification of anomalies • Initial training of new practitioners • Data centers: information based on knowledge
• Synthesis of expertise: factor in human expert knowledge
• Context search: published results data mining/social networks

Understanding
Data
J. Electron. Imaging. 2012;21(3):033010-1-033010-13. doi:10.1117/1.JEI.21.3.033010
Statistical measures of orientation of texture for the detection of architectural distortion
in prior mammograms of interval-cancer
Smart data: Google car, cancer screening, expert systems

Researcher Instrument Control/data acquisition
Community • Social networking/education • Publications/citations
1. Only small fraction of data stream from the instrumentation is captured 2. Only small fraction of captured data is analyzed, interpreted, and put in the context 3. Human-machine interaction during acquisition is often slow and can be non-optimal 4. Human interpretation of data is limited: bias and ignoring serendipity 5. Information propagation and concept evolution in scientific community is extremely slow
and affected by non-scientific factors
Classical Instrumental Research Paradigm

1. Multiple geographically-distributed data generation node 2. Full capture of instrumental data stream 3. Coordination of protocols and data/metadata across the cloud 4. Cloud-based processing and dimensionality reduction 5. Community-wide analytics
Cloud-Based Imaging: Integrated Instrumental Network

31
Goal: guide the design of materials tailored for functionality via probing, understanding, and designing local structure-property relationships on atomic and nanometer level Means: • Synergy and coordination
between imaging disciplines • Linking theory and imaging on
the level of microscopic degrees of freedom via data analytics
• Big, deep, and smart data in materials exploration and design
Institute for Functional Imaging of Materials
Static Functional Dynamic
Controlled
Unsupervised learning
Theo
ry
Correlative learning Image
recognition In-situ control
Big
dat
a Im
agin
g
Electronic Structure Molecular Dynamics
Multiscale
Ab Initio
New probes New analysis New control

32
Thank you for coming!


![Ultrasound Imaging Physics(Basic Principles)[1]](https://img.pdfslide.net/doc/110x75/5526da784a795911118b458d/ultrasound-imaging-physicsbasic-principles1.jpg)