Embed Size (px)
Citation preview
Integrative Genomics
G - genetic variation
T - transcript levels
P - protein concentrations
M - metabolite concentrations
F – phenotype/phenome
Data
Models: Networks
Hidden Structures/ Processes
Evolution
Knowledge
GF Mapping
Concepts
Analysis and Functional Explanation
Molecular Dissection
Detailed Dynamic Model
Single Data Analysis
Single type + phenotype Analysis
Multiple Data Types/ Integrated Analysis
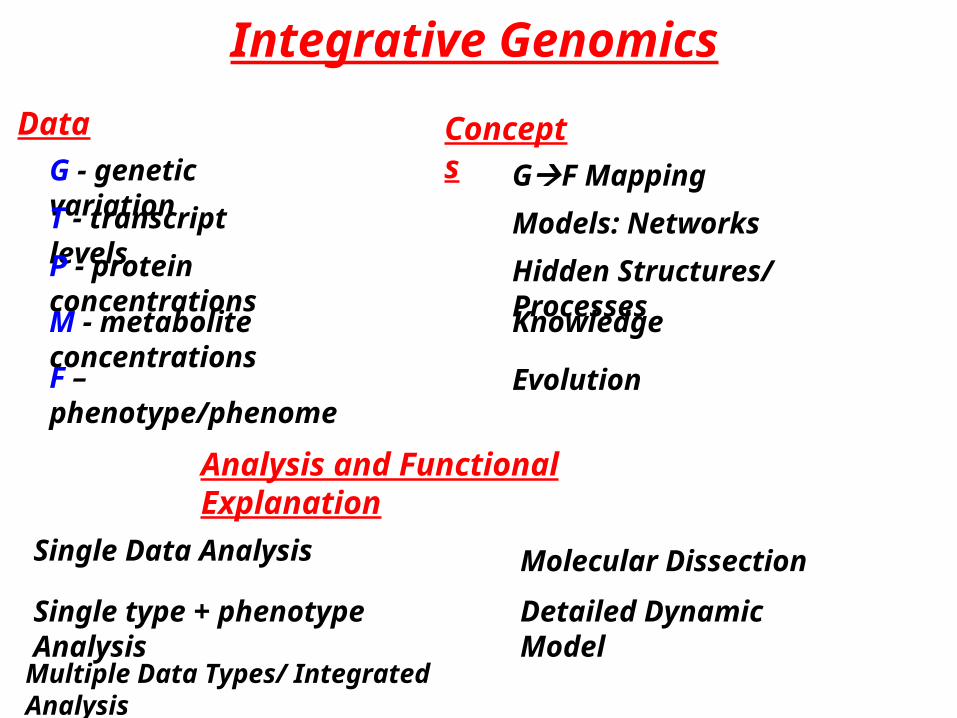
Cost of Disease
Alan D
Lopez, Colin D
Mathers, M
ajid Ezzati, D
ean T Jam
ison, Christopher J L M
urray Glo
bal an
d reg
ion
al bu
rden
of
disease an
d risk facto
rs, 2001: systematic an
alysis of p
op
ulatio
n h
ealth d
ata Lan
cet 2006; 367: 1747–57
•Most research in the bioscience is motivated by hope of disease intervention.
• Major WHO projects have tried to tabulate the costs of different diseases
• Genetic Diseases are diseases where there is genetic variation in the susceptibility.
• Even small improvements would save many billions
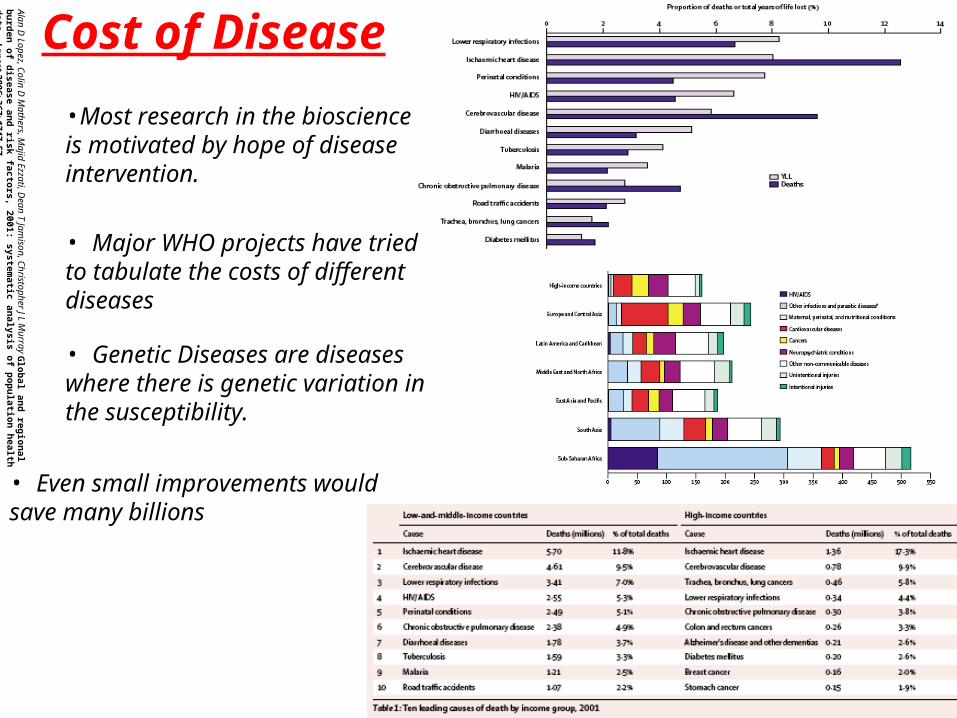
What is a bacteria? A human being?F
rom w
ikipedia
Central Dogma
DNA
RNA
Protein
Metabolism & Cell Structure
Organism
Prokaryote
1010 atoms
Eukaryote
1013 atoms
Human
1014 cells
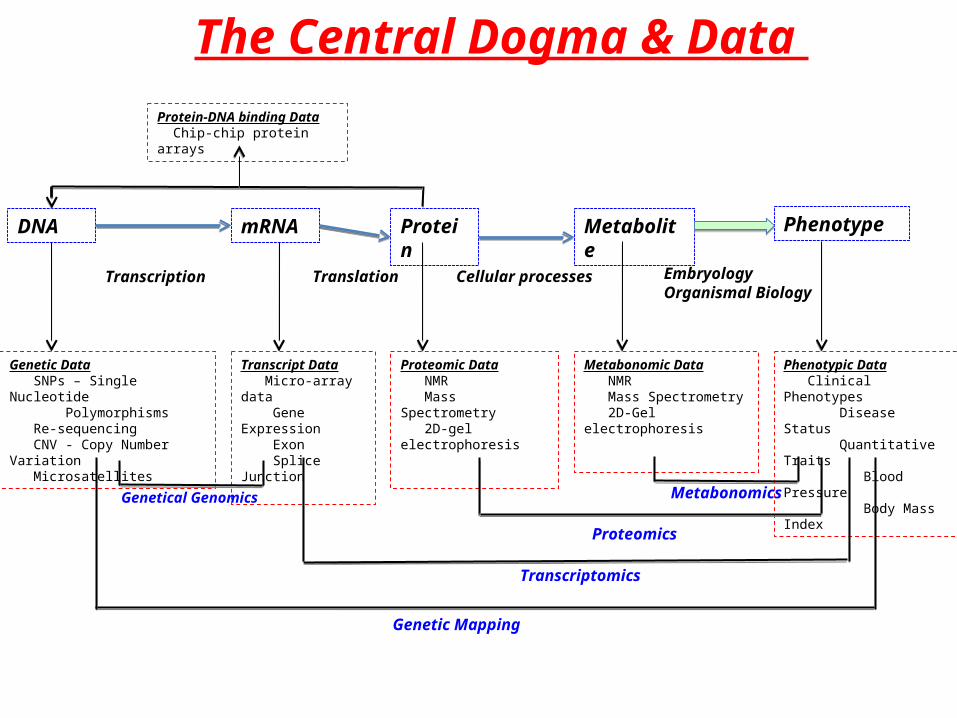
The Central Dogma & Data
DNA mRNA
Transcription
Protein
Translation
Metabolite
Cellular processes
Phenotype
EmbryologyOrganismal Biology
Genetic Data SNPs – Single Nucleotide Polymorphisms Re-sequencing CNV - Copy Number Variation Microsatellites
Transcript Data Micro-array data Gene Expression Exon Splice Junction
Proteomic Data NMR Mass Spectrometry 2D-gel electrophoresis
Metabonomic Data NMR Mass Spectrometry 2D-Gel electrophoresis
Phenotypic Data Clinical Phenotypes Disease Status Quantitative Traits Blood Pressure Body Mass Index
Protein-DNA binding Data Chip-chip protein arrays
Genetic Mapping
Transcriptomics
Proteomics
MetabonomicsGenetical Genomics
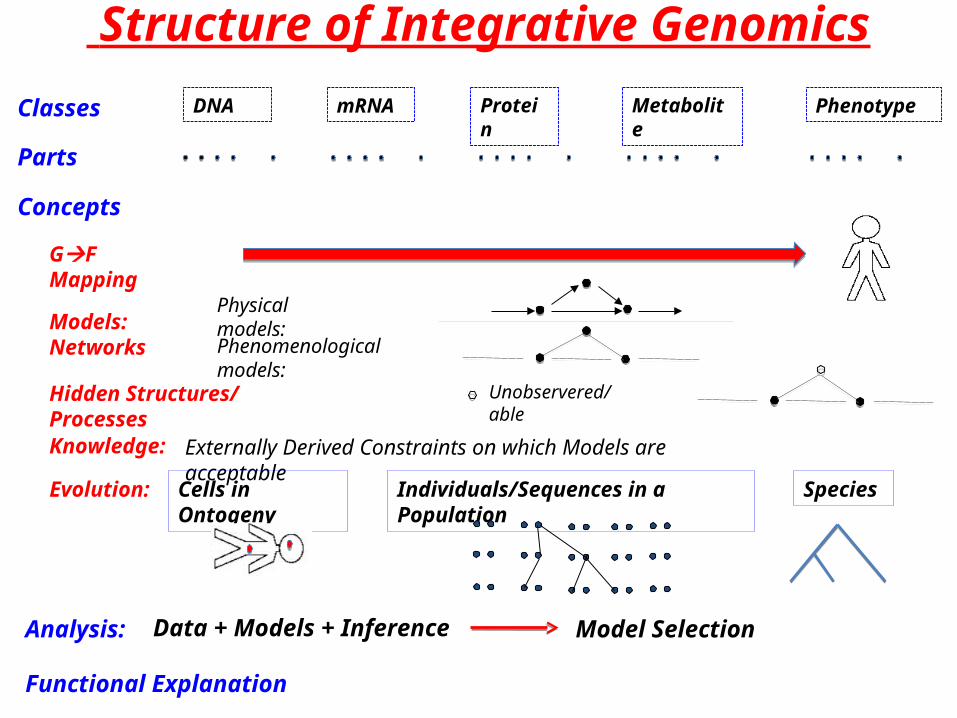
Structure of Integrative Genomics
DNA mRNA Protein Metabolite PhenotypeClasses
Parts
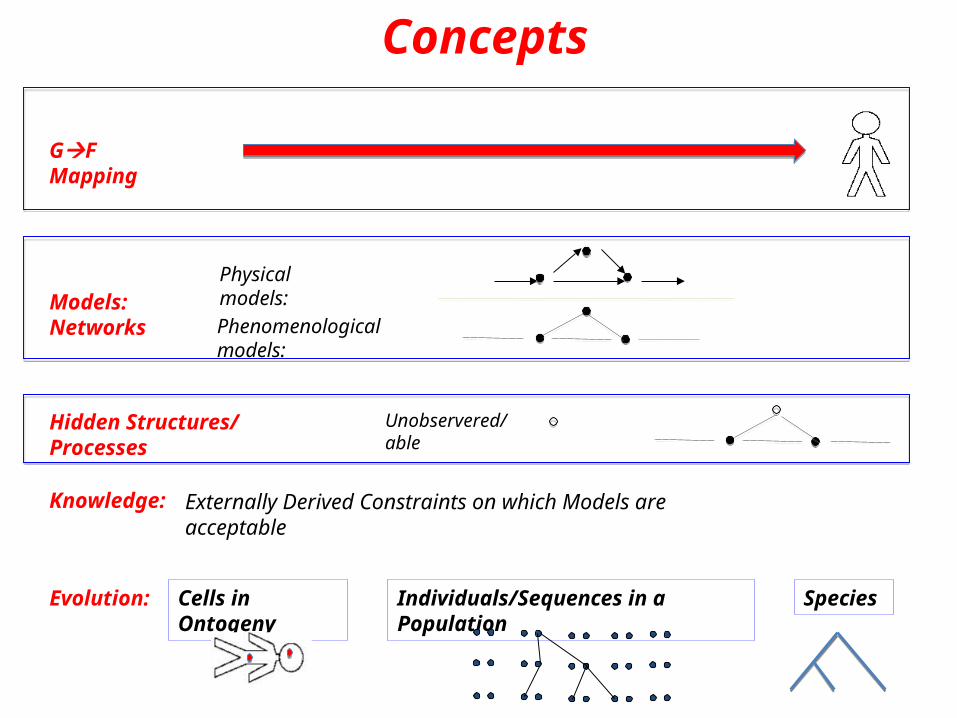
Concepts
Models: Networks
Hidden Structures/ Processes
Evolution:
Analysis:
Functional Explanation
Data + Models + Inference Model Selection
Knowledge: Externally Derived Constraints on which Models are acceptable
GF Mapping
Cells in Ontogeny SpeciesIndividuals/Sequences in a Population
Physical models:
Phenomenological models:
Unobservered/able
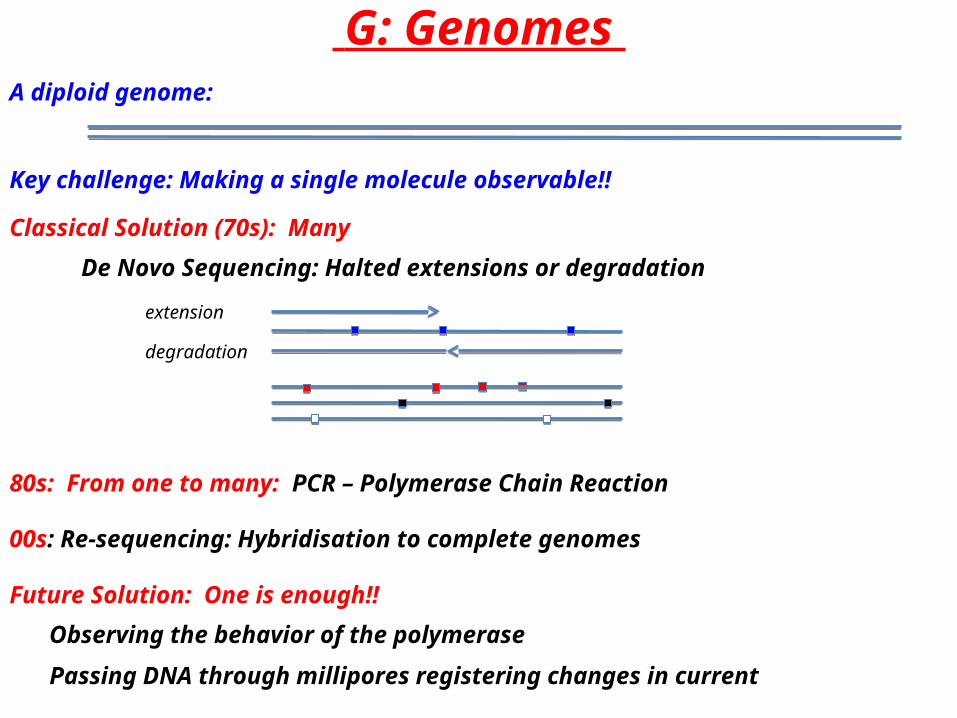
G: Genomes
Key challenge: Making a single molecule observable!!
Classical Solution (70s): Many
Observing the behavior of the polymerase
De Novo Sequencing: Halted extensions or degradation
A diploid genome:
00s: Re-sequencing: Hybridisation to complete genomes
Future Solution: One is enough!!
Passing DNA through millipores registering changes in current
extension
degradation
80s: From one to many: PCR – Polymerase Chain Reaction
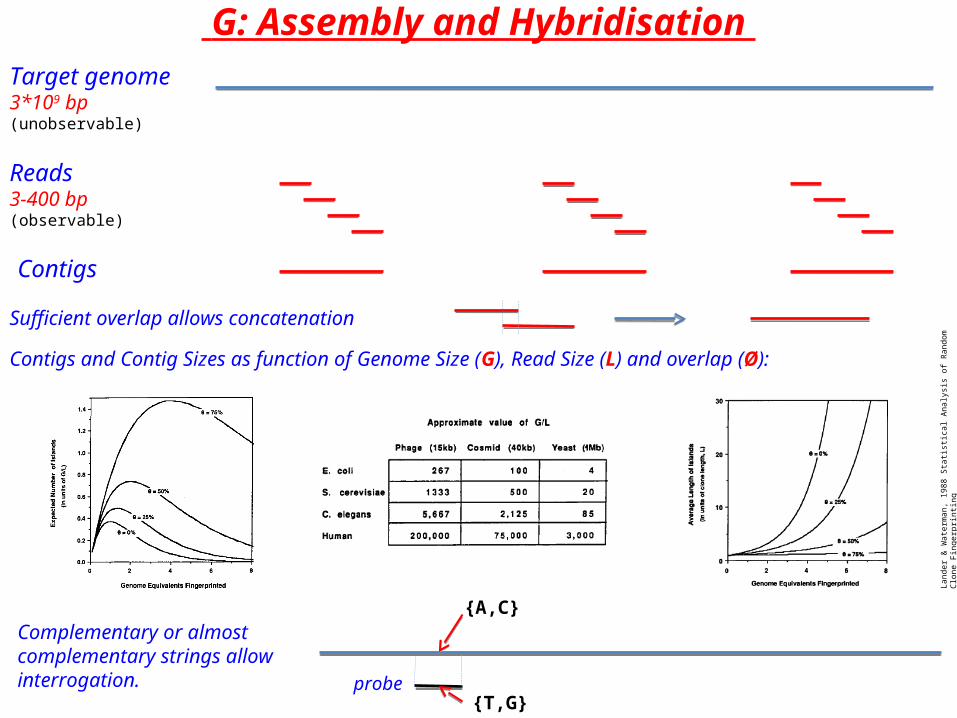
G: Assembly and Hybridisation Target genome3*109 bp(unobservable)
Sufficient overlap allows concatenation
Reads3-400 bp(observable)
Contigs
Complementary or almost complementary strings allow interrogation.
Lan
der
& W
ater
man
, 19
88 S
tatis
tical
Ana
lysi
s of
Ra
ndom
Clo
ne
Fin
ger
prin
ting
Contigs and Contig Sizes as function of Genome Size (G), Read Size (L) and overlap (Ø):
{A,C}
{T,G}probe

E - Epigenomics
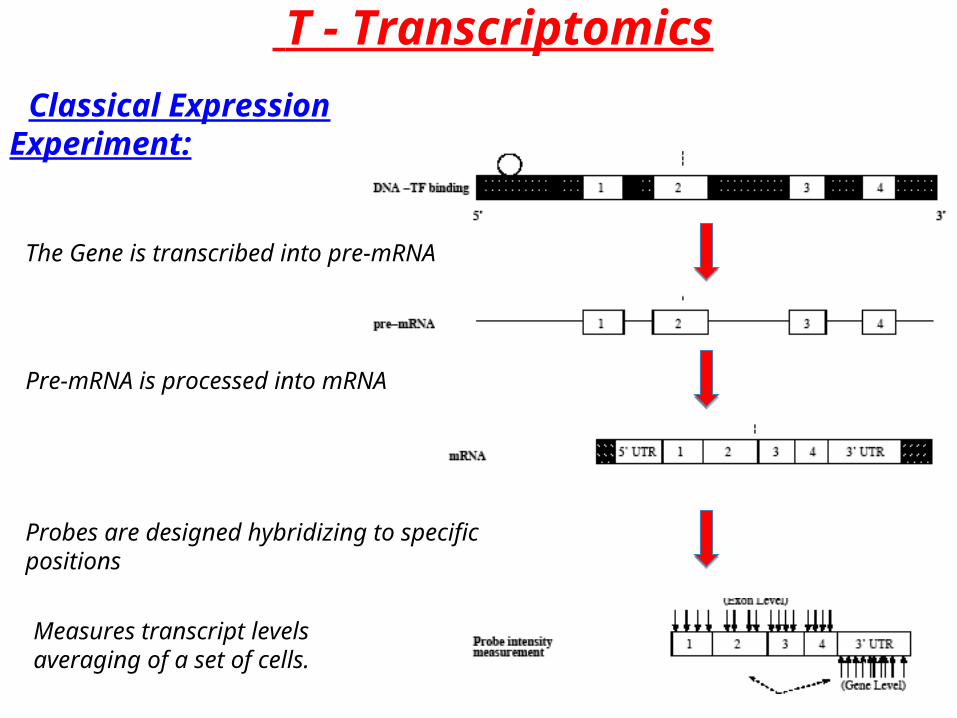
T - Transcriptomics
Measures transcript levels averaging of a set of cells.
The Gene is transcribed into pre-mRNA
Pre-mRNA is processed into mRNA
Probes are designed hybridizing to specific positions
Classical Expression Experiment:
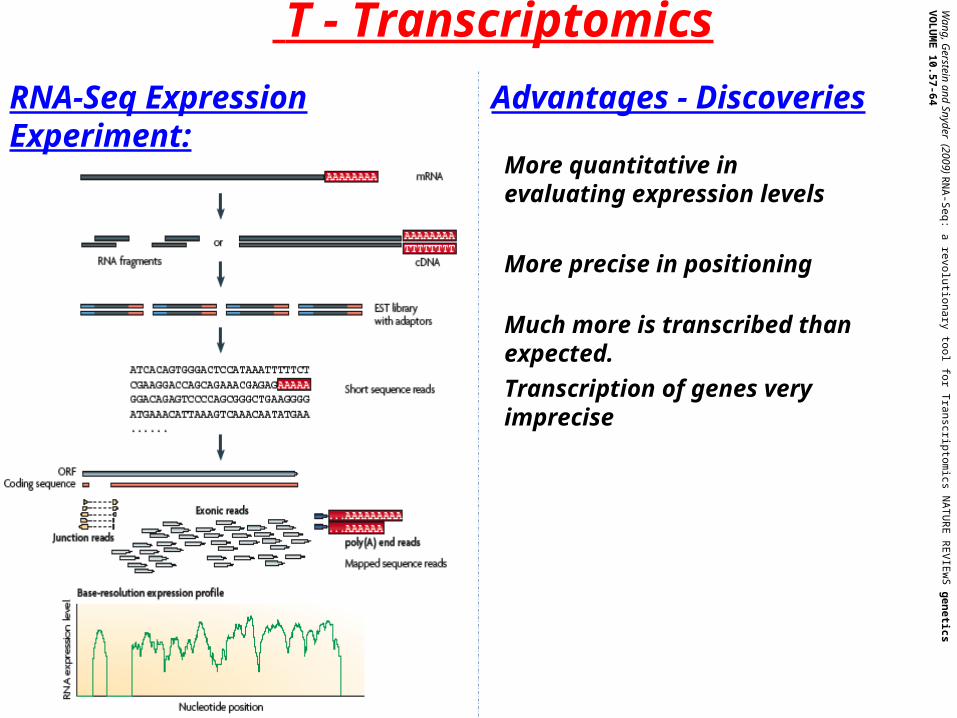
T - Transcriptomics Wang, G
erstein and Snyder (2009) R
NA
-Seq: a revolutionary tool for T
ranscriptomics N
AT
UR
E R
EV
IEw
S g
enetics V
OL
UM
E 10.57-64
RNA-Seq Expression Experiment: Advantages - Discoveries
More quantitative in evaluating expression levels
More precise in positioning
Much more is transcribed than expected.
Transcription of genes very imprecise

M - Metabonomics
Concepts
Knowledge: Externally Derived Constraints on which Models are acceptable
GF Mapping
Evolution: Cells in Ontogeny SpeciesIndividuals/Sequences in a Population
Hidden Structures/ Processes Unobservered/able
Models: NetworksPhenomenological models:
Physical models:
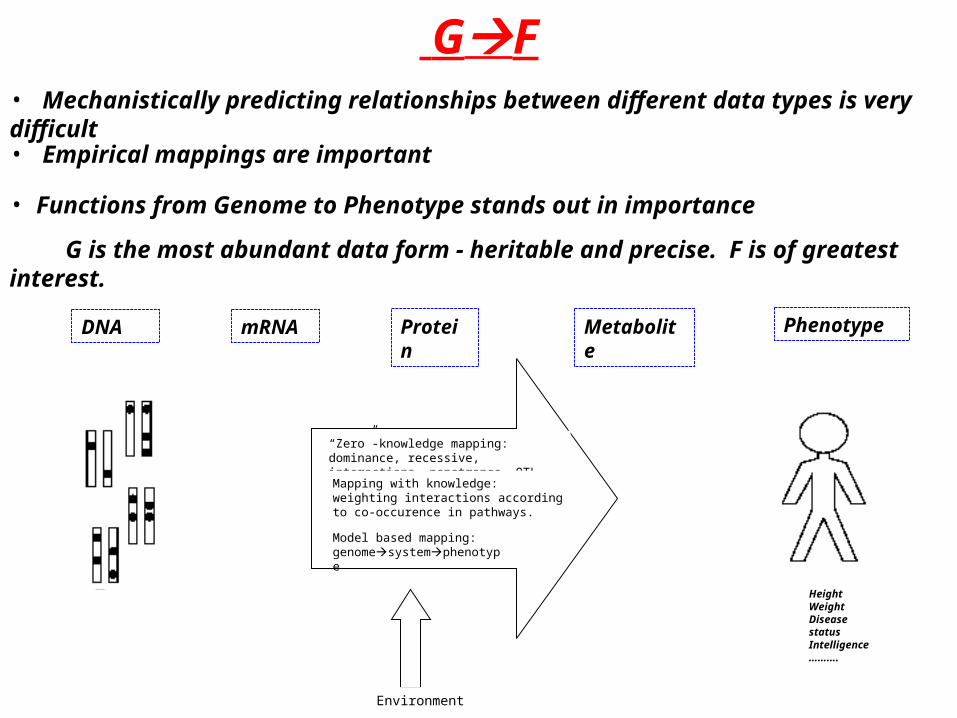
GF
DNA mRNA Protein Metabolite Phenotype
• Mechanistically predicting relationships between different data types is very difficult
“Zero”-knowledge mapping: dominance, recessive, interactions, penetrance, QTL,.
Environment
HeightWeightDisease statusIntelligence……….
• Functions from Genome to Phenotype stands out in importance
G is the most abundant data form - heritable and precise. F is of greatest interest.
• Empirical mappings are important
Mapping with knowledge: weighting interactions according to co-occurence in pathways.
Model based mapping: genomesystemphenotype
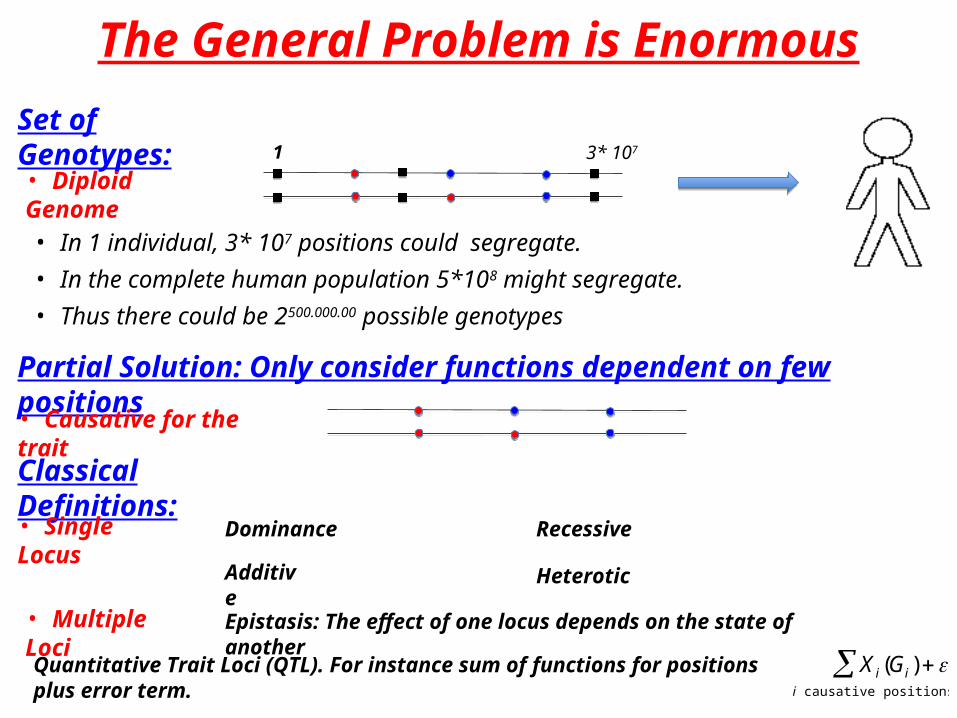
The General Problem is Enormous
Set of Genotypes:
• In 1 individual, 3* 107 positions could segregate.
• In the complete human population 5*108 might segregate.
• Thus there could be 2500.000.00 possible genotypes
Partial Solution: Only consider functions dependent on few positions
• Causative for the trait
Epistasis: The effect of one locus depends on the state of another
Classical Definitions:
Dominance Recessive
Additive Heterotic
• Single Locus
• Multiple Loci
Quantitative Trait Loci (QTL). For instance sum of functions for positions plus error term.
X i(Gi) i causative positions
• Diploid Genome1 3* 107
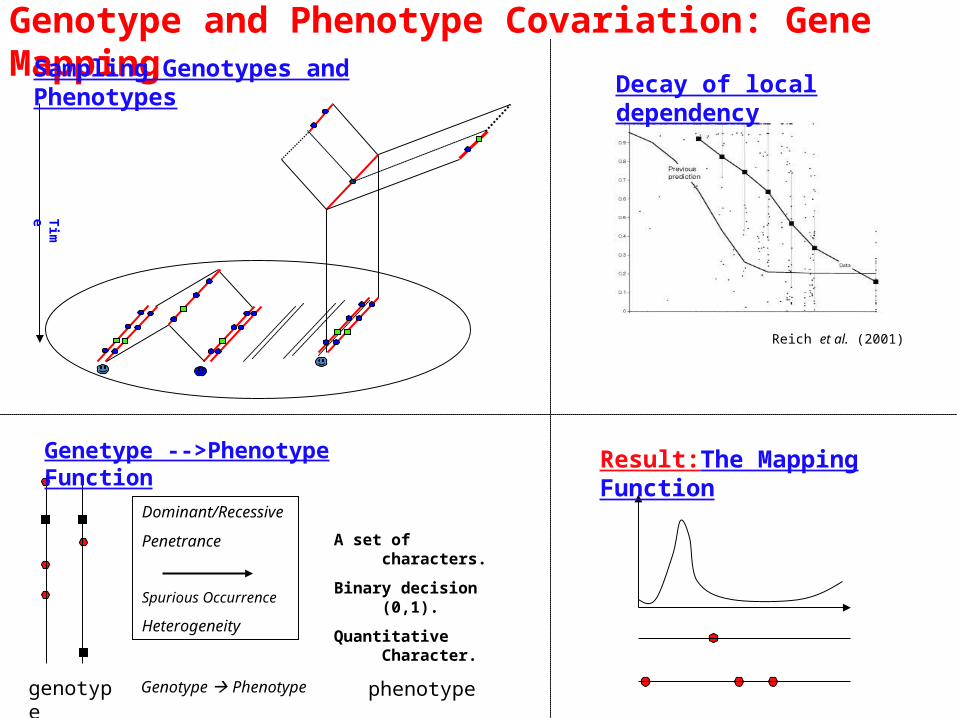
Genotype and Phenotype Covariation: Gene Mapping
Result:The Mapping Function
Reich et al. (2001)
Decay of local dependency
A set of characters.
Binary decision (0,1).
Quantitative Character.
Dominant/Recessive
Penetrance
Spurious Occurrence
Heterogeneity
genotype Genotype Phenotype phenotype
Genetype -->Phenotype Function
Time
Sampling Genotypes and Phenotypes
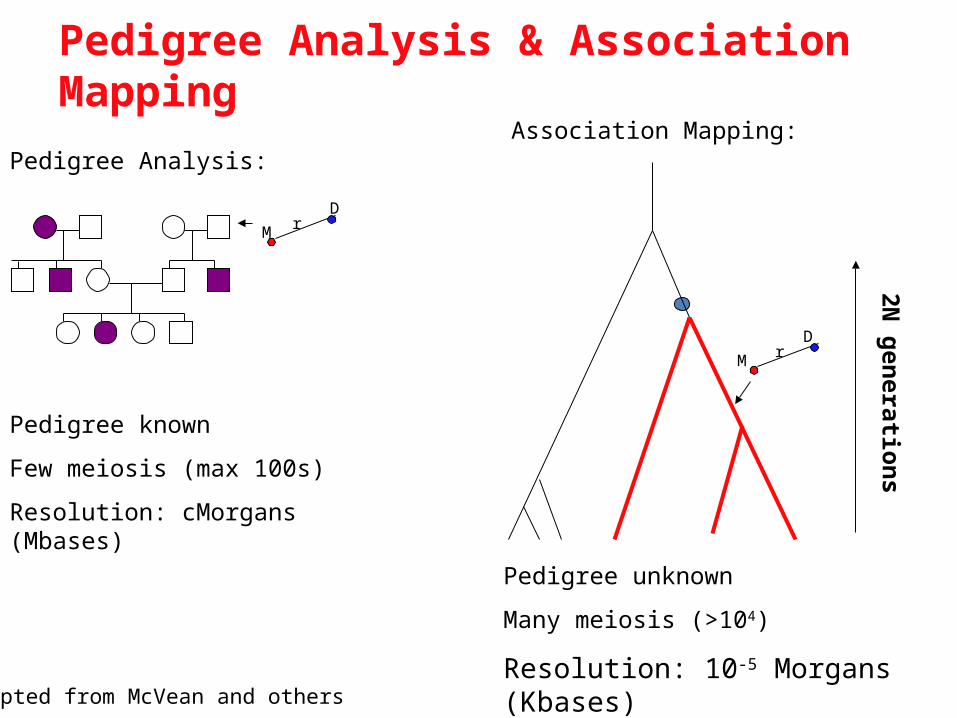
Pedigree Analysis:
Pedigree known
Few meiosis (max 100s)
Resolution: cMorgans (Mbases)
rMD
Association Mapping:
Pedigree unknown
Many meiosis (>104)
Resolution: 10-5 Morgans (Kbases)
2N generations
rMD
Adapted from McVean and others
Pedigree Analysis & Association Mapping
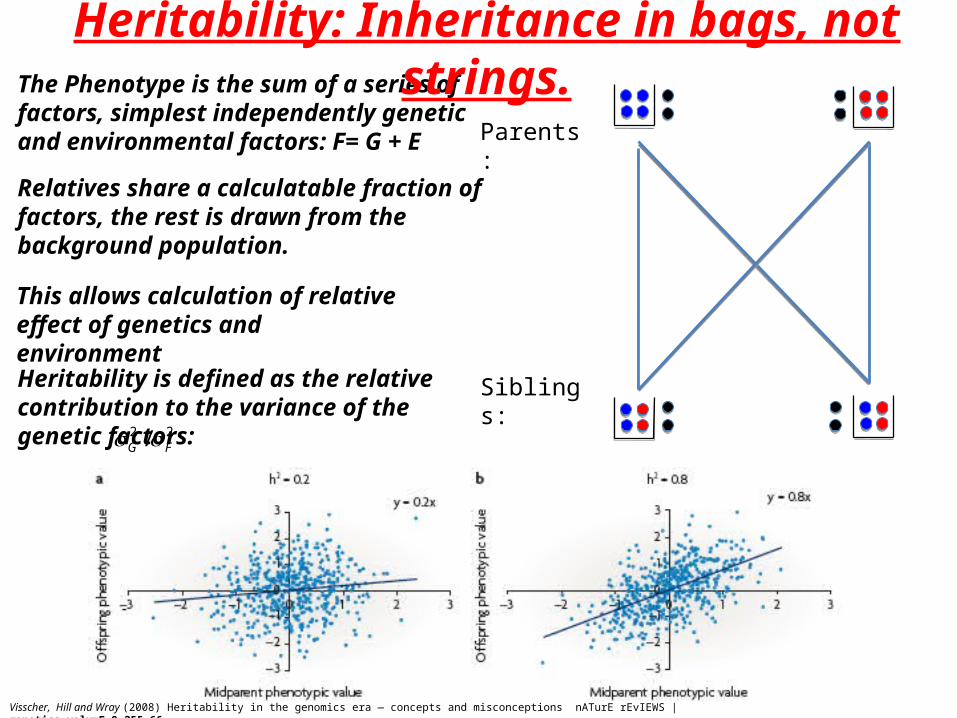
Visscher, Hill and Wray (2008) Heritability in the genomics era — concepts and misconceptions nATurE rEvIEWS | genetics volumE 9.255-66
Parents:
Siblings:
The Phenotype is the sum of a series of factors, simplest independently genetic and environmental factors: F= G + E
Relatives share a calculatable fraction of factors, the rest is drawn from the background population.
This allows calculation of relative effect of genetics and environment
Heritability is defined as the relative contribution to the variance of the genetic factors:
G2 /F
2
Heritability: Inheritance in bags, not strings.
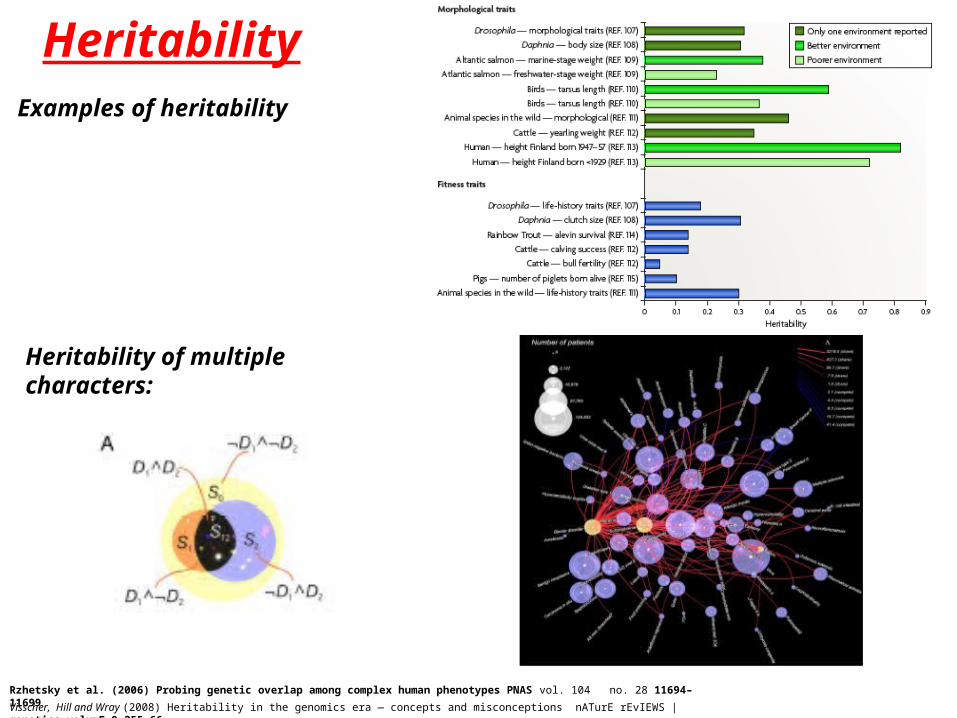
Heritability
Visscher, Hill and Wray (2008) Heritability in the genomics era — concepts and misconceptions nATurE rEvIEWS | genetics volumE 9.255-66
Examples of heritability
Heritability of multiple characters:
Rzhetsky et al. (2006) Probing genetic overlap among complex human phenotypes PNAS vol. 104 no. 28 11694–11699
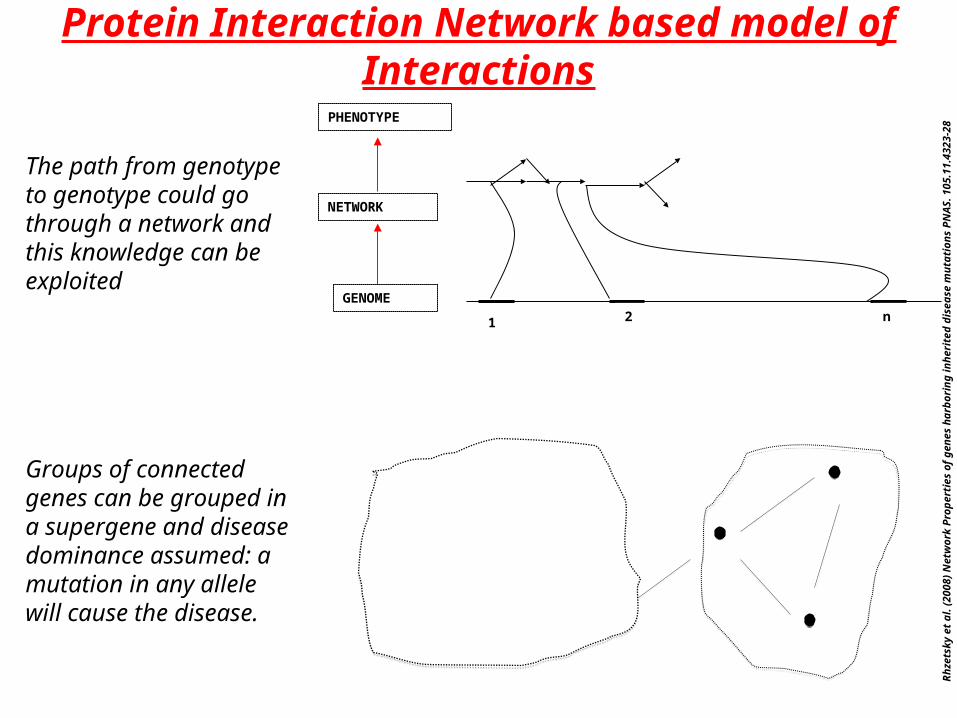
Protein Interaction Network based model of Interactions
1 2 n
PHENOTYPE
NETWORK
GENOME
Rhz
etsk
y et
al.
(200
8) N
etw
ork
Pro
pert
ies
of g
enes
har
bori
ng
inh
erit
ed d
isea
se m
uta
tion
s P
NA
S. 1
05.1
1.43
23-2
8
The path from genotype to genotype could go through a network and this knowledge can be exploited
Groups of connected genes can be grouped in a supergene and disease dominance assumed: a mutation in any allele will cause the disease.
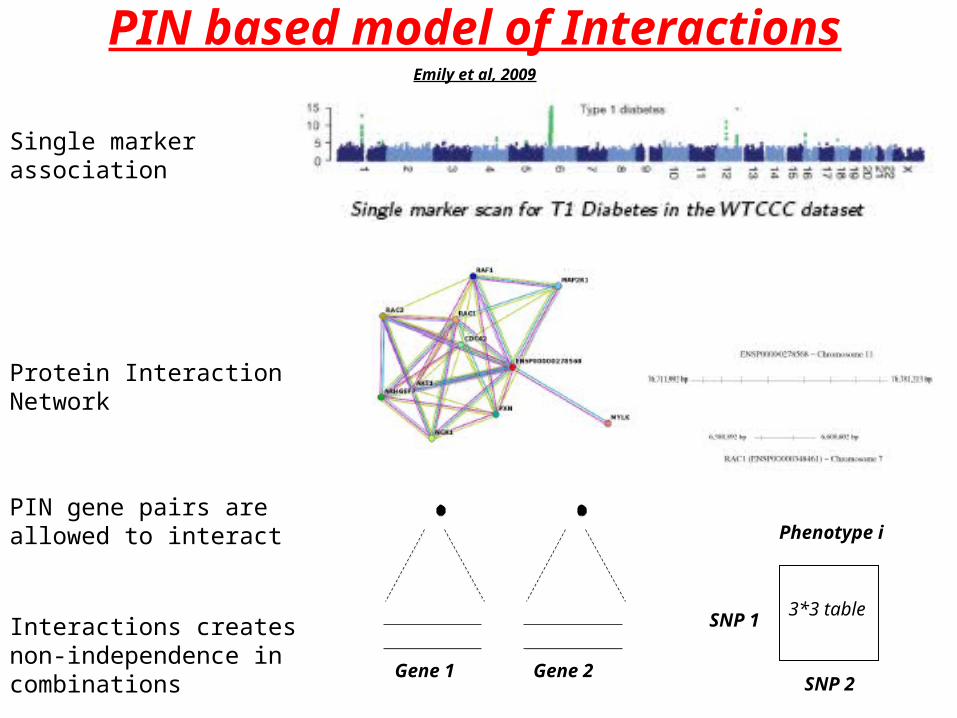
PIN based model of InteractionsEmily et al, 2009
Single marker association
Protein Interaction Network
Gene 1 Gene 2
PIN gene pairs are allowed to interact
SNP 2
SNP 1
Phenotype i
3*3 tableInteractions creates non-independence in combinations
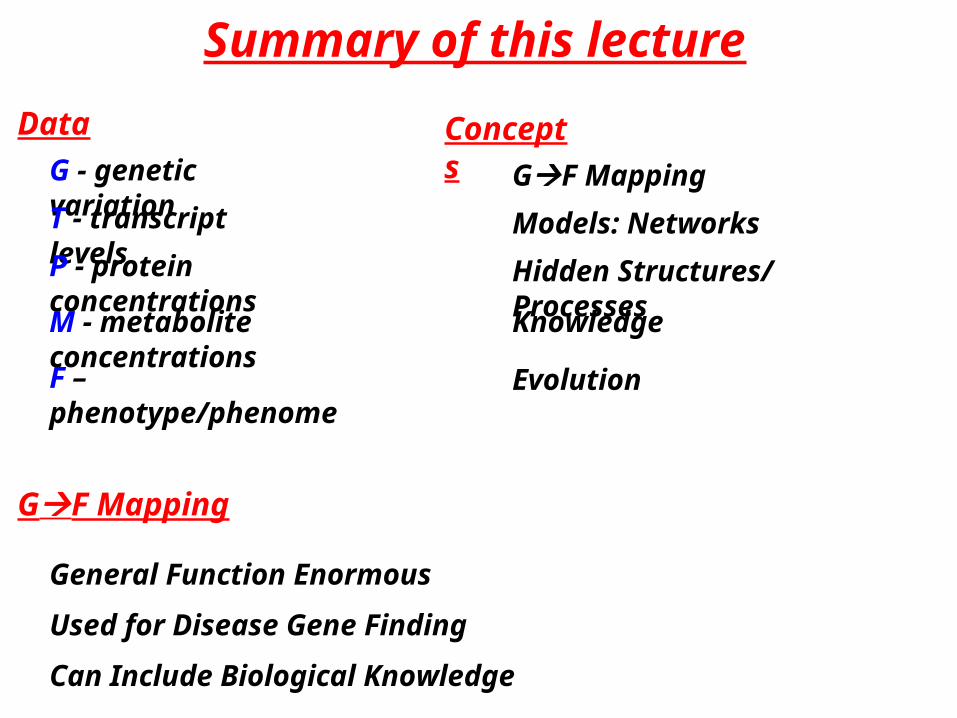
Summary of this lecture
G - genetic variation
T - transcript levels
P - protein concentrations
M - metabolite concentrations
F – phenotype/phenome
Data
Models: Networks
Hidden Structures/ Processes
Evolution
Knowledge
GF Mapping
Concepts
GF Mapping
General Function Enormous
Used for Disease Gene Finding
Can Include Biological Knowledge

P – ProteomicsC
ox and Mann (2007) Is P
roteomics the N
ew G
enomics? C
ell 130,395-99
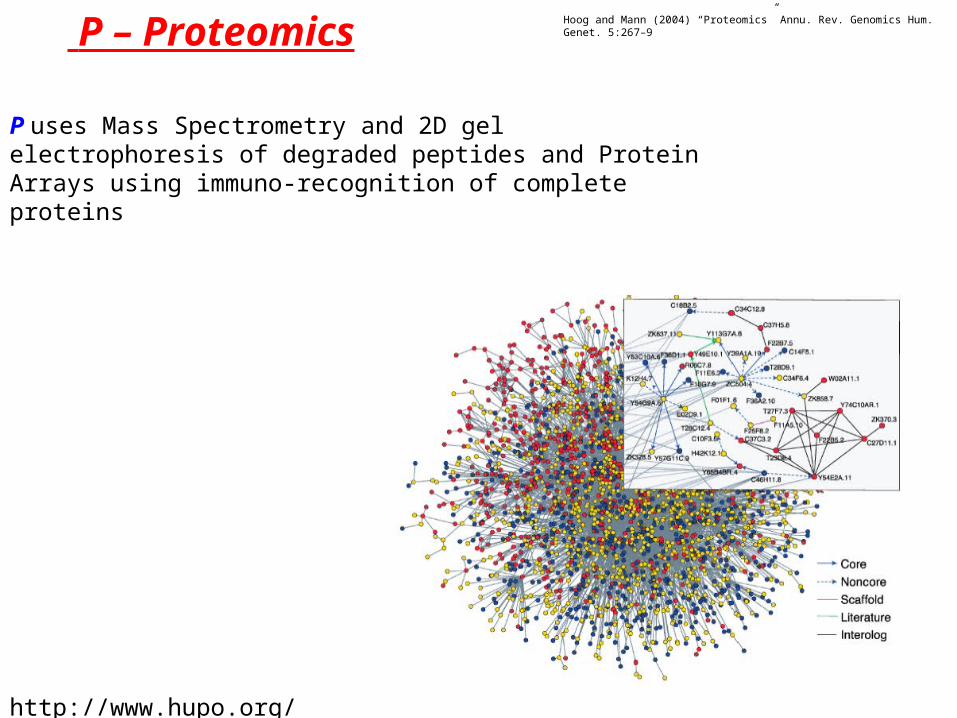
P – Proteomics
P uses Mass Spectrometry and 2D gel electrophoresis of degraded peptides and Protein Arrays using immuno-recognition of complete proteins
Hoog and Mann (2004) “Proteomics” Annu. Rev. Genomics Hum. Genet. 5:267–9
http://www.hupo.org/