Embed Size (px)
Citation preview
Notice: The Intel® Itanium® Processor 9300 Series may contain design defects or errors known as errata which may cause the product to deviate from published specifications. Current characterized errata are available on request.
Document number: 323602-001
Intel® Itanium® Processor 9300 Series Reference Manual for Software Development and Optimization
March 2010
2 Intel® Itanium® Processor 9300 Series Reference Manual for Software Development and Optimization, March 2010
INFORMATION IN THIS DOCUMENT IS PROVIDED IN CONNECTION WITH INTEL® PRODUCTS. NO LICENSE, EXPRESS OR IMPLIED, BY ESTOPPEL OR OTHERWISE, TO ANY INTELLECTUAL PROPERTY RIGHTS IS GRANTED BY THIS DOCUMENT. EXCEPT AS PROVIDED IN INTEL'S TERMS AND CONDITIONS OF SALE FOR SUCH PRODUCTS, INTEL ASSUMES NO LIABILITY WHATSOEVER, AND INTEL DISCLAIMS ANY EXPRESS OR IMPLIED WARRANTY, RELATING TO SALE AND/OR USE OF INTEL PRODUCTS INCLUDING LIABILITY OR WARRANTIES RELATING TO FITNESS FOR A PARTICULAR PURPOSE, MERCHANTABILITY, OR INFRINGEMENT OF ANY PATENT, COPYRIGHT OR OTHER INTELLECTUAL PROPERTY RIGHT. Intel products are not intended for use in medical, life saving, or life sustaining applications.
Intel may make changes to specifications and product descriptions at any time, without notice.
Designers must not rely on the absence or characteristics of any features or instructions marked “reserved” or “undefined.” Intel reserves these for future definition and shall have no responsibility whatsoever for conflicts or incompatibilities arising from future changes to them.
The Intel® Itanium® processor 9300 series may contain design defects or errors known as errata which may cause the product to deviate from published specifications. Current characterized errata are available on request.
Contact your local Intel sales office or your distributor to obtain the latest specifications and before placing your product order.
Copies of documents which have an order number and are referenced in this document, or other Intel literature, may be obtained by calling 1-800-548-4725, or by visiting Intel's web site at http://www.intel.com.
Intel, Itanium, Intel Interconnect BIST (Intel IBIST), Intel Scalable Memory Interconnect (Intel SMI), and the Intel logo are trademarks or registered trademarks of Intel Corporation or its subsidiaries in the United States and other countries.
*Other names and brands may be claimed as the property of others.
Copyright © 2010, Intel Corporation. All rights reserved.
Intel® Itanium® Processor 9300 Series 3Reference Manual for Software Development and Optimization, March 2010
Contents
1 Introduction ............................................................................................................ 131.1 Terminology ..................................................................................................... 131.2 Related Documentation ...................................................................................... 13
2 The Intel® Itanium® Processor 9300 Series ........................................................... 152.1 Overview ......................................................................................................... 15
2.1.1 Identifying Intel® Itanium® Processors .................................................... 152.1.2 The Intel® Itanium® Processor 9300 Series .............................................. 172.1.3 Instruction Set Support........................................................................... 20
2.2 Instruction Dispersal and Execution ..................................................................... 202.2.1 Instruction Dispersal............................................................................... 202.2.2 Instruction Latencies and Bypasses........................................................... 222.2.3 Intel® Itanium® Processor 9300 Series-Specific Instruction Behavior ........... 232.2.4 Branch Prediction ................................................................................... 242.2.5 Caches and Cache Management Changes .................................................. 24
2.3 Intel® Itanium® Processor 9300 Series Multi-Threading ........................................ 252.4 Quad Cores ...................................................................................................... 262.5 Intel® Virtualization Technology ......................................................................... 262.6 Tips and Tricks.................................................................................................. 26
2.6.1 Instruction Cache Coherence Optimization ................................................. 262.7 IA-32 Execution ................................................................................................ 272.8 Brand Information ............................................................................................. 27
3 Performance Monitoring .......................................................................................... 293.1 Introduction ..................................................................................................... 293.2 Performance Monitor Programming Models............................................................ 29
3.2.1 Workload Characterization....................................................................... 303.2.2 Profiling ................................................................................................ 333.2.3 Event Qualification ................................................................................. 363.2.4 References ............................................................................................ 42
3.3 Performance Monitor State ................................................................................. 423.3.1 Performance Monitor Control and Accessibility ............................................ 453.3.2 Performance Counter Registers ................................................................ 463.3.3 Performance Monitor Event Counting Restrictions Overview.......................... 483.3.4 Performance Monitor Overflow Status Registers (PMC0,1,2,3) ........................ 483.3.5 Instruction Address Range Matching ......................................................... 493.3.6 Opcode Match Check (PMC32,33,34,35,36) .................................................... 533.3.7 Data Address Range Matching (PMC41)...................................................... 563.3.8 Instruction EAR (PMC37/PMD34,35) ............................................................ 573.3.9 Data EAR (PMC40, PMD32,33,36) ................................................................ 603.3.10 Execution Trace Buffer (PMC39,42,PMD48-63,38,39) ....................................... 643.3.11 IVA Filter Configuration Register............................................................... 72
3.4 Interrupt and Processor Reset Information............................................................ 733.4.1 Perfmon Interrupts ................................................................................. 733.4.2 Processor Reset, PAL Calls, and Low Power State........................................ 73
4 Performance Monitor Events.................................................................................... 754.1 Introduction ..................................................................................................... 754.2 Categorization of Events..................................................................................... 75
4.2.1 Multi-Threading and Event Types.............................................................. 764.3 Basic Events ..................................................................................................... 774.4 Instruction Dispersal Events ............................................................................... 77
4 Intel® Itanium® Processor 9300 Series Reference Manual for Software Development and Optimization, March 2010
4.5 Instruction Execution Events ...............................................................................784.6 Stall Events ......................................................................................................794.7 Branch Events ...................................................................................................804.8 Memory Hierarchy .............................................................................................81
4.8.1 L1 Instruction Cache and Prefetch Events...................................................834.8.2 L1 Data Cache Events .............................................................................844.8.3 L2 Instruction Cache Events .....................................................................864.8.4 L2 Data Cache Events .............................................................................864.8.5 L3 Cache Events .....................................................................................91
4.9 System Events ..................................................................................................924.10 TLB Events .......................................................................................................934.11 Intel® QuickPath Interconnect Events ..................................................................95
4.11.1 External Request (ER) Events ...................................................................954.11.2 Core Protocol Engine (CPE) Events ............................................................964.11.3 Extracting Memory Latency from the Intel® Itanium® Processor 9300 Series
Performance Counters .............................................................................974.12 RSE Events .......................................................................................................994.13 Multi-Threading Events.....................................................................................1004.14 Intel Turbo Boost Technology ............................................................................1014.15 Performance Monitors Ordered by Event Code .....................................................1024.16 Performance Monitor Event List .........................................................................107
5 Uncore Performance Monitoring.............................................................................1735.1 Introduction....................................................................................................173
5.1.1 Quick Overview of Intel® Itanium® Processor 9300 Series ........................1735.1.2 Uncore PMU Overview ...........................................................................174
5.2 Uncore PMU Programming Overview...................................................................1745.2.1 On Accessing Uncore PMUs by Virtual Addresses
(Win/Linux*)........................................................................................1755.2.2 Uncore PMU Summary Tables .................................................................177
5.3 QEAR .............................................................................................................1785.4 D-Box Global Performance Monitoring Control......................................................181
5.4.1 Global Freeze/Unfreeze..........................................................................1825.4.2 Setting up a monitoring session..............................................................1825.4.3 Reading the sample interval ...................................................................1835.4.4 Enabling a new sample interval from frozen counters.................................1845.4.5 Global Performance Monitors ..................................................................184
5.5 B-Box Performance Monitoring...........................................................................1855.5.1 Overview of the B-Box...........................................................................1855.5.2 B-Box Performance Monitoring Overview..................................................1855.5.3 B-BOX Performance Monitoring CSRs.......................................................1875.5.4 B-BOX Performance Monitoring Events.....................................................1965.5.5 BBox Events Ordered By Code ................................................................1985.5.6 B-Box Performance Monitor Event List .....................................................200
5.6 R-Box Performance Monitoring ..........................................................................2125.6.1 Overview of the R-Box...........................................................................2125.6.2 R-Box Performance Monitoring Overview..................................................2145.6.3 R-Box Performance Monitoring CSRs .......................................................2165.6.4 R-BOX Performance Monitoring Events.....................................................2315.6.5 RBox Events Ordered By Code................................................................2325.6.6 R-Box Performance Monitor Event List .....................................................233
5.7 Z-Box Performance Monitoring...........................................................................2405.7.1 Overview of the Z-Box...........................................................................2405.7.2 Functional Overview..............................................................................2405.7.3 Z-Box Perfmon Overview .......................................................................242
Intel® Itanium® Processor 9300 Series 5Reference Manual for Software Development and Optimization, March 2010
5.7.4 Z-Box PerfMon Registers ....................................................................... 2435.7.5 Z-Box Performance Monitoring Events..................................................... 2525.7.6 ZBox Events Ordered By Code ............................................................... 2535.7.7 Z-Box Performance Monitor Event List..................................................... 254
5.8 Packet Matching Reference ............................................................................... 268
A Identifying Multi-Core and Multi-Threading ........................................................... 273A.1 Architectural Support ....................................................................................... 273
A.1.1 Terminology ........................................................................................ 273A.1.2 Detection of Hyper-Threading Technology................................................ 273A.1.3 Number of Cores on a Physical Processor................................................. 274A.1.4 Number of Threads in a Core ................................................................. 274A.1.5 Number of Logical Processors Enabled on a Physical Processor ................... 274A.1.6 Logical to Physical Translation................................................................ 274A.1.7 Number of Logical Processors Sharing a Cache ......................................... 274A.1.8 Determine which Logical Processors are Sharing a Cache........................... 275
A.2 Operating System Specific Mechanisms .............................................................. 275A.2.1 HP-UX*............................................................................................... 275A.2.2 Linux* ................................................................................................ 275A.2.3 Microsoft Windows*.............................................................................. 276
Figures2-1 Intel® Itanium® Processor Family and Model Values ............................................. 132-2 The Intel® Itanium® Processor 9300 Series ......................................................... 173-1 Time-Based Sampling ........................................................................................ 283-2 Intel® Itanium® Processor Family Cycle Accounting .............................................. 303-3 Event Histogram by Program Counter .................................................................. 323-4 Intel® Itanium® Processor 9300 Series Event Qualification .................................... 353-5 Instruction Tagging Mechanism in the Intel® Itanium® Processor 9300 Series .......... 373-6 Single Process Monitor ....................................................................................... 393-7 Multiple Process Monitor..................................................................................... 403-8 System Wide Monitor ......................................................................................... 403-9 Intel® Itanium® Processor 9300 Series Performance Monitor Register Mode............. 433-1 Processor Status Register (PSR) Fields for Performance Monitoring .......................... 443-10 Intel® Itanium® Processor 9300 Series Generic PMC Registers (PMC4-15) ................ 453-11 Intel® Itanium® Processor 9300 Series Generic PMD Registers (PMD4-15) ................ 463-12 Intel® Itanium® Processor 9300 Series Performance Monitor Overflow Status Registers
(PMC0,1,2,3) ...................................................................................................... 473-13 Instruction Address Range Configuration Register (PMC38)...................................... 493-14 Opcode Match Registers (PMC32,34) ..................................................................... 523-15 Opcode Match Registers (PMC33,35) ..................................................................... 533-16 Opcode Match Configuration Register (PMC36)....................................................... 533-17 Memory Pipeline Event Constraints Configuration Register (PMC41) .......................... 553-18 Instruction Event Address Configuration Register (PMC37)....................................... 563-19 Instruction Event Address Register Format (PMD34,35)............................................ 573-20 Data Event Address Configuration Register (PMC40) ............................................... 593-21 Data Event Address Register Format (PMD32,33,36) ................................................ 603-22 Execution Trace Buffer Configuration Register (PMC39) ........................................... 643-23 Execution Trace Buffer Register Format (PMD48-63, where PMC39.ds == 0) ............... 663-24 Execution Trace Buffer Index Register Format (PMD38)........................................... 673-25 Execution Trace Buffer Extension Register Format (PMD39) (PMC42.mode=‘000) ........ 67
6 Intel® Itanium® Processor 9300 Series Reference Manual for Software Development and Optimization, March 2010
3-26 IP-EAR Configuration Register (PMC42) .................................................................693-27 IP-EAR Data Format (PMD48-63, Where PMC42.mode == 100 and PMD48-63.ef =0)......693-28 IP-EAR Data Format (PMD48-63, Where PMC42.mode == 100 and PMD48-63.ef =1) ....693-29 IP Trace Buffer Index Register Format (PMD38)(PMC42.mode=‘1xx) ..........................703-30 IP Trace Buffer Extension Register Format (PMD39) (PMC42.mode=‘1xx) ...................703-31 IVA Filter Configuration Register Format (PMC43) ..................................................714-1 Event Monitors in the Intel® Itanium® 2 Processor Memory Hierarchy .....................824-2 Extracting Memory Latency from PMUs .................................................................995-1 Intel® Itanium® Processor 9300 Series Block Diagram ........................................1735-2 R-Box Block Diagram .......................................................................................2135-3 Memory Controller Block Diagram ......................................................................240
Tables2-1 Definition Table .................................................................................................142-2 A-Type Instruction Port Mapping ..........................................................................182-3 B-Type Instruction Port Mapping..........................................................................192-4 I-Type Instruction Port Mapping...........................................................................192-5 M-Type Instruction Port Mapping .........................................................................192-6 Execution with Bypass Latency Summary..............................................................212-7 Intel® Itanium® Processor 9300 Series Cache Hierarchy Summary..........................222-8 PAL_BRAND_INFO Return Values .........................................................................252-9 Intel® Itanium® Processor 9300 Series Feature Set Return Values ..........................263-1 Average Latency per Request and Requests per Cycle
Calculation Example ...........................................................................................303-2 Intel® Itanium® Processor 9300 Series EARs and Branch Trace Buffer .....................333-3 Intel® Itanium® Processor 9300 Series Performance Monitor Register Set ................423-4 Performance Monitor PMC Register Control Fields (PMC4-15) ....................................443-5 Intel® Itanium® Processor 9300 Series Generic PMC Register Fields (PMC4-15) .........453-6 Intel® Itanium® Processor 9300 Series Generic PMD Register Fields........................473-7 Intel® Itanium® Processor 9300 Series Performance Monitor Overflow Register Fields
(PMC0,1,2,3) ......................................................................................................483-8 Intel® Itanium® Processor 9300 Series Instruction Address Range Check by Instruction
Set.......................................................................................................................49
3-9 Instruction Address Range Configuration Register Fields (PMC38) ............................503-10 Opcode Match Registers(PMC32,34).......................................................................523-11 Opcode Match Registers (PMC33,35) ....................................................................533-12 Opcode Match Configuration Register Fields (PMC36) .............................................543-13 Memory Pipeline Event Constraints Fields (PMC41)..................................................553-14 Instruction Event Address Configuration Register Fields (PMC37) ..............................573-15 Instruction EAR (PMC37) umask Field in Cache Mode (PMC37.ct=’1x).........................583-16 Instruction EAR (PMD34,35) in Cache Mode (PMC37.ct=’1x) ......................................583-17 Instruction EAR (PMC37) umask Field in TLB Mode (PMC37.ct=00) ............................583-18 Instruction EAR (PMD34,35) in TLB Mode (PMC37.ct=‘00) .........................................593-19 Data Event Address Configuration Register Fields (PMC40).......................................593-20 Data EAR (PMC40) Umask Fields in Data Cache Mode (PMC40.mode=00) ...................603-21 PMD32,33,36 Fields in Data Cache Load Miss Mode (PMC40.mode=00) ........................613-22 Data EAR (PMC40) Umask Field in TLB Mode (PMC40.ct=01) ....................................623-23 PMD32,33,36 Fields in TLB Miss Mode (PMC40.mode=‘01)..........................................623-24 PMD32,33,36 Fields in ALAT Miss Mode (PMC11.mode=‘1x) ........................................63
Intel® Itanium® Processor 9300 Series 7Reference Manual for Software Development and Optimization, March 2010
3-25 Execution Trace Buffer Configuration Register Fields (PMC39) .................................. 643-26 Execution Trace Buffer Register Fields (PMD48-63)(PMC42.mode=‘000)...................... 663-27 Execution Trace Buffer Index Register Fields (PMD38)............................................. 673-28 Execution Trace Buffer Extension Register Fields (PMD39) (PMC42.mode=‘000) .......... 683-29 IP-EAR Configuration Register Fields (PMC42) ........................................................ 693-30 IP-EAR Data Register Fields (PMD48-63) (PMC42.mode=‘1xx) ................................... 703-31 IP Trace Buffer Index Register Fields (PMD38) (PMC42.mode=‘1xx) .......................... 703-32 IP Trace Buffer Extension Register Fields (PMD39) (PMC42.mode=‘1xx).................... 713-33 IVA Filter Configuration Register Fields (PMC43)..................................................... 713-34 Information Returned by PAL_PERF_MON_INFO for the Intel® Itanium® Processor 9300
Series.............................................................................................................. 734-1 Performance Monitors for Basic Events ................................................................. 774-2 Derived Monitors for Basic Events........................................................................ 774-3 Performance Monitors for Instruction Dispersal Events............................................ 784-4 Performance Monitors for Instruction Execution Events........................................... 784-5 Derived Monitors for Instruction Execution Events.................................................. 794-6 Performance Monitors for Stall Events .................................................................. 804-7 Performance Monitors for Branch Events............................................................... 814-8 Performance Monitors for L1/L2 Instruction Cache and Prefetch Events..................... 834-9 Derived Monitors for L1 Instruction Cache and Prefetch Events ................................ 844-10 Performance Monitors for L1 Data Cache Events .................................................... 844-11 Performance Monitors for L1D Cache Set 0 ........................................................... 854-12 Performance Monitors for L1D Cache Set 1 ........................................................... 854-13 Performance Monitors for L1D Cache Set 2 ........................................................... 854-14 Performance Monitors for L1D Cache Set 3 ........................................................... 854-15 Performance Monitors for L1D Cache Set 4 ........................................................... 854-16 Performance Monitors for L1D Cache Set 6 ........................................................... 864-17 Performance Monitors for L2I Cache..................................................................... 864-18 Derived Monitors for L2I Cache ........................................................................... 864-19 Performance Monitors for L2 Data Cache Events .................................................... 874-20 Derived Monitors for L2 Data Cache Events........................................................... 884-21 Performance Monitors for L2 Data Cache Set 0 ...................................................... 894-22 Performance Monitors for L2 Data Cache Set 1 ...................................................... 894-23 Performance Monitors for L2 Data Cache Set 2 ...................................................... 894-24 Performance Monitors for L2 Data Cache Set 3 ...................................................... 894-25 Performance Monitors for L2 Data Cache Set 4 ...................................................... 904-26 Performance Monitors for L2 Data Cache Set 5 ...................................................... 904-27 Performance Monitors for L2 Data Cache Set 6 ...................................................... 904-28 Performance Monitors for L2 Data Cache Set 7 ...................................................... 904-29 Performance Monitors for L2 Data Cache Set 8 ...................................................... 914-30 Performance Monitors for L2D Cache – Not Set Restricted....................................... 914-31 Performance Monitors for L3 Unified Cache Events ................................................. 914-32 Derived Monitors for L3 Unified Cache Events........................................................ 924-33 Performance Monitors for System Events.............................................................. 924-34 Derived Monitors for System Events..................................................................... 934-35 Performance Monitors for TLB Events ................................................................... 934-36 Derived Monitors for TLB Events.......................................................................... 944-37 Performance Monitors for External Request (ER) Events.......................................... 954-38 Derived Monitors for Intel® QuickPath Interconnect Events .................................... 964-39 Performance Monitors for Core Protocol Engine (CPE) Events................................... 96
8 Intel® Itanium® Processor 9300 Series Reference Manual for Software Development and Optimization, March 2010
4-40 Performance Monitors for RSE Events .................................................................1004-41 Derived Monitors for RSE Events........................................................................1004-42 Performance Monitors for Multi-Threading Events .................................................1014-43 Performance Monitors for Intel Turbo Boost Technology ........................................1014-44 All Performance Monitors Ordered by Code..........................................................1024-45 Unit Masks for ALAT_CAPACITY_MISS.................................................................1074-46 Unit Masks for BACK_END_BUBBLE ....................................................................1084-47 Unit Masks for BE_BR_MISPREDICT_DETAIL........................................................1084-48 Unit Masks for BE_EXE_BUBBLE.........................................................................1094-49 Unit Masks for BE_FLUSH_BUBBLE.....................................................................1094-50 Unit Masks for BE_L1D_FPU_BUBBLE..................................................................1104-51 Unit Masks for BE_LOST_BW_DUE_TO_FE...........................................................1114-52 Unit Masks for BE_RSE_BUBBLE ........................................................................1124-53 Unit Masks for BR_MISPRED_DETAIL..................................................................1124-54 Unit Masks for BR_MISPREDICT_DETAIL2 ...........................................................1134-55 Unit Masks for BR_PATH_PRED ..........................................................................1144-56 Unit Masks for BR_PATH_PRED2 ........................................................................1154-57 Unit Masks for CPE_BACK_SNP ..........................................................................1164-58 Unit Masks for CPE_BLD_DRSNCS......................................................................1164-59 Unit Masks for CPE_BLD_HOM ...........................................................................1174-60 Unit Masks for CPE_BLD_NCB............................................................................1184-61 Unit Masks for CPE_CPB_MISC ..........................................................................1184-62 Unit Masks for CPE_CPP_MISC...........................................................................1194-63 Unit Masks for CPE_QPI_RSP.............................................................................1194-64 Unit Masks for CPE_EXT_SNP ............................................................................1204-65 Unit Masks for CPE_LNK ...................................................................................1204-66 Unit Masks for CPE_PTCG..................................................................................1224-67 Unit Masks for CPE_REQ ...................................................................................1224-68 Unit Masks for CPE_RIP_DRS.............................................................................1234-69 Unit Masks for CPE_RIP_NDRNCBSNP .................................................................1234-70 Unit Masks for CPU_CPL_CHANGES ....................................................................1244-71 Unit Masks for CPU_OP_CYCLES ........................................................................1254-72 Unit Masks for CPU_OP_CYCLES_LOST ...............................................................1254-73 Unit Masks for CYCLES_IN_BGND_WITH_URG .....................................................1264-74 Unit Masks for DISP_THROTTLE .........................................................................1284-75 Unit Masks for ENCBR_MISPRED_DETAIL ............................................................1294-76 Unit Masks for ER_EVICT_CLN ...........................................................................1314-77 Unit Masks for ER_FC_OR_SS............................................................................1314-78 Unit Masks for ER_READS .................................................................................1324-79 Unit Masks for ER_SNP_ALL ..............................................................................1334-80 Unit Masks for ER_SNP_CODE ...........................................................................1344-81 Unit Masks for ER_SNP_DATA............................................................................1344-82 Unit Masks for ER_SNP_INV ..............................................................................1354-83 Unit Masks for ER_WRITES................................................................................1354-84 Unit Masks for FE_BUBBLE ................................................................................1364-85 Unit Masks for FE_LOST_BW .............................................................................1374-86 Unit Masks for FP_FLUSH_TO_ZERO...................................................................1384-87 Unit Masks for IA64_INST_RETIRED ...................................................................1394-88 Unit Masks for IA64_TAGGED_INST_RETIRED......................................................1404-89 Unit Masks for IDEAL_BE_LOST_BW_DUE_TO_FE.................................................140
Intel® Itanium® Processor 9300 Series 9Reference Manual for Software Development and Optimization, March 2010
4-90 Unit Masks for INST_CHKA_LDC_ALAT ............................................................... 1414-91 Unit Masks for INST_FAILED_CHKA_LDC_ALAT ................................................... 1414-92 Unit Masks for INST_FAILED_CHKS_RETIRED...................................................... 1424-93 Unit Masks for ITLB_MISSES_FETCH .................................................................. 1434-94 Unit Masks for L1D_READ_MISSES .................................................................... 1444-95 Unit Masks for L1I_PREFETCH_STALL................................................................. 1464-96 Unit Masks for L2D_BAD_LINES_SELECTED ........................................................ 1484-97 Unit Masks for L2D_BYPASS.............................................................................. 1484-98 Unit Masks for L2D_FILLB_FULL ........................................................................ 1494-99 Unit Masks for L2D_FILL_MESI_STATE ............................................................... 1494-100 Unit Masks for L2D_FORCE_RECIRC................................................................... 1504-101 Unit Masks for L2D_L3ACCESS_CANCEL ............................................................. 1534-102 Unit Masks for L2D_OPS_ISSUED ...................................................................... 1544-103 Unit Masks for L2D_OZDB_FULL ........................................................................ 1544-104 Unit Masks for L2D_OZQ_CANCELS0.................................................................. 1554-105 Unit Masks for L2D_OZQ_CANCELS0.................................................................. 1564-106 Unit Masks for L2D_OZQ_FULL.......................................................................... 1574-107 Unit Masks for L2D_REFERENCES ...................................................................... 1584-108 Unit Masks for L2D_STORE_HIT_SHARED ........................................................... 1584-109 Unit Masks for L2D_VICTIMB_FULL .................................................................... 1584-110 Unit Masks for L2I_HIT_CONFLICTS................................................................... 1594-111 Unit Masks for L2I_L3_REJECTS ........................................................................ 1604-112 Unit Masks for L2I_READS................................................................................ 1604-113 Unit Masks for L2I_RECIRCULATES .................................................................... 1614-114 Unit Masks for L2I_UC_READS .......................................................................... 1624-115 Unit Masks for L3_READS ................................................................................. 1634-116 Unit Masks for L3_WRITES ............................................................................... 1644-117 Unit Masks for RSE_REFERENCES_RETIRED ........................................................ 1674-118 Unit Masks for SPEC_LOADS_NATTED ................................................................ 1684-119 Unit Masks for SYLL_NOT_DISPERSED ............................................................... 1694-120 Unit Masks for SYLL_OVERCOUNT...................................................................... 1704-121 Unit Masks for THREAD_SWITCH_CYCLE ............................................................ 1704-122 Unit Masks for THREAD_SWITCH_EVENTS .......................................................... 1714-123 Unit Masks for THREAD_SWITCH_GATED............................................................ 1714-124 Unit Masks for THREAD_SWITCH_STALL............................................................. 1725-1 Per-Box Performance Monitoring Capabilities....................................................... 1745-2 Physical/Virtual Address Offsets for Socket Access ............................................... 1755-3 Address Offsets for Per-Box Access.................................................................... 1755-4 Uncore Performance Monitoring MSRs ................................................................ 1775-5 QEAR Configuration Register Fields (CPE_CSR_QEAR_CTL) ................................... 1805-6 QEAR Data Register 0 Fields (CPE_CSR_CEAR_DAT0)........................................... 1815-7 QEAR Data Register 1 Fields (CPE_CSR_CEAR_DAT1)........................................... 1815-8 DBX_CSR_MISC Register Field Definitions........................................................... 1845-9 B-Box PMU Summary....................................................................................... 1875-10 B_CSR_PERF_CTL0 Register – Field Definitions.................................................... 1885-11 B_CSR_PERF_CTL1 Register – Field Definitions.................................................... 1895-12 B_CSR_PERF_CNT{7-0} Register – Field Definitions............................................. 1905-13 B_CSR_PERF_CTL2 Register – Field Definitions.................................................... 1905-14 B_CSR_PERF_CTL3 Register – Field Definitions.................................................... 1925-15 Intel® QuickPath Interconnect (Intel® QPI) Packet Message Classes ..................... 192
10 Intel® Itanium® Processor 9300 Series Reference Manual for Software Development and Optimization, March 2010
5-16 Opcode Match by Message Class for the B-Box.....................................................1935-17 B_CSR_IOB_PERF_CNT Register – Field Definitions ..............................................1955-18 B_CSR_BZ_PERF_CNT Register – Field Definitions................................................1955-19 B_CSR_ARB_PERF_CNT0 Register – Field Definitions ............................................1955-20 B_CSR_ARB_PERF_CNT1 Register – Field Definitions ............................................1965-21 B_CSR_IMT_PERF_CNT Register – Field Definitions ..............................................1965-22 Performance Monitor Events for BBox Events.......................................................1985-23 Input Buffering Per Port....................................................................................2145-24 R-Box PMU Summary .......................................................................................2165-25 R-Box Port Map ...............................................................................................2215-26 R_CSR_PERF_GBLCFG Fields .............................................................................2225-27 R_CSR_PERF_CNT_CTRL_{15-0} Fields ..............................................................2225-28 R_CSR_PERF_CNT_{15-0} Fields.......................................................................2235-29 R_CSR_P{11-0}_IPERF{1-0} Registers ..............................................................2245-30 R_CSR_ARB_PERF_CTR[5:0] Register Fields........................................................2255-31 R_CSR_PORT{5-0}_MM_CFG_{1-0} Registers.....................................................2285-32 R_CSR_PORT{5-0}_MATCH_{1-0}_MSB Registers...............................................2285-33 R_CSR_PORT{5-0}_MATCH_{1-0}_LSB Registers................................................2295-34 R_CSR_PORT{5-0}_MASK_{1-0}_MSB Registers.................................................2295-35 R_CSR_PORT{5-0}_MASK_{1-0}_LSB Registers..................................................2305-36 Message Events Derived from the Match/Mask filters ............................................2305-37 Performance Monitor Events for RBox Events.......................................................2325-38 Unit Masks for EOT_DEPTH_ACC........................................................................2335-39 Unit Masks for EOT_INSERTS ............................................................................2345-40 Unit Masks for ET_DEPTH_ACC ..........................................................................2345-41 Unit Masks for NEW_PACKETS_RECV..................................................................2375-42 Unit Masks for QUE_ARB_BID............................................................................2385-43 Unit Masks for QUE_ARB_BID_FAIL ....................................................................2385-44 Unit Masks for TARGET_AVAILABLE....................................................................2395-45 Z-Box Performance Monitoring CSRs ..................................................................2435-46 Z_CSR_PMU_CNT_STATUS Register Field Definitions ............................................2445-47 Z_CSR_PMU_CNT_CTRL_{4-0} Register Field Definitions ......................................2455-48 Z_CSR_PMU_CNT_{4-0} Fields .........................................................................2465-49 Z_CSR_DSP_PMU Register – Field Definitions ......................................................2475-50 Z_CSR_ISS_PMU Register – Field Definitions .......................................................2485-51 Z_CSR_PMU_MSC_THR Register – Field Definitions ..............................................2485-52 TRP_PT_{DN,UP}_CND Encodings......................................................................2495-53 Z_CSR_PGT_PMU Register – Field Definitions ......................................................2495-54 Z_CSR_PLD_PMU Register – Field Definitions.......................................................2505-55 Z_CSR_PMU_ZDP_CTL_FVC Register – Field Definitions ........................................2505-56 Z_CSR_PMU_ZDP_CTL_FVC.evnt{3-0} Encodings ................................................2515-57 Z_CSR_PMU_ZDP_CTL_FVC.RESP Encodings .......................................................2515-58 Z_CSR_PMU_ZDP_CTL_FVC.BCMD Encodings ......................................................2525-59 Performance Monitor Events for ZBox Events.......................................................2535-60 Unit Masks for FVC_EV0....................................................................................2555-61 Unit Masks for FVC_EV1....................................................................................2575-62 Unit Masks for FVC_EV2....................................................................................2585-63 Unit Masks for FVC_EV3....................................................................................2595-64 Intel® QuickPath Interconnect Package Message Classes ......................................2685-65 Opcode Match by Message Class ........................................................................268
Intel® Itanium® Processor 9300 Series 11Reference Manual for Software Development and Optimization, March 2010
5-66 Opcodes (Alphabetical Listing) .......................................................................... 269
12 Intel® Itanium® Processor 9300 Series Reference Manual for Software Development and Optimization, March 2010
Revision History
§
Document Number
Revision Number Description Date
001 1.0 • Initial public release March 2010
Introduction
Intel® Itanium® Processor 9300 Series 13Reference Manual for Software Development and Optimization, March 2010
1 Introduction
This document provides microarchitectural description of the Intel® Itanium® processor 9300 series (formerly code-named Tukwila), performance monitor information, and other guidance to assist software developers in optimizing for the upcoming Intel® Itanium® processor.
1.1 TerminologyThe following definitions are for terms that will be used throughout this document:
1.2 Related DocumentationThe reader of this document should also be familiar with the material and concepts presented in the following documents:
• Intel® Itanium® Architecture Software Developer’s Manual, Volume 1: Application Architecture
• Intel® Itanium® Architecture Software Developer’s Manual, Volume 2: System Architecture
• Intel® Itanium® Architecture Software Developer’s Manual, Volume 3: Instruction Set Reference
• Intel® Itanium® Architecture Software Developer’s Manual Specification Update
• Intel® Itanium® 2 Processor Reference Manual for Software Development and Optimization
• Dual-Core Update to the Intel® Itanium® 2 Processor Reference Manual
Term Definition
Dispersal The process of mapping instructions within bundles to functional units
Bundle rotation The process of bringing new bundles into the two-bundle issue window
Split issue Instruction execution when an instruction does not issue at the same time as the instruction immediately before it.
Advanced load address table (ALAT) The ALAT holds the state necessary for advanced load and check operations.
Translation lookaside buffer (TLB) The TLB holds virtual to physical address mappings
Virtual hash page table (VHPT) The VHPT is an extension of the TLB hierarchy, which resides in the virtual memory space, is designed to enhance virtual address translation performance.
Hardware page walker (HPW) The HPW is the third level of address translation. It is an engine that performs page look-ups from the VHPT and seeks opportunities to insert translations into the processor TLBs.
Register stack engine (RSE) The RSE moves registers between the register stack and the backing store in memory.
Event address registers (EARs) The EARs record the instruction and data addresses of data cache misses.

Introduction
14 Intel® Itanium® Processor 9300 Series Reference Manual for Software Development and Optimization, March 2010
§
The Intel® Itanium® Processor 9300 Series
Intel® Itanium® Processor 9300 Series 15Reference Manual for Software Development and Optimization, March 2010
2 The Intel® Itanium® Processor 9300 Series
2.1 OverviewThe Intel® Itanium® processor 9300 series is the seventh generation Intel® Itanium® processor. Intel® Itanium® processor 9300 series builds on the previous Intel® Itanium® processors while introducing new technologies for performance and reliability to the Intel® Itanium® processor family. Key improvements include four cores per die, multi-threading improvements, virtualization enhancements, integrated memory controllers, directory coherency, and Intel® QuickPath Interconnect technology.
This section describes key Intel® Itanium® processor 9300 series features and how its implementation of the Intel® Itanium® architecture differs from previous Intel® Itanium® processors. Some of this information may not be directly applicable to performance tuning, but allows developers to better understand changes in application behavior on the Intel® Itanium® processor 9300 series compared to other Intel® Itanium® processors. Unless otherwise stated, all of the restrictions, rules, sizes, and capacities described in this document apply specifically to The Intel® Itanium® processor 9300 series and may not apply to other Intel® Itanium® processors. This document assumes a familiarity with the previous Intel® Itanium® processors, including some of their unique properties and behaviors. Furthermore, only differences as they relate to performance and general use will be included here. Information about Intel® Itanium® processor 9300 series features such as error protection, virtualization technology, and multi-threading technology support may be obtained in other documents.
General understanding of processor components and explicit familiarity with the Intel® Itanium® instruction set are assumed. This document is not intended to be used as an architectural reference for the Intel® Itanium® architecture. For more information on the Intel® Itanium® architecture, consult the Intel® Itanium® Architecture Software Developer’s Manual.
2.1.1 Identifying Intel® Itanium® Processors
The seven generations of the Intel® Itanium® processor can be identified by their unique CPUID values. For simplicity of documentation, throughout this document we will group all processors of like model together. Table 2-1 lists the CPUID values of all of the Intel® Itanium® processors. Table 2-1 lists Intel® Itanium® processors and their grouping.
Note that the The Intel® Itanium® Processor 9300 Series CPUID family value remains 0x20 and the model ID changes to 0x02.
Figure 2-1. Intel® Itanium® Processor Family and Model Values (Sheet 1 of 2)
Family Model Description
0x07 0x00 Intel® Itanium® Processor
0x1f 0x00 Intel® Itanium® Processor (up to 3 MB L3 cache)
0x1f 0x01 Intel® Itanium® Processor (up to 6 MB L3 cache)
The Intel® Itanium® Processor 9300 Series
16 Intel® Itanium® Processor 9300 Series Reference Manual for Software Development and Optimization, March 2010
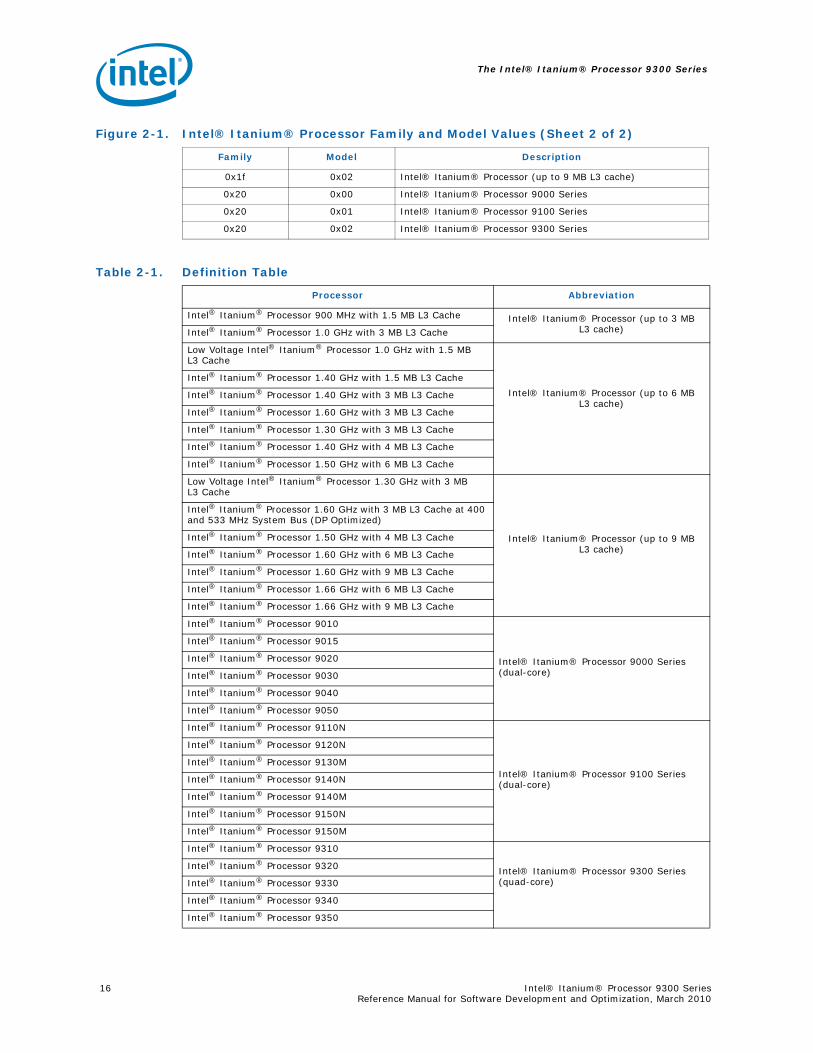
0x1f 0x02 Intel® Itanium® Processor (up to 9 MB L3 cache)
0x20 0x00 Intel® Itanium® Processor 9000 Series
0x20 0x01 Intel® Itanium® Processor 9100 Series
0x20 0x02 Intel® Itanium® Processor 9300 Series
Table 2-1. Definition Table
Processor Abbreviation
Intel® Itanium® Processor 900 MHz with 1.5 MB L3 Cache Intel® Itanium® Processor (up to 3 MB L3 cache)Intel® Itanium® Processor 1.0 GHz with 3 MB L3 Cache
Low Voltage Intel® Itanium® Processor 1.0 GHz with 1.5 MB L3 Cache
Intel® Itanium® Processor (up to 6 MB L3 cache)
Intel® Itanium® Processor 1.40 GHz with 1.5 MB L3 Cache
Intel® Itanium® Processor 1.40 GHz with 3 MB L3 Cache
Intel® Itanium® Processor 1.60 GHz with 3 MB L3 Cache
Intel® Itanium® Processor 1.30 GHz with 3 MB L3 Cache
Intel® Itanium® Processor 1.40 GHz with 4 MB L3 Cache
Intel® Itanium® Processor 1.50 GHz with 6 MB L3 Cache
Low Voltage Intel® Itanium® Processor 1.30 GHz with 3 MB L3 Cache
Intel® Itanium® Processor (up to 9 MB L3 cache)
Intel® Itanium® Processor 1.60 GHz with 3 MB L3 Cache at 400 and 533 MHz System Bus (DP Optimized)
Intel® Itanium® Processor 1.50 GHz with 4 MB L3 Cache
Intel® Itanium® Processor 1.60 GHz with 6 MB L3 Cache
Intel® Itanium® Processor 1.60 GHz with 9 MB L3 Cache
Intel® Itanium® Processor 1.66 GHz with 6 MB L3 Cache
Intel® Itanium® Processor 1.66 GHz with 9 MB L3 Cache
Intel® Itanium® Processor 9010
Intel® Itanium® Processor 9000 Series (dual-core)
Intel® Itanium® Processor 9015
Intel® Itanium® Processor 9020
Intel® Itanium® Processor 9030
Intel® Itanium® Processor 9040
Intel® Itanium® Processor 9050
Intel® Itanium® Processor 9110N
Intel® Itanium® Processor 9100 Series (dual-core)
Intel® Itanium® Processor 9120N
Intel® Itanium® Processor 9130M
Intel® Itanium® Processor 9140N
Intel® Itanium® Processor 9140M
Intel® Itanium® Processor 9150N
Intel® Itanium® Processor 9150M
Intel® Itanium® Processor 9310
Intel® Itanium® Processor 9300 Series (quad-core)
Intel® Itanium® Processor 9320
Intel® Itanium® Processor 9330
Intel® Itanium® Processor 9340
Intel® Itanium® Processor 9350
Figure 2-1. Intel® Itanium® Processor Family and Model Values (Sheet 2 of 2)
Family Model Description
The Intel® Itanium® Processor 9300 Series
Intel® Itanium® Processor 9300 Series 17Reference Manual for Software Development and Optimization, March 2010
2.1.2 The Intel® Itanium® Processor 9300 Series
The Intel® Itanium® processor 9300 series improves the latest Intel® Itanium® processor core’s thread level parallelism by doubling the number of cores per die and providing multi-threading algorithm enhancements. Instruction level parallelism is improved by increasing memory and interprocessor bandwidth and increasing core frequency. This document assumes an understanding of the dual-core Intel® Itanium® processors, as described in the Dual-Core Update to the Intel® Itanium® 2 Processor Reference Manual.
The Intel® Itanium® processor 9300 series is the first Intel® Itanium® processor with Intel® QuickPath Interconnect and Intel® Scalable Memory Interconnect (Intel® SMI). The Intel® Itanium® processor 9300 series includes four full-width and two half-width Intel® QuickPath Interconnect links in addition to four Intel® SMI channels. The Intel® Itanium® processor 9300 series implements two on-die memory controllers each with its own dedicated home agent coherency controller. A twelve-ported router is implemented to provide Intel® QuickPath Interconnect packet level routing between the four processor cores, six Intel® QuickPath Interconnect links, and two home agents.
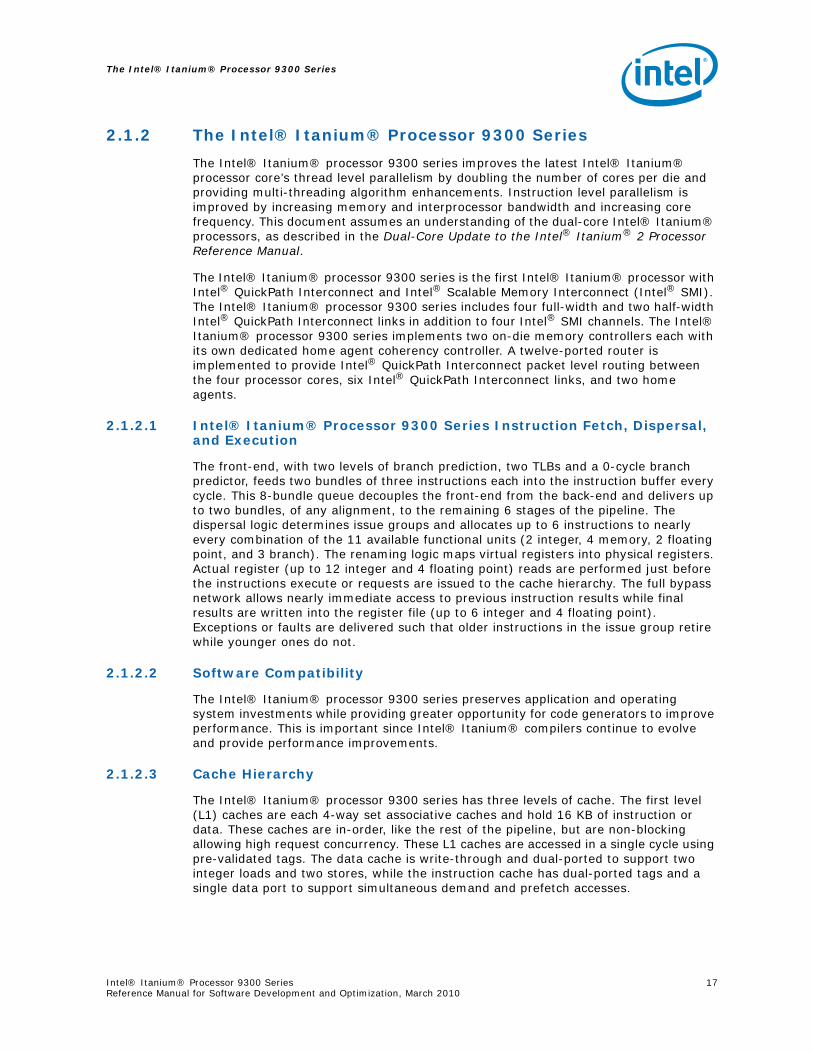
2.1.2.1 Intel® Itanium® Processor 9300 Series Instruction Fetch, Dispersal, and Execution
The front-end, with two levels of branch prediction, two TLBs and a 0-cycle branch predictor, feeds two bundles of three instructions each into the instruction buffer every cycle. This 8-bundle queue decouples the front-end from the back-end and delivers up to two bundles, of any alignment, to the remaining 6 stages of the pipeline. The dispersal logic determines issue groups and allocates up to 6 instructions to nearly every combination of the 11 available functional units (2 integer, 4 memory, 2 floating point, and 3 branch). The renaming logic maps virtual registers into physical registers. Actual register (up to 12 integer and 4 floating point) reads are performed just before the instructions execute or requests are issued to the cache hierarchy. The full bypass network allows nearly immediate access to previous instruction results while final results are written into the register file (up to 6 integer and 4 floating point). Exceptions or faults are delivered such that older instructions in the issue group retire while younger ones do not.
2.1.2.2 Software Compatibility
The Intel® Itanium® processor 9300 series preserves application and operating system investments while providing greater opportunity for code generators to improve performance. This is important since Intel® Itanium® compilers continue to evolve and provide performance improvements.
2.1.2.3 Cache Hierarchy
The Intel® Itanium® processor 9300 series has three levels of cache. The first level (L1) caches are each 4-way set associative caches and hold 16 KB of instruction or data. These caches are in-order, like the rest of the pipeline, but are non-blocking allowing high request concurrency. These L1 caches are accessed in a single cycle using pre-validated tags. The data cache is write-through and dual-ported to support two integer loads and two stores, while the instruction cache has dual-ported tags and a single data port to support simultaneous demand and prefetch accesses.
The Intel® Itanium® Processor 9300 Series
18 Intel® Itanium® Processor 9300 Series Reference Manual for Software Development and Optimization, March 2010
The Intel® Itanium® processor 9300 series provides a dedicated 512 KB L2 cache for instructions (L2I). This cache is 8-way set associative with a 128 byte line size with 7 cycle instruction access latency. A single tag and data port supports out-of-order and pipelined accesses to provide a high utilization. The separate instruction and data L2 caches provide efficient access to the caches by avoiding contention between data accesses and instruction fetches at the second level of the cache hierarchy. The second level instruction cache was 1 MB on dual-core Intel® Itanium® processors.
The Intel® Itanium® processor 9300 series provides a dedicated 256 KB L2 cache for data (L2D). The instruction and data separation increases the data hit rate. The L2D hit latency is 5 cycles for integer and 6 cycles for floating-point accesses. The tag is true 4-ported and the data is pseudo 4-ported with 16-byte banks. The Intel® Itanium® Processor 9300 Series L2D, like previous generations of the Intel® Itanium® processor L2 cache, is out-of-order and pipelined with the ability to track up to 32 requests in addition to 16 misses and their associated victims.
The third level (L3) cache remains unified as in previous Intel® Itanium® processors, but is now 6 MB in size with a 15 cycle integer access latency. The L3 on the dual-core Intel® Itanium® processors was 12 MB with 14 cycle integer access latency. The L3 uses an asynchronous interface with the data array to achieve this low latency; there is no clock, only a read or write valid indication. The read signal is coincident with index and way values that initiate L3 data array accesses. Five cycles later, the entire 128-byte line is available and latched. This data is then delivered in 4 cycles to either the L2D or L2I cache in critical byte order.
The L3 receives requests from both the L2I and L2D but gives priority to the L2I request in the rare case of a conflict. The instruction versus data arbitration point was moved from the L1-L2 in the Intel® Itanium® processor to the L2-L3 starting with the dual-core Intel® Itanium® processors and this design is retained on the Intel® Itanium® processor 9300 series. The cache hierarchy reduces conflicts thanks to the high hit rates of the L2.
The cache hierarchy is replicated in each core to total more than 6.7 MB for each core and nearly 27 MB for the entire processor.
2.1.2.4 TLB Hierarchy
The first level data translation-lookaside-buffer (DTLB1) performs virtual to physical address translations for load transactions that hit in the L1 cache. It has two read ports and one write port. The DTLB1 contains 32 entries and is fully associative. It supports 4 KB, 8 KB, and 16K pages, and can also support subsets of larger pages in 4, 8 or 16 KB subsections. For pages larger than 16 KB, the minimum subset will be a 16 KB subsection. The DTLB1 on previous Intel® Itanium® processors only supported 4KB pages or 4KB subsections of larger pages.
The second level DTLB (DTLB2) handles virtual to physical address translations for data memory references during stores, and protection checking on loads. It contains 128 entries, is fully associative, and can support architected page sizes from 4 KB to 4 GB. The DTLB2 has four ports, where two ports are for loads and two ports are for stores. Of the 128 entries, 64 can be configured as translation registers (TRs).
The first level instruction TLB (ITLB1) is responsible for virtual to physical address translations to enable instruction transaction hits in the L1I cache. It is dual ported, contains 32 entries, and is fully associative. It supports 4 KB pages only.
The Intel® Itanium® Processor 9300 Series
Intel® Itanium® Processor 9300 Series 19Reference Manual for Software Development and Optimization, March 2010
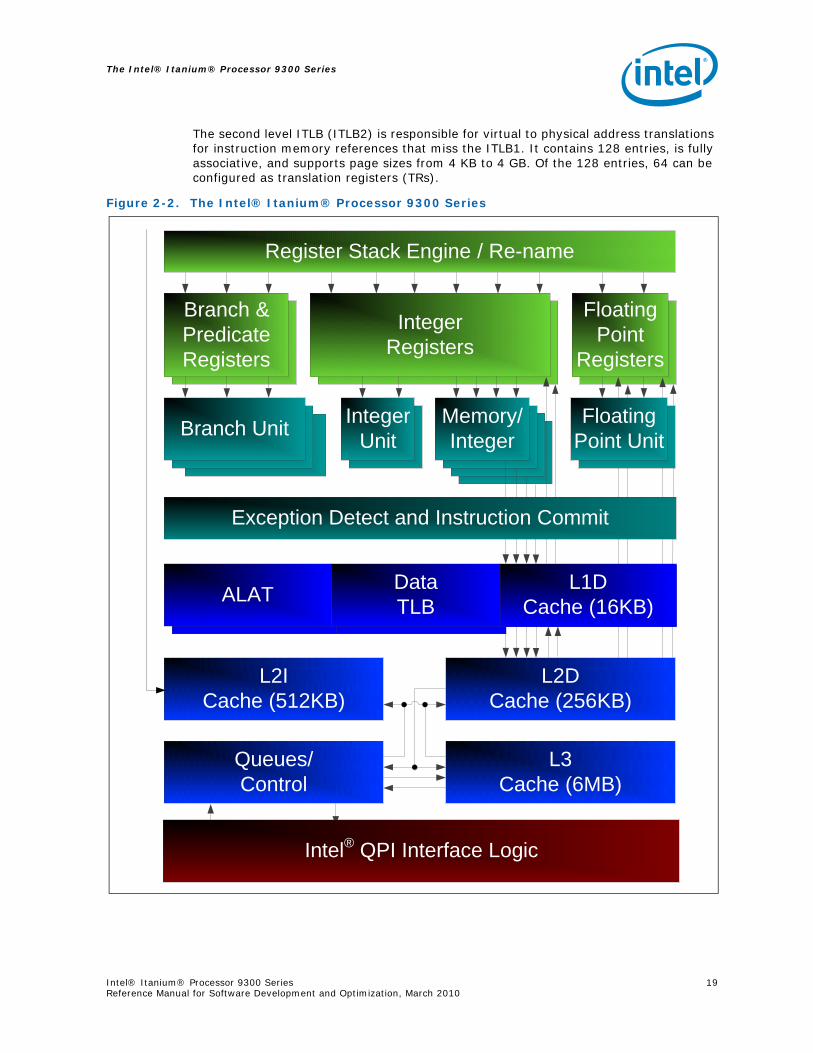
The second level ITLB (ITLB2) is responsible for virtual to physical address translations for instruction memory references that miss the ITLB1. It contains 128 entries, is fully associative, and supports page sizes from 4 KB to 4 GB. Of the 128 entries, 64 can be configured as translation registers (TRs).
Figure 2-2. The Intel® Itanium® Processor 9300 Series
Register Stack Engine / Re-name
IntegerRegisters
Branch & PredicateRegisters
Data TLBALAT L1D
Cache (16KB)
L2DCache (256KB)
Queues/Control
L3Cache (6MB)
Branch Unit IntegerUnit
Memory/Integer
Floating Point Unit
L2ICache (512KB)
Exception Detect and Instruction Commit
Floating Point
Registers
Intel® QPI Interface Logic
The Intel® Itanium® Processor 9300 Series
20 Intel® Itanium® Processor 9300 Series Reference Manual for Software Development and Optimization, March 2010
2.1.3 Instruction Set Support
The Intel® Itanium® processor 9300 series is compliant with the Intel® Itanium®
Architecture Software Developer’s Manual and the Intel® Itanium® Architecture Software Developer’s Manual Specification Update. Compared to the dual-core Intel® Itanium® processors, the Intel® Itanium® processor 9300 series introduces no new instructions.
2.2 Instruction Dispersal and ExecutionThe Intel® Itanium® processor 9300 series core is very similar to the dual-core Intel® Itanium® processor core from a code generation point of view. This allows software optimized for the dual-core Intel® Itanium® processors to achieve improved performance on The Intel® Itanium® processor 9300 series without recompilation.
2.2.1 Instruction Dispersal
The instruction dispersal information in this section is exactly the same as for the dual-core Intel® Itanium® processors. Changes between the dual-core Intel® Itanium® processors and previous Intel® Itanium® processors will be noted with footnotes.
Each fetched instruction is assigned to a functional unit through an issue port. The numerous functional units share a smaller number of issue ports. There are 11 functional units: eight for non-branch instructions and three for branch instructions. They are labeled M0, M1, M2, M3, I0, I1, F0, F1, B0, B1, and B2. The process of mapping instructions within bundles to functional units is called dispersal.
An instruction’s type and position within the issue group determine which functional unit the instruction is assigned. An instruction is mapped to a subset of the functional units based upon the instruction type (that is, ALU, Memory, Integer, and so on). Then, based on the position of the instruction within the instruction group presented for dispersal, the instruction is mapped to a particular functional unit within that subset.
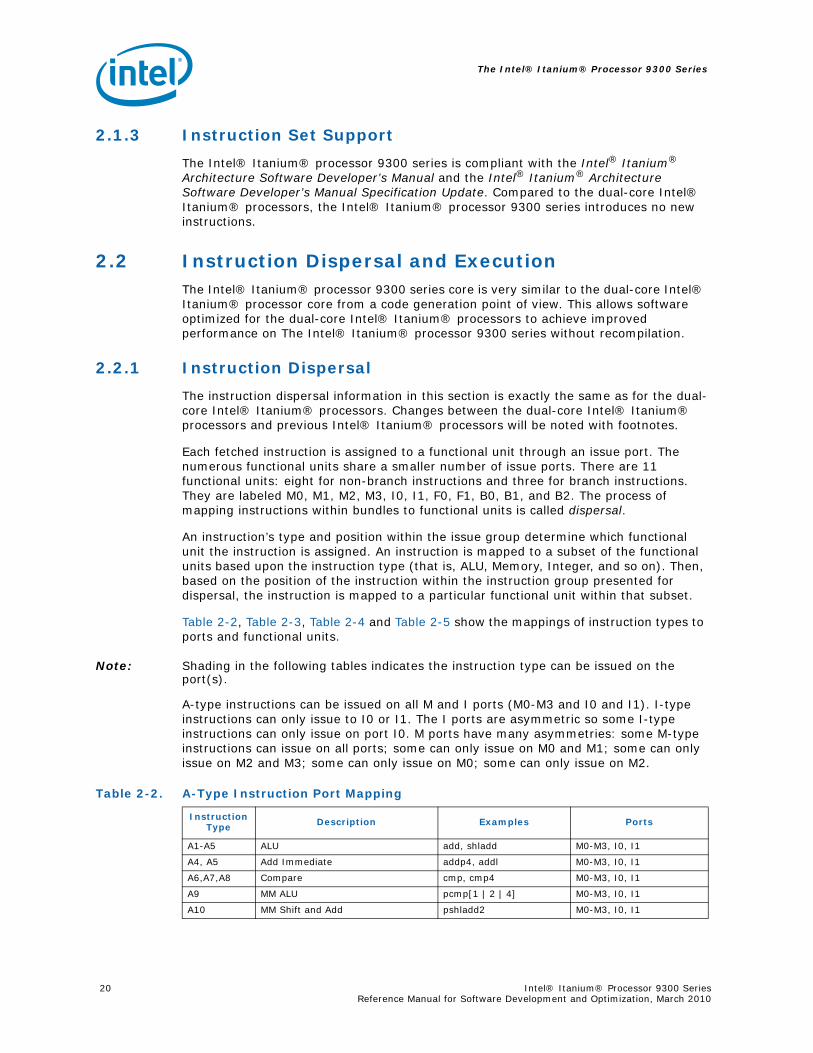
Table 2-2, Table 2-3, Table 2-4 and Table 2-5 show the mappings of instruction types to ports and functional units.
Note: Shading in the following tables indicates the instruction type can be issued on the port(s).
A-type instructions can be issued on all M and I ports (M0-M3 and I0 and I1). I-type instructions can only issue to I0 or I1. The I ports are asymmetric so some I-type instructions can only issue on port I0. M ports have many asymmetries: some M-type instructions can issue on all ports; some can only issue on M0 and M1; some can only issue on M2 and M3; some can only issue on M0; some can only issue on M2.
Table 2-2. A-Type Instruction Port Mapping
Instruction Type Description Examples Ports
A1-A5 ALU add, shladd M0-M3, I0, I1
A4, A5 Add Immediate addp4, addl M0-M3, I0, I1
A6,A7,A8 Compare cmp, cmp4 M0-M3, I0, I1
A9 MM ALU pcmp[1 | 2 | 4] M0-M3, I0, I1
A10 MM Shift and Add pshladd2 M0-M3, I0, I1
The Intel® Itanium® Processor 9300 Series
Intel® Itanium® Processor 9300 Series 21Reference Manual for Software Development and Optimization, March 2010
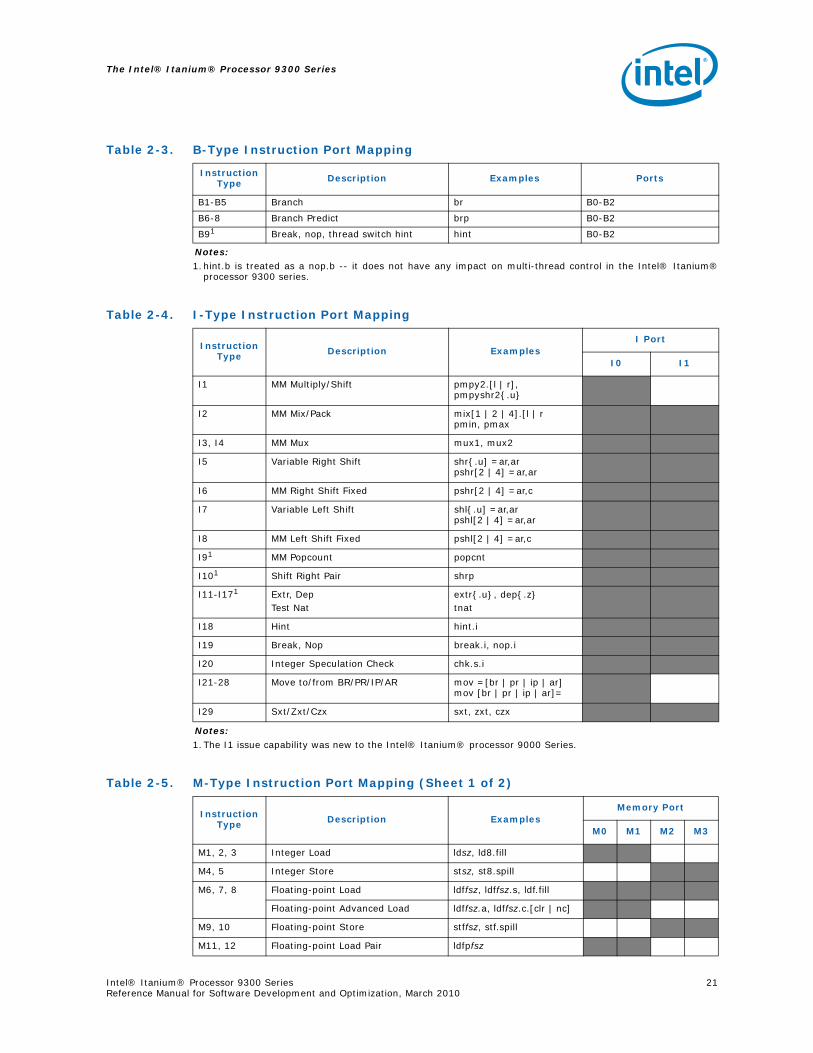
Table 2-3. B-Type Instruction Port Mapping
Instruction Type Description Examples Ports
B1-B5 Branch br B0-B2
B6-8 Branch Predict brp B0-B2
B91
Notes:1.hint.b is treated as a nop.b -- it does not have any impact on multi-thread control in the Intel® Itanium®
processor 9300 series.
Break, nop, thread switch hint hint B0-B2
Table 2-4. I-Type Instruction Port Mapping
Instruction Type Description Examples
I Port
I0 I1
I1 MM Multiply/Shift pmpy2.[l | r], pmpyshr2{.u}
I2 MM Mix/Pack mix[1 | 2 | 4].[l | rpmin, pmax
I3, I4 MM Mux mux1, mux2
I5 Variable Right Shift shr{.u] =ar,arpshr[2 | 4] =ar,ar
I6 MM Right Shift Fixed pshr[2 | 4] =ar,c
I7 Variable Left Shift shl{.u] =ar,arpshl[2 | 4] =ar,ar
I8 MM Left Shift Fixed pshl[2 | 4] =ar,c
I91
Notes:1.The I1 issue capability was new to the Intel® Itanium® processor 9000 Series.
MM Popcount popcnt
I101 Shift Right Pair shrp
I11-I171 Extr, Dep Test Nat
extr{.u}, dep{.z}tnat
I18 Hint hint.i
I19 Break, Nop break.i, nop.i
I20 Integer Speculation Check chk.s.i
I21-28 Move to/from BR/PR/IP/AR mov =[br | pr | ip | ar]mov [br | pr | ip | ar]=
I29 Sxt/Zxt/Czx sxt, zxt, czx
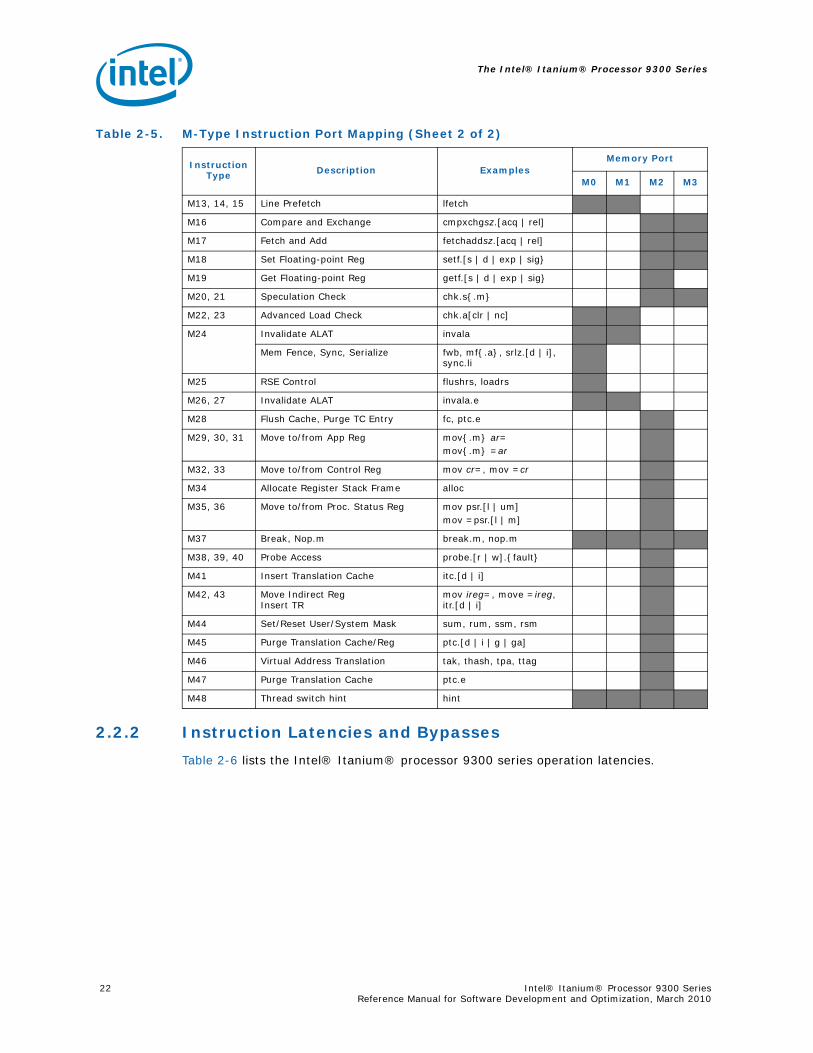
Table 2-5. M-Type Instruction Port Mapping (Sheet 1 of 2)
Instruction Type Description Examples
Memory Port
M0 M1 M2 M3
M1, 2, 3 Integer Load ldsz, ld8.fill
M4, 5 Integer Store stsz, st8.spill
M6, 7, 8 Floating-point Load ldffsz, ldffsz.s, ldf.fill
Floating-point Advanced Load ldffsz.a, ldffsz.c.[clr | nc]
M9, 10 Floating-point Store stffsz, stf.spill
M11, 12 Floating-point Load Pair ldfpfsz
The Intel® Itanium® Processor 9300 Series
22 Intel® Itanium® Processor 9300 Series Reference Manual for Software Development and Optimization, March 2010
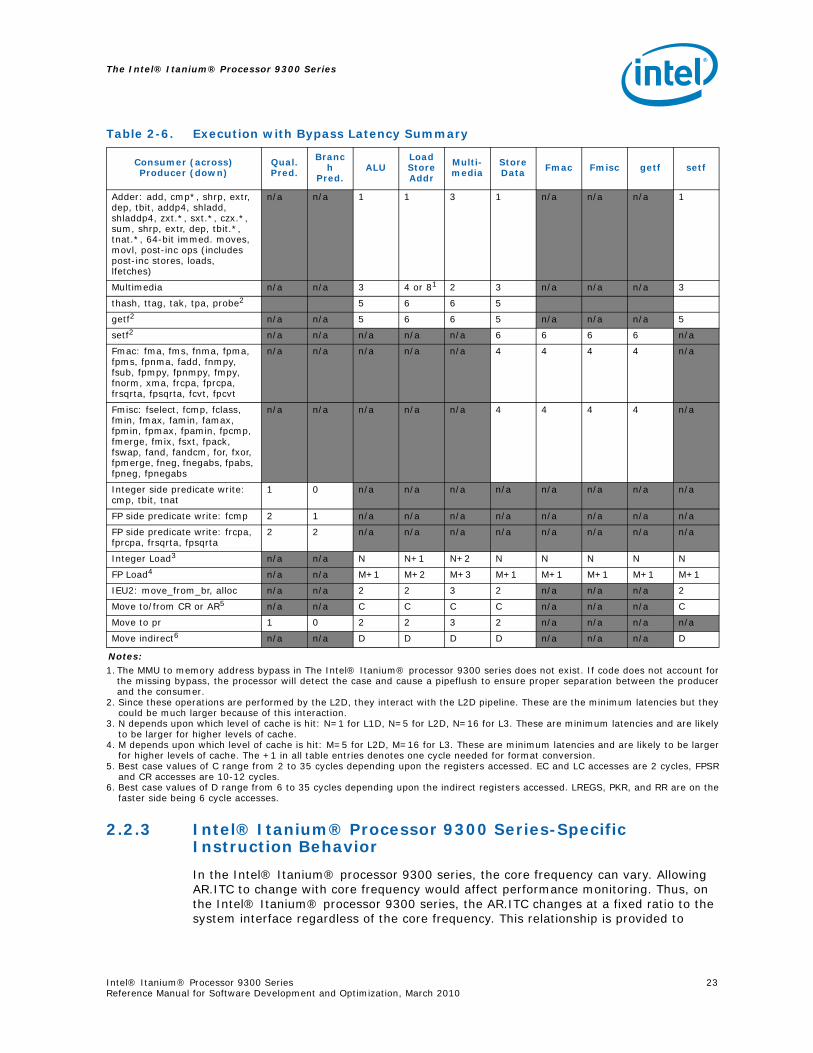
2.2.2 Instruction Latencies and Bypasses
Table 2-6 lists the Intel® Itanium® processor 9300 series operation latencies.
M13, 14, 15 Line Prefetch lfetch
M16 Compare and Exchange cmpxchgsz.[acq | rel]
M17 Fetch and Add fetchaddsz.[acq | rel]
M18 Set Floating-point Reg setf.[s | d | exp | sig}
M19 Get Floating-point Reg getf.[s | d | exp | sig}
M20, 21 Speculation Check chk.s{.m}
M22, 23 Advanced Load Check chk.a[clr | nc]
M24 Invalidate ALAT invala
Mem Fence, Sync, Serialize fwb, mf{.a}, srlz.[d | i], sync.li
M25 RSE Control flushrs, loadrs
M26, 27 Invalidate ALAT invala.e
M28 Flush Cache, Purge TC Entry fc, ptc.e
M29, 30, 31 Move to/from App Reg mov{.m} ar=mov{.m} =ar
M32, 33 Move to/from Control Reg mov cr=, mov =cr
M34 Allocate Register Stack Frame alloc
M35, 36 Move to/from Proc. Status Reg mov psr.[l | um]mov =psr.[l | m]
M37 Break, Nop.m break.m, nop.m
M38, 39, 40 Probe Access probe.[r | w].{fault}
M41 Insert Translation Cache itc.[d | i]
M42, 43 Move Indirect RegInsert TR
mov ireg=, move =ireg, itr.[d | i]
M44 Set/Reset User/System Mask sum, rum, ssm, rsm
M45 Purge Translation Cache/Reg ptc.[d | i | g | ga]
M46 Virtual Address Translation tak, thash, tpa, ttag
M47 Purge Translation Cache ptc.e
M48 Thread switch hint hint
Table 2-5. M-Type Instruction Port Mapping (Sheet 2 of 2)
Instruction Type Description Examples
Memory Port
M0 M1 M2 M3
The Intel® Itanium® Processor 9300 Series
Intel® Itanium® Processor 9300 Series 23Reference Manual for Software Development and Optimization, March 2010
2.2.3 Intel® Itanium® Processor 9300 Series-Specific Instruction Behavior
In the Intel® Itanium® processor 9300 series, the core frequency can vary. Allowing AR.ITC to change with core frequency would affect performance monitoring. Thus, on the Intel® Itanium® processor 9300 series, the AR.ITC changes at a fixed ratio to the system interface regardless of the core frequency. This relationship is provided to
Table 2-6. Execution with Bypass Latency Summary
Consumer (across)Producer (down)
Qual.Pred.
Branch
Pred.ALU
Load Store Addr
Multi-media
Store Data Fmac Fmisc getf setf
Adder: add, cmp*, shrp, extr, dep, tbit, addp4, shladd, shladdp4, zxt.*, sxt.*, czx.*, sum, shrp, extr, dep, tbit.*, tnat.*, 64-bit immed. moves, movl, post-inc ops (includes post-inc stores, loads, lfetches)
n/a n/a 1 1 3 1 n/a n/a n/a 1
Multimedia n/a n/a 3 4 or 81 2 3 n/a n/a n/a 3
thash, ttag, tak, tpa, probe2 5 6 6 5
getf2 n/a n/a 5 6 6 5 n/a n/a n/a 5
setf2 n/a n/a n/a n/a n/a 6 6 6 6 n/a
Fmac: fma, fms, fnma, fpma, fpms, fpnma, fadd, fnmpy, fsub, fpmpy, fpnmpy, fmpy, fnorm, xma, frcpa, fprcpa, frsqrta, fpsqrta, fcvt, fpcvt
n/a n/a n/a n/a n/a 4 4 4 4 n/a
Fmisc: fselect, fcmp, fclass, fmin, fmax, famin, famax, fpmin, fpmax, fpamin, fpcmp, fmerge, fmix, fsxt, fpack, fswap, fand, fandcm, for, fxor, fpmerge, fneg, fnegabs, fpabs, fpneg, fpnegabs
n/a n/a n/a n/a n/a 4 4 4 4 n/a
Integer side predicate write: cmp, tbit, tnat
1 0 n/a n/a n/a n/a n/a n/a n/a n/a
FP side predicate write: fcmp 2 1 n/a n/a n/a n/a n/a n/a n/a n/a
FP side predicate write: frcpa, fprcpa, frsqrta, fpsqrta
2 2 n/a n/a n/a n/a n/a n/a n/a n/a
Integer Load3 n/a n/a N N+1 N+2 N N N N N
FP Load4 n/a n/a M+1 M+2 M+3 M+1 M+1 M+1 M+1 M+1
IEU2: move_from_br, alloc n/a n/a 2 2 3 2 n/a n/a n/a 2
Move to/from CR or AR5 n/a n/a C C C C n/a n/a n/a C
Move to pr 1 0 2 2 3 2 n/a n/a n/a n/a
Move indirect6 n/a n/a D D D D n/a n/a n/a D
Notes:1.The MMU to memory address bypass in The Intel® Itanium® processor 9300 series does not exist. If code does not account for
the missing bypass, the processor will detect the case and cause a pipeflush to ensure proper separation between the producerand the consumer.
2. Since these operations are performed by the L2D, they interact with the L2D pipeline. These are the minimum latencies but theycould be much larger because of this interaction.
3. N depends upon which level of cache is hit: N=1 for L1D, N=5 for L2D, N=16 for L3. These are minimum latencies and are likelyto be larger for higher levels of cache.
4. M depends upon which level of cache is hit: M=5 for L2D, M=16 for L3. These are minimum latencies and are likely to be largerfor higher levels of cache. The +1 in all table entries denotes one cycle needed for format conversion.
5. Best case values of C range from 2 to 35 cycles depending upon the registers accessed. EC and LC accesses are 2 cycles, FPSRand CR accesses are 10-12 cycles.
6. Best case values of D range from 6 to 35 cycles depending upon the indirect registers accessed. LREGS, PKR, and RR are on thefaster side being 6 cycle accesses.

The Intel® Itanium® Processor 9300 Series
24 Intel® Itanium® Processor 9300 Series Reference Manual for Software Development and Optimization, March 2010
software through PAL. The Intel® Itanium® processor 9300 series ensures that multiple reads of AR.ITC observe unique increasing values, though, this property of AR.ITC is not required of the architecture.
On the Intel® Itanium® processor 9300 series, the fc.i instruction behavior is identical to the fc instruction.
The Intel® Itanium® processor 9300 series is the first Intel® Itanium® processor to implement the Resource Utilization Counter (AR.RUC) described in the Intel® Itanium® Architecture Software Developer’s Manual. The AR.RUC resource indicates the number of cycles that each logical processor (hardware thread) is being executed. This is useful when Multi-Threading is enabled or when a Virtual Machine Monitor (VMM) is being used. Virtual processors may be inactive when not scheduled to run by the VMM. The Resource Utilization Counter is a 64-bit register which provides an estimate of the portion of resources used by a logical or virtual processor with respect to all resources provided by the underlying physical processor.
In a given time interval, the difference in the RUC values for all of the logical or virtual processors on a given physical processor add up to approximately the difference seen in the ITC on that physical processor for that same interval.
2.2.4 Branch Prediction
The Intel® Itanium® processor 9300 series branch prediction is the same as on the dual-core Intel® Itanium® processors.
2.2.5 Caches and Cache Management Changes
The Intel® Itanium® processor 9300 series, like the previous Intel® Itanium® processors, supports three levels of on-chip cache. Each core contains a complete cache hierarchy, with nearly 6.7 Mbytes per core, for a total of nearly 27 Mbytes of processor cache.
Table 2-7. Intel® Itanium® Processor 9300 Series Cache Hierarchy Summary
CacheData Types
Supported
Write Through/
Write Back
Data Array Size
Line Size Ways Index Queuing
Minimum/Typical Latency
L1D Integer WT 16 KB 64 Bytes 4 VA[11:6] 8 Fills 1/1
L1I Instruction NA 16 KB 64 Bytes 4 VA[11:6] 1 Demand + 7
Prefetch Fills
1/1
L2D Integer, Floating
Point
WB 256 KB 128 Bytes 8 PA[14:7] 32 OzQ/ 16 Fills
5/11
L2I Instruction NA 512 KByte 128 Bytes 8 PA[16:7] (CHECK)
8 7/10
L3 Integer, Floating Point,
Instruction
WB 6 MByte 128 Bytes 12 PA[19:7] (CHECEK)
8 15/22 (CHECK)

The Intel® Itanium® Processor 9300 Series
Intel® Itanium® Processor 9300 Series 25Reference Manual for Software Development and Optimization, March 2010
2.2.5.1 Request Tracking
All L2I and L2D requests are allocated to one of 16 request buffers. Requests are sent to the to the L3 cache and system from these buffers by the tracking logic. A modified L2D victim or partial write may be allocated to one of 8 write buffers.
For increased performance of uncacheable references to frame buffers, the write coalescing (WC) memory type coalesces streams of data writes into a single larger bus write transaction. On the Intel® Itanium® processor 9300 series, WC loads are performed directly from memory and not from the coalescing buffers.
On the Intel® Itanium® processor 9300 series, a separate 4-entry, 128-byte buffer (WCB) is used for WC store accesses exclusively. Each byte in the line has a valid bit. If all the valid bits are true, then the line is said to be full and will be evicted (flushed) by the processor.
The Intel® Itanium® processor 9300 series has four WC buffers for each core which gives a total of sixteen WC buffers on the processor. Each thread can use up to four WC buffers where a pair of threads on the same core share these four buffers. A partially filled WCB can be evicted when the processor issues a WC write that does not match any WCB and all WCB are valid.
There is no method for the user to write WC entries in such a way to ensure eviction order. If a flush is required, the first buffer not currently flushing begins to flush regardless of the address. Once that buffer starts flushing, if there are holes, the buffer will be flushed from lower address to higher address.
2.3 Intel® Itanium® Processor 9300 Series Multi-ThreadingThe multiple thread concept starts with the idea that the processor has some resources that cannot be effectively utilized by a single thread. Therefore, sharing under-utilized resources between multiple threads will increase utilization and performance. The Intel® Itanium® processor 9300 series multi-threading implementation duplicates and shares resources to create two logical processors. All architectural state and some micro-architectural state is duplicated.
The Intel® Itanium® processor 9300 series implementation of multi-threading is very similar to that on the dual-core Intel® Itanium® processors; however, improvements have been made on the Intel® Itanium® processor 9300 series. In particular, The Intel® Itanium® processor 9300 series has added two new thread switch events:
1) L2 Cache Return event: An L2 cache return can trigger thread switch events subject to thread urgency comparisons. This event increases the thread’s urgency.
2) ALAT invalidation event: The ALAT switch event has an arming mechanism which is set when a hint @pause retires for that thread prior to switching away and which is cleared when a switch to that thread occurs. Once the inactive thread see an ALAT invalidation with the arming mechanism engaged, a thread switch is generated. This switch event does not pay attention to the urgency comparison. This event is intended to help performance of software semaphores. To take advantage of this event it software could use a code sequence similar to the following sample code:
invala
;;

The Intel® Itanium® Processor 9300 Series
26 Intel® Itanium® Processor 9300 Series Reference Manual for Software Development and Optimization, March 2010
ld.a rX = [rLockAddr]
;;
loop: ld.c.nc rX = [rLockAddr]
cmp.eq pLockFree, pLockBusy = LockFreeValue, rX
;;
(pLockBusy) hint @pause
(pLockBusy) br loop
;;
acquire_lock()
In addition, The Intel® Itanium® processor 9300 series improves its behavior in response to a L3 cache return.
2.4 Quad CoresThe Intel® Itanium® processor 9300 series is the first quad-core Intel® Itanium® processor. The four cores attach to the system interface through the cross-bar router, which provides a low-latency path for each core to initiate and respond to system events.
2.5 Intel® Virtualization TechnologyThe Intel® Itanium® processor 9300 series is the third Intel® Itanium® processor to implement Intel® Virtualization Technology, described in the Intel® Itanium® Architecture Software Developer’s Manual.
The Intel® Itanium® processor 9300 series provides enhanced Intel® Virtualization Technology (Intel® VT-i2) and Intel® Virtualization Technology for directed I/O (Intel®
VT-d).
The Intel® Itanium® processor 9300 series core supports all of the baseline virtualization support provided in the dual-core Intel® Itanium® processors. In addition, it implements certain hardware acceleration modes and provides a new Interruption Instruction Bundle control register. The additional virtualization support attempts to further reduce the virtualization overhead. The Interruption Instruction Bundle or CR.IIB is defined to be two new implementation-specific control registers to capture the instruction bundle on architectural exceptions. CR26/27 (CR.IIB0, CR.IIB1) are defined as the Interruption Instruction Bundle (IIB) control registers. Whenever an architectural exception occurs with PSR.ic=1, the entire bundle is captured in this pair of IIB registers. Bits 63:0 and bits 127:64 of the 128-bit bundle are captured in CR26 and 27 respectively.
2.6 Tips and Tricks
2.6.1 Instruction Cache Coherence Optimization
Coherence requests of the L1I and L2I caches will invalidate the line if it is in the cache. The Intel® Itanium® processor 9300 series allows instruction requests on the system

The Intel® Itanium® Processor 9300 Series
Intel® Itanium® Processor 9300 Series 27Reference Manual for Software Development and Optimization, March 2010
interface to be filtered such that they will not initiate coherence requests of the L1I and L2I caches. This will allow instructions to be cached at the L1I and L2I levels across multiple processors in a coherent domain. This optimization is enabled by default, but may be disabled by PAL_SET_PROC_FEATURES bit 5 of the Intel® Itanium® processor 9300 series feature_set = 20.
2.7 IA-32 ExecutionIA-32 execution on the Intel® Itanium® processor 9300 series is enabled supported with PAL-based IA-32 execution and IA-32 Execution Layer (IA-32 EL).
PAL-based IA-32 execution is available after PAL_COPY_PAL is called and provides IA-32 execution support before the OS has booted. PAL-based IA-32 execution is not supported in an OS environment.
IA-32 EL is a software layer that is currently shipping with Intel® Itanium® architecture-based operating systems, which converts IA-32 instructions into Intel® Itanium® processor instructions via dynamic translation. IA-32 EL is OS-based and is only available after an OS has booted.
Further details on operating system support and functionality of IA-32 EL can be found at http://www.intel.com.
2.8 Brand InformationThe PAL_BRAND_INFO procedure, along with PAL_PROC_GET_FEATURES, allows software to obtain processor branding and feature information. Details on the above functions can be found in the Intel® Itanium® Architecture Software Developer’s Manual.Below is the table of the return values for PAL_BRAND_INFO. The Intel® Itanium® processor 9300 series will implement all three; however, previous Intel® Itanium® processors are all unable to retrieve the processor frequency, so requests for these fields will return -6, information not available. Also, previous Intel® Itanium® processors cannot return system bus frequency speed. Implementation-specific values are expected to start at value 16 and continue until an invalid argument (-2) is returned.
Table 2-8. PAL_BRAND_INFO Return Values
Value Definition
19 NULL (0)-terminated ASCII string corresponding to the processor stepping will be returned in the brand_info return argument.
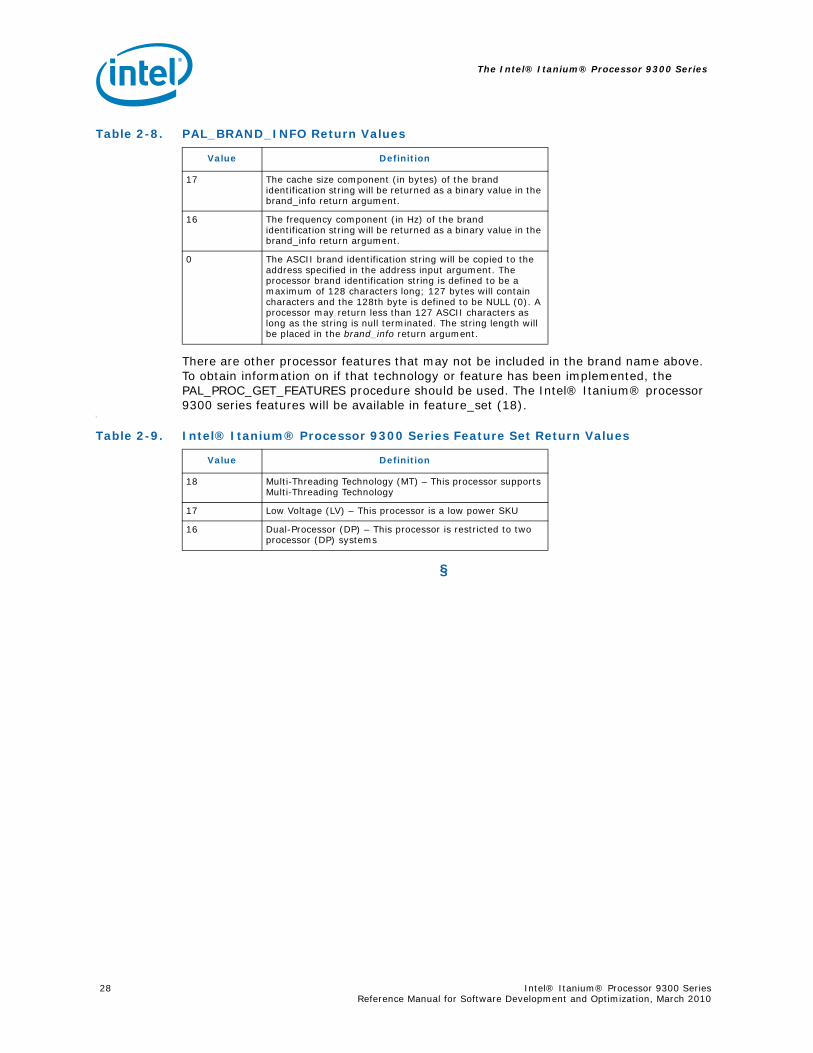
The Intel® Itanium® Processor 9300 Series
28 Intel® Itanium® Processor 9300 Series Reference Manual for Software Development and Optimization, March 2010
There are other processor features that may not be included in the brand name above. To obtain information on if that technology or feature has been implemented, the PAL_PROC_GET_FEATURES procedure should be used. The Intel® Itanium® processor 9300 series features will be available in feature_set (18).
\
§
17 The cache size component (in bytes) of the brand identification string will be returned as a binary value in the brand_info return argument.
16 The frequency component (in Hz) of the brand identification string will be returned as a binary value in the brand_info return argument.
0 The ASCII brand identification string will be copied to the address specified in the address input argument. The processor brand identification string is defined to be a maximum of 128 characters long; 127 bytes will contain characters and the 128th byte is defined to be NULL (0). A processor may return less than 127 ASCII characters as long as the string is null terminated. The string length will be placed in the brand_info return argument.
Table 2-8. PAL_BRAND_INFO Return Values
Value Definition
Table 2-9. Intel® Itanium® Processor 9300 Series Feature Set Return Values
Value Definition
18 Multi-Threading Technology (MT) – This processor supports Multi-Threading Technology
17 Low Voltage (LV) – This processor is a low power SKU
16 Dual-Processor (DP) – This processor is restricted to two processor (DP) systems
Performance Monitoring
Intel® Itanium® Processor 9300 Series 29Reference Manual for Software Development and Optimization, March 2010
3 Performance Monitoring
3.1 IntroductionThis chapter defines the performance monitoring features of the Intel® Itanium® processor 9300 series. The Intel® Itanium® processor 9300 series provides 12 48-bit performance counters per each thread, 200+ monitorable events, and several advanced monitoring capabilities. This chapter outlines the targeted performance monitor usage models and defines the software interface and programming model.
The Intel® Itanium® architecture provides architected mechanisms that allow software to actively and directly manage performance critical processor resources such as branch prediction structures, processor data and instruction caches, virtual memory translation structures, and more. To achieve the highest performance levels, dynamic processor behavior should be able to be monitored and fed back into the code generation process to better encode observed run-time behavior or to expose higher levels of instruction level parallelism. These measurements will be critical for understanding the behavior of compiler optimizations, the use of architectural features such as speculation and predication, or the effectiveness of microarchitectural structures such as the ALAT, the caches, and the TLBs. These measurements will provide the data to drive application tuning and future processor, compiler, and operating system designs.
The remainder of the document is split into the following sections:
• Section 3.2, “Performance Monitor Programming Models” discusses how performance monitors are used, and presents various Intel® Itanium® processor 9300 series performance monitoring programming models.
• Section 3.3, “Performance Monitor State” defines the Intel® Itanium® processor 9300 series specific performance monitoring features, structures and registers.
Following chapter, Chapter 4 would provide an overview of the Intel® Itanium® processor 9300 series event which can be monitored.
3.2 Performance Monitor Programming ModelsThis section introduces the Intel® Itanium® processor 9300 series performance monitoring features from a programming model point of view and describes how the different event monitoring mechanisms can be used effectively. The Intel® Itanium® processor 9300 series performance monitor architecture focuses on the following two usage models:
• Workload Characterization: The first step in any performance analysis is to understand the performance characteristics of the workload under study. Section 3.2.1, “Workload Characterization” discusses the Intel® Itanium® processor 9300 series support for workload characterization.
• Profiling: Profiling is used by application developers and profile-guided compilers. Application developers are interested in identifying performance bottlenecks and relating them back to their code. Their primary objective is to understand which program location caused performance degradation at the module, function, and basic block level. For optimization of data placement and the analysis of critical loops, instruction level granularity is desirable. Profile-guided compilers that use
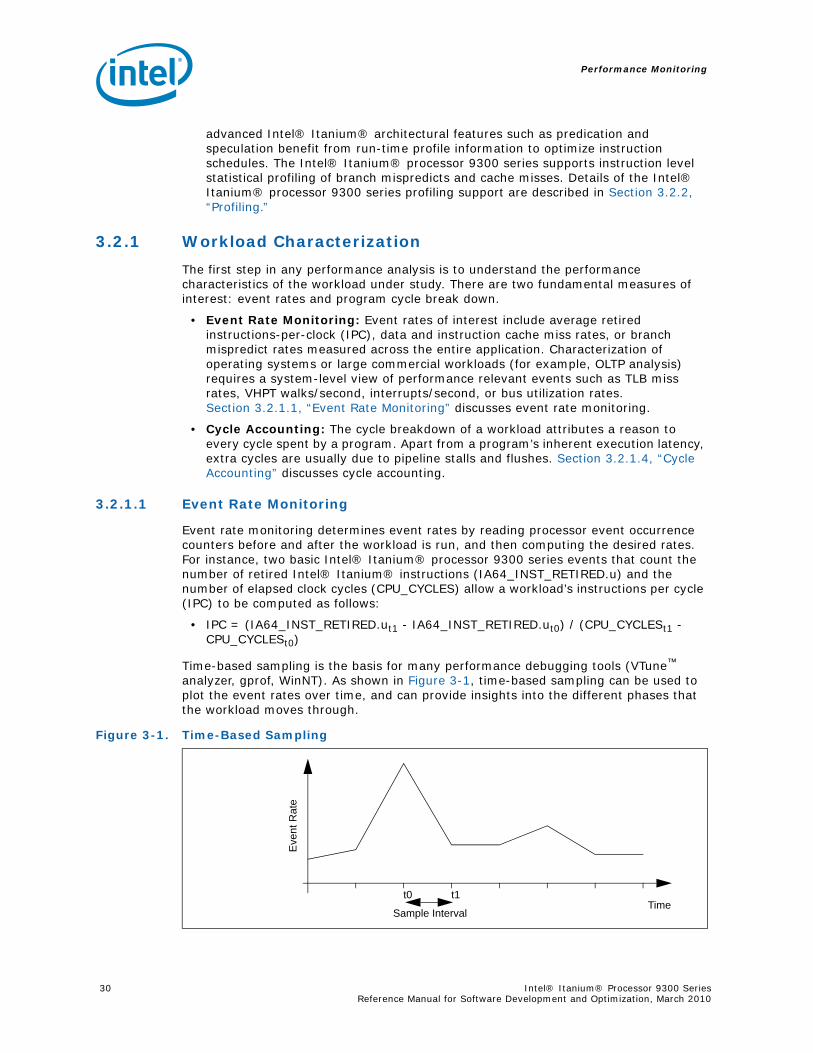
Performance Monitoring
30 Intel® Itanium® Processor 9300 Series Reference Manual for Software Development and Optimization, March 2010
advanced Intel® Itanium® architectural features such as predication and speculation benefit from run-time profile information to optimize instruction schedules. The Intel® Itanium® processor 9300 series supports instruction level statistical profiling of branch mispredicts and cache misses. Details of the Intel® Itanium® processor 9300 series profiling support are described in Section 3.2.2, “Profiling.”
3.2.1 Workload Characterization
The first step in any performance analysis is to understand the performance characteristics of the workload under study. There are two fundamental measures of interest: event rates and program cycle break down.
• Event Rate Monitoring: Event rates of interest include average retired instructions-per-clock (IPC), data and instruction cache miss rates, or branch mispredict rates measured across the entire application. Characterization of operating systems or large commercial workloads (for example, OLTP analysis) requires a system-level view of performance relevant events such as TLB miss rates, VHPT walks/second, interrupts/second, or bus utilization rates. Section 3.2.1.1, “Event Rate Monitoring” discusses event rate monitoring.
• Cycle Accounting: The cycle breakdown of a workload attributes a reason to every cycle spent by a program. Apart from a program’s inherent execution latency, extra cycles are usually due to pipeline stalls and flushes. Section 3.2.1.4, “Cycle Accounting” discusses cycle accounting.
3.2.1.1 Event Rate Monitoring
Event rate monitoring determines event rates by reading processor event occurrence counters before and after the workload is run, and then computing the desired rates. For instance, two basic Intel® Itanium® processor 9300 series events that count the number of retired Intel® Itanium® instructions (IA64_INST_RETIRED.u) and the number of elapsed clock cycles (CPU_CYCLES) allow a workload’s instructions per cycle (IPC) to be computed as follows:
• IPC = (IA64_INST_RETIRED.ut1 - IA64_INST_RETIRED.ut0) / (CPU_CYCLESt1 - CPU_CYCLESt0)
Time-based sampling is the basis for many performance debugging tools (VTune™
analyzer, gprof, WinNT). As shown in Figure 3-1, time-based sampling can be used to plot the event rates over time, and can provide insights into the different phases that the workload moves through.
Figure 3-1. Time-Based Sampling
TimeSample Interval
t1t0
Eve
nt R
ate
Performance Monitoring
Intel® Itanium® Processor 9300 Series 31Reference Manual for Software Development and Optimization, March 2010
On the Intel® Itanium® processor 9300 series, many event types, for example, TLB misses or branch mispredicts are limited to a rate of one per clock cycle. These are referred to as “single occurrence” events. However, in the Intel® Itanium® processor 9300 series, multiple events of the same type may occur in the same clock. We refer to such events as “multi-occurrence” events. An example of a multi-occurrence events on the Intel® Itanium® processor 9300 series is data cache read misses (up to two per clock). Multi-occurrence events, such as the number of entries in the memory request queue, can be used to derive the average number and average latency of memory accesses. The next two sections describe the basic Intel® Itanium® processor 9300 series mechanisms for monitoring single and multi-occurrence events.
3.2.1.2 Single Occurrence Events and Duration Counts
A single occurrence event can be monitored by any of the Intel® Itanium® processor 9300 series performance counters. For all single occurrence events, a counter is incremented by up to one per clock cycle. Duration counters that count the number of clock cycles during which a condition persists are considered “single occurrence” events. Examples of single occurrence events on the Intel® Itanium® processor 9300 series are TLB misses, branch mispredictions, and cycle-based metrics.
3.2.1.3 Multi-Occurrence Events, Thresholding, and Averaging
Events that, due to hardware parallelism, may occur at rates greater than one per clock cycle are termed “multi-occurrence” events. Examples of such events on the Intel® Itanium® processor 9300 series are retired instructions or the number of live entries in the memory request queue.
The Intel® Itanium® processor 9300 series multi-occurrence counters include thresholding capabilities and can be used to plot an event distribution histogram. When a non-zero threshold is specified, the monitor is incremented by one in every cycle in which the observed event count exceeds that programmed threshold. This allows questions such as “For how many cycles did the memory request queue contain more than two entries?” or “During how many cycles did the machine retire more than three instructions?” to be answered. This capability allows microarchitectural buffer sizing experiments to be supported by real measurements. By running a benchmark with different threshold values, a histogram can be drawn up that may help to identify the performance “knee” at a certain buffer size.
For overlapping concurrent events, such as pending memory operations, the average number of concurrently outstanding requests and the average number of cycles that requests were pending are of interest. To calculate the average number or latency of multiple outstanding requests in the memory queue, we need to know the total number of requests (ntotal) and the number of live requests per cycle (nlive/cycle). By summing up the live requests (nlive/cycle) using a multi-occurrence counter, Σnlive is directly measured by hardware. We can now calculate the average number of requests and the average latency as follows:
• Average outstanding requests/cycle = Σnlive/ Δt
• Average latency per request = Σnlive / ntotal
An example of this calculation is given in Table 3-1 in which the average outstanding requests/cycle = 15/8 = 1.825, and the average latency per request = 15/5 = 3 cycles.

Performance Monitoring
32 Intel® Itanium® Processor 9300 Series Reference Manual for Software Development and Optimization, March 2010
The Intel® Itanium® processor 9300 series provides the following capabilities to support event rate monitoring:
• Clock cycle counter
• Retired instruction counter
• Event occurrence and duration counters
• Multi-occurrence counters with thresholding capability
3.2.1.4 Cycle Accounting
While event rate monitoring counts the number of events, it does not tell us whether the observed events are contributing to a performance problem. A commonly used strategy is to plot multiple event rates and correlate them with the measured instructions per cycle (IPC) rate. If a low IPC occurs concurrently with a peak of cache miss activity, chances are that cache misses are causing a performance problem. To eliminate such guess work, the Intel® Itanium® processor 9300 series provides a set of cycle accounting monitors, that break down the number of cycles that are lost due to various kinds of microarchitectural events. As shown in Figure 3-2, this lets us account for every cycle spent by a program and therefore provides insight into an application’s microarchitectural behavior. Note that cycle accounting is different from simple stall or flush duration counting. Cycle accounting is based on the machine’s actual stall and flush conditions, and accounts for overlapped pipeline delays, while simple stall or flush duration counters do not. Cycle accounting determines a program’s cycle breakdown by stall and flush reasons, while simple duration counters are useful in determining cumulative stall or flush latencies.
The Intel® Itanium® processor 9300 series cycle accounting monitors account for all major single and multi-cycle stall and flush conditions. Overlapping stall and flush conditions are prioritized in reverse pipeline order, that is, delays that occur later in the
Table 3-1. Average Latency per Request and Requests per CycleCalculation Example
Time [Cycles] 1 2 3 4 5 6 7 8
# Requests In 1 1 1 1 1 0 0 0
# Requests Out 0 0 0 1 1 1 1 1
nlive1 2 3 3 3 2 1 0
Σnlive1 3 6 9 12 14 15 15
ntotal1 2 3 4 5 5 5 5
Figure 3-2. Intel® Itanium® Processor Family Cycle Accounting
001229
30% 25%
100% Execution Time
Inherent ProgramExecution Latency
Data AccessCycles
BranchMispredicts
I FetchStalls Other Stalls
20% 15% 10%
Performance Monitoring
Intel® Itanium® Processor 9300 Series 33Reference Manual for Software Development and Optimization, March 2010
pipe and that overlap with earlier stage delays are reported as being caused later in the pipeline. The six back-end stall and flush reasons are prioritized in the following order:
1. Exception/Interruption Cycle: cycles spent flushing the pipe due to interrupts and exceptions.
2. Branch Mispredict Cycle: cycles spent flushing the pipe due to branch mispredicts.
3. Data/FPU Access Cycle: memory pipeline full, data TLB stalls, load-use stalls, and access to floating-point unit.
4. Execution Latency Cycle: scoreboard and other register dependency stalls.
5. RSE Active Cycle: RSE spill/fill stall.
6. Front End Stalls: stalls due to the back-end waiting on the front end.
Additional front-end stall counters are available which detail seven possible reasons for a front-end stall to occur. However, the back-end and front-end stall events should not be compared since they are counted in different stages of the pipeline.
For details, refer to Section 4.6
3.2.2 Profiling
Profiling is used by application developers, profile-guided compilers, optimizing linkers, and run-time systems. Application developers are interested in identifying performance bottlenecks and relating them back to their source code. Based on profile feedback, developers can make changes to the high-level algorithms and data structures of the program. Compilers can use profile feedback to optimize instruction schedules by employing advanced Intel® Itanium® architectural features such as predication and speculation.
To support profiling, performance monitor counts have to be associated with program locations. The following mechanisms are supported directly by the performance monitors on the IIntel® Itanium® processor 9300 series:
• Program Counter Sampling
• Miss Event Address Sampling: Intel® Itanium® processor 9300 series event address registers (EARs) provide sub-pipeline length event resolution for performance critical events (instruction and data caches, branch mispredicts, and instruction and data TLBs).
• Event Qualification: constrains event monitoring to a specific instruction address range, to certain opcodes or privilege levels.
These profiling features are presented in the next three subsections.
3.2.2.1 Program Counter Sampling
Application tuning tools like VTune analyzer and gprof use time-based or event-based sampling of the program counter and other event counters to identify performance critical functions and basic blocks. As shown in Figure 3-3, the sampled points can be histogrammed by instruction addresses. For application tuning, statistical sampling techniques have been very successful, because the programmer can rapidly identify code hot spots in which the program spends a significant fraction of its time, or where certain event counts are high.
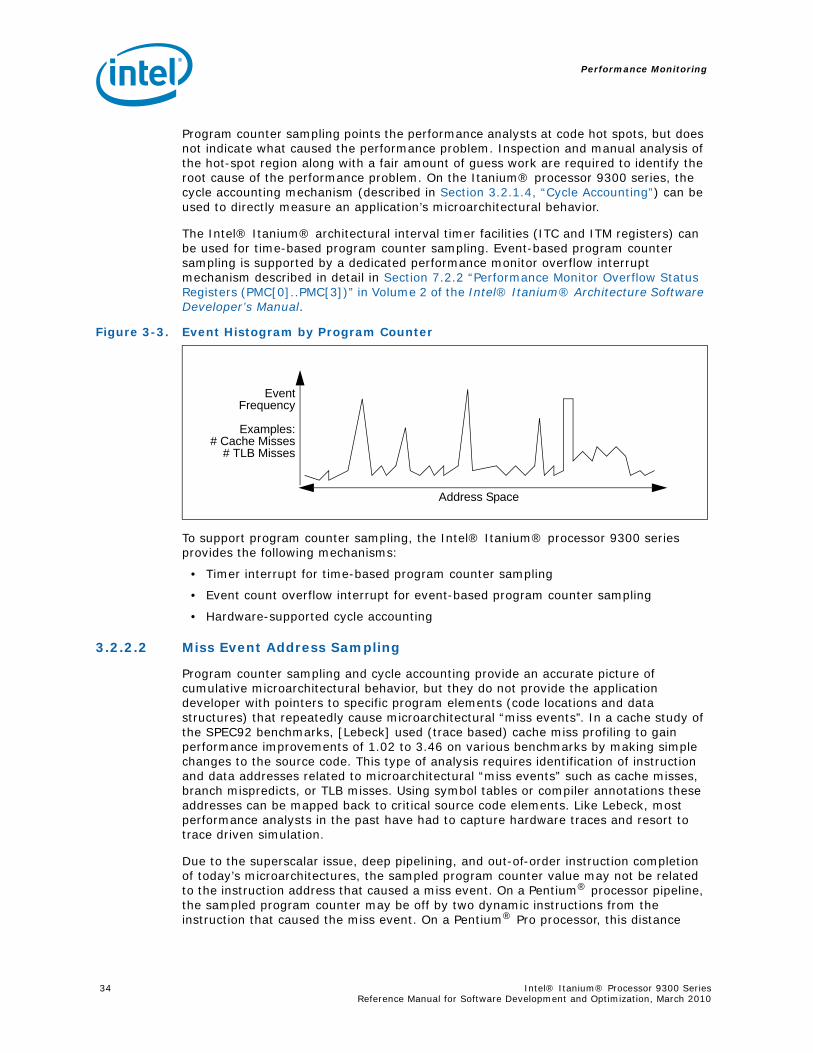
Performance Monitoring
34 Intel® Itanium® Processor 9300 Series Reference Manual for Software Development and Optimization, March 2010
Program counter sampling points the performance analysts at code hot spots, but does not indicate what caused the performance problem. Inspection and manual analysis of the hot-spot region along with a fair amount of guess work are required to identify the root cause of the performance problem. On the Itanium® processor 9300 series, the cycle accounting mechanism (described in Section 3.2.1.4, “Cycle Accounting”) can be used to directly measure an application’s microarchitectural behavior.
The Intel® Itanium® architectural interval timer facilities (ITC and ITM registers) can be used for time-based program counter sampling. Event-based program counter sampling is supported by a dedicated performance monitor overflow interrupt mechanism described in detail in Section 7.2.2 “Performance Monitor Overflow Status Registers (PMC[0]..PMC[3])” in Volume 2 of the Intel® Itanium® Architecture Software Developer’s Manual.
To support program counter sampling, the Intel® Itanium® processor 9300 series provides the following mechanisms:
• Timer interrupt for time-based program counter sampling
• Event count overflow interrupt for event-based program counter sampling
• Hardware-supported cycle accounting
3.2.2.2 Miss Event Address Sampling
Program counter sampling and cycle accounting provide an accurate picture of cumulative microarchitectural behavior, but they do not provide the application developer with pointers to specific program elements (code locations and data structures) that repeatedly cause microarchitectural “miss events”. In a cache study of the SPEC92 benchmarks, [Lebeck] used (trace based) cache miss profiling to gain performance improvements of 1.02 to 3.46 on various benchmarks by making simple changes to the source code. This type of analysis requires identification of instruction and data addresses related to microarchitectural “miss events” such as cache misses, branch mispredicts, or TLB misses. Using symbol tables or compiler annotations these addresses can be mapped back to critical source code elements. Like Lebeck, most performance analysts in the past have had to capture hardware traces and resort to trace driven simulation.
Due to the superscalar issue, deep pipelining, and out-of-order instruction completion of today’s microarchitectures, the sampled program counter value may not be related to the instruction address that caused a miss event. On a Pentium® processor pipeline, the sampled program counter may be off by two dynamic instructions from the instruction that caused the miss event. On a Pentium® Pro processor, this distance
Figure 3-3. Event Histogram by Program Counter
EventFrequency
Examples:# Cache Misses
# TLB Misses
Address Space
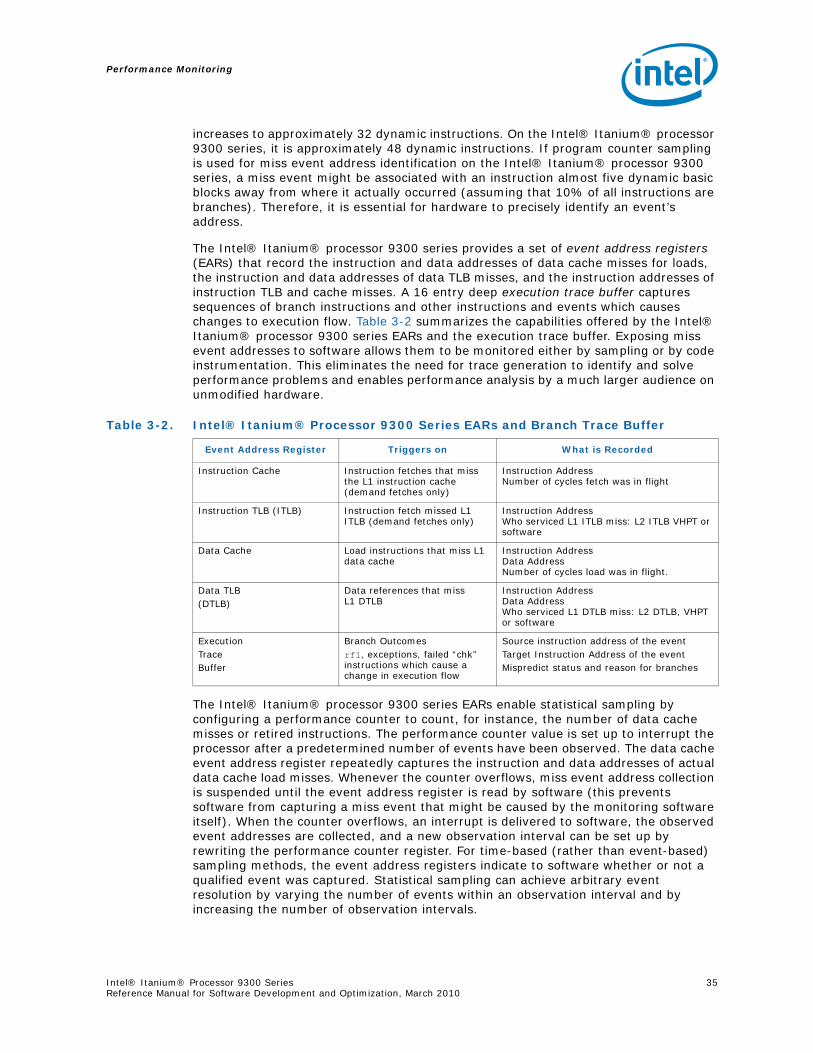
Performance Monitoring
Intel® Itanium® Processor 9300 Series 35Reference Manual for Software Development and Optimization, March 2010
increases to approximately 32 dynamic instructions. On the Intel® Itanium® processor 9300 series, it is approximately 48 dynamic instructions. If program counter sampling is used for miss event address identification on the Intel® Itanium® processor 9300 series, a miss event might be associated with an instruction almost five dynamic basic blocks away from where it actually occurred (assuming that 10% of all instructions are branches). Therefore, it is essential for hardware to precisely identify an event’s address.
The Intel® Itanium® processor 9300 series provides a set of event address registers (EARs) that record the instruction and data addresses of data cache misses for loads, the instruction and data addresses of data TLB misses, and the instruction addresses of instruction TLB and cache misses. A 16 entry deep execution trace buffer captures sequences of branch instructions and other instructions and events which causes changes to execution flow. Table 3-2 summarizes the capabilities offered by the Intel® Itanium® processor 9300 series EARs and the execution trace buffer. Exposing miss event addresses to software allows them to be monitored either by sampling or by code instrumentation. This eliminates the need for trace generation to identify and solve performance problems and enables performance analysis by a much larger audience on unmodified hardware.
The Intel® Itanium® processor 9300 series EARs enable statistical sampling by configuring a performance counter to count, for instance, the number of data cache misses or retired instructions. The performance counter value is set up to interrupt the processor after a predetermined number of events have been observed. The data cache event address register repeatedly captures the instruction and data addresses of actual data cache load misses. Whenever the counter overflows, miss event address collection is suspended until the event address register is read by software (this prevents software from capturing a miss event that might be caused by the monitoring software itself). When the counter overflows, an interrupt is delivered to software, the observed event addresses are collected, and a new observation interval can be set up by rewriting the performance counter register. For time-based (rather than event-based) sampling methods, the event address registers indicate to software whether or not a qualified event was captured. Statistical sampling can achieve arbitrary event resolution by varying the number of events within an observation interval and by increasing the number of observation intervals.
Table 3-2. Intel® Itanium® Processor 9300 Series EARs and Branch Trace Buffer
Event Address Register Triggers on What is Recorded
Instruction Cache Instruction fetches that miss the L1 instruction cache (demand fetches only)
Instruction AddressNumber of cycles fetch was in flight
Instruction TLB (ITLB) Instruction fetch missed L1 ITLB (demand fetches only)
Instruction AddressWho serviced L1 ITLB miss: L2 ITLB VHPT or software
Data Cache Load instructions that miss L1 data cache
Instruction AddressData AddressNumber of cycles load was in flight.
Data TLB(DTLB)
Data references that missL1 DTLB
Instruction AddressData AddressWho serviced L1 DTLB miss: L2 DTLB, VHPT or software
ExecutionTrace Buffer
Branch Outcomesrfi, exceptions, failed “chk” instructions which cause a change in execution flow
Source instruction address of the eventTarget Instruction Address of the eventMispredict status and reason for branches
Performance Monitoring
36 Intel® Itanium® Processor 9300 Series Reference Manual for Software Development and Optimization, March 2010
3.2.3 Event Qualification
On the Intel® Itanium® processor 9300 series, many of the performance monitoring events can be qualified in a number of ways such that only a subset of the events are counted using performance monitoring counters. As shown in Figure 3-4 events can be qualified for monitoring based on instruction address range, instruction opcode, data address range, event-specific “unit mask” (umask), the privilege level and instruction set the event was caused by, and the status of the performance monitoring freeze bit (PMC0.fr). The following paragraphs describe these capabilities in detail.
• Intel® Itanium® Instruction Address Range Check: The Intel® Itanium® processor 9300 series allows event monitoring to be constrained to a programmable instruction address range. This enables monitoring of dynamically linked libraries (DLLs), functions, or loops of interest in the context of a large Intel® Itanium®-based application. The Intel® Itanium® instruction address range check is applied at the instruction fetch stage of the pipeline and the resulting qualification is carried by the instruction throughout the pipeline. This enables conditional event counting at a level of granularity smaller than dynamic instruction length of the pipeline (approximately 48 instructions). The instruction address range check on the Intel® Itanium® processor 9300 series operates only during Intel® Itanium®-based code execution, that is, when PSR.is is zero. For details, see Section 3.3.5, “Instruction Address Range Matching”.
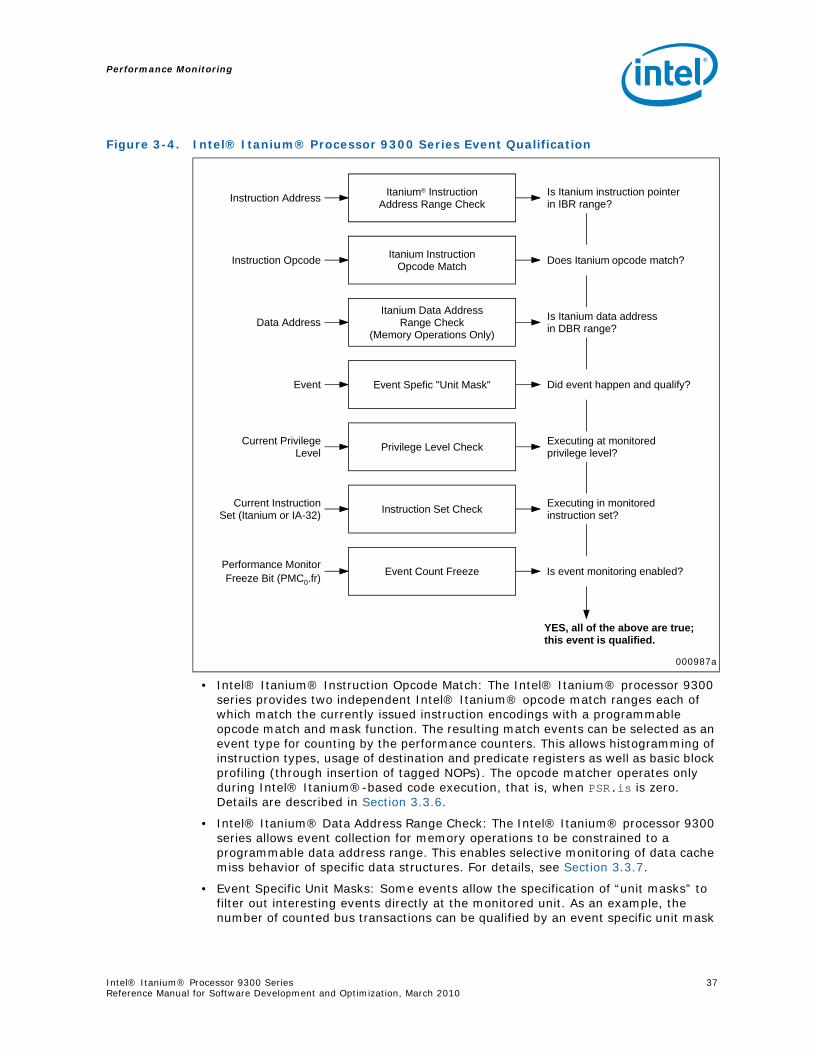
Performance Monitoring
Intel® Itanium® Processor 9300 Series 37Reference Manual for Software Development and Optimization, March 2010
• Intel® Itanium® Instruction Opcode Match: The Intel® Itanium® processor 9300 series provides two independent Intel® Itanium® opcode match ranges each of which match the currently issued instruction encodings with a programmable opcode match and mask function. The resulting match events can be selected as an event type for counting by the performance counters. This allows histogramming of instruction types, usage of destination and predicate registers as well as basic block profiling (through insertion of tagged NOPs). The opcode matcher operates only during Intel® Itanium®-based code execution, that is, when PSR.is is zero. Details are described in Section 3.3.6.
• Intel® Itanium® Data Address Range Check: The Intel® Itanium® processor 9300 series allows event collection for memory operations to be constrained to a programmable data address range. This enables selective monitoring of data cache miss behavior of specific data structures. For details, see Section 3.3.7.
• Event Specific Unit Masks: Some events allow the specification of “unit masks” to filter out interesting events directly at the monitored unit. As an example, the number of counted bus transactions can be qualified by an event specific unit mask
Figure 3-4. Intel® Itanium® Processor 9300 Series Event Qualification
000987a
Itanium® InstructionAddress Range CheckInstruction Address
Itanium InstructionOpcode MatchInstruction Opcode
Is Itanium instruction pointerin IBR range?
Does Itanium opcode match?
Itanium Data Address Range Check
(Memory Operations Only)Data Address Is Itanium data address
in DBR range?
Event Spefic "Unit Mask"Event Did event happen and qualify?
Privilege Level CheckCurrent Privilege Level
Executing at monitoredprivilege level?
Instruction Set CheckCurrent InstructionSet (Itanium or IA-32)
Executing in monitoredinstruction set?
Event Count FreezePerformance MonitorFreeze Bit (PMC0.fr)
Is event monitoring enabled?
YES, all of the above are true;this event is qualified.
Performance Monitoring
38 Intel® Itanium® Processor 9300 Series Reference Manual for Software Development and Optimization, March 2010
to contain transactions that originated from any bus agent, from the processor itself, or from other I/O bus masters. In this case, the bus unit uses a three-way unit mask (any, self, or I/O) that specifies which transactions are to be counted. In the Intel® Itanium® processor 9300 series, events from the branch, memory and bus units support a variety of unit masks. For details, refer to the event pages in Chapter 4.
• Privilege Level: Two bits in the processor status register (PSR) are provided to enable selective process-based event monitoring. The IIntel® Itanium® processor 9300 series supports conditional event counting based on the current privilege level; this allows performance monitoring software to break down event counts into user and operating system contributions. For details on how to constrain monitoring by privilege level, refer to Section 3.3.1, “Performance Monitor Control and Accessibility.”
• Instruction Set: IA-32 applications are supported on the Intel® Itanium® processor 9300 series using IA-32 Execution Layer and pre-boot IA-32 code is supported with PAL-based IA-32 execution. However, the Intel® Itanium® processor 9300 series does not support conditional event counting based on the currently executing instruction set (Intel® Itanium® or IA-32).
• Performance Monitor Freeze: Event counter overflows or software can freeze event monitoring. When frozen, no event monitoring takes place until software clears the monitoring freeze bit (PMC0.fr). This ensures that the performance monitoring routines themselves, for example, counter overflow interrupt handlers or performance monitoring context switch routines, do not “pollute” the event counts of the system under observation. For details refer to Section 7.2.4 of Volume 2 of the Intel® Itanium® Architecture Software Developer’s Manual.
3.2.3.1 Combining Opcode Matching, Instruction, and Data Address Range Check
The Intel® Itanium® processor 9300 series allows various event qualification mechanisms to be combined by providing the instruction tagging mechanism shown in Figure 3-5.
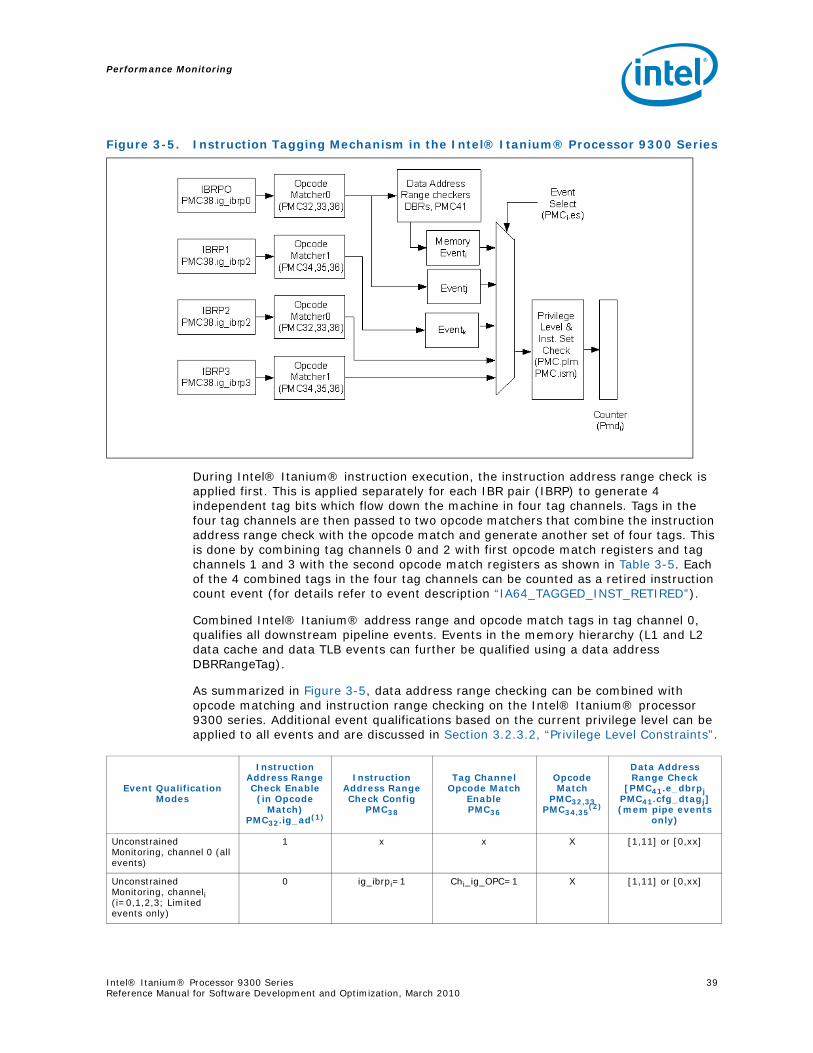
Performance Monitoring
Intel® Itanium® Processor 9300 Series 39Reference Manual for Software Development and Optimization, March 2010
During Intel® Itanium® instruction execution, the instruction address range check is applied first. This is applied separately for each IBR pair (IBRP) to generate 4 independent tag bits which flow down the machine in four tag channels. Tags in the four tag channels are then passed to two opcode matchers that combine the instruction address range check with the opcode match and generate another set of four tags. This is done by combining tag channels 0 and 2 with first opcode match registers and tag channels 1 and 3 with the second opcode match registers as shown in Table 3-5. Each of the 4 combined tags in the four tag channels can be counted as a retired instruction count event (for details refer to event description “IA64_TAGGED_INST_RETIRED”).
Combined Intel® Itanium® address range and opcode match tags in tag channel 0, qualifies all downstream pipeline events. Events in the memory hierarchy (L1 and L2 data cache and data TLB events can further be qualified using a data address DBRRangeTag).
As summarized in Figure 3-5, data address range checking can be combined with opcode matching and instruction range checking on the Intel® Itanium® processor 9300 series. Additional event qualifications based on the current privilege level can be applied to all events and are discussed in Section 3.2.3.2, “Privilege Level Constraints”.
Figure 3-5. Instruction Tagging Mechanism in the Intel® Itanium® Processor 9300 Series
Event Qualification Modes
InstructionAddress Range Check Enable(in Opcode
Match)PMC32.ig_ad(1)
InstructionAddress Range Check Config
PMC38
Tag Channel Opcode Match
EnablePMC36
Opcode Match
PMC32,33PMC34,35
(2)
Data AddressRange Check
[PMC41.e_dbrpjPMC41.cfg_dtagj](mem pipe events
only)
Unconstrained Monitoring, channel 0 (all events)
1 x x X [1,11] or [0,xx]
Unconstrained Monitoring, channeli (i=0,1,2,3; Limited events only)
0 ig_ibrpi=1 Chi_ig_OPC=1 X [1,11] or [0,xx]
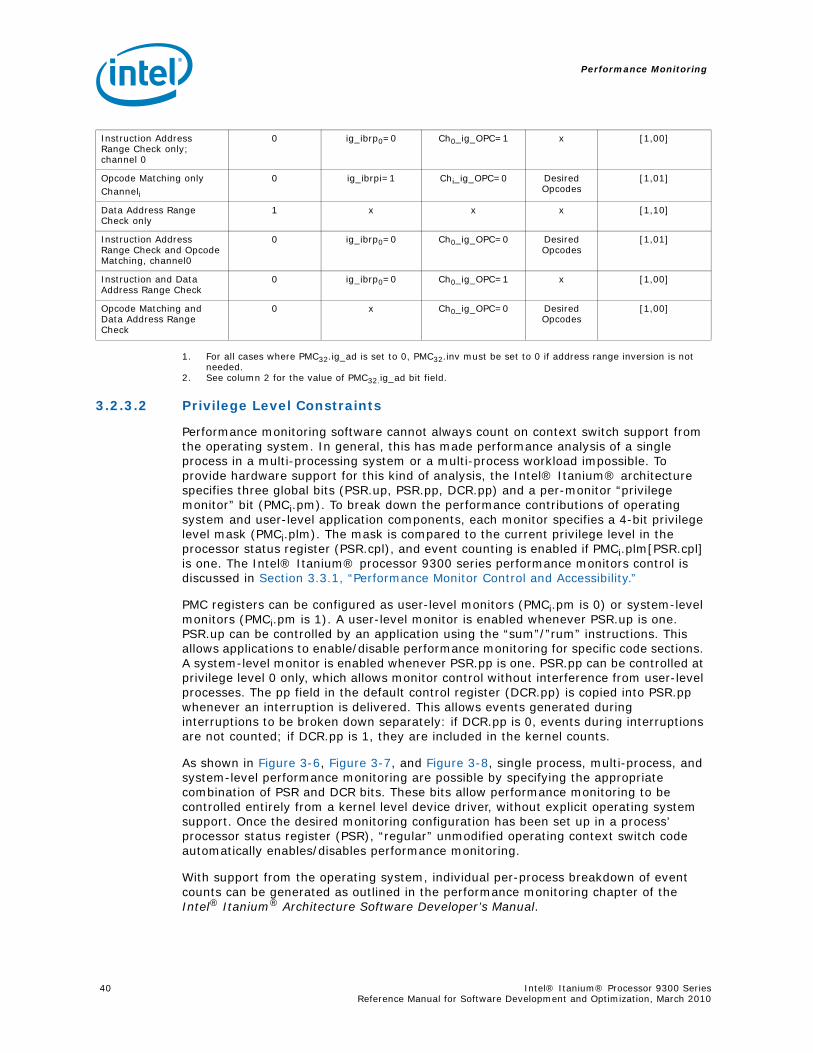
Performance Monitoring
40 Intel® Itanium® Processor 9300 Series Reference Manual for Software Development and Optimization, March 2010
1. For all cases where PMC32.ig_ad is set to 0, PMC32.inv must be set to 0 if address range inversion is not needed.
2. See column 2 for the value of PMC32.ig_ad bit field.
3.2.3.2 Privilege Level Constraints
Performance monitoring software cannot always count on context switch support from the operating system. In general, this has made performance analysis of a single process in a multi-processing system or a multi-process workload impossible. To provide hardware support for this kind of analysis, the Intel® Itanium® architecture specifies three global bits (PSR.up, PSR.pp, DCR.pp) and a per-monitor “privilege monitor” bit (PMCi.pm). To break down the performance contributions of operating system and user-level application components, each monitor specifies a 4-bit privilege level mask (PMCi.plm). The mask is compared to the current privilege level in the processor status register (PSR.cpl), and event counting is enabled if PMCi.plm[PSR.cpl] is one. The Intel® Itanium® processor 9300 series performance monitors control is discussed in Section 3.3.1, “Performance Monitor Control and Accessibility.”
PMC registers can be configured as user-level monitors (PMCi.pm is 0) or system-level monitors (PMCi.pm is 1). A user-level monitor is enabled whenever PSR.up is one. PSR.up can be controlled by an application using the “sum”/”rum” instructions. This allows applications to enable/disable performance monitoring for specific code sections. A system-level monitor is enabled whenever PSR.pp is one. PSR.pp can be controlled at privilege level 0 only, which allows monitor control without interference from user-level processes. The pp field in the default control register (DCR.pp) is copied into PSR.pp whenever an interruption is delivered. This allows events generated during interruptions to be broken down separately: if DCR.pp is 0, events during interruptions are not counted; if DCR.pp is 1, they are included in the kernel counts.
As shown in Figure 3-6, Figure 3-7, and Figure 3-8, single process, multi-process, and system-level performance monitoring are possible by specifying the appropriate combination of PSR and DCR bits. These bits allow performance monitoring to be controlled entirely from a kernel level device driver, without explicit operating system support. Once the desired monitoring configuration has been set up in a process’ processor status register (PSR), “regular” unmodified operating context switch code automatically enables/disables performance monitoring.
With support from the operating system, individual per-process breakdown of event counts can be generated as outlined in the performance monitoring chapter of the Intel® Itanium® Architecture Software Developer’s Manual.
Instruction Address Range Check only; channel 0
0 ig_ibrp0=0 Ch0_ig_OPC=1 x [1,00]
Opcode Matching onlyChanneli
0 ig_ibrpi=1 Chi_ig_OPC=0 Desired Opcodes
[1,01]
Data Address Range Check only
1 x x x [1,10]
Instruction Address Range Check and Opcode Matching, channel0
0 ig_ibrp0=0 Ch0_ig_OPC=0 Desired Opcodes
[1,01]
Instruction and Data Address Range Check
0 ig_ibrp0=0 Ch0_ig_OPC=1 x [1,00]
Opcode Matching and Data Address Range Check
0 x Ch0_ig_OPC=0 Desired Opcodes
[1,00]
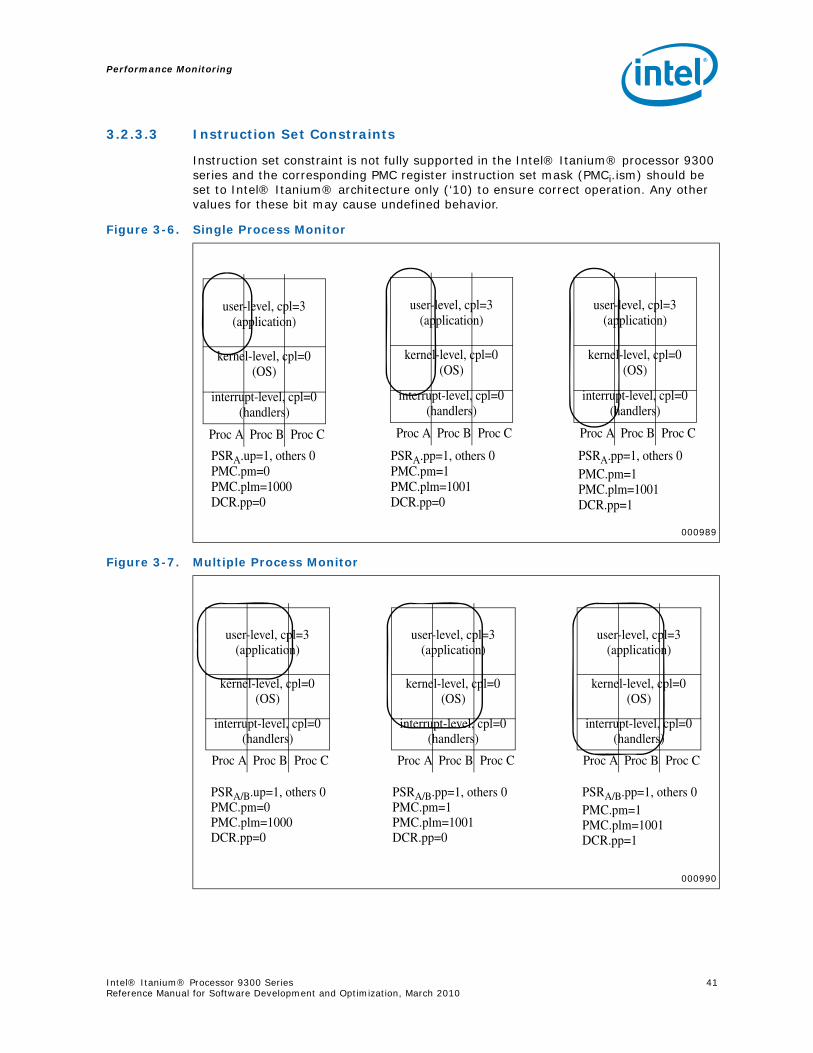
Performance Monitoring
Intel® Itanium® Processor 9300 Series 41Reference Manual for Software Development and Optimization, March 2010
3.2.3.3 Instruction Set Constraints
Instruction set constraint is not fully supported in the Intel® Itanium® processor 9300 series and the corresponding PMC register instruction set mask (PMCi.ism) should be set to Intel® Itanium® architecture only (‘10) to ensure correct operation. Any other values for these bit may cause undefined behavior.
Figure 3-6. Single Process Monitor
000989
Figure 3-7. Multiple Process Monitor
000990
user-level, cpl=3(application)
kernel-level, cpl=0(OS)
interrupt-level, cpl=0(handlers)
Proc A Proc B Proc C
user-level, cpl=3(application)
kernel-level, cpl=0(OS)
interrupt-level, cpl=0(handlers)
Proc A Proc B Proc C
user-level, cpl=3(application)
kernel-level, cpl=0(OS)
interrupt-level, cpl=0(handlers)
Proc A Proc B Proc C
PSRA.up=1, others 0PMC.pm=0
PSRA.pp=1, others 0PMC.pm=1PMC.plm=1001
DCR.pp=0 DCR.pp=0
PSRA.pp=1, others 0PMC.pm=1PMC.plm=1001DCR.pp=1
PMC.plm=1000
user-level, cpl=3(application)
kernel-level, cpl=0(OS)
interrupt-level, cpl=0(handlers)
Proc A Proc B Proc C
user-level, cpl=3(application)
kernel-level, cpl=0(OS)
interrupt-level, cpl=0(handlers)
Proc A Proc B Proc C
user-level, cpl=3(application)
kernel-level, cpl=0(OS)
interrupt-level, cpl=0(handlers)
Proc A Proc B Proc C
PSRA/B.up=1, others 0PMC.pm=0
PSRA/B.pp=1, others 0PMC.pm=1PMC.plm=1001
DCR.pp=0 DCR.pp=0
PSRA/B.pp=1, others 0PMC.pm=1PMC.plm=1001DCR.pp=1
PMC.plm=1000
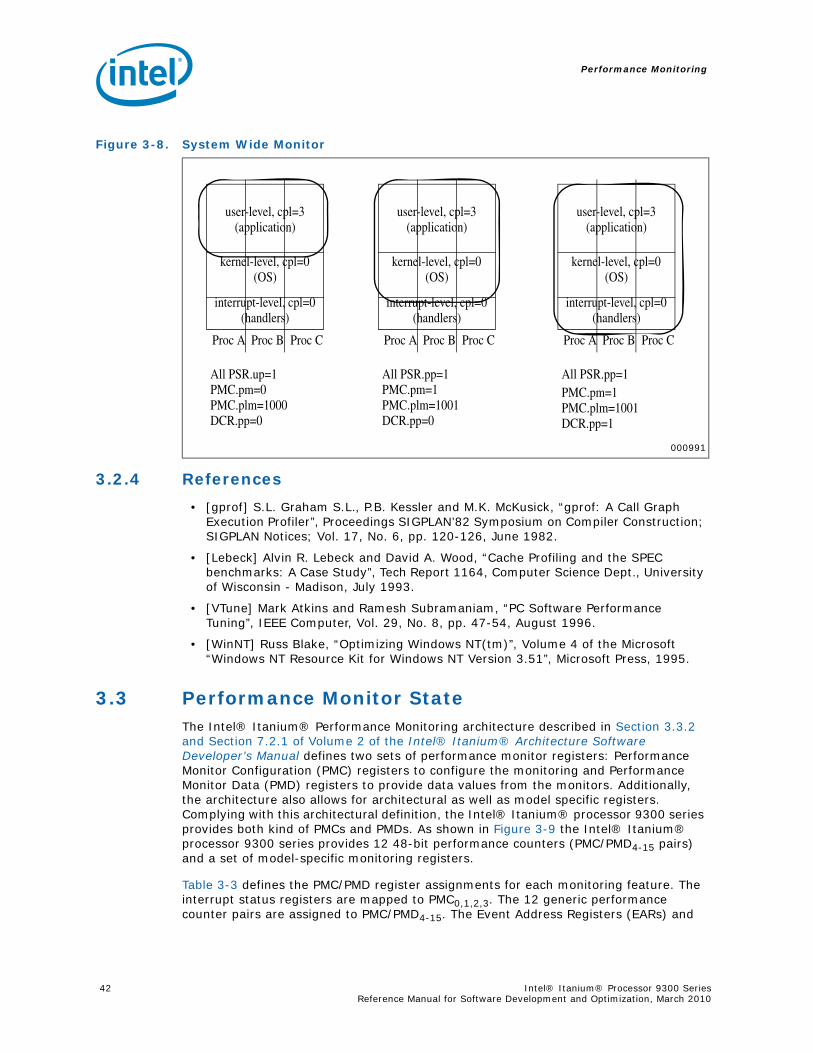
Performance Monitoring
42 Intel® Itanium® Processor 9300 Series Reference Manual for Software Development and Optimization, March 2010
3.2.4 References
• [gprof] S.L. Graham S.L., P.B. Kessler and M.K. McKusick, “gprof: A Call Graph Execution Profiler”, Proceedings SIGPLAN’82 Symposium on Compiler Construction; SIGPLAN Notices; Vol. 17, No. 6, pp. 120-126, June 1982.
• [Lebeck] Alvin R. Lebeck and David A. Wood, “Cache Profiling and the SPEC benchmarks: A Case Study”, Tech Report 1164, Computer Science Dept., University of Wisconsin - Madison, July 1993.
• [VTune] Mark Atkins and Ramesh Subramaniam, “PC Software Performance Tuning”, IEEE Computer, Vol. 29, No. 8, pp. 47-54, August 1996.
• [WinNT] Russ Blake, “Optimizing Windows NT(tm)”, Volume 4 of the Microsoft “Windows NT Resource Kit for Windows NT Version 3.51”, Microsoft Press, 1995.
3.3 Performance Monitor StateThe Intel® Itanium® Performance Monitoring architecture described in Section 3.3.2 and Section 7.2.1 of Volume 2 of the Intel® Itanium® Architecture Software Developer’s Manual defines two sets of performance monitor registers: Performance Monitor Configuration (PMC) registers to configure the monitoring and Performance Monitor Data (PMD) registers to provide data values from the monitors. Additionally, the architecture also allows for architectural as well as model specific registers. Complying with this architectural definition, the Intel® Itanium® processor 9300 series provides both kind of PMCs and PMDs. As shown in Figure 3-9 the Intel® Itanium® processor 9300 series provides 12 48-bit performance counters (PMC/PMD4-15 pairs) and a set of model-specific monitoring registers.
Table 3-3 defines the PMC/PMD register assignments for each monitoring feature. The interrupt status registers are mapped to PMC0,1,2,3. The 12 generic performance counter pairs are assigned to PMC/PMD4-15. The Event Address Registers (EARs) and
Figure 3-8. System Wide Monitor
000991
user-level, cpl=3(application)
kernel-level, cpl=0(OS)
interrupt-level, cpl=0(handlers)
Proc A Proc B Proc C
user-level, cpl=3(application)
kernel-level, cpl=0(OS)
interrupt-level, cpl=0(handlers)
Proc A Proc B Proc C
user-level, cpl=3(application)
kernel-level, cpl=0(OS)
interrupt-level, cpl=0(handlers)
Proc A Proc B Proc C
All PSR.up=1PMC.pm=0
All PSR.pp=1PMC.pm=1PMC.plm=1001
DCR.pp=0 DCR.pp=0
All PSR.pp=1PMC.pm=1PMC.plm=1001DCR.pp=1
PMC.plm=1000
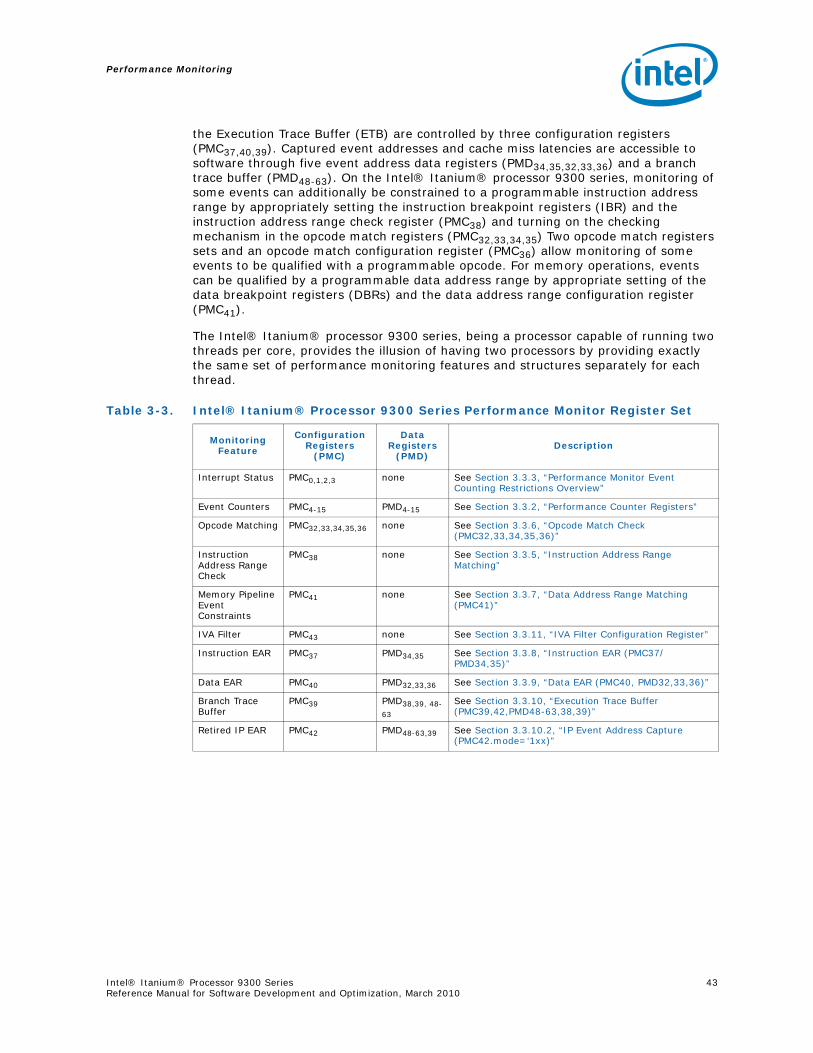
Performance Monitoring
Intel® Itanium® Processor 9300 Series 43Reference Manual for Software Development and Optimization, March 2010
the Execution Trace Buffer (ETB) are controlled by three configuration registers (PMC37,40,39). Captured event addresses and cache miss latencies are accessible to software through five event address data registers (PMD34,35,32,33,36) and a branch trace buffer (PMD48-63). On the Intel® Itanium® processor 9300 series, monitoring of some events can additionally be constrained to a programmable instruction address range by appropriately setting the instruction breakpoint registers (IBR) and the instruction address range check register (PMC38) and turning on the checking mechanism in the opcode match registers (PMC32,33,34,35) Two opcode match registers sets and an opcode match configuration register (PMC36) allow monitoring of some events to be qualified with a programmable opcode. For memory operations, events can be qualified by a programmable data address range by appropriate setting of the data breakpoint registers (DBRs) and the data address range configuration register (PMC41).
The Intel® Itanium® processor 9300 series, being a processor capable of running two threads per core, provides the illusion of having two processors by providing exactly the same set of performance monitoring features and structures separately for each thread.
Table 3-3. Intel® Itanium® Processor 9300 Series Performance Monitor Register Set
MonitoringFeature
ConfigurationRegisters
(PMC)
DataRegisters
(PMD)Description
Interrupt Status PMC0,1,2,3 none See Section 3.3.3, “Performance Monitor Event Counting Restrictions Overview”
Event Counters PMC4-15 PMD4-15 See Section 3.3.2, “Performance Counter Registers”
Opcode Matching PMC32,33,34,35,36 none See Section 3.3.6, “Opcode Match Check (PMC32,33,34,35,36)”
Instruction Address Range Check
PMC38 none See Section 3.3.5, “Instruction Address Range Matching”
Memory Pipeline Event Constraints
PMC41 none See Section 3.3.7, “Data Address Range Matching (PMC41)”
IVA Filter PMC43 none See Section 3.3.11, “IVA Filter Configuration Register”
Instruction EAR PMC37 PMD34,35 See Section 3.3.8, “Instruction EAR (PMC37/PMD34,35)”
Data EAR PMC40 PMD32,33,36 See Section 3.3.9, “Data EAR (PMC40, PMD32,33,36)”
Branch Trace Buffer
PMC39 PMD38,39, 48-63
See Section 3.3.10, “Execution Trace Buffer (PMC39,42,PMD48-63,38,39)”
Retired IP EAR PMC42 PMD48-63,39 See Section 3.3.10.2, “IP Event Address Capture (PMC42.mode=‘1xx)”
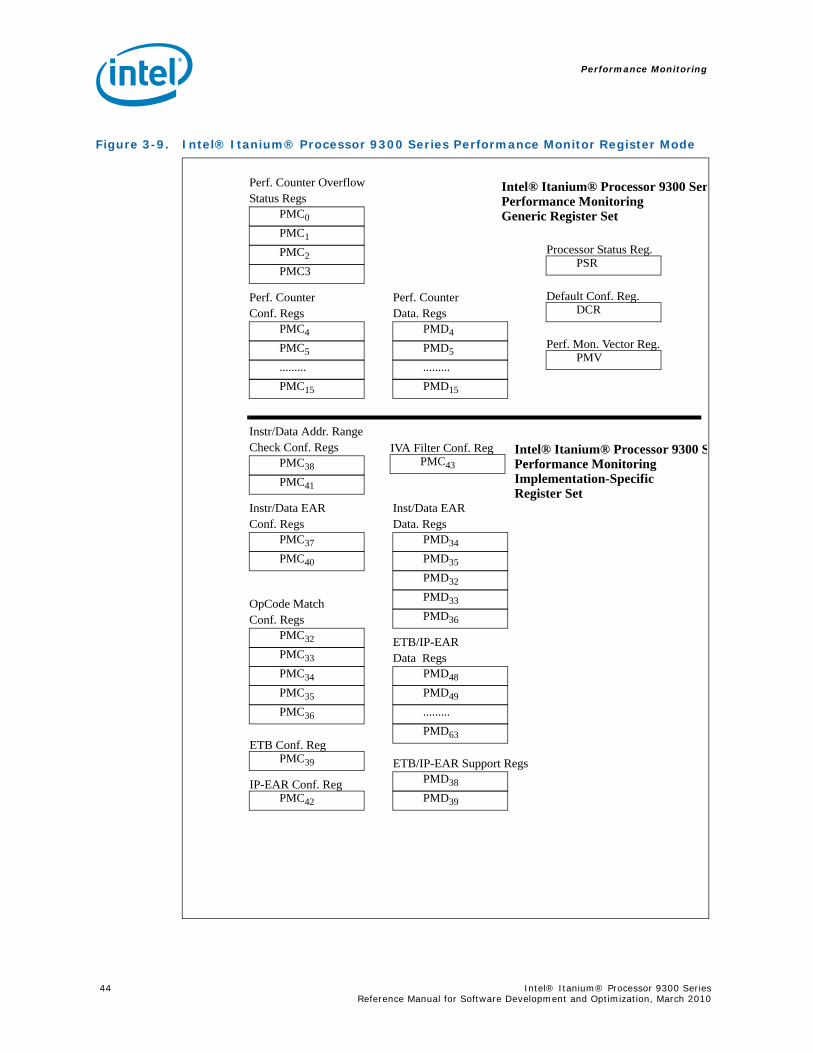
Performance Monitoring
44 Intel® Itanium® Processor 9300 Series Reference Manual for Software Development and Optimization, March 2010
Figure 3-9. Intel® Itanium® Processor 9300 Series Performance Monitor Register Mode
PMC0
PMC1
PMC2
PMC3
PMC4
PMC5
.........PMC15
Perf. Counter
Perf. Counter OverflowStatus Regs
Conf. RegsPMD4
PMD5
.........PMD15
Perf. Counter Data. Regs
PMC38
PMC41
Instr/Data Addr. Range Check Conf. Regs
PMD38
PMD39
ETB/IP-EAR Support Regs
PMD34
PMD35
PMD32
PMD33
Inst/Data EAR Data. Regs
PMD36
PMC32
PMC33
PMC34
PMC35
OpCode Match Conf. Regs
PMC37
PMC40
Instr/Data EAR Conf. Regs
PMC36
PMD48
PMD49
.........PMD63
ETB/IP-EAR Data Regs
PMC39
ETB Conf. Reg
PMC42
IP-EAR Conf. Reg
PSRProcessor Status Reg.
DCRDefault Conf. Reg.
PMVPerf. Mon. Vector Reg.
PMC43
IVA Filter Conf. Reg Intel® Itanium® Processor 9300 SPerformance MonitoringImplementation-SpecificRegister Set
Intel® Itanium® Processor 9300 SerPerformance MonitoringGeneric Register Set
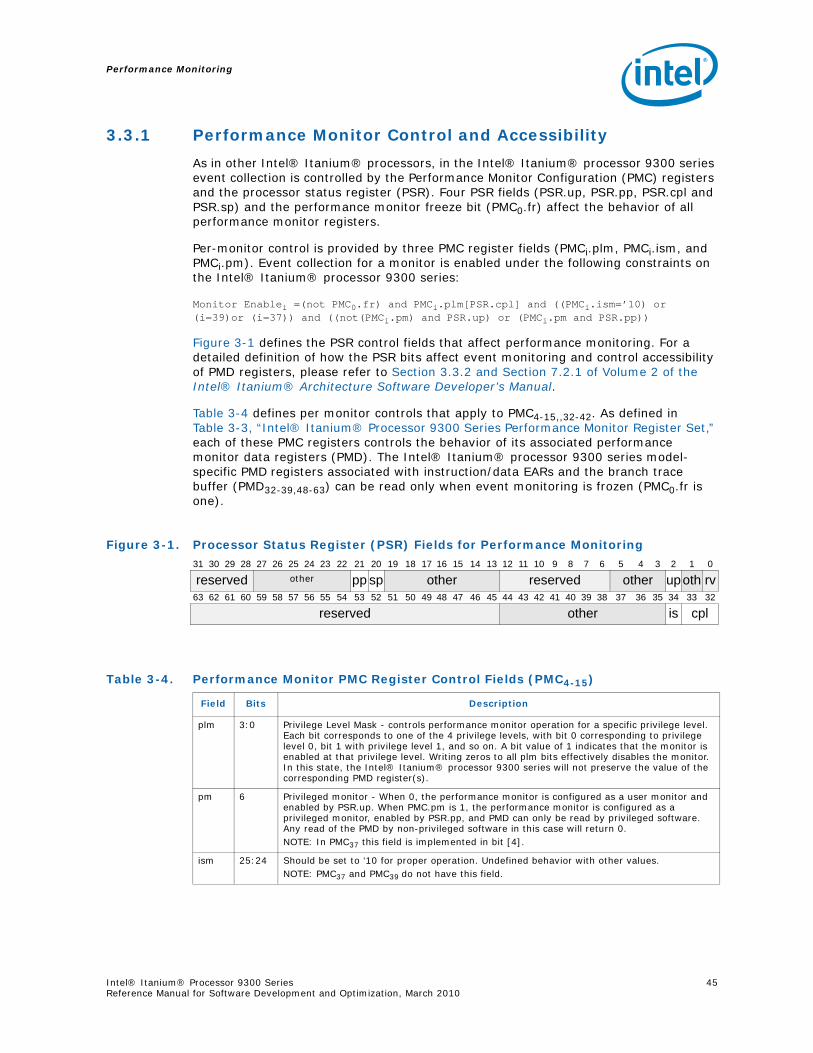
Performance Monitoring
Intel® Itanium® Processor 9300 Series 45Reference Manual for Software Development and Optimization, March 2010
3.3.1 Performance Monitor Control and Accessibility
As in other Intel® Itanium® processors, in the Intel® Itanium® processor 9300 series event collection is controlled by the Performance Monitor Configuration (PMC) registers and the processor status register (PSR). Four PSR fields (PSR.up, PSR.pp, PSR.cpl and PSR.sp) and the performance monitor freeze bit (PMC0.fr) affect the behavior of all performance monitor registers.
Per-monitor control is provided by three PMC register fields (PMCi.plm, PMCi.ism, and PMCi.pm). Event collection for a monitor is enabled under the following constraints on the Intel® Itanium® processor 9300 series:
Monitor Enablei =(not PMC0.fr) and PMCi.plm[PSR.cpl] and ((PMCi.ism=’10) or (i=39)or (i=37)) and ((not(PMCi.pm) and PSR.up) or (PMCi.pm and PSR.pp))
Figure 3-1 defines the PSR control fields that affect performance monitoring. For a detailed definition of how the PSR bits affect event monitoring and control accessibility of PMD registers, please refer to Section 3.3.2 and Section 7.2.1 of Volume 2 of the Intel® Itanium® Architecture Software Developer’s Manual.
Table 3-4 defines per monitor controls that apply to PMC4-15,,32-42. As defined in Table 3-3, “Intel® Itanium® Processor 9300 Series Performance Monitor Register Set,” each of these PMC registers controls the behavior of its associated performance monitor data registers (PMD). The Intel® Itanium® processor 9300 series model-specific PMD registers associated with instruction/data EARs and the branch trace buffer (PMD32-39,48-63) can be read only when event monitoring is frozen (PMC0.fr is one).
Figure 3-1. Processor Status Register (PSR) Fields for Performance Monitoring
31 30 29 28 27 26 25 24 23 22 21 20 19 18 17 16 15 14 13 12 11 10 9 8 7 6 5 4 3 2 1 0
reserved other pp sp other reserved other upoth rv63 62 61 60 59 58 57 56 55 54 53 52 51 50 49 48 47 46 45 44 43 42 41 40 39 38 37 36 35 34 33 32
reserved other is cpl
Table 3-4. Performance Monitor PMC Register Control Fields (PMC4-15)
Field Bits Description
plm 3:0 Privilege Level Mask - controls performance monitor operation for a specific privilege level. Each bit corresponds to one of the 4 privilege levels, with bit 0 corresponding to privilege level 0, bit 1 with privilege level 1, and so on. A bit value of 1 indicates that the monitor is enabled at that privilege level. Writing zeros to all plm bits effectively disables the monitor. In this state, the Intel® Itanium® processor 9300 series will not preserve the value of the corresponding PMD register(s).
pm 6 Privileged monitor - When 0, the performance monitor is configured as a user monitor and enabled by PSR.up. When PMC.pm is 1, the performance monitor is configured as a privileged monitor, enabled by PSR.pp, and PMD can only be read by privileged software. Any read of the PMD by non-privileged software in this case will return 0.NOTE: In PMC37 this field is implemented in bit [4].
ism 25:24 Should be set to ‘10 for proper operation. Undefined behavior with other values.NOTE: PMC37 and PMC39 do not have this field.
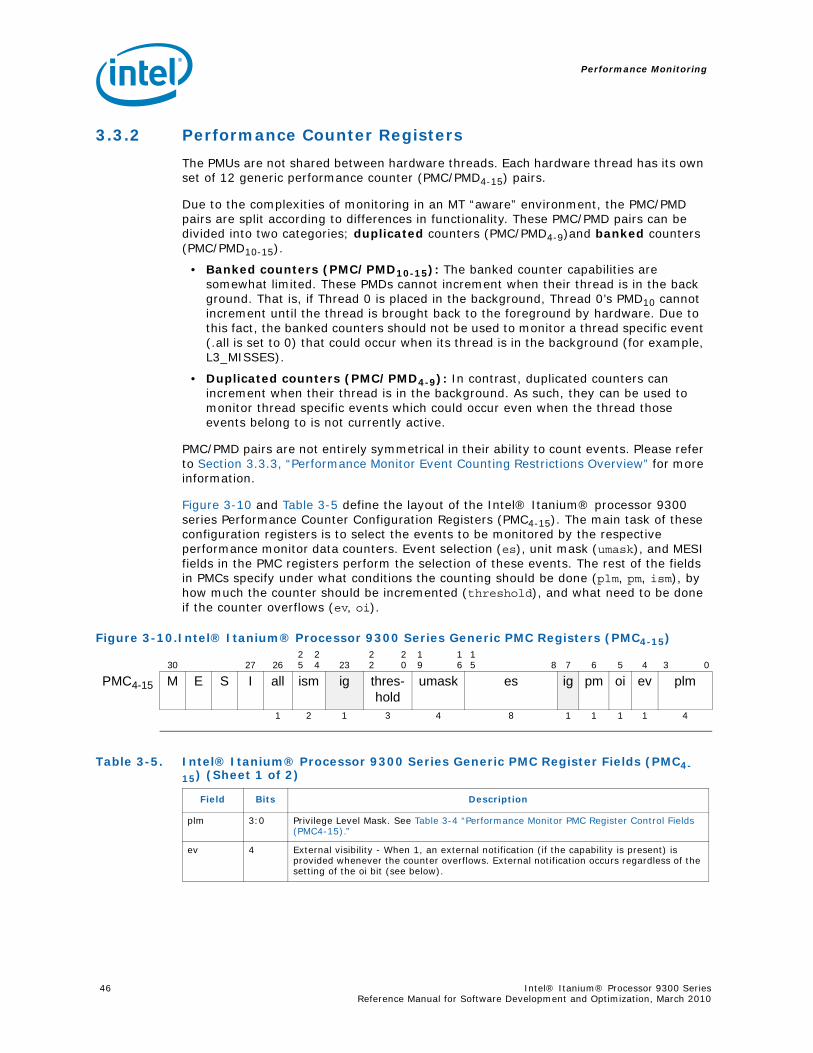
Performance Monitoring
46 Intel® Itanium® Processor 9300 Series Reference Manual for Software Development and Optimization, March 2010
3.3.2 Performance Counter Registers
The PMUs are not shared between hardware threads. Each hardware thread has its own set of 12 generic performance counter (PMC/PMD4-15) pairs.
Due to the complexities of monitoring in an MT “aware” environment, the PMC/PMD pairs are split according to differences in functionality. These PMC/PMD pairs can be divided into two categories; duplicated counters (PMC/PMD4-9)and banked counters (PMC/PMD10-15).
• Banked counters (PMC/PMD10-15): The banked counter capabilities are somewhat limited. These PMDs cannot increment when their thread is in the back ground. That is, if Thread 0 is placed in the background, Thread 0’s PMD10 cannot increment until the thread is brought back to the foreground by hardware. Due to this fact, the banked counters should not be used to monitor a thread specific event (.all is set to 0) that could occur when its thread is in the background (for example, L3_MISSES).
• Duplicated counters (PMC/PMD4-9): In contrast, duplicated counters can increment when their thread is in the background. As such, they can be used to monitor thread specific events which could occur even when the thread those events belong to is not currently active.
PMC/PMD pairs are not entirely symmetrical in their ability to count events. Please refer to Section 3.3.3, “Performance Monitor Event Counting Restrictions Overview” for more information.
Figure 3-10 and Table 3-5 define the layout of the Intel® Itanium® processor 9300 series Performance Counter Configuration Registers (PMC4-15). The main task of these configuration registers is to select the events to be monitored by the respective performance monitor data counters. Event selection (es), unit mask (umask), and MESI fields in the PMC registers perform the selection of these events. The rest of the fields in PMCs specify under what conditions the counting should be done (plm, pm, ism), by how much the counter should be incremented (threshold), and what need to be done if the counter overflows (ev, oi).
Figure 3-10.Intel® Itanium® Processor 9300 Series Generic PMC Registers (PMC4-15)
30 27 2625
24 23
22
20
19
16
15 8 7 6 5 4 3 0
PMC4-15 M E S I all ism ig thres-hold
umask es ig pm oi ev plm
1 2 1 3 4 8 1 1 1 1 4
Table 3-5. Intel® Itanium® Processor 9300 Series Generic PMC Register Fields (PMC4-15) (Sheet 1 of 2)
Field Bits Description
plm 3:0 Privilege Level Mask. See Table 3-4 “Performance Monitor PMC Register Control Fields (PMC4-15).”
ev 4 External visibility - When 1, an external notification (if the capability is present) is provided whenever the counter overflows. External notification occurs regardless of the setting of the oi bit (see below).
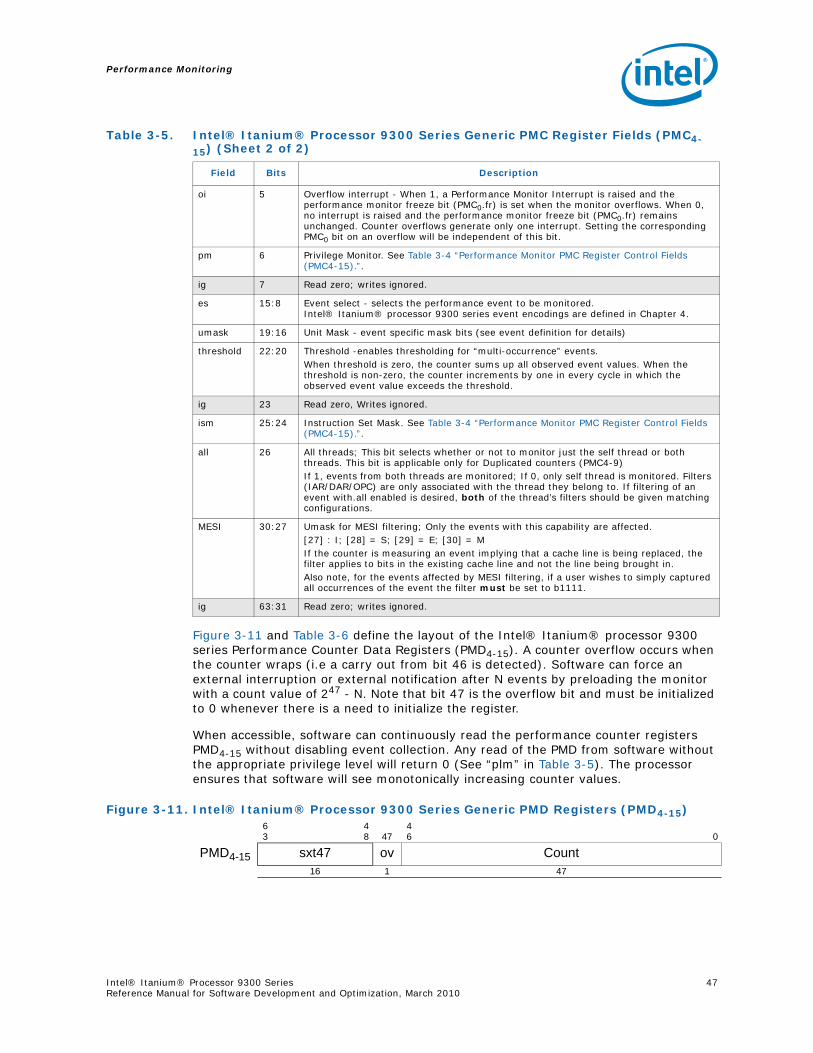
Performance Monitoring
Intel® Itanium® Processor 9300 Series 47Reference Manual for Software Development and Optimization, March 2010
Figure 3-11 and Table 3-6 define the layout of the Intel® Itanium® processor 9300 series Performance Counter Data Registers (PMD4-15). A counter overflow occurs when the counter wraps (i.e a carry out from bit 46 is detected). Software can force an external interruption or external notification after N events by preloading the monitor with a count value of 247 - N. Note that bit 47 is the overflow bit and must be initialized to 0 whenever there is a need to initialize the register.
When accessible, software can continuously read the performance counter registers PMD4-15 without disabling event collection. Any read of the PMD from software without the appropriate privilege level will return 0 (See “plm” in Table 3-5). The processor ensures that software will see monotonically increasing counter values.
oi 5 Overflow interrupt - When 1, a Performance Monitor Interrupt is raised and the performance monitor freeze bit (PMC0.fr) is set when the monitor overflows. When 0, no interrupt is raised and the performance monitor freeze bit (PMC0.fr) remains unchanged. Counter overflows generate only one interrupt. Setting the corresponding PMC0 bit on an overflow will be independent of this bit.
pm 6 Privilege Monitor. See Table 3-4 “Performance Monitor PMC Register Control Fields (PMC4-15).”.
ig 7 Read zero; writes ignored.
es 15:8 Event select - selects the performance event to be monitored. Intel® Itanium® processor 9300 series event encodings are defined in Chapter 4.
umask 19:16 Unit Mask - event specific mask bits (see event definition for details)
threshold 22:20 Threshold -enables thresholding for “multi-occurrence” events. When threshold is zero, the counter sums up all observed event values. When the threshold is non-zero, the counter increments by one in every cycle in which the observed event value exceeds the threshold.
ig 23 Read zero, Writes ignored.
ism 25:24 Instruction Set Mask. See Table 3-4 “Performance Monitor PMC Register Control Fields (PMC4-15).”.
all 26 All threads; This bit selects whether or not to monitor just the self thread or both threads. This bit is applicable only for Duplicated counters (PMC4-9)If 1, events from both threads are monitored; If 0, only self thread is monitored. Filters (IAR/DAR/OPC) are only associated with the thread they belong to. If filtering of an event with.all enabled is desired, both of the thread’s filters should be given matching configurations.
MESI 30:27 Umask for MESI filtering; Only the events with this capability are affected. [27] : I; [28] = S; [29] = E; [30] = MIf the counter is measuring an event implying that a cache line is being replaced, the filter applies to bits in the existing cache line and not the line being brought in. Also note, for the events affected by MESI filtering, if a user wishes to simply captured all occurrences of the event the filter must be set to b1111.
ig 63:31 Read zero; writes ignored.
Table 3-5. Intel® Itanium® Processor 9300 Series Generic PMC Register Fields (PMC4-15) (Sheet 2 of 2)
Field Bits Description
Figure 3-11. Intel® Itanium® Processor 9300 Series Generic PMD Registers (PMD4-15)63
48 47
46 0
PMD4-15 sxt47 ov Count16 1 47
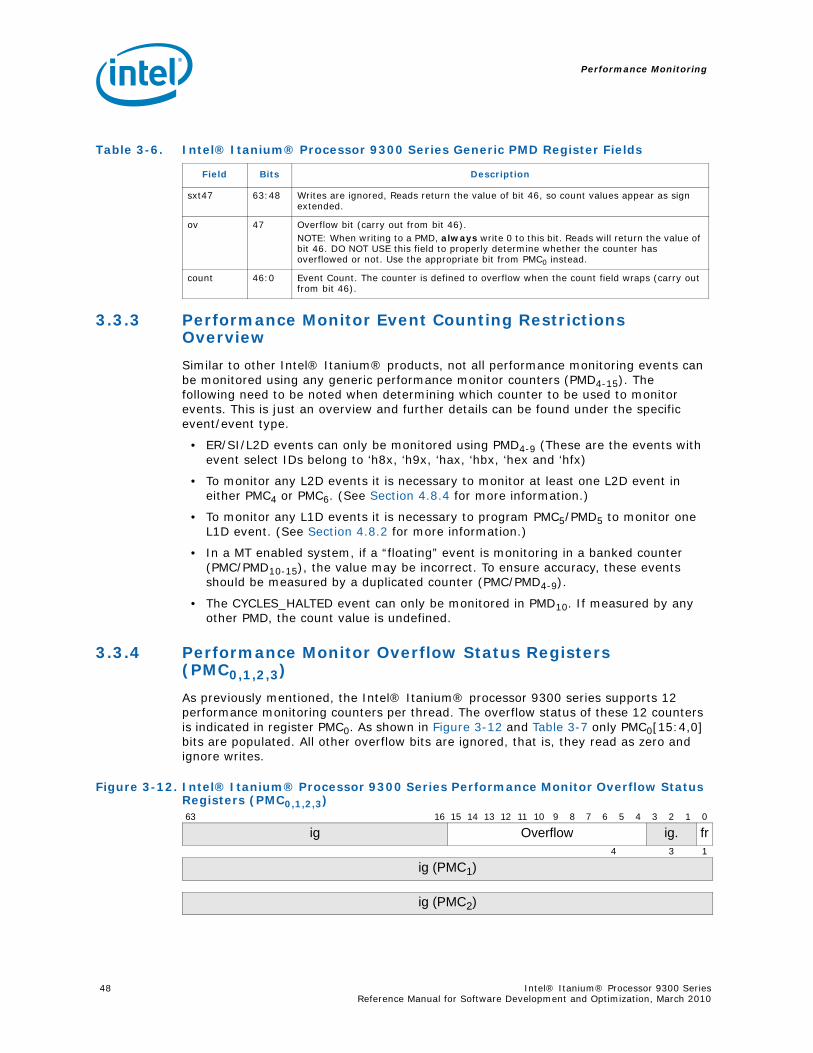
Performance Monitoring
48 Intel® Itanium® Processor 9300 Series Reference Manual for Software Development and Optimization, March 2010
3.3.3 Performance Monitor Event Counting Restrictions Overview
Similar to other Intel® Itanium® products, not all performance monitoring events can be monitored using any generic performance monitor counters (PMD4-15). The following need to be noted when determining which counter to be used to monitor events. This is just an overview and further details can be found under the specific event/event type.
• ER/SI/L2D events can only be monitored using PMD4-9 (These are the events with event select IDs belong to ‘h8x, ‘h9x, ‘hax, ‘hbx, ‘hex and ‘hfx)
• To monitor any L2D events it is necessary to monitor at least one L2D event in either PMC4 or PMC6. (See Section 4.8.4 for more information.)
• To monitor any L1D events it is necessary to program PMC5/PMD5 to monitor one L1D event. (See Section 4.8.2 for more information.)
• In a MT enabled system, if a “floating” event is monitoring in a banked counter (PMC/PMD10-15), the value may be incorrect. To ensure accuracy, these events should be measured by a duplicated counter (PMC/PMD4-9).
• The CYCLES_HALTED event can only be monitored in PMD10. If measured by any other PMD, the count value is undefined.
3.3.4 Performance Monitor Overflow Status Registers (PMC0,1,2,3)
As previously mentioned, the Intel® Itanium® processor 9300 series supports 12 performance monitoring counters per thread. The overflow status of these 12 counters is indicated in register PMC0. As shown in Figure 3-12 and Table 3-7 only PMC0[15:4,0] bits are populated. All other overflow bits are ignored, that is, they read as zero and ignore writes.
Table 3-6. Intel® Itanium® Processor 9300 Series Generic PMD Register Fields
Field Bits Description
sxt47 63:48 Writes are ignored, Reads return the value of bit 46, so count values appear as sign extended.
ov 47 Overflow bit (carry out from bit 46).NOTE: When writing to a PMD, always write 0 to this bit. Reads will return the value of bit 46. DO NOT USE this field to properly determine whether the counter has overflowed or not. Use the appropriate bit from PMC0 instead.
count 46:0 Event Count. The counter is defined to overflow when the count field wraps (carry out from bit 46).
Figure 3-12. Intel® Itanium® Processor 9300 Series Performance Monitor Overflow Status Registers (PMC0,1,2,3)63 16 15 14 13 12 11 10 9 8 7 6 5 4 3 2 1 0
ig Overflow ig. fr4 3 1
ig (PMC1)
ig (PMC2)

Performance Monitoring
Intel® Itanium® Processor 9300 Series 49Reference Manual for Software Development and Optimization, March 2010
3.3.5 Instruction Address Range Matching
The Intel® Itanium® processor 9300 series allows event monitoring to be constrained to a range of instruction addresses. Once programmed with this constraints, only the events generated by instructions with their addresses within this range are counted using PMD4-15. The four architectural Instruction Breakpoint Register Pairs IBRP0-3 (IBR0-7) are used to specify the desired address ranges. Using these IBR pairs it is possible to define up to 4 different address ranges (only 2 address ranges in “fine mode”) that can be used to qualify event monitoring.
Once programmed, each of these 4 address restrictions can be applied separately to all events that are identified to do so. The event, IA64_INST_RETIRED, is the only event that can be constrained using any of the four address ranges. Events described as prefetch events can only be constrained using address range 2 (IBRP1). All other events can only use the first address range (IBRP0) and this range will be considered as the default for this section.
In addition to constraint events based on instruction addresses, the Intel® Itanium® processor 9300 series allows event qualification based on the opcode of the instruction and the address of the data the memory related instructions accessed. These are done by applying these constraints to the same 4 instruction address ranges described in this section. These features are explained in Section 3.3.6, “Opcode Match Check (PMC32,33,34,35,36)”and Section 3.3.7, “Data Address Range Matching (PMC41)”.
ig (PMC3)
Table 3-7. Intel® Itanium® Processor 9300 Series Performance Monitor Overflow Register Fields (PMC0,1,2,3)
Register Field Bits HW Reset Description
PMC0 fr 0 0 Performance Monitor “freeze” bit - When 1, event monitoring is disabled. When 0, event monitoring is enabled. This bit is set by hardware whenever a performance monitor overflow occurs and its corresponding overflow interrupt bit (PMC.oi) is set to one. SW is responsible for clearing it. When the PMC.oi bit is not set, then counter overflows do not set this bit.
PMC0 ig 3:1 - Read zero, Writes ignored.
PMC0 overflow 15:4 0 Event Counter Overflow - When bit n is one, indicate that the PMDn overflowed. This is a bit vector indicating which performance monitor overflowed. These overflow bits are set on their corresponding counters overflow regardless of the state of the PMC.oi bit. Software may also set these bits. These bits are sticky and multiple bits may be set.
PMC0 ig 63:16
- Read zero, Writes ignored.
PMC1,2,3 ig 63:0 - Read zero, Writes ignored.
Figure 3-12. Intel® Itanium® Processor 9300 Series Performance Monitor Overflow Status Registers (PMC0,1,2,3)63 16 15 14 13 12 11 10 9 8 7 6 5 4 3 2 1 0
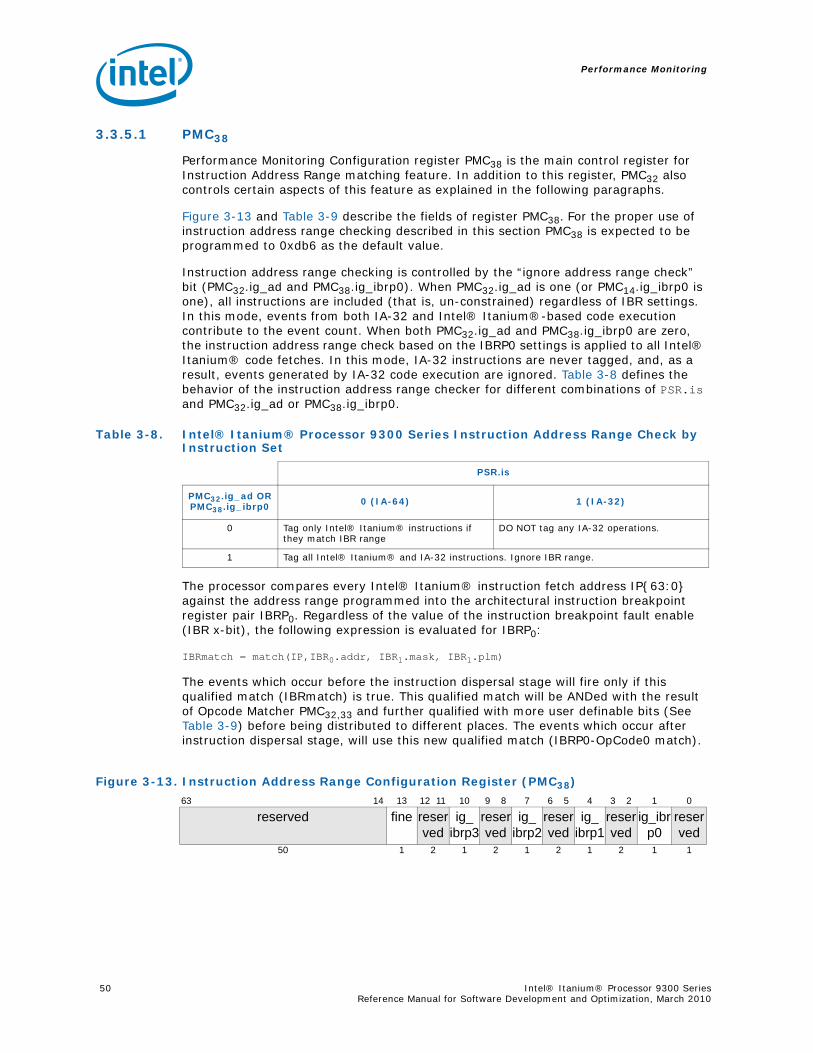
Performance Monitoring
50 Intel® Itanium® Processor 9300 Series Reference Manual for Software Development and Optimization, March 2010
3.3.5.1 PMC38
Performance Monitoring Configuration register PMC38 is the main control register for Instruction Address Range matching feature. In addition to this register, PMC32 also controls certain aspects of this feature as explained in the following paragraphs.
Figure 3-13 and Table 3-9 describe the fields of register PMC38. For the proper use of instruction address range checking described in this section PMC38 is expected to be programmed to 0xdb6 as the default value.
Instruction address range checking is controlled by the “ignore address range check” bit (PMC32.ig_ad and PMC38.ig_ibrp0). When PMC32.ig_ad is one (or PMC14.ig_ibrp0 is one), all instructions are included (that is, un-constrained) regardless of IBR settings. In this mode, events from both IA-32 and Intel® Itanium®-based code execution contribute to the event count. When both PMC32.ig_ad and PMC38.ig_ibrp0 are zero, the instruction address range check based on the IBRP0 settings is applied to all Intel® Itanium® code fetches. In this mode, IA-32 instructions are never tagged, and, as a result, events generated by IA-32 code execution are ignored. Table 3-8 defines the behavior of the instruction address range checker for different combinations of PSR.is and PMC32.ig_ad or PMC38.ig_ibrp0.
The processor compares every Intel® Itanium® instruction fetch address IP{63:0} against the address range programmed into the architectural instruction breakpoint register pair IBRP0. Regardless of the value of the instruction breakpoint fault enable (IBR x-bit), the following expression is evaluated for IBRP0:
IBRmatch = match(IP,IBR0.addr, IBR1.mask, IBR1.plm)
The events which occur before the instruction dispersal stage will fire only if this qualified match (IBRmatch) is true. This qualified match will be ANDed with the result of Opcode Matcher PMC32,33 and further qualified with more user definable bits (See Table 3-9) before being distributed to different places. The events which occur after instruction dispersal stage, will use this new qualified match (IBRP0-OpCode0 match).
Table 3-8. Intel® Itanium® Processor 9300 Series Instruction Address Range Check by Instruction Set
PSR.is
PMC32.ig_ad ORPMC38.ig_ibrp0 0 (IA-64) 1 (IA-32)
0 Tag only Intel® Itanium® instructions if they match IBR range
DO NOT tag any IA-32 operations.
1 Tag all Intel® Itanium® and IA-32 instructions. Ignore IBR range.
Figure 3-13. Instruction Address Range Configuration Register (PMC38)
63 14 13 12 11 10 9 8 7 6 5 4 3 2 1 0
reserved fine reserved
ig_ibrp3
reserved
ig_ibrp2
reserved
ig_ibrp1
reserved
ig_ibrp0
reserved
50 1 2 1 2 1 2 1 2 1 1
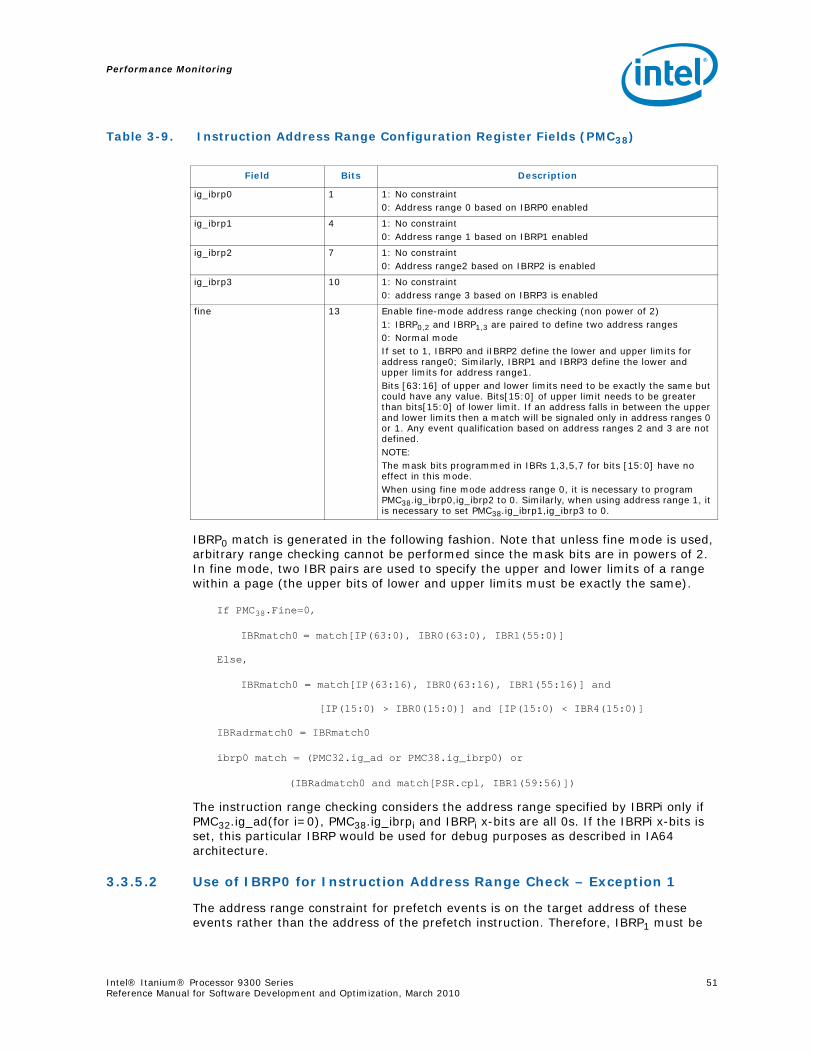
Performance Monitoring
Intel® Itanium® Processor 9300 Series 51Reference Manual for Software Development and Optimization, March 2010
IBRP0 match is generated in the following fashion. Note that unless fine mode is used, arbitrary range checking cannot be performed since the mask bits are in powers of 2. In fine mode, two IBR pairs are used to specify the upper and lower limits of a range within a page (the upper bits of lower and upper limits must be exactly the same).
If PMC38.Fine=0,
IBRmatch0 = match[IP(63:0), IBR0(63:0), IBR1(55:0)]
Else,
IBRmatch0 = match[IP(63:16), IBR0(63:16), IBR1(55:16)] and
[IP(15:0) > IBR0(15:0)] and [IP(15:0) < IBR4(15:0)]
IBRadrmatch0 = IBRmatch0
ibrp0 match = (PMC32.ig_ad or PMC38.ig_ibrp0) or
(IBRadmatch0 and match[PSR.cpl, IBR1(59:56)])
The instruction range checking considers the address range specified by IBRPi only if PMC32.ig_ad(for i=0), PMC38.ig_ibrpi and IBRPi x-bits are all 0s. If the IBRPi x-bits is set, this particular IBRP would be used for debug purposes as described in IA64 architecture.
3.3.5.2 Use of IBRP0 for Instruction Address Range Check – Exception 1
The address range constraint for prefetch events is on the target address of these events rather than the address of the prefetch instruction. Therefore, IBRP1 must be
Table 3-9. Instruction Address Range Configuration Register Fields (PMC38)
Field Bits Description
ig_ibrp0 1 1: No constraint0: Address range 0 based on IBRP0 enabled
ig_ibrp1 4 1: No constraint0: Address range 1 based on IBRP1 enabled
ig_ibrp2 7 1: No constraint0: Address range2 based on IBRP2 is enabled
ig_ibrp3 10 1: No constraint0: address range 3 based on IBRP3 is enabled
fine 13 Enable fine-mode address range checking (non power of 2)1: IBRP0,2 and IBRP1,3 are paired to define two address ranges0: Normal modeIf set to 1, IBRP0 and iIBRP2 define the lower and upper limits for address range0; Similarly, IBRP1 and IBRP3 define the lower and upper limits for address range1. Bits [63:16] of upper and lower limits need to be exactly the same but could have any value. Bits[15:0] of upper limit needs to be greater than bits[15:0] of lower limit. If an address falls in between the upper and lower limits then a match will be signaled only in address ranges 0 or 1. Any event qualification based on address ranges 2 and 3 are not defined.NOTE: The mask bits programmed in IBRs 1,3,5,7 for bits [15:0] have no effect in this mode.When using fine mode address range 0, it is necessary to program PMC38.ig_ibrp0,ig_ibrp2 to 0. Similarly, when using address range 1, it is necessary to set PMC38.ig_ibrp1,ig_ibrp3 to 0.

Performance Monitoring
52 Intel® Itanium® Processor 9300 Series Reference Manual for Software Development and Optimization, March 2010
used for constraining these events. Calculation of IBRP1 match is the same as that of IBRP0 match with the exception that we use IBR2,3,6 instead of IBR0,1,4.
Note: On reset, PAL will initialize register PMC38 to 0x0db6. Software must preserve the values of the reserved bits or undefined behavior may occur. (Unlike other registers that require all reserved bits to be set to 0, some PMC38 reserved bits are set to 1.)
3.3.5.3 Use of IBRP0 for Instruction Address Range Check – Exception 2
The Address Range Constraint for IA64_TAGGED_INST_RETIRED event uses all four IBR pairs. Calculation of IBRP2 match is the same as that of IBRP0 match with the exception that IBR4,5 (in non-fine mode) are used instead of IBR0. Calculation of IBRP3 match is the same as that of IBRP1 match with the exception that we use IBR6,7 (in non-fine mode) instead of IBR2,3.
The instruction range check tag is computed early in the processor pipeline and therefore includes speculative, wrong-path as well as predicated off instructions. Furthermore, range check tags are not accurate in the instruction fetch and out-of-order parts of the pipeline (cache and bus units). Therefore, software must accept a level of range check inaccuracy for events generated by these units, especially for non-looping code sequences that are shorter than the Intel® Itanium® processor 9300 series pipeline. As described in Section 3.2.3.1, “Combining Opcode Matching, Instruction, and Data Address Range Check”, the instruction range check result may be combined with the results of the IA-64 opcode match registers described in the next section.
3.3.5.4 Fine Mode Address Range Check
In addition to providing coarse address range checking described above, the Itanium® processor 9300 series can be programmed to perform address range checks in the fine mode. The Itanium® processor 9300 series provides the use of two address ranges for fine mode. The first range is defined using IBRP0 and IBRP2 while the second is defined using IBRP1 and IBRP3. When properly programmed to use address range 0, all performance monitoring events that would qualify with IBRP0 would now qualify with this new address range (defined collectively by IBRP0 and IBRP2). Similarly, when using the address range 1, all events that could be qualified with IBRP1, now get qualified with this new address range.
A user can configure the Intel® Itanium® Processor 9300 Series PMU to use fine mode address range 0 by following these steps: (It is assumed that PMCs 32,33,34,35,36,38,41 all start with default settings):
• program IBRP0 and IBRP2 to define the instruction address range. Note to follow the programming restrictions mentioned in Table 3-9, “Instruction Address Range Configuration Register Fields (PMC38)”
• program PMC32[ig_ad,inv] = ‘00 to turn off default tags injected into tag channel 0
• program PMC38[ig_ibrp0,ig_ibrp2] = ‘00 to turn on address tagging based on IBRP0 and IBRP2.
• Program PMC38.fine = 1
Similarly, a user can configure the Intel® Itanium® Processor 9300 Series PMU to use fine mode address range by following the same steps as above but this time with IBRP1&3. The only exception is that PMC32[ig_ad,inv] need not to be programmed.
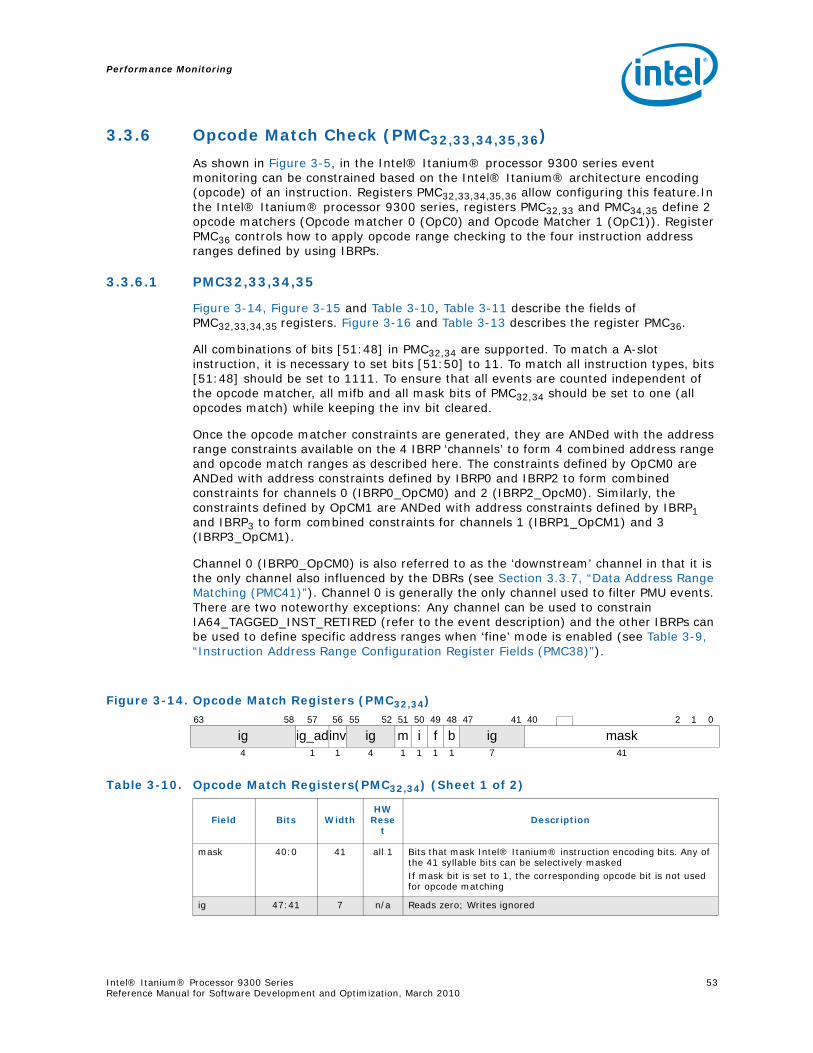
Performance Monitoring
Intel® Itanium® Processor 9300 Series 53Reference Manual for Software Development and Optimization, March 2010
3.3.6 Opcode Match Check (PMC32,33,34,35,36)
As shown in Figure 3-5, in the Intel® Itanium® processor 9300 series event monitoring can be constrained based on the Intel® Itanium® architecture encoding (opcode) of an instruction. Registers PMC32,33,34,35,36 allow configuring this feature.In the Intel® Itanium® processor 9300 series, registers PMC32,33 and PMC34,35 define 2 opcode matchers (Opcode matcher 0 (OpC0) and Opcode Matcher 1 (OpC1)). Register PMC36 controls how to apply opcode range checking to the four instruction address ranges defined by using IBRPs.
3.3.6.1 PMC32,33,34,35
Figure 3-14, Figure 3-15 and Table 3-10, Table 3-11 describe the fields of PMC32,33,34,35 registers. Figure 3-16 and Table 3-13 describes the register PMC36.
All combinations of bits [51:48] in PMC32,34 are supported. To match a A-slot instruction, it is necessary to set bits [51:50] to 11. To match all instruction types, bits [51:48] should be set to 1111. To ensure that all events are counted independent of the opcode matcher, all mifb and all mask bits of PMC32,34 should be set to one (all opcodes match) while keeping the inv bit cleared.
Once the opcode matcher constraints are generated, they are ANDed with the address range constraints available on the 4 IBRP ‘channels’ to form 4 combined address range and opcode match ranges as described here. The constraints defined by OpCM0 are ANDed with address constraints defined by IBRP0 and IBRP2 to form combined constraints for channels 0 (IBRP0_OpCM0) and 2 (IBRP2_OpcM0). Similarly, the constraints defined by OpCM1 are ANDed with address constraints defined by IBRP1 and IBRP3 to form combined constraints for channels 1 (IBRP1_OpCM1) and 3 (IBRP3_OpCM1).
Channel 0 (IBRP0_OpCM0) is also referred to as the ‘downstream’ channel in that it is the only channel also influenced by the DBRs (see Section 3.3.7, “Data Address Range Matching (PMC41)”). Channel 0 is generally the only channel used to filter PMU events. There are two noteworthy exceptions: Any channel can be used to constrain IA64_TAGGED_INST_RETIRED (refer to the event description) and the other IBRPs can be used to define specific address ranges when ‘fine’ mode is enabled (see Table 3-9, “Instruction Address Range Configuration Register Fields (PMC38)”).
Figure 3-14. Opcode Match Registers (PMC32,34)
63 58 57 56 55 52 51 50 49 48 47 41 40 2 1 0
ig ig_adinv ig m i f b ig mask4 1 1 4 1 1 1 1 7 41
Table 3-10. Opcode Match Registers(PMC32,34) (Sheet 1 of 2)
Field Bits WidthHW
Reset
Description
mask 40:0 41 all 1 Bits that mask Intel® Itanium® instruction encoding bits. Any of the 41 syllable bits can be selectively maskedIf mask bit is set to 1, the corresponding opcode bit is not used for opcode matching
ig 47:41 7 n/a Reads zero; Writes ignored
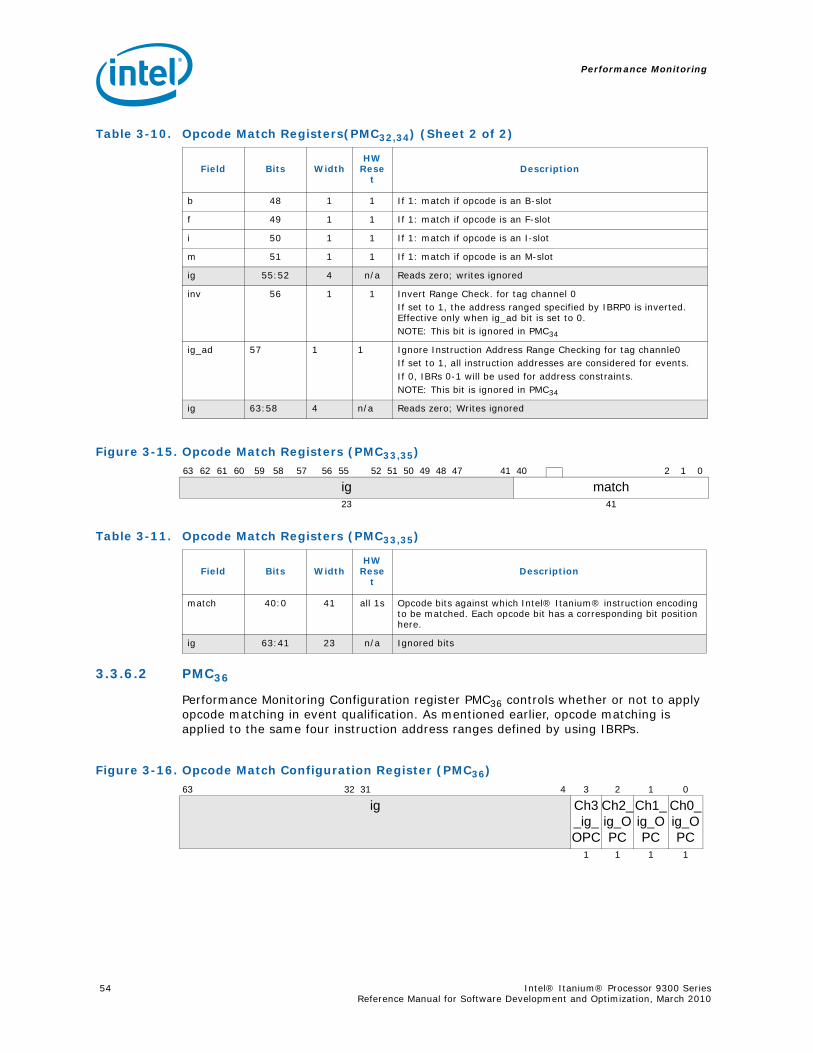
Performance Monitoring
54 Intel® Itanium® Processor 9300 Series Reference Manual for Software Development and Optimization, March 2010
3.3.6.2 PMC36
Performance Monitoring Configuration register PMC36 controls whether or not to apply opcode matching in event qualification. As mentioned earlier, opcode matching is applied to the same four instruction address ranges defined by using IBRPs.
b 48 1 1 If 1: match if opcode is an B-slot
f 49 1 1 If 1: match if opcode is an F-slot
i 50 1 1 If 1: match if opcode is an I-slot
m 51 1 1 If 1: match if opcode is an M-slot
ig 55:52 4 n/a Reads zero; writes ignored
inv 56 1 1 Invert Range Check. for tag channel 0If set to 1, the address ranged specified by IBRP0 is inverted. Effective only when ig_ad bit is set to 0.NOTE: This bit is ignored in PMC34
ig_ad 57 1 1 Ignore Instruction Address Range Checking for tag channle0If set to 1, all instruction addresses are considered for events. If 0, IBRs 0-1 will be used for address constraints.NOTE: This bit is ignored in PMC34
ig 63:58 4 n/a Reads zero; Writes ignored
Table 3-10. Opcode Match Registers(PMC32,34) (Sheet 2 of 2)
Field Bits WidthHW
Reset
Description
Figure 3-15. Opcode Match Registers (PMC33,35)
63 62 61 60 59 58 57 56 55 52 51 50 49 48 47 41 40 2 1 0
ig match23 41
Table 3-11. Opcode Match Registers (PMC33,35)
Field Bits WidthHW
Reset
Description
match 40:0 41 all 1s Opcode bits against which Intel® Itanium® instruction encoding to be matched. Each opcode bit has a corresponding bit position here.
ig 63:41 23 n/a Ignored bits
Figure 3-16. Opcode Match Configuration Register (PMC36)
63 32 31 4 3 2 1 0
ig Ch3_ig_OPC
Ch2_ig_OPC
Ch1_ig_OPC
Ch0_ig_OPC
1 1 1 1

Performance Monitoring
Intel® Itanium® Processor 9300 Series 55Reference Manual for Software Development and Optimization, March 2010
For opcode matching purposes, an Intel® Itanium® instruction is defined by two items: the instruction type “itype” (one of M, I, F or B) and the 41-bit encoding “enco{40:0}” defined the Intel® Itanium® Architecture Software Developer’s Manual. Each instruction is evaluated against each opcode match register (OpCM0 and OpCM1) as follows:
Match(OpCM[i]) = (imatch(itype, OpCM[i].mifb) AND ematch(enco,OpCM[i].match,OpCM[i].mask))
Where:
i match(itype,OpCMi.mifb) = (itype=M AND PMC[32+i].m) OR (itype=I AND PMC[32+i].i) OR (itype=F AND PMC[32+i].f) OR (itype=B AND PMC[32+i].b)
ematch(enco,match,mask) = AND b=40..0 ((enco{b}=match{b}) OR mask{b})
The IBRP matches are advanced with the instruction pointer to the point where opcodes are being dispersed. The matches from opcode matchers are ANDed with the IBRP matches at this point.
This produces two opcode match events that are combined with the instruction range check tags (IBRRangeTag, see Section 3.3.5, “Instruction Address Range Matching”) as follows:
Tag(IBRP0_OpCM0) = Match(OpCM0) and IBRRangeTag0
Tag(IBRP1_OpCM1) = Match(OpCM1) and IBRRangeTag1
Tag(IBRP2_OpCM0) = Match(OpCM0) and IBRRangeTag2
Tag(IBRP3_OpCM1) = Match(OpCM1) and IBRRangeTag3
As shown in Figure 3-5, these 4 ‘channels’ of tags are staged down the processor pipeline until instruction retirement and can be selected as a retired instruction count event (see event description “IA64_TAGGED_INST_RETIRED”). In this way, a performance counter (PMC/PMD4-15) can be used to count the number of retired instructions within the programmed range that match the specified opcodes.
Note: In previous Intel® Itanium® processors, register PMC36 needed to contain the predetermined value of 0xfffffff0. If software modified any bits not listed in Table 3-12
Table 3-12. Opcode Match Configuration Register Fields (PMC36)
Field Bits HW Reset Description
Ch0_ig_OPC 0 0 1: Tag channel 0 (IBRP0) PMU events will not be constrained by opcode0: Tag channel 0 PMU events (including IA64_TAGGED_INST_RETIRED.00) will be opcode constrained by OpCM0
Ch1_ig_OPC 1 0 1: Tag channel 1 (IBRP1) events (IA64_TAGGED_INST_RETIRED.01) won’t be constrained by opcode0: tag channel 1 events will be opcode constrained by OpCM1
Ch2_ig_OpC 2 0 1: Tag channel2 (IBRP2) events (IA64_TAGGED_INST_RETIRED.10) won’t be constrained by opcode0: Tag channel2 events will be opcode constrained by OpCM0
Ch3_ig_OpC 3 0 1: Tag channel3 (IBRP3) events (IA64_TAGGED_INST_RETIRED.11) won’t be constrained by opcode0: Tag channel2 events will be opcode constrained by OpCM1
ig 63:4 n/a Writes ignored; Reads return zeros
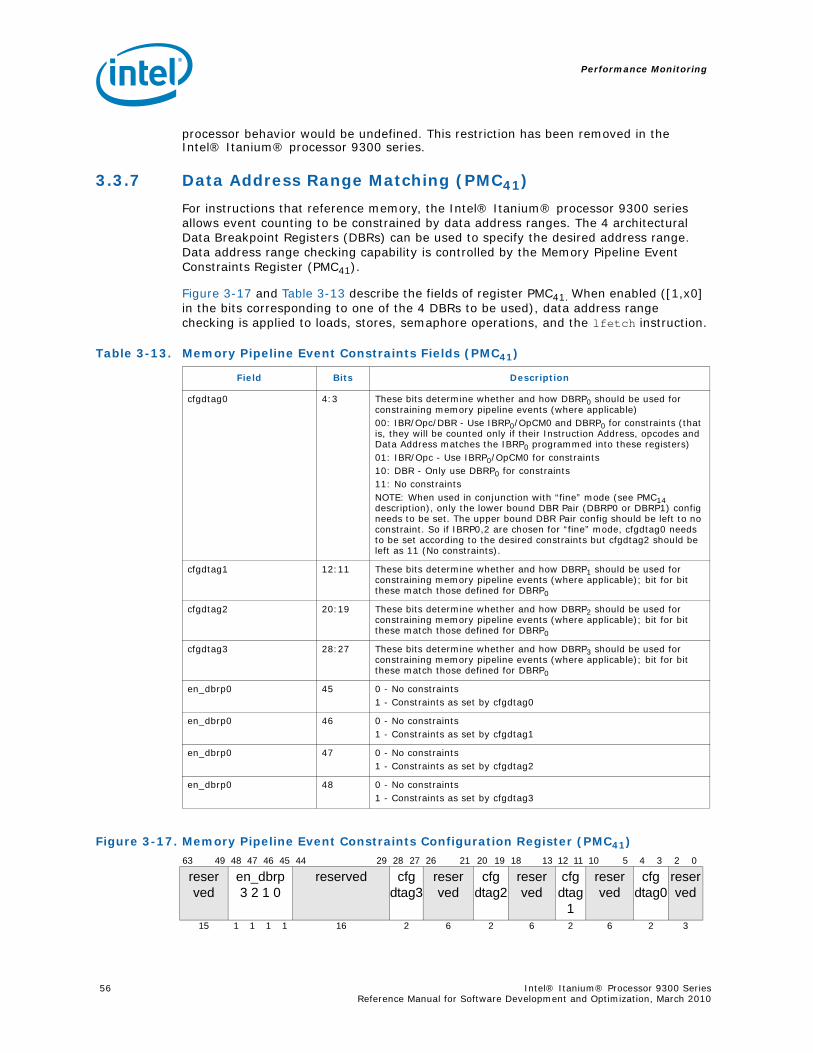
Performance Monitoring
56 Intel® Itanium® Processor 9300 Series Reference Manual for Software Development and Optimization, March 2010
processor behavior would be undefined. This restriction has been removed in the Intel® Itanium® processor 9300 series.
3.3.7 Data Address Range Matching (PMC41)
For instructions that reference memory, the Intel® Itanium® processor 9300 series allows event counting to be constrained by data address ranges. The 4 architectural Data Breakpoint Registers (DBRs) can be used to specify the desired address range. Data address range checking capability is controlled by the Memory Pipeline Event Constraints Register (PMC41).
Figure 3-17 and Table 3-13 describe the fields of register PMC41. When enabled ([1,x0] in the bits corresponding to one of the 4 DBRs to be used), data address range checking is applied to loads, stores, semaphore operations, and the lfetch instruction.
Table 3-13. Memory Pipeline Event Constraints Fields (PMC41)
Field Bits Description
cfgdtag0 4:3 These bits determine whether and how DBRP0 should be used for constraining memory pipeline events (where applicable)00: IBR/Opc/DBR - Use IBRP0/OpCM0 and DBRP0 for constraints (that is, they will be counted only if their Instruction Address, opcodes and Data Address matches the IBRP0 programmed into these registers)01: IBR/Opc - Use IBRP0/OpCM0 for constraints10: DBR - Only use DBRP0 for constraints11: No constraintsNOTE: When used in conjunction with “fine” mode (see PMC14 description), only the lower bound DBR Pair (DBRP0 or DBRP1) config needs to be set. The upper bound DBR Pair config should be left to no constraint. So if IBRP0,2 are chosen for “fine” mode, cfgdtag0 needs to be set according to the desired constraints but cfgdtag2 should be left as 11 (No constraints).
cfgdtag1 12:11 These bits determine whether and how DBRP1 should be used for constraining memory pipeline events (where applicable); bit for bit these match those defined for DBRP0
cfgdtag2 20:19 These bits determine whether and how DBRP2 should be used for constraining memory pipeline events (where applicable); bit for bit these match those defined for DBRP0
cfgdtag3 28:27 These bits determine whether and how DBRP3 should be used for constraining memory pipeline events (where applicable); bit for bit these match those defined for DBRP0
en_dbrp0 45 0 - No constraints1 - Constraints as set by cfgdtag0
en_dbrp0 46 0 - No constraints1 - Constraints as set by cfgdtag1
en_dbrp0 47 0 - No constraints1 - Constraints as set by cfgdtag2
en_dbrp0 48 0 - No constraints1 - Constraints as set by cfgdtag3
Figure 3-17. Memory Pipeline Event Constraints Configuration Register (PMC41)
63 49 48 47 46 45 44 29 28 27 26 21 20 19 18 13 12 11 10 5 4 3 2 0
reserved
en_dbrp3 2 1 0
reserved cfgdtag3
reserved
cfgdtag2
reserved
cfgdtag
1
reserved
cfgdtag0
reserved
15 1 1 1 1 16 2 6 2 6 2 6 2 3
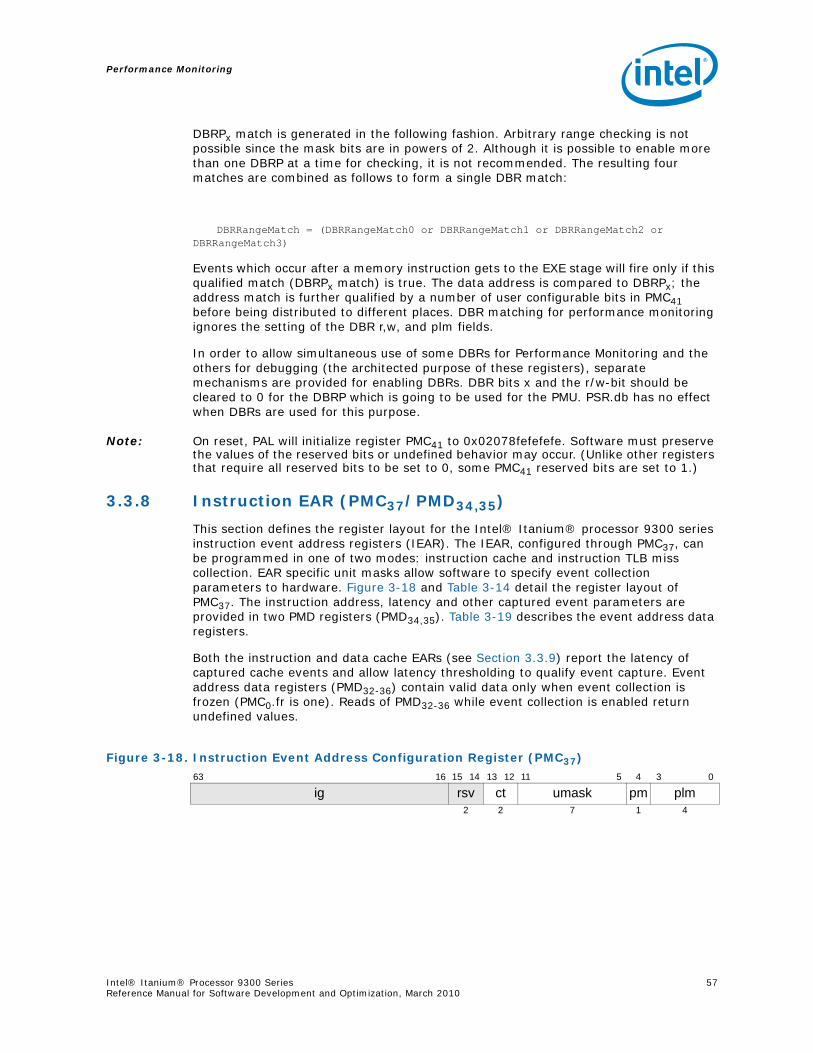
Performance Monitoring
Intel® Itanium® Processor 9300 Series 57Reference Manual for Software Development and Optimization, March 2010
DBRPx match is generated in the following fashion. Arbitrary range checking is not possible since the mask bits are in powers of 2. Although it is possible to enable more than one DBRP at a time for checking, it is not recommended. The resulting four matches are combined as follows to form a single DBR match:
DBRRangeMatch = (DBRRangeMatch0 or DBRRangeMatch1 or DBRRangeMatch2 or DBRRangeMatch3)
Events which occur after a memory instruction gets to the EXE stage will fire only if this qualified match (DBRPx match) is true. The data address is compared to DBRPx; the address match is further qualified by a number of user configurable bits in PMC41 before being distributed to different places. DBR matching for performance monitoring ignores the setting of the DBR r,w, and plm fields.
In order to allow simultaneous use of some DBRs for Performance Monitoring and the others for debugging (the architected purpose of these registers), separate mechanisms are provided for enabling DBRs. DBR bits x and the r/w-bit should be cleared to 0 for the DBRP which is going to be used for the PMU. PSR.db has no effect when DBRs are used for this purpose.
Note: On reset, PAL will initialize register PMC41 to 0x02078fefefefe. Software must preserve the values of the reserved bits or undefined behavior may occur. (Unlike other registers that require all reserved bits to be set to 0, some PMC41 reserved bits are set to 1.)
3.3.8 Instruction EAR (PMC37/PMD34,35)
This section defines the register layout for the Intel® Itanium® processor 9300 series instruction event address registers (IEAR). The IEAR, configured through PMC37, can be programmed in one of two modes: instruction cache and instruction TLB miss collection. EAR specific unit masks allow software to specify event collection parameters to hardware. Figure 3-18 and Table 3-14 detail the register layout of PMC37. The instruction address, latency and other captured event parameters are provided in two PMD registers (PMD34,35). Table 3-19 describes the event address data registers.
Both the instruction and data cache EARs (see Section 3.3.9) report the latency of captured cache events and allow latency thresholding to qualify event capture. Event address data registers (PMD32-36) contain valid data only when event collection is frozen (PMC0.fr is one). Reads of PMD32-36 while event collection is enabled return undefined values.
Figure 3-18. Instruction Event Address Configuration Register (PMC37)
63 16 15 14 13 12 11 5 4 3 0
ig rsv ct umask pm plm2 2 7 1 4
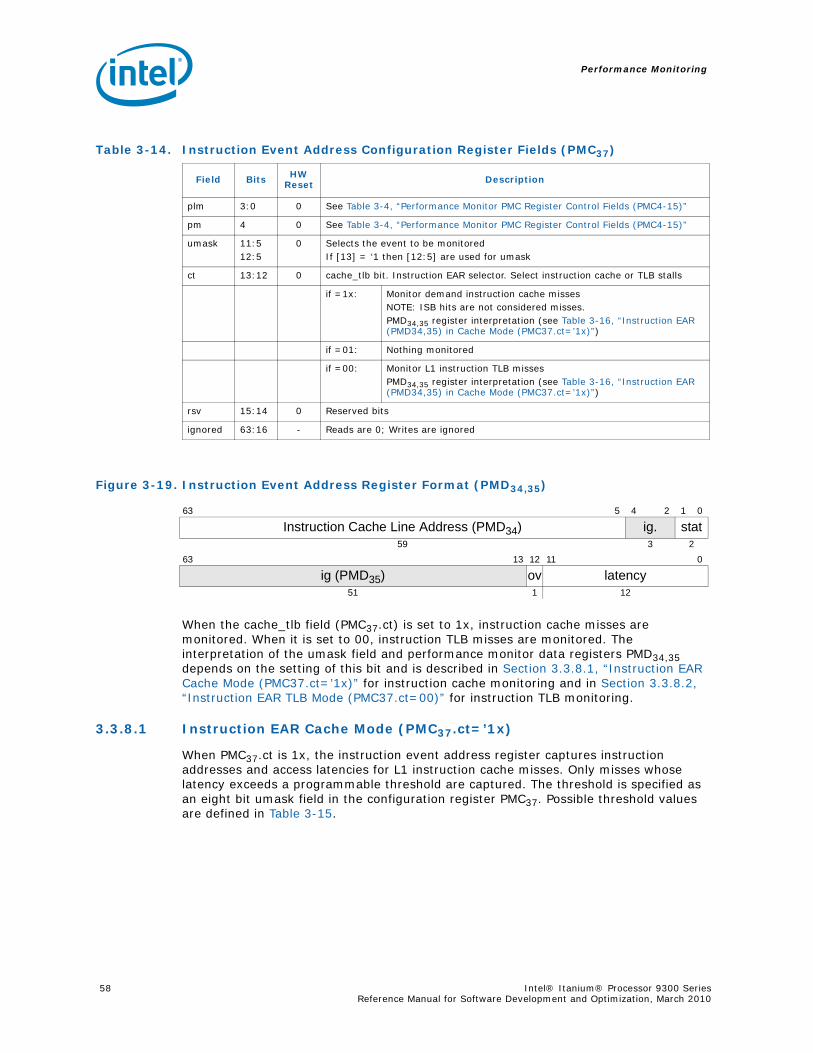
Performance Monitoring
58 Intel® Itanium® Processor 9300 Series Reference Manual for Software Development and Optimization, March 2010
Figure 3-19. Instruction Event Address Register Format (PMD34,35)
When the cache_tlb field (PMC37.ct) is set to 1x, instruction cache misses are monitored. When it is set to 00, instruction TLB misses are monitored. The interpretation of the umask field and performance monitor data registers PMD34,35 depends on the setting of this bit and is described in Section 3.3.8.1, “Instruction EAR Cache Mode (PMC37.ct=’1x)” for instruction cache monitoring and in Section 3.3.8.2, “Instruction EAR TLB Mode (PMC37.ct=00)” for instruction TLB monitoring.
3.3.8.1 Instruction EAR Cache Mode (PMC37.ct=’1x)
When PMC37.ct is 1x, the instruction event address register captures instruction addresses and access latencies for L1 instruction cache misses. Only misses whose latency exceeds a programmable threshold are captured. The threshold is specified as an eight bit umask field in the configuration register PMC37. Possible threshold values are defined in Table 3-15.
Table 3-14. Instruction Event Address Configuration Register Fields (PMC37)
Field Bits HW Reset Description
plm 3:0 0 See Table 3-4, “Performance Monitor PMC Register Control Fields (PMC4-15)”
pm 4 0 See Table 3-4, “Performance Monitor PMC Register Control Fields (PMC4-15)”
umask 11:512:5
0 Selects the event to be monitoredIf [13] = ‘1 then [12:5] are used for umask
ct 13:12 0 cache_tlb bit. Instruction EAR selector. Select instruction cache or TLB stalls
if =1x: Monitor demand instruction cache misses NOTE: ISB hits are not considered misses.PMD34,35 register interpretation (see Table 3-16, “Instruction EAR (PMD34,35) in Cache Mode (PMC37.ct=’1x)”)
if =01: Nothing monitored
if =00: Monitor L1 instruction TLB missesPMD34,35 register interpretation (see Table 3-16, “Instruction EAR (PMD34,35) in Cache Mode (PMC37.ct=’1x)”)
rsv 15:14 0 Reserved bits
ignored 63:16 - Reads are 0; Writes are ignored
63 5 4 2 1 0
Instruction Cache Line Address (PMD34) ig. stat59 3 2
63 13 12 11 0
ig (PMD35) ov latency51 1 12
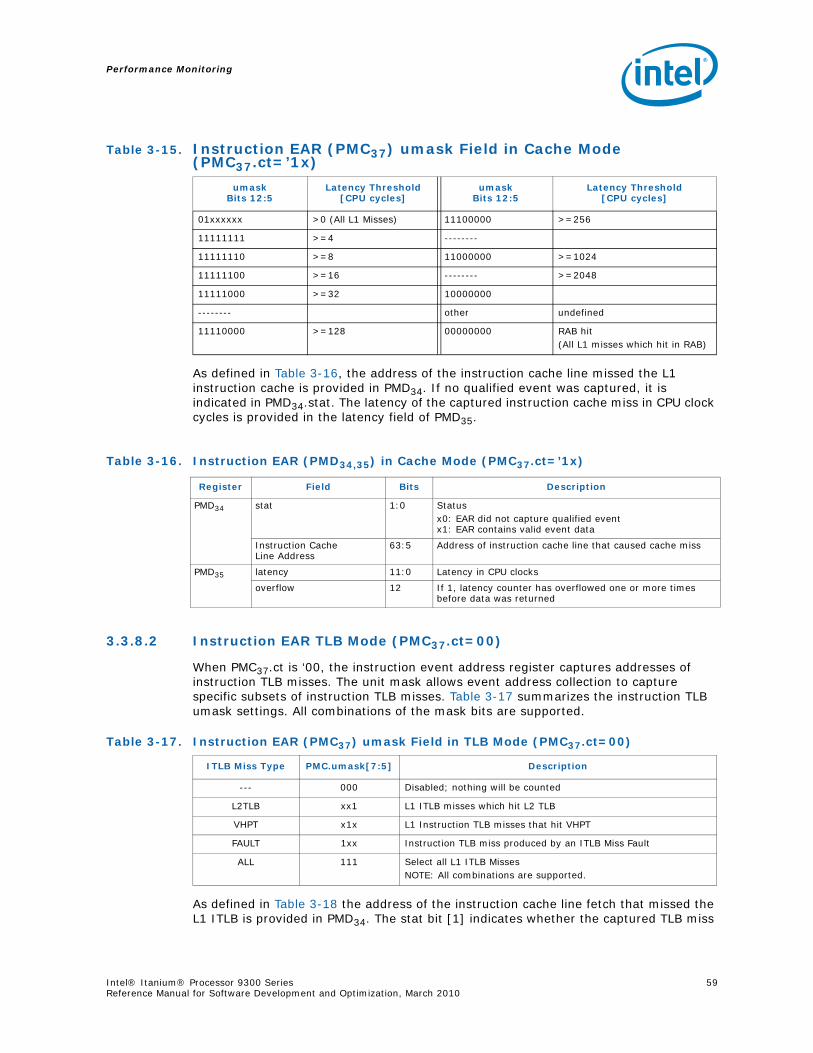
Performance Monitoring
Intel® Itanium® Processor 9300 Series 59Reference Manual for Software Development and Optimization, March 2010
As defined in Table 3-16, the address of the instruction cache line missed the L1 instruction cache is provided in PMD34. If no qualified event was captured, it is indicated in PMD34.stat. The latency of the captured instruction cache miss in CPU clock cycles is provided in the latency field of PMD35.
3.3.8.2 Instruction EAR TLB Mode (PMC37.ct=00)
When PMC37.ct is ‘00, the instruction event address register captures addresses of instruction TLB misses. The unit mask allows event address collection to capture specific subsets of instruction TLB misses. Table 3-17 summarizes the instruction TLB umask settings. All combinations of the mask bits are supported.
As defined in Table 3-18 the address of the instruction cache line fetch that missed the L1 ITLB is provided in PMD34. The stat bit [1] indicates whether the captured TLB miss
Table 3-15. Instruction EAR (PMC37) umask Field in Cache Mode (PMC37.ct=’1x)
umaskBits 12:5
Latency Threshold[CPU cycles]
umaskBits 12:5
Latency Threshold[CPU cycles]
01xxxxxx >0 (All L1 Misses) 11100000 >=256
11111111 >=4 --------
11111110 >=8 11000000 >=1024
11111100 >=16 -------- >=2048
11111000 >=32 10000000
-------- other undefined
11110000 >=128 00000000 RAB hit (All L1 misses which hit in RAB)
Table 3-16. Instruction EAR (PMD34,35) in Cache Mode (PMC37.ct=’1x)
Register Field Bits Description
PMD34 stat 1:0 Statusx0: EAR did not capture qualified eventx1: EAR contains valid event data
Instruction CacheLine Address
63:5 Address of instruction cache line that caused cache miss
PMD35 latency 11:0 Latency in CPU clocks
overflow 12 If 1, latency counter has overflowed one or more times before data was returned
Table 3-17. Instruction EAR (PMC37) umask Field in TLB Mode (PMC37.ct=00)
ITLB Miss Type PMC.umask[7:5] Description
--- 000 Disabled; nothing will be counted
L2TLB xx1 L1 ITLB misses which hit L2 TLB
VHPT x1x L1 Instruction TLB misses that hit VHPT
FAULT 1xx Instruction TLB miss produced by an ITLB Miss Fault
ALL 111 Select all L1 ITLB MissesNOTE: All combinations are supported.
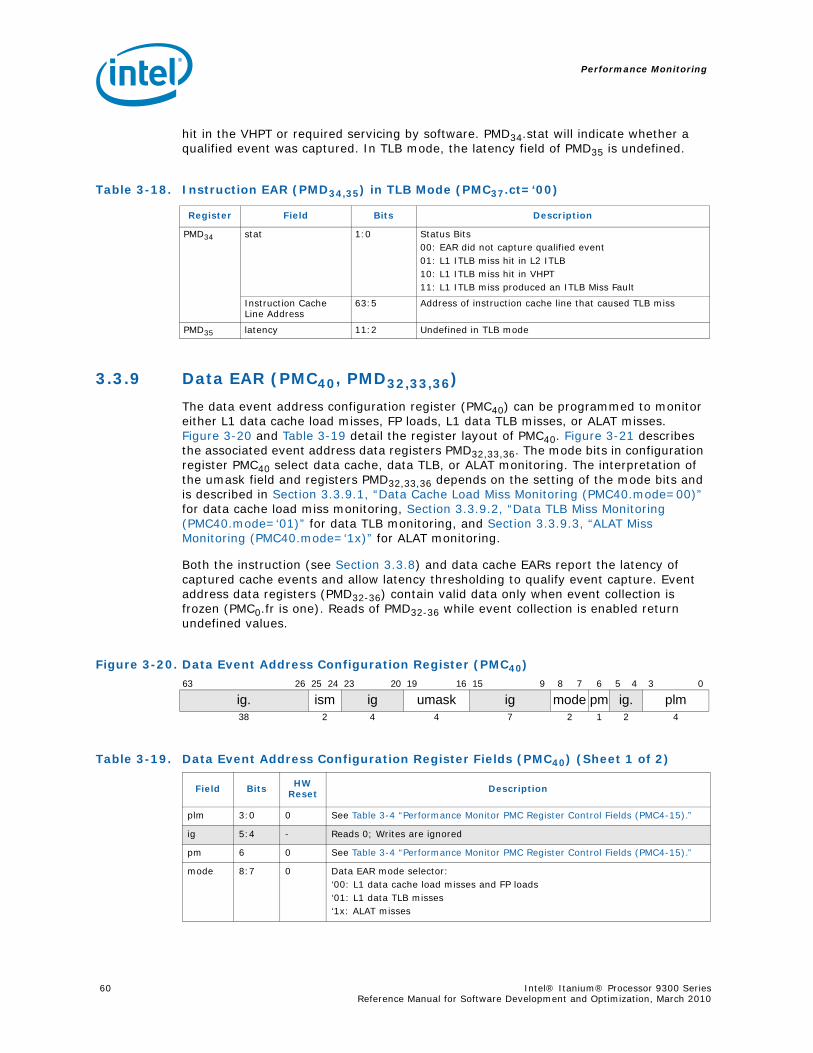
Performance Monitoring
60 Intel® Itanium® Processor 9300 Series Reference Manual for Software Development and Optimization, March 2010
hit in the VHPT or required servicing by software. PMD34.stat will indicate whether a qualified event was captured. In TLB mode, the latency field of PMD35 is undefined.
3.3.9 Data EAR (PMC40, PMD32,33,36)
The data event address configuration register (PMC40) can be programmed to monitor either L1 data cache load misses, FP loads, L1 data TLB misses, or ALAT misses. Figure 3-20 and Table 3-19 detail the register layout of PMC40. Figure 3-21 describes the associated event address data registers PMD32,33,36. The mode bits in configuration register PMC40 select data cache, data TLB, or ALAT monitoring. The interpretation of the umask field and registers PMD32,33,36 depends on the setting of the mode bits and is described in Section 3.3.9.1, “Data Cache Load Miss Monitoring (PMC40.mode=00)” for data cache load miss monitoring, Section 3.3.9.2, “Data TLB Miss Monitoring (PMC40.mode=‘01)” for data TLB monitoring, and Section 3.3.9.3, “ALAT Miss Monitoring (PMC40.mode=‘1x)” for ALAT monitoring.
Both the instruction (see Section 3.3.8) and data cache EARs report the latency of captured cache events and allow latency thresholding to qualify event capture. Event address data registers (PMD32-36) contain valid data only when event collection is frozen (PMC0.fr is one). Reads of PMD32-36 while event collection is enabled return undefined values.
Table 3-18. Instruction EAR (PMD34,35) in TLB Mode (PMC37.ct=‘00)
Register Field Bits Description
PMD34 stat 1:0 Status Bits00: EAR did not capture qualified event01: L1 ITLB miss hit in L2 ITLB10: L1 ITLB miss hit in VHPT11: L1 ITLB miss produced an ITLB Miss Fault
Instruction CacheLine Address
63:5 Address of instruction cache line that caused TLB miss
PMD35 latency 11:2 Undefined in TLB mode
Figure 3-20. Data Event Address Configuration Register (PMC40)
63 26 25 24 23 20 19 16 15 9 8 7 6 5 4 3 0
ig. ism ig umask ig mode pm ig. plm38 2 4 4 7 2 1 2 4
Table 3-19. Data Event Address Configuration Register Fields (PMC40) (Sheet 1 of 2)
Field Bits HW Reset Description
plm 3:0 0 See Table 3-4 “Performance Monitor PMC Register Control Fields (PMC4-15).”
ig 5:4 - Reads 0; Writes are ignored
pm 6 0 See Table 3-4 “Performance Monitor PMC Register Control Fields (PMC4-15).”
mode 8:7 0 Data EAR mode selector:‘00: L1 data cache load misses and FP loads‘01: L1 data TLB misses‘1x: ALAT misses
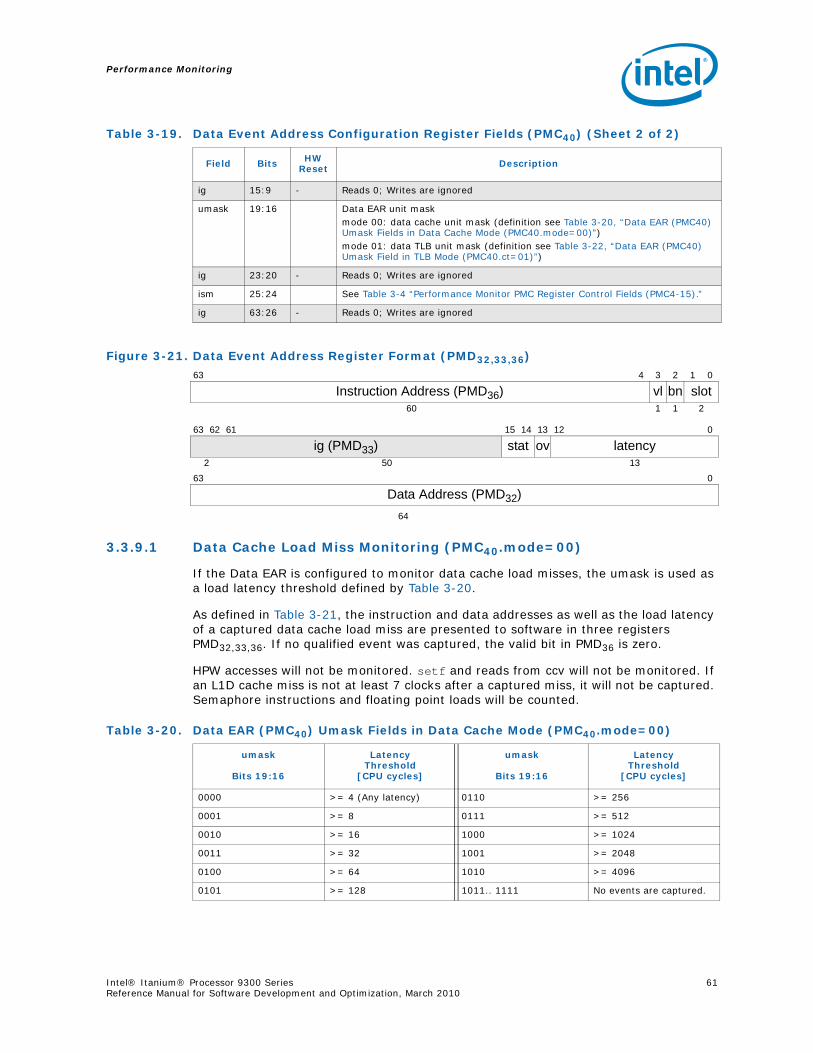
Performance Monitoring
Intel® Itanium® Processor 9300 Series 61Reference Manual for Software Development and Optimization, March 2010
3.3.9.1 Data Cache Load Miss Monitoring (PMC40.mode=00)
If the Data EAR is configured to monitor data cache load misses, the umask is used as a load latency threshold defined by Table 3-20.
As defined in Table 3-21, the instruction and data addresses as well as the load latency of a captured data cache load miss are presented to software in three registers PMD32,33,36. If no qualified event was captured, the valid bit in PMD36 is zero.
HPW accesses will not be monitored. setf and reads from ccv will not be monitored. If an L1D cache miss is not at least 7 clocks after a captured miss, it will not be captured. Semaphore instructions and floating point loads will be counted.
ig 15:9 - Reads 0; Writes are ignored
umask 19:16 Data EAR unit mask mode 00: data cache unit mask (definition see Table 3-20, “Data EAR (PMC40) Umask Fields in Data Cache Mode (PMC40.mode=00)”) mode 01: data TLB unit mask (definition see Table 3-22, “Data EAR (PMC40) Umask Field in TLB Mode (PMC40.ct=01)”)
ig 23:20 - Reads 0; Writes are ignored
ism 25:24 See Table 3-4 “Performance Monitor PMC Register Control Fields (PMC4-15).”
ig 63:26 - Reads 0; Writes are ignored
Table 3-19. Data Event Address Configuration Register Fields (PMC40) (Sheet 2 of 2)
Field Bits HW Reset Description
Figure 3-21. Data Event Address Register Format (PMD32,33,36)
63 4 3 2 1 0
Instruction Address (PMD36) vl bn slot60 1 1 2
63 62 61 15 14 13 12 0
ig (PMD33) stat ov latency2 50 13
63 0
Data Address (PMD32)64
Table 3-20. Data EAR (PMC40) Umask Fields in Data Cache Mode (PMC40.mode=00)
umask
Bits 19:16
LatencyThreshold
[CPU cycles]
umask
Bits 19:16
LatencyThreshold
[CPU cycles]
0000 >= 4 (Any latency) 0110 >= 256
0001 >= 8 0111 >= 512
0010 >= 16 1000 >= 1024
0011 >= 32 1001 >= 2048
0100 >= 64 1010 >= 4096
0101 >= 128 1011.. 1111 No events are captured.
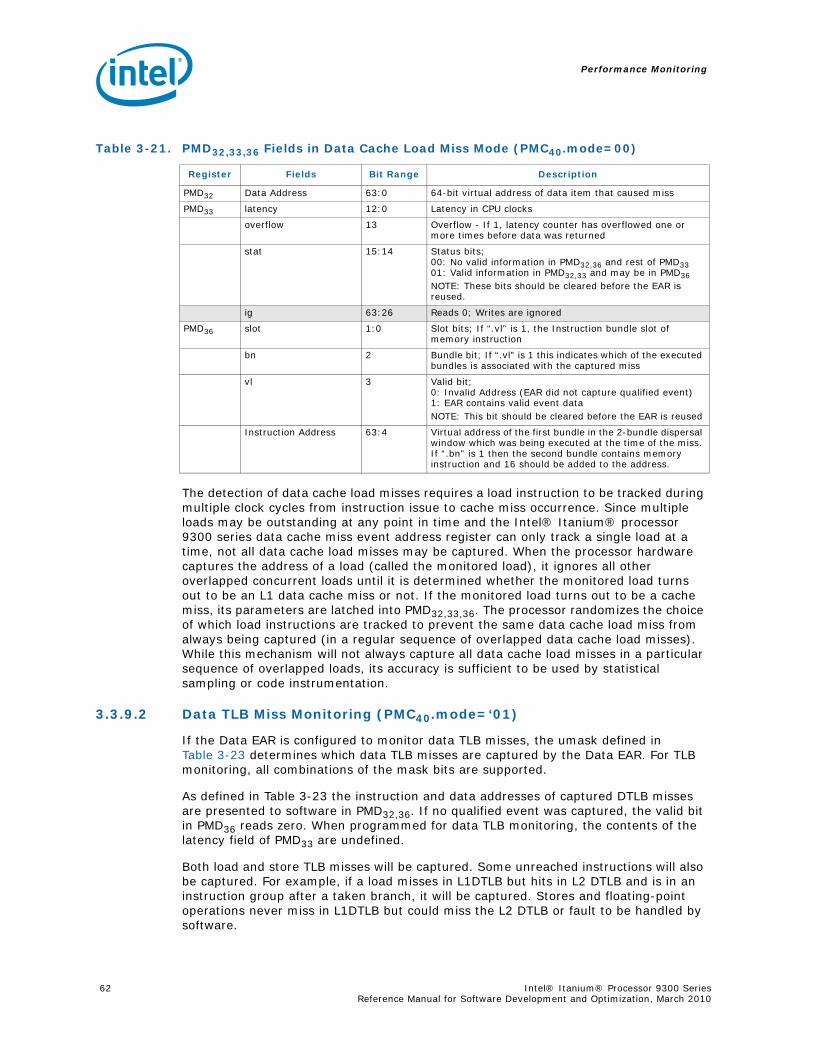
Performance Monitoring
62 Intel® Itanium® Processor 9300 Series Reference Manual for Software Development and Optimization, March 2010
The detection of data cache load misses requires a load instruction to be tracked during multiple clock cycles from instruction issue to cache miss occurrence. Since multiple loads may be outstanding at any point in time and the Intel® Itanium® processor 9300 series data cache miss event address register can only track a single load at a time, not all data cache load misses may be captured. When the processor hardware captures the address of a load (called the monitored load), it ignores all other overlapped concurrent loads until it is determined whether the monitored load turns out to be an L1 data cache miss or not. If the monitored load turns out to be a cache miss, its parameters are latched into PMD32,33,36. The processor randomizes the choice of which load instructions are tracked to prevent the same data cache load miss from always being captured (in a regular sequence of overlapped data cache load misses). While this mechanism will not always capture all data cache load misses in a particular sequence of overlapped loads, its accuracy is sufficient to be used by statistical sampling or code instrumentation.
3.3.9.2 Data TLB Miss Monitoring (PMC40.mode=‘01)
If the Data EAR is configured to monitor data TLB misses, the umask defined in Table 3-23 determines which data TLB misses are captured by the Data EAR. For TLB monitoring, all combinations of the mask bits are supported.
As defined in Table 3-23 the instruction and data addresses of captured DTLB misses are presented to software in PMD32,36. If no qualified event was captured, the valid bit in PMD36 reads zero. When programmed for data TLB monitoring, the contents of the latency field of PMD33 are undefined.
Both load and store TLB misses will be captured. Some unreached instructions will also be captured. For example, if a load misses in L1DTLB but hits in L2 DTLB and is in an instruction group after a taken branch, it will be captured. Stores and floating-point operations never miss in L1DTLB but could miss the L2 DTLB or fault to be handled by software.
Table 3-21. PMD32,33,36 Fields in Data Cache Load Miss Mode (PMC40.mode=00)
Register Fields Bit Range Description
PMD32 Data Address 63:0 64-bit virtual address of data item that caused miss
PMD33 latency 12:0 Latency in CPU clocks
overflow 13 Overflow - If 1, latency counter has overflowed one or more times before data was returned
stat 15:14 Status bits;00: No valid information in PMD32,36 and rest of PMD3301: Valid information in PMD32,33 and may be in PMD36NOTE: These bits should be cleared before the EAR is reused.
ig 63:26 Reads 0; Writes are ignored
PMD36 slot 1:0 Slot bits; If “.vl” is 1, the Instruction bundle slot of memory instruction
bn 2 Bundle bit; If “.vl” is 1 this indicates which of the executed bundles is associated with the captured miss
vl 3 Valid bit;0: Invalid Address (EAR did not capture qualified event)1: EAR contains valid event dataNOTE: This bit should be cleared before the EAR is reused
Instruction Address 63:4 Virtual address of the first bundle in the 2-bundle dispersal window which was being executed at the time of the miss. If “.bn” is 1 then the second bundle contains memory instruction and 16 should be added to the address.
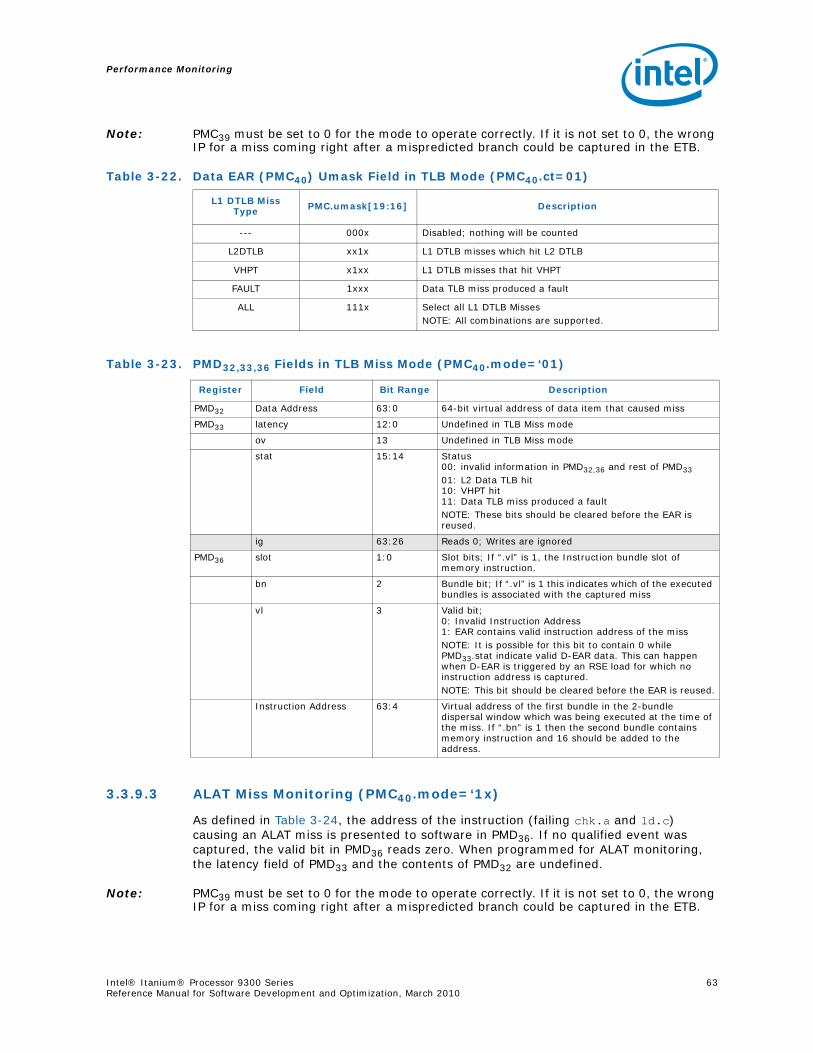
Performance Monitoring
Intel® Itanium® Processor 9300 Series 63Reference Manual for Software Development and Optimization, March 2010
Note: PMC39 must be set to 0 for the mode to operate correctly. If it is not set to 0, the wrong IP for a miss coming right after a mispredicted branch could be captured in the ETB.
3.3.9.3 ALAT Miss Monitoring (PMC40.mode=‘1x)
As defined in Table 3-24, the address of the instruction (failing chk.a and ld.c) causing an ALAT miss is presented to software in PMD36. If no qualified event was captured, the valid bit in PMD36 reads zero. When programmed for ALAT monitoring, the latency field of PMD33 and the contents of PMD32 are undefined.
Note: PMC39 must be set to 0 for the mode to operate correctly. If it is not set to 0, the wrong IP for a miss coming right after a mispredicted branch could be captured in the ETB.
Table 3-22. Data EAR (PMC40) Umask Field in TLB Mode (PMC40.ct=01)
L1 DTLB Miss Type PMC.umask[19:16] Description
--- 000x Disabled; nothing will be counted
L2DTLB xx1x L1 DTLB misses which hit L2 DTLB
VHPT x1xx L1 DTLB misses that hit VHPT
FAULT 1xxx Data TLB miss produced a fault
ALL 111x Select all L1 DTLB MissesNOTE: All combinations are supported.
Table 3-23. PMD32,33,36 Fields in TLB Miss Mode (PMC40.mode=‘01)
Register Field Bit Range Description
PMD32 Data Address 63:0 64-bit virtual address of data item that caused miss
PMD33 latency 12:0 Undefined in TLB Miss mode
ov 13 Undefined in TLB Miss mode
stat 15:14 Status00: invalid information in PMD32,36 and rest of PMD3301: L2 Data TLB hit10: VHPT hit11: Data TLB miss produced a faultNOTE: These bits should be cleared before the EAR is reused.
ig 63:26 Reads 0; Writes are ignored
PMD36 slot 1:0 Slot bits; If “.vl” is 1, the Instruction bundle slot of memory instruction.
bn 2 Bundle bit; If “.vl” is 1 this indicates which of the executed bundles is associated with the captured miss
vl 3 Valid bit;0: Invalid Instruction Address1: EAR contains valid instruction address of the missNOTE: It is possible for this bit to contain 0 while PMD33.stat indicate valid D-EAR data. This can happen when D-EAR is triggered by an RSE load for which no instruction address is captured.NOTE: This bit should be cleared before the EAR is reused.
Instruction Address 63:4 Virtual address of the first bundle in the 2-bundle dispersal window which was being executed at the time of the miss. If “.bn” is 1 then the second bundle contains memory instruction and 16 should be added to the address.
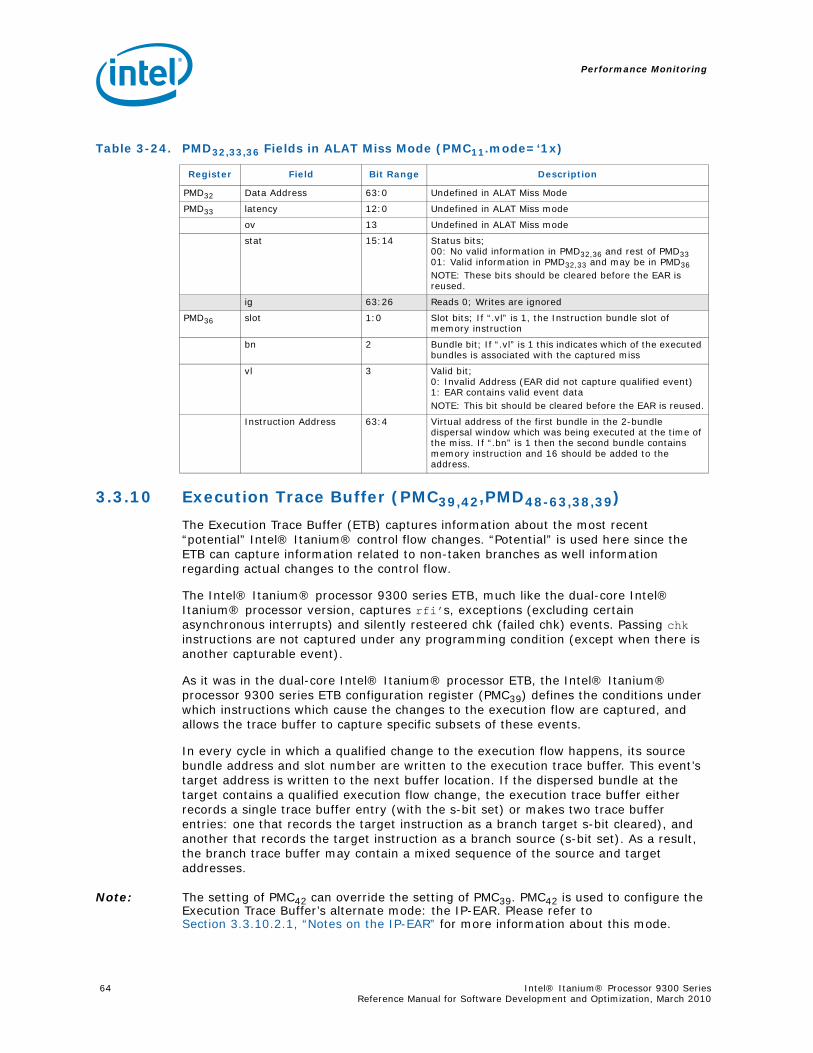
Performance Monitoring
64 Intel® Itanium® Processor 9300 Series Reference Manual for Software Development and Optimization, March 2010
3.3.10 Execution Trace Buffer (PMC39,42,PMD48-63,38,39)
The Execution Trace Buffer (ETB) captures information about the most recent “potential” Intel® Itanium® control flow changes. “Potential” is used here since the ETB can capture information related to non-taken branches as well information regarding actual changes to the control flow.
The Intel® Itanium® processor 9300 series ETB, much like the dual-core Intel® Itanium® processor version, captures rfi’s, exceptions (excluding certain asynchronous interrupts) and silently resteered chk (failed chk) events. Passing chk instructions are not captured under any programming condition (except when there is another capturable event).
As it was in the dual-core Intel® Itanium® processor ETB, the Intel® Itanium® processor 9300 series ETB configuration register (PMC39) defines the conditions under which instructions which cause the changes to the execution flow are captured, and allows the trace buffer to capture specific subsets of these events.
In every cycle in which a qualified change to the execution flow happens, its source bundle address and slot number are written to the execution trace buffer. This event’s target address is written to the next buffer location. If the dispersed bundle at the target contains a qualified execution flow change, the execution trace buffer either records a single trace buffer entry (with the s-bit set) or makes two trace buffer entries: one that records the target instruction as a branch target s-bit cleared), and another that records the target instruction as a branch source (s-bit set). As a result, the branch trace buffer may contain a mixed sequence of the source and target addresses.
Note: The setting of PMC42 can override the setting of PMC39. PMC42 is used to configure the Execution Trace Buffer’s alternate mode: the IP-EAR. Please refer to Section 3.3.10.2.1, “Notes on the IP-EAR” for more information about this mode.
Table 3-24. PMD32,33,36 Fields in ALAT Miss Mode (PMC11.mode=‘1x)
Register Field Bit Range Description
PMD32 Data Address 63:0 Undefined in ALAT Miss Mode
PMD33 latency 12:0 Undefined in ALAT Miss mode
ov 13 Undefined in ALAT Miss mode
stat 15:14 Status bits;00: No valid information in PMD32,36 and rest of PMD3301: Valid information in PMD32,33 and may be in PMD36NOTE: These bits should be cleared before the EAR is reused.
ig 63:26 Reads 0; Writes are ignored
PMD36 slot 1:0 Slot bits; If “.vl” is 1, the Instruction bundle slot of memory instruction
bn 2 Bundle bit; If “.vl” is 1 this indicates which of the executed bundles is associated with the captured miss
vl 3 Valid bit;0: Invalid Address (EAR did not capture qualified event)1: EAR contains valid event dataNOTE: This bit should be cleared before the EAR is reused.
Instruction Address 63:4 Virtual address of the first bundle in the 2-bundle dispersal window which was being executed at the time of the miss. If “.bn” is 1 then the second bundle contains memory instruction and 16 should be added to the address.
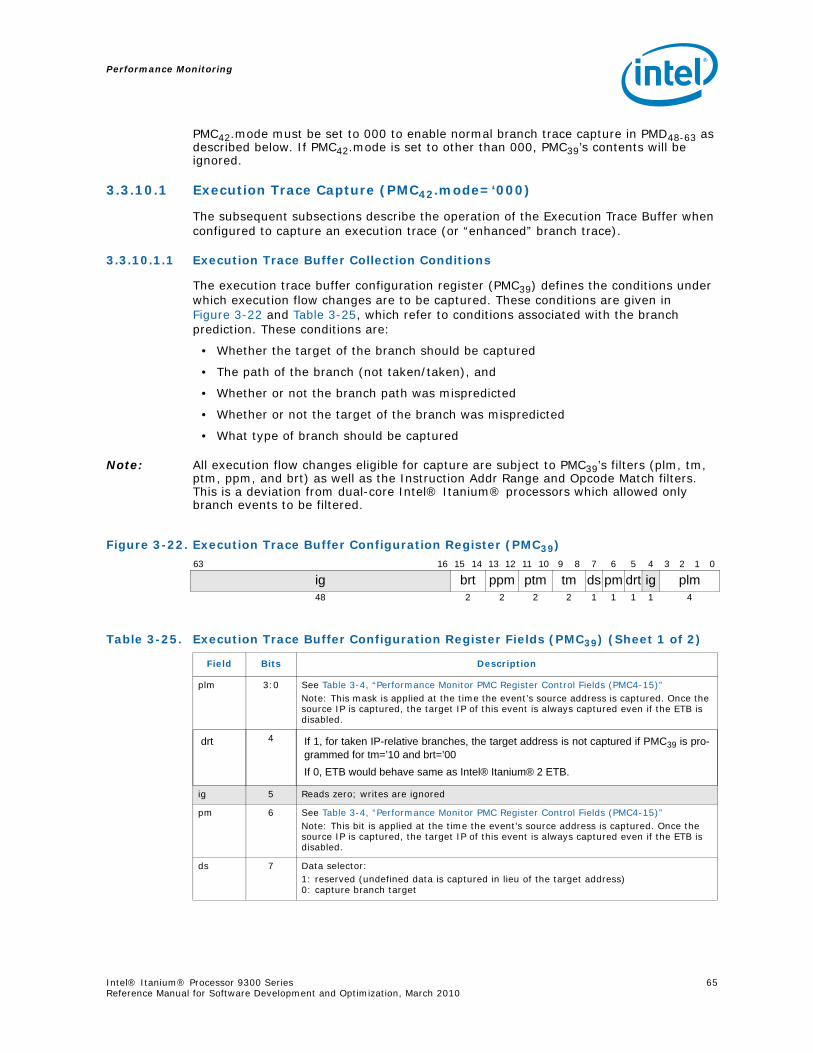
Performance Monitoring
Intel® Itanium® Processor 9300 Series 65Reference Manual for Software Development and Optimization, March 2010
PMC42.mode must be set to 000 to enable normal branch trace capture in PMD48-63 as described below. If PMC42.mode is set to other than 000, PMC39’s contents will be ignored.
3.3.10.1 Execution Trace Capture (PMC42.mode=‘000)
The subsequent subsections describe the operation of the Execution Trace Buffer when configured to capture an execution trace (or “enhanced” branch trace).
3.3.10.1.1 Execution Trace Buffer Collection Conditions
The execution trace buffer configuration register (PMC39) defines the conditions under which execution flow changes are to be captured. These conditions are given in Figure 3-22 and Table 3-25, which refer to conditions associated with the branch prediction. These conditions are:
• Whether the target of the branch should be captured
• The path of the branch (not taken/taken), and
• Whether or not the branch path was mispredicted
• Whether or not the target of the branch was mispredicted
• What type of branch should be captured
Note: All execution flow changes eligible for capture are subject to PMC39’s filters (plm, tm, ptm, ppm, and brt) as well as the Instruction Addr Range and Opcode Match filters. This is a deviation from dual-core Intel® Itanium® processors which allowed only branch events to be filtered.
Figure 3-22. Execution Trace Buffer Configuration Register (PMC39)
63 16 15 14 13 12 11 10 9 8 7 6 5 4 3 2 1 0
ig brt ppm ptm tm ds pm drt ig plm48 2 2 2 2 1 1 1 1 4
Table 3-25. Execution Trace Buffer Configuration Register Fields (PMC39) (Sheet 1 of 2)
Field Bits Description
plm 3:0 See Table 3-4, “Performance Monitor PMC Register Control Fields (PMC4-15)”Note: This mask is applied at the time the event’s source address is captured. Once the source IP is captured, the target IP of this event is always captured even if the ETB is disabled.
drt 4 If 1, for taken IP-relative branches, the target address is not captured if PMC39 is pro-grammed for tm=’10 and brt=’00If 0, ETB would behave same as Intel® Itanium® 2 ETB.
ig 5 Reads zero; writes are ignored
pm 6 See Table 3-4, “Performance Monitor PMC Register Control Fields (PMC4-15)”Note: This bit is applied at the time the event’s source address is captured. Once the source IP is captured, the target IP of this event is always captured even if the ETB is disabled.
ds 7 Data selector:1: reserved (undefined data is captured in lieu of the target address)0: capture branch target
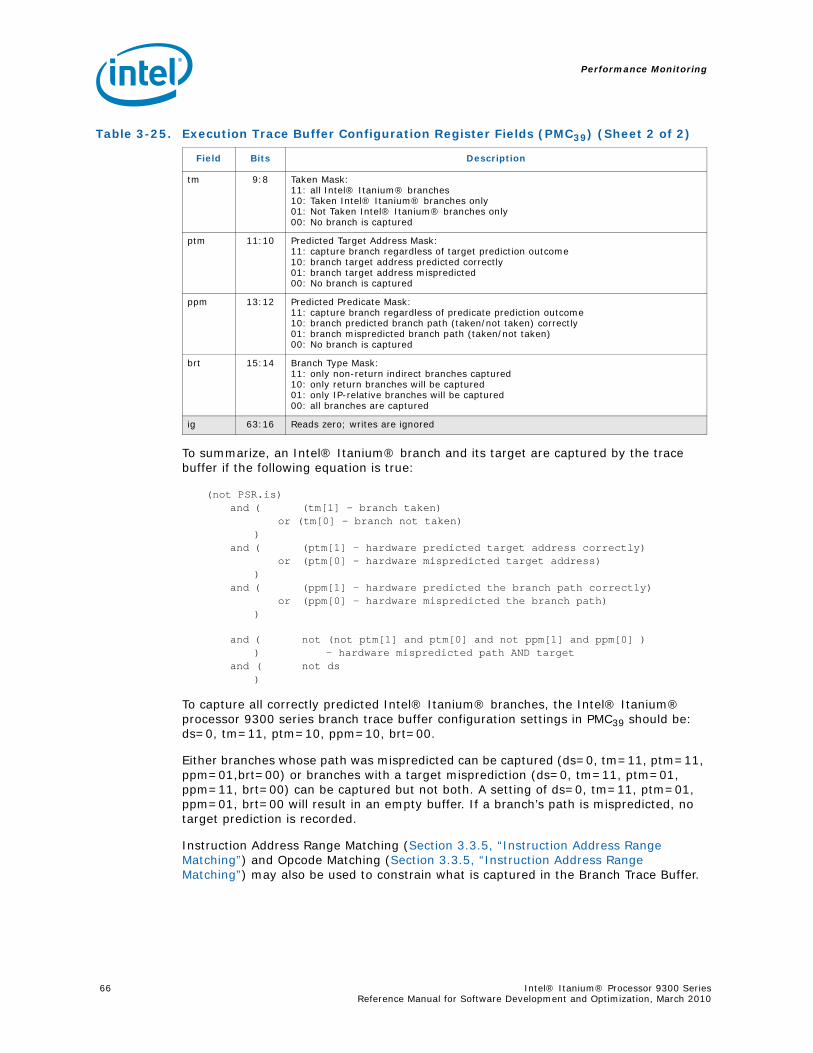
Performance Monitoring
66 Intel® Itanium® Processor 9300 Series Reference Manual for Software Development and Optimization, March 2010
To summarize, an Intel® Itanium® branch and its target are captured by the trace buffer if the following equation is true:
(not PSR.is) and ( (tm[1] - branch taken)
or (tm[0] - branch not taken))
and ( (ptm[1] - hardware predicted target address correctly)or (ptm[0] - hardware mispredicted target address)
)and ( (ppm[1] - hardware predicted the branch path correctly)
or (ppm[0] - hardware mispredicted the branch path))
and ( not (not ptm[1] and ptm[0] and not ppm[1] and ppm[0] ) ) - hardware mispredicted path AND target
and ( not ds)
To capture all correctly predicted Intel® Itanium® branches, the Intel® Itanium® processor 9300 series branch trace buffer configuration settings in PMC39 should be: ds=0, tm=11, ptm=10, ppm=10, brt=00.
Either branches whose path was mispredicted can be captured (ds=0, tm=11, ptm=11, ppm=01,brt=00) or branches with a target misprediction (ds=0, tm=11, ptm=01, ppm=11, brt=00) can be captured but not both. A setting of ds=0, tm=11, ptm=01, ppm=01, brt=00 will result in an empty buffer. If a branch’s path is mispredicted, no target prediction is recorded.
Instruction Address Range Matching (Section 3.3.5, “Instruction Address Range Matching”) and Opcode Matching (Section 3.3.5, “Instruction Address Range Matching”) may also be used to constrain what is captured in the Branch Trace Buffer.
tm 9:8 Taken Mask:11: all Intel® Itanium® branches10: Taken Intel® Itanium® branches only01: Not Taken Intel® Itanium® branches only00: No branch is captured
ptm 11:10 Predicted Target Address Mask:11: capture branch regardless of target prediction outcome10: branch target address predicted correctly01: branch target address mispredicted00: No branch is captured
ppm 13:12 Predicted Predicate Mask:11: capture branch regardless of predicate prediction outcome10: branch predicted branch path (taken/not taken) correctly01: branch mispredicted branch path (taken/not taken)00: No branch is captured
brt 15:14 Branch Type Mask:11: only non-return indirect branches captured10: only return branches will be captured01: only IP-relative branches will be captured00: all branches are captured
ig 63:16 Reads zero; writes are ignored
Table 3-25. Execution Trace Buffer Configuration Register Fields (PMC39) (Sheet 2 of 2)
Field Bits Description
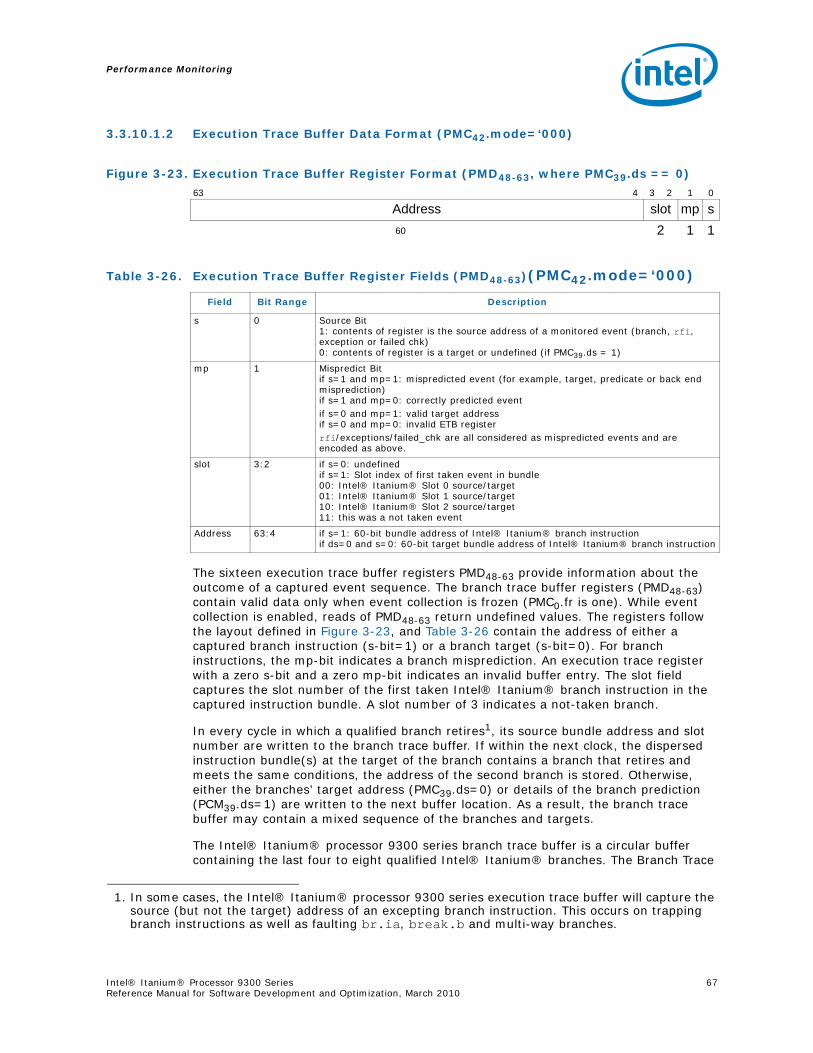
Performance Monitoring
Intel® Itanium® Processor 9300 Series 67Reference Manual for Software Development and Optimization, March 2010
3.3.10.1.2 Execution Trace Buffer Data Format (PMC42.mode=‘000)
The sixteen execution trace buffer registers PMD48-63 provide information about the outcome of a captured event sequence. The branch trace buffer registers (PMD48-63) contain valid data only when event collection is frozen (PMC0.fr is one). While event collection is enabled, reads of PMD48-63 return undefined values. The registers follow the layout defined in Figure 3-23, and Table 3-26 contain the address of either a captured branch instruction (s-bit=1) or a branch target (s-bit=0). For branch instructions, the mp-bit indicates a branch misprediction. An execution trace register with a zero s-bit and a zero mp-bit indicates an invalid buffer entry. The slot field captures the slot number of the first taken Intel® Itanium® branch instruction in the captured instruction bundle. A slot number of 3 indicates a not-taken branch.
In every cycle in which a qualified branch retires1, its source bundle address and slot number are written to the branch trace buffer. If within the next clock, the dispersed instruction bundle(s) at the target of the branch contains a branch that retires and meets the same conditions, the address of the second branch is stored. Otherwise, either the branches’ target address (PMC39.ds=0) or details of the branch prediction (PCM39.ds=1) are written to the next buffer location. As a result, the branch trace buffer may contain a mixed sequence of the branches and targets.
The Intel® Itanium® processor 9300 series branch trace buffer is a circular buffer containing the last four to eight qualified Intel® Itanium® branches. The Branch Trace
Figure 3-23. Execution Trace Buffer Register Format (PMD48-63, where PMC39.ds == 0)
63 4 3 2 1 0
Address slot mp s60 2 1 1
Table 3-26. Execution Trace Buffer Register Fields (PMD48-63)(PMC42.mode=‘000)
Field Bit Range Description
s 0 Source Bit1: contents of register is the source address of a monitored event (branch, rfi, exception or failed chk)0: contents of register is a target or undefined (if PMC39.ds = 1)
mp 1 Mispredict Bitif s=1 and mp=1: mispredicted event (for example, target, predicate or back end misprediction)if s=1 and mp=0: correctly predicted eventif s=0 and mp=1: valid target addressif s=0 and mp=0: invalid ETB registerrfi/exceptions/failed_chk are all considered as mispredicted events and are encoded as above.
slot 3:2 if s=0: undefinedif s=1: Slot index of first taken event in bundle00: Intel® Itanium® Slot 0 source/target01: Intel® Itanium® Slot 1 source/target10: Intel® Itanium® Slot 2 source/target11: this was a not taken event
Address 63:4 if s=1: 60-bit bundle address of Intel® Itanium® branch instructionif ds=0 and s=0: 60-bit target bundle address of Intel® Itanium® branch instruction
1. In some cases, the Intel® Itanium® processor 9300 series execution trace buffer will capture the source (but not the target) address of an excepting branch instruction. This occurs on trapping branch instructions as well as faulting br.ia, break.b and multi-way branches.
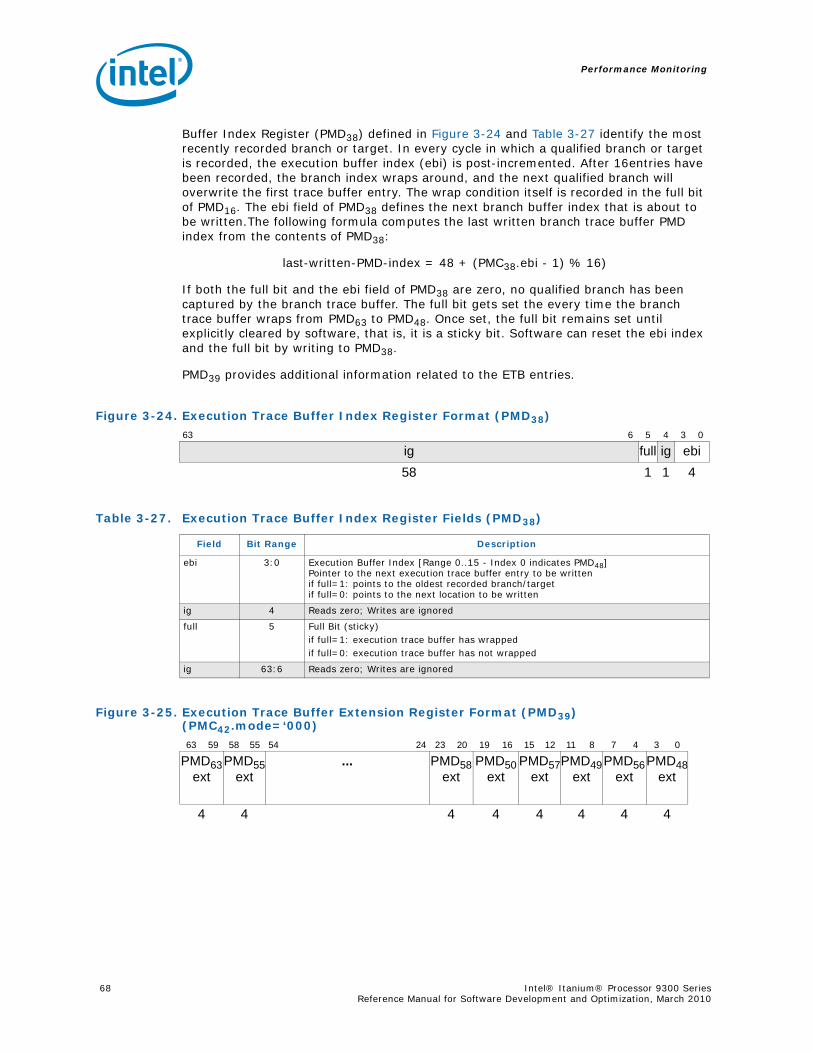
Performance Monitoring
68 Intel® Itanium® Processor 9300 Series Reference Manual for Software Development and Optimization, March 2010
Buffer Index Register (PMD38) defined in Figure 3-24 and Table 3-27 identify the most recently recorded branch or target. In every cycle in which a qualified branch or target is recorded, the execution buffer index (ebi) is post-incremented. After 16entries have been recorded, the branch index wraps around, and the next qualified branch will overwrite the first trace buffer entry. The wrap condition itself is recorded in the full bit of PMD16. The ebi field of PMD38 defines the next branch buffer index that is about to be written.The following formula computes the last written branch trace buffer PMD index from the contents of PMD38:
last-written-PMD-index = 48 + (PMC38.ebi - 1) % 16)
If both the full bit and the ebi field of PMD38 are zero, no qualified branch has been captured by the branch trace buffer. The full bit gets set the every time the branch trace buffer wraps from PMD63 to PMD48. Once set, the full bit remains set until explicitly cleared by software, that is, it is a sticky bit. Software can reset the ebi index and the full bit by writing to PMD38.
PMD39 provides additional information related to the ETB entries.
Figure 3-24. Execution Trace Buffer Index Register Format (PMD38)
63 6 5 4 3 0
ig full ig ebi58 1 1 4
Table 3-27. Execution Trace Buffer Index Register Fields (PMD38)
Field Bit Range Description
ebi 3:0 Execution Buffer Index [Range 0..15 - Index 0 indicates PMD48]Pointer to the next execution trace buffer entry to be writtenif full=1: points to the oldest recorded branch/targetif full=0: points to the next location to be written
ig 4 Reads zero; Writes are ignored
full 5 Full Bit (sticky)if full=1: execution trace buffer has wrappedif full=0: execution trace buffer has not wrapped
ig 63:6 Reads zero; Writes are ignored
Figure 3-25. Execution Trace Buffer Extension Register Format (PMD39) (PMC42.mode=‘000)
63 59 58 55 54 24 23 20 19 16 15 12 11 8 7 4 3 0
PMD63 ext
PMD55 ext
... PMD58 ext
PMD50 ext
PMD57 ext
PMD49 ext
PMD56 ext
PMD48 ext
4 4 4 4 4 4 4 4

Performance Monitoring
Intel® Itanium® Processor 9300 Series 69Reference Manual for Software Development and Optimization, March 2010
3.3.10.1.3 Notes on the Execution Trace Buffer
Although the Intel® Itanium® Processor 9300 Series ETB does not capture asynchronous interrupts as events, the address of these handlers can be captured as target addresses. This could happen if, at the target of a captured event (for example, taken branch), an asynchronous event is taken before executing any instruction at the target.
3.3.10.2 IP Event Address Capture (PMC42.mode=‘1xx)
The Intel® Itanium® processor 9300 series has a new feature called Instruction Pointer Address Capture (or IP-EAR). This feature is intended to facilitate the correlation of performance monitoring events to IP values. To do this, the Intel® Itanium® processor 9300 series Execution Trace Buffer (ETB) can be configured to capture IPs of retired instructions. When a performance monitoring event is used to trigger an IP-EAR freeze, if the IP which caused the event gets to retirement there is a good chance that IP would be captured in the ETB. The IP-EAR freezes after a programmable number of cycles following a PMU freeze as described below
Register PMC42 is used to configure this feature and the ETB registers(PMD48-63,39) are used to capture the data. PMD38 holds the index and overflow bits for the IP Buffer much as it does for the ETB.
Note: Setting PMC42.mode to a non-0 value will override the setting of PMC39 (the configuration register for the normal BTB mode).
Table 3-28. Execution Trace Buffer Extension Register Fields (PMD39) (PMC42.mode=‘000)
Field Bit Range Bits Description
PMD48 ext 3:0 3:2 ignoredReads zero; writes are ignored
1 bruflushIf PMD48.bits[1:0] = 11, 1 = back end mispredicted the branch and the pipeline was flushed by it0 = no pipeline flushes are associated with this branch
0 b1if PMD48.s = 1, then*1 = branch was from bundle 1, add 0x1 to PMD48.bits[63:4]0 = branch was from bundle 0, no correction is necessary
else, ignore*NOTE: If the entry represents both a source and a target entry, only add 0x1 to the source address.
PMD56 ext 7:4 Same as above for PMD56
PMD49 ext 11:8 Same as above for PMD49
PMD57 ext 15:12 Same as above for PMD57
PMD50 ext 19:16 Same as above for PMD50
PMD58 ext 23:20 Same as above for PMD58
so on so on so on
PMD63 ext 63:60 Same as above for PMD63
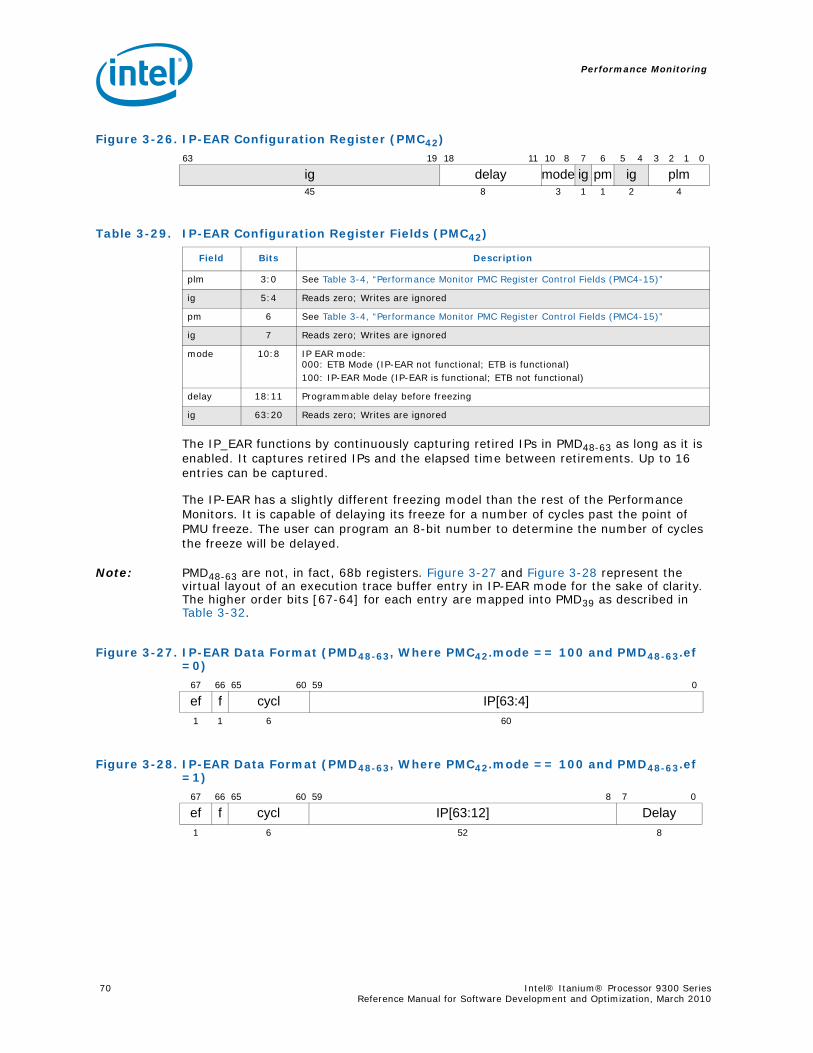
Performance Monitoring
70 Intel® Itanium® Processor 9300 Series Reference Manual for Software Development and Optimization, March 2010
The IP_EAR functions by continuously capturing retired IPs in PMD48-63 as long as it is enabled. It captures retired IPs and the elapsed time between retirements. Up to 16 entries can be captured.
The IP-EAR has a slightly different freezing model than the rest of the Performance Monitors. It is capable of delaying its freeze for a number of cycles past the point of PMU freeze. The user can program an 8-bit number to determine the number of cycles the freeze will be delayed.
Note: PMD48-63 are not, in fact, 68b registers. Figure 3-27 and Figure 3-28 represent the virtual layout of an execution trace buffer entry in IP-EAR mode for the sake of clarity. The higher order bits [67-64] for each entry are mapped into PMD39 as described in Table 3-32.
Figure 3-26. IP-EAR Configuration Register (PMC42)
63 19 18 11 10 8 7 6 5 4 3 2 1 0
ig delay mode ig pm ig plm45 8 3 1 1 2 4
Table 3-29. IP-EAR Configuration Register Fields (PMC42)
Field Bits Description
plm 3:0 See Table 3-4, “Performance Monitor PMC Register Control Fields (PMC4-15)”
ig 5:4 Reads zero; Writes are ignored
pm 6 See Table 3-4, “Performance Monitor PMC Register Control Fields (PMC4-15)”
ig 7 Reads zero; Writes are ignored
mode 10:8 IP EAR mode:000: ETB Mode (IP-EAR not functional; ETB is functional)100: IP-EAR Mode (IP-EAR is functional; ETB not functional)
delay 18:11 Programmable delay before freezing
ig 63:20 Reads zero; Writes are ignored
Figure 3-27. IP-EAR Data Format (PMD48-63, Where PMC42.mode == 100 and PMD48-63.ef =0)
67 66 65 60 59 0
ef f cycl IP[63:4]1 1 6 60
Figure 3-28. IP-EAR Data Format (PMD48-63, Where PMC42.mode == 100 and PMD48-63.ef =1)
67 66 65 60 59 8 7 0
ef f cycl IP[63:12] Delay1 6 52 8
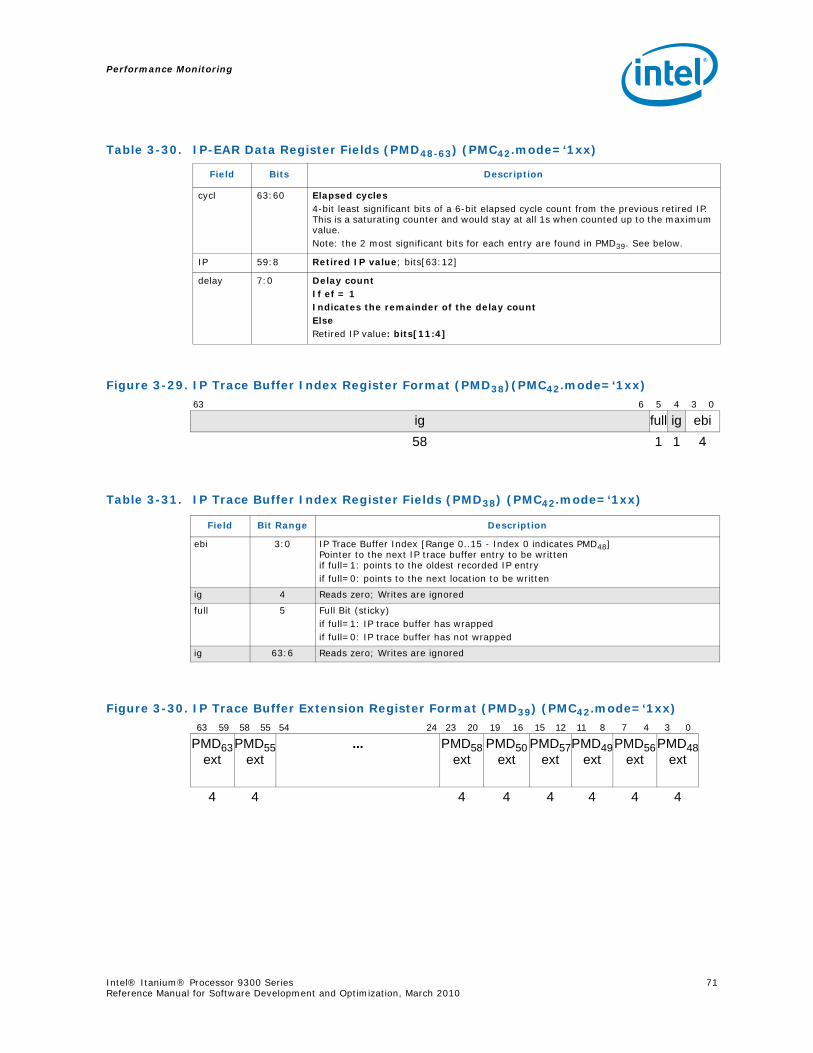
Performance Monitoring
Intel® Itanium® Processor 9300 Series 71Reference Manual for Software Development and Optimization, March 2010
Table 3-30. IP-EAR Data Register Fields (PMD48-63) (PMC42.mode=‘1xx)
Field Bits Description
cycl 63:60 Elapsed cycles4-bit least significant bits of a 6-bit elapsed cycle count from the previous retired IP. This is a saturating counter and would stay at all 1s when counted up to the maximum value.Note: the 2 most significant bits for each entry are found in PMD39. See below.
IP 59:8 Retired IP value; bits[63:12]
delay 7:0 Delay countIf ef = 1Indicates the remainder of the delay countElseRetired IP value: bits[11:4]
Figure 3-29. IP Trace Buffer Index Register Format (PMD38)(PMC42.mode=‘1xx)
63 6 5 4 3 0
ig full ig ebi58 1 1 4
Table 3-31. IP Trace Buffer Index Register Fields (PMD38) (PMC42.mode=‘1xx)
Field Bit Range Description
ebi 3:0 IP Trace Buffer Index [Range 0..15 - Index 0 indicates PMD48]Pointer to the next IP trace buffer entry to be writtenif full=1: points to the oldest recorded IP entryif full=0: points to the next location to be written
ig 4 Reads zero; Writes are ignored
full 5 Full Bit (sticky)if full=1: IP trace buffer has wrappedif full=0: IP trace buffer has not wrapped
ig 63:6 Reads zero; Writes are ignored
Figure 3-30. IP Trace Buffer Extension Register Format (PMD39) (PMC42.mode=‘1xx)
63 59 58 55 54 24 23 20 19 16 15 12 11 8 7 4 3 0
PMD63 ext
PMD55 ext
... PMD58 ext
PMD50 ext
PMD57 ext
PMD49 ext
PMD56 ext
PMD48 ext
4 4 4 4 4 4 4 4
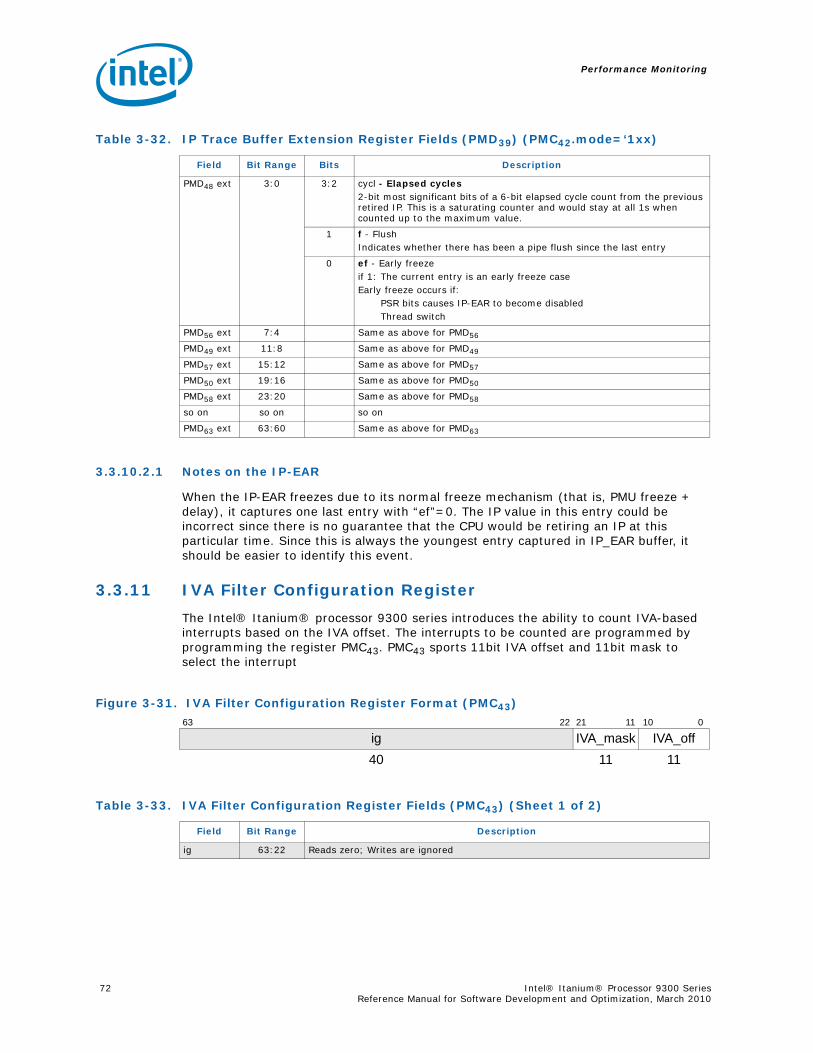
Performance Monitoring
72 Intel® Itanium® Processor 9300 Series Reference Manual for Software Development and Optimization, March 2010
3.3.10.2.1 Notes on the IP-EAR
When the IP-EAR freezes due to its normal freeze mechanism (that is, PMU freeze + delay), it captures one last entry with “ef”=0. The IP value in this entry could be incorrect since there is no guarantee that the CPU would be retiring an IP at this particular time. Since this is always the youngest entry captured in IP_EAR buffer, it should be easier to identify this event.
3.3.11 IVA Filter Configuration Register
The Intel® Itanium® processor 9300 series introduces the ability to count IVA-based interrupts based on the IVA offset. The interrupts to be counted are programmed by programming the register PMC43. PMC43 sports 11bit IVA offset and 11bit mask to select the interrupt
Table 3-32. IP Trace Buffer Extension Register Fields (PMD39) (PMC42.mode=‘1xx)
Field Bit Range Bits Description
PMD48 ext 3:0 3:2 cycl - Elapsed cycles2-bit most significant bits of a 6-bit elapsed cycle count from the previous retired IP. This is a saturating counter and would stay at all 1s when counted up to the maximum value.
1 f - FlushIndicates whether there has been a pipe flush since the last entry
0 ef - Early freezeif 1: The current entry is an early freeze caseEarly freeze occurs if:
PSR bits causes IP-EAR to become disabledThread switch
PMD56 ext 7:4 Same as above for PMD56
PMD49 ext 11:8 Same as above for PMD49
PMD57 ext 15:12 Same as above for PMD57
PMD50 ext 19:16 Same as above for PMD50
PMD58 ext 23:20 Same as above for PMD58
so on so on so on
PMD63 ext 63:60 Same as above for PMD63
Figure 3-31. IVA Filter Configuration Register Format (PMC43)
63 22 21 11 10 0
ig IVA_mask IVA_off40 11 11
Table 3-33. IVA Filter Configuration Register Fields (PMC43) (Sheet 1 of 2)
Field Bit Range Description
ig 63:22 Reads zero; Writes are ignored
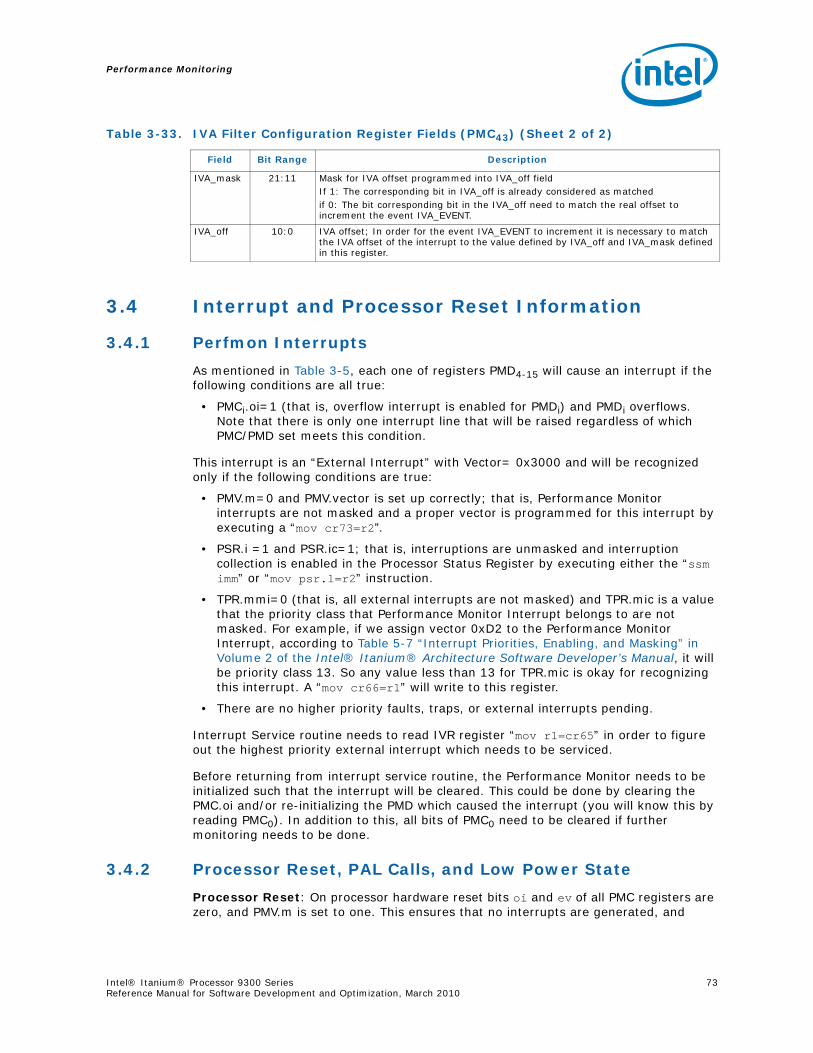
Performance Monitoring
Intel® Itanium® Processor 9300 Series 73Reference Manual for Software Development and Optimization, March 2010
3.4 Interrupt and Processor Reset Information
3.4.1 Perfmon Interrupts
As mentioned in Table 3-5, each one of registers PMD4-15 will cause an interrupt if the following conditions are all true:
• PMCi.oi=1 (that is, overflow interrupt is enabled for PMDi) and PMDi overflows. Note that there is only one interrupt line that will be raised regardless of which PMC/PMD set meets this condition.
This interrupt is an “External Interrupt” with Vector= 0x3000 and will be recognized only if the following conditions are true:
• PMV.m=0 and PMV.vector is set up correctly; that is, Performance Monitor interrupts are not masked and a proper vector is programmed for this interrupt by executing a “mov cr73=r2”.
• PSR.i =1 and PSR.ic=1; that is, interruptions are unmasked and interruption collection is enabled in the Processor Status Register by executing either the “ssm imm” or “mov psr.l=r2” instruction.
• TPR.mmi=0 (that is, all external interrupts are not masked) and TPR.mic is a value that the priority class that Performance Monitor Interrupt belongs to are not masked. For example, if we assign vector 0xD2 to the Performance Monitor Interrupt, according to Table 5-7 “Interrupt Priorities, Enabling, and Masking” in Volume 2 of the Intel® Itanium® Architecture Software Developer’s Manual, it will be priority class 13. So any value less than 13 for TPR.mic is okay for recognizing this interrupt. A “mov cr66=r1” will write to this register.
• There are no higher priority faults, traps, or external interrupts pending.
Interrupt Service routine needs to read IVR register “mov r1=cr65” in order to figure out the highest priority external interrupt which needs to be serviced.
Before returning from interrupt service routine, the Performance Monitor needs to be initialized such that the interrupt will be cleared. This could be done by clearing the PMC.oi and/or re-initializing the PMD which caused the interrupt (you will know this by reading PMC0). In addition to this, all bits of PMC0 need to be cleared if further monitoring needs to be done.
3.4.2 Processor Reset, PAL Calls, and Low Power State
Processor Reset: On processor hardware reset bits oi and ev of all PMC registers are zero, and PMV.m is set to one. This ensures that no interrupts are generated, and
IVA_mask 21:11 Mask for IVA offset programmed into IVA_off fieldIf 1: The corresponding bit in IVA_off is already considered as matchedif 0: The bit corresponding bit in the IVA_off need to match the real offset to increment the event IVA_EVENT.
IVA_off 10:0 IVA offset; In order for the event IVA_EVENT to increment it is necessary to match the IVA offset of the interrupt to the value defined by IVA_off and IVA_mask defined in this register.
Table 3-33. IVA Filter Configuration Register Fields (PMC43) (Sheet 2 of 2)
Field Bit Range Description
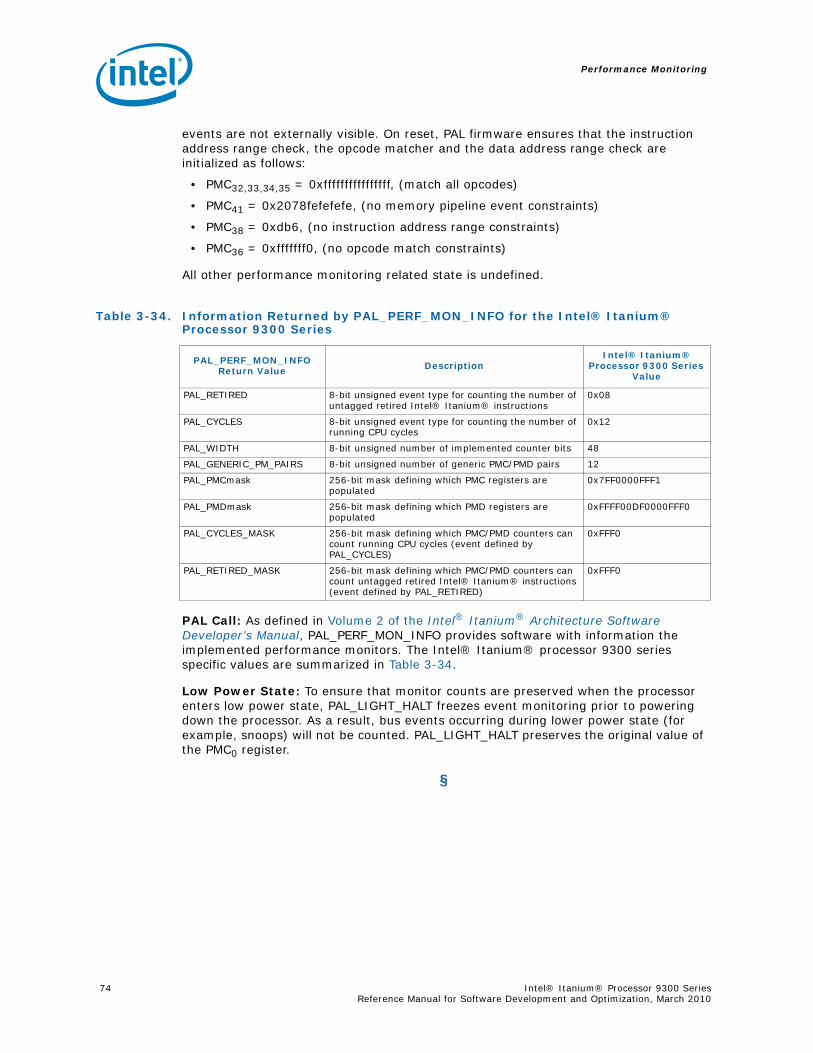
Performance Monitoring
74 Intel® Itanium® Processor 9300 Series Reference Manual for Software Development and Optimization, March 2010
events are not externally visible. On reset, PAL firmware ensures that the instruction address range check, the opcode matcher and the data address range check are initialized as follows:
• PMC32,33,34,35 = 0xffffffffffffffff, (match all opcodes)
• PMC41 = 0x2078fefefefe, (no memory pipeline event constraints)
• PMC38 = 0xdb6, (no instruction address range constraints)
• PMC36 = 0xfffffff0, (no opcode match constraints)
All other performance monitoring related state is undefined.
PAL Call: As defined in Volume 2 of the Intel® Itanium® Architecture Software Developer’s Manual, PAL_PERF_MON_INFO provides software with information the implemented performance monitors. The Intel® Itanium® processor 9300 series specific values are summarized in Table 3-34.
Low Power State: To ensure that monitor counts are preserved when the processor enters low power state, PAL_LIGHT_HALT freezes event monitoring prior to powering down the processor. As a result, bus events occurring during lower power state (for example, snoops) will not be counted. PAL_LIGHT_HALT preserves the original value of the PMC0 register.
§
Table 3-34. Information Returned by PAL_PERF_MON_INFO for the Intel® Itanium® Processor 9300 Series
PAL_PERF_MON_INFOReturn Value Description
Intel® Itanium® Processor 9300 Series
Value
PAL_RETIRED 8-bit unsigned event type for counting the number of untagged retired Intel® Itanium® instructions
0x08
PAL_CYCLES 8-bit unsigned event type for counting the number of running CPU cycles
0x12
PAL_WIDTH 8-bit unsigned number of implemented counter bits 48
PAL_GENERIC_PM_PAIRS 8-bit unsigned number of generic PMC/PMD pairs 12
PAL_PMCmask 256-bit mask defining which PMC registers are populated
0x7FF0000FFF1
PAL_PMDmask 256-bit mask defining which PMD registers are populated
0xFFFF00DF0000FFF0
PAL_CYCLES_MASK 256-bit mask defining which PMC/PMD counters can count running CPU cycles (event defined by PAL_CYCLES)
0xFFF0
PAL_RETIRED_MASK 256-bit mask defining which PMC/PMD counters can count untagged retired Intel® Itanium® instructions (event defined by PAL_RETIRED)
0xFFF0

Performance Monitor Events
Intel® Itanium® Processor 9300 Series 75Reference Manual for Software Development and Optimization, March 2010
4 Performance Monitor Events
4.1 IntroductionThis chapter describes the architectural and microarchitectural events measurable on the Intel® Itanium® processor 9300 series through the performance monitoring mechanisms described earlier in Chapter 3. The early sections of this chapter provide a categorized high-level view of the event list, grouping logically related events together. Computation (either directly by a counter in hardware or indirectly as a “derived” event) of common performance metrics is also discussed. Each directly measurable event is then described in greater detail in the alphabetized list of all processor events in Chapter 4, “Categorization of Events.”
The Intel® Itanium® processor 9300 series is capable of monitoring numerous events. The majority of events can be selected as input to any of the PMD4-15 by programming bit [15:8] of the corresponding PMC to the hexadecimal values shown in the “event code” field of the event list. Please refer to Section 4.8.2 and Section 4.8.4 for events that have more specific requirements.
4.2 Categorization of EventsPerformance related events are grouped into the following categories:
• Basic Events: clock cycles, retired instructions (Section 4.3)
• Instruction Dispersal Events: instruction decode and issue (Section 4.4)
• Instruction Execution Events: instruction execution, data and control speculation, and memory operations (Section 4.5)
• Stall Events: stall and execution cycle breakdowns (Section 4.6)
• Branch Events: branch prediction (Section 4.7)
• Memory Hierarchy: instruction and data caches (Section 4.8)
• System Events: operating system monitors (Section 4.9)
• TLB Events: instruction and data TLBs (Section 4.10)
• Intel® QuickPath Interconnect Events: (Section 4.11)
• RSE Events: Register Stack Engine (Section 4.12)
• Multi-Threading Events (Section 4.13)
• Intel Turbo Boost Technology Events (Section 4.14)
Each section listed above includes a table providing information on directly measurable events. The section may also contain a second table of events that can be derived from those that are directly measurable. These derived events may simply rename existing events or present steps to determine the value of common performance metrics. Derived events are not, however, discussed in the systematic event listing in Section 4.16.
Performance Monitor Events
76 Intel® Itanium® Processor 9300 Series Reference Manual for Software Development and Optimization, March 2010
Directly measurable events often use the PMC.umask field (See Section 3.3.2 ) to measure a certain variant of the event in question. Symbolic event names for such events include a period to indicate use of the umask, specified by four bits in the detailed event description (x’s are for don’t-cares).
The summary tables in the subsequent sections define events by specifying the following attributes:
• Symbol Name – Symbolic name used to denote this event.
• Event Code – Hexadecimal value to program into bits [15:8] of the appropriate PMC register in order to measure this event.
• IAR – Can this event be constrained by the Instruction Address Range registers?
• DAR – Can this event be constrained by the Data Address Range registers?
• OPC – Can this event by constrained by the Opcode Match registers?
• Max Inc/Cyc – Maximum Increment Per Cycle or the maximum value this event may be increased by each cycle.
• T – Type; Either A for Active, F for Floating, S for Self Floating or C for Causal (check table Table 4-44, “All Performance Monitors Ordered by Code” for this information).
• Description – Brief description of the event.
4.2.1 Multi-Threading and Event Types
The Intel® Itanium® processor 9300 series implements a type of hardware based multi-threading that effectively allows two threads to coexist within a processor core although only one thread is “active” within the core’s pipeline at any moment in time. This affects how events are generated. Certain events may be generated after the thread they belong has become inactive. This also affects how events are assigned to the threads occupying the same core, which is also dependent upon which PMD the event was programmed into (see Section 3.3.2 for more information). Certain events do not have the concept of a “home” thread.
These effects are further complicated by the use of the “.all” field, which allows a user to choose to monitor a particular event for the thread being programmed to or for both threads (see Table 3-5). It should be noted that monitoring with .all enabled does not always produce valid results and in certain cases the setting of .all is ignored. Please refer to the individual events for further information.
To help decipher these effects, events have been classified by the following types:
• Active – this event can only occur when the thread that generated it is “active” (currently executing in the processor core’s pipeline) and is considered to be generated by the active thread. Either type of monitor can be used if .all is not set. Example(s): BE_EXE_BUBBLE and IA64_INST_RETIRED.
• Causal – this event does not belong to a thread. It is assigned to the active thread. Altough it seems natural to use either type of monitor if .all is not set, due to implementation constraints, causal events should only be monitored in duplicated counters. There is one exception to this rule: CPU_OP_CYCLES can be measured in both types of counters. Example(s): CPU_OP_CYCLES and L2I_SNOOP_HITS.
• Floating – this event belongs to a thread, but could have been generated when its thread was inactive (or “in the background”). These events should only be monitored in duplicated counters. If .all is not set, only events associated with the

Performance Monitor Events
Intel® Itanium® Processor 9300 Series 77Reference Manual for Software Development and Optimization, March 2010
monitoring thread will be captured. If .all is set, events associated with both threads will be captured during the time the monitoring thread has been assigned to a processor by the OS. Example(s): L2D_REFERENCES and ER_MEM_READ_OUT_LO.
• Self Floating – this is a hybrid event used to better categorize certain BUS and SI (System Interface) events. If this event was monitored with the .SELF umask, it is a Floating event. If any other umask is used it is considered Causal. These events should only be monitored in duplicated counters. Example(s): BUS_IO and SI_WRITEQ_INSERTS.
4.3 Basic EventsTable 4-1 summarizes two basic execution monitors. The Intel® Itanium® processor 9300 series retired instruction count, IA64_INST_RETIRED, includes both predicated true and predicated off instructions and nop instructions, but excludes RSE operations.
4.4 Instruction Dispersal EventsInstruction cache lines are delivered to the execution core and dispersed to the Intel® Itanium® processor 9300 series functional units. The Intel® Itanium® processor 9300 series can issue, or disperse, 6 instructions per clock cycle. In other words, the Intel® Itanium® processor 9300 series can issue to 6 instruction slots (or syllables).The following events are intended to give users an idea of how effectively instructions are dispersed and why they are not dispersed at full capacity. There are five reasons for not dispersing at full capacity. One is measured by DISP_STALLED. For every clock that dispersal is stalled, dispersal takes a hit of 6-syllables. The other four reasons are measured by SYLL_NOT_DISPERSED. Due to the way the hardware is designed, SYLL_NOT_DISPERSED may contain an overcount due to implicit and explicit bits; although this number should be small, SYLL_OVERCOUNT will provide an accurate count for it.
The relationship between these events is as follows:
6*(CPU_OP_CYCLES-DISP_STALLED) = INST_DISPERSED + SYLL_NOT_DISPERSED.ALL - SYLL_OVERCOUNT.ALL
Table 4-1. Performance Monitors for Basic Events
Symbol Name Event Code
IAR
DAR
OPC
Max Inc/Cyc T Description
CPU_OP_CYCLES 0x12 Y N Y 1 C CPU Operating Cycles
IA64_INST_RETIRED 0x08 Y N Y 6 A Retired Intel® Itanium® Instructions
Table 4-2. Derived Monitors for Basic Events
Symbol Name Description Equation
IA64_IPC Average Number of Intel® Itanium® Instructions Per Cycle During Intel® Itanium®-based Code Sequences
IA64_INST_RETIRED / CPU_OP_CYCLES
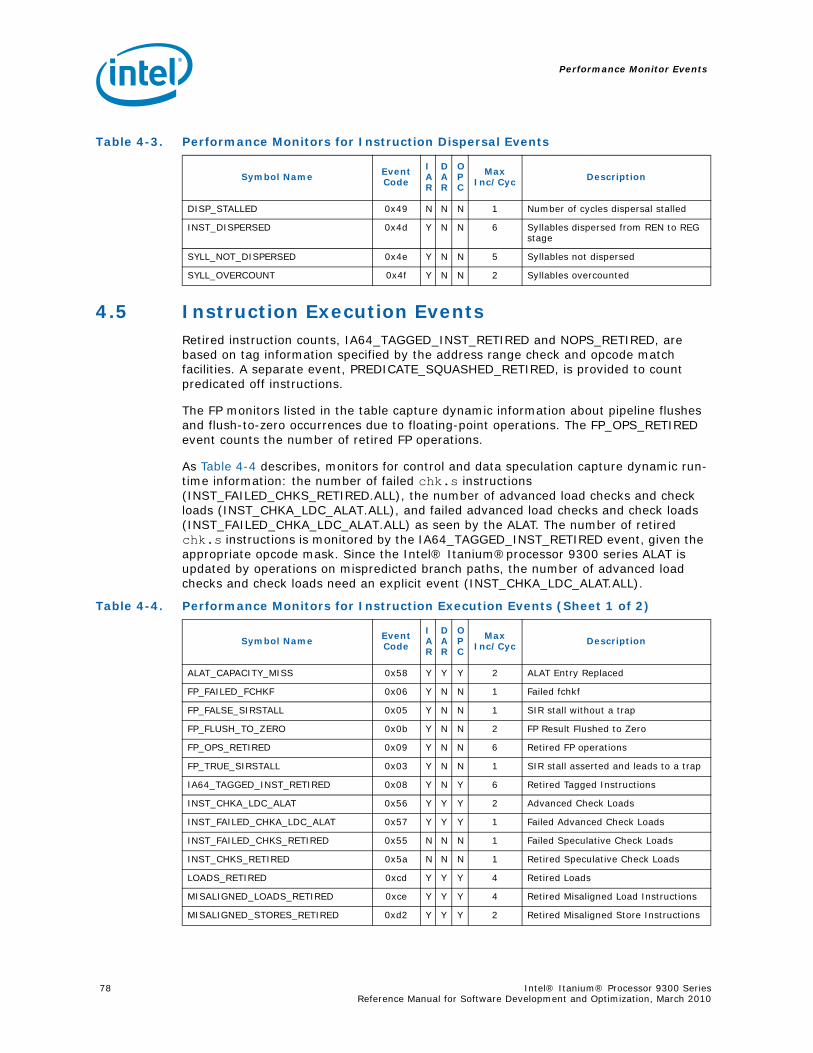
Performance Monitor Events
78 Intel® Itanium® Processor 9300 Series Reference Manual for Software Development and Optimization, March 2010
4.5 Instruction Execution EventsRetired instruction counts, IA64_TAGGED_INST_RETIRED and NOPS_RETIRED, are based on tag information specified by the address range check and opcode match facilities. A separate event, PREDICATE_SQUASHED_RETIRED, is provided to count predicated off instructions.
The FP monitors listed in the table capture dynamic information about pipeline flushes and flush-to-zero occurrences due to floating-point operations. The FP_OPS_RETIRED event counts the number of retired FP operations.
As Table 4-4 describes, monitors for control and data speculation capture dynamic run-time information: the number of failed chk.s instructions (INST_FAILED_CHKS_RETIRED.ALL), the number of advanced load checks and check loads (INST_CHKA_LDC_ALAT.ALL), and failed advanced load checks and check loads (INST_FAILED_CHKA_LDC_ALAT.ALL) as seen by the ALAT. The number of retired chk.s instructions is monitored by the IA64_TAGGED_INST_RETIRED event, given the appropriate opcode mask. Since the Intel® Itanium®processor 9300 series ALAT is updated by operations on mispredicted branch paths, the number of advanced load checks and check loads need an explicit event (INST_CHKA_LDC_ALAT.ALL).
Table 4-3. Performance Monitors for Instruction Dispersal Events
Symbol Name Event Code
IAR
DAR
OPC
Max Inc/Cyc Description
DISP_STALLED 0x49 N N N 1 Number of cycles dispersal stalled
INST_DISPERSED 0x4d Y N N 6 Syllables dispersed from REN to REG stage
SYLL_NOT_DISPERSED 0x4e Y N N 5 Syllables not dispersed
SYLL_OVERCOUNT 0x4f Y N N 2 Syllables overcounted
Table 4-4. Performance Monitors for Instruction Execution Events (Sheet 1 of 2)
Symbol Name Event Code
IAR
DAR
OPC
Max Inc/Cyc Description
ALAT_CAPACITY_MISS 0x58 Y Y Y 2 ALAT Entry Replaced
FP_FAILED_FCHKF 0x06 Y N N 1 Failed fchkf
FP_FALSE_SIRSTALL 0x05 Y N N 1 SIR stall without a trap
FP_FLUSH_TO_ZERO 0x0b Y N N 2 FP Result Flushed to Zero
FP_OPS_RETIRED 0x09 Y N N 6 Retired FP operations
FP_TRUE_SIRSTALL 0x03 Y N N 1 SIR stall asserted and leads to a trap
IA64_TAGGED_INST_RETIRED 0x08 Y N Y 6 Retired Tagged Instructions
INST_CHKA_LDC_ALAT 0x56 Y Y Y 2 Advanced Check Loads
INST_FAILED_CHKA_LDC_ALAT 0x57 Y Y Y 1 Failed Advanced Check Loads
INST_FAILED_CHKS_RETIRED 0x55 N N N 1 Failed Speculative Check Loads
INST_CHKS_RETIRED 0x5a N N N 1 Retired Speculative Check Loads
LOADS_RETIRED 0xcd Y Y Y 4 Retired Loads
MISALIGNED_LOADS_RETIRED 0xce Y Y Y 4 Retired Misaligned Load Instructions
MISALIGNED_STORES_RETIRED 0xd2 Y Y Y 2 Retired Misaligned Store Instructions
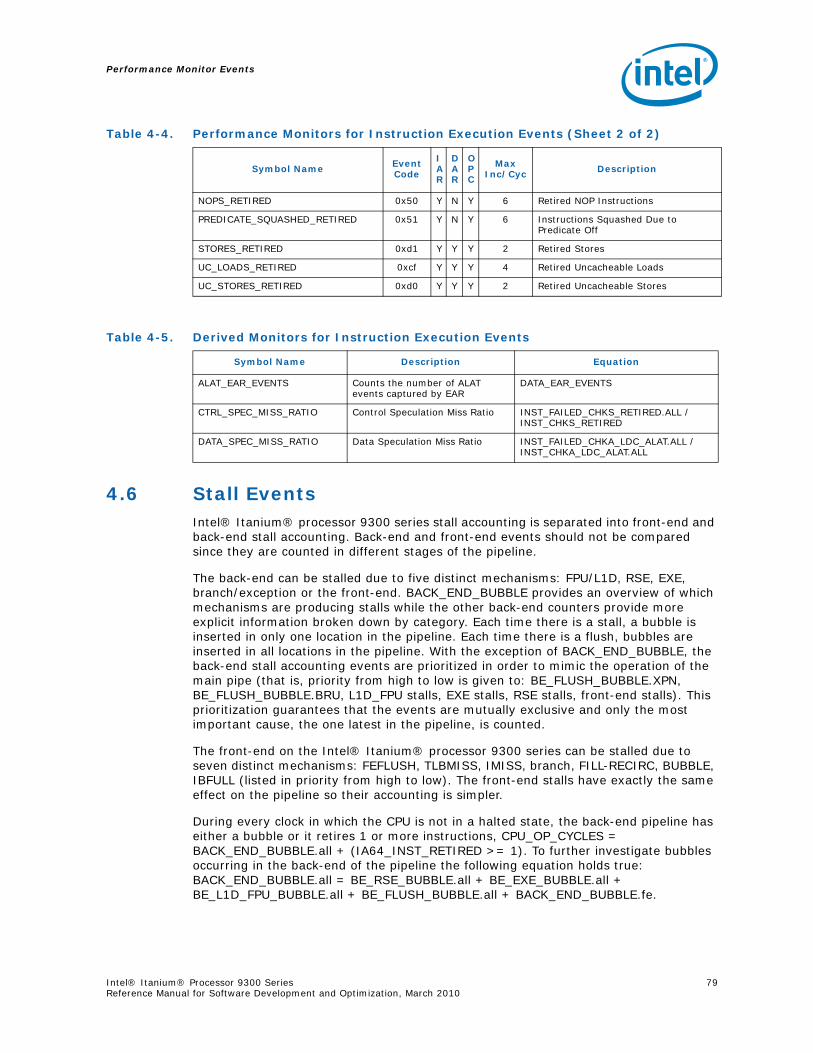
Performance Monitor Events
Intel® Itanium® Processor 9300 Series 79Reference Manual for Software Development and Optimization, March 2010
4.6 Stall EventsIntel® Itanium® processor 9300 series stall accounting is separated into front-end and back-end stall accounting. Back-end and front-end events should not be compared since they are counted in different stages of the pipeline.
The back-end can be stalled due to five distinct mechanisms: FPU/L1D, RSE, EXE, branch/exception or the front-end. BACK_END_BUBBLE provides an overview of which mechanisms are producing stalls while the other back-end counters provide more explicit information broken down by category. Each time there is a stall, a bubble is inserted in only one location in the pipeline. Each time there is a flush, bubbles are inserted in all locations in the pipeline. With the exception of BACK_END_BUBBLE, the back-end stall accounting events are prioritized in order to mimic the operation of the main pipe (that is, priority from high to low is given to: BE_FLUSH_BUBBLE.XPN, BE_FLUSH_BUBBLE.BRU, L1D_FPU stalls, EXE stalls, RSE stalls, front-end stalls). This prioritization guarantees that the events are mutually exclusive and only the most important cause, the one latest in the pipeline, is counted.
The front-end on the Intel® Itanium® processor 9300 series can be stalled due to seven distinct mechanisms: FEFLUSH, TLBMISS, IMISS, branch, FILL-RECIRC, BUBBLE, IBFULL (listed in priority from high to low). The front-end stalls have exactly the same effect on the pipeline so their accounting is simpler.
During every clock in which the CPU is not in a halted state, the back-end pipeline has either a bubble or it retires 1 or more instructions, CPU_OP_CYCLES = BACK_END_BUBBLE.all + (IA64_INST_RETIRED >= 1). To further investigate bubbles occurring in the back-end of the pipeline the following equation holds true: BACK_END_BUBBLE.all = BE_RSE_BUBBLE.all + BE_EXE_BUBBLE.all + BE_L1D_FPU_BUBBLE.all + BE_FLUSH_BUBBLE.all + BACK_END_BUBBLE.fe.
NOPS_RETIRED 0x50 Y N Y 6 Retired NOP Instructions
PREDICATE_SQUASHED_RETIRED 0x51 Y N Y 6 Instructions Squashed Due to Predicate Off
STORES_RETIRED 0xd1 Y Y Y 2 Retired Stores
UC_LOADS_RETIRED 0xcf Y Y Y 4 Retired Uncacheable Loads
UC_STORES_RETIRED 0xd0 Y Y Y 2 Retired Uncacheable Stores
Table 4-4. Performance Monitors for Instruction Execution Events (Sheet 2 of 2)
Symbol Name Event Code
IAR
DAR
OPC
Max Inc/Cyc Description
Table 4-5. Derived Monitors for Instruction Execution Events
Symbol Name Description Equation
ALAT_EAR_EVENTS Counts the number of ALAT events captured by EAR
DATA_EAR_EVENTS
CTRL_SPEC_MISS_RATIO Control Speculation Miss Ratio INST_FAILED_CHKS_RETIRED.ALL / INST_CHKS_RETIRED
DATA_SPEC_MISS_RATIO Data Speculation Miss Ratio INST_FAILED_CHKA_LDC_ALAT.ALL / INST_CHKA_LDC_ALAT.ALL
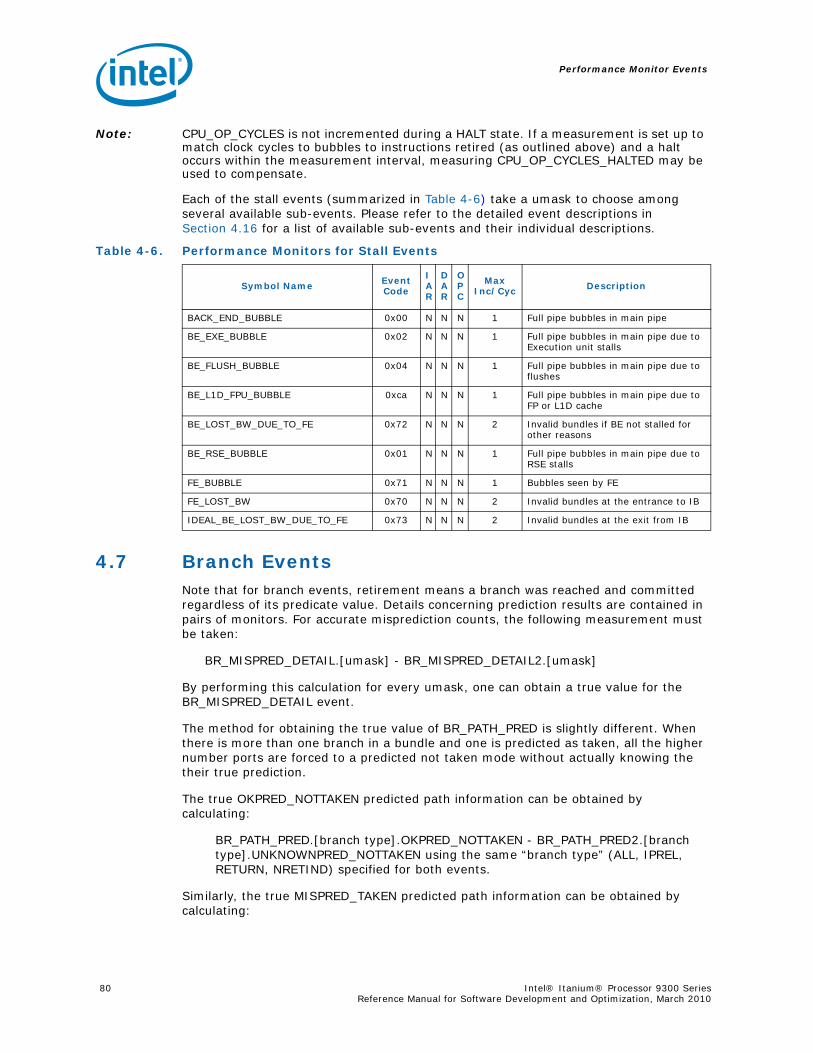
Performance Monitor Events
80 Intel® Itanium® Processor 9300 Series Reference Manual for Software Development and Optimization, March 2010
Note: CPU_OP_CYCLES is not incremented during a HALT state. If a measurement is set up to match clock cycles to bubbles to instructions retired (as outlined above) and a halt occurs within the measurement interval, measuring CPU_OP_CYCLES_HALTED may be used to compensate.
Each of the stall events (summarized in Table 4-6) take a umask to choose among several available sub-events. Please refer to the detailed event descriptions in Section 4.16 for a list of available sub-events and their individual descriptions.
4.7 Branch EventsNote that for branch events, retirement means a branch was reached and committed regardless of its predicate value. Details concerning prediction results are contained in pairs of monitors. For accurate misprediction counts, the following measurement must be taken:
BR_MISPRED_DETAIL.[umask] - BR_MISPRED_DETAIL2.[umask]
By performing this calculation for every umask, one can obtain a true value for the BR_MISPRED_DETAIL event.
The method for obtaining the true value of BR_PATH_PRED is slightly different. When there is more than one branch in a bundle and one is predicted as taken, all the higher number ports are forced to a predicted not taken mode without actually knowing the their true prediction.
The true OKPRED_NOTTAKEN predicted path information can be obtained by calculating:
BR_PATH_PRED.[branch type].OKPRED_NOTTAKEN - BR_PATH_PRED2.[branch type].UNKNOWNPRED_NOTTAKEN using the same “branch type” (ALL, IPREL, RETURN, NRETIND) specified for both events.
Similarly, the true MISPRED_TAKEN predicted path information can be obtained by calculating:
Table 4-6. Performance Monitors for Stall Events
Symbol Name Event Code
IAR
DAR
OPC
Max Inc/Cyc Description
BACK_END_BUBBLE 0x00 N N N 1 Full pipe bubbles in main pipe
BE_EXE_BUBBLE 0x02 N N N 1 Full pipe bubbles in main pipe due to Execution unit stalls
BE_FLUSH_BUBBLE 0x04 N N N 1 Full pipe bubbles in main pipe due to flushes
BE_L1D_FPU_BUBBLE 0xca N N N 1 Full pipe bubbles in main pipe due to FP or L1D cache
BE_LOST_BW_DUE_TO_FE 0x72 N N N 2 Invalid bundles if BE not stalled for other reasons
BE_RSE_BUBBLE 0x01 N N N 1 Full pipe bubbles in main pipe due to RSE stalls
FE_BUBBLE 0x71 N N N 1 Bubbles seen by FE
FE_LOST_BW 0x70 N N N 2 Invalid bundles at the entrance to IB
IDEAL_BE_LOST_BW_DUE_TO_FE 0x73 N N N 2 Invalid bundles at the exit from IB
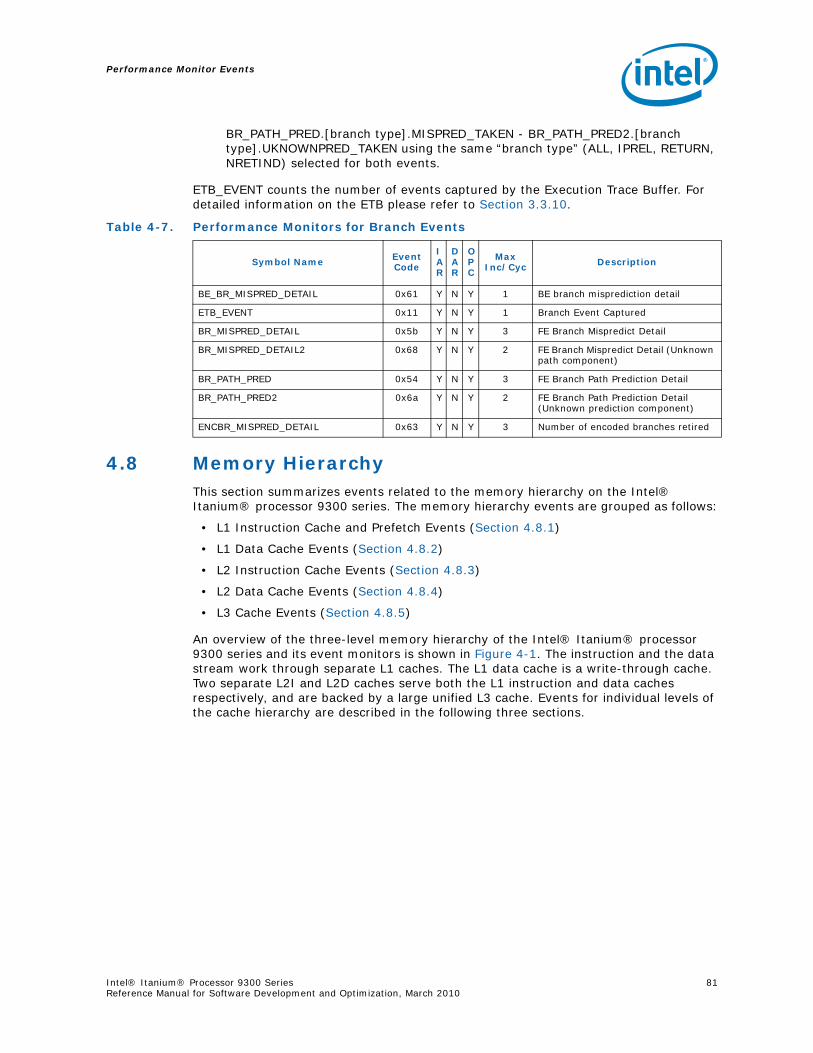
Performance Monitor Events
Intel® Itanium® Processor 9300 Series 81Reference Manual for Software Development and Optimization, March 2010
BR_PATH_PRED.[branch type].MISPRED_TAKEN - BR_PATH_PRED2.[branch type].UKNOWNPRED_TAKEN using the same “branch type” (ALL, IPREL, RETURN, NRETIND) selected for both events.
ETB_EVENT counts the number of events captured by the Execution Trace Buffer. For detailed information on the ETB please refer to Section 3.3.10.
4.8 Memory HierarchyThis section summarizes events related to the memory hierarchy on the Intel® Itanium® processor 9300 series. The memory hierarchy events are grouped as follows:
• L1 Instruction Cache and Prefetch Events (Section 4.8.1)
• L1 Data Cache Events (Section 4.8.2)
• L2 Instruction Cache Events (Section 4.8.3)
• L2 Data Cache Events (Section 4.8.4)
• L3 Cache Events (Section 4.8.5)
An overview of the three-level memory hierarchy of the Intel® Itanium® processor 9300 series and its event monitors is shown in Figure 4-1. The instruction and the data stream work through separate L1 caches. The L1 data cache is a write-through cache. Two separate L2I and L2D caches serve both the L1 instruction and data caches respectively, and are backed by a large unified L3 cache. Events for individual levels of the cache hierarchy are described in the following three sections.
Table 4-7. Performance Monitors for Branch Events
Symbol Name Event Code
IAR
DAR
OPC
Max Inc/Cyc Description
BE_BR_MISPRED_DETAIL 0x61 Y N Y 1 BE branch misprediction detail
ETB_EVENT 0x11 Y N Y 1 Branch Event Captured
BR_MISPRED_DETAIL 0x5b Y N Y 3 FE Branch Mispredict Detail
BR_MISPRED_DETAIL2 0x68 Y N Y 2 FE Branch Mispredict Detail (Unknown path component)
BR_PATH_PRED 0x54 Y N Y 3 FE Branch Path Prediction Detail
BR_PATH_PRED2 0x6a Y N Y 2 FE Branch Path Prediction Detail (Unknown prediction component)
ENCBR_MISPRED_DETAIL 0x63 Y N Y 3 Number of encoded branches retired
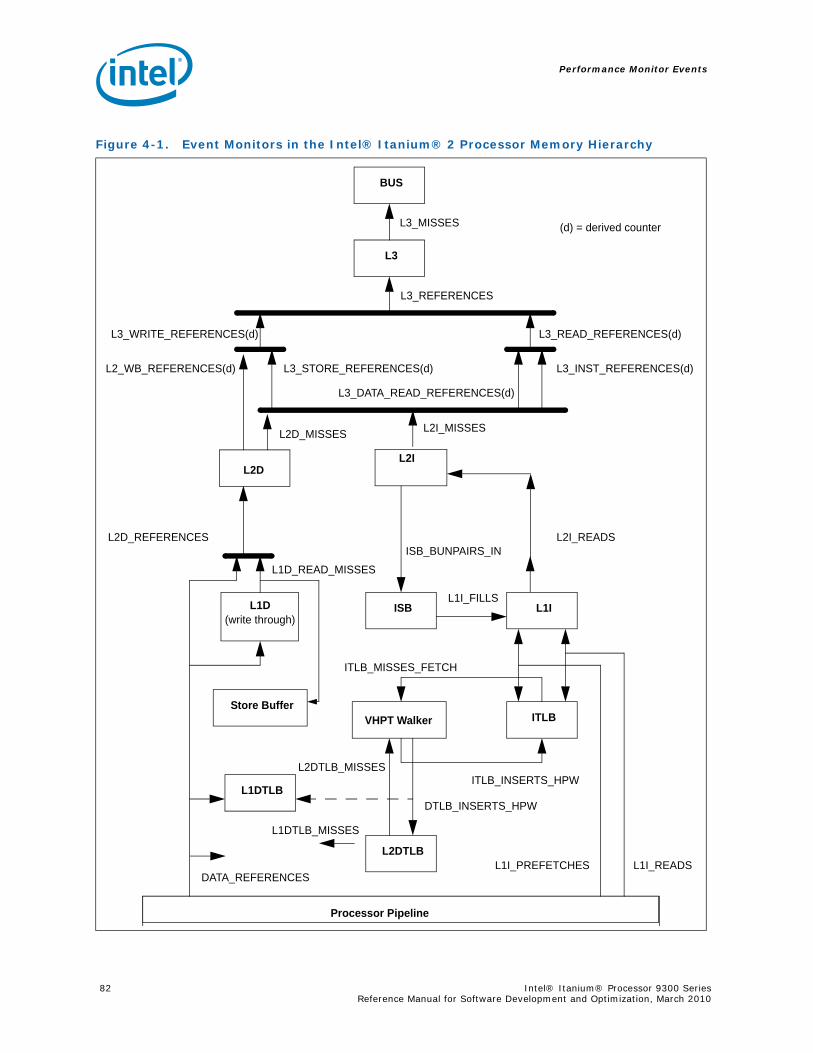
Performance Monitor Events
82 Intel® Itanium® Processor 9300 Series Reference Manual for Software Development and Optimization, March 2010
Figure 4-1. Event Monitors in the Intel® Itanium® 2 Processor Memory Hierarchy
(d) = derived counter
BUS
L3
L3_MISSES
L3_READ_REFERENCES(d)L3_WRITE_REFERENCES(d)
L3_REFERENCES
L3_STORE_REFERENCES(d) L3_INST_REFERENCES(d)L2_WB_REFERENCES(d)
L3_DATA_READ_REFERENCES(d)
L2I_MISSES
L2D_REFERENCES L2I_READS
L1IL1D
L1D_READ_MISSES
Processor Pipeline
DATA_REFERENCESL1I_READSL1I_PREFETCHES
ITLB
L1DTLB
L2DTLB
VHPT Walker
ISB(write through)
L1DTLB_MISSES
L2DTLB_MISSESITLB_INSERTS_HPW
DTLB_INSERTS_HPW
L1I_FILLS
ITLB_MISSES_FETCH
Store Buffer
ISB_BUNPAIRS_IN
L2DL2I
L2D_MISSES
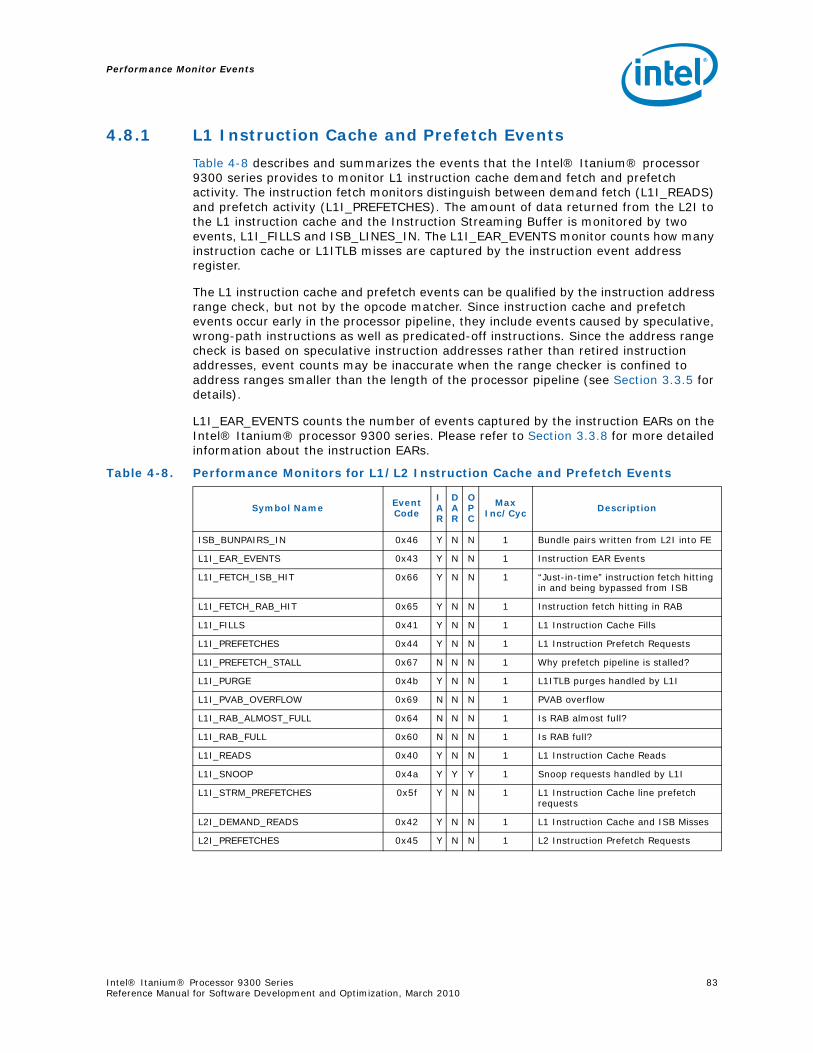
Performance Monitor Events
Intel® Itanium® Processor 9300 Series 83Reference Manual for Software Development and Optimization, March 2010
4.8.1 L1 Instruction Cache and Prefetch Events
Table 4-8 describes and summarizes the events that the Intel® Itanium® processor 9300 series provides to monitor L1 instruction cache demand fetch and prefetch activity. The instruction fetch monitors distinguish between demand fetch (L1I_READS) and prefetch activity (L1I_PREFETCHES). The amount of data returned from the L2I to the L1 instruction cache and the Instruction Streaming Buffer is monitored by two events, L1I_FILLS and ISB_LINES_IN. The L1I_EAR_EVENTS monitor counts how many instruction cache or L1ITLB misses are captured by the instruction event address register.
The L1 instruction cache and prefetch events can be qualified by the instruction address range check, but not by the opcode matcher. Since instruction cache and prefetch events occur early in the processor pipeline, they include events caused by speculative, wrong-path instructions as well as predicated-off instructions. Since the address range check is based on speculative instruction addresses rather than retired instruction addresses, event counts may be inaccurate when the range checker is confined to address ranges smaller than the length of the processor pipeline (see Section 3.3.5 for details).
L1I_EAR_EVENTS counts the number of events captured by the instruction EARs on the Intel® Itanium® processor 9300 series. Please refer to Section 3.3.8 for more detailed information about the instruction EARs.
Table 4-8. Performance Monitors for L1/L2 Instruction Cache and Prefetch Events
Symbol Name Event Code
IAR
DAR
OPC
Max Inc/Cyc Description
ISB_BUNPAIRS_IN 0x46 Y N N 1 Bundle pairs written from L2I into FE
L1I_EAR_EVENTS 0x43 Y N N 1 Instruction EAR Events
L1I_FETCH_ISB_HIT 0x66 Y N N 1 “Just-in-time” instruction fetch hitting in and being bypassed from ISB
L1I_FETCH_RAB_HIT 0x65 Y N N 1 Instruction fetch hitting in RAB
L1I_FILLS 0x41 Y N N 1 L1 Instruction Cache Fills
L1I_PREFETCHES 0x44 Y N N 1 L1 Instruction Prefetch Requests
L1I_PREFETCH_STALL 0x67 N N N 1 Why prefetch pipeline is stalled?
L1I_PURGE 0x4b Y N N 1 L1ITLB purges handled by L1I
L1I_PVAB_OVERFLOW 0x69 N N N 1 PVAB overflow
L1I_RAB_ALMOST_FULL 0x64 N N N 1 Is RAB almost full?
L1I_RAB_FULL 0x60 N N N 1 Is RAB full?
L1I_READS 0x40 Y N N 1 L1 Instruction Cache Reads
L1I_SNOOP 0x4a Y Y Y 1 Snoop requests handled by L1I
L1I_STRM_PREFETCHES 0x5f Y N N 1 L1 Instruction Cache line prefetch requests
L2I_DEMAND_READS 0x42 Y N N 1 L1 Instruction Cache and ISB Misses
L2I_PREFETCHES 0x45 Y N N 1 L2 Instruction Prefetch Requests
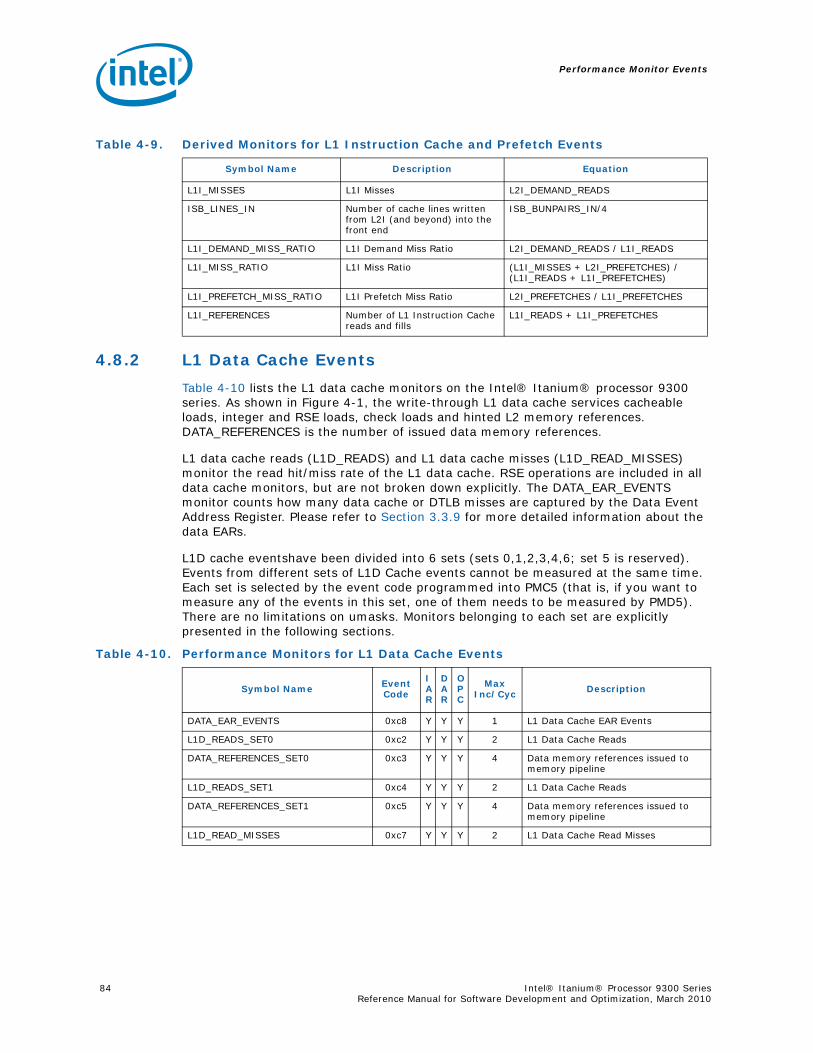
Performance Monitor Events
84 Intel® Itanium® Processor 9300 Series Reference Manual for Software Development and Optimization, March 2010
4.8.2 L1 Data Cache Events
Table 4-10 lists the L1 data cache monitors on the Intel® Itanium® processor 9300 series. As shown in Figure 4-1, the write-through L1 data cache services cacheable loads, integer and RSE loads, check loads and hinted L2 memory references. DATA_REFERENCES is the number of issued data memory references.
L1 data cache reads (L1D_READS) and L1 data cache misses (L1D_READ_MISSES) monitor the read hit/miss rate of the L1 data cache. RSE operations are included in all data cache monitors, but are not broken down explicitly. The DATA_EAR_EVENTS monitor counts how many data cache or DTLB misses are captured by the Data Event Address Register. Please refer to Section 3.3.9 for more detailed information about the data EARs.
L1D cache eventshave been divided into 6 sets (sets 0,1,2,3,4,6; set 5 is reserved). Events from different sets of L1D Cache events cannot be measured at the same time. Each set is selected by the event code programmed into PMC5 (that is, if you want to measure any of the events in this set, one of them needs to be measured by PMD5). There are no limitations on umasks. Monitors belonging to each set are explicitly presented in the following sections.
Table 4-9. Derived Monitors for L1 Instruction Cache and Prefetch Events
Symbol Name Description Equation
L1I_MISSES L1I Misses L2I_DEMAND_READS
ISB_LINES_IN Number of cache lines written from L2I (and beyond) into the front end
ISB_BUNPAIRS_IN/4
L1I_DEMAND_MISS_RATIO L1I Demand Miss Ratio L2I_DEMAND_READS / L1I_READS
L1I_MISS_RATIO L1I Miss Ratio (L1I_MISSES + L2I_PREFETCHES) / (L1I_READS + L1I_PREFETCHES)
L1I_PREFETCH_MISS_RATIO L1I Prefetch Miss Ratio L2I_PREFETCHES / L1I_PREFETCHES
L1I_REFERENCES Number of L1 Instruction Cache reads and fills
L1I_READS + L1I_PREFETCHES
Table 4-10. Performance Monitors for L1 Data Cache Events
Symbol Name Event Code
IAR
DAR
OPC
Max Inc/Cyc Description
DATA_EAR_EVENTS 0xc8 Y Y Y 1 L1 Data Cache EAR Events
L1D_READS_SET0 0xc2 Y Y Y 2 L1 Data Cache Reads
DATA_REFERENCES_SET0 0xc3 Y Y Y 4 Data memory references issued to memory pipeline
L1D_READS_SET1 0xc4 Y Y Y 2 L1 Data Cache Reads
DATA_REFERENCES_SET1 0xc5 Y Y Y 4 Data memory references issued to memory pipeline
L1D_READ_MISSES 0xc7 Y Y Y 2 L1 Data Cache Read Misses
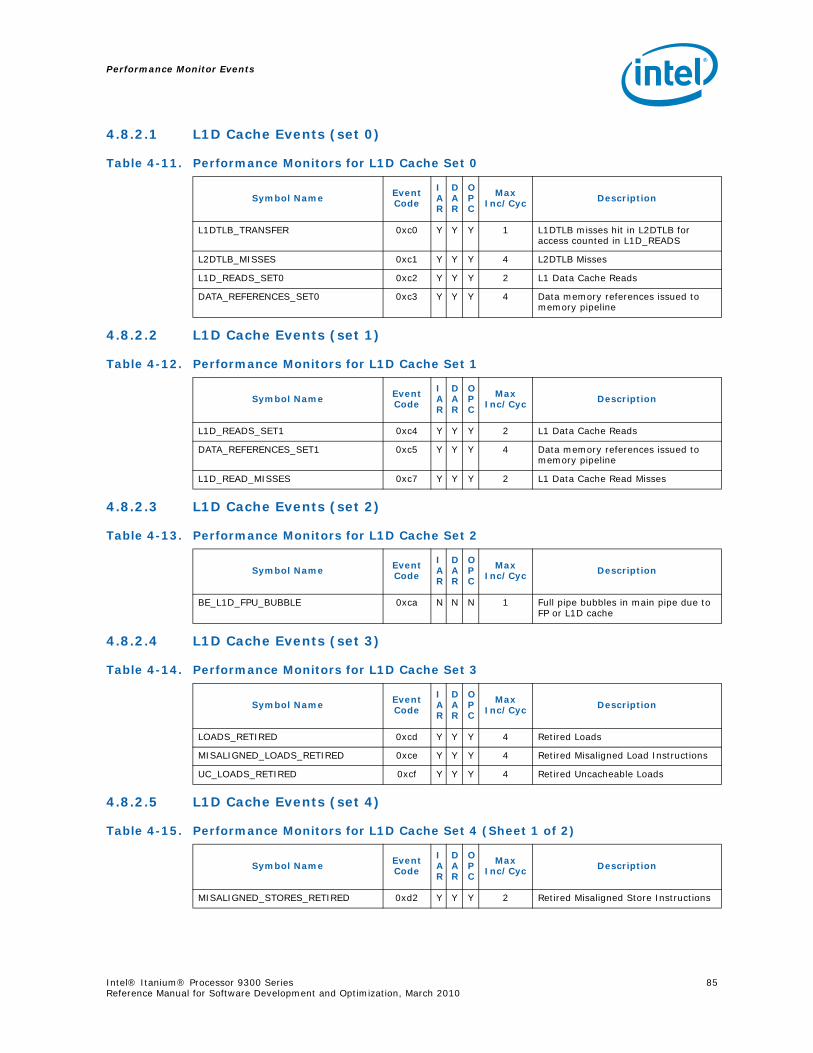
Performance Monitor Events
Intel® Itanium® Processor 9300 Series 85Reference Manual for Software Development and Optimization, March 2010
4.8.2.1 L1D Cache Events (set 0)
4.8.2.2 L1D Cache Events (set 1)
4.8.2.3 L1D Cache Events (set 2)
4.8.2.4 L1D Cache Events (set 3)
4.8.2.5 L1D Cache Events (set 4)
Table 4-11. Performance Monitors for L1D Cache Set 0
Symbol Name Event Code
IAR
DAR
OPC
Max Inc/Cyc Description
L1DTLB_TRANSFER 0xc0 Y Y Y 1 L1DTLB misses hit in L2DTLB for access counted in L1D_READS
L2DTLB_MISSES 0xc1 Y Y Y 4 L2DTLB Misses
L1D_READS_SET0 0xc2 Y Y Y 2 L1 Data Cache Reads
DATA_REFERENCES_SET0 0xc3 Y Y Y 4 Data memory references issued to memory pipeline
Table 4-12. Performance Monitors for L1D Cache Set 1
Symbol Name Event Code
IAR
DAR
OPC
Max Inc/Cyc Description
L1D_READS_SET1 0xc4 Y Y Y 2 L1 Data Cache Reads
DATA_REFERENCES_SET1 0xc5 Y Y Y 4 Data memory references issued to memory pipeline
L1D_READ_MISSES 0xc7 Y Y Y 2 L1 Data Cache Read Misses
Table 4-13. Performance Monitors for L1D Cache Set 2
Symbol Name Event Code
IAR
DAR
OPC
Max Inc/Cyc Description
BE_L1D_FPU_BUBBLE 0xca N N N 1 Full pipe bubbles in main pipe due to FP or L1D cache
Table 4-14. Performance Monitors for L1D Cache Set 3
Symbol Name Event Code
IAR
DAR
OPC
Max Inc/Cyc Description
LOADS_RETIRED 0xcd Y Y Y 4 Retired Loads
MISALIGNED_LOADS_RETIRED 0xce Y Y Y 4 Retired Misaligned Load Instructions
UC_LOADS_RETIRED 0xcf Y Y Y 4 Retired Uncacheable Loads
Table 4-15. Performance Monitors for L1D Cache Set 4 (Sheet 1 of 2)
Symbol Name Event Code
IAR
DAR
OPC
Max Inc/Cyc Description
MISALIGNED_STORES_RETIRED 0xd2 Y Y Y 2 Retired Misaligned Store Instructions
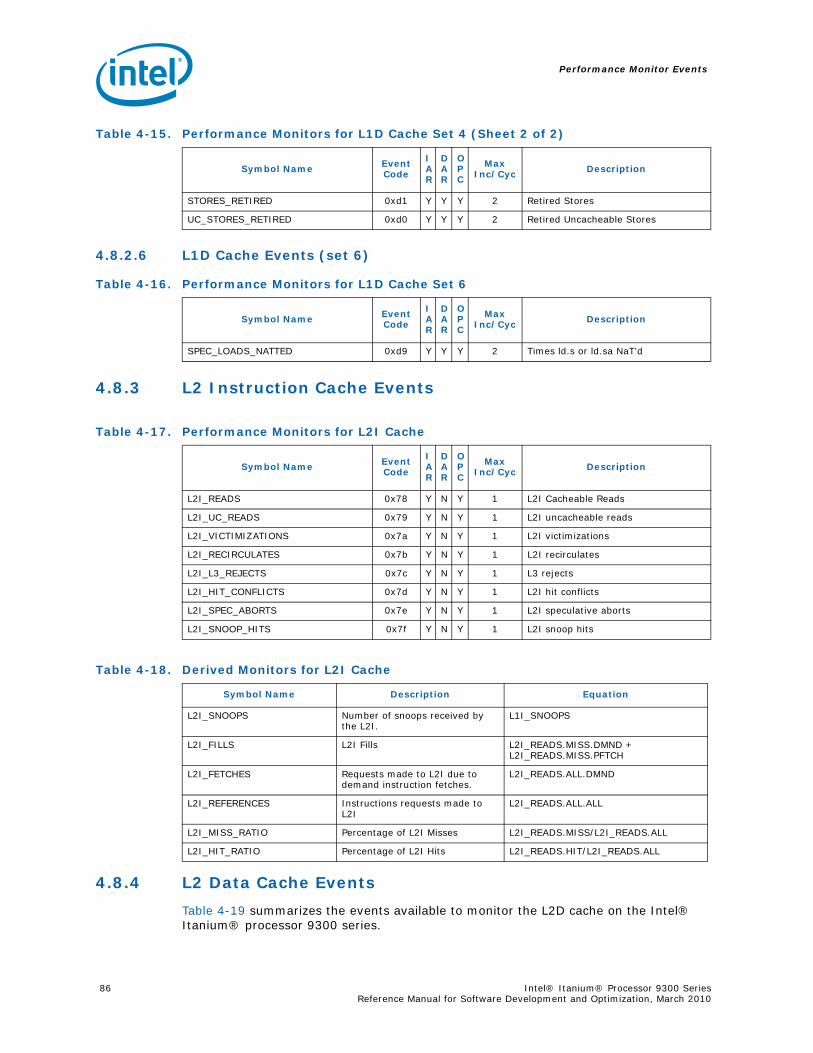
Performance Monitor Events
86 Intel® Itanium® Processor 9300 Series Reference Manual for Software Development and Optimization, March 2010
4.8.2.6 L1D Cache Events (set 6)
4.8.3 L2 Instruction Cache Events
4.8.4 L2 Data Cache Events
Table 4-19 summarizes the events available to monitor the L2D cache on the Intel® Itanium® processor 9300 series.
STORES_RETIRED 0xd1 Y Y Y 2 Retired Stores
UC_STORES_RETIRED 0xd0 Y Y Y 2 Retired Uncacheable Stores
Table 4-16. Performance Monitors for L1D Cache Set 6
Symbol Name Event Code
IAR
DAR
OPC
Max Inc/Cyc Description
SPEC_LOADS_NATTED 0xd9 Y Y Y 2 Times ld.s or ld.sa NaT’d
Table 4-17. Performance Monitors for L2I Cache
Symbol Name Event Code
IAR
DAR
OPC
Max Inc/Cyc Description
L2I_READS 0x78 Y N Y 1 L2I Cacheable Reads
L2I_UC_READS 0x79 Y N Y 1 L2I uncacheable reads
L2I_VICTIMIZATIONS 0x7a Y N Y 1 L2I victimizations
L2I_RECIRCULATES 0x7b Y N Y 1 L2I recirculates
L2I_L3_REJECTS 0x7c Y N Y 1 L3 rejects
L2I_HIT_CONFLICTS 0x7d Y N Y 1 L2I hit conflicts
L2I_SPEC_ABORTS 0x7e Y N Y 1 L2I speculative aborts
L2I_SNOOP_HITS 0x7f Y N Y 1 L2I snoop hits
Table 4-18. Derived Monitors for L2I Cache
Symbol Name Description Equation
L2I_SNOOPS Number of snoops received by the L2I.
L1I_SNOOPS
L2I_FILLS L2I Fills L2I_READS.MISS.DMND + L2I_READS.MISS.PFTCH
L2I_FETCHES Requests made to L2I due to demand instruction fetches.
L2I_READS.ALL.DMND
L2I_REFERENCES Instructions requests made to L2I
L2I_READS.ALL.ALL
L2I_MISS_RATIO Percentage of L2I Misses L2I_READS.MISS/L2I_READS.ALL
L2I_HIT_RATIO Percentage of L2I Hits L2I_READS.HIT/L2I_READS.ALL
Table 4-15. Performance Monitors for L1D Cache Set 4 (Sheet 2 of 2)
Symbol Name Event Code
IAR
DAR
OPC
Max Inc/Cyc Description

Performance Monitor Events
Intel® Itanium® Processor 9300 Series 87Reference Manual for Software Development and Optimization, March 2010
Most L2D events have been divided into 8 sets. Only events within two of these sets (or non-L2D events) can be measured at the same time. These two sets are selected by the event code programmed into PMC4 and PMC6 (that is, if you want to measure any of the events in a particular set, one of these events needs to be measured by PMD4 or PMD6).
Note: The opposite holds true. If PMC4 is not programmed to monitor an L2D event, yet PMC5 or PMC8 are (similarly with PMC6->PMC7/9), PMD values are undefined.
Any event set can be measured by programming either PMC4 or PMC6. Once PMC4 is programmed to measure an event from one L2D event set, PMD4, PMD5, and PMD8 can only measure events from the same L2D event set (PMD5,8 share the umask programmed into PMC4). Similarly, once PMC6 is programmed to monitor another set (could be the same set as measured by PMC4), PMD6, PMD7 and PMD9 can measure events from this set only. None of the L2 data cache events can be measured using PMD10-15.
Support for the .all bit has the same restrictions as the set restrictions. The value set for “.all” in PMC4 applies to both the L1D events selected by it. Hence, even though the “.all” values in PMC5 and PMC8 are different from the value in PMC4, PMC4’s value selects the capability. This is same with PMC6,7,9. This bit is available for both the threads. Hence, it is possible for one thread’s PMDs to monitor just the events credited for that thread while the other thread’s PMDs can monitor events for both threads (if PMC4.all is set). Note that some events do not support .all counting. If .all counting is enabled for events that don’t support it, the resulting counts will be wrong.
While the L2D events support threading, not all counts have access to exact thread id bit needed. Each count is labeled with one of ActiveTrue, ActiveApprox, or TrueThrd. ActiveTrue means that the event is counted with the current active thread, and that thread is the only thread that can see the event when it is counted. ActiveApprox means the event is counted with the current active thread, but there are some corner cases were the event may actually be due to the other non-Active thread. It is assumed in most cases that the error due this approximation will be negligible. TrueThrd indicates that the L2D cache has knowledge of what thread the count belongs to besides the active thread indication, and that knowledge is always correct.
Table 4-19. Performance Monitors for L2 Data Cache Events (Sheet 1 of 2)
Symbol Name Event Code
IAR
DAR
OPC
.all capable
Max Inc/Cyc Description
L2D_OZQ_CANCELS0 0xe0 Y Y Y Y 4 L2D OZQ cancels
L2D_OZQ_FULL 0xe10xe3
N N N N 1 L2D OZQ is full
L2D_OZQ_CANCELS1 0xe2 Y Y Y Y 4 L2D OZQ cancels
L2D_BYPASS 0xe4 Y Y Y Y/N 1 L2D Hit or Miss Bypass (..all support is umask dependent)
L2D_OZQ_RELEASE 0xe5 N N N N 1 Clocks with release ordering attribute existed in L2D OZQ
L2D_REFERENCES 0xe6 Y Y Y Y 4 Data RD/WR access to L2D
L2D_L3ACCESS_CANCEL 0xe8 Y Y Y N 1 Canceled L3 accesses
L2D_OZDB_FULL 0xe9 N N N Y 1 L2D OZ data buffer is full
L2D_FORCE_RECIRC 0xea Y Y Y Y/N 4 Forced recirculates

Performance Monitor Events
88 Intel® Itanium® Processor 9300 Series Reference Manual for Software Development and Optimization, March 2010
L2D_ISSUED_RECIRC_OZQ_ACC 0xeb Y Y Y Y 1 Count the number of times a recirculate issue was attempted and not preempted
L2DBAD_LINES_SELECTED 0xec Y Y Y Y 4 Valid line replaced when invalid line is available
L2D_STORE_HIT_SHARED 0xed Y Y Y Y 2 Store hit a shared line
L2D_OZQ_ACQUIRE 0xef N N N Y 1 Clocks with acquire ordering attribute existed in L2D OZQ
L2D_OPS_ISSUED 0xf0 Y Y Y N 4 Different operations issued by L2D
L2D_FILLB_FULL 0xf1 N N N N 1 L2D Fill buffer is full
L2D_FILL_MESI_STATE 0xf2 Y Y Y Y 1 MESI states of fills to L2D cache
L2D_VICTIMB_FULL 0xf3 N N N Y 1 L2D victim buffer is full
L2D_MISSES 0xcb Y Y Y Y 1 L2D Misses - NOT SET RESTRICTED
L2D_INSERT_HITS 0xb1 Y Y Y Y 4 L2D Hits on Insert - NOT SET RESTRICTED
L2D_INSERT_MISSES 0xb0 Y Y Y Y 4 L2D Misses on Insert - NOT SET RESTRICTED
Table 4-19. Performance Monitors for L2 Data Cache Events (Sheet 2 of 2)
Symbol Name Event Code
IAR
DAR
OPC
.all capable
Max Inc/Cyc Description
Table 4-20. Derived Monitors for L2 Data Cache Events
Symbol Name Description Equation
L2D_READS L2 Data Read Requests L2D_REFERENCES.READS
L2D_WRITES L2 Data Write Requests L2D_REFERENCES.WRITES
L2D_MISS_RATIO Percentage of L2D Misses L2D_INSERT_MISSES/L2D_REFERENCES
L2D_HIT_RATIO Percentage of L2D Hits L2D_INSERT_HITS/L2D_REFERENCES
L2D_RECIRC_ATTEMPTS Number of times the L2 issue logic atempted to issue a recirculate
L2D_ISSUED_RECIRC_OZQ_ACC + L2D_OZQ_CANCEL_S0.RECIRC
L2D_FILL_MESI_STATE.PPRIME
Counts fills to P Prime L2D_FILL_MESI_STATE.P_EPRIME - L2D_FILL_MESI_STATE.EPRIME
L2D_AVG_CNFL_SNPRSP Average number of cycles L2D holds a conflicted snoop response.
L2D_FILL_MESI_STATE.INUSEMANY / L2D_FILL_MESI_STATE.P_EPRIME

Performance Monitor Events
Intel® Itanium® Processor 9300 Series 89Reference Manual for Software Development and Optimization, March 2010
4.8.4.1 L2 Data Cache Events (Set 0)
L2D_OZQ_FULL is not .all capable.
4.8.4.2 L2 Data Cache Events (Set 1)
The L2D_BYPASS count on dual-core Intel® Itanium® processors was too speculative to be useful. It has been fixed and we now count how many bypasses occurred in a given cycle, rather than signalling a 1 for 1-4 bypasses. The 5 and 7 cycle umasks of L2D_BYPASS and the L2D_OZQ_RELEASE counts are not .all capable.
4.8.4.3 L2 Data Cache Events (Set 2)
4.8.4.4 L2 Data Cache Events (Set 3)L
L2D_L3_ACCESS_CANCEL events are not .all capable.
Table 4-21. Performance Monitors for L2 Data Cache Set 0
Symbol Name Event Code
IAR
DAR
OPC
Max Inc/Cyc Description
L2D_OZQ_FULL 0xe10xe3
N N N 1 L2D OZQ Full-ActiveApprox
L2D_OZQ_CANCELS0 0xe0 Y Y Y 4 L2D OZQ cancels-TrueThrd
L2D_OZQ_CANCELS1 0xe2 Y Y Y 4 L2D OZQ cancels-TrueThrd
Table 4-22. Performance Monitors for L2 Data Cache Set 1
Symbol Name Event Code
IAR
DAR
OPC
Max Inc/Cyc Description
L2D_BYPASS 0xe4 Y Y Y 4 Count L2 Hit bypasses-TrueThread
L2D_OZQ_RELEASE 0xe5 N N N 1 Effective Release is valid in Ozq-ActiveApprox
Table 4-23. Performance Monitors for L2 Data Cache Set 2
Symbol Name Event Code
IAR
DAR
OPC
Max Inc/Cyc Description
L2D_REFERENCES 0xe6 Y Y Y 4 Inserts of Data Accesses into Ozq-ActiveTrue
Not supported 0xe7 - - - - -
Table 4-24. Performance Monitors for L2 Data Cache Set 3
Symbol Name Event Code
IAR
DAR
OPC
Max Inc/Cyc Description
L2D_L3_ACCESS_CANCEL 0xe8 Y Y Y 1 L2D request to L3 was cancelled-TrueThrd
L2D_OZDB_FULL 0xe9 N N N 1 L2D OZ data buffer is full-AcitveApprox
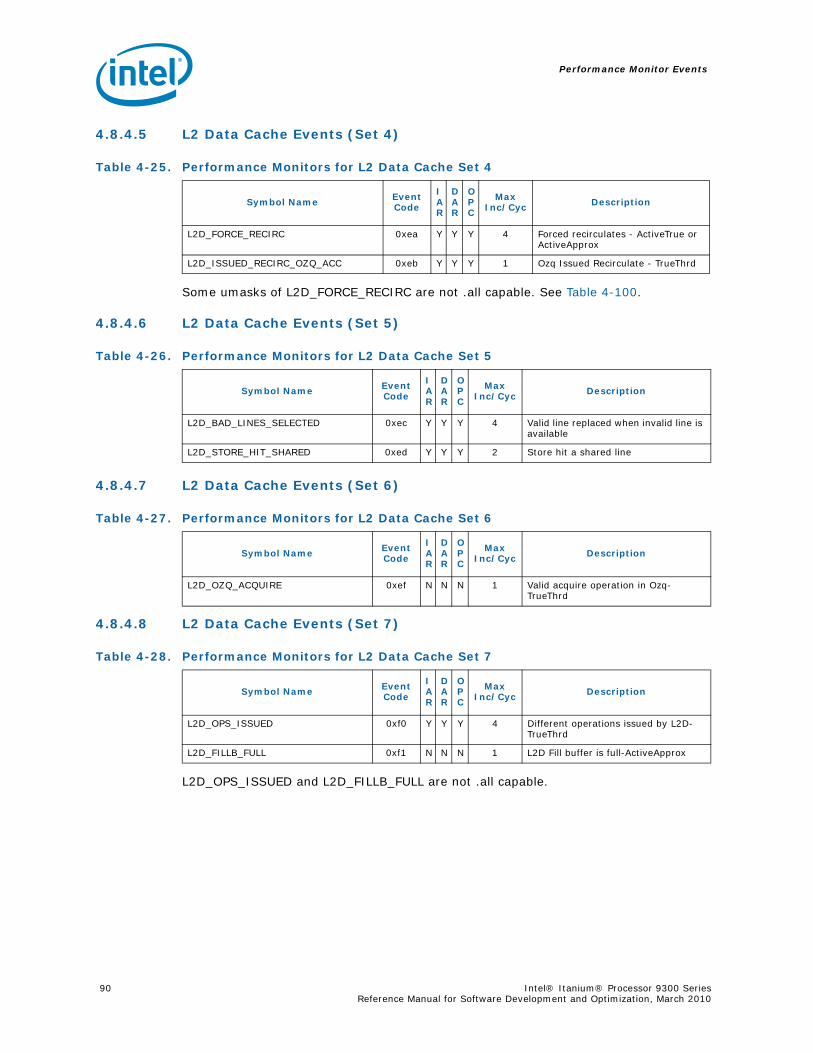
Performance Monitor Events
90 Intel® Itanium® Processor 9300 Series Reference Manual for Software Development and Optimization, March 2010
4.8.4.5 L2 Data Cache Events (Set 4)
Some umasks of L2D_FORCE_RECIRC are not .all capable. See Table 4-100.
4.8.4.6 L2 Data Cache Events (Set 5)
4.8.4.7 L2 Data Cache Events (Set 6)
4.8.4.8 L2 Data Cache Events (Set 7)
L2D_OPS_ISSUED and L2D_FILLB_FULL are not .all capable.
Table 4-25. Performance Monitors for L2 Data Cache Set 4
Symbol Name Event Code
IAR
DAR
OPC
Max Inc/Cyc Description
L2D_FORCE_RECIRC 0xea Y Y Y 4 Forced recirculates - ActiveTrue or ActiveApprox
L2D_ISSUED_RECIRC_OZQ_ACC 0xeb Y Y Y 1 Ozq Issued Recirculate - TrueThrd
Table 4-26. Performance Monitors for L2 Data Cache Set 5
Symbol Name Event Code
IAR
DAR
OPC
Max Inc/Cyc Description
L2D_BAD_LINES_SELECTED 0xec Y Y Y 4 Valid line replaced when invalid line is available
L2D_STORE_HIT_SHARED 0xed Y Y Y 2 Store hit a shared line
Table 4-27. Performance Monitors for L2 Data Cache Set 6
Symbol Name Event Code
IAR
DAR
OPC
Max Inc/Cyc Description
L2D_OZQ_ACQUIRE 0xef N N N 1 Valid acquire operation in Ozq-TrueThrd
Table 4-28. Performance Monitors for L2 Data Cache Set 7
Symbol Name Event Code
IAR
DAR
OPC
Max Inc/Cyc Description
L2D_OPS_ISSUED 0xf0 Y Y Y 4 Different operations issued by L2D-TrueThrd
L2D_FILLB_FULL 0xf1 N N N 1 L2D Fill buffer is full-ActiveApprox
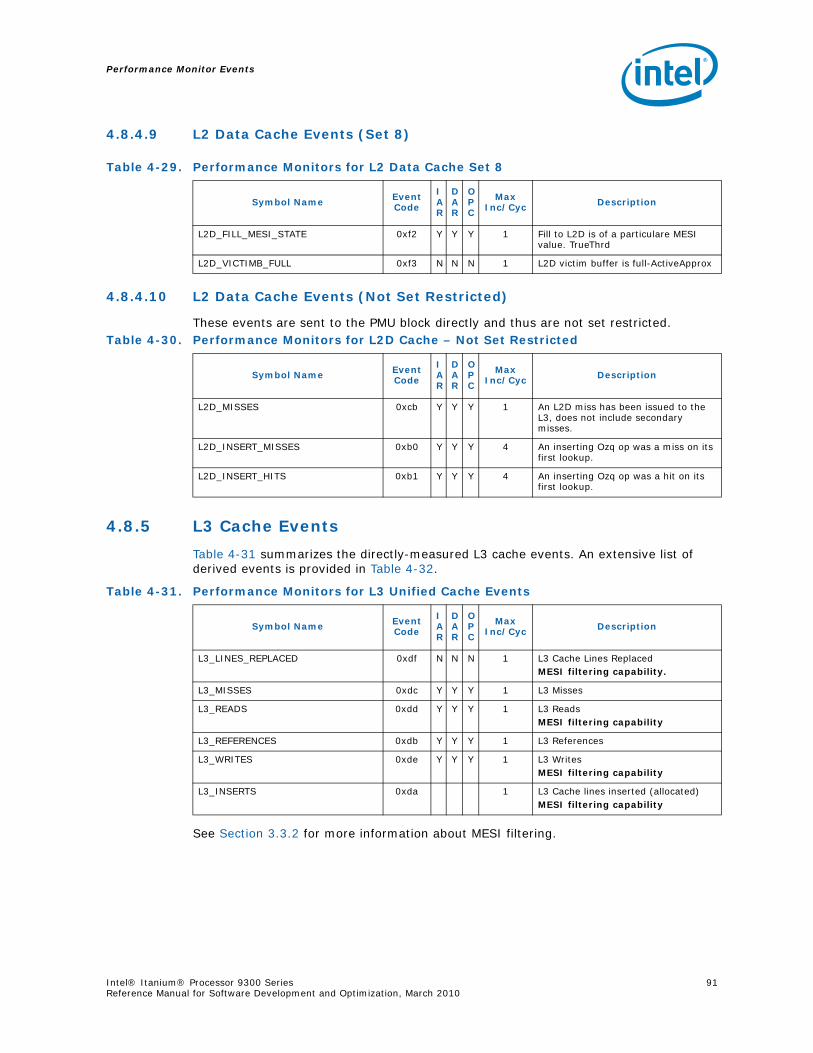
Performance Monitor Events
Intel® Itanium® Processor 9300 Series 91Reference Manual for Software Development and Optimization, March 2010
4.8.4.9 L2 Data Cache Events (Set 8)
4.8.4.10 L2 Data Cache Events (Not Set Restricted)
These events are sent to the PMU block directly and thus are not set restricted.
4.8.5 L3 Cache Events
Table 4-31 summarizes the directly-measured L3 cache events. An extensive list of derived events is provided in Table 4-32.
See Section 3.3.2 for more information about MESI filtering.
Table 4-29. Performance Monitors for L2 Data Cache Set 8
Symbol Name Event Code
IAR
DAR
OPC
Max Inc/Cyc Description
L2D_FILL_MESI_STATE 0xf2 Y Y Y 1 Fill to L2D is of a particulare MESI value. TrueThrd
L2D_VICTIMB_FULL 0xf3 N N N 1 L2D victim buffer is full-ActiveApprox
Table 4-30. Performance Monitors for L2D Cache – Not Set Restricted
Symbol Name Event Code
IAR
DAR
OPC
Max Inc/Cyc Description
L2D_MISSES 0xcb Y Y Y 1 An L2D miss has been issued to the L3, does not include secondary misses.
L2D_INSERT_MISSES 0xb0 Y Y Y 4 An inserting Ozq op was a miss on its first lookup.
L2D_INSERT_HITS 0xb1 Y Y Y 4 An inserting Ozq op was a hit on its first lookup.
Table 4-31. Performance Monitors for L3 Unified Cache Events
Symbol Name Event Code
IAR
DAR
OPC
Max Inc/Cyc Description
L3_LINES_REPLACED 0xdf N N N 1 L3 Cache Lines ReplacedMESI filtering capability.
L3_MISSES 0xdc Y Y Y 1 L3 Misses
L3_READS 0xdd Y Y Y 1 L3 ReadsMESI filtering capability
L3_REFERENCES 0xdb Y Y Y 1 L3 References
L3_WRITES 0xde Y Y Y 1 L3 WritesMESI filtering capability
L3_INSERTS 0xda 1 L3 Cache lines inserted (allocated) MESI filtering capability
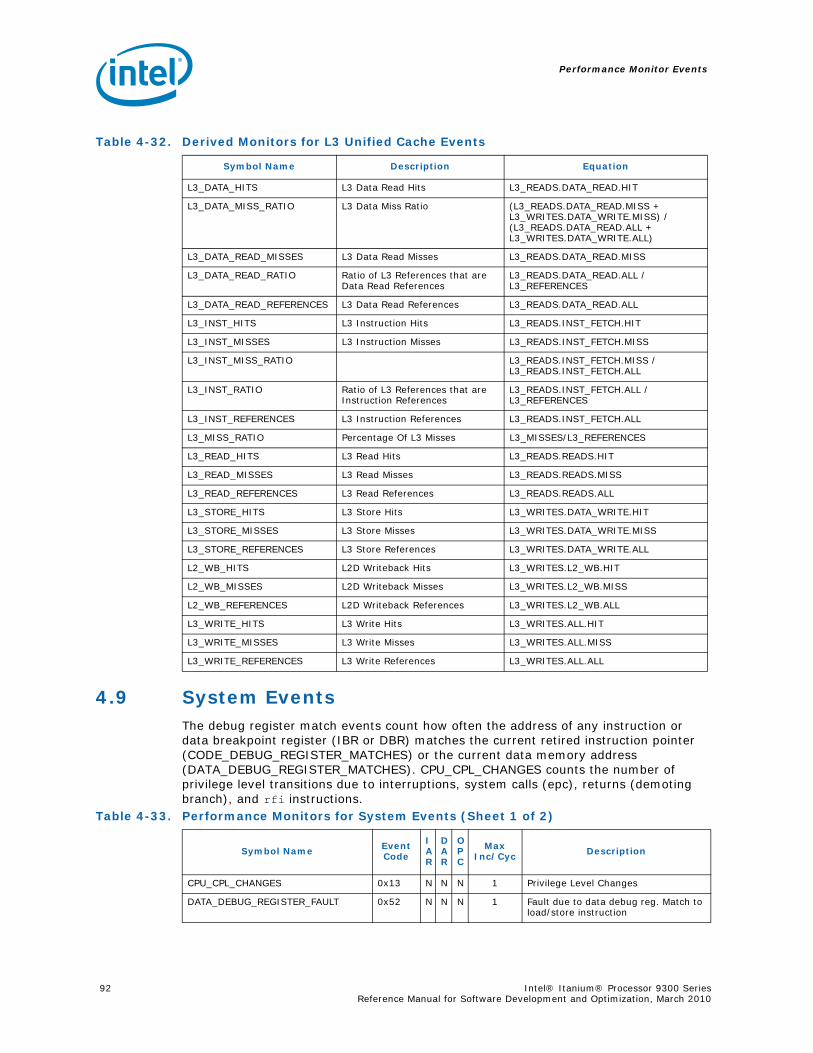
Performance Monitor Events
92 Intel® Itanium® Processor 9300 Series Reference Manual for Software Development and Optimization, March 2010
4.9 System EventsThe debug register match events count how often the address of any instruction or data breakpoint register (IBR or DBR) matches the current retired instruction pointer (CODE_DEBUG_REGISTER_MATCHES) or the current data memory address (DATA_DEBUG_REGISTER_MATCHES). CPU_CPL_CHANGES counts the number of privilege level transitions due to interruptions, system calls (epc), returns (demoting branch), and rfi instructions.
Table 4-32. Derived Monitors for L3 Unified Cache Events
Symbol Name Description Equation
L3_DATA_HITS L3 Data Read Hits L3_READS.DATA_READ.HIT
L3_DATA_MISS_RATIO L3 Data Miss Ratio (L3_READS.DATA_READ.MISS + L3_WRITES.DATA_WRITE.MISS) / (L3_READS.DATA_READ.ALL + L3_WRITES.DATA_WRITE.ALL)
L3_DATA_READ_MISSES L3 Data Read Misses L3_READS.DATA_READ.MISS
L3_DATA_READ_RATIO Ratio of L3 References that are Data Read References
L3_READS.DATA_READ.ALL / L3_REFERENCES
L3_DATA_READ_REFERENCES L3 Data Read References L3_READS.DATA_READ.ALL
L3_INST_HITS L3 Instruction Hits L3_READS.INST_FETCH.HIT
L3_INST_MISSES L3 Instruction Misses L3_READS.INST_FETCH.MISS
L3_INST_MISS_RATIO L3_READS.INST_FETCH.MISS / L3_READS.INST_FETCH.ALL
L3_INST_RATIO Ratio of L3 References that are Instruction References
L3_READS.INST_FETCH.ALL / L3_REFERENCES
L3_INST_REFERENCES L3 Instruction References L3_READS.INST_FETCH.ALL
L3_MISS_RATIO Percentage Of L3 Misses L3_MISSES/L3_REFERENCES
L3_READ_HITS L3 Read Hits L3_READS.READS.HIT
L3_READ_MISSES L3 Read Misses L3_READS.READS.MISS
L3_READ_REFERENCES L3 Read References L3_READS.READS.ALL
L3_STORE_HITS L3 Store Hits L3_WRITES.DATA_WRITE.HIT
L3_STORE_MISSES L3 Store Misses L3_WRITES.DATA_WRITE.MISS
L3_STORE_REFERENCES L3 Store References L3_WRITES.DATA_WRITE.ALL
L2_WB_HITS L2D Writeback Hits L3_WRITES.L2_WB.HIT
L2_WB_MISSES L2D Writeback Misses L3_WRITES.L2_WB.MISS
L2_WB_REFERENCES L2D Writeback References L3_WRITES.L2_WB.ALL
L3_WRITE_HITS L3 Write Hits L3_WRITES.ALL.HIT
L3_WRITE_MISSES L3 Write Misses L3_WRITES.ALL.MISS
L3_WRITE_REFERENCES L3 Write References L3_WRITES.ALL.ALL
Table 4-33. Performance Monitors for System Events (Sheet 1 of 2)
Symbol Name Event Code
IAR
DAR
OPC
Max Inc/Cyc Description
CPU_CPL_CHANGES 0x13 N N N 1 Privilege Level Changes
DATA_DEBUG_REGISTER_FAULT 0x52 N N N 1 Fault due to data debug reg. Match to load/store instruction
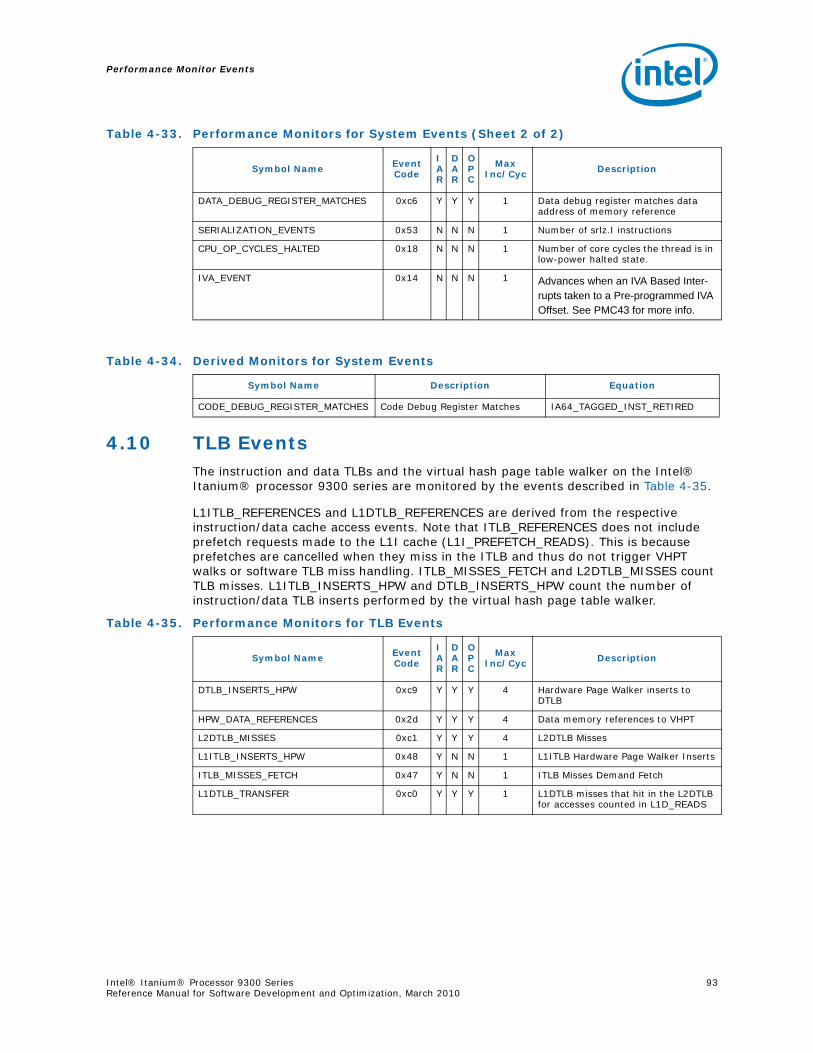
Performance Monitor Events
Intel® Itanium® Processor 9300 Series 93Reference Manual for Software Development and Optimization, March 2010
4.10 TLB EventsThe instruction and data TLBs and the virtual hash page table walker on the Intel® Itanium® processor 9300 series are monitored by the events described in Table 4-35.
L1ITLB_REFERENCES and L1DTLB_REFERENCES are derived from the respective instruction/data cache access events. Note that ITLB_REFERENCES does not include prefetch requests made to the L1I cache (L1I_PREFETCH_READS). This is because prefetches are cancelled when they miss in the ITLB and thus do not trigger VHPT walks or software TLB miss handling. ITLB_MISSES_FETCH and L2DTLB_MISSES count TLB misses. L1ITLB_INSERTS_HPW and DTLB_INSERTS_HPW count the number of instruction/data TLB inserts performed by the virtual hash page table walker.
DATA_DEBUG_REGISTER_MATCHES 0xc6 Y Y Y 1 Data debug register matches data address of memory reference
SERIALIZATION_EVENTS 0x53 N N N 1 Number of srlz.I instructions
CPU_OP_CYCLES_HALTED 0x18 N N N 1 Number of core cycles the thread is in low-power halted state.
IVA_EVENT 0x14 N N N 1 Advances when an IVA Based Inter-rupts taken to a Pre-programmed IVA Offset. See PMC43 for more info.
Table 4-33. Performance Monitors for System Events (Sheet 2 of 2)
Symbol Name Event Code
IAR
DAR
OPC
Max Inc/Cyc Description
Table 4-34. Derived Monitors for System Events
Symbol Name Description Equation
CODE_DEBUG_REGISTER_MATCHES Code Debug Register Matches IA64_TAGGED_INST_RETIRED
Table 4-35. Performance Monitors for TLB Events
Symbol Name Event Code
IAR
DAR
OPC
Max Inc/Cyc Description
DTLB_INSERTS_HPW 0xc9 Y Y Y 4 Hardware Page Walker inserts to DTLB
HPW_DATA_REFERENCES 0x2d Y Y Y 4 Data memory references to VHPT
L2DTLB_MISSES 0xc1 Y Y Y 4 L2DTLB Misses
L1ITLB_INSERTS_HPW 0x48 Y N N 1 L1ITLB Hardware Page Walker Inserts
ITLB_MISSES_FETCH 0x47 Y N N 1 ITLB Misses Demand Fetch
L1DTLB_TRANSFER 0xc0 Y Y Y 1 L1DTLB misses that hit in the L2DTLB for accesses counted in L1D_READS
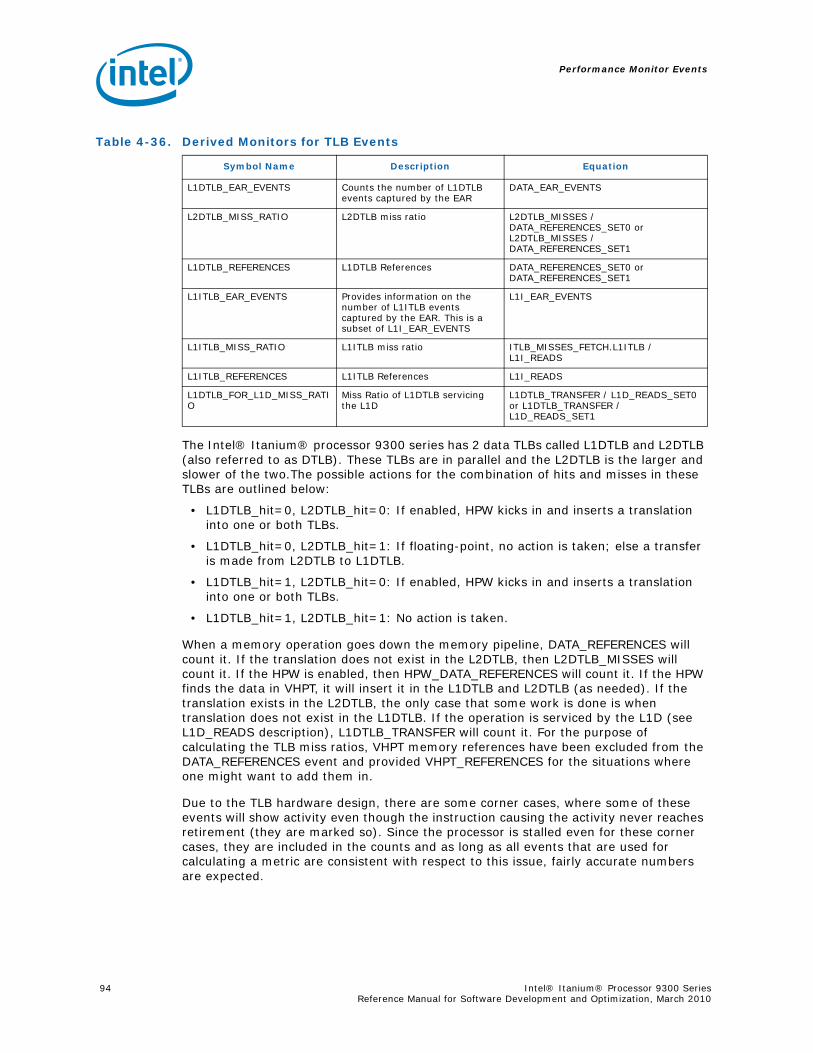
Performance Monitor Events
94 Intel® Itanium® Processor 9300 Series Reference Manual for Software Development and Optimization, March 2010
The Intel® Itanium® processor 9300 series has 2 data TLBs called L1DTLB and L2DTLB (also referred to as DTLB). These TLBs are in parallel and the L2DTLB is the larger and slower of the two.The possible actions for the combination of hits and misses in these TLBs are outlined below:
• L1DTLB_hit=0, L2DTLB_hit=0: If enabled, HPW kicks in and inserts a translation into one or both TLBs.
• L1DTLB_hit=0, L2DTLB_hit=1: If floating-point, no action is taken; else a transfer is made from L2DTLB to L1DTLB.
• L1DTLB_hit=1, L2DTLB_hit=0: If enabled, HPW kicks in and inserts a translation into one or both TLBs.
• L1DTLB_hit=1, L2DTLB_hit=1: No action is taken.
When a memory operation goes down the memory pipeline, DATA_REFERENCES will count it. If the translation does not exist in the L2DTLB, then L2DTLB_MISSES will count it. If the HPW is enabled, then HPW_DATA_REFERENCES will count it. If the HPW finds the data in VHPT, it will insert it in the L1DTLB and L2DTLB (as needed). If the translation exists in the L2DTLB, the only case that some work is done is when translation does not exist in the L1DTLB. If the operation is serviced by the L1D (see L1D_READS description), L1DTLB_TRANSFER will count it. For the purpose of calculating the TLB miss ratios, VHPT memory references have been excluded from the DATA_REFERENCES event and provided VHPT_REFERENCES for the situations where one might want to add them in.
Due to the TLB hardware design, there are some corner cases, where some of these events will show activity even though the instruction causing the activity never reaches retirement (they are marked so). Since the processor is stalled even for these corner cases, they are included in the counts and as long as all events that are used for calculating a metric are consistent with respect to this issue, fairly accurate numbers are expected.
Table 4-36. Derived Monitors for TLB Events
Symbol Name Description Equation
L1DTLB_EAR_EVENTS Counts the number of L1DTLB events captured by the EAR
DATA_EAR_EVENTS
L2DTLB_MISS_RATIO L2DTLB miss ratio L2DTLB_MISSES / DATA_REFERENCES_SET0 or L2DTLB_MISSES / DATA_REFERENCES_SET1
L1DTLB_REFERENCES L1DTLB References DATA_REFERENCES_SET0 or DATA_REFERENCES_SET1
L1ITLB_EAR_EVENTS Provides information on the number of L1ITLB events captured by the EAR. This is a subset of L1I_EAR_EVENTS
L1I_EAR_EVENTS
L1ITLB_MISS_RATIO L1ITLB miss ratio ITLB_MISSES_FETCH.L1ITLB / L1I_READS
L1ITLB_REFERENCES L1ITLB References L1I_READS
L1DTLB_FOR_L1D_MISS_RATIO
Miss Ratio of L1DTLB servicing the L1D
L1DTLB_TRANSFER / L1D_READS_SET0 or L1DTLB_TRANSFER / L1D_READS_SET1
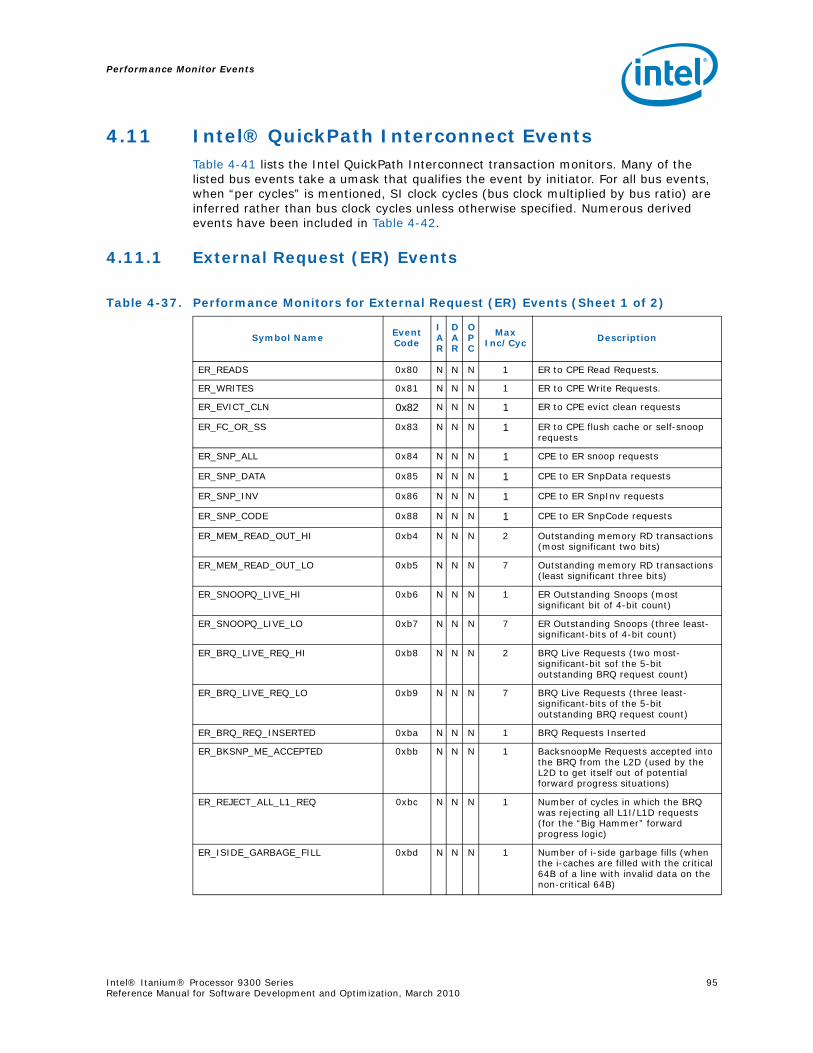
Performance Monitor Events
Intel® Itanium® Processor 9300 Series 95Reference Manual for Software Development and Optimization, March 2010
4.11 Intel® QuickPath Interconnect EventsTable 4-41 lists the Intel QuickPath Interconnect transaction monitors. Many of the listed bus events take a umask that qualifies the event by initiator. For all bus events, when “per cycles” is mentioned, SI clock cycles (bus clock multiplied by bus ratio) are inferred rather than bus clock cycles unless otherwise specified. Numerous derived events have been included in Table 4-42.
4.11.1 External Request (ER) Events
Table 4-37. Performance Monitors for External Request (ER) Events (Sheet 1 of 2)
Symbol Name Event Code
IAR
DAR
OPC
Max Inc/Cyc Description
ER_READS 0x80 N N N 1 ER to CPE Read Requests.
ER_WRITES 0x81 N N N 1 ER to CPE Write Requests.
ER_EVICT_CLN 0x82 N N N 1 ER to CPE evict clean requests
ER_FC_OR_SS 0x83 N N N 1 ER to CPE flush cache or self-snoop requests
ER_SNP_ALL 0x84 N N N 1 CPE to ER snoop requests
ER_SNP_DATA 0x85 N N N 1 CPE to ER SnpData requests
ER_SNP_INV 0x86 N N N 1 CPE to ER SnpInv requests
ER_SNP_CODE 0x88 N N N 1 CPE to ER SnpCode requests
ER_MEM_READ_OUT_HI 0xb4 N N N 2 Outstanding memory RD transactions (most significant two bits)
ER_MEM_READ_OUT_LO 0xb5 N N N 7 Outstanding memory RD transactions (least significant three bits)
ER_SNOOPQ_LIVE_HI 0xb6 N N N 1 ER Outstanding Snoops (most significant bit of 4-bit count)
ER_SNOOPQ_LIVE_LO 0xb7 N N N 7 ER Outstanding Snoops (three least-significant-bits of 4-bit count)
ER_BRQ_LIVE_REQ_HI 0xb8 N N N 2 BRQ Live Requests (two most-significant-bit sof the 5-bit outstanding BRQ request count)
ER_BRQ_LIVE_REQ_LO 0xb9 N N N 7 BRQ Live Requests (three least-significant-bits of the 5-bit outstanding BRQ request count)
ER_BRQ_REQ_INSERTED 0xba N N N 1 BRQ Requests Inserted
ER_BKSNP_ME_ACCEPTED 0xbb N N N 1 BacksnoopMe Requests accepted into the BRQ from the L2D (used by the L2D to get itself out of potential forward progress situations)
ER_REJECT_ALL_L1_REQ 0xbc N N N 1 Number of cycles in which the BRQ was rejecting all L1I/L1D requests (for the “Big Hammer” forward progress logic)
ER_ISIDE_GARBAGE_FILL 0xbd N N N 1 Number of i-side garbage fills (when the i-caches are filled with the critical 64B of a line with invalid data on the non-critical 64B)
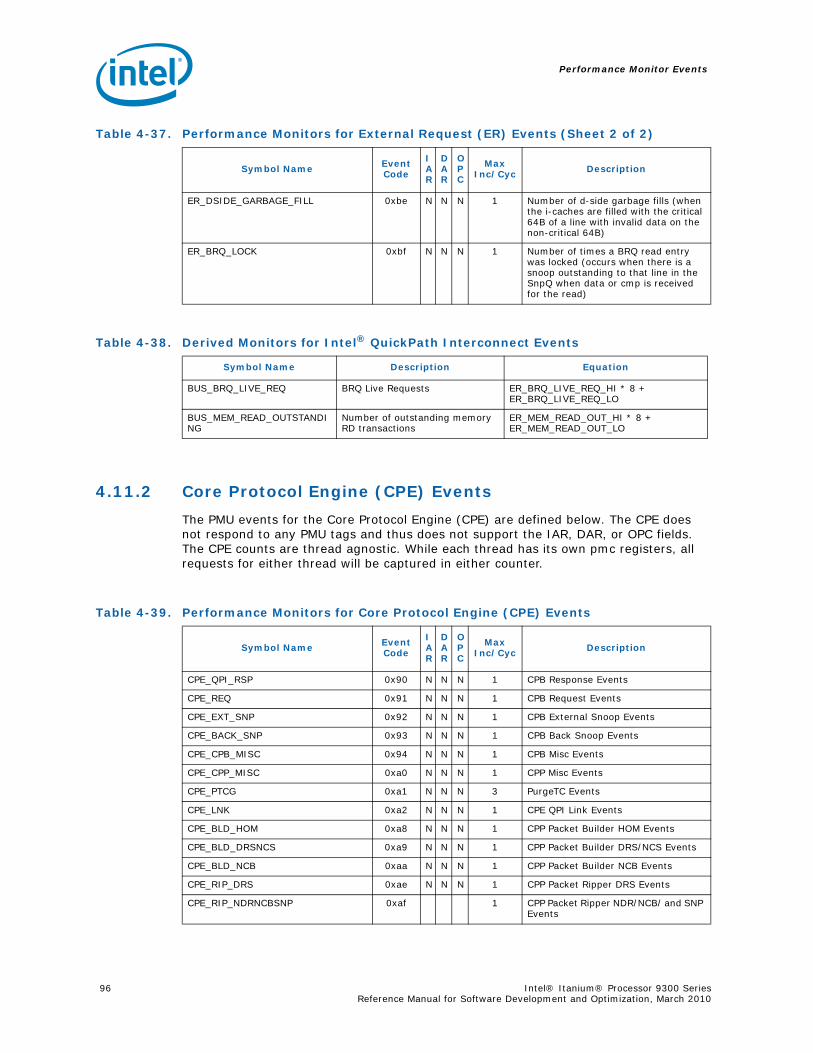
Performance Monitor Events
96 Intel® Itanium® Processor 9300 Series Reference Manual for Software Development and Optimization, March 2010
4.11.2 Core Protocol Engine (CPE) Events
The PMU events for the Core Protocol Engine (CPE) are defined below. The CPE does not respond to any PMU tags and thus does not support the IAR, DAR, or OPC fields. The CPE counts are thread agnostic. While each thread has its own pmc registers, all requests for either thread will be captured in either counter.
ER_DSIDE_GARBAGE_FILL 0xbe N N N 1 Number of d-side garbage fills (when the i-caches are filled with the critical 64B of a line with invalid data on the non-critical 64B)
ER_BRQ_LOCK 0xbf N N N 1 Number of times a BRQ read entry was locked (occurs when there is a snoop outstanding to that line in the SnpQ when data or cmp is received for the read)
Table 4-37. Performance Monitors for External Request (ER) Events (Sheet 2 of 2)
Symbol Name Event Code
IAR
DAR
OPC
Max Inc/Cyc Description
Table 4-38. Derived Monitors for Intel® QuickPath Interconnect Events
Symbol Name Description Equation
BUS_BRQ_LIVE_REQ BRQ Live Requests ER_BRQ_LIVE_REQ_HI * 8 + ER_BRQ_LIVE_REQ_LO
BUS_MEM_READ_OUTSTANDING
Number of outstanding memory RD transactions
ER_MEM_READ_OUT_HI * 8 + ER_MEM_READ_OUT_LO
Table 4-39. Performance Monitors for Core Protocol Engine (CPE) Events
Symbol Name Event Code
IAR
DAR
OPC
Max Inc/Cyc Description
CPE_QPI_RSP 0x90 N N N 1 CPB Response Events
CPE_REQ 0x91 N N N 1 CPB Request Events
CPE_EXT_SNP 0x92 N N N 1 CPB External Snoop Events
CPE_BACK_SNP 0x93 N N N 1 CPB Back Snoop Events
CPE_CPB_MISC 0x94 N N N 1 CPB Misc Events
CPE_CPP_MISC 0xa0 N N N 1 CPP Misc Events
CPE_PTCG 0xa1 N N N 3 PurgeTC Events
CPE_LNK 0xa2 N N N 1 CPE QPI Link Events
CPE_BLD_HOM 0xa8 N N N 1 CPP Packet Builder HOM Events
CPE_BLD_DRSNCS 0xa9 N N N 1 CPP Packet Builder DRS/NCS Events
CPE_BLD_NCB 0xaa N N N 1 CPP Packet Builder NCB Events
CPE_RIP_DRS 0xae N N N 1 CPP Packet Ripper DRS Events
CPE_RIP_NDRNCBSNP 0xaf 1 CPP Packet Ripper NDR/NCB/ and SNP Events
Performance Monitor Events
Intel® Itanium® Processor 9300 Series 97Reference Manual for Software Development and Optimization, March 2010
4.11.3 Extracting Memory Latency from the Intel® Itanium® Processor 9300 Series Performance Counters
On previous Intel® Itanium® processors, several events were provided to approximate memory latency as seen by the processor using the following equation:
(ER_MEM_READ_OUT_HI * 8) + ER_MEM_READ_OUT_LO) /ER_READS.CACHEABLE_READS.
The ER_MEM_READ_OUT starts counting one bus clock after a request is issued on the system interface (ADS) and stops incrementing when the request completes its first data transfer or is retried. In each core cycle after counting is initiated, the number of live requests in that cycle are added to the count. This count may as high as 15. For ease of implementation, the count is split into two parts: ER_MEM_READ_OUT_LO sums up the low order 3 bits of the number of live requests, while ER_MEM_READ_OUT_HI sums up the high order bit.
In the above formula, the numerator provides the number of live requests and the denominator provides the number of requests that are counted. When the live count is divided by the number of transactions issued, you get an average lifetime of a transaction issued on the system interface (a novel application of Little’s Law).
The Intel® Itanium® processor 9300 series has similar counters: ER_MEM_READ_OUT.{HI,LO} Using these events to derive Intel® Itanium® processor 9300 series memory latency will give results that are higher than the true memory latency seen in the Intel® Itanium® processor 9300 series. The main reason for this is the fact that the start and stop point of the counters are not equivalent between the two processors. Specifically, in the Intel® Itanium® processor 9300 series, ER_MEM_READ_OUT.{HI,LO} events start counting the core clock after a request is sent to the arbiter. The Intel® Itanium® processor 9300 series ER_MEM_READ_OUT_{HI,LO} events stop counting when the request receives its first data transfer within the external request logic (after the arbiter). Thus, these events include the entire time requests spend in the arbiter (pre and post request).
Note that the Data EAR may be used to compare data cache load miss latency between the Intel® Itanium® processor with 6MB L3 cache and the Intel® Itanium® processor 9300 series. However, an access’ memory latency, as measured by the Data EAR or other cycle counters will be inherently greater on the Intel® Itanium® processor 9300 series compared to previous dual-core Intel® Itanium® processors processors due to the latency the arbiter adds to both the outbound request and inbound data transfer. Also, the Data EAR encompasses the entire latency through the processor’s memory hierarchy and queues without details into time spent in any specific queue.
Even with this improved formula, the estimated memory latency for the Intel® Itanium® processor 9300 series will appear greater than previous Intel® Itanium® processors. We have not observed any design point that suggests that the system interface component of memory accesses are excessive on Intel® Itanium® processor 9300 series.
We have observed that snoop stalls and write queue pressure lead to additional memory latency on the Intel® Itanium® processor 9300 series compared to previous dual-core Intel® Itanium® processors processors, but these are phenomena that impact the pre-system or post-system interface aspect of a memory latency and are very workload dependant in their impact. Specifically, the write queues need to be sufficiently filled to cause back pressure on the victimizing read requests such that a new read request cannot issue to the system interface because it cannot identify a victim in the L3 cache to ensure its proper allocation. This sever pressure has only

Performance Monitor Events
98 Intel® Itanium® Processor 9300 Series Reference Manual for Software Development and Optimization, March 2010
been seen with steady streams of every read requests resulting in a dirty L3 victim. Additional snoop stalls should only add latency to transactions that receive a HITM snoop response (cache to cache transfers) because non-HITM responses are satisfied by the memory and memory access should be initiated as a consequence of the initial transaction rather than its snoop response.
The figure below (Figure ) shows the latency is determined using the above calculations on the dual-core Intel® Itanium® processors and Intel® Itanium® processor 9300 series. The red portion of the Intel® Itanium® processor 9300 series diagram shows latency accounted for by the correction found in the Intel® Itanium® processor 9300 series calculation.
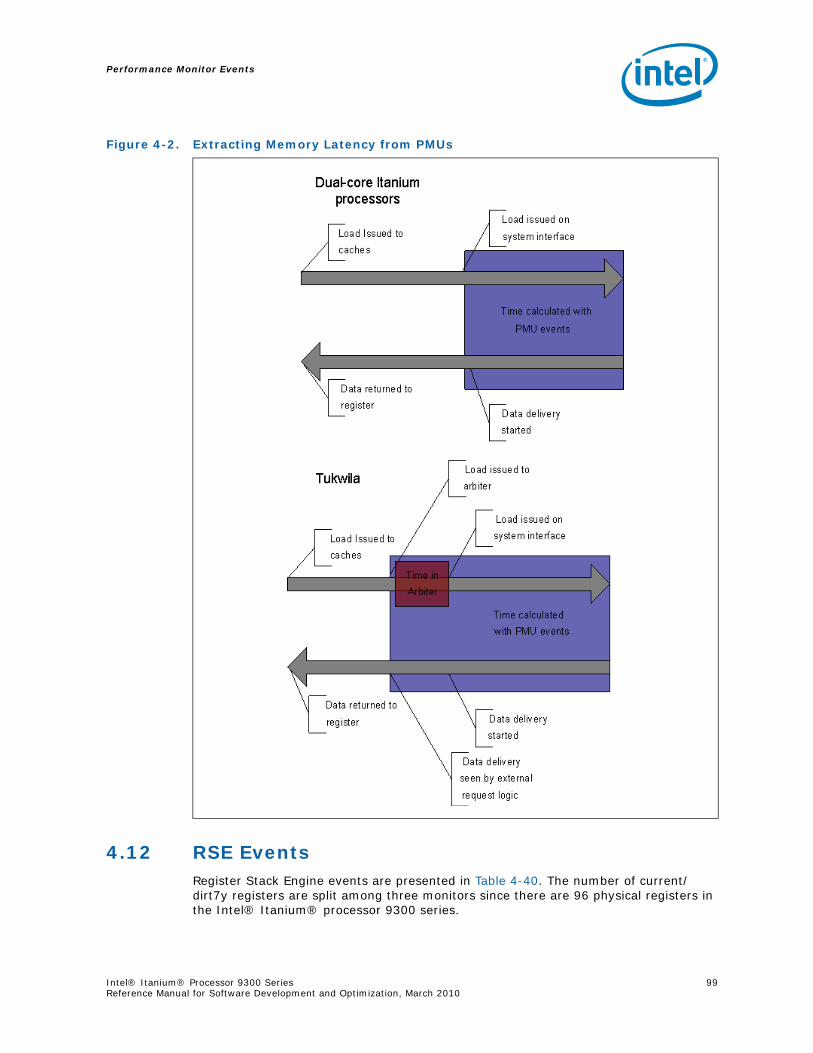
Performance Monitor Events
Intel® Itanium® Processor 9300 Series 99Reference Manual for Software Development and Optimization, March 2010
4.12 RSE EventsRegister Stack Engine events are presented in Table 4-40. The number of current/dirt7y registers are split among three monitors since there are 96 physical registers in the Intel® Itanium® processor 9300 series.
Figure 4-2. Extracting Memory Latency from PMUs
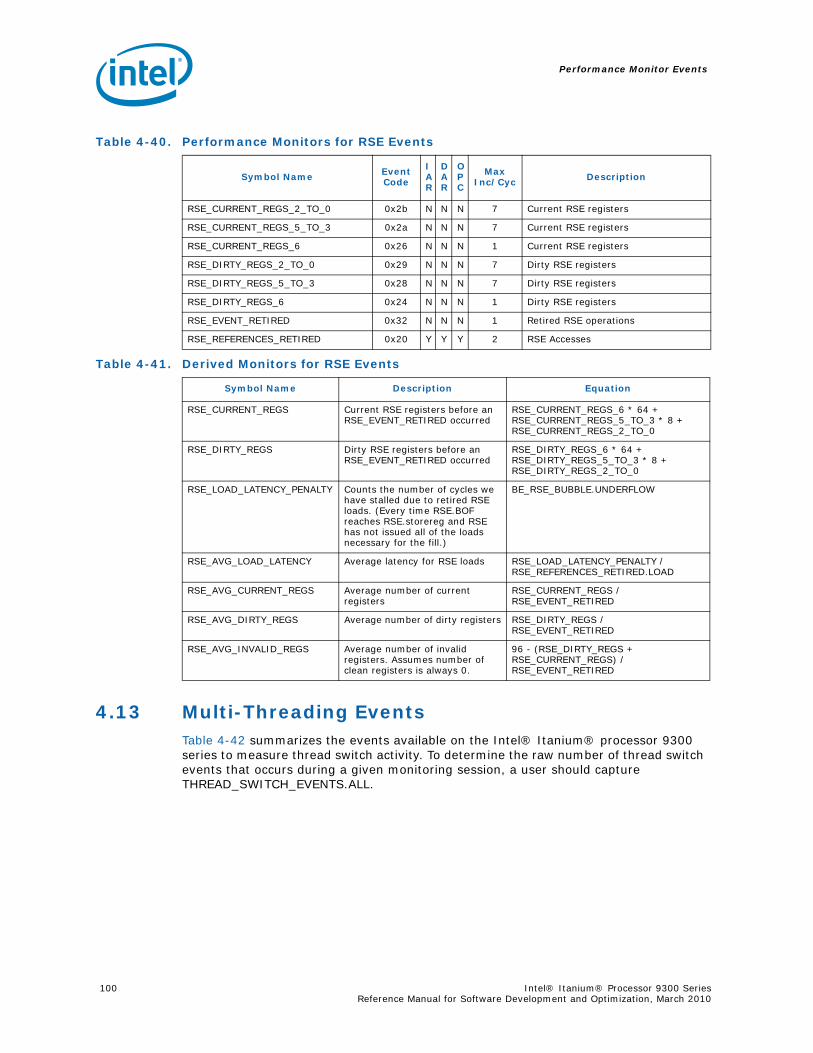
Performance Monitor Events
100 Intel® Itanium® Processor 9300 Series Reference Manual for Software Development and Optimization, March 2010
4.13 Multi-Threading EventsTable 4-42 summarizes the events available on the Intel® Itanium® processor 9300 series to measure thread switch activity. To determine the raw number of thread switch events that occurs during a given monitoring session, a user should capture THREAD_SWITCH_EVENTS.ALL.
Table 4-40. Performance Monitors for RSE Events
Symbol Name Event Code
IAR
DAR
OPC
Max Inc/Cyc Description
RSE_CURRENT_REGS_2_TO_0 0x2b N N N 7 Current RSE registers
RSE_CURRENT_REGS_5_TO_3 0x2a N N N 7 Current RSE registers
RSE_CURRENT_REGS_6 0x26 N N N 1 Current RSE registers
RSE_DIRTY_REGS_2_TO_0 0x29 N N N 7 Dirty RSE registers
RSE_DIRTY_REGS_5_TO_3 0x28 N N N 7 Dirty RSE registers
RSE_DIRTY_REGS_6 0x24 N N N 1 Dirty RSE registers
RSE_EVENT_RETIRED 0x32 N N N 1 Retired RSE operations
RSE_REFERENCES_RETIRED 0x20 Y Y Y 2 RSE Accesses
Table 4-41. Derived Monitors for RSE Events
Symbol Name Description Equation
RSE_CURRENT_REGS Current RSE registers before an RSE_EVENT_RETIRED occurred
RSE_CURRENT_REGS_6 * 64 + RSE_CURRENT_REGS_5_TO_3 * 8 + RSE_CURRENT_REGS_2_TO_0
RSE_DIRTY_REGS Dirty RSE registers before an RSE_EVENT_RETIRED occurred
RSE_DIRTY_REGS_6 * 64 + RSE_DIRTY_REGS_5_TO_3 * 8 + RSE_DIRTY_REGS_2_TO_0
RSE_LOAD_LATENCY_PENALTY Counts the number of cycles we have stalled due to retired RSE loads. (Every time RSE.BOF reaches RSE.storereg and RSE has not issued all of the loads necessary for the fill.)
BE_RSE_BUBBLE.UNDERFLOW
RSE_AVG_LOAD_LATENCY Average latency for RSE loads RSE_LOAD_LATENCY_PENALTY / RSE_REFERENCES_RETIRED.LOAD
RSE_AVG_CURRENT_REGS Average number of current registers
RSE_CURRENT_REGS / RSE_EVENT_RETIRED
RSE_AVG_DIRTY_REGS Average number of dirty registers RSE_DIRTY_REGS / RSE_EVENT_RETIRED
RSE_AVG_INVALID_REGS Average number of invalid registers. Assumes number of clean registers is always 0.
96 - (RSE_DIRTY_REGS + RSE_CURRENT_REGS) / RSE_EVENT_RETIRED
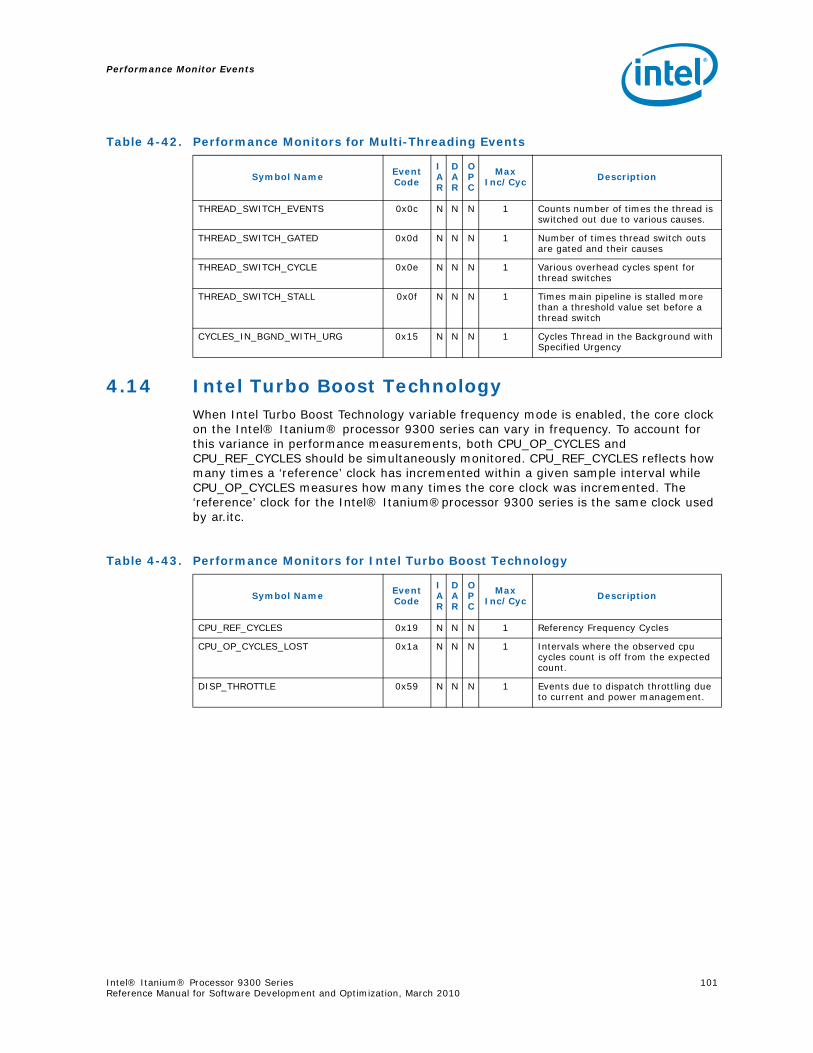
Performance Monitor Events
Intel® Itanium® Processor 9300 Series 101Reference Manual for Software Development and Optimization, March 2010
4.14 Intel Turbo Boost TechnologyWhen Intel Turbo Boost Technology variable frequency mode is enabled, the core clock on the Intel® Itanium® processor 9300 series can vary in frequency. To account for this variance in performance measurements, both CPU_OP_CYCLES and CPU_REF_CYCLES should be simultaneously monitored. CPU_REF_CYCLES reflects how many times a ‘reference’ clock has incremented within a given sample interval while CPU_OP_CYCLES measures how many times the core clock was incremented. The ‘reference’ clock for the Intel® Itanium®processor 9300 series is the same clock used by ar.itc.
Table 4-42. Performance Monitors for Multi-Threading Events
Symbol Name Event Code
IAR
DAR
OPC
Max Inc/Cyc Description
THREAD_SWITCH_EVENTS 0x0c N N N 1 Counts number of times the thread is switched out due to various causes.
THREAD_SWITCH_GATED 0x0d N N N 1 Number of times thread switch outs are gated and their causes
THREAD_SWITCH_CYCLE 0x0e N N N 1 Various overhead cycles spent for thread switches
THREAD_SWITCH_STALL 0x0f N N N 1 Times main pipeline is stalled more than a threshold value set before a thread switch
CYCLES_IN_BGND_WITH_URG 0x15 N N N 1 Cycles Thread in the Background with Specified Urgency
Table 4-43. Performance Monitors for Intel Turbo Boost Technology
Symbol Name Event Code
IAR
DAR
OPC
Max Inc/Cyc Description
CPU_REF_CYCLES 0x19 N N N 1 Referency Frequency Cycles
CPU_OP_CYCLES_LOST 0x1a N N N 1 Intervals where the observed cpu cycles count is off from the expected count.
DISP_THROTTLE 0x59 N N N 1 Events due to dispatch throttling due to current and power management.

Performance Monitor Events
102 Intel® Itanium® Processor 9300 Series Reference Manual for Software Development and Optimization, March 2010
4.15 Performance Monitors Ordered by Event CodeTable 4-44 presents all of the performance monitors provided in the Intel® Itanium® processor 9300 series ordered by their event code.
Table 4-44. All Performance Monitors Ordered by Code (Sheet 1 of 6)
Symbol Name Event Code
IAR
DAR
OPC
Max Inc/Cyc
Type
Description
BACK_END_BUBBLE 0x00 N N N 1 A Full pipe bubbles in main pipe
BE_RSE_BUBBLE 0x01 N N N 1 A Full pipe bubbles in main pipe due to RSE stalls
BE_EXE_BUBBLE 0x02 N N N 1 A Full pipe bubbles in main pipe due to Execution unit stalls
FP_TRUE_SIRSTALL 0x03 Y N N 1 A SIR stall asserted and leads to a trap
BE_FLUSH_BUBBLE 0x04 N N N 1 A Full pipe bubbles in main pipe due to flushes
FP_FALSE_SIRSTALL 0x05 Y N N 1 A SIR stall without a trap
FP_FAILED_FCHKF 0x06 Y N N 1 A Failed fchkf
IA64_INST_RETIRED 0x08 Y N Y 6 A Retired Intel® Itanium® Instructions
IA64_TAGGED_INST_RETIRED 0x08 Y N Y 6 A Retired Tagged Instructions
FP_OPS_RETIRED 0x09 Y N N 6 A Retired FP operations
FP_FLUSH_TO_ZERO 0x0b Y N N 2 A FP Result Flushed to Zero
THREAD_SWITCH_EVENTS 0x0c N N N 1 A Thread switch events and cause
THREAD_SWITCH_GATED 0x0d N N N 1 A TS gated and their sources
THREAD_SWITCH_CYCLE 0x0e N N N 1 A Various TS related periods
THREAD_SWITCH_STALLS 0x0f N N N 1 A Pipe line stalls due to TS
ETB_EVENT 0x11 Y N Y 1 A Branch Event Captured
CPU_OP_CYCLES 0x12 Y N Y 1 C CPU Operating Cycles
CPU_CPL_CHANGES 0x13 N N N 1 A Privilege Level Changes
IVA_EVENT 0x14 N N N
1 A Advances when an IVA Based Interrupts taken to a Pre-programmed IVA Offset. See PMC43 for more info
CYCLES_IN_BGND_WITH_URG 0x15 N N N 1 F Cycles Thread in the Background with Specified Urgency
CPU_OP_CYCLES_HALTED 0x18 N N N 7 C CPU Operating Cycles Halted
CPU_REF_CYCLES 0x19 N N N 1 C Reference Frequency Cycles
CPU_CYCLES_LOST 0x1a N N N 1 C Intervals where the observed cpu cycles count is off from a predetermined count.
RSE_REFERENCES_RETIRED 0x20 Y Y Y 2 A RSE Accesses
RSE_DIRTY_REGS_6 0x24 N N N 1 A Dirty RSE registers
RSE_CURRENT_REGS_6 0x26 N N N 1 A Current RSE registers
RSE_DIRTY_REGS_5_TO_3 0x28 N N N 7 A Dirty RSE registers
RSE_DIRTY_REGS_2_TO_0 0x29 N N N 7 A Dirty RSE registers
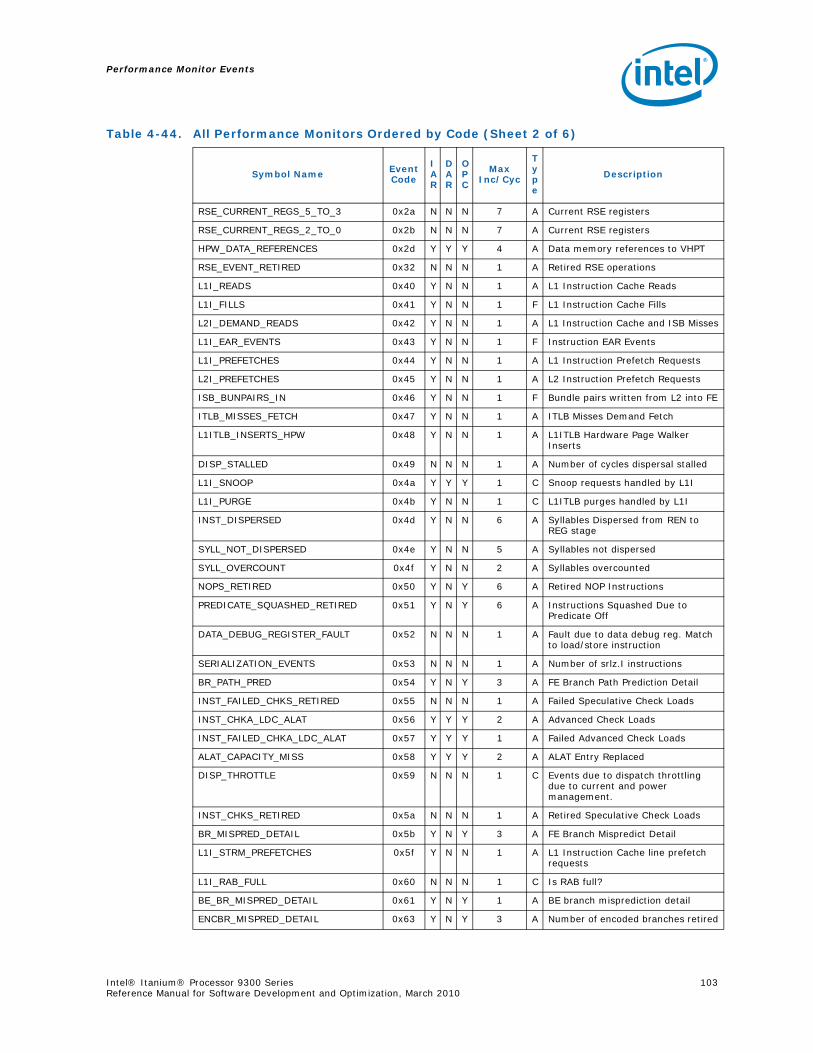
Performance Monitor Events
Intel® Itanium® Processor 9300 Series 103Reference Manual for Software Development and Optimization, March 2010
RSE_CURRENT_REGS_5_TO_3 0x2a N N N 7 A Current RSE registers
RSE_CURRENT_REGS_2_TO_0 0x2b N N N 7 A Current RSE registers
HPW_DATA_REFERENCES 0x2d Y Y Y 4 A Data memory references to VHPT
RSE_EVENT_RETIRED 0x32 N N N 1 A Retired RSE operations
L1I_READS 0x40 Y N N 1 A L1 Instruction Cache Reads
L1I_FILLS 0x41 Y N N 1 F L1 Instruction Cache Fills
L2I_DEMAND_READS 0x42 Y N N 1 A L1 Instruction Cache and ISB Misses
L1I_EAR_EVENTS 0x43 Y N N 1 F Instruction EAR Events
L1I_PREFETCHES 0x44 Y N N 1 A L1 Instruction Prefetch Requests
L2I_PREFETCHES 0x45 Y N N 1 A L2 Instruction Prefetch Requests
ISB_BUNPAIRS_IN 0x46 Y N N 1 F Bundle pairs written from L2 into FE
ITLB_MISSES_FETCH 0x47 Y N N 1 A ITLB Misses Demand Fetch
L1ITLB_INSERTS_HPW 0x48 Y N N 1 A L1ITLB Hardware Page Walker Inserts
DISP_STALLED 0x49 N N N 1 A Number of cycles dispersal stalled
L1I_SNOOP 0x4a Y Y Y 1 C Snoop requests handled by L1I
L1I_PURGE 0x4b Y N N 1 C L1ITLB purges handled by L1I
INST_DISPERSED 0x4d Y N N 6 A Syllables Dispersed from REN to REG stage
SYLL_NOT_DISPERSED 0x4e Y N N 5 A Syllables not dispersed
SYLL_OVERCOUNT 0x4f Y N N 2 A Syllables overcounted
NOPS_RETIRED 0x50 Y N Y 6 A Retired NOP Instructions
PREDICATE_SQUASHED_RETIRED 0x51 Y N Y 6 A Instructions Squashed Due to Predicate Off
DATA_DEBUG_REGISTER_FAULT 0x52 N N N 1 A Fault due to data debug reg. Match to load/store instruction
SERIALIZATION_EVENTS 0x53 N N N 1 A Number of srlz.I instructions
BR_PATH_PRED 0x54 Y N Y 3 A FE Branch Path Prediction Detail
INST_FAILED_CHKS_RETIRED 0x55 N N N 1 A Failed Speculative Check Loads
INST_CHKA_LDC_ALAT 0x56 Y Y Y 2 A Advanced Check Loads
INST_FAILED_CHKA_LDC_ALAT 0x57 Y Y Y 1 A Failed Advanced Check Loads
ALAT_CAPACITY_MISS 0x58 Y Y Y 2 A ALAT Entry Replaced
DISP_THROTTLE 0x59 N N N 1 C Events due to dispatch throttling due to current and power management.
INST_CHKS_RETIRED 0x5a N N N 1 A Retired Speculative Check Loads
BR_MISPRED_DETAIL 0x5b Y N Y 3 A FE Branch Mispredict Detail
L1I_STRM_PREFETCHES 0x5f Y N N 1 A L1 Instruction Cache line prefetch requests
L1I_RAB_FULL 0x60 N N N 1 C Is RAB full?
BE_BR_MISPRED_DETAIL 0x61 Y N Y 1 A BE branch misprediction detail
ENCBR_MISPRED_DETAIL 0x63 Y N Y 3 A Number of encoded branches retired
Table 4-44. All Performance Monitors Ordered by Code (Sheet 2 of 6)
Symbol Name Event Code
IAR
DAR
OPC
Max Inc/Cyc
Type
Description
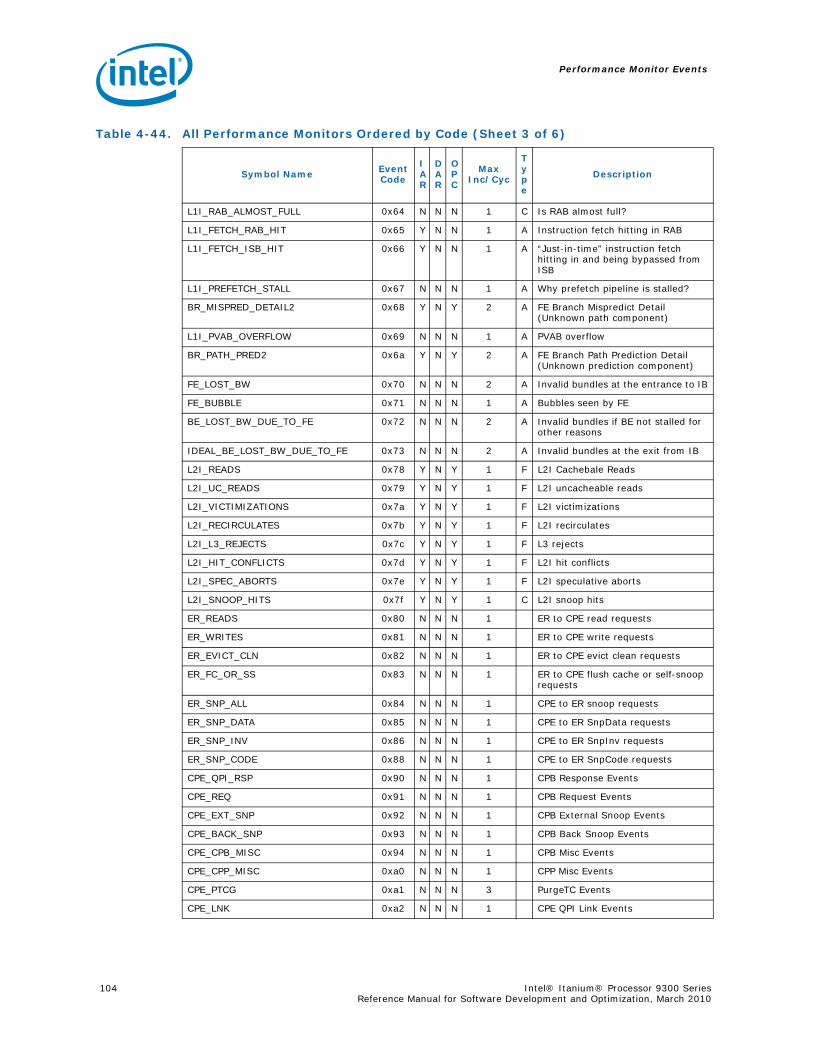
Performance Monitor Events
104 Intel® Itanium® Processor 9300 Series Reference Manual for Software Development and Optimization, March 2010
L1I_RAB_ALMOST_FULL 0x64 N N N 1 C Is RAB almost full?
L1I_FETCH_RAB_HIT 0x65 Y N N 1 A Instruction fetch hitting in RAB
L1I_FETCH_ISB_HIT 0x66 Y N N 1 A “Just-in-time” instruction fetch hitting in and being bypassed from ISB
L1I_PREFETCH_STALL 0x67 N N N 1 A Why prefetch pipeline is stalled?
BR_MISPRED_DETAIL2 0x68 Y N Y 2 A FE Branch Mispredict Detail (Unknown path component)
L1I_PVAB_OVERFLOW 0x69 N N N 1 A PVAB overflow
BR_PATH_PRED2 0x6a Y N Y 2 A FE Branch Path Prediction Detail (Unknown prediction component)
FE_LOST_BW 0x70 N N N 2 A Invalid bundles at the entrance to IB
FE_BUBBLE 0x71 N N N 1 A Bubbles seen by FE
BE_LOST_BW_DUE_TO_FE 0x72 N N N 2 A Invalid bundles if BE not stalled for other reasons
IDEAL_BE_LOST_BW_DUE_TO_FE 0x73 N N N 2 A Invalid bundles at the exit from IB
L2I_READS 0x78 Y N Y 1 F L2I Cachebale Reads
L2I_UC_READS 0x79 Y N Y 1 F L2I uncacheable reads
L2I_VICTIMIZATIONS 0x7a Y N Y 1 F L2I victimizations
L2I_RECIRCULATES 0x7b Y N Y 1 F L2I recirculates
L2I_L3_REJECTS 0x7c Y N Y 1 F L3 rejects
L2I_HIT_CONFLICTS 0x7d Y N Y 1 F L2I hit conflicts
L2I_SPEC_ABORTS 0x7e Y N Y 1 F L2I speculative aborts
L2I_SNOOP_HITS 0x7f Y N Y 1 C L2I snoop hits
ER_READS 0x80 N N N 1 ER to CPE read requests
ER_WRITES 0x81 N N N 1 ER to CPE write requests
ER_EVICT_CLN 0x82 N N N 1 ER to CPE evict clean requests
ER_FC_OR_SS 0x83 N N N 1 ER to CPE flush cache or self-snoop requests
ER_SNP_ALL 0x84 N N N 1 CPE to ER snoop requests
ER_SNP_DATA 0x85 N N N 1 CPE to ER SnpData requests
ER_SNP_INV 0x86 N N N 1 CPE to ER SnpInv requests
ER_SNP_CODE 0x88 N N N 1 CPE to ER SnpCode requests
CPE_QPI_RSP 0x90 N N N 1 CPB Response Events
CPE_REQ 0x91 N N N 1 CPB Request Events
CPE_EXT_SNP 0x92 N N N 1 CPB External Snoop Events
CPE_BACK_SNP 0x93 N N N 1 CPB Back Snoop Events
CPE_CPB_MISC 0x94 N N N 1 CPB Misc Events
CPE_CPP_MISC 0xa0 N N N 1 CPP Misc Events
CPE_PTCG 0xa1 N N N 3 PurgeTC Events
CPE_LNK 0xa2 N N N 1 CPE QPI Link Events
Table 4-44. All Performance Monitors Ordered by Code (Sheet 3 of 6)
Symbol Name Event Code
IAR
DAR
OPC
Max Inc/Cyc
Type
Description
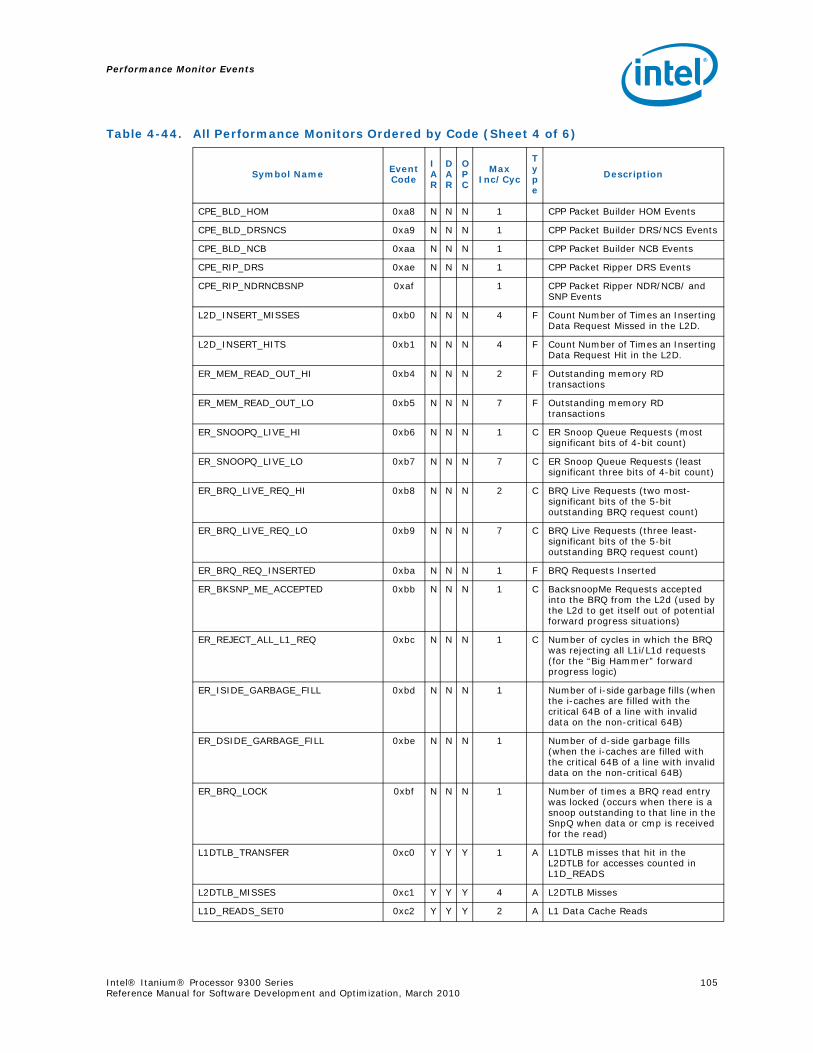
Performance Monitor Events
Intel® Itanium® Processor 9300 Series 105Reference Manual for Software Development and Optimization, March 2010
CPE_BLD_HOM 0xa8 N N N 1 CPP Packet Builder HOM Events
CPE_BLD_DRSNCS 0xa9 N N N 1 CPP Packet Builder DRS/NCS Events
CPE_BLD_NCB 0xaa N N N 1 CPP Packet Builder NCB Events
CPE_RIP_DRS 0xae N N N 1 CPP Packet Ripper DRS Events
CPE_RIP_NDRNCBSNP 0xaf 1 CPP Packet Ripper NDR/NCB/ and SNP Events
L2D_INSERT_MISSES 0xb0 N N N 4 F Count Number of Times an Inserting Data Request Missed in the L2D.
L2D_INSERT_HITS 0xb1 N N N 4 F Count Number of Times an Inserting Data Request Hit in the L2D.
ER_MEM_READ_OUT_HI 0xb4 N N N 2 F Outstanding memory RD transactions
ER_MEM_READ_OUT_LO 0xb5 N N N 7 F Outstanding memory RD transactions
ER_SNOOPQ_LIVE_HI 0xb6 N N N 1 C ER Snoop Queue Requests (most significant bits of 4-bit count)
ER_SNOOPQ_LIVE_LO 0xb7 N N N 7 C ER Snoop Queue Requests (least significant three bits of 4-bit count)
ER_BRQ_LIVE_REQ_HI 0xb8 N N N 2 C BRQ Live Requests (two most-significant bits of the 5-bit outstanding BRQ request count)
ER_BRQ_LIVE_REQ_LO 0xb9 N N N 7 C BRQ Live Requests (three least-significant bits of the 5-bit outstanding BRQ request count)
ER_BRQ_REQ_INSERTED 0xba N N N 1 F BRQ Requests Inserted
ER_BKSNP_ME_ACCEPTED 0xbb N N N 1 C BacksnoopMe Requests accepted into the BRQ from the L2d (used by the L2d to get itself out of potential forward progress situations)
ER_REJECT_ALL_L1_REQ 0xbc N N N 1 C Number of cycles in which the BRQ was rejecting all L1i/L1d requests (for the “Big Hammer” forward progress logic)
ER_ISIDE_GARBAGE_FILL 0xbd N N N 1 Number of i-side garbage fills (when the i-caches are filled with the critical 64B of a line with invalid data on the non-critical 64B)
ER_DSIDE_GARBAGE_FILL 0xbe N N N 1 Number of d-side garbage fills (when the i-caches are filled with the critical 64B of a line with invalid data on the non-critical 64B)
ER_BRQ_LOCK 0xbf N N N 1 Number of times a BRQ read entry was locked (occurs when there is a snoop outstanding to that line in the SnpQ when data or cmp is received for the read)
L1DTLB_TRANSFER 0xc0 Y Y Y 1 A L1DTLB misses that hit in the L2DTLB for accesses counted in L1D_READS
L2DTLB_MISSES 0xc1 Y Y Y 4 A L2DTLB Misses
L1D_READS_SET0 0xc2 Y Y Y 2 A L1 Data Cache Reads
Table 4-44. All Performance Monitors Ordered by Code (Sheet 4 of 6)
Symbol Name Event Code
IAR
DAR
OPC
Max Inc/Cyc
Type
Description
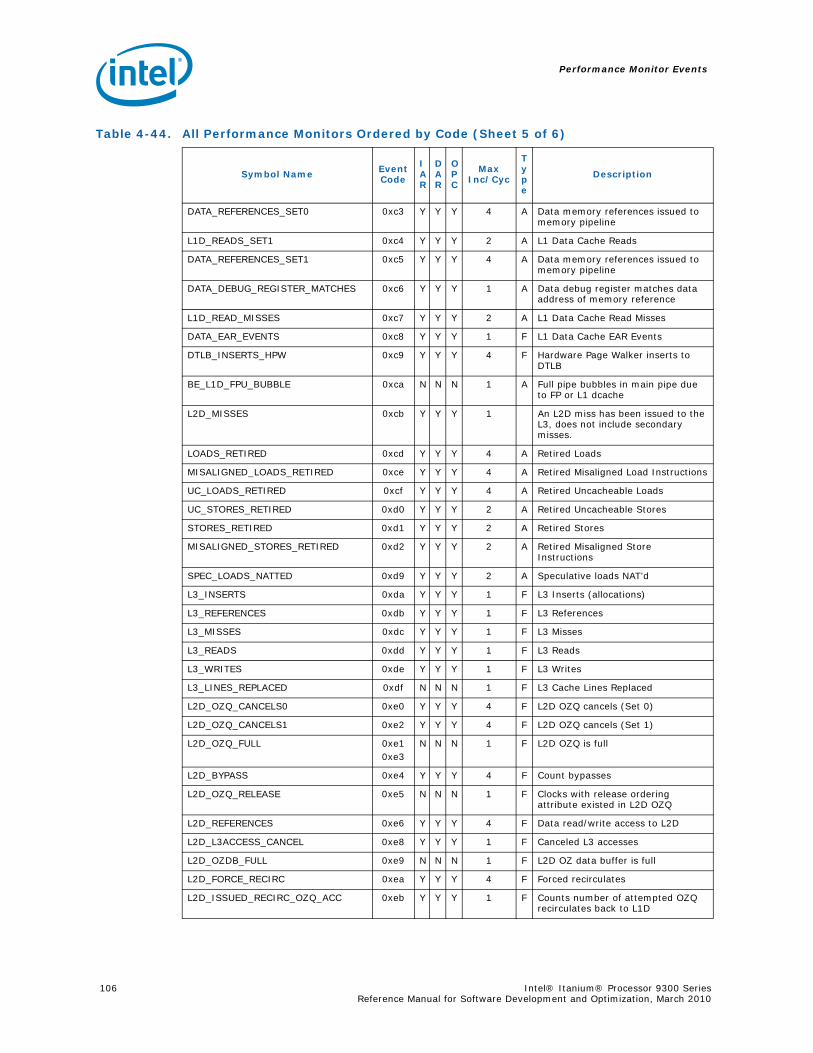
Performance Monitor Events
106 Intel® Itanium® Processor 9300 Series Reference Manual for Software Development and Optimization, March 2010
DATA_REFERENCES_SET0 0xc3 Y Y Y 4 A Data memory references issued to memory pipeline
L1D_READS_SET1 0xc4 Y Y Y 2 A L1 Data Cache Reads
DATA_REFERENCES_SET1 0xc5 Y Y Y 4 A Data memory references issued to memory pipeline
DATA_DEBUG_REGISTER_MATCHES 0xc6 Y Y Y 1 A Data debug register matches data address of memory reference
L1D_READ_MISSES 0xc7 Y Y Y 2 A L1 Data Cache Read Misses
DATA_EAR_EVENTS 0xc8 Y Y Y 1 F L1 Data Cache EAR Events
DTLB_INSERTS_HPW 0xc9 Y Y Y 4 F Hardware Page Walker inserts to DTLB
BE_L1D_FPU_BUBBLE 0xca N N N 1 A Full pipe bubbles in main pipe due to FP or L1 dcache
L2D_MISSES 0xcb Y Y Y 1 An L2D miss has been issued to the L3, does not include secondary misses.
LOADS_RETIRED 0xcd Y Y Y 4 A Retired Loads
MISALIGNED_LOADS_RETIRED 0xce Y Y Y 4 A Retired Misaligned Load Instructions
UC_LOADS_RETIRED 0xcf Y Y Y 4 A Retired Uncacheable Loads
UC_STORES_RETIRED 0xd0 Y Y Y 2 A Retired Uncacheable Stores
STORES_RETIRED 0xd1 Y Y Y 2 A Retired Stores
MISALIGNED_STORES_RETIRED 0xd2 Y Y Y 2 A Retired Misaligned Store Instructions
SPEC_LOADS_NATTED 0xd9 Y Y Y 2 A Speculative loads NAT’d
L3_INSERTS 0xda Y Y Y 1 F L3 Inserts (allocations)
L3_REFERENCES 0xdb Y Y Y 1 F L3 References
L3_MISSES 0xdc Y Y Y 1 F L3 Misses
L3_READS 0xdd Y Y Y 1 F L3 Reads
L3_WRITES 0xde Y Y Y 1 F L3 Writes
L3_LINES_REPLACED 0xdf N N N 1 F L3 Cache Lines Replaced
L2D_OZQ_CANCELS0 0xe0 Y Y Y 4 F L2D OZQ cancels (Set 0)
L2D_OZQ_CANCELS1 0xe2 Y Y Y 4 F L2D OZQ cancels (Set 1)
L2D_OZQ_FULL 0xe10xe3
N N N 1 F L2D OZQ is full
L2D_BYPASS 0xe4 Y Y Y 4 F Count bypasses
L2D_OZQ_RELEASE 0xe5 N N N 1 F Clocks with release ordering attribute existed in L2D OZQ
L2D_REFERENCES 0xe6 Y Y Y 4 F Data read/write access to L2D
L2D_L3ACCESS_CANCEL 0xe8 Y Y Y 1 F Canceled L3 accesses
L2D_OZDB_FULL 0xe9 N N N 1 F L2D OZ data buffer is full
L2D_FORCE_RECIRC 0xea Y Y Y 4 F Forced recirculates
L2D_ISSUED_RECIRC_OZQ_ACC 0xeb Y Y Y 1 F Counts number of attempted OZQ recirculates back to L1D
Table 4-44. All Performance Monitors Ordered by Code (Sheet 5 of 6)
Symbol Name Event Code
IAR
DAR
OPC
Max Inc/Cyc
Type
Description
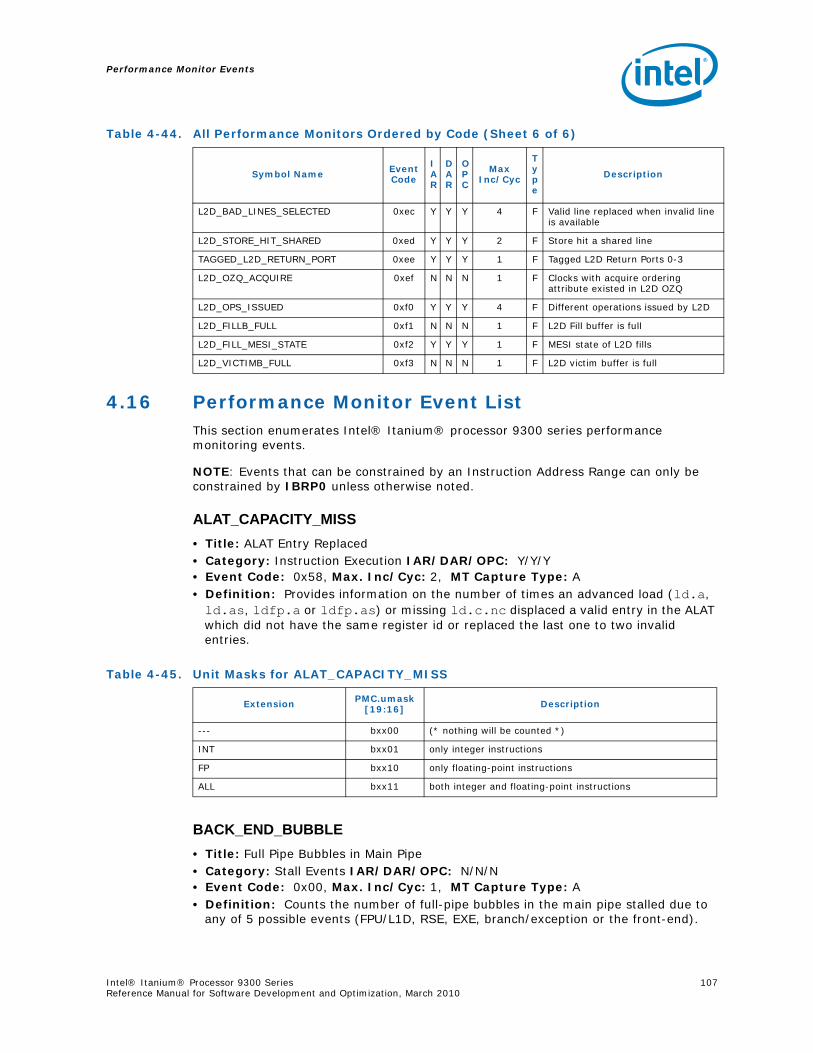
Performance Monitor Events
Intel® Itanium® Processor 9300 Series 107Reference Manual for Software Development and Optimization, March 2010
4.16 Performance Monitor Event ListThis section enumerates Intel® Itanium® processor 9300 series performance monitoring events.
NOTE: Events that can be constrained by an Instruction Address Range can only be constrained by IBRP0 unless otherwise noted.
ALAT_CAPACITY_MISS• Title: ALAT Entry Replaced• Category: Instruction Execution IAR/DAR/OPC: Y/Y/Y• Event Code: 0x58, Max. Inc/Cyc: 2, MT Capture Type: A• Definition: Provides information on the number of times an advanced load (ld.a, ld.as, ldfp.a or ldfp.as) or missing ld.c.nc displaced a valid entry in the ALAT which did not have the same register id or replaced the last one to two invalid entries.
BACK_END_BUBBLE• Title: Full Pipe Bubbles in Main Pipe• Category: Stall Events IAR/DAR/OPC: N/N/N• Event Code: 0x00, Max. Inc/Cyc: 1, MT Capture Type: A• Definition: Counts the number of full-pipe bubbles in the main pipe stalled due to
any of 5 possible events (FPU/L1D, RSE, EXE, branch/exception or the front-end).
L2D_BAD_LINES_SELECTED 0xec Y Y Y 4 F Valid line replaced when invalid line is available
L2D_STORE_HIT_SHARED 0xed Y Y Y 2 F Store hit a shared line
TAGGED_L2D_RETURN_PORT 0xee Y Y Y 1 F Tagged L2D Return Ports 0-3
L2D_OZQ_ACQUIRE 0xef N N N 1 F Clocks with acquire ordering attribute existed in L2D OZQ
L2D_OPS_ISSUED 0xf0 Y Y Y 4 F Different operations issued by L2D
L2D_FILLB_FULL 0xf1 N N N 1 F L2D Fill buffer is full
L2D_FILL_MESI_STATE 0xf2 Y Y Y 1 F MESI state of L2D fills
L2D_VICTIMB_FULL 0xf3 N N N 1 F L2D victim buffer is full
Table 4-44. All Performance Monitors Ordered by Code (Sheet 6 of 6)
Symbol Name Event Code
IAR
DAR
OPC
Max Inc/Cyc
Type
Description
Table 4-45. Unit Masks for ALAT_CAPACITY_MISS
Extension PMC.umask[19:16] Description
--- bxx00 (* nothing will be counted *)
INT bxx01 only integer instructions
FP bxx10 only floating-point instructions
ALL bxx11 both integer and floating-point instructions
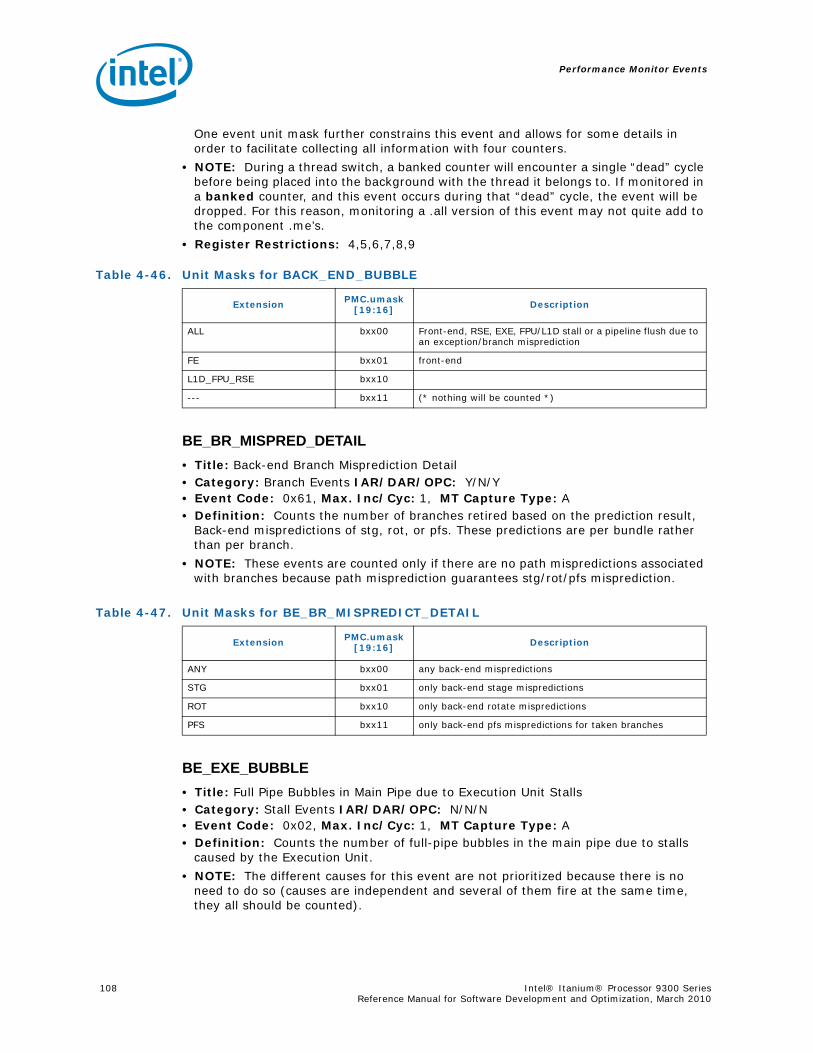
Performance Monitor Events
108 Intel® Itanium® Processor 9300 Series Reference Manual for Software Development and Optimization, March 2010
One event unit mask further constrains this event and allows for some details in order to facilitate collecting all information with four counters.
• NOTE: During a thread switch, a banked counter will encounter a single “dead” cycle before being placed into the background with the thread it belongs to. If monitored in a banked counter, and this event occurs during that “dead” cycle, the event will be dropped. For this reason, monitoring a .all version of this event may not quite add to the component .me’s.
• Register Restrictions: 4,5,6,7,8,9
BE_BR_MISPRED_DETAIL• Title: Back-end Branch Misprediction Detail• Category: Branch Events IAR/DAR/OPC: Y/N/Y• Event Code: 0x61, Max. Inc/Cyc: 1, MT Capture Type: A• Definition: Counts the number of branches retired based on the prediction result,
Back-end mispredictions of stg, rot, or pfs. These predictions are per bundle rather than per branch.
• NOTE: These events are counted only if there are no path mispredictions associated with branches because path misprediction guarantees stg/rot/pfs misprediction.
BE_EXE_BUBBLE• Title: Full Pipe Bubbles in Main Pipe due to Execution Unit Stalls• Category: Stall Events IAR/DAR/OPC: N/N/N• Event Code: 0x02, Max. Inc/Cyc: 1, MT Capture Type: A• Definition: Counts the number of full-pipe bubbles in the main pipe due to stalls
caused by the Execution Unit.
• NOTE: The different causes for this event are not prioritized because there is no need to do so (causes are independent and several of them fire at the same time, they all should be counted).
Table 4-46. Unit Masks for BACK_END_BUBBLE
Extension PMC.umask[19:16] Description
ALL bxx00 Front-end, RSE, EXE, FPU/L1D stall or a pipeline flush due to an exception/branch misprediction
FE bxx01 front-end
L1D_FPU_RSE bxx10
--- bxx11 (* nothing will be counted *)
Table 4-47. Unit Masks for BE_BR_MISPREDICT_DETAIL
Extension PMC.umask[19:16] Description
ANY bxx00 any back-end mispredictions
STG bxx01 only back-end stage mispredictions
ROT bxx10 only back-end rotate mispredictions
PFS bxx11 only back-end pfs mispredictions for taken branches
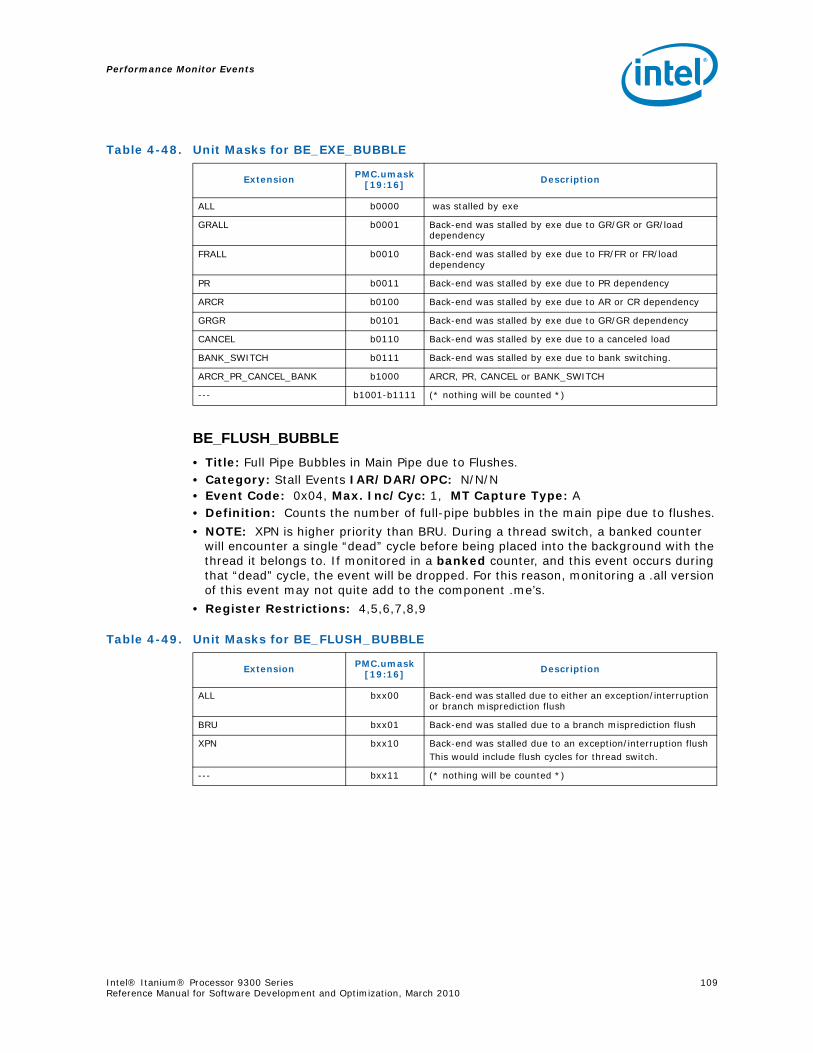
Performance Monitor Events
Intel® Itanium® Processor 9300 Series 109Reference Manual for Software Development and Optimization, March 2010
BE_FLUSH_BUBBLE• Title: Full Pipe Bubbles in Main Pipe due to Flushes.• Category: Stall Events IAR/DAR/OPC: N/N/N• Event Code: 0x04, Max. Inc/Cyc: 1, MT Capture Type: A• Definition: Counts the number of full-pipe bubbles in the main pipe due to flushes.
• NOTE: XPN is higher priority than BRU. During a thread switch, a banked counter will encounter a single “dead” cycle before being placed into the background with the thread it belongs to. If monitored in a banked counter, and this event occurs during that “dead” cycle, the event will be dropped. For this reason, monitoring a .all version of this event may not quite add to the component .me’s.
• Register Restrictions: 4,5,6,7,8,9
Table 4-48. Unit Masks for BE_EXE_BUBBLE
Extension PMC.umask[19:16] Description
ALL b0000 was stalled by exe
GRALL b0001 Back-end was stalled by exe due to GR/GR or GR/load dependency
FRALL b0010 Back-end was stalled by exe due to FR/FR or FR/load dependency
PR b0011 Back-end was stalled by exe due to PR dependency
ARCR b0100 Back-end was stalled by exe due to AR or CR dependency
GRGR b0101 Back-end was stalled by exe due to GR/GR dependency
CANCEL b0110 Back-end was stalled by exe due to a canceled load
BANK_SWITCH b0111 Back-end was stalled by exe due to bank switching.
ARCR_PR_CANCEL_BANK b1000 ARCR, PR, CANCEL or BANK_SWITCH
--- b1001-b1111 (* nothing will be counted *)
Table 4-49. Unit Masks for BE_FLUSH_BUBBLE
Extension PMC.umask[19:16] Description
ALL bxx00 Back-end was stalled due to either an exception/interruption or branch misprediction flush
BRU bxx01 Back-end was stalled due to a branch misprediction flush
XPN bxx10 Back-end was stalled due to an exception/interruption flushThis would include flush cycles for thread switch.
--- bxx11 (* nothing will be counted *)
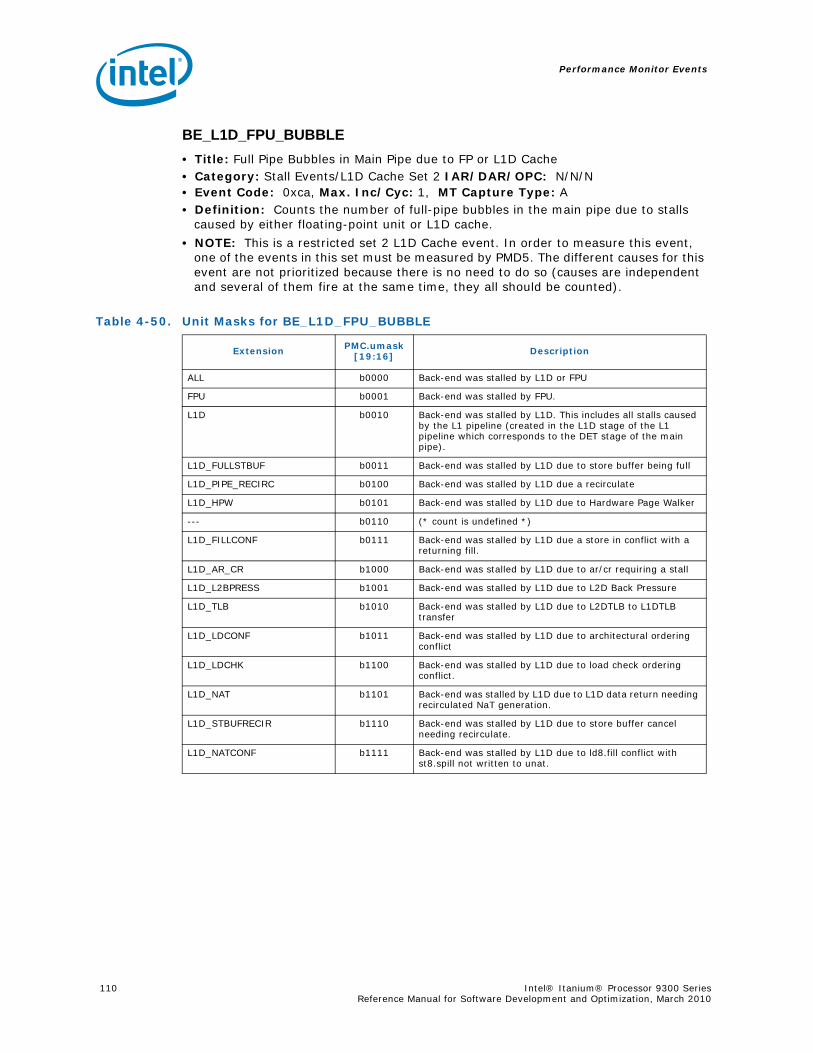
Performance Monitor Events
110 Intel® Itanium® Processor 9300 Series Reference Manual for Software Development and Optimization, March 2010
BE_L1D_FPU_BUBBLE• Title: Full Pipe Bubbles in Main Pipe due to FP or L1D Cache• Category: Stall Events/L1D Cache Set 2 IAR/DAR/OPC: N/N/N• Event Code: 0xca, Max. Inc/Cyc: 1, MT Capture Type: A• Definition: Counts the number of full-pipe bubbles in the main pipe due to stalls
caused by either floating-point unit or L1D cache.
• NOTE: This is a restricted set 2 L1D Cache event. In order to measure this event, one of the events in this set must be measured by PMD5. The different causes for this event are not prioritized because there is no need to do so (causes are independent and several of them fire at the same time, they all should be counted).
Table 4-50. Unit Masks for BE_L1D_FPU_BUBBLE
Extension PMC.umask[19:16] Description
ALL b0000 Back-end was stalled by L1D or FPU
FPU b0001 Back-end was stalled by FPU.
L1D b0010 Back-end was stalled by L1D. This includes all stalls caused by the L1 pipeline (created in the L1D stage of the L1 pipeline which corresponds to the DET stage of the main pipe).
L1D_FULLSTBUF b0011 Back-end was stalled by L1D due to store buffer being full
L1D_PIPE_RECIRC b0100 Back-end was stalled by L1D due a recirculate
L1D_HPW b0101 Back-end was stalled by L1D due to Hardware Page Walker
--- b0110 (* count is undefined *)
L1D_FILLCONF b0111 Back-end was stalled by L1D due a store in conflict with a returning fill.
L1D_AR_CR b1000 Back-end was stalled by L1D due to ar/cr requiring a stall
L1D_L2BPRESS b1001 Back-end was stalled by L1D due to L2D Back Pressure
L1D_TLB b1010 Back-end was stalled by L1D due to L2DTLB to L1DTLB transfer
L1D_LDCONF b1011 Back-end was stalled by L1D due to architectural ordering conflict
L1D_LDCHK b1100 Back-end was stalled by L1D due to load check ordering conflict.
L1D_NAT b1101 Back-end was stalled by L1D due to L1D data return needing recirculated NaT generation.
L1D_STBUFRECIR b1110 Back-end was stalled by L1D due to store buffer cancel needing recirculate.
L1D_NATCONF b1111 Back-end was stalled by L1D due to ld8.fill conflict with st8.spill not written to unat.
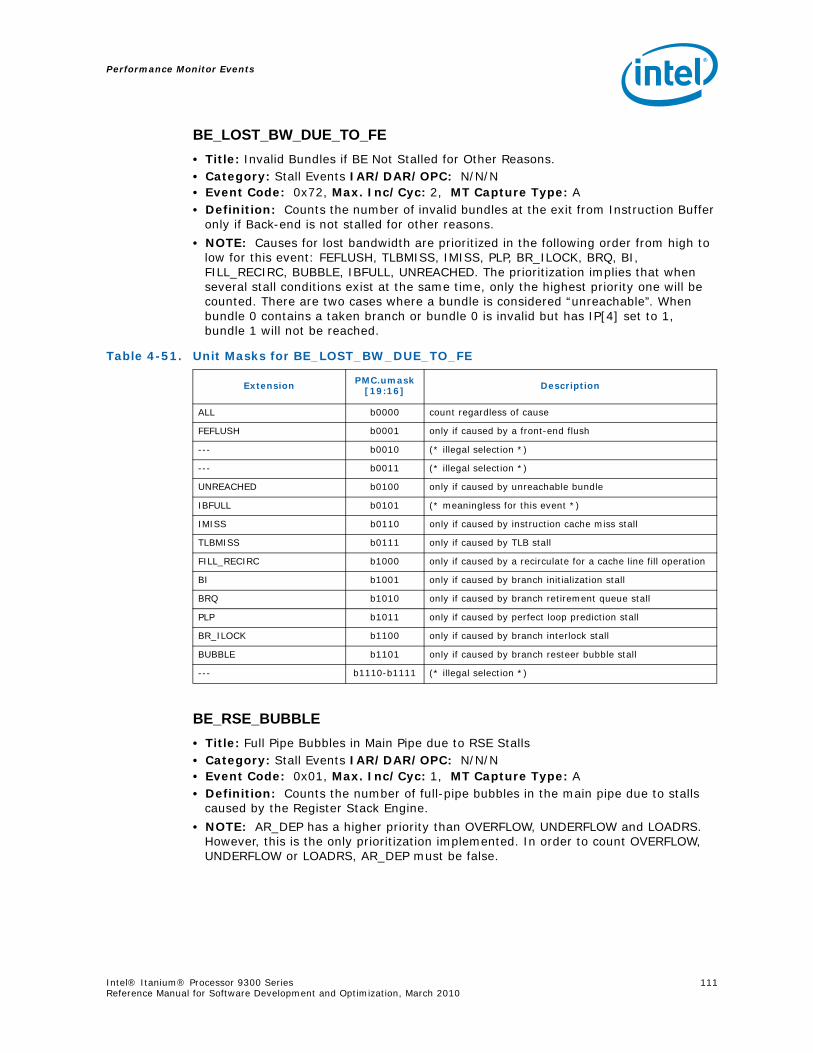
Performance Monitor Events
Intel® Itanium® Processor 9300 Series 111Reference Manual for Software Development and Optimization, March 2010
BE_LOST_BW_DUE_TO_FE• Title: Invalid Bundles if BE Not Stalled for Other Reasons.• Category: Stall Events IAR/DAR/OPC: N/N/N• Event Code: 0x72, Max. Inc/Cyc: 2, MT Capture Type: A• Definition: Counts the number of invalid bundles at the exit from Instruction Buffer
only if Back-end is not stalled for other reasons.
• NOTE: Causes for lost bandwidth are prioritized in the following order from high to low for this event: FEFLUSH, TLBMISS, IMISS, PLP, BR_ILOCK, BRQ, BI, FILL_RECIRC, BUBBLE, IBFULL, UNREACHED. The prioritization implies that when several stall conditions exist at the same time, only the highest priority one will be counted. There are two cases where a bundle is considered “unreachable”. When bundle 0 contains a taken branch or bundle 0 is invalid but has IP[4] set to 1, bundle 1 will not be reached.
BE_RSE_BUBBLE• Title: Full Pipe Bubbles in Main Pipe due to RSE Stalls• Category: Stall Events IAR/DAR/OPC: N/N/N• Event Code: 0x01, Max. Inc/Cyc: 1, MT Capture Type: A• Definition: Counts the number of full-pipe bubbles in the main pipe due to stalls
caused by the Register Stack Engine.
• NOTE: AR_DEP has a higher priority than OVERFLOW, UNDERFLOW and LOADRS. However, this is the only prioritization implemented. In order to count OVERFLOW, UNDERFLOW or LOADRS, AR_DEP must be false.
Table 4-51. Unit Masks for BE_LOST_BW_DUE_TO_FE
Extension PMC.umask[19:16] Description
ALL b0000 count regardless of cause
FEFLUSH b0001 only if caused by a front-end flush
--- b0010 (* illegal selection *)
--- b0011 (* illegal selection *)
UNREACHED b0100 only if caused by unreachable bundle
IBFULL b0101 (* meaningless for this event *)
IMISS b0110 only if caused by instruction cache miss stall
TLBMISS b0111 only if caused by TLB stall
FILL_RECIRC b1000 only if caused by a recirculate for a cache line fill operation
BI b1001 only if caused by branch initialization stall
BRQ b1010 only if caused by branch retirement queue stall
PLP b1011 only if caused by perfect loop prediction stall
BR_ILOCK b1100 only if caused by branch interlock stall
BUBBLE b1101 only if caused by branch resteer bubble stall
--- b1110-b1111 (* illegal selection *)
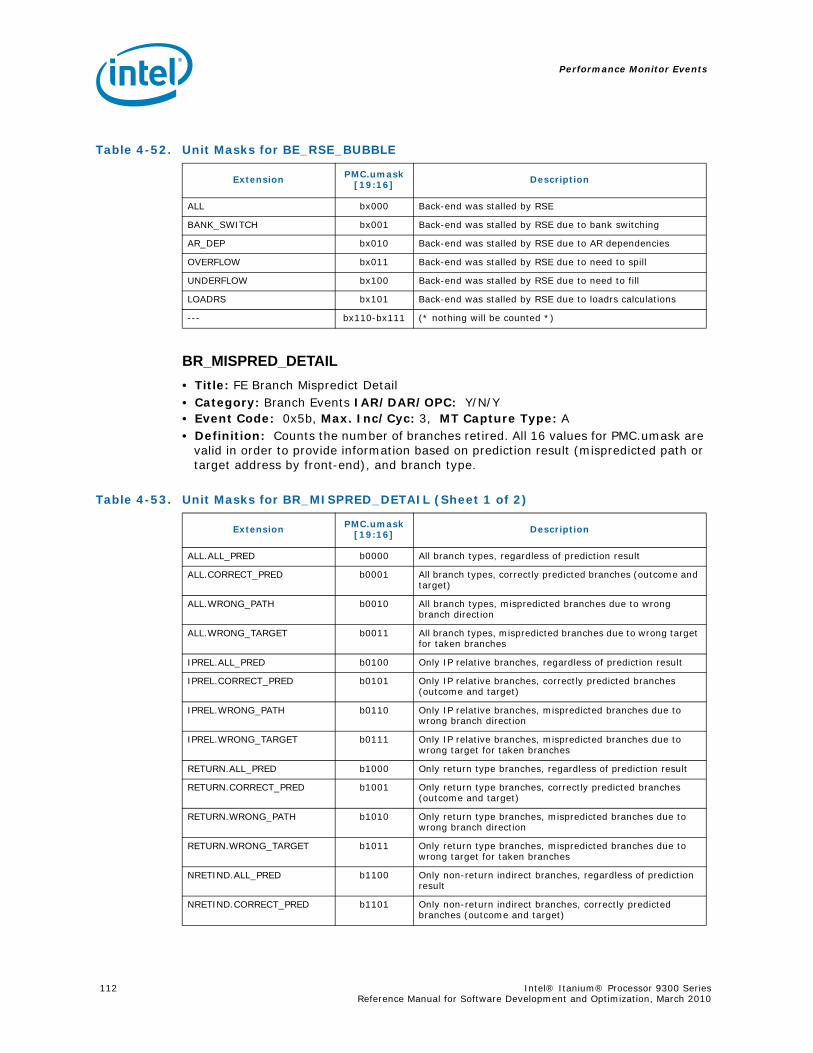
Performance Monitor Events
112 Intel® Itanium® Processor 9300 Series Reference Manual for Software Development and Optimization, March 2010
BR_MISPRED_DETAIL• Title: FE Branch Mispredict Detail• Category: Branch Events IAR/DAR/OPC: Y/N/Y• Event Code: 0x5b, Max. Inc/Cyc: 3, MT Capture Type: A• Definition: Counts the number of branches retired. All 16 values for PMC.umask are
valid in order to provide information based on prediction result (mispredicted path or target address by front-end), and branch type.
Table 4-52. Unit Masks for BE_RSE_BUBBLE
Extension PMC.umask[19:16] Description
ALL bx000 Back-end was stalled by RSE
BANK_SWITCH bx001 Back-end was stalled by RSE due to bank switching
AR_DEP bx010 Back-end was stalled by RSE due to AR dependencies
OVERFLOW bx011 Back-end was stalled by RSE due to need to spill
UNDERFLOW bx100 Back-end was stalled by RSE due to need to fill
LOADRS bx101 Back-end was stalled by RSE due to loadrs calculations
--- bx110-bx111 (* nothing will be counted *)
Table 4-53. Unit Masks for BR_MISPRED_DETAIL (Sheet 1 of 2)
Extension PMC.umask[19:16] Description
ALL.ALL_PRED b0000 All branch types, regardless of prediction result
ALL.CORRECT_PRED b0001 All branch types, correctly predicted branches (outcome and target)
ALL.WRONG_PATH b0010 All branch types, mispredicted branches due to wrong branch direction
ALL.WRONG_TARGET b0011 All branch types, mispredicted branches due to wrong target for taken branches
IPREL.ALL_PRED b0100 Only IP relative branches, regardless of prediction result
IPREL.CORRECT_PRED b0101 Only IP relative branches, correctly predicted branches (outcome and target)
IPREL.WRONG_PATH b0110 Only IP relative branches, mispredicted branches due to wrong branch direction
IPREL.WRONG_TARGET b0111 Only IP relative branches, mispredicted branches due to wrong target for taken branches
RETURN.ALL_PRED b1000 Only return type branches, regardless of prediction result
RETURN.CORRECT_PRED b1001 Only return type branches, correctly predicted branches (outcome and target)
RETURN.WRONG_PATH b1010 Only return type branches, mispredicted branches due to wrong branch direction
RETURN.WRONG_TARGET b1011 Only return type branches, mispredicted branches due to wrong target for taken branches
NRETIND.ALL_PRED b1100 Only non-return indirect branches, regardless of prediction result
NRETIND.CORRECT_PRED b1101 Only non-return indirect branches, correctly predicted branches (outcome and target)
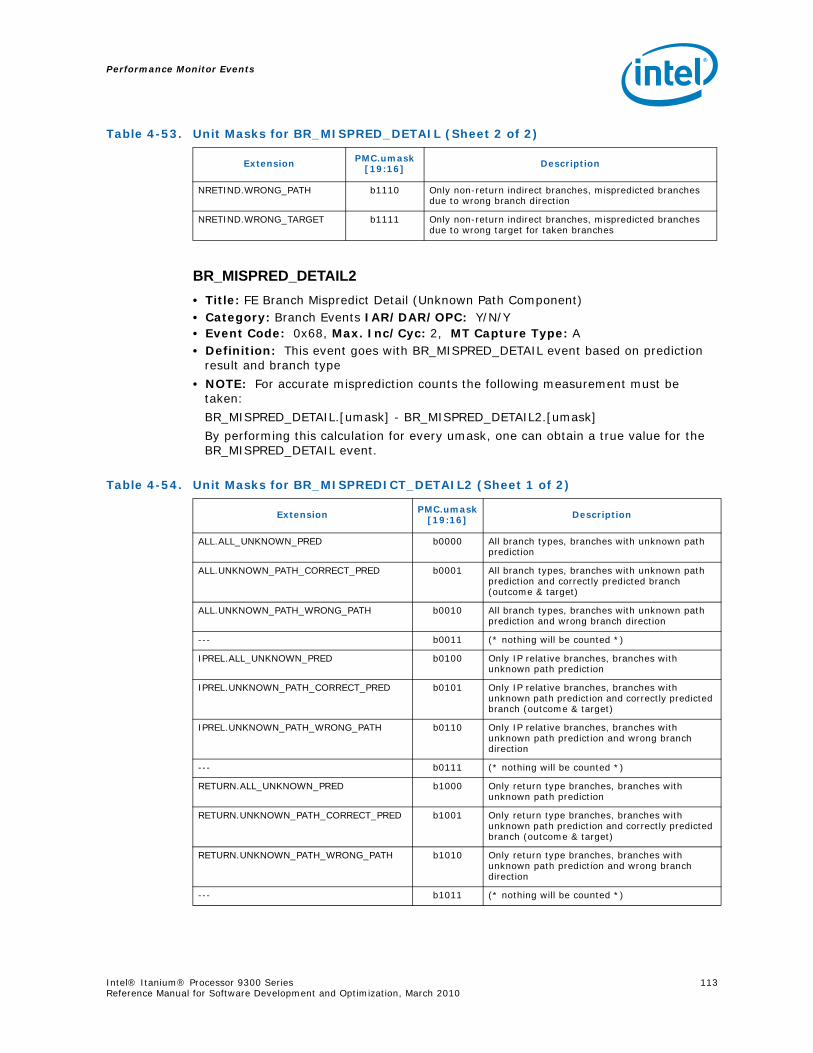
Performance Monitor Events
Intel® Itanium® Processor 9300 Series 113Reference Manual for Software Development and Optimization, March 2010
BR_MISPRED_DETAIL2• Title: FE Branch Mispredict Detail (Unknown Path Component)• Category: Branch Events IAR/DAR/OPC: Y/N/Y• Event Code: 0x68, Max. Inc/Cyc: 2, MT Capture Type: A• Definition: This event goes with BR_MISPRED_DETAIL event based on prediction
result and branch type
• NOTE: For accurate misprediction counts the following measurement must be taken:
BR_MISPRED_DETAIL.[umask] - BR_MISPRED_DETAIL2.[umask]
By performing this calculation for every umask, one can obtain a true value for the BR_MISPRED_DETAIL event.
NRETIND.WRONG_PATH b1110 Only non-return indirect branches, mispredicted branches due to wrong branch direction
NRETIND.WRONG_TARGET b1111 Only non-return indirect branches, mispredicted branches due to wrong target for taken branches
Table 4-53. Unit Masks for BR_MISPRED_DETAIL (Sheet 2 of 2)
Extension PMC.umask[19:16] Description
Table 4-54. Unit Masks for BR_MISPREDICT_DETAIL2 (Sheet 1 of 2)
Extension PMC.umask[19:16] Description
ALL.ALL_UNKNOWN_PRED b0000 All branch types, branches with unknown path prediction
ALL.UNKNOWN_PATH_CORRECT_PRED b0001 All branch types, branches with unknown path prediction and correctly predicted branch (outcome & target)
ALL.UNKNOWN_PATH_WRONG_PATH b0010 All branch types, branches with unknown path prediction and wrong branch direction
--- b0011 (* nothing will be counted *)
IPREL.ALL_UNKNOWN_PRED b0100 Only IP relative branches, branches with unknown path prediction
IPREL.UNKNOWN_PATH_CORRECT_PRED b0101 Only IP relative branches, branches with unknown path prediction and correctly predicted branch (outcome & target)
IPREL.UNKNOWN_PATH_WRONG_PATH b0110 Only IP relative branches, branches with unknown path prediction and wrong branch direction
--- b0111 (* nothing will be counted *)
RETURN.ALL_UNKNOWN_PRED b1000 Only return type branches, branches with unknown path prediction
RETURN.UNKNOWN_PATH_CORRECT_PRED b1001 Only return type branches, branches with unknown path prediction and correctly predicted branch (outcome & target)
RETURN.UNKNOWN_PATH_WRONG_PATH b1010 Only return type branches, branches with unknown path prediction and wrong branch direction
--- b1011 (* nothing will be counted *)
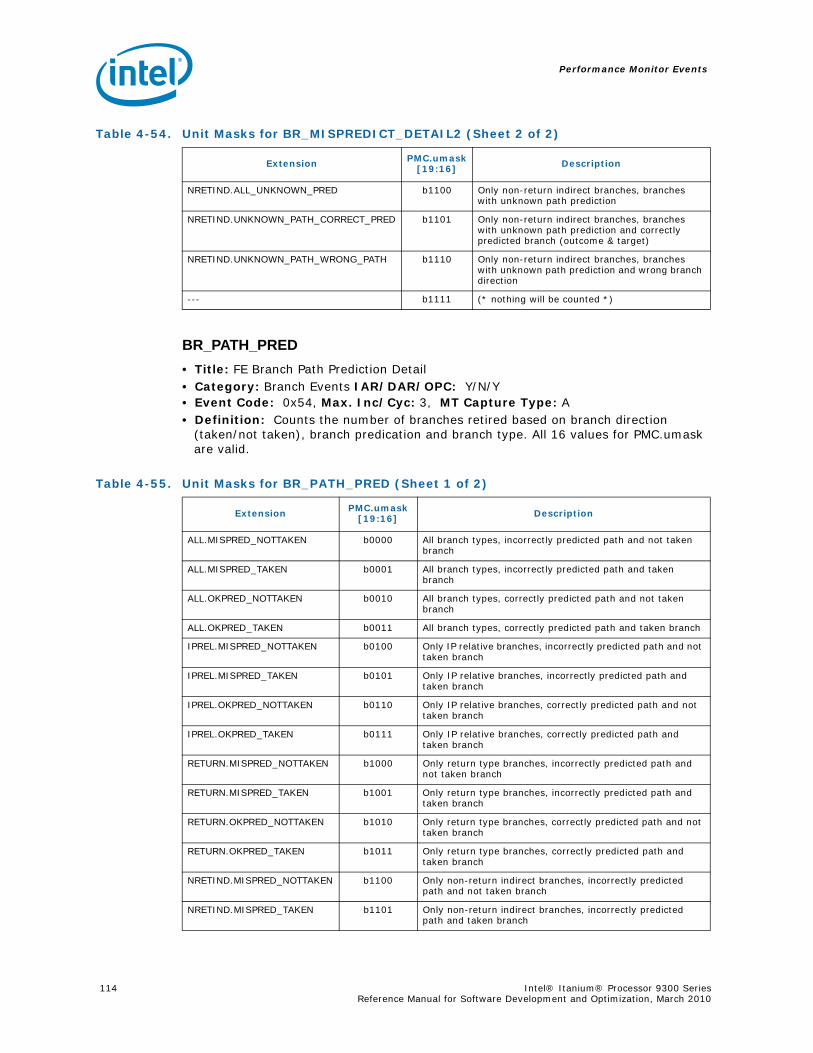
Performance Monitor Events
114 Intel® Itanium® Processor 9300 Series Reference Manual for Software Development and Optimization, March 2010
BR_PATH_PRED• Title: FE Branch Path Prediction Detail• Category: Branch Events IAR/DAR/OPC: Y/N/Y• Event Code: 0x54, Max. Inc/Cyc: 3, MT Capture Type: A• Definition: Counts the number of branches retired based on branch direction
(taken/not taken), branch predication and branch type. All 16 values for PMC.umask are valid.
NRETIND.ALL_UNKNOWN_PRED b1100 Only non-return indirect branches, branches with unknown path prediction
NRETIND.UNKNOWN_PATH_CORRECT_PRED b1101 Only non-return indirect branches, branches with unknown path prediction and correctly predicted branch (outcome & target)
NRETIND.UNKNOWN_PATH_WRONG_PATH b1110 Only non-return indirect branches, branches with unknown path prediction and wrong branch direction
--- b1111 (* nothing will be counted *)
Table 4-54. Unit Masks for BR_MISPREDICT_DETAIL2 (Sheet 2 of 2)
Extension PMC.umask[19:16] Description
Table 4-55. Unit Masks for BR_PATH_PRED (Sheet 1 of 2)
Extension PMC.umask[19:16] Description
ALL.MISPRED_NOTTAKEN b0000 All branch types, incorrectly predicted path and not taken branch
ALL.MISPRED_TAKEN b0001 All branch types, incorrectly predicted path and taken branch
ALL.OKPRED_NOTTAKEN b0010 All branch types, correctly predicted path and not taken branch
ALL.OKPRED_TAKEN b0011 All branch types, correctly predicted path and taken branch
IPREL.MISPRED_NOTTAKEN b0100 Only IP relative branches, incorrectly predicted path and not taken branch
IPREL.MISPRED_TAKEN b0101 Only IP relative branches, incorrectly predicted path and taken branch
IPREL.OKPRED_NOTTAKEN b0110 Only IP relative branches, correctly predicted path and not taken branch
IPREL.OKPRED_TAKEN b0111 Only IP relative branches, correctly predicted path and taken branch
RETURN.MISPRED_NOTTAKEN b1000 Only return type branches, incorrectly predicted path and not taken branch
RETURN.MISPRED_TAKEN b1001 Only return type branches, incorrectly predicted path and taken branch
RETURN.OKPRED_NOTTAKEN b1010 Only return type branches, correctly predicted path and not taken branch
RETURN.OKPRED_TAKEN b1011 Only return type branches, correctly predicted path and taken branch
NRETIND.MISPRED_NOTTAKEN b1100 Only non-return indirect branches, incorrectly predicted path and not taken branch
NRETIND.MISPRED_TAKEN b1101 Only non-return indirect branches, incorrectly predicted path and taken branch
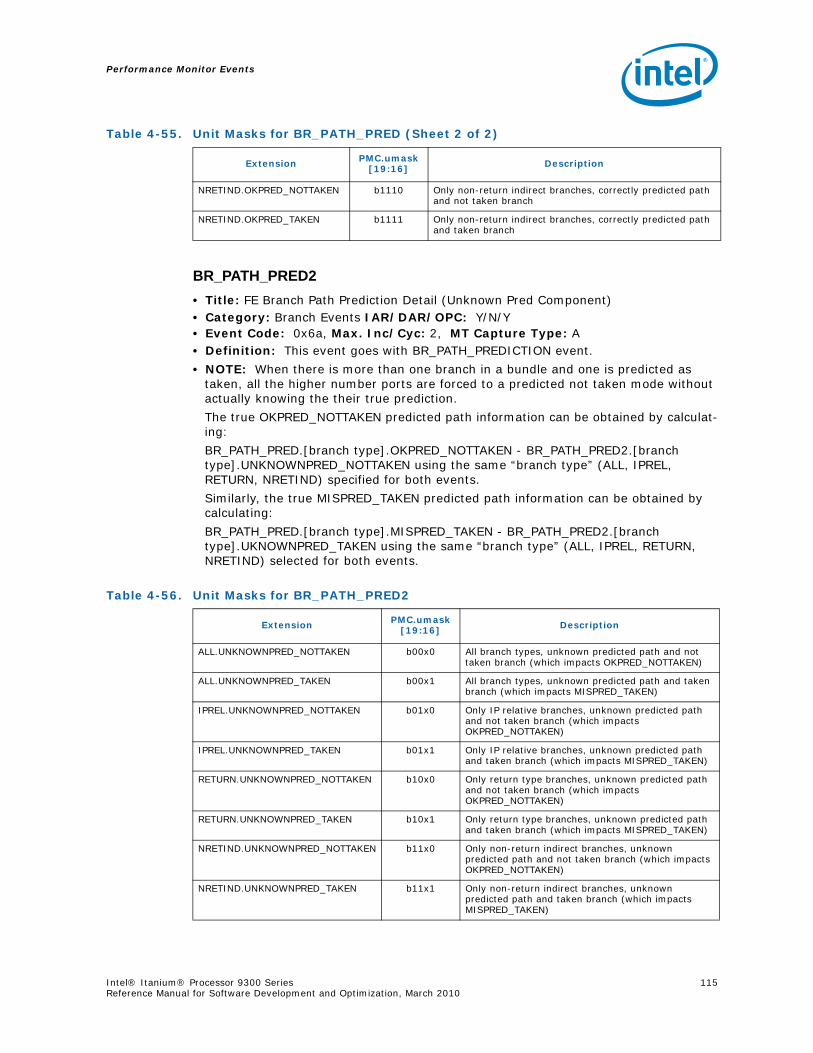
Performance Monitor Events
Intel® Itanium® Processor 9300 Series 115Reference Manual for Software Development and Optimization, March 2010
BR_PATH_PRED2• Title: FE Branch Path Prediction Detail (Unknown Pred Component) • Category: Branch Events IAR/DAR/OPC: Y/N/Y• Event Code: 0x6a, Max. Inc/Cyc: 2, MT Capture Type: A• Definition: This event goes with BR_PATH_PREDICTION event.
• NOTE: When there is more than one branch in a bundle and one is predicted as taken, all the higher number ports are forced to a predicted not taken mode without actually knowing the their true prediction.
The true OKPRED_NOTTAKEN predicted path information can be obtained by calculat-ing:
BR_PATH_PRED.[branch type].OKPRED_NOTTAKEN - BR_PATH_PRED2.[branch type].UNKNOWNPRED_NOTTAKEN using the same “branch type” (ALL, IPREL, RETURN, NRETIND) specified for both events.
Similarly, the true MISPRED_TAKEN predicted path information can be obtained by calculating:
BR_PATH_PRED.[branch type].MISPRED_TAKEN - BR_PATH_PRED2.[branch type].UKNOWNPRED_TAKEN using the same “branch type” (ALL, IPREL, RETURN, NRETIND) selected for both events.
NRETIND.OKPRED_NOTTAKEN b1110 Only non-return indirect branches, correctly predicted path and not taken branch
NRETIND.OKPRED_TAKEN b1111 Only non-return indirect branches, correctly predicted path and taken branch
Table 4-55. Unit Masks for BR_PATH_PRED (Sheet 2 of 2)
Extension PMC.umask[19:16] Description
Table 4-56. Unit Masks for BR_PATH_PRED2
Extension PMC.umask[19:16] Description
ALL.UNKNOWNPRED_NOTTAKEN b00x0 All branch types, unknown predicted path and not taken branch (which impacts OKPRED_NOTTAKEN)
ALL.UNKNOWNPRED_TAKEN b00x1 All branch types, unknown predicted path and taken branch (which impacts MISPRED_TAKEN)
IPREL.UNKNOWNPRED_NOTTAKEN b01x0 Only IP relative branches, unknown predicted path and not taken branch (which impacts OKPRED_NOTTAKEN)
IPREL.UNKNOWNPRED_TAKEN b01x1 Only IP relative branches, unknown predicted path and taken branch (which impacts MISPRED_TAKEN)
RETURN.UNKNOWNPRED_NOTTAKEN b10x0 Only return type branches, unknown predicted path and not taken branch (which impacts OKPRED_NOTTAKEN)
RETURN.UNKNOWNPRED_TAKEN b10x1 Only return type branches, unknown predicted path and taken branch (which impacts MISPRED_TAKEN)
NRETIND.UNKNOWNPRED_NOTTAKEN b11x0 Only non-return indirect branches, unknown predicted path and not taken branch (which impacts OKPRED_NOTTAKEN)
NRETIND.UNKNOWNPRED_TAKEN b11x1 Only non-return indirect branches, unknown predicted path and taken branch (which impacts MISPRED_TAKEN)
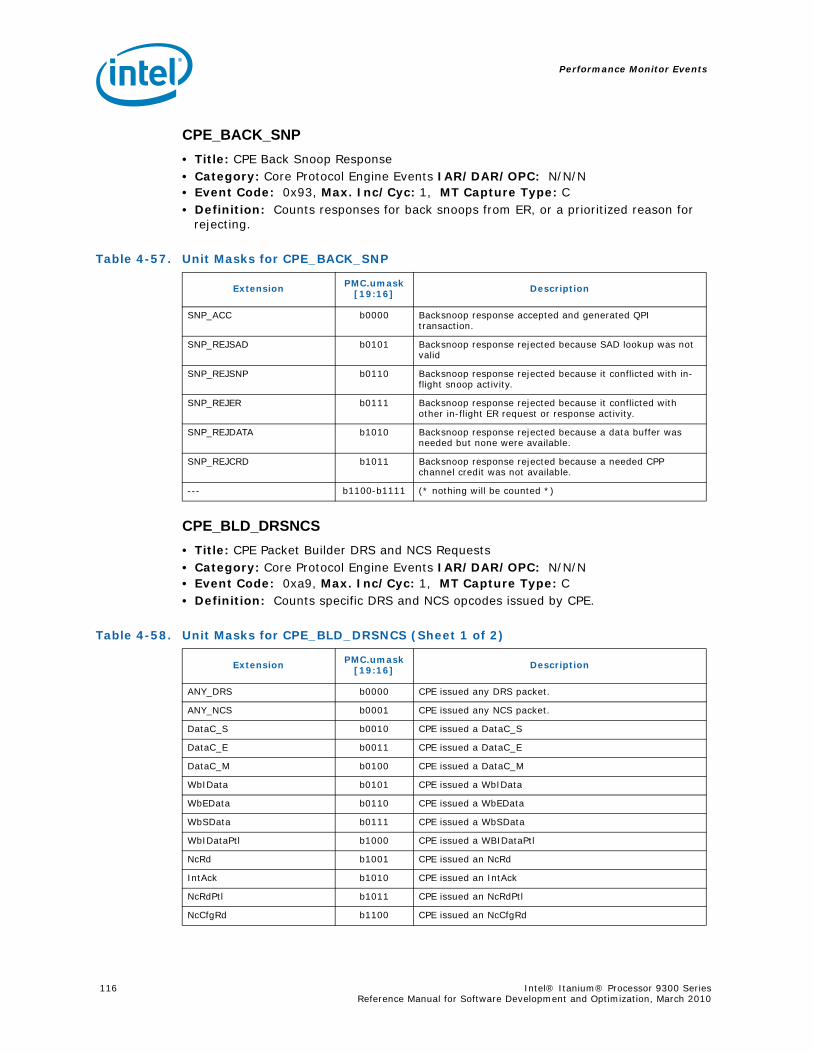
Performance Monitor Events
116 Intel® Itanium® Processor 9300 Series Reference Manual for Software Development and Optimization, March 2010
CPE_BACK_SNP• Title: CPE Back Snoop Response• Category: Core Protocol Engine Events IAR/DAR/OPC: N/N/N• Event Code: 0x93, Max. Inc/Cyc: 1, MT Capture Type: C• Definition: Counts responses for back snoops from ER, or a prioritized reason for
rejecting.
CPE_BLD_DRSNCS• Title: CPE Packet Builder DRS and NCS Requests• Category: Core Protocol Engine Events IAR/DAR/OPC: N/N/N• Event Code: 0xa9, Max. Inc/Cyc: 1, MT Capture Type: C• Definition: Counts specific DRS and NCS opcodes issued by CPE.
Table 4-57. Unit Masks for CPE_BACK_SNP
Extension PMC.umask[19:16] Description
SNP_ACC b0000 Backsnoop response accepted and generated QPI transaction.
SNP_REJSAD b0101 Backsnoop response rejected because SAD lookup was not valid
SNP_REJSNP b0110 Backsnoop response rejected because it conflicted with in-flight snoop activity.
SNP_REJER b0111 Backsnoop response rejected because it conflicted with other in-flight ER request or response activity.
SNP_REJDATA b1010 Backsnoop response rejected because a data buffer was needed but none were available.
SNP_REJCRD b1011 Backsnoop response rejected because a needed CPP channel credit was not available.
--- b1100-b1111 (* nothing will be counted *)
Table 4-58. Unit Masks for CPE_BLD_DRSNCS (Sheet 1 of 2)
Extension PMC.umask[19:16] Description
ANY_DRS b0000 CPE issued any DRS packet.
ANY_NCS b0001 CPE issued any NCS packet.
DataC_S b0010 CPE issued a DataC_S
DataC_E b0011 CPE issued a DataC_E
DataC_M b0100 CPE issued a DataC_M
WbIData b0101 CPE issued a WbIData
WbEData b0110 CPE issued a WbEData
WbSData b0111 CPE issued a WbSData
WbIDataPtl b1000 CPE issued a WBIDataPtl
NcRd b1001 CPE issued an NcRd
IntAck b1010 CPE issued an IntAck
NcRdPtl b1011 CPE issued an NcRdPtl
NcCfgRd b1100 CPE issued an NcCfgRd
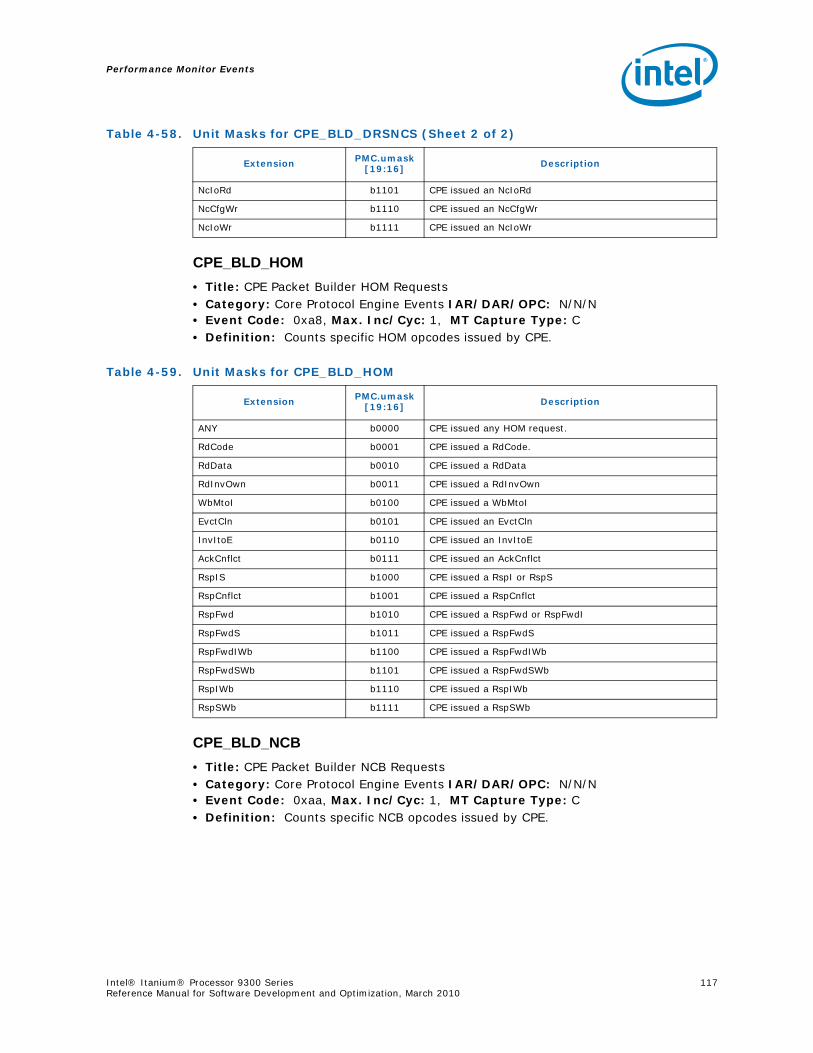
Performance Monitor Events
Intel® Itanium® Processor 9300 Series 117Reference Manual for Software Development and Optimization, March 2010
CPE_BLD_HOM• Title: CPE Packet Builder HOM Requests• Category: Core Protocol Engine Events IAR/DAR/OPC: N/N/N• Event Code: 0xa8, Max. Inc/Cyc: 1, MT Capture Type: C• Definition: Counts specific HOM opcodes issued by CPE.
CPE_BLD_NCB• Title: CPE Packet Builder NCB Requests• Category: Core Protocol Engine Events IAR/DAR/OPC: N/N/N• Event Code: 0xaa, Max. Inc/Cyc: 1, MT Capture Type: C• Definition: Counts specific NCB opcodes issued by CPE.
NcIoRd b1101 CPE issued an NcIoRd
NcCfgWr b1110 CPE issued an NcCfgWr
NcIoWr b1111 CPE issued an NcIoWr
Table 4-58. Unit Masks for CPE_BLD_DRSNCS (Sheet 2 of 2)
Extension PMC.umask[19:16] Description
Table 4-59. Unit Masks for CPE_BLD_HOM
Extension PMC.umask[19:16] Description
ANY b0000 CPE issued any HOM request.
RdCode b0001 CPE issued a RdCode.
RdData b0010 CPE issued a RdData
RdInvOwn b0011 CPE issued a RdInvOwn
WbMtoI b0100 CPE issued a WbMtoI
EvctCln b0101 CPE issued an EvctCln
InvItoE b0110 CPE issued an InvItoE
AckCnflct b0111 CPE issued an AckCnflct
RspIS b1000 CPE issued a RspI or RspS
RspCnflct b1001 CPE issued a RspCnflct
RspFwd b1010 CPE issued a RspFwd or RspFwdI
RspFwdS b1011 CPE issued a RspFwdS
RspFwdIWb b1100 CPE issued a RspFwdIWb
RspFwdSWb b1101 CPE issued a RspFwdSWb
RspIWb b1110 CPE issued a RspIWb
RspSWb b1111 CPE issued a RspSWb
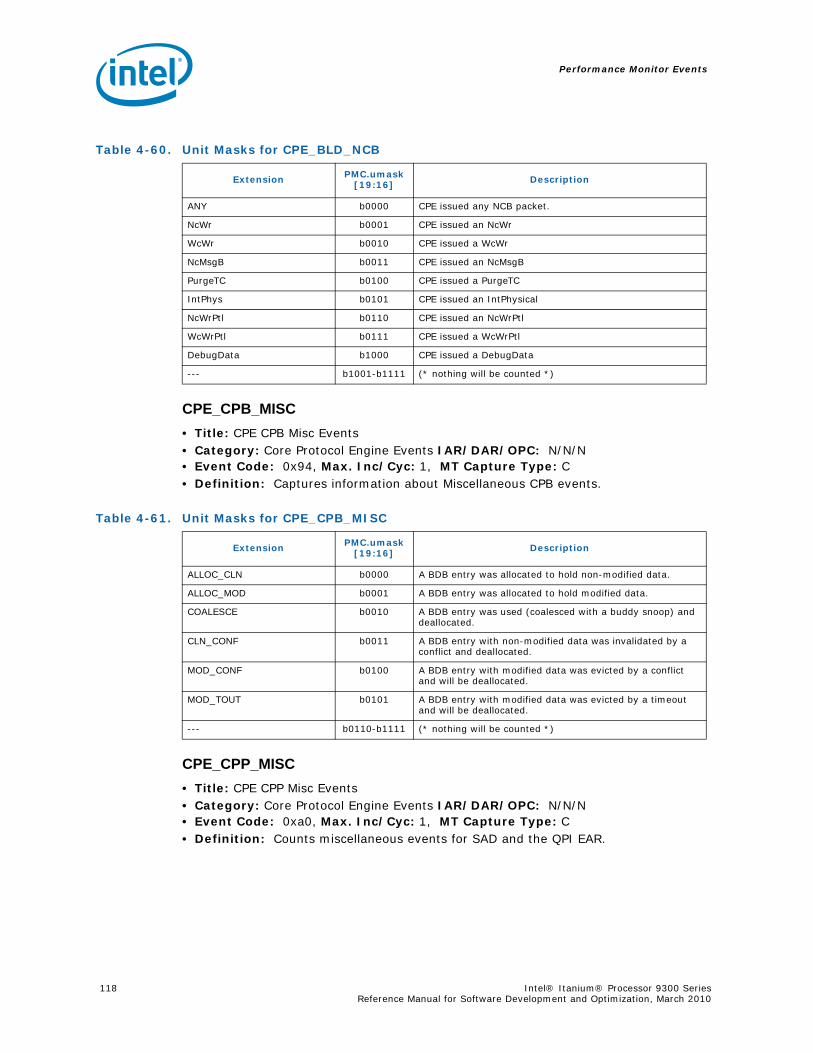
Performance Monitor Events
118 Intel® Itanium® Processor 9300 Series Reference Manual for Software Development and Optimization, March 2010
CPE_CPB_MISC• Title: CPE CPB Misc Events• Category: Core Protocol Engine Events IAR/DAR/OPC: N/N/N• Event Code: 0x94, Max. Inc/Cyc: 1, MT Capture Type: C• Definition: Captures information about Miscellaneous CPB events.
CPE_CPP_MISC• Title: CPE CPP Misc Events• Category: Core Protocol Engine Events IAR/DAR/OPC: N/N/N• Event Code: 0xa0, Max. Inc/Cyc: 1, MT Capture Type: C• Definition: Counts miscellaneous events for SAD and the QPI EAR.
Table 4-60. Unit Masks for CPE_BLD_NCB
Extension PMC.umask[19:16] Description
ANY b0000 CPE issued any NCB packet.
NcWr b0001 CPE issued an NcWr
WcWr b0010 CPE issued a WcWr
NcMsgB b0011 CPE issued an NcMsgB
PurgeTC b0100 CPE issued a PurgeTC
IntPhys b0101 CPE issued an IntPhysical
NcWrPtl b0110 CPE issued an NcWrPtl
WcWrPtl b0111 CPE issued a WcWrPtl
DebugData b1000 CPE issued a DebugData
--- b1001-b1111 (* nothing will be counted *)
Table 4-61. Unit Masks for CPE_CPB_MISC
Extension PMC.umask[19:16] Description
ALLOC_CLN b0000 A BDB entry was allocated to hold non-modified data.
ALLOC_MOD b0001 A BDB entry was allocated to hold modified data.
COALESCE b0010 A BDB entry was used (coalesced with a buddy snoop) and deallocated.
CLN_CONF b0011 A BDB entry with non-modified data was invalidated by a conflict and deallocated.
MOD_CONF b0100 A BDB entry with modified data was evicted by a conflict and will be deallocated.
MOD_TOUT b0101 A BDB entry with modified data was evicted by a timeout and will be deallocated.
--- b0110-b1111 (* nothing will be counted *)
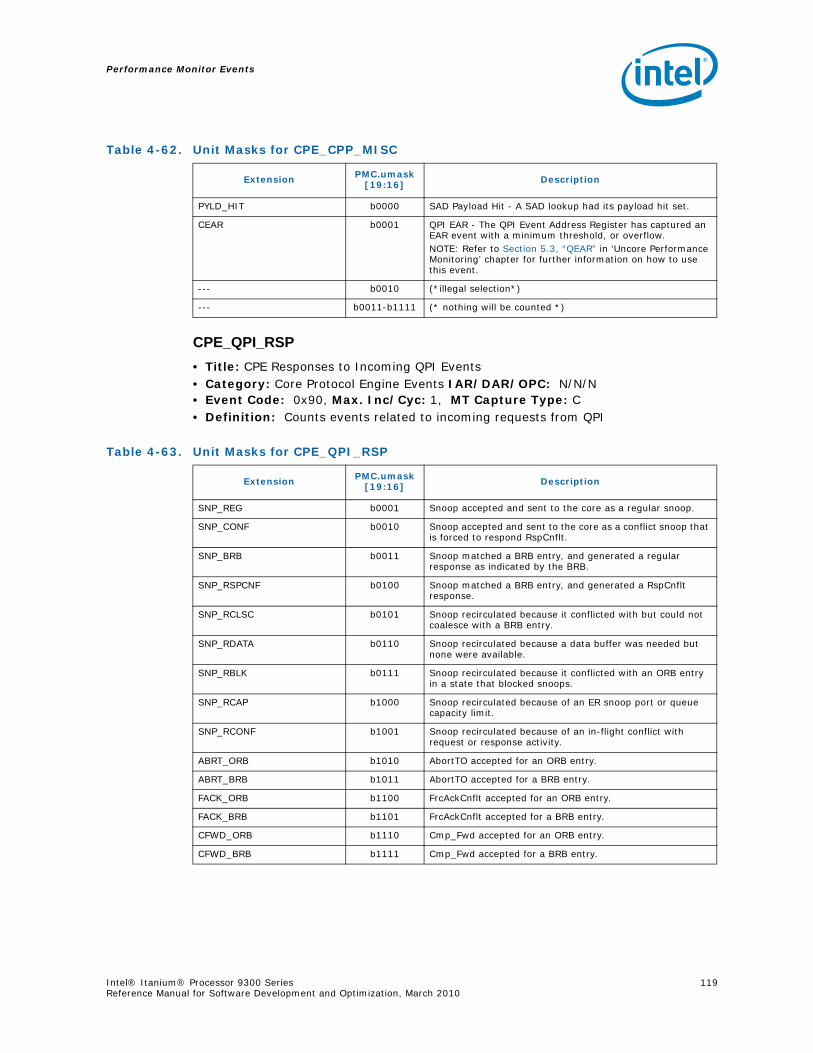
Performance Monitor Events
Intel® Itanium® Processor 9300 Series 119Reference Manual for Software Development and Optimization, March 2010
CPE_QPI_RSP• Title: CPE Responses to Incoming QPI Events• Category: Core Protocol Engine Events IAR/DAR/OPC: N/N/N• Event Code: 0x90, Max. Inc/Cyc: 1, MT Capture Type: C• Definition: Counts events related to incoming requests from QPI
Table 4-62. Unit Masks for CPE_CPP_MISC
Extension PMC.umask[19:16] Description
PYLD_HIT b0000 SAD Payload Hit - A SAD lookup had its payload hit set.
CEAR b0001 QPI EAR - The QPI Event Address Register has captured an EAR event with a minimum threshold, or overflow.NOTE: Refer to Section 5.3, “QEAR” in ‘Uncore Performance Monitoring’ chapter for further information on how to use this event.
--- b0010 (*illegal selection*)
--- b0011-b1111 (* nothing will be counted *)
Table 4-63. Unit Masks for CPE_QPI_RSP
Extension PMC.umask[19:16] Description
SNP_REG b0001 Snoop accepted and sent to the core as a regular snoop.
SNP_CONF b0010 Snoop accepted and sent to the core as a conflict snoop that is forced to respond RspCnflt.
SNP_BRB b0011 Snoop matched a BRB entry, and generated a regular response as indicated by the BRB.
SNP_RSPCNF b0100 Snoop matched a BRB entry, and generated a RspCnflt response.
SNP_RCLSC b0101 Snoop recirculated because it conflicted with but could not coalesce with a BRB entry.
SNP_RDATA b0110 Snoop recirculated because a data buffer was needed but none were available.
SNP_RBLK b0111 Snoop recirculated because it conflicted with an ORB entry in a state that blocked snoops.
SNP_RCAP b1000 Snoop recirculated because of an ER snoop port or queue capacity limit.
SNP_RCONF b1001 Snoop recirculated because of an in-flight conflict with request or response activity.
ABRT_ORB b1010 AbortTO accepted for an ORB entry.
ABRT_BRB b1011 AbortTO accepted for a BRB entry.
FACK_ORB b1100 FrcAckCnflt accepted for an ORB entry.
FACK_BRB b1101 FrcAckCnflt accepted for a BRB entry.
CFWD_ORB b1110 Cmp_Fwd accepted for an ORB entry.
CFWD_BRB b1111 Cmp_Fwd accepted for a BRB entry.

Performance Monitor Events
120 Intel® Itanium® Processor 9300 Series Reference Manual for Software Development and Optimization, March 2010
CPE_EXT_SNP• Title: CPE External Snoop Response• Category: Core Protocol Engine Events IAR/DAR/OPC: N/N/N• Event Code: 0x92, Max. Inc/Cyc: 1, MT Capture Type: C• Definition: Counts responses for external snoops from ER, or a prioritized reason
for rejecting.
CPE_LNK• Title: CPE QPI Link Events• Category: Core Protocol Engine Events IAR/DAR/OPC: N/N/N• Event Code: 0xa2, Max. Inc/Cyc: 1, MT Capture Type: C• Definition: Counts responses for back snoops from ER, or a prioritized reason for
rejecting.
Table 4-64. Unit Masks for CPE_EXT_SNP
Extension PMC.umask[19:16] Description
SNP_ACC b0000 External snoop response accepted and generated QPI transaction.
SNP_REJSAD b0101 External snoop response rejected because SAD lookup was not valid.
SNP_REJSNP b0110 External snoop response rejected because it conflicted with in-flight snoop activity.
SNP_REJER b0111 External snoop response rejected because it conflicted with other in-flight ER request or response activity.
SNP_REJDATA b1010 External snoop response rejected because a data buffer was needed but none were available.
SNP_REJCRD b1011 External snoop response rejected because a needed CPP channel credit was not available.
SNP_REJACK b1110 External snoop response rejected because an internal (AckQ) response pre-empted it.
SNP_REJPRE b1111 External snoop response rejected because a BRB eviction or snoop response pre-empted it.
Table 4-65. Unit Masks for CPE_LNK (Sheet 1 of 2)
Extension PMC.umask[19:16] Description
IN_VLD b0000 CPE received a valid flit from QPI
OUT_VLD b0001 CPE sent a valid to QPI
SEND_EN b0010 Counts number of times CPE’s JBox sent a sendenable=1 .
NCS_CRD b0011 Counts cycles that an NCS opcode was valid in the CPE builder FIFO but did not have enough VN0 or VNA credits to issue. Only counts cycles when JBox senden=1.
NCB_CRD b0100 Counts cycles that an NCB opcode was valid in the CPE builder FIFO but did not have enough VN0 or VNA credits to issue. Only counts cycles when JBox senden=1.
DRS_CRD b0101 Counts cycles that an DRS opcode was valid in the CPE builder FIFO but did not have enough VN0 or VNA credits to issue. Only counts cycles when JBox senden=1.
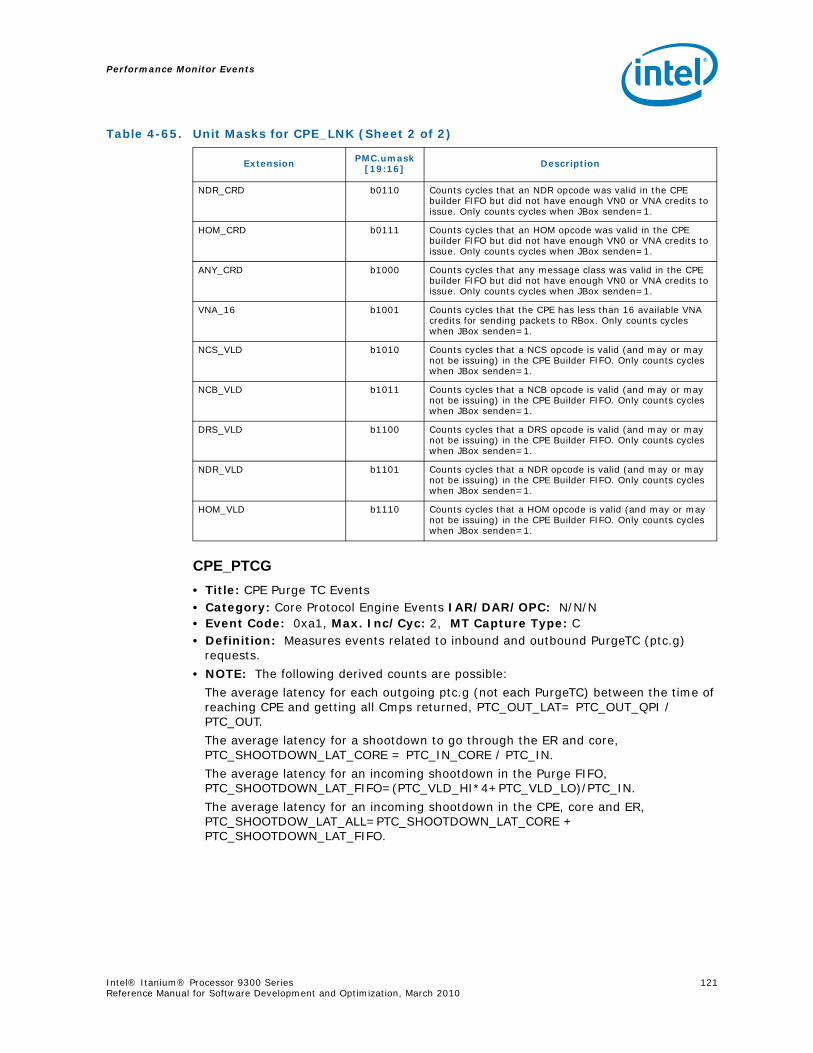
Performance Monitor Events
Intel® Itanium® Processor 9300 Series 121Reference Manual for Software Development and Optimization, March 2010
CPE_PTCG• Title: CPE Purge TC Events• Category: Core Protocol Engine Events IAR/DAR/OPC: N/N/N• Event Code: 0xa1, Max. Inc/Cyc: 2, MT Capture Type: C• Definition: Measures events related to inbound and outbound PurgeTC (ptc.g)
requests.
• NOTE: The following derived counts are possible:
The average latency for each outgoing ptc.g (not each PurgeTC) between the time of reaching CPE and getting all Cmps returned, PTC_OUT_LAT= PTC_OUT_QPI / PTC_OUT.
The average latency for a shootdown to go through the ER and core, PTC_SHOOTDOWN_LAT_CORE = PTC_IN_CORE / PTC_IN.
The average latency for an incoming shootdown in the Purge FIFO, PTC_SHOOTDOWN_LAT_FIFO=(PTC_VLD_HI*4+PTC_VLD_LO)/PTC_IN.
The average latency for an incoming shootdown in the CPE, core and ER, PTC_SHOOTDOW_LAT_ALL=PTC_SHOOTDOWN_LAT_CORE + PTC_SHOOTDOWN_LAT_FIFO.
NDR_CRD b0110 Counts cycles that an NDR opcode was valid in the CPE builder FIFO but did not have enough VN0 or VNA credits to issue. Only counts cycles when JBox senden=1.
HOM_CRD b0111 Counts cycles that an HOM opcode was valid in the CPE builder FIFO but did not have enough VN0 or VNA credits to issue. Only counts cycles when JBox senden=1.
ANY_CRD b1000 Counts cycles that any message class was valid in the CPE builder FIFO but did not have enough VN0 or VNA credits to issue. Only counts cycles when JBox senden=1.
VNA_16 b1001 Counts cycles that the CPE has less than 16 available VNA credits for sending packets to RBox. Only counts cycles when JBox senden=1.
NCS_VLD b1010 Counts cycles that a NCS opcode is valid (and may or may not be issuing) in the CPE Builder FIFO. Only counts cycles when JBox senden=1.
NCB_VLD b1011 Counts cycles that a NCB opcode is valid (and may or may not be issuing) in the CPE Builder FIFO. Only counts cycles when JBox senden=1.
DRS_VLD b1100 Counts cycles that a DRS opcode is valid (and may or may not be issuing) in the CPE Builder FIFO. Only counts cycles when JBox senden=1.
NDR_VLD b1101 Counts cycles that a NDR opcode is valid (and may or may not be issuing) in the CPE Builder FIFO. Only counts cycles when JBox senden=1.
HOM_VLD b1110 Counts cycles that a HOM opcode is valid (and may or may not be issuing) in the CPE Builder FIFO. Only counts cycles when JBox senden=1.
Table 4-65. Unit Masks for CPE_LNK (Sheet 2 of 2)
Extension PMC.umask[19:16] Description
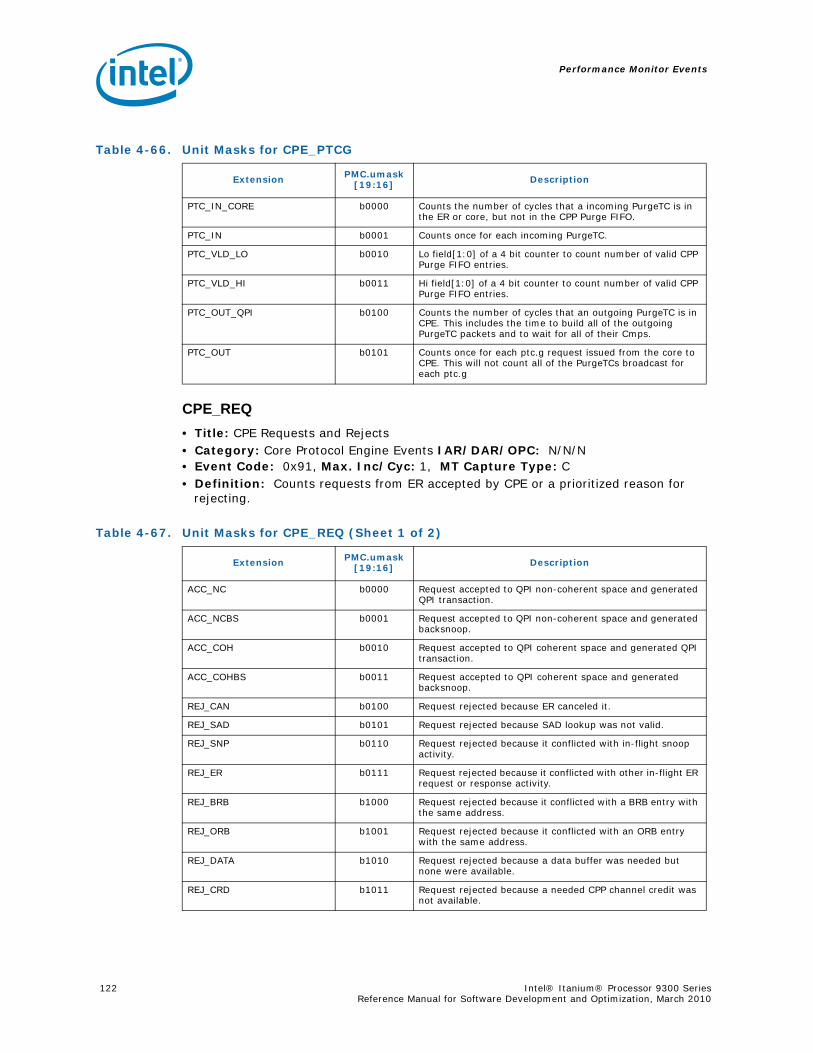
Performance Monitor Events
122 Intel® Itanium® Processor 9300 Series Reference Manual for Software Development and Optimization, March 2010
CPE_REQ• Title: CPE Requests and Rejects• Category: Core Protocol Engine Events IAR/DAR/OPC: N/N/N• Event Code: 0x91, Max. Inc/Cyc: 1, MT Capture Type: C• Definition: Counts requests from ER accepted by CPE or a prioritized reason for
rejecting.
Table 4-66. Unit Masks for CPE_PTCG
Extension PMC.umask[19:16] Description
PTC_IN_CORE b0000 Counts the number of cycles that a incoming PurgeTC is in the ER or core, but not in the CPP Purge FIFO.
PTC_IN b0001 Counts once for each incoming PurgeTC.
PTC_VLD_LO b0010 Lo field[1:0] of a 4 bit counter to count number of valid CPP Purge FIFO entries.
PTC_VLD_HI b0011 Hi field[1:0] of a 4 bit counter to count number of valid CPP Purge FIFO entries.
PTC_OUT_QPI b0100 Counts the number of cycles that an outgoing PurgeTC is in CPE. This includes the time to build all of the outgoing PurgeTC packets and to wait for all of their Cmps.
PTC_OUT b0101 Counts once for each ptc.g request issued from the core to CPE. This will not count all of the PurgeTCs broadcast for each ptc.g
Table 4-67. Unit Masks for CPE_REQ (Sheet 1 of 2)
Extension PMC.umask[19:16] Description
ACC_NC b0000 Request accepted to QPI non-coherent space and generated QPI transaction.
ACC_NCBS b0001 Request accepted to QPI non-coherent space and generated backsnoop.
ACC_COH b0010 Request accepted to QPI coherent space and generated QPI transaction.
ACC_COHBS b0011 Request accepted to QPI coherent space and generated backsnoop.
REJ_CAN b0100 Request rejected because ER canceled it.
REJ_SAD b0101 Request rejected because SAD lookup was not valid.
REJ_SNP b0110 Request rejected because it conflicted with in-flight snoop activity.
REJ_ER b0111 Request rejected because it conflicted with other in-flight ER request or response activity.
REJ_BRB b1000 Request rejected because it conflicted with a BRB entry with the same address.
REJ_ORB b1001 Request rejected because it conflicted with an ORB entry with the same address.
REJ_DATA b1010 Request rejected because a data buffer was needed but none were available.
REJ_CRD b1011 Request rejected because a needed CPP channel credit was not available.
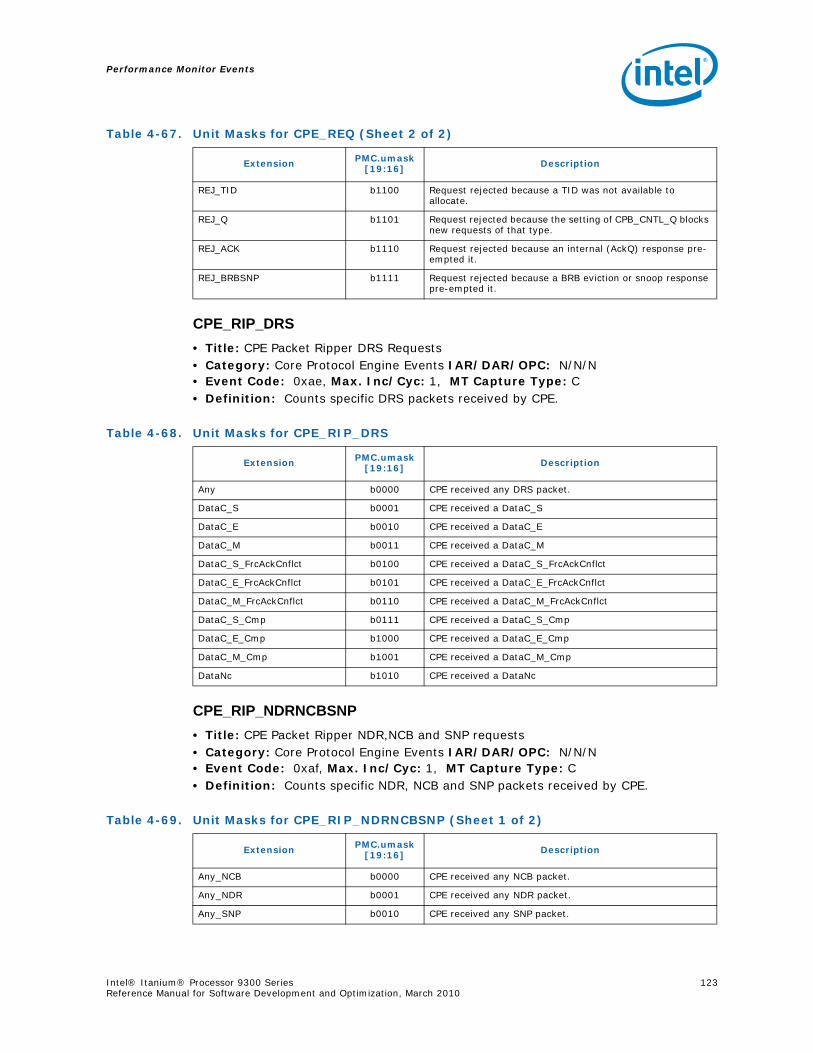
Performance Monitor Events
Intel® Itanium® Processor 9300 Series 123Reference Manual for Software Development and Optimization, March 2010
CPE_RIP_DRS• Title: CPE Packet Ripper DRS Requests• Category: Core Protocol Engine Events IAR/DAR/OPC: N/N/N• Event Code: 0xae, Max. Inc/Cyc: 1, MT Capture Type: C• Definition: Counts specific DRS packets received by CPE.
CPE_RIP_NDRNCBSNP• Title: CPE Packet Ripper NDR,NCB and SNP requests• Category: Core Protocol Engine Events IAR/DAR/OPC: N/N/N• Event Code: 0xaf, Max. Inc/Cyc: 1, MT Capture Type: C• Definition: Counts specific NDR, NCB and SNP packets received by CPE.
REJ_TID b1100 Request rejected because a TID was not available to allocate.
REJ_Q b1101 Request rejected because the setting of CPB_CNTL_Q blocks new requests of that type.
REJ_ACK b1110 Request rejected because an internal (AckQ) response pre-empted it.
REJ_BRBSNP b1111 Request rejected because a BRB eviction or snoop response pre-empted it.
Table 4-67. Unit Masks for CPE_REQ (Sheet 2 of 2)
Extension PMC.umask[19:16] Description
Table 4-68. Unit Masks for CPE_RIP_DRS
Extension PMC.umask[19:16] Description
Any b0000 CPE received any DRS packet.
DataC_S b0001 CPE received a DataC_S
DataC_E b0010 CPE received a DataC_E
DataC_M b0011 CPE received a DataC_M
DataC_S_FrcAckCnflct b0100 CPE received a DataC_S_FrcAckCnflct
DataC_E_FrcAckCnflct b0101 CPE received a DataC_E_FrcAckCnflct
DataC_M_FrcAckCnflct b0110 CPE received a DataC_M_FrcAckCnflct
DataC_S_Cmp b0111 CPE received a DataC_S_Cmp
DataC_E_Cmp b1000 CPE received a DataC_E_Cmp
DataC_M_Cmp b1001 CPE received a DataC_M_Cmp
DataNc b1010 CPE received a DataNc
Table 4-69. Unit Masks for CPE_RIP_NDRNCBSNP (Sheet 1 of 2)
Extension PMC.umask[19:16] Description
Any_NCB b0000 CPE received any NCB packet.
Any_NDR b0001 CPE received any NDR packet.
Any_SNP b0010 CPE received any SNP packet.
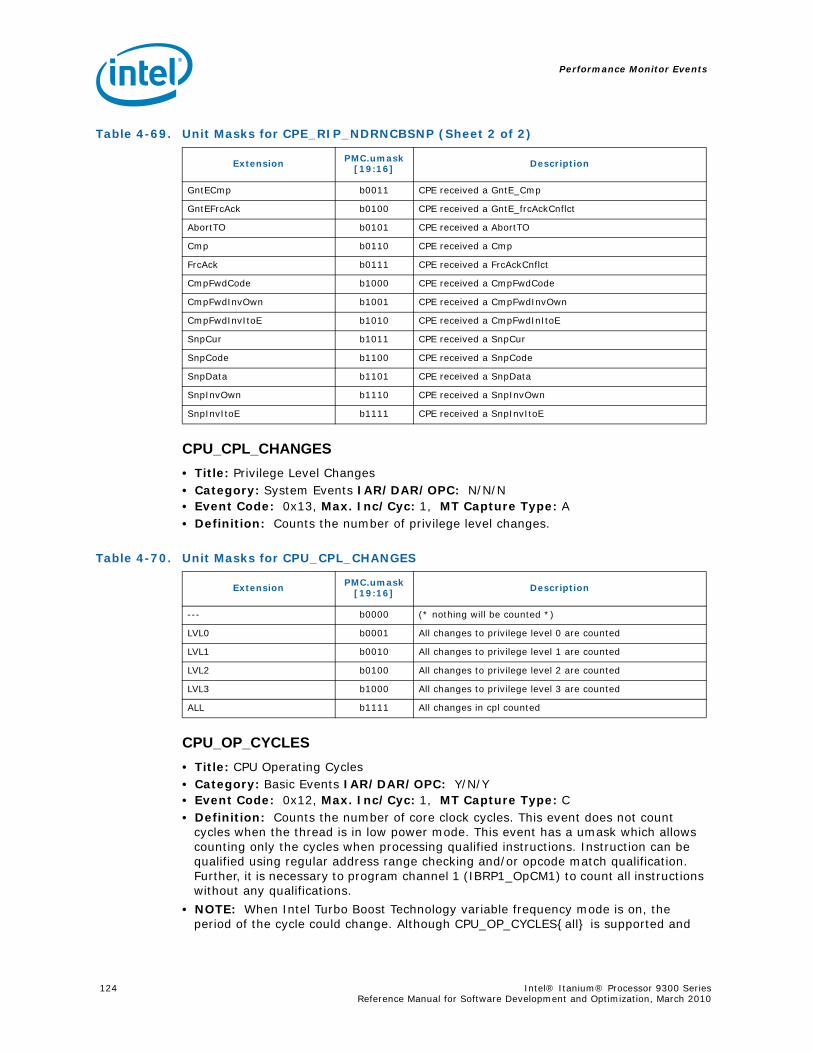
Performance Monitor Events
124 Intel® Itanium® Processor 9300 Series Reference Manual for Software Development and Optimization, March 2010
CPU_CPL_CHANGES• Title: Privilege Level Changes• Category: System Events IAR/DAR/OPC: N/N/N• Event Code: 0x13, Max. Inc/Cyc: 1, MT Capture Type: A• Definition: Counts the number of privilege level changes.
CPU_OP_CYCLES• Title: CPU Operating Cycles• Category: Basic Events IAR/DAR/OPC: Y/N/Y• Event Code: 0x12, Max. Inc/Cyc: 1, MT Capture Type: C• Definition: Counts the number of core clock cycles. This event does not count
cycles when the thread is in low power mode. This event has a umask which allows counting only the cycles when processing qualified instructions. Instruction can be qualified using regular address range checking and/or opcode match qualification. Further, it is necessary to program channel 1 (IBRP1_OpCM1) to count all instructions without any qualifications.
• NOTE: When Intel Turbo Boost Technology variable frequency mode is on, the period of the cycle could change. Although CPU_OP_CYCLES{all} is supported and
GntECmp b0011 CPE received a GntE_Cmp
GntEFrcAck b0100 CPE received a GntE_frcAckCnflct
AbortTO b0101 CPE received a AbortTO
Cmp b0110 CPE received a Cmp
FrcAck b0111 CPE received a FrcAckCnflct
CmpFwdCode b1000 CPE received a CmpFwdCode
CmpFwdInvOwn b1001 CPE received a CmpFwdInvOwn
CmpFwdInvItoE b1010 CPE received a CmpFwdInItoE
SnpCur b1011 CPE received a SnpCur
SnpCode b1100 CPE received a SnpCode
SnpData b1101 CPE received a SnpData
SnpInvOwn b1110 CPE received a SnpInvOwn
SnpInvItoE b1111 CPE received a SnpInvItoE
Table 4-69. Unit Masks for CPE_RIP_NDRNCBSNP (Sheet 2 of 2)
Extension PMC.umask[19:16] Description
Table 4-70. Unit Masks for CPU_CPL_CHANGES
Extension PMC.umask[19:16] Description
--- b0000 (* nothing will be counted *)
LVL0 b0001 All changes to privilege level 0 are counted
LVL1 b0010 All changes to privilege level 1 are counted
LVL2 b0100 All changes to privilege level 2 are counted
LVL3 b1000 All changes to privilege level 3 are counted
ALL b1111 All changes in cpl counted
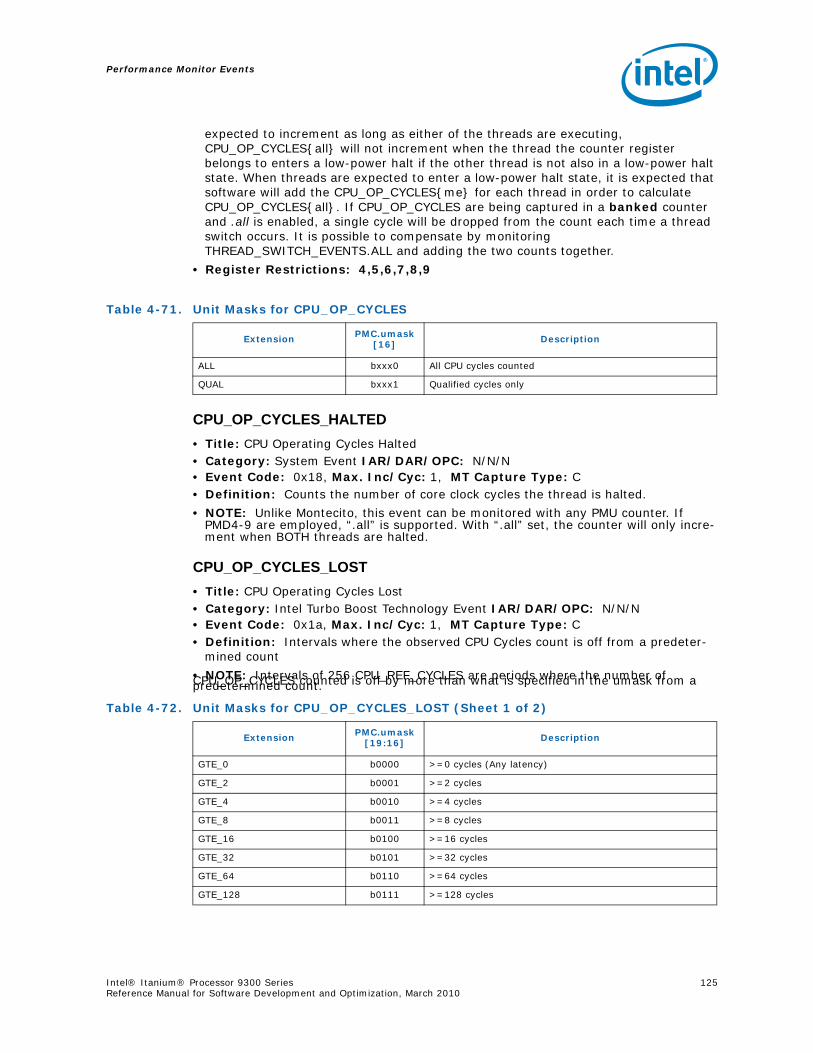
Performance Monitor Events
Intel® Itanium® Processor 9300 Series 125Reference Manual for Software Development and Optimization, March 2010
expected to increment as long as either of the threads are executing, CPU_OP_CYCLES{all} will not increment when the thread the counter register belongs to enters a low-power halt if the other thread is not also in a low-power halt state. When threads are expected to enter a low-power halt state, it is expected that software will add the CPU_OP_CYCLES{me} for each thread in order to calculate CPU_OP_CYCLES{all}. If CPU_OP_CYCLES are being captured in a banked counter and .all is enabled, a single cycle will be dropped from the count each time a thread switch occurs. It is possible to compensate by monitoring THREAD_SWITCH_EVENTS.ALL and adding the two counts together.
• Register Restrictions: 4,5,6,7,8,9
CPU_OP_CYCLES_HALTED• Title: CPU Operating Cycles Halted• Category: System Event IAR/DAR/OPC: N/N/N• Event Code: 0x18, Max. Inc/Cyc: 1, MT Capture Type: C• Definition: Counts the number of core clock cycles the thread is halted.
• NOTE: Unlike Montecito, this event can be monitored with any PMU counter. If PMD4-9 are employed, “.all” is supported. With “.all” set, the counter will only incre-ment when BOTH threads are halted.
CPU_OP_CYCLES_LOST• Title: CPU Operating Cycles Lost• Category: Intel Turbo Boost Technology Event IAR/DAR/OPC: N/N/N• Event Code: 0x1a, Max. Inc/Cyc: 1, MT Capture Type: C• Definition: Intervals where the observed CPU Cycles count is off from a predeter-
mined count
• NOTE: Intervals of 256 CPU_REF_CYCLES are periods where the number of CPU_OP_CYCLES counted is off by more than what is specified in the umask from a predetermined count.
Table 4-71. Unit Masks for CPU_OP_CYCLES
Extension PMC.umask[16] Description
ALL bxxx0 All CPU cycles counted
QUAL bxxx1 Qualified cycles only
Table 4-72. Unit Masks for CPU_OP_CYCLES_LOST (Sheet 1 of 2)
Extension PMC.umask[19:16] Description
GTE_0 b0000 >=0 cycles (Any latency)
GTE_2 b0001 >=2 cycles
GTE_4 b0010 >=4 cycles
GTE_8 b0011 >=8 cycles
GTE_16 b0100 >=16 cycles
GTE_32 b0101 >=32 cycles
GTE_64 b0110 >=64 cycles
GTE_128 b0111 >=128 cycles
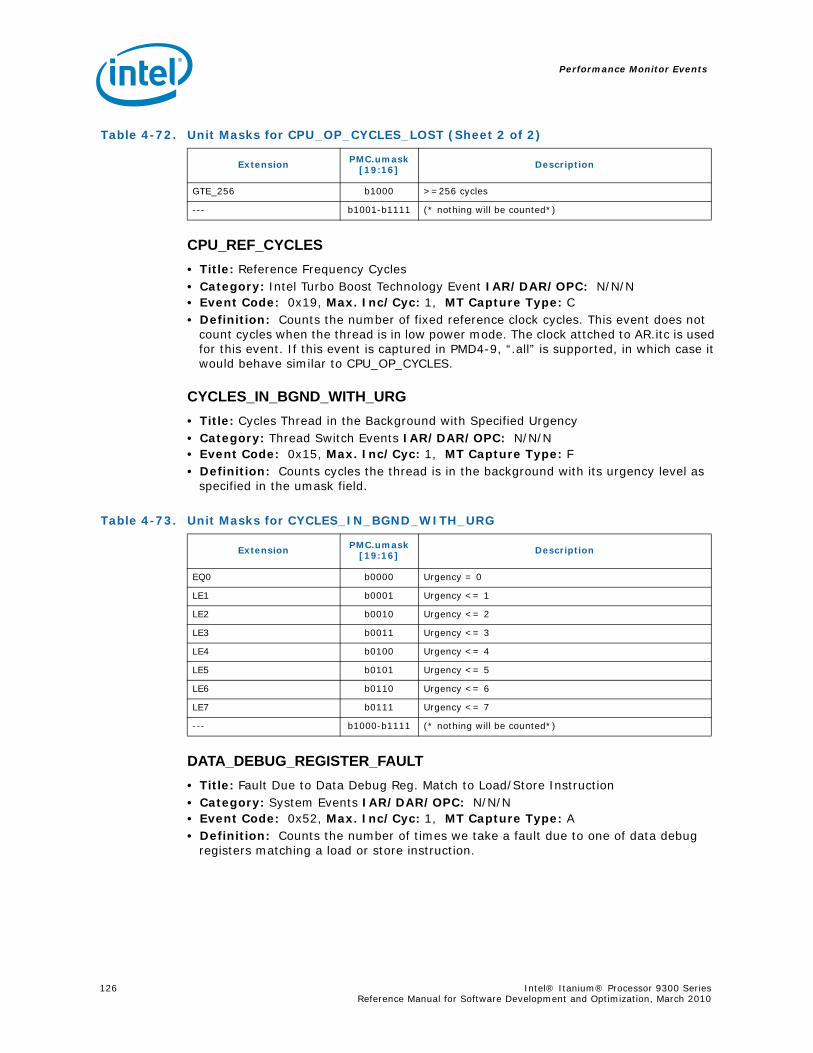
Performance Monitor Events
126 Intel® Itanium® Processor 9300 Series Reference Manual for Software Development and Optimization, March 2010
CPU_REF_CYCLES• Title: Reference Frequency Cycles• Category: Intel Turbo Boost Technology Event IAR/DAR/OPC: N/N/N• Event Code: 0x19, Max. Inc/Cyc: 1, MT Capture Type: C• Definition: Counts the number of fixed reference clock cycles. This event does not
count cycles when the thread is in low power mode. The clock attched to AR.itc is used for this event. If this event is captured in PMD4-9, “.all” is supported, in which case it would behave similar to CPU_OP_CYCLES.
CYCLES_IN_BGND_WITH_URG• Title: Cycles Thread in the Background with Specified Urgency• Category: Thread Switch Events IAR/DAR/OPC: N/N/N• Event Code: 0x15, Max. Inc/Cyc: 1, MT Capture Type: F• Definition: Counts cycles the thread is in the background with its urgency level as
specified in the umask field.
DATA_DEBUG_REGISTER_FAULT• Title: Fault Due to Data Debug Reg. Match to Load/Store Instruction• Category: System Events IAR/DAR/OPC: N/N/N• Event Code: 0x52, Max. Inc/Cyc: 1, MT Capture Type: A• Definition: Counts the number of times we take a fault due to one of data debug
registers matching a load or store instruction.
GTE_256 b1000 >=256 cycles
--- b1001-b1111 (* nothing will be counted*)
Table 4-72. Unit Masks for CPU_OP_CYCLES_LOST (Sheet 2 of 2)
Extension PMC.umask[19:16] Description
Table 4-73. Unit Masks for CYCLES_IN_BGND_WITH_URG
Extension PMC.umask[19:16] Description
EQ0 b0000 Urgency = 0
LE1 b0001 Urgency <= 1
LE2 b0010 Urgency <= 2
LE3 b0011 Urgency <= 3
LE4 b0100 Urgency <= 4
LE5 b0101 Urgency <= 5
LE6 b0110 Urgency <= 6
LE7 b0111 Urgency <= 7
--- b1000-b1111 (* nothing will be counted*)

Performance Monitor Events
Intel® Itanium® Processor 9300 Series 127Reference Manual for Software Development and Optimization, March 2010
DATA_DEBUG_REGISTER_MATCHES• Title: Data Debug Register Matches Data Address of Memory References.• Category: System Events IAR/DAR/OPC: Y/Y/Y• Event Code: 0xc6, Max. Inc/Cyc: 1, MT Capture Type: A• Definition: Counts the number of times the data debug register matches the data
address of a memory reference. This is the OR function the 4 DBR matches. Registers DBR0-7, PSR, DCR, PMC13 affect this event. It does not include commits which means that it might have noise.
DATA_EAR_EVENTS• Title: L1 Data Cache EAR Events• Category: L1 Data Cache IAR/DAR/OPC: Y/Y/Y• Event Code: 0xc8, Max. Inc/Cyc: 1, MT Capture Type: F• Definition: Counts the number of L1 Data Cache or L1DTLB or ALAT events cap-
tured by EAR
DATA_REFERENCES_SET0• Title: Data Memory References Issued to Memory Pipeline• Category: L1 Data Cache/L1D Cache Set 0 IAR/DAR/OPC: Y/Y/Y• Event Code: 0xc3, Max. Inc/Cyc: 4, MT Capture Type: A• Definition: Counts the number of data memory references issued into memory
pipeline (includes check loads, uncacheable accesses, RSE operations, semaphores, and floating-point memory references). The count includes wrong path operations but excludes predicated off operations. This event does not include VHPT memory references.
• NOTE: This is a restricted set 0 L1D Cache event. In order to measure this event, one of the events in this set must be measured by PMD5.
DATA_REFERENCES_SET1• Title: Data Memory References Issued to Memory Pipeline• Category: L1 Data Cache/L1D Cache Set 1 IAR/DAR/OPC: Y/Y/Y• Event Code: 0xc5, Max. Inc/Cyc: 4, MT Capture Type: A• Definition: Counts the number of data memory references issued into memory
pipeline (includes check loads, uncacheable accesses, RSE operations, semaphores, and floating-point memory references). The count includes wrong path operations but excludes predicated off operations. This event does not include VHPT memory references.
• NOTE: This is a restricted set 1 L1D Cache event. In order to measure this event,one of the events in this set must be measured by PMD5.
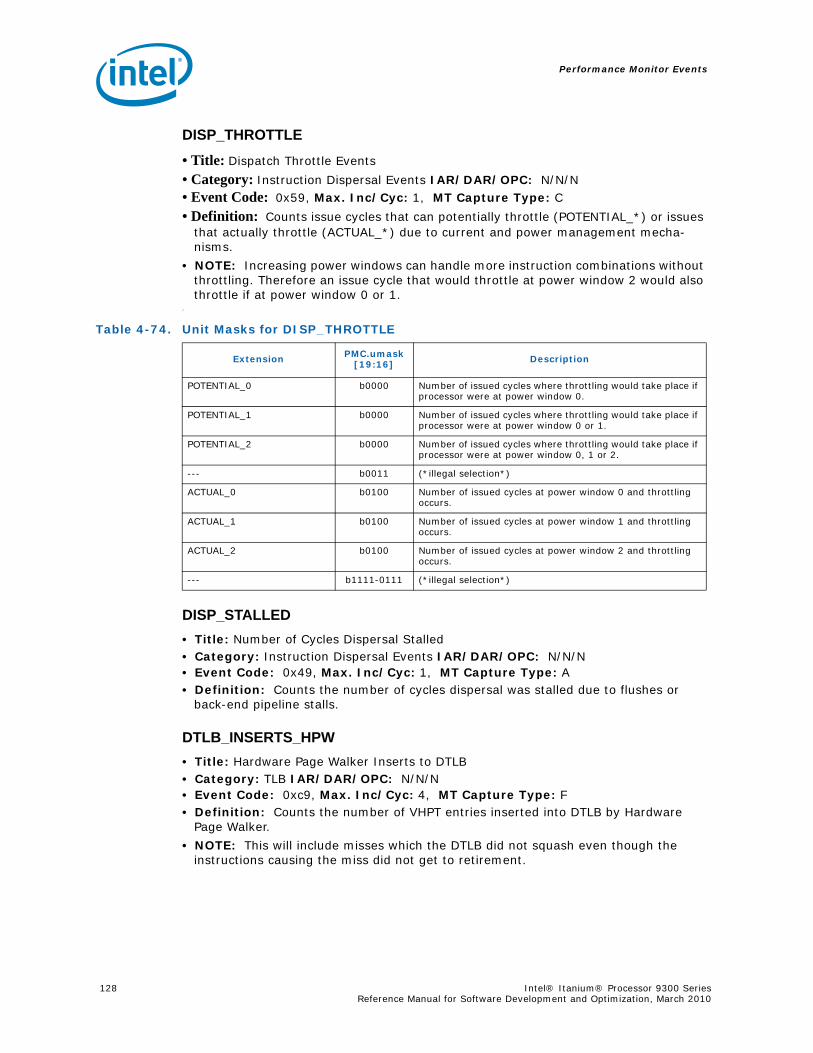
Performance Monitor Events
128 Intel® Itanium® Processor 9300 Series Reference Manual for Software Development and Optimization, March 2010
DISP_THROTTLE• Title: Dispatch Throttle Events
• Category: Instruction Dispersal Events IAR/DAR/OPC: N/N/N• Event Code: 0x59, Max. Inc/Cyc: 1, MT Capture Type: C
• Definition: Counts issue cycles that can potentially throttle (POTENTIAL_*) or issues that actually throttle (ACTUAL_*) due to current and power management mecha-nisms.
• NOTE: Increasing power windows can handle more instruction combinations without throttling. Therefore an issue cycle that would throttle at power window 2 would also throttle if at power window 0 or 1.
7
DISP_STALLED• Title: Number of Cycles Dispersal Stalled• Category: Instruction Dispersal Events IAR/DAR/OPC: N/N/N• Event Code: 0x49, Max. Inc/Cyc: 1, MT Capture Type: A• Definition: Counts the number of cycles dispersal was stalled due to flushes or
back-end pipeline stalls.
DTLB_INSERTS_HPW• Title: Hardware Page Walker Inserts to DTLB• Category: TLB IAR/DAR/OPC: N/N/N• Event Code: 0xc9, Max. Inc/Cyc: 4, MT Capture Type: F• Definition: Counts the number of VHPT entries inserted into DTLB by Hardware
Page Walker.
• NOTE: This will include misses which the DTLB did not squash even though the instructions causing the miss did not get to retirement.
Table 4-74. Unit Masks for DISP_THROTTLE
Extension PMC.umask[19:16] Description
POTENTIAL_0 b0000 Number of issued cycles where throttling would take place if processor were at power window 0.
POTENTIAL_1 b0000 Number of issued cycles where throttling would take place if processor were at power window 0 or 1.
POTENTIAL_2 b0000 Number of issued cycles where throttling would take place if processor were at power window 0, 1 or 2.
--- b0011 (*illegal selection*)
ACTUAL_0 b0100 Number of issued cycles at power window 0 and throttling occurs.
ACTUAL_1 b0100 Number of issued cycles at power window 1 and throttling occurs.
ACTUAL_2 b0100 Number of issued cycles at power window 2 and throttling occurs.
--- b1111-0111 (*illegal selection*)
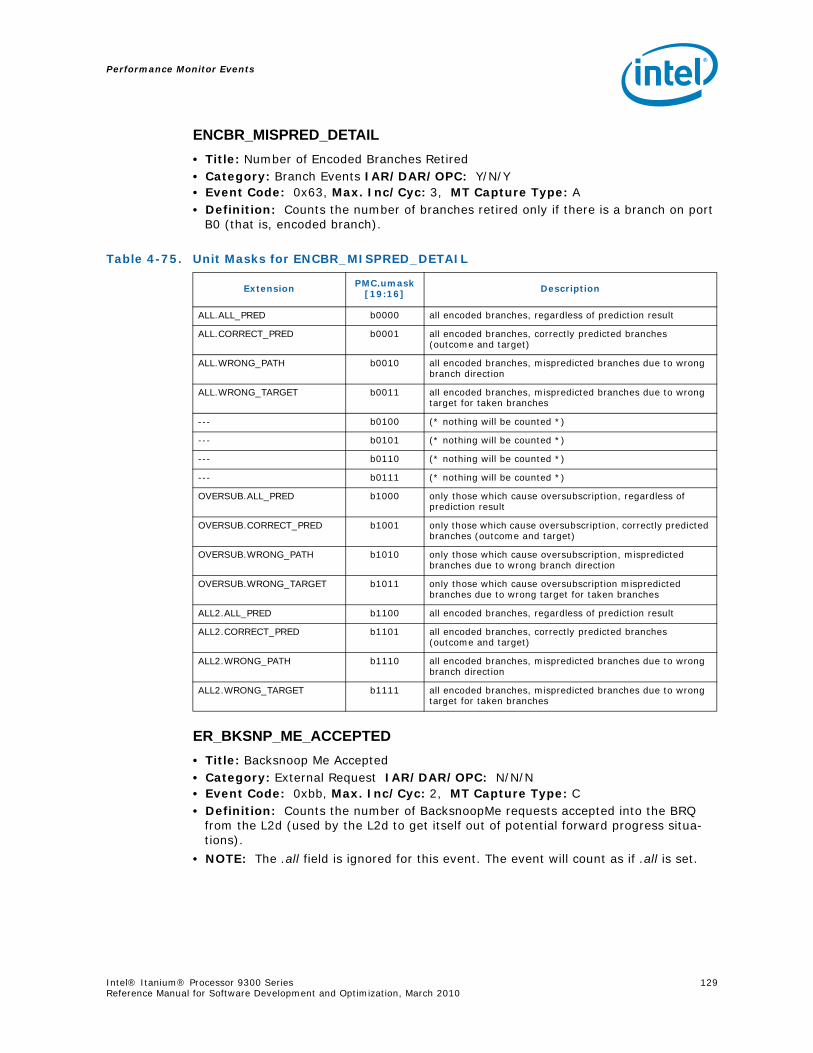
Performance Monitor Events
Intel® Itanium® Processor 9300 Series 129Reference Manual for Software Development and Optimization, March 2010
ENCBR_MISPRED_DETAIL• Title: Number of Encoded Branches Retired• Category: Branch Events IAR/DAR/OPC: Y/N/Y• Event Code: 0x63, Max. Inc/Cyc: 3, MT Capture Type: A• Definition: Counts the number of branches retired only if there is a branch on port
B0 (that is, encoded branch).
ER_BKSNP_ME_ACCEPTED• Title: Backsnoop Me Accepted• Category: External Request IAR/DAR/OPC: N/N/N• Event Code: 0xbb, Max. Inc/Cyc: 2, MT Capture Type: C• Definition: Counts the number of BacksnoopMe requests accepted into the BRQ
from the L2d (used by the L2d to get itself out of potential forward progress situa-tions).
• NOTE: The .all field is ignored for this event. The event will count as if .all is set.
Table 4-75. Unit Masks for ENCBR_MISPRED_DETAIL
Extension PMC.umask[19:16] Description
ALL.ALL_PRED b0000 all encoded branches, regardless of prediction result
ALL.CORRECT_PRED b0001 all encoded branches, correctly predicted branches (outcome and target)
ALL.WRONG_PATH b0010 all encoded branches, mispredicted branches due to wrong branch direction
ALL.WRONG_TARGET b0011 all encoded branches, mispredicted branches due to wrong target for taken branches
--- b0100 (* nothing will be counted *)
--- b0101 (* nothing will be counted *)
--- b0110 (* nothing will be counted *)
--- b0111 (* nothing will be counted *)
OVERSUB.ALL_PRED b1000 only those which cause oversubscription, regardless of prediction result
OVERSUB.CORRECT_PRED b1001 only those which cause oversubscription, correctly predicted branches (outcome and target)
OVERSUB.WRONG_PATH b1010 only those which cause oversubscription, mispredicted branches due to wrong branch direction
OVERSUB.WRONG_TARGET b1011 only those which cause oversubscription mispredicted branches due to wrong target for taken branches
ALL2.ALL_PRED b1100 all encoded branches, regardless of prediction result
ALL2.CORRECT_PRED b1101 all encoded branches, correctly predicted branches (outcome and target)
ALL2.WRONG_PATH b1110 all encoded branches, mispredicted branches due to wrong branch direction
ALL2.WRONG_TARGET b1111 all encoded branches, mispredicted branches due to wrong target for taken branches
Performance Monitor Events
130 Intel® Itanium® Processor 9300 Series Reference Manual for Software Development and Optimization, March 2010
ER_BRQ_LIVE_REQ_HI• Title: BRQ Live Requests (upper two bits)• Category: External Request IAR/DAR/OPC: N/N/N• Event Code: 0xb8, Max. Inc/Cyc: 2, MT Capture Type: C• Definition: Counts the number of live read requests in BRQ. The Intel® Itanium®
processor 9300 series can have a total of 16 per cycle. The upper 2 bits are stored in this counter (bits 4:3).
• NOTE: If a read request has an L2d victim, it is also entered in the BRQ (as write-back). This event will count 1 as long as a read or its victim is in BRQ (net effect is that due to an L2d victim, the life of read in BRQ is extended). The .all field is ignored for this event. The event will count as if .all is set.
ER_BRQ_LIVE_REQ_LO• Title: BRQ Live Requests (lower three bits)• Category: External Request IAR/DAR/OPC: N/N/N• Event Code: 0xb9, Max. Inc/Cyc: 7, MT Capture Type: C• Definition: Counts the number of live read requests in BRQ. The Intel® Itanium®
processor 9300 series can have a total of 16 per cycle. The lower 3 bits are stored in this counter (bits 2:0).
• NOTE: If a read request has an L2d victim, it is also entered in the BRQ (as write-back). This event will count 1 as long as a read or its victim is in BRQ (net effect is that due to an L2d victim, the life of read in BRQ is extended). The .all field is ignored for this event. The event will count as if .all is set.
ER_BRQ_LOCK• Title: BRQ Lock Events• Category: External Request IAR/DAR/OPC: N/N/N• Event Code: 0xbf, Max. Inc/Cyc: 1, MT Capture Type: N/A• Definition: Number of times BRQ had its request locked by receiving a cmp for a
BRQ read entry when there was a snoop active for the same 128B line in ER’s snoop queue.
• NOTE: The non-.all versions of this event attribute this event to the active thread (which is not necessarily the thread which had its request locked).
ER_BRQ_REQ_INSERTED• Title: BRQ Requests Inserted• Category: External Request IAR/DAR/OPC: N/N/N• Event Code: 0xba, Max. Inc/Cyc: 1, MT Capture Type: F• Definition: Counts the number of requests which are inserted into BRQ.
• NOTE: Entries made into BRQ due to L2d victims (caused by read, fc, cc) are not counted.
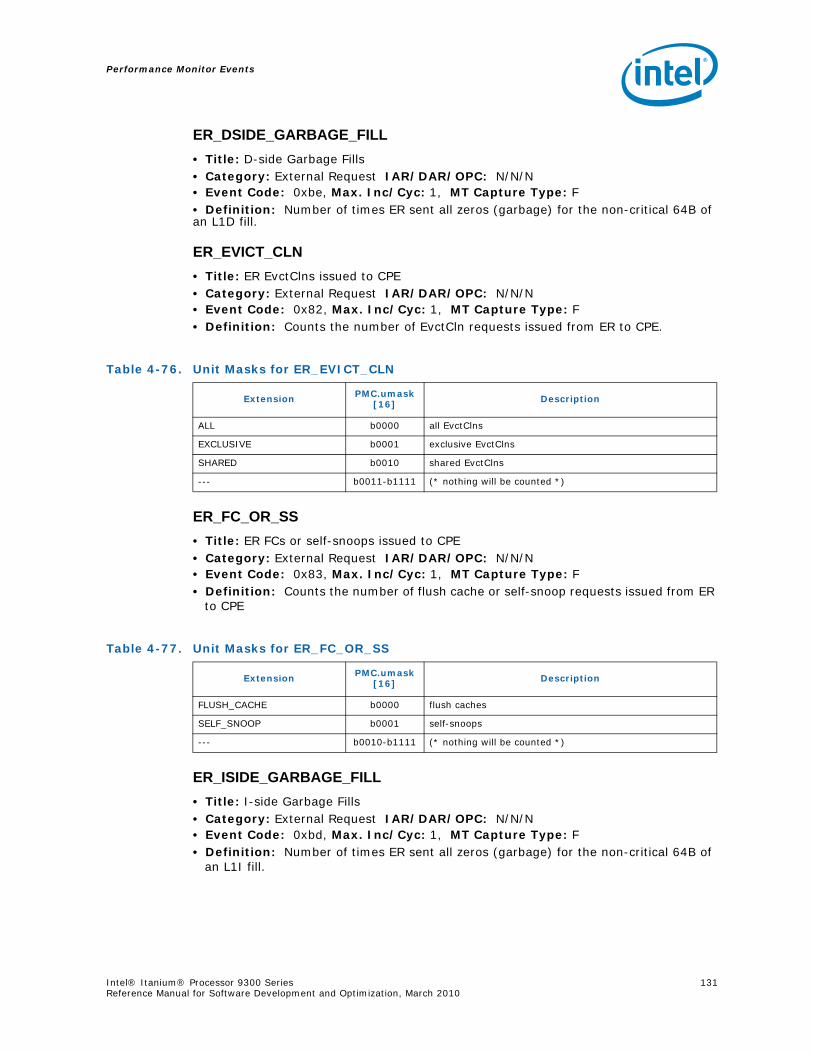
Performance Monitor Events
Intel® Itanium® Processor 9300 Series 131Reference Manual for Software Development and Optimization, March 2010
ER_DSIDE_GARBAGE_FILL• Title: D-side Garbage Fills• Category: External Request IAR/DAR/OPC: N/N/N• Event Code: 0xbe, Max. Inc/Cyc: 1, MT Capture Type: F• Definition: Number of times ER sent all zeros (garbage) for the non-critical 64B of an L1D fill.
ER_EVICT_CLN• Title: ER EvctClns issued to CPE• Category: External Request IAR/DAR/OPC: N/N/N• Event Code: 0x82, Max. Inc/Cyc: 1, MT Capture Type: F• Definition: Counts the number of EvctCln requests issued from ER to CPE.
ER_FC_OR_SS• Title: ER FCs or self-snoops issued to CPE• Category: External Request IAR/DAR/OPC: N/N/N• Event Code: 0x83, Max. Inc/Cyc: 1, MT Capture Type: F• Definition: Counts the number of flush cache or self-snoop requests issued from ER
to CPE
ER_ISIDE_GARBAGE_FILL• Title: I-side Garbage Fills• Category: External Request IAR/DAR/OPC: N/N/N• Event Code: 0xbd, Max. Inc/Cyc: 1, MT Capture Type: F• Definition: Number of times ER sent all zeros (garbage) for the non-critical 64B of
an L1I fill.
Table 4-76. Unit Masks for ER_EVICT_CLN
Extension PMC.umask[16] Description
ALL b0000 all EvctClns
EXCLUSIVE b0001 exclusive EvctClns
SHARED b0010 shared EvctClns
--- b0011-b1111 (* nothing will be counted *)
Table 4-77. Unit Masks for ER_FC_OR_SS
Extension PMC.umask[16] Description
FLUSH_CACHE b0000 flush caches
SELF_SNOOP b0001 self-snoops
--- b0010-b1111 (* nothing will be counted *)
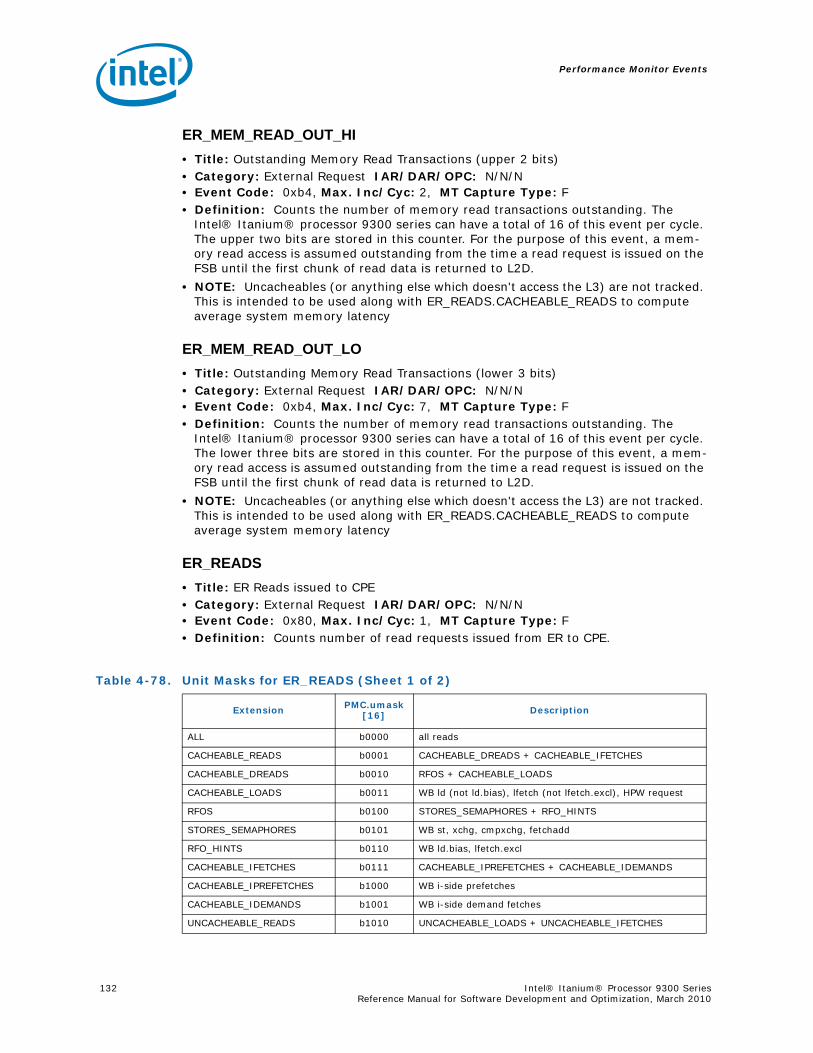
Performance Monitor Events
132 Intel® Itanium® Processor 9300 Series Reference Manual for Software Development and Optimization, March 2010
ER_MEM_READ_OUT_HI• Title: Outstanding Memory Read Transactions (upper 2 bits)• Category: External Request IAR/DAR/OPC: N/N/N• Event Code: 0xb4, Max. Inc/Cyc: 2, MT Capture Type: F• Definition: Counts the number of memory read transactions outstanding. The
Intel® Itanium® processor 9300 series can have a total of 16 of this event per cycle. The upper two bits are stored in this counter. For the purpose of this event, a mem-ory read access is assumed outstanding from the time a read request is issued on the FSB until the first chunk of read data is returned to L2D.
• NOTE: Uncacheables (or anything else which doesn't access the L3) are not tracked. This is intended to be used along with ER_READS.CACHEABLE_READS to compute average system memory latency
ER_MEM_READ_OUT_LO• Title: Outstanding Memory Read Transactions (lower 3 bits)• Category: External Request IAR/DAR/OPC: N/N/N• Event Code: 0xb4, Max. Inc/Cyc: 7, MT Capture Type: F• Definition: Counts the number of memory read transactions outstanding. The
Intel® Itanium® processor 9300 series can have a total of 16 of this event per cycle. The lower three bits are stored in this counter. For the purpose of this event, a mem-ory read access is assumed outstanding from the time a read request is issued on the FSB until the first chunk of read data is returned to L2D.
• NOTE: Uncacheables (or anything else which doesn't access the L3) are not tracked. This is intended to be used along with ER_READS.CACHEABLE_READS to compute average system memory latency
ER_READS• Title: ER Reads issued to CPE• Category: External Request IAR/DAR/OPC: N/N/N• Event Code: 0x80, Max. Inc/Cyc: 1, MT Capture Type: F• Definition: Counts number of read requests issued from ER to CPE.
Table 4-78. Unit Masks for ER_READS (Sheet 1 of 2)
Extension PMC.umask[16] Description
ALL b0000 all reads
CACHEABLE_READS b0001 CACHEABLE_DREADS + CACHEABLE_IFETCHES
CACHEABLE_DREADS b0010 RFOS + CACHEABLE_LOADS
CACHEABLE_LOADS b0011 WB ld (not ld.bias), lfetch (not lfetch.excl), HPW request
RFOS b0100 STORES_SEMAPHORES + RFO_HINTS
STORES_SEMAPHORES b0101 WB st, xchg, cmpxchg, fetchadd
RFO_HINTS b0110 WB ld.bias, lfetch.excl
CACHEABLE_IFETCHES b0111 CACHEABLE_IPREFETCHES + CACHEABLE_IDEMANDS
CACHEABLE_IPREFETCHES b1000 WB i-side prefetches
CACHEABLE_IDEMANDS b1001 WB i-side demand fetches
UNCACHEABLE_READS b1010 UNCACHEABLE_LOADS + UNCACHEABLE_IFETCHES
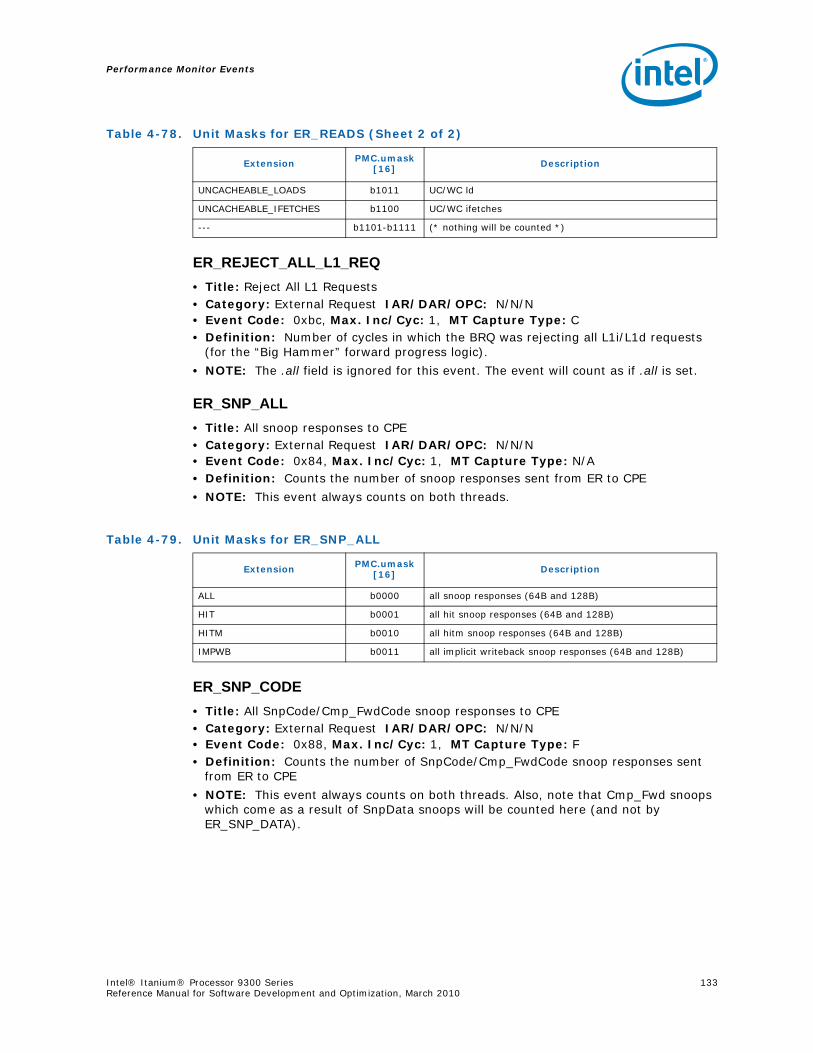
Performance Monitor Events
Intel® Itanium® Processor 9300 Series 133Reference Manual for Software Development and Optimization, March 2010
ER_REJECT_ALL_L1_REQ• Title: Reject All L1 Requests• Category: External Request IAR/DAR/OPC: N/N/N• Event Code: 0xbc, Max. Inc/Cyc: 1, MT Capture Type: C• Definition: Number of cycles in which the BRQ was rejecting all L1i/L1d requests
(for the “Big Hammer” forward progress logic).
• NOTE: The .all field is ignored for this event. The event will count as if .all is set.
ER_SNP_ALL• Title: All snoop responses to CPE• Category: External Request IAR/DAR/OPC: N/N/N• Event Code: 0x84, Max. Inc/Cyc: 1, MT Capture Type: N/A• Definition: Counts the number of snoop responses sent from ER to CPE
• NOTE: This event always counts on both threads.
ER_SNP_CODE• Title: All SnpCode/Cmp_FwdCode snoop responses to CPE• Category: External Request IAR/DAR/OPC: N/N/N• Event Code: 0x88, Max. Inc/Cyc: 1, MT Capture Type: F• Definition: Counts the number of SnpCode/Cmp_FwdCode snoop responses sent
from ER to CPE
• NOTE: This event always counts on both threads. Also, note that Cmp_Fwd snoops which come as a result of SnpData snoops will be counted here (and not by ER_SNP_DATA).
UNCACHEABLE_LOADS b1011 UC/WC ld
UNCACHEABLE_IFETCHES b1100 UC/WC ifetches
--- b1101-b1111 (* nothing will be counted *)
Table 4-78. Unit Masks for ER_READS (Sheet 2 of 2)
Extension PMC.umask[16] Description
Table 4-79. Unit Masks for ER_SNP_ALL
Extension PMC.umask[16] Description
ALL b0000 all snoop responses (64B and 128B)
HIT b0001 all hit snoop responses (64B and 128B)
HITM b0010 all hitm snoop responses (64B and 128B)
IMPWB b0011 all implicit writeback snoop responses (64B and 128B)

Performance Monitor Events
134 Intel® Itanium® Processor 9300 Series Reference Manual for Software Development and Optimization, March 2010
ER_SNP_DATA• Title: All SnpData snoop responses to CPE• Category: External Request IAR/DAR/OPC: N/N/N• Event Code: 0x85, Max. Inc/Cyc: 1, MT Capture Type: F• Definition: Counts the number of snoop responses to SnpData snoops sent from ER
to CPE
• NOTE: This event always counts on both threads. Also, note that Cmp_Fwd snoops which come as a result of SnpData snoops will not be counted here (they will be counted by ER_SNP_CODE).
ER_SNP_INV• Title: All SnpInv*/Cmp_FwdInv* snoop responses to CPE• Category: External Request IAR/DAR/OPC: N/N/N• Event Code: 0x86, Max. Inc/Cyc: 1, MT Capture Type: F• Definition: Counts the number of SnpInv*/Cmp_FwdInv* snoop responses sent
from ER to CPE
• NOTE: This event always counts on both threads.
Table 4-80. Unit Masks for ER_SNP_CODE
Extension PMC.umask[16] Description
ALL b0000 all snoop responses (64B and 128B)
HIT b0001 all hit snoop responses (64B and 128B)
HITM b0010 all hitm snoop responses (64B and 128B)
IMPWB b0011 all implicit writeback snoop responses (64B and 128B)
64B b0100 all 64B snoop responses
64B_HIT b0101 all 64B hit snoop responses
64B_HITM b0110 all 64B hitm snoop responses
64B_IMPWB b0111 all 64B implicit writeback snoop responses
Table 4-81. Unit Masks for ER_SNP_DATA
Extension PMC.umask[16] Description
ALL b0000 all snoop responses (64B and 128B)
HIT b0001 all hit snoop responses (64B and 128B)
HITM b0010 all hitm snoop responses (64B and 128B)
IMPWB b0011 all implicit writeback snoop responses (64B and 128B)
64B b0100 all 64B snoop responses
64B_HIT b0101 all 64B hit snoop responses
64B_HITM b0110 all 64B hitm snoop responses
64B_IMPWB b0111 all 64B implicit writeback snoop responses
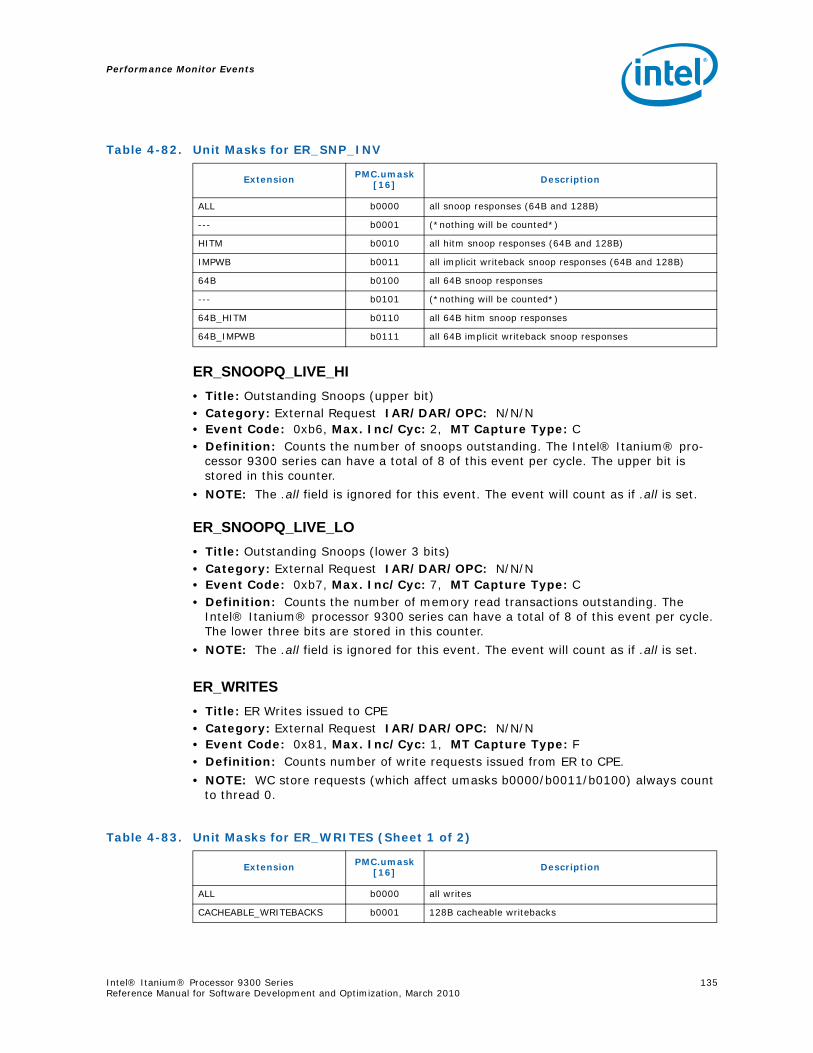
Performance Monitor Events
Intel® Itanium® Processor 9300 Series 135Reference Manual for Software Development and Optimization, March 2010
ER_SNOOPQ_LIVE_HI• Title: Outstanding Snoops (upper bit)• Category: External Request IAR/DAR/OPC: N/N/N• Event Code: 0xb6, Max. Inc/Cyc: 2, MT Capture Type: C• Definition: Counts the number of snoops outstanding. The Intel® Itanium® pro-
cessor 9300 series can have a total of 8 of this event per cycle. The upper bit is stored in this counter.
• NOTE: The .all field is ignored for this event. The event will count as if .all is set.
ER_SNOOPQ_LIVE_LO• Title: Outstanding Snoops (lower 3 bits)• Category: External Request IAR/DAR/OPC: N/N/N• Event Code: 0xb7, Max. Inc/Cyc: 7, MT Capture Type: C• Definition: Counts the number of memory read transactions outstanding. The
Intel® Itanium® processor 9300 series can have a total of 8 of this event per cycle. The lower three bits are stored in this counter.
• NOTE: The .all field is ignored for this event. The event will count as if .all is set.
ER_WRITES• Title: ER Writes issued to CPE• Category: External Request IAR/DAR/OPC: N/N/N• Event Code: 0x81, Max. Inc/Cyc: 1, MT Capture Type: F• Definition: Counts number of write requests issued from ER to CPE.
• NOTE: WC store requests (which affect umasks b0000/b0011/b0100) always count to thread 0.
Table 4-82. Unit Masks for ER_SNP_INV
Extension PMC.umask[16] Description
ALL b0000 all snoop responses (64B and 128B)
--- b0001 (*nothing will be counted*)
HITM b0010 all hitm snoop responses (64B and 128B)
IMPWB b0011 all implicit writeback snoop responses (64B and 128B)
64B b0100 all 64B snoop responses
--- b0101 (*nothing will be counted*)
64B_HITM b0110 all 64B hitm snoop responses
64B_IMPWB b0111 all 64B implicit writeback snoop responses
Table 4-83. Unit Masks for ER_WRITES (Sheet 1 of 2)
Extension PMC.umask[16] Description
ALL b0000 all writes
CACHEABLE_WRITEBACKS b0001 128B cacheable writebacks

Performance Monitor Events
136 Intel® Itanium® Processor 9300 Series Reference Manual for Software Development and Optimization, March 2010
ETB_EVENT• Title: Execution Trace Buffer Event Captured• Category: Branch Events IAR/DAR/OPC: Y/N/Y• Event Code: 0x11, Max. Inc/Cyc: 1, MT Capture Type: A• Definition: Counts the number of entries captured in Execution Trace Buffer. Please
see Section 3.3.10.1.1 and Section 3.3.10.2 for more information. Entries captured are subject to the constraints programmed to PMC39.
FE_BUBBLE
• Title: Bubbles Seen by FE
• Category: Stall Events IAR/DAR/OPC: N/N/N• Event Code: 0x71, Max. Inc/Cyc: 1, MT Capture Type: A
• Definition: Counts the number of bubbles seen by front-end. This event is another way of looking at the FE_LOST_BW event.
Causes for stall are prioritized in the following order from high to low for this event: FEFLUSH, TLBMISS, IMISS, BRANCH, FILL_RECIRC, BUBBLE, IBFULL. The prioritiza-tion implies that when several stall conditions exist at the same time, only the high-est priority one will be counted.
UNCACHEABLE_WRITEBACKS b0010 UC writes
64B_WC_STORES b0011 64B WC stores
PARTIAL_WC_STORES b0100 sub-64B WC stores
64B_CACHEABLE_WRITEBACKS
b0101 64B cacheable writebacks (caused by v64)
Table 4-83. Unit Masks for ER_WRITES (Sheet 2 of 2)
Extension PMC.umask[16] Description
Table 4-84. Unit Masks for FE_BUBBLE (Sheet 1 of 2)
Extension PMC.umask[19:16] Description
ALL b0000 count regardless of cause
FEFLUSH b0001 only if caused by a front-end flush
--- b0010 (*illegal selection*)
--- b0011 (*illegal selection*)
GROUP2 b0100 IMISS or TLBMISS
IBFULL b0101 only if caused by instruction buffer full stall
IMISS b0110 only if caused by instruction cache miss stall
TLBMISS b0111 only if caused by TLB stall
FILL_RECIRC b1000 only if caused by a recirculate for a fill operation
BRANCH b1001 only if caused by any of 4 branch recirculates
GROUP3 b1010 FILL_RECIRC or BRANCH
ALLBUT_FEFLUSH_BUBBLE b1011 ALL except FEFLUSH and BUBBLE
ALLBUT_IBFULL b1100 ALL except IBFULL
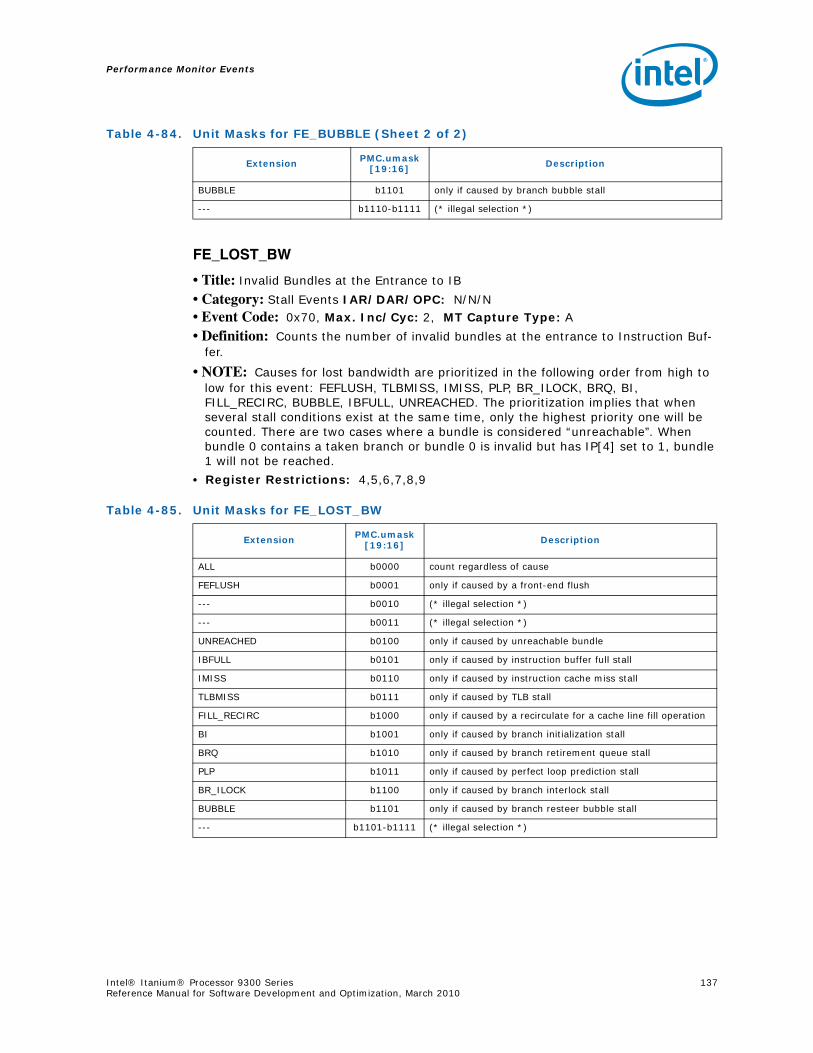
Performance Monitor Events
Intel® Itanium® Processor 9300 Series 137Reference Manual for Software Development and Optimization, March 2010
FE_LOST_BW
• Title: Invalid Bundles at the Entrance to IB
• Category: Stall Events IAR/DAR/OPC: N/N/N• Event Code: 0x70, Max. Inc/Cyc: 2, MT Capture Type: A
• Definition: Counts the number of invalid bundles at the entrance to Instruction Buf-fer.
• NOTE: Causes for lost bandwidth are prioritized in the following order from high to low for this event: FEFLUSH, TLBMISS, IMISS, PLP, BR_ILOCK, BRQ, BI, FILL_RECIRC, BUBBLE, IBFULL, UNREACHED. The prioritization implies that when several stall conditions exist at the same time, only the highest priority one will be counted. There are two cases where a bundle is considered “unreachable”. When bundle 0 contains a taken branch or bundle 0 is invalid but has IP[4] set to 1, bundle 1 will not be reached.
• Register Restrictions: 4,5,6,7,8,9
BUBBLE b1101 only if caused by branch bubble stall
--- b1110-b1111 (* illegal selection *)
Table 4-84. Unit Masks for FE_BUBBLE (Sheet 2 of 2)
Extension PMC.umask[19:16] Description
Table 4-85. Unit Masks for FE_LOST_BW
Extension PMC.umask[19:16] Description
ALL b0000 count regardless of cause
FEFLUSH b0001 only if caused by a front-end flush
--- b0010 (* illegal selection *)
--- b0011 (* illegal selection *)
UNREACHED b0100 only if caused by unreachable bundle
IBFULL b0101 only if caused by instruction buffer full stall
IMISS b0110 only if caused by instruction cache miss stall
TLBMISS b0111 only if caused by TLB stall
FILL_RECIRC b1000 only if caused by a recirculate for a cache line fill operation
BI b1001 only if caused by branch initialization stall
BRQ b1010 only if caused by branch retirement queue stall
PLP b1011 only if caused by perfect loop prediction stall
BR_ILOCK b1100 only if caused by branch interlock stall
BUBBLE b1101 only if caused by branch resteer bubble stall
--- b1101-b1111 (* illegal selection *)
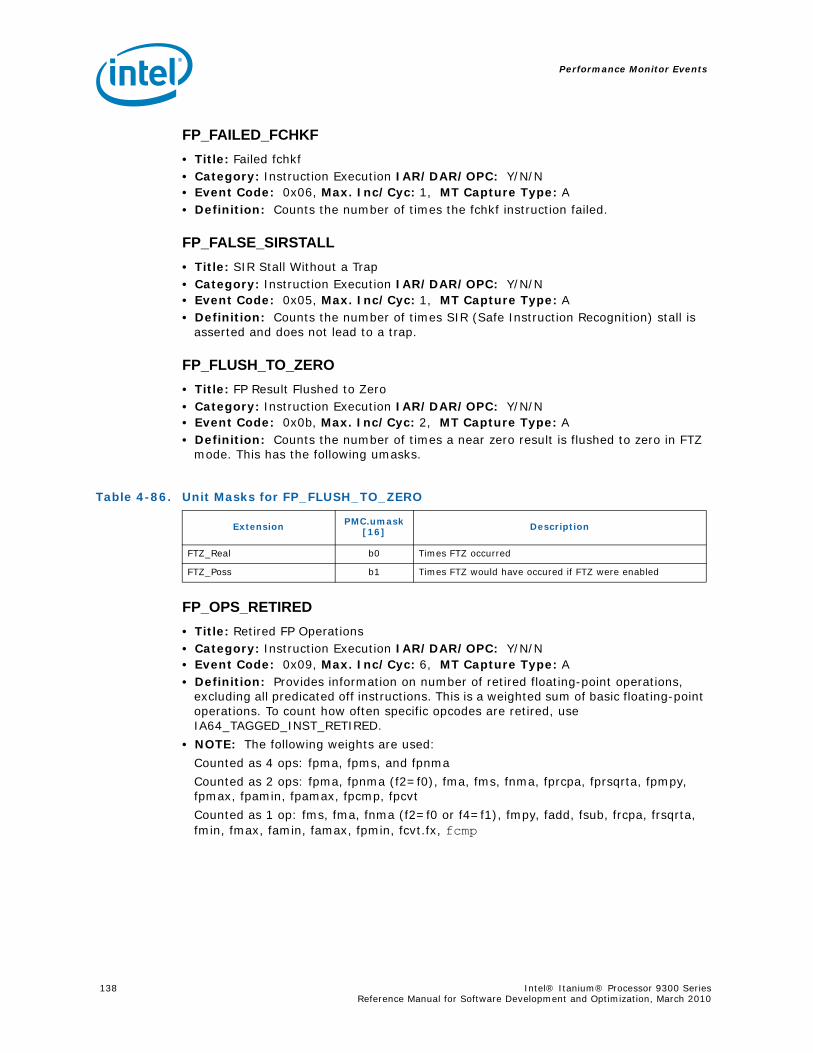
Performance Monitor Events
138 Intel® Itanium® Processor 9300 Series Reference Manual for Software Development and Optimization, March 2010
FP_FAILED_FCHKF• Title: Failed fchkf• Category: Instruction Execution IAR/DAR/OPC: Y/N/N• Event Code: 0x06, Max. Inc/Cyc: 1, MT Capture Type: A• Definition: Counts the number of times the fchkf instruction failed.
FP_FALSE_SIRSTALL• Title: SIR Stall Without a Trap• Category: Instruction Execution IAR/DAR/OPC: Y/N/N• Event Code: 0x05, Max. Inc/Cyc: 1, MT Capture Type: A• Definition: Counts the number of times SIR (Safe Instruction Recognition) stall is
asserted and does not lead to a trap.
FP_FLUSH_TO_ZERO• Title: FP Result Flushed to Zero• Category: Instruction Execution IAR/DAR/OPC: Y/N/N• Event Code: 0x0b, Max. Inc/Cyc: 2, MT Capture Type: A• Definition: Counts the number of times a near zero result is flushed to zero in FTZ
mode. This has the following umasks.
FP_OPS_RETIRED• Title: Retired FP Operations• Category: Instruction Execution IAR/DAR/OPC: Y/N/N• Event Code: 0x09, Max. Inc/Cyc: 6, MT Capture Type: A• Definition: Provides information on number of retired floating-point operations,
excluding all predicated off instructions. This is a weighted sum of basic floating-point operations. To count how often specific opcodes are retired, use IA64_TAGGED_INST_RETIRED.
• NOTE: The following weights are used:
Counted as 4 ops: fpma, fpms, and fpnma
Counted as 2 ops: fpma, fpnma (f2=f0), fma, fms, fnma, fprcpa, fprsqrta, fpmpy, fpmax, fpamin, fpamax, fpcmp, fpcvt
Counted as 1 op: fms, fma, fnma (f2=f0 or f4=f1), fmpy, fadd, fsub, frcpa, frsqrta, fmin, fmax, famin, famax, fpmin, fcvt.fx, fcmp
Table 4-86. Unit Masks for FP_FLUSH_TO_ZERO
Extension PMC.umask[16] Description
FTZ_Real b0 Times FTZ occurred
FTZ_Poss b1 Times FTZ would have occured if FTZ were enabled
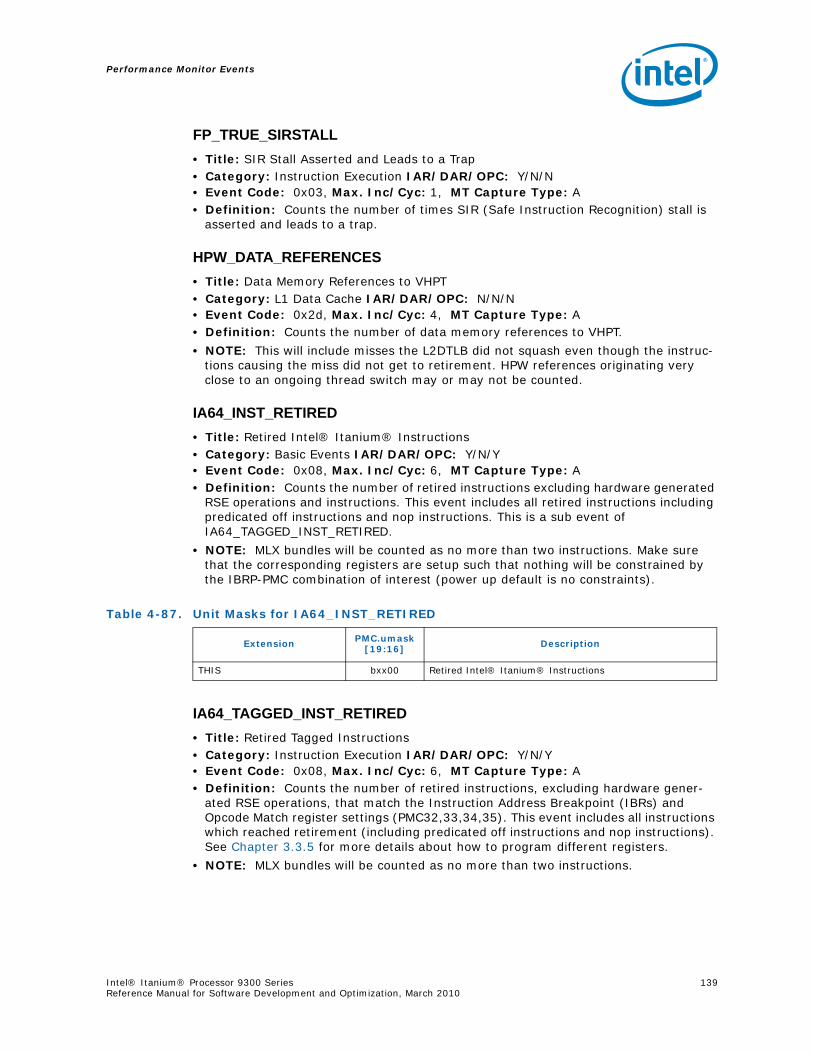
Performance Monitor Events
Intel® Itanium® Processor 9300 Series 139Reference Manual for Software Development and Optimization, March 2010
FP_TRUE_SIRSTALL• Title: SIR Stall Asserted and Leads to a Trap• Category: Instruction Execution IAR/DAR/OPC: Y/N/N• Event Code: 0x03, Max. Inc/Cyc: 1, MT Capture Type: A• Definition: Counts the number of times SIR (Safe Instruction Recognition) stall is
asserted and leads to a trap.
HPW_DATA_REFERENCES• Title: Data Memory References to VHPT• Category: L1 Data Cache IAR/DAR/OPC: N/N/N• Event Code: 0x2d, Max. Inc/Cyc: 4, MT Capture Type: A• Definition: Counts the number of data memory references to VHPT.
• NOTE: This will include misses the L2DTLB did not squash even though the instruc-tions causing the miss did not get to retirement. HPW references originating very close to an ongoing thread switch may or may not be counted.
IA64_INST_RETIRED• Title: Retired Intel® Itanium® Instructions• Category: Basic Events IAR/DAR/OPC: Y/N/Y• Event Code: 0x08, Max. Inc/Cyc: 6, MT Capture Type: A• Definition: Counts the number of retired instructions excluding hardware generated
RSE operations and instructions. This event includes all retired instructions including predicated off instructions and nop instructions. This is a sub event of IA64_TAGGED_INST_RETIRED.
• NOTE: MLX bundles will be counted as no more than two instructions. Make sure that the corresponding registers are setup such that nothing will be constrained by the IBRP-PMC combination of interest (power up default is no constraints).
IA64_TAGGED_INST_RETIRED• Title: Retired Tagged Instructions• Category: Instruction Execution IAR/DAR/OPC: Y/N/Y• Event Code: 0x08, Max. Inc/Cyc: 6, MT Capture Type: A• Definition: Counts the number of retired instructions, excluding hardware gener-
ated RSE operations, that match the Instruction Address Breakpoint (IBRs) and Opcode Match register settings (PMC32,33,34,35). This event includes all instructions which reached retirement (including predicated off instructions and nop instructions). See Chapter 3.3.5 for more details about how to program different registers.
• NOTE: MLX bundles will be counted as no more than two instructions.
Table 4-87. Unit Masks for IA64_INST_RETIRED
Extension PMC.umask[19:16] Description
THIS bxx00 Retired Intel® Itanium® Instructions
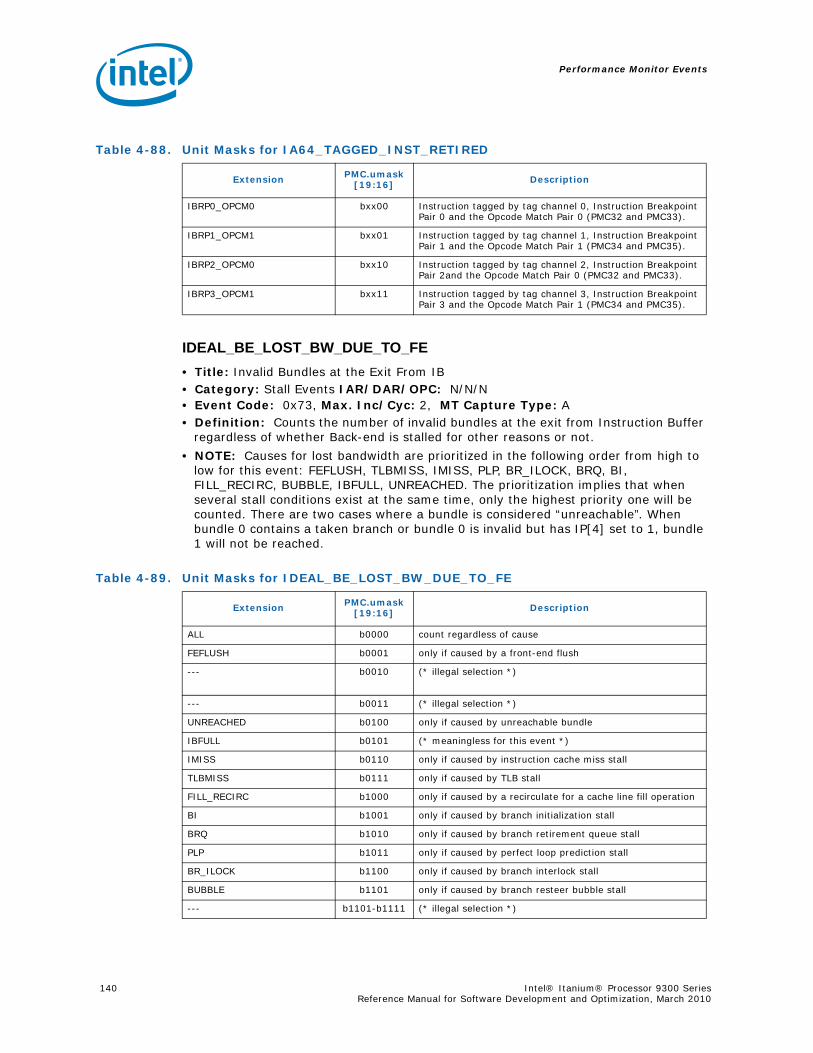
Performance Monitor Events
140 Intel® Itanium® Processor 9300 Series Reference Manual for Software Development and Optimization, March 2010
IDEAL_BE_LOST_BW_DUE_TO_FE• Title: Invalid Bundles at the Exit From IB• Category: Stall Events IAR/DAR/OPC: N/N/N• Event Code: 0x73, Max. Inc/Cyc: 2, MT Capture Type: A• Definition: Counts the number of invalid bundles at the exit from Instruction Buffer
regardless of whether Back-end is stalled for other reasons or not.
• NOTE: Causes for lost bandwidth are prioritized in the following order from high to low for this event: FEFLUSH, TLBMISS, IMISS, PLP, BR_ILOCK, BRQ, BI, FILL_RECIRC, BUBBLE, IBFULL, UNREACHED. The prioritization implies that when several stall conditions exist at the same time, only the highest priority one will be counted. There are two cases where a bundle is considered “unreachable”. When bundle 0 contains a taken branch or bundle 0 is invalid but has IP[4] set to 1, bundle 1 will not be reached.
Table 4-88. Unit Masks for IA64_TAGGED_INST_RETIRED
Extension PMC.umask[19:16] Description
IBRP0_OPCM0 bxx00 Instruction tagged by tag channel 0, Instruction Breakpoint Pair 0 and the Opcode Match Pair 0 (PMC32 and PMC33).
IBRP1_OPCM1 bxx01 Instruction tagged by tag channel 1, Instruction Breakpoint Pair 1 and the Opcode Match Pair 1 (PMC34 and PMC35).
IBRP2_OPCM0 bxx10 Instruction tagged by tag channel 2, Instruction Breakpoint Pair 2and the Opcode Match Pair 0 (PMC32 and PMC33).
IBRP3_OPCM1 bxx11 Instruction tagged by tag channel 3, Instruction Breakpoint Pair 3 and the Opcode Match Pair 1 (PMC34 and PMC35).
Table 4-89. Unit Masks for IDEAL_BE_LOST_BW_DUE_TO_FE
Extension PMC.umask[19:16] Description
ALL b0000 count regardless of cause
FEFLUSH b0001 only if caused by a front-end flush
--- b0010 (* illegal selection *)
--- b0011 (* illegal selection *)
UNREACHED b0100 only if caused by unreachable bundle
IBFULL b0101 (* meaningless for this event *)
IMISS b0110 only if caused by instruction cache miss stall
TLBMISS b0111 only if caused by TLB stall
FILL_RECIRC b1000 only if caused by a recirculate for a cache line fill operation
BI b1001 only if caused by branch initialization stall
BRQ b1010 only if caused by branch retirement queue stall
PLP b1011 only if caused by perfect loop prediction stall
BR_ILOCK b1100 only if caused by branch interlock stall
BUBBLE b1101 only if caused by branch resteer bubble stall
--- b1101-b1111 (* illegal selection *)
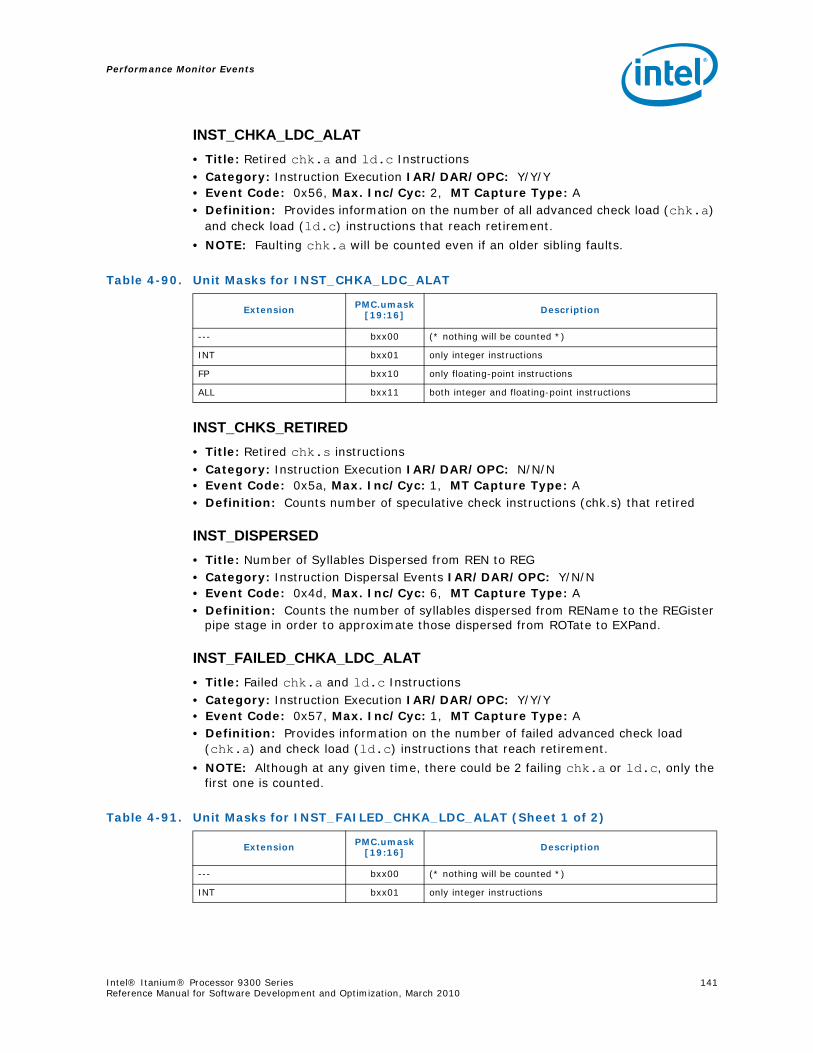
Performance Monitor Events
Intel® Itanium® Processor 9300 Series 141Reference Manual for Software Development and Optimization, March 2010
INST_CHKA_LDC_ALAT• Title: Retired chk.a and ld.c Instructions• Category: Instruction Execution IAR/DAR/OPC: Y/Y/Y• Event Code: 0x56, Max. Inc/Cyc: 2, MT Capture Type: A• Definition: Provides information on the number of all advanced check load (chk.a)
and check load (ld.c) instructions that reach retirement.
• NOTE: Faulting chk.a will be counted even if an older sibling faults.
INST_CHKS_RETIRED• Title: Retired chk.s instructions• Category: Instruction Execution IAR/DAR/OPC: N/N/N• Event Code: 0x5a, Max. Inc/Cyc: 1, MT Capture Type: A• Definition: Counts number of speculative check instructions (chk.s) that retired
INST_DISPERSED• Title: Number of Syllables Dispersed from REN to REG• Category: Instruction Dispersal Events IAR/DAR/OPC: Y/N/N• Event Code: 0x4d, Max. Inc/Cyc: 6, MT Capture Type: A• Definition: Counts the number of syllables dispersed from REName to the REGister
pipe stage in order to approximate those dispersed from ROTate to EXPand.
INST_FAILED_CHKA_LDC_ALAT• Title: Failed chk.a and ld.c Instructions• Category: Instruction Execution IAR/DAR/OPC: Y/Y/Y• Event Code: 0x57, Max. Inc/Cyc: 1, MT Capture Type: A• Definition: Provides information on the number of failed advanced check load
(chk.a) and check load (ld.c) instructions that reach retirement.
• NOTE: Although at any given time, there could be 2 failing chk.a or ld.c, only the first one is counted.
Table 4-90. Unit Masks for INST_CHKA_LDC_ALAT
Extension PMC.umask[19:16] Description
--- bxx00 (* nothing will be counted *)
INT bxx01 only integer instructions
FP bxx10 only floating-point instructions
ALL bxx11 both integer and floating-point instructions
Table 4-91. Unit Masks for INST_FAILED_CHKA_LDC_ALAT (Sheet 1 of 2)
Extension PMC.umask[19:16] Description
--- bxx00 (* nothing will be counted *)
INT bxx01 only integer instructions
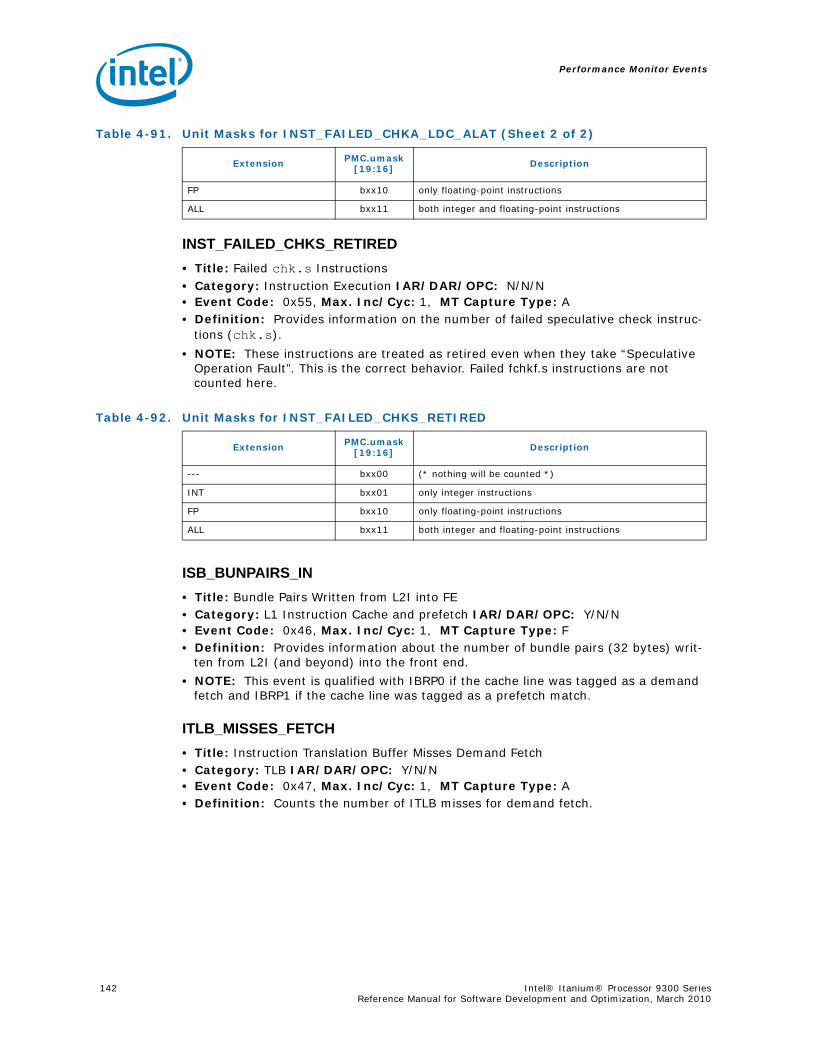
Performance Monitor Events
142 Intel® Itanium® Processor 9300 Series Reference Manual for Software Development and Optimization, March 2010
INST_FAILED_CHKS_RETIRED• Title: Failed chk.s Instructions• Category: Instruction Execution IAR/DAR/OPC: N/N/N• Event Code: 0x55, Max. Inc/Cyc: 1, MT Capture Type: A• Definition: Provides information on the number of failed speculative check instruc-
tions (chk.s).
• NOTE: These instructions are treated as retired even when they take “Speculative Operation Fault”. This is the correct behavior. Failed fchkf.s instructions are not counted here.
ISB_BUNPAIRS_IN• Title: Bundle Pairs Written from L2I into FE• Category: L1 Instruction Cache and prefetch IAR/DAR/OPC: Y/N/N• Event Code: 0x46, Max. Inc/Cyc: 1, MT Capture Type: F• Definition: Provides information about the number of bundle pairs (32 bytes) writ-
ten from L2I (and beyond) into the front end.
• NOTE: This event is qualified with IBRP0 if the cache line was tagged as a demand fetch and IBRP1 if the cache line was tagged as a prefetch match.
ITLB_MISSES_FETCH• Title: Instruction Translation Buffer Misses Demand Fetch• Category: TLB IAR/DAR/OPC: Y/N/N• Event Code: 0x47, Max. Inc/Cyc: 1, MT Capture Type: A• Definition: Counts the number of ITLB misses for demand fetch.
FP bxx10 only floating-point instructions
ALL bxx11 both integer and floating-point instructions
Table 4-91. Unit Masks for INST_FAILED_CHKA_LDC_ALAT (Sheet 2 of 2)
Extension PMC.umask[19:16] Description
Table 4-92. Unit Masks for INST_FAILED_CHKS_RETIRED
Extension PMC.umask[19:16] Description
--- bxx00 (* nothing will be counted *)
INT bxx01 only integer instructions
FP bxx10 only floating-point instructions
ALL bxx11 both integer and floating-point instructions

Performance Monitor Events
Intel® Itanium® Processor 9300 Series 143Reference Manual for Software Development and Optimization, March 2010
IVA_EVENT• Title: IVA Based Interrupts Taken to a Pre-programmed IVA Offset• Category: System event IAR/DAR/OPC: N/N/N• Event Code: 0x14, Max. Inc/Cyc: 1, MT Capture Type: A• Definition: Increments when IVA based interrupt to a pre-programmed IVA offset is
taken. IVA offset is programmed using PMC43.
L1DTLB_TRANSFER• Title: L1DTLB Misses that Hit in the L2DTLB for Accesses Counted in L1D_READS• Category: TLB/L1D Cache Set 0 IAR/DAR/OPC: Y/Y/Y• Event Code: 0xc0, Max. Inc/Cyc: 1, MT Capture Type: A• Definition: Counts the number of times an L1DTLB miss hits in the L2DTLB for an
access counted in L1D_READS.
• NOTE: This is a restricted set 0 L1D Cache event. In order to measure this event, one of the events in this set must be measured by PMD5. In code sequence a;;b if “a” takes an exception and “b” requires an L2DTLB->L1DTLB transfer, the transfer is per-formed but not counted in this event. This is necessary to remain consistent with L1D_READS which will not count “b” because it is not reached. If thread switch occurs in the middle of DET stall while a transfer is pending, this event won’t be counted.
L1D_READS_SET0• Title: L1 Data Cache Reads (Set 0)• Category: L1 Data Cache/L1D Cache Set 0 IAR/DAR/OPC: Y/Y/Y• Event Code: 0xc2, Max. Inc/Cyc: 2, MT Capture Type: A• Definition: Counts the number of data memory read references issued into memory
pipeline which are serviced by L1D (only integer loads), RSE loads, L1-hinted loads (L1D returns data if it hits in L1D but does not do a fill) and check loads (ld.c). Uncacheable reads, VHPT loads, semaphores, floating-point loads, and lfetch instructions are not counted here because L1D does not handle these. The count includes wrong path operations but excludes predicated off operations.
• NOTE: This is a restricted set 0 L1D Cache event. In order to measure this event, one of the events in this set must be measured by PMD5. Only ports 0 and 1 are measured.
Table 4-93. Unit Masks for ITLB_MISSES_FETCH
Extension PMC.umask[19:16] Description
--- bxx00 (* nothing will be counted *)
L1ITLB bxx01 All misses in L1ITLB will be counted. even if L1ITLB is not updated for an access (Uncacheable/nat page/not present page/faulting/some flushed), it will be counted here.
L2ITLB bxx10 All misses in L1ITLB which also missed in L2ITLB will be counted.
ALL bxx11 All tlb misses will be counted. Note that this is not equal to sum of the L1ITLB and L2ITLB umasks because any access could be a miss in L1ITLB and L2ITLB.

Performance Monitor Events
144 Intel® Itanium® Processor 9300 Series Reference Manual for Software Development and Optimization, March 2010
L1D_READS_SET1• Title: L1 Data Cache Reads (Set 1)• Category: L1 Data Cache/L1D Cache Set 1 IAR/DAR/OPC: Y/Y/Y• Event Code: 0xc4, Max. Inc/Cyc: 2, MT Capture Type: A• Definition: Counts the number of data memory read references issued into memory
pipeline which are serviced by L1D (only integer loads), RSE loads, L1-hinted loads (L1D returns data if it hits in L1D but does not do a fill) and check loads (ld.c). Uncacheable reads, VHPT loads, semaphores, floating-point loads and lfetch instructions are not counted here because L1D does not handle these. The count includes wrong path operations but excludes predicated off operations.
• NOTE: This is a restricted set 1 L1D Cache event. In order to measure this event, one of the events in this set must be measured by PMD5. Only ports 0 and 1 are measured.
L1D_READ_MISSES• Title: L1 Data Cache Read Misses• Category: L1 Data Cache/L1D Cache Set 1 IAR/DAR/OPC: Y/Y/Y• Event Code: 0xc7, Max. Inc/Cyc: 2, MT Capture Type: A• Definition: Counts the number of L1 Data Cache read misses. L1 Data Cache is
write through; therefore write misses are not counted. The count only includes misses caused by references counted by L1D_READS event. It will include L1D misses which missed the ALAT but not those which hit in the ALAT. Semaphores are not handled by L1D and are not included in this count
• NOTE: This is a restricted set 1 L1D Cache event. In order to measure this event, one of the events in this set must be measured by PMD5. Only ports 0 and 1 are measured.
L1ITLB_INSERTS_HPW• Title: L1ITLB Hardware Page Walker Inserts• Category: TLB IAR/DAR/OPC: Y/N/N• Event Code: 0x48, Max. Inc/Cyc: 1, MT Capture Type: A• Definition: Counts the number of L1ITLB inserts done by Hardware Page Walker.
L1I_EAR_EVENTS• Title: Instruction EAR Events• Category: L1 Instruction Cache and Prefetch IAR/DAR/OPC: Y/N/N• Event Code: 0x43, Max. Inc/Cyc: 1, MT Capture Type: F• Definition: Counts the number of L1 Instruction Cache or L1ITLB events captured
by EAR.
Table 4-94. Unit Masks for L1D_READ_MISSES
Extension PMC.umask[19:16] Description
ALL bxxx0 all L1D read misses will be counted.
RSE_FILL bxxx1 only L1D read misses caused by RSE fills will be counted
Performance Monitor Events
Intel® Itanium® Processor 9300 Series 145Reference Manual for Software Development and Optimization, March 2010
L1I_FETCH_ISB_HIT• Title: “Just-In-Time” Instruction Fetch Hitting In and Being Bypassed from ISB• Category: L1 Instruction Cache and Prefetch IAR/DAR/OPC: Y/N/N• Event Code: 0x66, Max. Inc/Cyc: 1, MT Capture Type: A• Definition: Provides information about an instruction fetch hitting in and being
bypassed from the ISB (Instruction Streaming Buffer). It will not count “critical bypasses,” that is, anytime the pipeline has to stall waiting for data to be delivered from L2I. It will count “just-in-time bypasses,” that is, when instruction data is deliv-ered by the L2I in time for the instructions to be consumed without stalling the front-end pipe.
• NOTE: Demand fetches which hit the ISB at the same time as they are being trans-ferred to the Instruction Cache (1 cycles window) will not be counted because they have to be treated as cache hits for the purpose of branch prediction. This event is qualified with IBRP0 if the cache line was tagged as a demand fetch and IBRP1 if the cache line was tagged as a prefetch match.
L1I_FETCH_RAB_HIT• Title: Instruction Fetch Hitting in RAB• Category: L1 Instruction Cache and Prefetch IAR/DAR/OPC: Y/N/N• Event Code: 0x65, Max. Inc/Cyc: 1, MT Capture Type: A• Definition: Provides Information about instruction fetch hitting in the RAB.
• NOTE: This event is qualified with IBRP0 if the cache line was tagged as a demand fetch and IBRP1 if the cache line was tagged as a prefetch match.
L1I_FILLS• Title: L1 Instruction Cache Fills• Category: L1 Instruction Cache and Prefetch IAR/DAR/OPC: Y/N/N• Event Code: 0x41, Max. Inc/Cyc: 1, MT Capture Type: F• Definition: Provides information about the number of line fills from ISB to the L1
Instruction Cache (64-byte chunks).
• NOTE: This event is qualified with IBRP0 if the cache line was tagged as a demand fetch or IBRP1 if the cache line was tagged as a prefetch match. It is impossible for this event to fire if the corresponding entry is not in L1ITLB
L1I_PREFETCHES• Title: L1 Instruction Prefetch Requests• Category: L1 Instruction Cache and Prefetch IAR/DAR/OPC: Y/N/N• Event Code: 0x44, Max. Inc/Cyc: 1, MT Capture Type: A• Definition: Provides information about the number of issued L1 cache line prefetch
requests (64 bytes/line). The reported number includes streaming and non-stream-ing prefetches (hits and misses in L1 Instruction Cache are both included).
• NOTE: This event is qualified with IBRP1
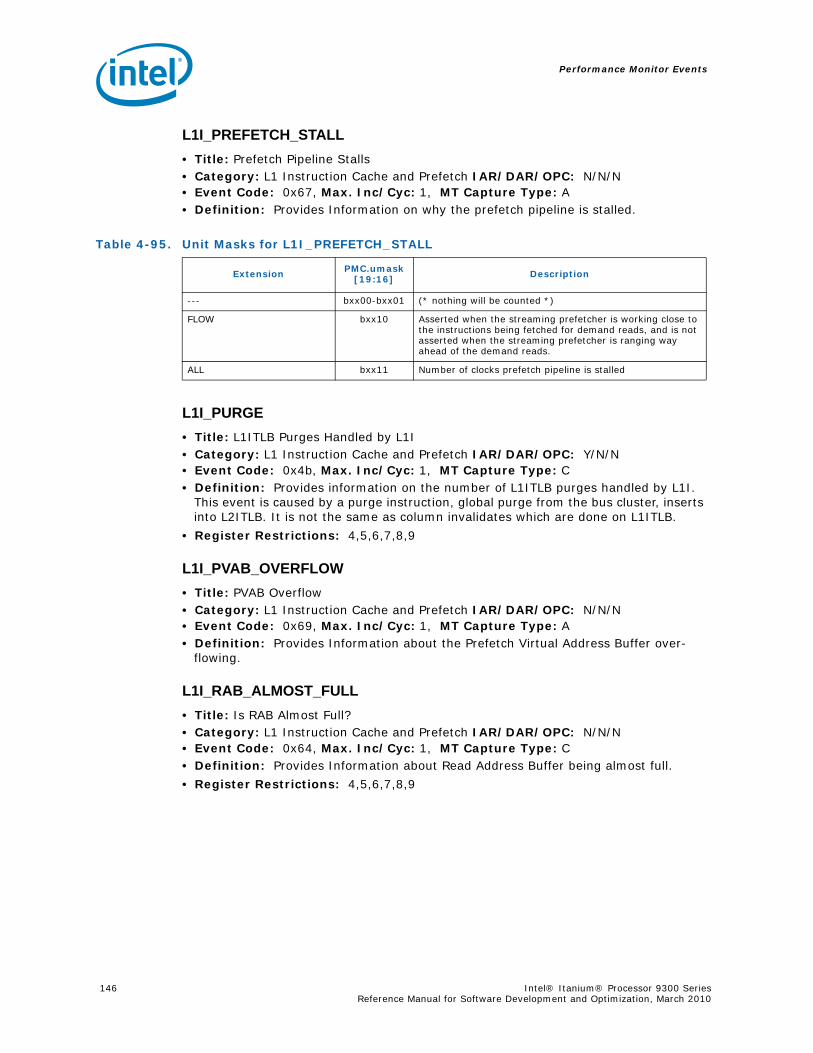
Performance Monitor Events
146 Intel® Itanium® Processor 9300 Series Reference Manual for Software Development and Optimization, March 2010
L1I_PREFETCH_STALL• Title: Prefetch Pipeline Stalls• Category: L1 Instruction Cache and Prefetch IAR/DAR/OPC: N/N/N• Event Code: 0x67, Max. Inc/Cyc: 1, MT Capture Type: A• Definition: Provides Information on why the prefetch pipeline is stalled.
L1I_PURGE• Title: L1ITLB Purges Handled by L1I• Category: L1 Instruction Cache and Prefetch IAR/DAR/OPC: Y/N/N• Event Code: 0x4b, Max. Inc/Cyc: 1, MT Capture Type: C• Definition: Provides information on the number of L1ITLB purges handled by L1I.
This event is caused by a purge instruction, global purge from the bus cluster, inserts into L2ITLB. It is not the same as column invalidates which are done on L1ITLB.
• Register Restrictions: 4,5,6,7,8,9
L1I_PVAB_OVERFLOW• Title: PVAB Overflow• Category: L1 Instruction Cache and Prefetch IAR/DAR/OPC: N/N/N• Event Code: 0x69, Max. Inc/Cyc: 1, MT Capture Type: A• Definition: Provides Information about the Prefetch Virtual Address Buffer over-
flowing.
L1I_RAB_ALMOST_FULL• Title: Is RAB Almost Full?• Category: L1 Instruction Cache and Prefetch IAR/DAR/OPC: N/N/N• Event Code: 0x64, Max. Inc/Cyc: 1, MT Capture Type: C• Definition: Provides Information about Read Address Buffer being almost full.
• Register Restrictions: 4,5,6,7,8,9
Table 4-95. Unit Masks for L1I_PREFETCH_STALL
Extension PMC.umask[19:16] Description
--- bxx00-bxx01 (* nothing will be counted *)
FLOW bxx10 Asserted when the streaming prefetcher is working close to the instructions being fetched for demand reads, and is not asserted when the streaming prefetcher is ranging way ahead of the demand reads.
ALL bxx11 Number of clocks prefetch pipeline is stalled
Performance Monitor Events
Intel® Itanium® Processor 9300 Series 147Reference Manual for Software Development and Optimization, March 2010
L1I_RAB_FULL• Title: Is RAB Full?• Category: L1 Instruction Cache and Prefetch IAR/DAR/OPC: N/N/N• Event Code: 0x60, Max. Inc/Cyc: 1, MT Capture Type: C• Definition: Provides Information about Read Address Buffer being full.
• Register Restrictions: 4,5,6,7,8,9
L1I_READS• Title: L1 Instruction Cache Reads• Category: L1 Instruction Cache and Prefetch IAR/DAR/OPC: Y/N/N• Event Code: 0x40, Max. Inc/Cyc: 1, MT Capture Type: A• Definition: Provides information about the number of demand fetch reads (that is,
all accesses regardless of hit or miss) to the L1 Instruction Cache (32-byte chunks).
• NOTE: Demand fetches which have an L1ITLB miss, and L1I cache miss, and collide with a fill-recirculate to icache, will not be counted in this event even though they will be counted in L2I_DEMAND_READS.
L1I_SNOOP• Title: Snoop Requests Handled by L1I• Category: L1 Instruction Cache and Prefetch IAR/DAR/OPC: Y/Y/Y• Event Code: 0x4a, Max. Inc/Cyc: 1, MT Capture Type: C• Definition: Provides information on the number of snoop requests (64-byte granu-
lar) handled by L1I.
• NOTE: Each “fc” instruction will produce 1 snoop request to L1I after it goes out on the bus. If IFR snoop pipeline is busy when L1D sends the snoop to IFR, this event will count more than once for the same snoop. A victimized line will also produce a snoop. Some bus transactions also can cause L1I snoops.
• Register Restrictions: 4,5,6,7,8,9
L1I_STRM_PREFETCHES• Title: L1 Instruction Cache Line Prefetch Requests• Category: L1 Instruction Cache and Prefetch IAR/DAR/OPC: Y/N/N• Event Code: 0x5f, Max. Inc/Cyc: 1, MT Capture Type: A• Definition: Provides Information about the number of L1I cache line prefetch
requests (64 bytes/line) which go through prefetch pipeline (that is, hit or miss in L1I cache is not factored in) in streaming mode only (initiated by br.many).
• NOTE: This event is qualified with IBRP1
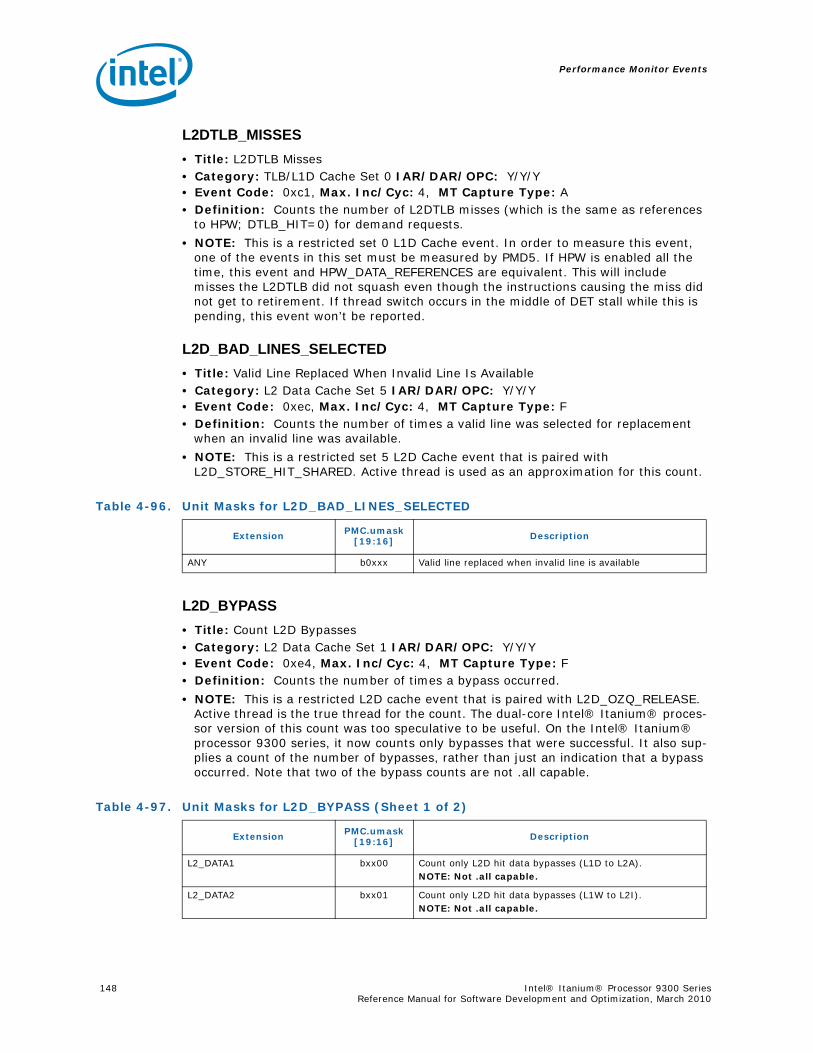
Performance Monitor Events
148 Intel® Itanium® Processor 9300 Series Reference Manual for Software Development and Optimization, March 2010
L2DTLB_MISSES• Title: L2DTLB Misses• Category: TLB/L1D Cache Set 0 IAR/DAR/OPC: Y/Y/Y• Event Code: 0xc1, Max. Inc/Cyc: 4, MT Capture Type: A• Definition: Counts the number of L2DTLB misses (which is the same as references
to HPW; DTLB_HIT=0) for demand requests.
• NOTE: This is a restricted set 0 L1D Cache event. In order to measure this event, one of the events in this set must be measured by PMD5. If HPW is enabled all the time, this event and HPW_DATA_REFERENCES are equivalent. This will include misses the L2DTLB did not squash even though the instructions causing the miss did not get to retirement. If thread switch occurs in the middle of DET stall while this is pending, this event won’t be reported.
L2D_BAD_LINES_SELECTED• Title: Valid Line Replaced When Invalid Line Is Available• Category: L2 Data Cache Set 5 IAR/DAR/OPC: Y/Y/Y• Event Code: 0xec, Max. Inc/Cyc: 4, MT Capture Type: F• Definition: Counts the number of times a valid line was selected for replacement
when an invalid line was available.
• NOTE: This is a restricted set 5 L2D Cache event that is paired with L2D_STORE_HIT_SHARED. Active thread is used as an approximation for this count.
L2D_BYPASS• Title: Count L2D Bypasses• Category: L2 Data Cache Set 1 IAR/DAR/OPC: Y/Y/Y• Event Code: 0xe4, Max. Inc/Cyc: 4, MT Capture Type: F• Definition: Counts the number of times a bypass occurred.
• NOTE: This is a restricted L2D cache event that is paired with L2D_OZQ_RELEASE. Active thread is the true thread for the count. The dual-core Intel® Itanium® proces-sor version of this count was too speculative to be useful. On the Intel® Itanium® processor 9300 series, it now counts only bypasses that were successful. It also sup-plies a count of the number of bypasses, rather than just an indication that a bypass occurred. Note that two of the bypass counts are not .all capable.
Table 4-96. Unit Masks for L2D_BAD_LINES_SELECTED
Extension PMC.umask[19:16] Description
ANY b0xxx Valid line replaced when invalid line is available
Table 4-97. Unit Masks for L2D_BYPASS (Sheet 1 of 2)
Extension PMC.umask[19:16] Description
L2_DATA1 bxx00 Count only L2D hit data bypasses (L1D to L2A). NOTE: Not .all capable.
L2_DATA2 bxx01 Count only L2D hit data bypasses (L1W to L2I). NOTE: Not .all capable.
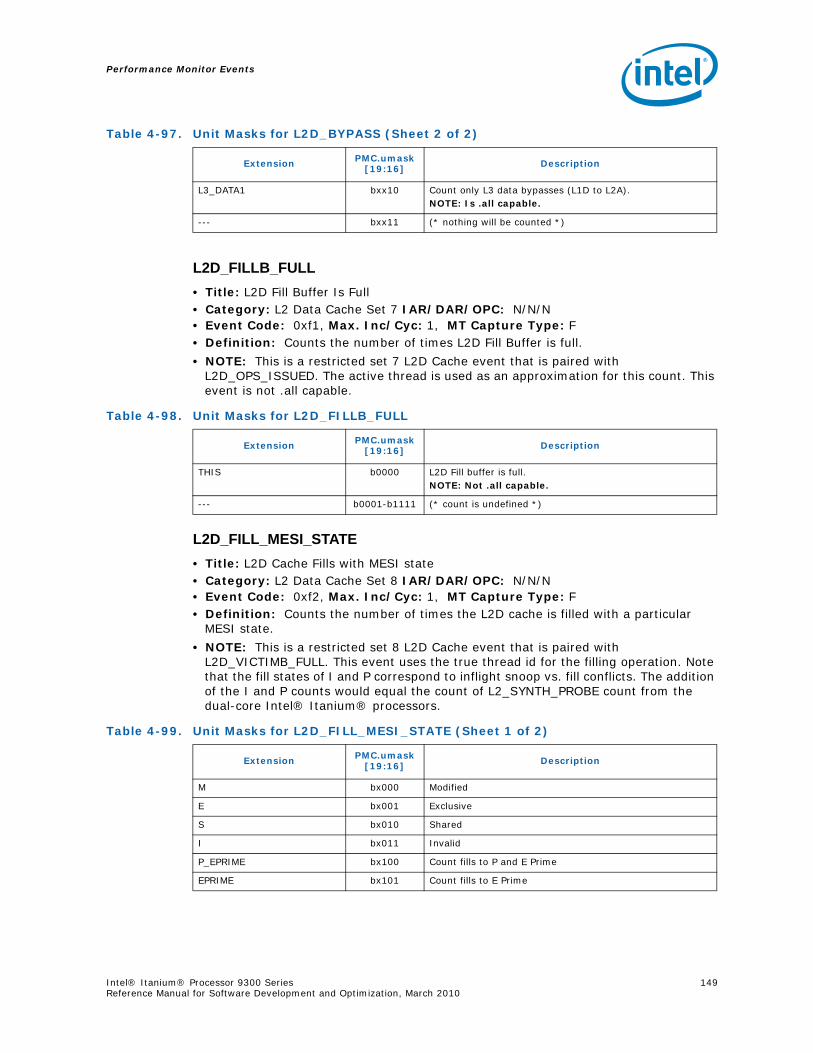
Performance Monitor Events
Intel® Itanium® Processor 9300 Series 149Reference Manual for Software Development and Optimization, March 2010
L2D_FILLB_FULL• Title: L2D Fill Buffer Is Full• Category: L2 Data Cache Set 7 IAR/DAR/OPC: N/N/N• Event Code: 0xf1, Max. Inc/Cyc: 1, MT Capture Type: F• Definition: Counts the number of times L2D Fill Buffer is full.
• NOTE: This is a restricted set 7 L2D Cache event that is paired with L2D_OPS_ISSUED. The active thread is used as an approximation for this count. This event is not .all capable.
L2D_FILL_MESI_STATE• Title: L2D Cache Fills with MESI state• Category: L2 Data Cache Set 8 IAR/DAR/OPC: N/N/N• Event Code: 0xf2, Max. Inc/Cyc: 1, MT Capture Type: F• Definition: Counts the number of times the L2D cache is filled with a particular
MESI state.
• NOTE: This is a restricted set 8 L2D Cache event that is paired with L2D_VICTIMB_FULL. This event uses the true thread id for the filling operation. Note that the fill states of I and P correspond to inflight snoop vs. fill conflicts. The addition of the I and P counts would equal the count of L2_SYNTH_PROBE count from the dual-core Intel® Itanium® processors.
L3_DATA1 bxx10 Count only L3 data bypasses (L1D to L2A). NOTE: Is .all capable.
--- bxx11 (* nothing will be counted *)
Table 4-97. Unit Masks for L2D_BYPASS (Sheet 2 of 2)
Extension PMC.umask[19:16] Description
Table 4-98. Unit Masks for L2D_FILLB_FULL
Extension PMC.umask[19:16] Description
THIS b0000 L2D Fill buffer is full. NOTE: Not .all capable.
--- b0001-b1111 (* count is undefined *)
Table 4-99. Unit Masks for L2D_FILL_MESI_STATE (Sheet 1 of 2)
Extension PMC.umask[19:16] Description
M bx000 Modified
E bx001 Exclusive
S bx010 Shared
I bx011 Invalid
P_EPRIME bx100 Count fills to P and E Prime
EPRIME bx101 Count fills to E Prime
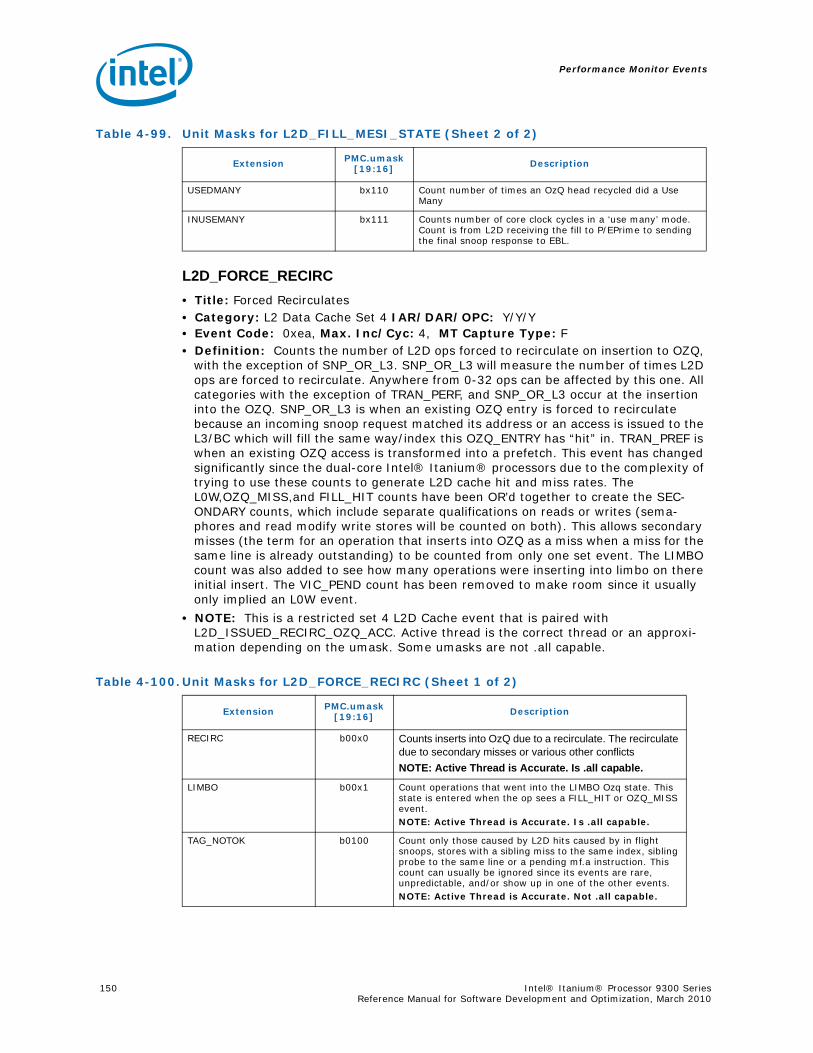
Performance Monitor Events
150 Intel® Itanium® Processor 9300 Series Reference Manual for Software Development and Optimization, March 2010
L2D_FORCE_RECIRC• Title: Forced Recirculates• Category: L2 Data Cache Set 4 IAR/DAR/OPC: Y/Y/Y• Event Code: 0xea, Max. Inc/Cyc: 4, MT Capture Type: F• Definition: Counts the number of L2D ops forced to recirculate on insertion to OZQ,
with the exception of SNP_OR_L3. SNP_OR_L3 will measure the number of times L2D ops are forced to recirculate. Anywhere from 0-32 ops can be affected by this one. All categories with the exception of TRAN_PERF, and SNP_OR_L3 occur at the insertion into the OZQ. SNP_OR_L3 is when an existing OZQ entry is forced to recirculate because an incoming snoop request matched its address or an access is issued to the L3/BC which will fill the same way/index this OZQ_ENTRY has “hit” in. TRAN_PREF is when an existing OZQ access is transformed into a prefetch. This event has changed significantly since the dual-core Intel® Itanium® processors due to the complexity of trying to use these counts to generate L2D cache hit and miss rates. The L0W,OZQ_MISS,and FILL_HIT counts have been OR’d together to create the SEC-ONDARY counts, which include separate qualifications on reads or writes (sema-phores and read modify write stores will be counted on both). This allows secondary misses (the term for an operation that inserts into OZQ as a miss when a miss for the same line is already outstanding) to be counted from only one set event. The LIMBO count was also added to see how many operations were inserting into limbo on there initial insert. The VIC_PEND count has been removed to make room since it usually only implied an L0W event.
• NOTE: This is a restricted set 4 L2D Cache event that is paired with L2D_ISSUED_RECIRC_OZQ_ACC. Active thread is the correct thread or an approxi-mation depending on the umask. Some umasks are not .all capable.
USEDMANY bx110 Count number of times an OzQ head recycled did a Use Many
INUSEMANY bx111 Counts number of core clock cycles in a ‘use many’ mode. Count is from L2D receiving the fill to P/EPrime to sending the final snoop response to EBL.
Table 4-99. Unit Masks for L2D_FILL_MESI_STATE (Sheet 2 of 2)
Extension PMC.umask[19:16] Description
Table 4-100.Unit Masks for L2D_FORCE_RECIRC (Sheet 1 of 2)
Extension PMC.umask[19:16] Description
RECIRC b00x0 Counts inserts into OzQ due to a recirculate. The recirculate due to secondary misses or various other conflictsNOTE: Active Thread is Accurate. Is .all capable.
LIMBO b00x1 Count operations that went into the LIMBO Ozq state. This state is entered when the op sees a FILL_HIT or OZQ_MISS event. NOTE: Active Thread is Accurate. Is .all capable.
TAG_NOTOK b0100 Count only those caused by L2D hits caused by in flight snoops, stores with a sibling miss to the same index, sibling probe to the same line or a pending mf.a instruction. This count can usually be ignored since its events are rare, unpredictable, and/or show up in one of the other events. NOTE: Active Thread is Accurate. Not .all capable.
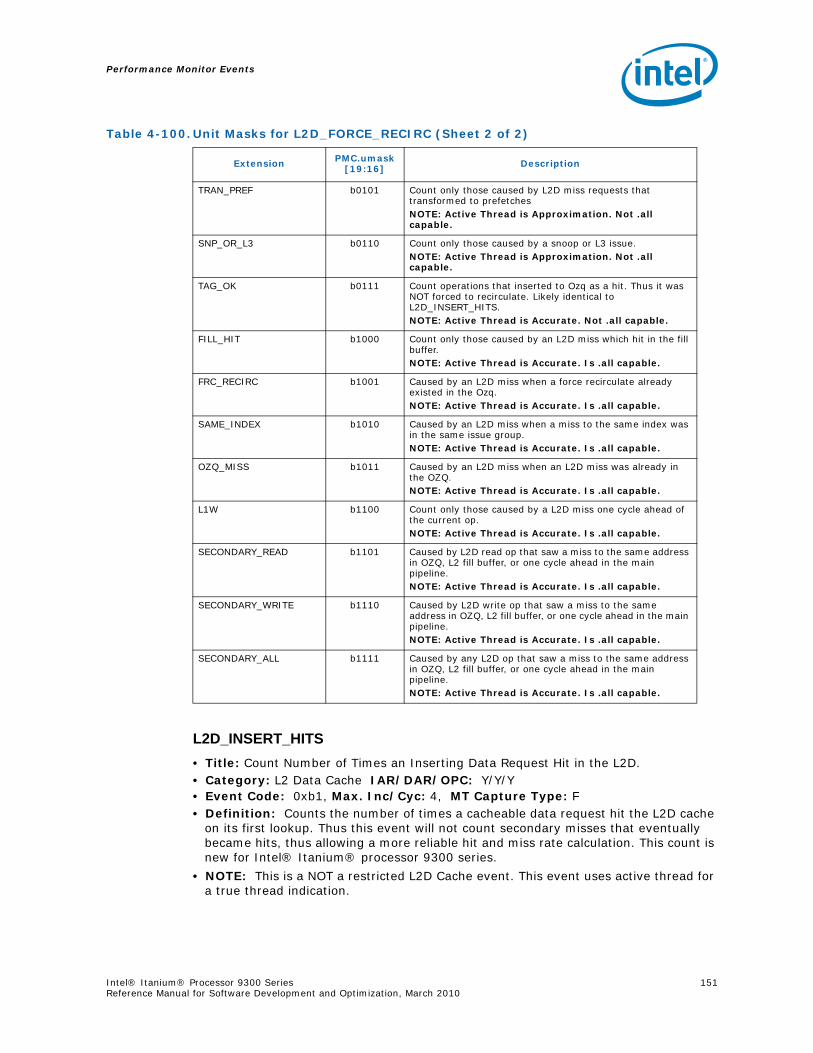
Performance Monitor Events
Intel® Itanium® Processor 9300 Series 151Reference Manual for Software Development and Optimization, March 2010
L2D_INSERT_HITS• Title: Count Number of Times an Inserting Data Request Hit in the L2D.• Category: L2 Data Cache IAR/DAR/OPC: Y/Y/Y• Event Code: 0xb1, Max. Inc/Cyc: 4, MT Capture Type: F• Definition: Counts the number of times a cacheable data request hit the L2D cache
on its first lookup. Thus this event will not count secondary misses that eventually became hits, thus allowing a more reliable hit and miss rate calculation. This count is new for Intel® Itanium® processor 9300 series.
• NOTE: This is a NOT a restricted L2D Cache event. This event uses active thread for a true thread indication.
TRAN_PREF b0101 Count only those caused by L2D miss requests that transformed to prefetches NOTE: Active Thread is Approximation. Not .all capable.
SNP_OR_L3 b0110 Count only those caused by a snoop or L3 issue. NOTE: Active Thread is Approximation. Not .all capable.
TAG_OK b0111 Count operations that inserted to Ozq as a hit. Thus it was NOT forced to recirculate. Likely identical to L2D_INSERT_HITS.NOTE: Active Thread is Accurate. Not .all capable.
FILL_HIT b1000 Count only those caused by an L2D miss which hit in the fill buffer. NOTE: Active Thread is Accurate. Is .all capable.
FRC_RECIRC b1001 Caused by an L2D miss when a force recirculate already existed in the Ozq. NOTE: Active Thread is Accurate. Is .all capable.
SAME_INDEX b1010 Caused by an L2D miss when a miss to the same index was in the same issue group. NOTE: Active Thread is Accurate. Is .all capable.
OZQ_MISS b1011 Caused by an L2D miss when an L2D miss was already in the OZQ. NOTE: Active Thread is Accurate. Is .all capable.
L1W b1100 Count only those caused by a L2D miss one cycle ahead of the current op. NOTE: Active Thread is Accurate. Is .all capable.
SECONDARY_READ b1101 Caused by L2D read op that saw a miss to the same address in OZQ, L2 fill buffer, or one cycle ahead in the main pipeline. NOTE: Active Thread is Accurate. Is .all capable.
SECONDARY_WRITE b1110 Caused by L2D write op that saw a miss to the same address in OZQ, L2 fill buffer, or one cycle ahead in the main pipeline. NOTE: Active Thread is Accurate. Is .all capable.
SECONDARY_ALL b1111 Caused by any L2D op that saw a miss to the same address in OZQ, L2 fill buffer, or one cycle ahead in the main pipeline.NOTE: Active Thread is Accurate. Is .all capable.
Table 4-100.Unit Masks for L2D_FORCE_RECIRC (Sheet 2 of 2)
Extension PMC.umask[19:16] Description
Performance Monitor Events
152 Intel® Itanium® Processor 9300 Series Reference Manual for Software Development and Optimization, March 2010
L2D_INSERT_MISSES• Title: Count Number of Times an Inserting Data Request Missed the L2D.• Category: L2 Data Cache IAR/DAR/OPC: Y/Y/Y• Event Code: 0xb0, Max. Inc/Cyc: 4, MT Capture Type: F• Definition: Counts the number of times a cacheable data request missed the L2D
cache on its first lookup. Thus this event will count secondary misses and other misses that were forced to recirculate. This allows for a more reliable miss rate calcu-lation as compared to the dual-core Intel® Itanium® processors method of counting L2_MISSES and adding a combination of L2_FORCE_RECIRC events.
• NOTE: This is a NOT a restricted L2D Cache event. This event uses active thread for a true thread indication.
L2D_ISSUED_RECIRC_OZQ_ACC• Title: Count Number of Times a Recirculate Issue Was Attempted and Not Preempted• Category: L2 Data Cache Set 4 IAR/DAR/OPC: Y/Y/Y• Event Code: 0xeb, Max. Inc/Cyc: 1, MT Capture Type: F• Definition: Counts the number of times a recirculate was attempted that didn't get
preempted by a fill/confirm/evervalid (fill/confirm tag updates have higher priority) or by an older sibling issuing a recirculate (only one recirculate can be sent per clock). This value can be added to L2D_OZQ_CANCELS*.RECIRC for the total number of times the L2D issue logic attempted to issue a recirculate.
• NOTE: This is a restricted L2D Cache event that is paired with L2D_FORCE_RECIRCULATE. This event uses the true thread id of the given recircu-late.
L2D_L3ACCESS_CANCEL• Title: L2D Access Cancelled by L2D• Category: L2 Data Cache Set 3 IAR/DAR/OPC: Y/Y/Y• Event Code: 0xe8, Max. Inc/Cyc: 1, MT Capture Type: F• Definition: Counts the number of canceled L3 accesses. A unit mask, as specified in
the following table, narrows this event down to a specific reason for the cancel. This event includes one event for dynamic throttling of L2D transform to prefetches and L2D Ozq tail collapse disabling.
• NOTE: This is a restricted set 3 L2D Cache event that is paired with L2D_OZDB_FULL. The L2D reject events used their true thread id. The dynamic dis-abling and non-coverage events use active thread as an approximation. None of the umasks in this event are .all capable. umasks ‘bx000 to ‘bx011 use the true tread of the access. umasks ‘bx100 to ‘bx111 use the active thread.
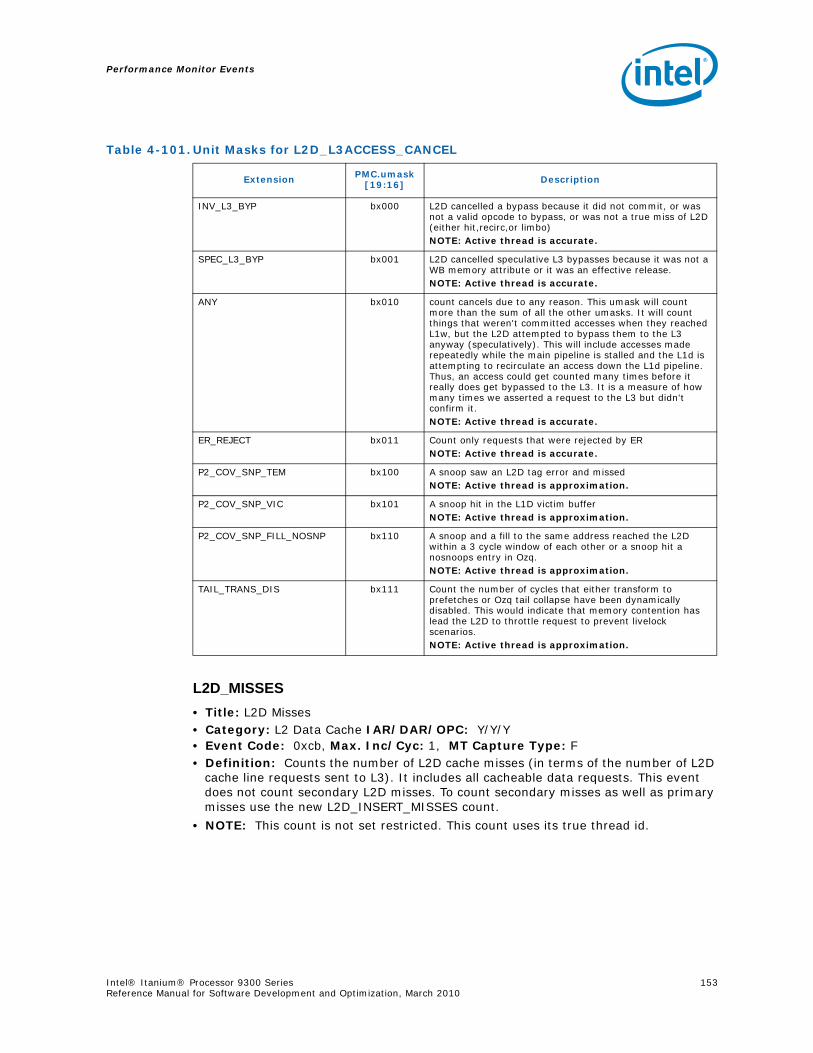
Performance Monitor Events
Intel® Itanium® Processor 9300 Series 153Reference Manual for Software Development and Optimization, March 2010
L2D_MISSES• Title: L2D Misses• Category: L2 Data Cache IAR/DAR/OPC: Y/Y/Y• Event Code: 0xcb, Max. Inc/Cyc: 1, MT Capture Type: F• Definition: Counts the number of L2D cache misses (in terms of the number of L2D
cache line requests sent to L3). It includes all cacheable data requests. This event does not count secondary L2D misses. To count secondary misses as well as primary misses use the new L2D_INSERT_MISSES count.
• NOTE: This count is not set restricted. This count uses its true thread id.
Table 4-101.Unit Masks for L2D_L3ACCESS_CANCEL
Extension PMC.umask[19:16] Description
INV_L3_BYP bx000 L2D cancelled a bypass because it did not commit, or was not a valid opcode to bypass, or was not a true miss of L2D (either hit,recirc,or limbo)NOTE: Active thread is accurate.
SPEC_L3_BYP bx001 L2D cancelled speculative L3 bypasses because it was not a WB memory attribute or it was an effective release.NOTE: Active thread is accurate.
ANY bx010 count cancels due to any reason. This umask will count more than the sum of all the other umasks. It will count things that weren't committed accesses when they reached L1w, but the L2D attempted to bypass them to the L3 anyway (speculatively). This will include accesses made repeatedly while the main pipeline is stalled and the L1d is attempting to recirculate an access down the L1d pipeline. Thus, an access could get counted many times before it really does get bypassed to the L3. It is a measure of how many times we asserted a request to the L3 but didn't confirm it.NOTE: Active thread is accurate.
ER_REJECT bx011 Count only requests that were rejected by ERNOTE: Active thread is accurate.
P2_COV_SNP_TEM bx100 A snoop saw an L2D tag error and missedNOTE: Active thread is approximation.
P2_COV_SNP_VIC bx101 A snoop hit in the L1D victim bufferNOTE: Active thread is approximation.
P2_COV_SNP_FILL_NOSNP bx110 A snoop and a fill to the same address reached the L2D within a 3 cycle window of each other or a snoop hit a nosnoops entry in Ozq.NOTE: Active thread is approximation.
TAIL_TRANS_DIS bx111 Count the number of cycles that either transform to prefetches or Ozq tail collapse have been dynamically disabled. This would indicate that memory contention has lead the L2D to throttle request to prevent livelock scenarios.NOTE: Active thread is approximation.
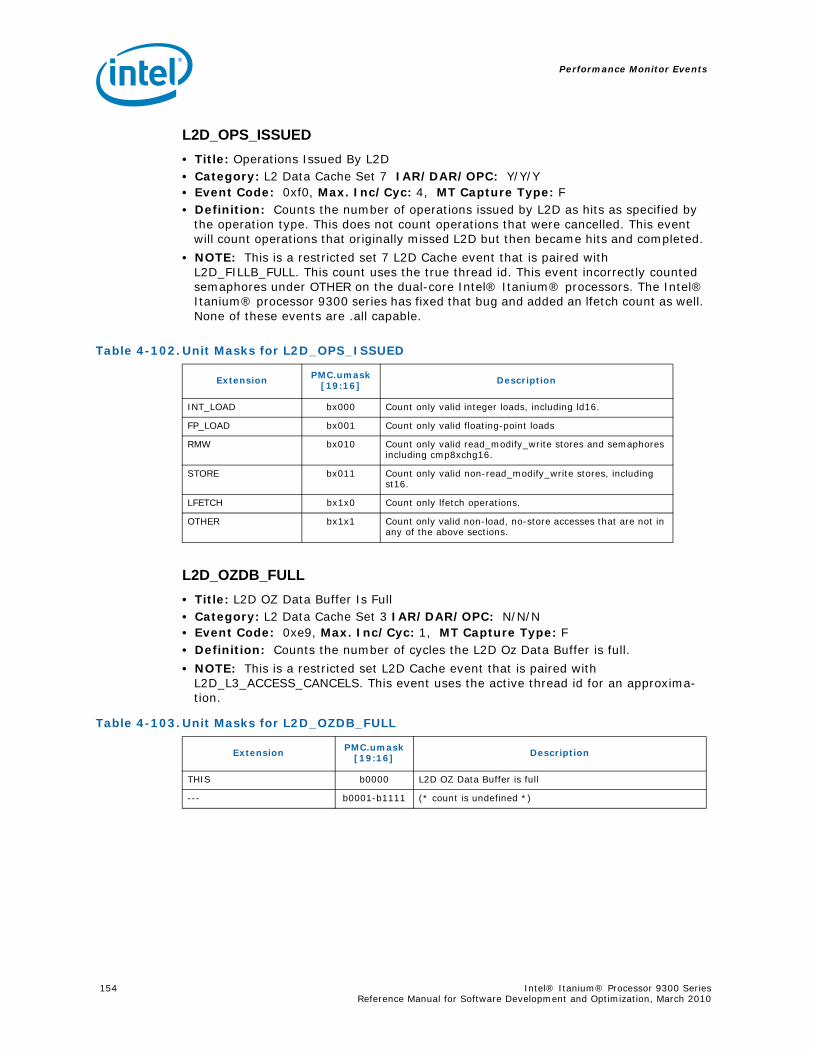
Performance Monitor Events
154 Intel® Itanium® Processor 9300 Series Reference Manual for Software Development and Optimization, March 2010
L2D_OPS_ISSUED• Title: Operations Issued By L2D• Category: L2 Data Cache Set 7 IAR/DAR/OPC: Y/Y/Y• Event Code: 0xf0, Max. Inc/Cyc: 4, MT Capture Type: F• Definition: Counts the number of operations issued by L2D as hits as specified by
the operation type. This does not count operations that were cancelled. This event will count operations that originally missed L2D but then became hits and completed.
• NOTE: This is a restricted set 7 L2D Cache event that is paired with L2D_FILLB_FULL. This count uses the true thread id. This event incorrectly counted semaphores under OTHER on the dual-core Intel® Itanium® processors. The Intel® Itanium® processor 9300 series has fixed that bug and added an lfetch count as well. None of these events are .all capable.
L2D_OZDB_FULL• Title: L2D OZ Data Buffer Is Full• Category: L2 Data Cache Set 3 IAR/DAR/OPC: N/N/N• Event Code: 0xe9, Max. Inc/Cyc: 1, MT Capture Type: F• Definition: Counts the number of cycles the L2D Oz Data Buffer is full.
• NOTE: This is a restricted set L2D Cache event that is paired with L2D_L3_ACCESS_CANCELS. This event uses the active thread id for an approxima-tion.
Table 4-102.Unit Masks for L2D_OPS_ISSUED
Extension PMC.umask[19:16] Description
INT_LOAD bx000 Count only valid integer loads, including ld16.
FP_LOAD bx001 Count only valid floating-point loads
RMW bx010 Count only valid read_modify_write stores and semaphores including cmp8xchg16.
STORE bx011 Count only valid non-read_modify_write stores, including st16.
LFETCH bx1x0 Count only lfetch operations.
OTHER bx1x1 Count only valid non-load, no-store accesses that are not in any of the above sections.
Table 4-103.Unit Masks for L2D_OZDB_FULL
Extension PMC.umask[19:16] Description
THIS b0000 L2D OZ Data Buffer is full
--- b0001-b1111 (* count is undefined *)
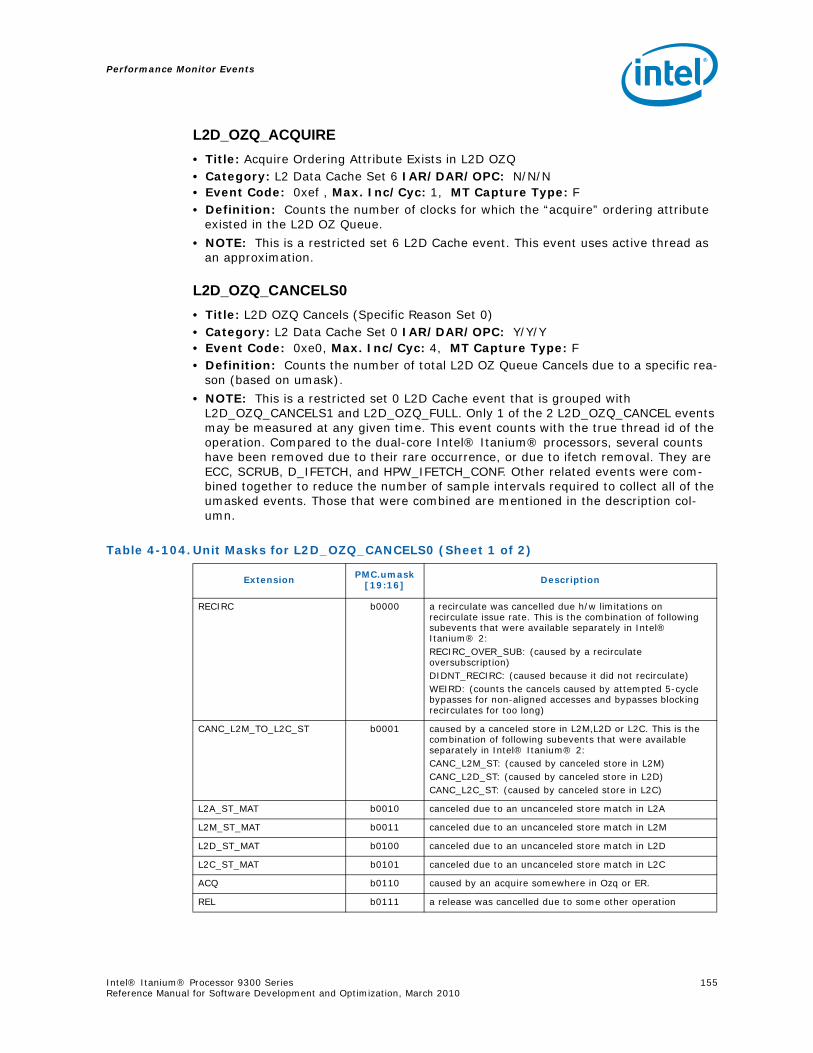
Performance Monitor Events
Intel® Itanium® Processor 9300 Series 155Reference Manual for Software Development and Optimization, March 2010
L2D_OZQ_ACQUIRE• Title: Acquire Ordering Attribute Exists in L2D OZQ• Category: L2 Data Cache Set 6 IAR/DAR/OPC: N/N/N• Event Code: 0xef , Max. Inc/Cyc: 1, MT Capture Type: F• Definition: Counts the number of clocks for which the “acquire” ordering attribute
existed in the L2D OZ Queue.
• NOTE: This is a restricted set 6 L2D Cache event. This event uses active thread as an approximation.
L2D_OZQ_CANCELS0• Title: L2D OZQ Cancels (Specific Reason Set 0)• Category: L2 Data Cache Set 0 IAR/DAR/OPC: Y/Y/Y• Event Code: 0xe0, Max. Inc/Cyc: 4, MT Capture Type: F• Definition: Counts the number of total L2D OZ Queue Cancels due to a specific rea-
son (based on umask).
• NOTE: This is a restricted set 0 L2D Cache event that is grouped with L2D_OZQ_CANCELS1 and L2D_OZQ_FULL. Only 1 of the 2 L2D_OZQ_CANCEL events may be measured at any given time. This event counts with the true thread id of the operation. Compared to the dual-core Intel® Itanium® processors, several counts have been removed due to their rare occurrence, or due to ifetch removal. They are ECC, SCRUB, D_IFETCH, and HPW_IFETCH_CONF. Other related events were com-bined together to reduce the number of sample intervals required to collect all of the umasked events. Those that were combined are mentioned in the description col-umn.
Table 4-104.Unit Masks for L2D_OZQ_CANCELS0 (Sheet 1 of 2)
Extension PMC.umask[19:16] Description
RECIRC b0000 a recirculate was cancelled due h/w limitations on recirculate issue rate. This is the combination of following subevents that were available separately in Intel® Itanium® 2:RECIRC_OVER_SUB: (caused by a recirculate oversubscription)DIDNT_RECIRC: (caused because it did not recirculate)WEIRD: (counts the cancels caused by attempted 5-cycle bypasses for non-aligned accesses and bypasses blocking recirculates for too long)
CANC_L2M_TO_L2C_ST b0001 caused by a canceled store in L2M,L2D or L2C. This is the combination of following subevents that were available separately in Intel® Itanium® 2: CANC_L2M_ST: (caused by canceled store in L2M)CANC_L2D_ST: (caused by canceled store in L2D)CANC_L2C_ST: (caused by canceled store in L2C)
L2A_ST_MAT b0010 canceled due to an uncanceled store match in L2A
L2M_ST_MAT b0011 canceled due to an uncanceled store match in L2M
L2D_ST_MAT b0100 canceled due to an uncanceled store match in L2D
L2C_ST_MAT b0101 canceled due to an uncanceled store match in L2C
ACQ b0110 caused by an acquire somewhere in Ozq or ER.
REL b0111 a release was cancelled due to some other operation
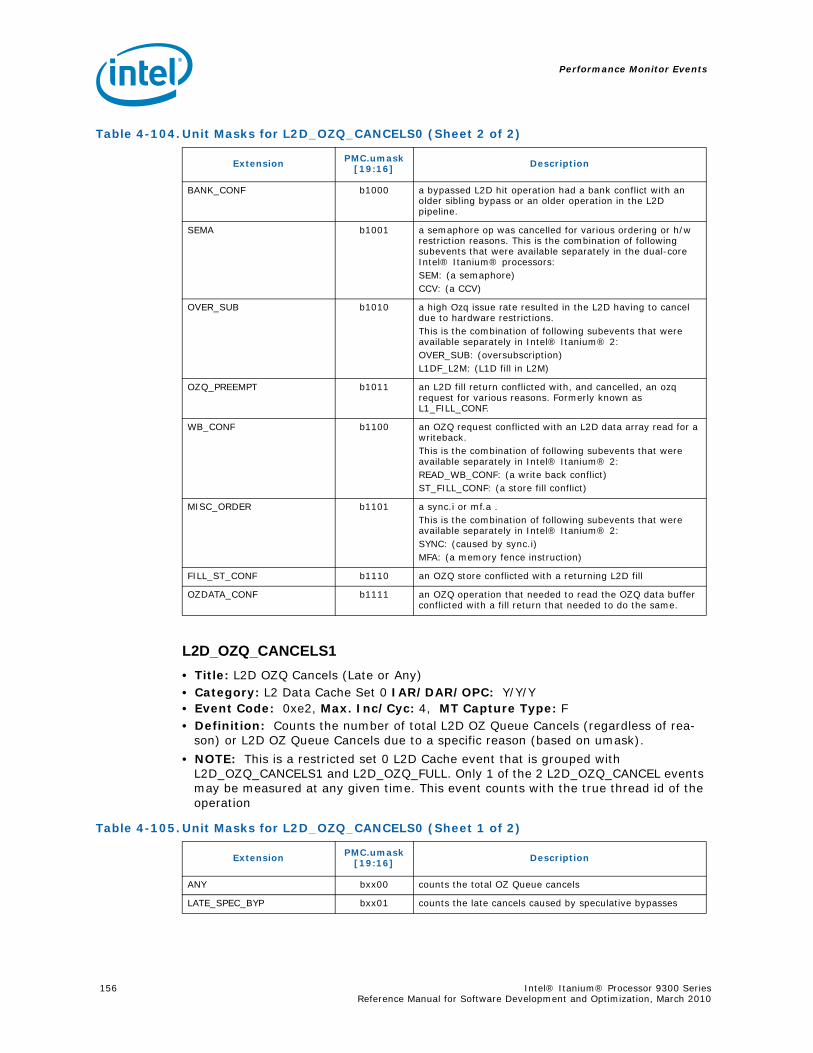
Performance Monitor Events
156 Intel® Itanium® Processor 9300 Series Reference Manual for Software Development and Optimization, March 2010
L2D_OZQ_CANCELS1• Title: L2D OZQ Cancels (Late or Any)• Category: L2 Data Cache Set 0 IAR/DAR/OPC: Y/Y/Y• Event Code: 0xe2, Max. Inc/Cyc: 4, MT Capture Type: F• Definition: Counts the number of total L2D OZ Queue Cancels (regardless of rea-
son) or L2D OZ Queue Cancels due to a specific reason (based on umask).
• NOTE: This is a restricted set 0 L2D Cache event that is grouped with L2D_OZQ_CANCELS1 and L2D_OZQ_FULL. Only 1 of the 2 L2D_OZQ_CANCEL events may be measured at any given time. This event counts with the true thread id of the operation
BANK_CONF b1000 a bypassed L2D hit operation had a bank conflict with an older sibling bypass or an older operation in the L2D pipeline.
SEMA b1001 a semaphore op was cancelled for various ordering or h/w restriction reasons. This is the combination of following subevents that were available separately in the dual-core Intel® Itanium® processors: SEM: (a semaphore)CCV: (a CCV)
OVER_SUB b1010 a high Ozq issue rate resulted in the L2D having to cancel due to hardware restrictions. This is the combination of following subevents that were available separately in Intel® Itanium® 2:OVER_SUB: (oversubscription)L1DF_L2M: (L1D fill in L2M)
OZQ_PREEMPT b1011 an L2D fill return conflicted with, and cancelled, an ozq request for various reasons. Formerly known as L1_FILL_CONF.
WB_CONF b1100 an OZQ request conflicted with an L2D data array read for a writeback. This is the combination of following subevents that were available separately in Intel® Itanium® 2:READ_WB_CONF: (a write back conflict)ST_FILL_CONF: (a store fill conflict)
MISC_ORDER b1101 a sync.i or mf.a . This is the combination of following subevents that were available separately in Intel® Itanium® 2:SYNC: (caused by sync.i)MFA: (a memory fence instruction)
FILL_ST_CONF b1110 an OZQ store conflicted with a returning L2D fill
OZDATA_CONF b1111 an OZQ operation that needed to read the OZQ data buffer conflicted with a fill return that needed to do the same.
Table 4-104.Unit Masks for L2D_OZQ_CANCELS0 (Sheet 2 of 2)
Extension PMC.umask[19:16] Description
Table 4-105.Unit Masks for L2D_OZQ_CANCELS0 (Sheet 1 of 2)
Extension PMC.umask[19:16] Description
ANY bxx00 counts the total OZ Queue cancels
LATE_SPEC_BYP bxx01 counts the late cancels caused by speculative bypasses

Performance Monitor Events
Intel® Itanium® Processor 9300 Series 157Reference Manual for Software Development and Optimization, March 2010
L2D_OZQ_FULL• Title: L2D OZQ Is Full• Category: L2 Data Cache Set 0 IAR/DAR/OPC: N/N/N• Event Code: 0xe1, Max. Inc/Cyc: 1, MT Capture Type: F• Definition: Counts the number of times L2D OZQ is full.
• NOTE: This is a restricted set 0 L2D cache event that is grouped with L2D_OZQ_CANCELS0/1. This event uses active thread as an approximation. This event is not .all capable.
L2D_OZQ_RELEASE• Title: Release Ordering Attribute Exists in L2D OZQ• Category: L2 Data Cache Set 1 IAR/DAR/OPC: N/N/N• Event Code: 0xe5, Max. Inc/Cyc: 1, MT Capture Type: F• Definition: Counts the number of clocks entries with an “effective release” ordering
attribute existed in the L2D OZ Queue. This includes not just architected .rel instruc-tions, but also effective releases due to loads and stores to the same 4 byte chunk.
• NOTE: This is a restricted set 1L2D Cache event that is paired with L2D_BYPASS. This event uses active thread as an approximation. This event is not .all capable.
SIBLING_ACQ_REL bxx10 counts the late cancels caused by releases and acquires in the same issue group. This is the combination of following subevents that were available separately in Intel® Itanium® 2:LATE_ACQUIRE: (late cancels caused by acquires)LATE_RELEASE: (late cancels caused by releases)
LATE_BYP_EFFRELEASE bxx11 counts the late cancels caused by L1D to L2A bypass effective releases
Table 4-105.Unit Masks for L2D_OZQ_CANCELS0 (Sheet 2 of 2)
Extension PMC.umask[19:16] Description
Table 4-106.Unit Masks for L2D_OZQ_FULL
Extension PMC.umask[19:16] Description
THIS b0000 L2D OZQ is full. NOTE: Not .all capable.
--- b0001-b1111 (* count is undefined *)

Performance Monitor Events
158 Intel® Itanium® Processor 9300 Series Reference Manual for Software Development and Optimization, March 2010
L2D_REFERENCES• Title: Data Read/Write Access to L2D• Category: L2 Data Cache Set 2 IAR/DAR/OPC: Y/Y/Y• Event Code: 0xe6, Max. Inc/Cyc: 4, MT Capture Type: F• Definition: Counts the number of requests made to L2D due to a data read and/or
write access. Semaphore operations are counted as one read and one write.
• NOTE: This is a restricted set 2 L2D cache event that does not share an event code. Active thread is the true thread for the count.
L2D_STORE_HIT_SHARED• Title: Store Hit a Shared Line• Category: L2 Data Cache Set 5 IAR/DAR/OPC: Y/Y/Y• Event Code: 0xed, Max. Inc/Cyc: 2, MT Capture Type: F• Definition: Counts the number of times a store hit a shared line.
• NOTE: This is a restricted set 5 L2D Cache event that is paired with L2D_NUM_BAD_LINES_SELECTED. This event uses active thread as an approxima-tion.
L2D_VICTIMB_FULL• Title: L2D Victim Buffer Is Full• Category: L2 Data Cache Set 8 IAR/DAR/OPC: N/N/N• Event Code: 0xf3, Max. Inc/Cyc: 1, MT Capture Type: F• Definition: Counts the number of times L2D Victim Buffer is full.
• NOTE: This is a restricted set 8 L2D Cache event that is paired with L2D_FILL_MESI_STATE. This event uses active thread for an approximation.
Table 4-107.Unit Masks for L2D_REFERENCES
Extension PMC.umask[19:16] Description
--- bxx00 (* nothing will be counted *)
READS bxx01 count only data read and semaphore operations.
WRITES bxx10 count only data write and semaphore operations
ALL bxx11 count both read and write operations (semaphores will count as 2)
Table 4-108.Unit Masks for L2D_STORE_HIT_SHARED
Extension PMC.umask[19:16] Description
ANY b0xxx Store hit a shared line
Table 4-109.Unit Masks for L2D_VICTIMB_FULL
Extension PMC.umask[19:16] Description
THIS b0000 L2D victim buffer is full
--- b0001-b1111 (* count is undefined *)
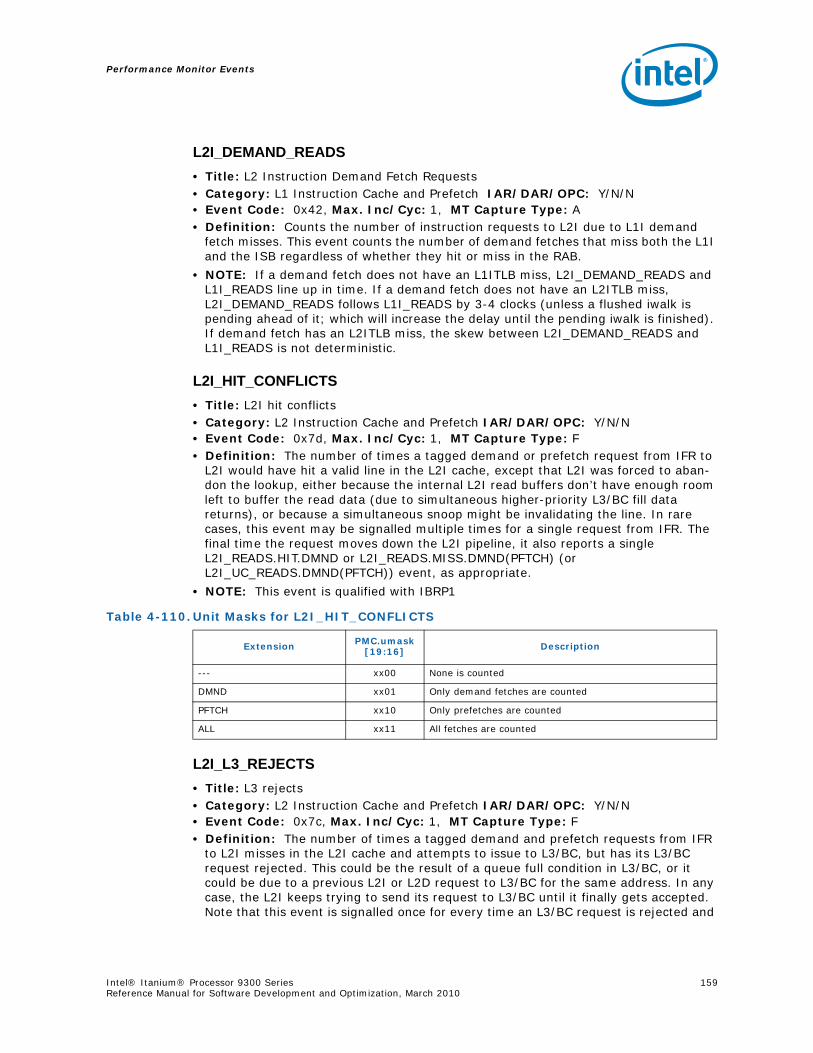
Performance Monitor Events
Intel® Itanium® Processor 9300 Series 159Reference Manual for Software Development and Optimization, March 2010
L2I_DEMAND_READS• Title: L2 Instruction Demand Fetch Requests• Category: L1 Instruction Cache and Prefetch IAR/DAR/OPC: Y/N/N• Event Code: 0x42, Max. Inc/Cyc: 1, MT Capture Type: A• Definition: Counts the number of instruction requests to L2I due to L1I demand
fetch misses. This event counts the number of demand fetches that miss both the L1I and the ISB regardless of whether they hit or miss in the RAB.
• NOTE: If a demand fetch does not have an L1ITLB miss, L2I_DEMAND_READS and L1I_READS line up in time. If a demand fetch does not have an L2ITLB miss, L2I_DEMAND_READS follows L1I_READS by 3-4 clocks (unless a flushed iwalk is pending ahead of it; which will increase the delay until the pending iwalk is finished). If demand fetch has an L2ITLB miss, the skew between L2I_DEMAND_READS and L1I_READS is not deterministic.
L2I_HIT_CONFLICTS• Title: L2I hit conflicts• Category: L2 Instruction Cache and Prefetch IAR/DAR/OPC: Y/N/N• Event Code: 0x7d, Max. Inc/Cyc: 1, MT Capture Type: F• Definition: The number of times a tagged demand or prefetch request from IFR to
L2I would have hit a valid line in the L2I cache, except that L2I was forced to aban-don the lookup, either because the internal L2I read buffers don’t have enough room left to buffer the read data (due to simultaneous higher-priority L3/BC fill data returns), or because a simultaneous snoop might be invalidating the line. In rare cases, this event may be signalled multiple times for a single request from IFR. The final time the request moves down the L2I pipeline, it also reports a single L2I_READS.HIT.DMND or L2I_READS.MISS.DMND(PFTCH) (or L2I_UC_READS.DMND(PFTCH)) event, as appropriate.
• NOTE: This event is qualified with IBRP1
L2I_L3_REJECTS• Title: L3 rejects• Category: L2 Instruction Cache and Prefetch IAR/DAR/OPC: Y/N/N• Event Code: 0x7c, Max. Inc/Cyc: 1, MT Capture Type: F• Definition: The number of times a tagged demand and prefetch requests from IFR
to L2I misses in the L2I cache and attempts to issue to L3/BC, but has its L3/BC request rejected. This could be the result of a queue full condition in L3/BC, or it could be due to a previous L2I or L2D request to L3/BC for the same address. In any case, the L2I keeps trying to send its request to L3/BC until it finally gets accepted. Note that this event is signalled once for every time an L3/BC request is rejected and
Table 4-110.Unit Masks for L2I_HIT_CONFLICTS
Extension PMC.umask[19:16] Description
--- xx00 None is counted
DMND xx01 Only demand fetches are counted
PFTCH xx10 Only prefetches are counted
ALL xx11 All fetches are counted
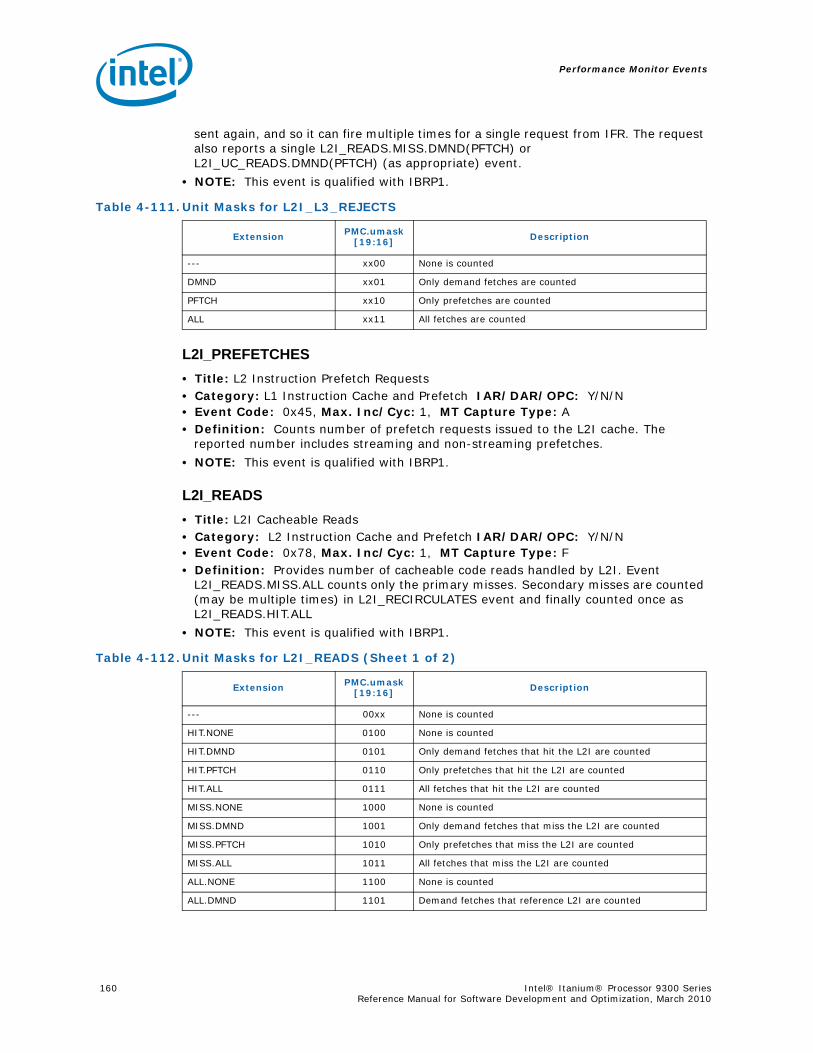
Performance Monitor Events
160 Intel® Itanium® Processor 9300 Series Reference Manual for Software Development and Optimization, March 2010
sent again, and so it can fire multiple times for a single request from IFR. The request also reports a single L2I_READS.MISS.DMND(PFTCH) or L2I_UC_READS.DMND(PFTCH) (as appropriate) event.
• NOTE: This event is qualified with IBRP1.
L2I_PREFETCHES• Title: L2 Instruction Prefetch Requests• Category: L1 Instruction Cache and Prefetch IAR/DAR/OPC: Y/N/N• Event Code: 0x45, Max. Inc/Cyc: 1, MT Capture Type: A• Definition: Counts number of prefetch requests issued to the L2I cache. The
reported number includes streaming and non-streaming prefetches.
• NOTE: This event is qualified with IBRP1.
L2I_READS• Title: L2I Cacheable Reads• Category: L2 Instruction Cache and Prefetch IAR/DAR/OPC: Y/N/N• Event Code: 0x78, Max. Inc/Cyc: 1, MT Capture Type: F• Definition: Provides number of cacheable code reads handled by L2I. Event
L2I_READS.MISS.ALL counts only the primary misses. Secondary misses are counted (may be multiple times) in L2I_RECIRCULATES event and finally counted once as L2I_READS.HIT.ALL
• NOTE: This event is qualified with IBRP1.
Table 4-111.Unit Masks for L2I_L3_REJECTS
Extension PMC.umask[19:16] Description
--- xx00 None is counted
DMND xx01 Only demand fetches are counted
PFTCH xx10 Only prefetches are counted
ALL xx11 All fetches are counted
Table 4-112.Unit Masks for L2I_READS (Sheet 1 of 2)
Extension PMC.umask[19:16] Description
--- 00xx None is counted
HIT.NONE 0100 None is counted
HIT.DMND 0101 Only demand fetches that hit the L2I are counted
HIT.PFTCH 0110 Only prefetches that hit the L2I are counted
HIT.ALL 0111 All fetches that hit the L2I are counted
MISS.NONE 1000 None is counted
MISS.DMND 1001 Only demand fetches that miss the L2I are counted
MISS.PFTCH 1010 Only prefetches that miss the L2I are counted
MISS.ALL 1011 All fetches that miss the L2I are counted
ALL.NONE 1100 None is counted
ALL.DMND 1101 Demand fetches that reference L2I are counted
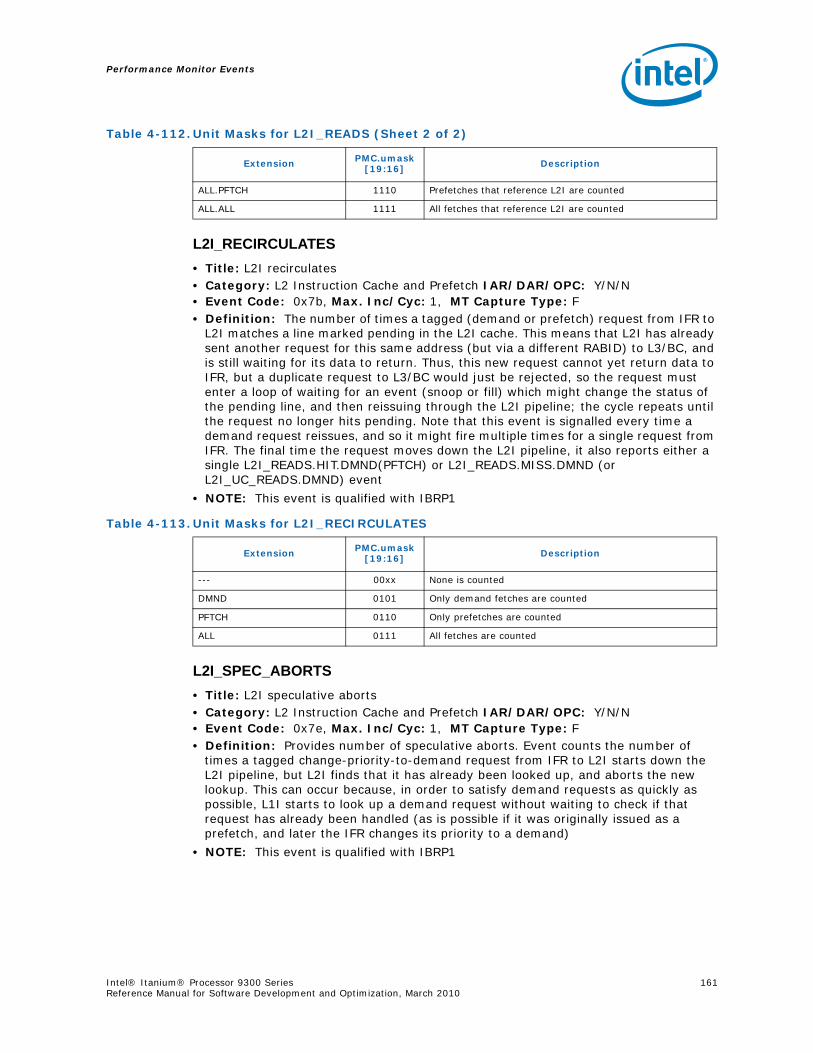
Performance Monitor Events
Intel® Itanium® Processor 9300 Series 161Reference Manual for Software Development and Optimization, March 2010
L2I_RECIRCULATES• Title: L2I recirculates• Category: L2 Instruction Cache and Prefetch IAR/DAR/OPC: Y/N/N• Event Code: 0x7b, Max. Inc/Cyc: 1, MT Capture Type: F• Definition: The number of times a tagged (demand or prefetch) request from IFR to
L2I matches a line marked pending in the L2I cache. This means that L2I has already sent another request for this same address (but via a different RABID) to L3/BC, and is still waiting for its data to return. Thus, this new request cannot yet return data to IFR, but a duplicate request to L3/BC would just be rejected, so the request must enter a loop of waiting for an event (snoop or fill) which might change the status of the pending line, and then reissuing through the L2I pipeline; the cycle repeats until the request no longer hits pending. Note that this event is signalled every time a demand request reissues, and so it might fire multiple times for a single request from IFR. The final time the request moves down the L2I pipeline, it also reports either a single L2I_READS.HIT.DMND(PFTCH) or L2I_READS.MISS.DMND (or L2I_UC_READS.DMND) event
• NOTE: This event is qualified with IBRP1
L2I_SPEC_ABORTS• Title: L2I speculative aborts• Category: L2 Instruction Cache and Prefetch IAR/DAR/OPC: Y/N/N• Event Code: 0x7e, Max. Inc/Cyc: 1, MT Capture Type: F• Definition: Provides number of speculative aborts. Event counts the number of
times a tagged change-priority-to-demand request from IFR to L2I starts down the L2I pipeline, but L2I finds that it has already been looked up, and aborts the new lookup. This can occur because, in order to satisfy demand requests as quickly as possible, L1I starts to look up a demand request without waiting to check if that request has already been handled (as is possible if it was originally issued as a prefetch, and later the IFR changes its priority to a demand)
• NOTE: This event is qualified with IBRP1
ALL.PFTCH 1110 Prefetches that reference L2I are counted
ALL.ALL 1111 All fetches that reference L2I are counted
Table 4-112.Unit Masks for L2I_READS (Sheet 2 of 2)
Extension PMC.umask[19:16] Description
Table 4-113.Unit Masks for L2I_RECIRCULATES
Extension PMC.umask[19:16] Description
--- 00xx None is counted
DMND 0101 Only demand fetches are counted
PFTCH 0110 Only prefetches are counted
ALL 0111 All fetches are counted
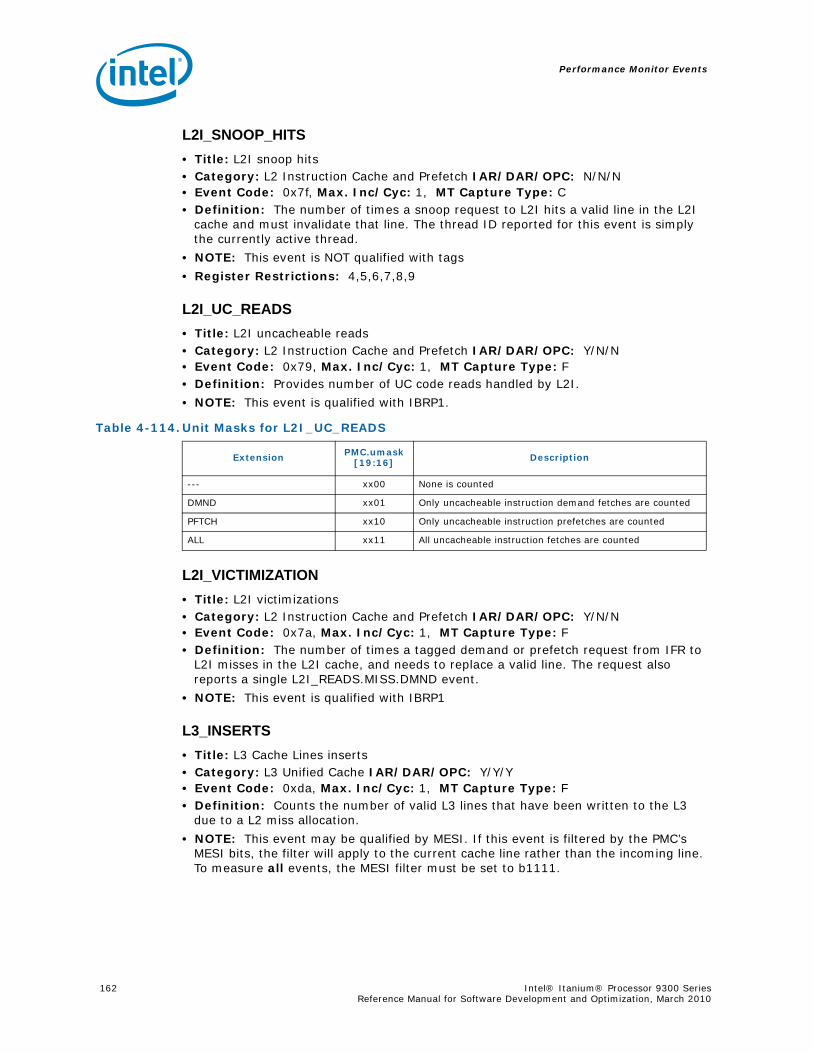
Performance Monitor Events
162 Intel® Itanium® Processor 9300 Series Reference Manual for Software Development and Optimization, March 2010
L2I_SNOOP_HITS• Title: L2I snoop hits• Category: L2 Instruction Cache and Prefetch IAR/DAR/OPC: N/N/N• Event Code: 0x7f, Max. Inc/Cyc: 1, MT Capture Type: C• Definition: The number of times a snoop request to L2I hits a valid line in the L2I
cache and must invalidate that line. The thread ID reported for this event is simply the currently active thread.
• NOTE: This event is NOT qualified with tags
• Register Restrictions: 4,5,6,7,8,9
L2I_UC_READS• Title: L2I uncacheable reads• Category: L2 Instruction Cache and Prefetch IAR/DAR/OPC: Y/N/N• Event Code: 0x79, Max. Inc/Cyc: 1, MT Capture Type: F• Definition: Provides number of UC code reads handled by L2I.
• NOTE: This event is qualified with IBRP1.
L2I_VICTIMIZATION• Title: L2I victimizations• Category: L2 Instruction Cache and Prefetch IAR/DAR/OPC: Y/N/N• Event Code: 0x7a, Max. Inc/Cyc: 1, MT Capture Type: F• Definition: The number of times a tagged demand or prefetch request from IFR to
L2I misses in the L2I cache, and needs to replace a valid line. The request also reports a single L2I_READS.MISS.DMND event.
• NOTE: This event is qualified with IBRP1
L3_INSERTS• Title: L3 Cache Lines inserts• Category: L3 Unified Cache IAR/DAR/OPC: Y/Y/Y• Event Code: 0xda, Max. Inc/Cyc: 1, MT Capture Type: F• Definition: Counts the number of valid L3 lines that have been written to the L3
due to a L2 miss allocation.
• NOTE: This event may be qualified by MESI. If this event is filtered by the PMC’s MESI bits, the filter will apply to the current cache line rather than the incoming line. To measure all events, the MESI filter must be set to b1111.
Table 4-114.Unit Masks for L2I_UC_READS
Extension PMC.umask[19:16] Description
--- xx00 None is counted
DMND xx01 Only uncacheable instruction demand fetches are counted
PFTCH xx10 Only uncacheable instruction prefetches are counted
ALL xx11 All uncacheable instruction fetches are counted
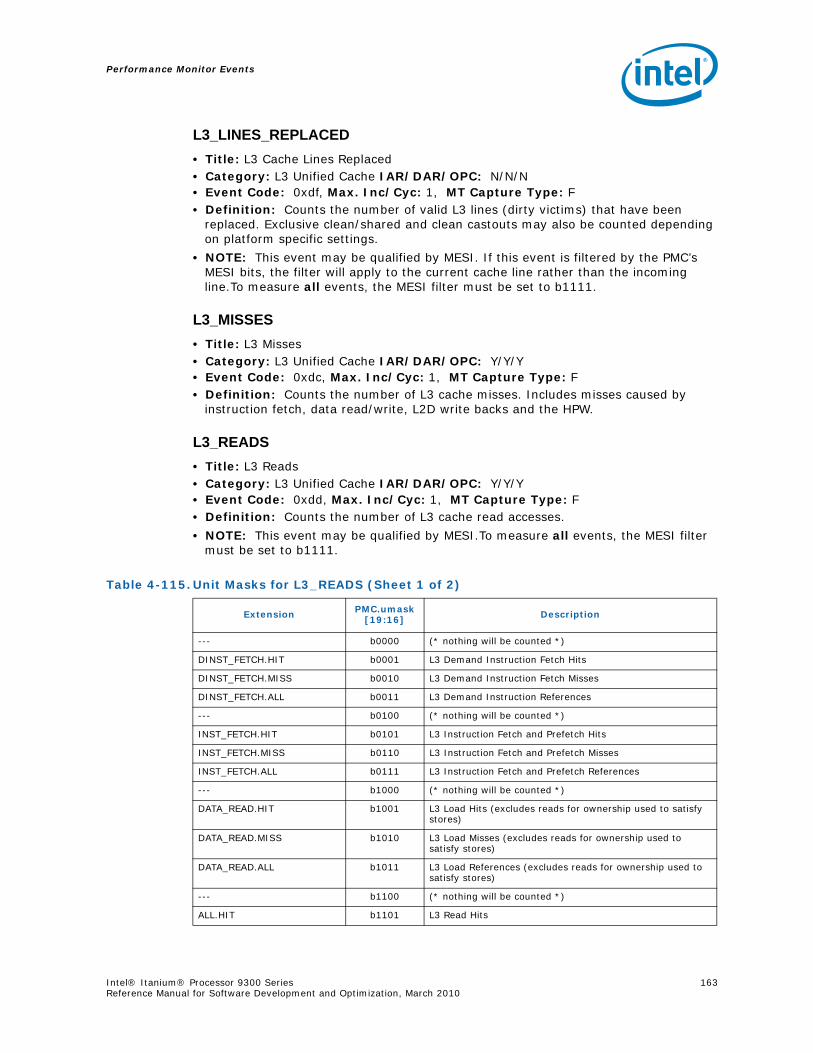
Performance Monitor Events
Intel® Itanium® Processor 9300 Series 163Reference Manual for Software Development and Optimization, March 2010
L3_LINES_REPLACED• Title: L3 Cache Lines Replaced• Category: L3 Unified Cache IAR/DAR/OPC: N/N/N• Event Code: 0xdf, Max. Inc/Cyc: 1, MT Capture Type: F• Definition: Counts the number of valid L3 lines (dirty victims) that have been
replaced. Exclusive clean/shared and clean castouts may also be counted depending on platform specific settings.
• NOTE: This event may be qualified by MESI. If this event is filtered by the PMC’s MESI bits, the filter will apply to the current cache line rather than the incoming line.To measure all events, the MESI filter must be set to b1111.
L3_MISSES• Title: L3 Misses• Category: L3 Unified Cache IAR/DAR/OPC: Y/Y/Y• Event Code: 0xdc, Max. Inc/Cyc: 1, MT Capture Type: F• Definition: Counts the number of L3 cache misses. Includes misses caused by
instruction fetch, data read/write, L2D write backs and the HPW.
L3_READS• Title: L3 Reads• Category: L3 Unified Cache IAR/DAR/OPC: Y/Y/Y• Event Code: 0xdd, Max. Inc/Cyc: 1, MT Capture Type: F• Definition: Counts the number of L3 cache read accesses.
• NOTE: This event may be qualified by MESI.To measure all events, the MESI filter must be set to b1111.
Table 4-115.Unit Masks for L3_READS (Sheet 1 of 2)
Extension PMC.umask[19:16] Description
--- b0000 (* nothing will be counted *)
DINST_FETCH.HIT b0001 L3 Demand Instruction Fetch Hits
DINST_FETCH.MISS b0010 L3 Demand Instruction Fetch Misses
DINST_FETCH.ALL b0011 L3 Demand Instruction References
--- b0100 (* nothing will be counted *)
INST_FETCH.HIT b0101 L3 Instruction Fetch and Prefetch Hits
INST_FETCH.MISS b0110 L3 Instruction Fetch and Prefetch Misses
INST_FETCH.ALL b0111 L3 Instruction Fetch and Prefetch References
--- b1000 (* nothing will be counted *)
DATA_READ.HIT b1001 L3 Load Hits (excludes reads for ownership used to satisfy stores)
DATA_READ.MISS b1010 L3 Load Misses (excludes reads for ownership used to satisfy stores)
DATA_READ.ALL b1011 L3 Load References (excludes reads for ownership used to satisfy stores)
--- b1100 (* nothing will be counted *)
ALL.HIT b1101 L3 Read Hits
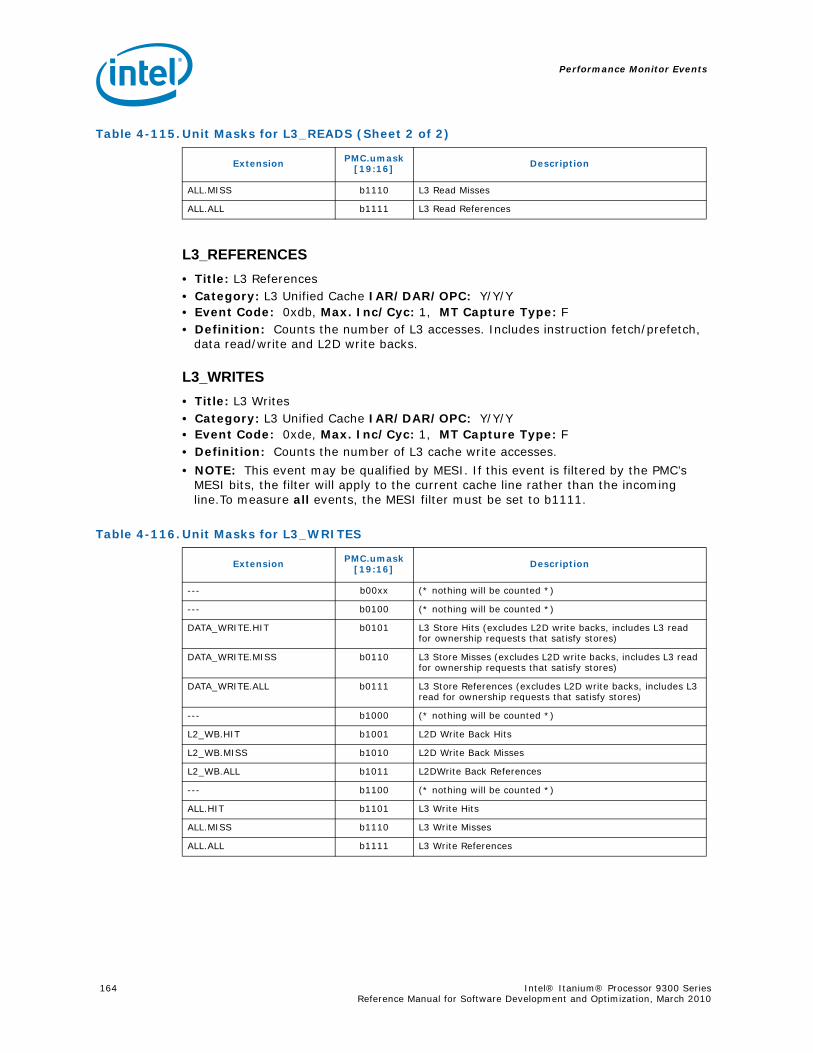
Performance Monitor Events
164 Intel® Itanium® Processor 9300 Series Reference Manual for Software Development and Optimization, March 2010
L3_REFERENCES• Title: L3 References• Category: L3 Unified Cache IAR/DAR/OPC: Y/Y/Y• Event Code: 0xdb, Max. Inc/Cyc: 1, MT Capture Type: F• Definition: Counts the number of L3 accesses. Includes instruction fetch/prefetch,
data read/write and L2D write backs.
L3_WRITES• Title: L3 Writes• Category: L3 Unified Cache IAR/DAR/OPC: Y/Y/Y• Event Code: 0xde, Max. Inc/Cyc: 1, MT Capture Type: F• Definition: Counts the number of L3 cache write accesses.
• NOTE: This event may be qualified by MESI. If this event is filtered by the PMC’s MESI bits, the filter will apply to the current cache line rather than the incoming line.To measure all events, the MESI filter must be set to b1111.
ALL.MISS b1110 L3 Read Misses
ALL.ALL b1111 L3 Read References
Table 4-115.Unit Masks for L3_READS (Sheet 2 of 2)
Extension PMC.umask[19:16] Description
Table 4-116.Unit Masks for L3_WRITES
Extension PMC.umask[19:16] Description
--- b00xx (* nothing will be counted *)
--- b0100 (* nothing will be counted *)
DATA_WRITE.HIT b0101 L3 Store Hits (excludes L2D write backs, includes L3 read for ownership requests that satisfy stores)
DATA_WRITE.MISS b0110 L3 Store Misses (excludes L2D write backs, includes L3 read for ownership requests that satisfy stores)
DATA_WRITE.ALL b0111 L3 Store References (excludes L2D write backs, includes L3 read for ownership requests that satisfy stores)
--- b1000 (* nothing will be counted *)
L2_WB.HIT b1001 L2D Write Back Hits
L2_WB.MISS b1010 L2D Write Back Misses
L2_WB.ALL b1011 L2DWrite Back References
--- b1100 (* nothing will be counted *)
ALL.HIT b1101 L3 Write Hits
ALL.MISS b1110 L3 Write Misses
ALL.ALL b1111 L3 Write References
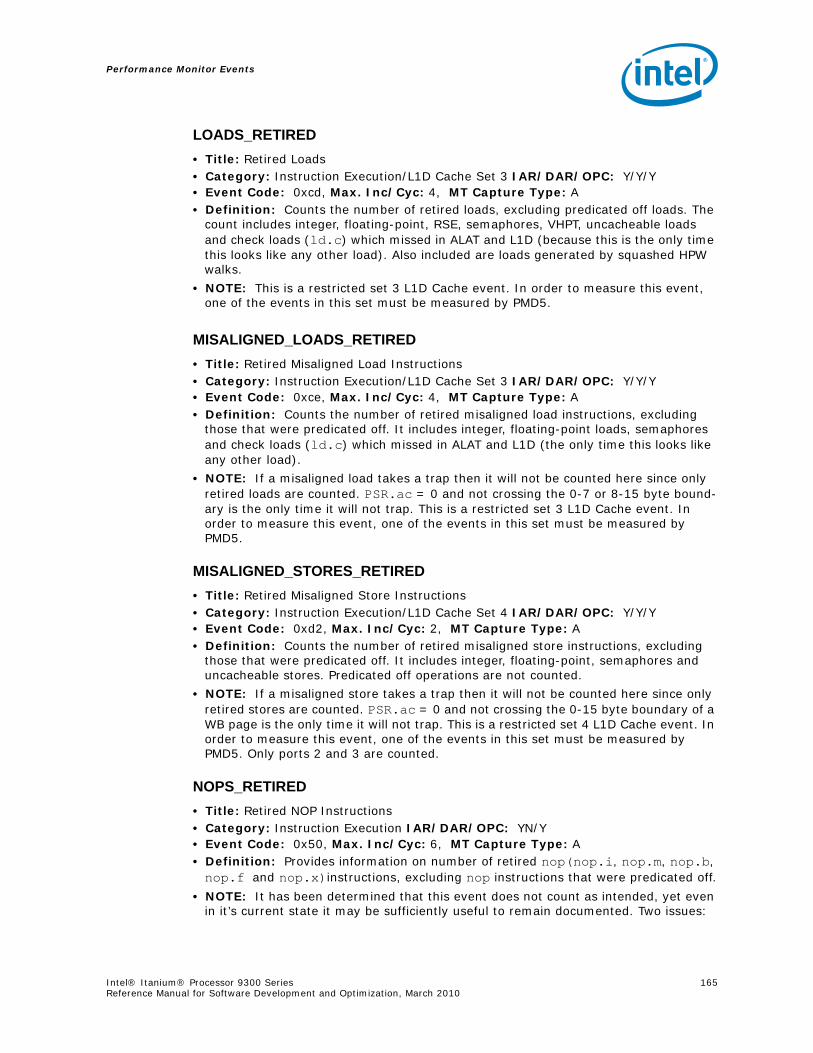
Performance Monitor Events
Intel® Itanium® Processor 9300 Series 165Reference Manual for Software Development and Optimization, March 2010
LOADS_RETIRED• Title: Retired Loads• Category: Instruction Execution/L1D Cache Set 3 IAR/DAR/OPC: Y/Y/Y• Event Code: 0xcd, Max. Inc/Cyc: 4, MT Capture Type: A• Definition: Counts the number of retired loads, excluding predicated off loads. The
count includes integer, floating-point, RSE, semaphores, VHPT, uncacheable loads and check loads (ld.c) which missed in ALAT and L1D (because this is the only time this looks like any other load). Also included are loads generated by squashed HPW walks.
• NOTE: This is a restricted set 3 L1D Cache event. In order to measure this event, one of the events in this set must be measured by PMD5.
MISALIGNED_LOADS_RETIRED• Title: Retired Misaligned Load Instructions• Category: Instruction Execution/L1D Cache Set 3 IAR/DAR/OPC: Y/Y/Y• Event Code: 0xce, Max. Inc/Cyc: 4, MT Capture Type: A• Definition: Counts the number of retired misaligned load instructions, excluding
those that were predicated off. It includes integer, floating-point loads, semaphores and check loads (ld.c) which missed in ALAT and L1D (the only time this looks like any other load).
• NOTE: If a misaligned load takes a trap then it will not be counted here since only retired loads are counted. PSR.ac = 0 and not crossing the 0-7 or 8-15 byte bound-ary is the only time it will not trap. This is a restricted set 3 L1D Cache event. In order to measure this event, one of the events in this set must be measured by PMD5.
MISALIGNED_STORES_RETIRED• Title: Retired Misaligned Store Instructions• Category: Instruction Execution/L1D Cache Set 4 IAR/DAR/OPC: Y/Y/Y• Event Code: 0xd2, Max. Inc/Cyc: 2, MT Capture Type: A• Definition: Counts the number of retired misaligned store instructions, excluding
those that were predicated off. It includes integer, floating-point, semaphores and uncacheable stores. Predicated off operations are not counted.
• NOTE: If a misaligned store takes a trap then it will not be counted here since only retired stores are counted. PSR.ac = 0 and not crossing the 0-15 byte boundary of a WB page is the only time it will not trap. This is a restricted set 4 L1D Cache event. In order to measure this event, one of the events in this set must be measured by PMD5. Only ports 2 and 3 are counted.
NOPS_RETIRED• Title: Retired NOP Instructions• Category: Instruction Execution IAR/DAR/OPC: YN/Y• Event Code: 0x50, Max. Inc/Cyc: 6, MT Capture Type: A• Definition: Provides information on number of retired nop(nop.i, nop.m, nop.b, nop.f and nop.x)instructions, excluding nop instructions that were predicated off.
• NOTE: It has been determined that this event does not count as intended, yet even in it’s current state it may be sufficiently useful to remain documented. Two issues:
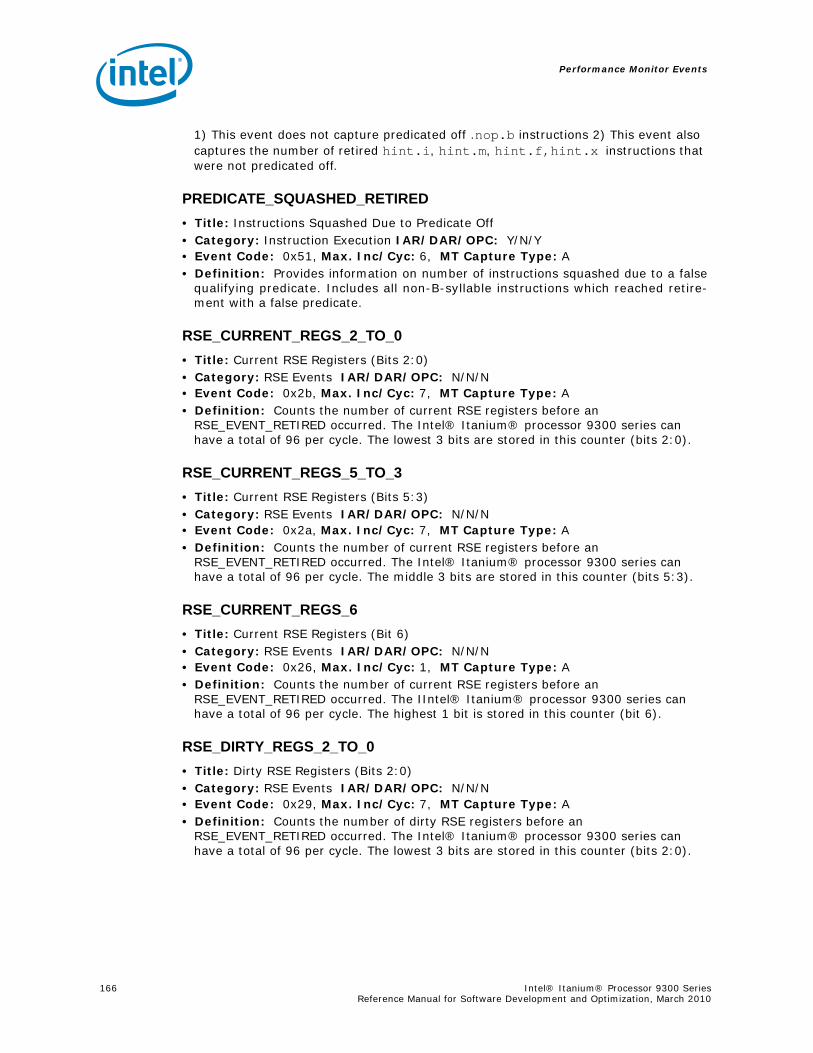
Performance Monitor Events
166 Intel® Itanium® Processor 9300 Series Reference Manual for Software Development and Optimization, March 2010
1) This event does not capture predicated off .nop.b instructions 2) This event also captures the number of retired hint.i, hint.m, hint.f,hint.x instructions that were not predicated off.
PREDICATE_SQUASHED_RETIRED• Title: Instructions Squashed Due to Predicate Off• Category: Instruction Execution IAR/DAR/OPC: Y/N/Y• Event Code: 0x51, Max. Inc/Cyc: 6, MT Capture Type: A• Definition: Provides information on number of instructions squashed due to a false
qualifying predicate. Includes all non-B-syllable instructions which reached retire-ment with a false predicate.
RSE_CURRENT_REGS_2_TO_0• Title: Current RSE Registers (Bits 2:0)• Category: RSE Events IAR/DAR/OPC: N/N/N• Event Code: 0x2b, Max. Inc/Cyc: 7, MT Capture Type: A• Definition: Counts the number of current RSE registers before an
RSE_EVENT_RETIRED occurred. The Intel® Itanium® processor 9300 series can have a total of 96 per cycle. The lowest 3 bits are stored in this counter (bits 2:0).
RSE_CURRENT_REGS_5_TO_3• Title: Current RSE Registers (Bits 5:3)• Category: RSE Events IAR/DAR/OPC: N/N/N• Event Code: 0x2a, Max. Inc/Cyc: 7, MT Capture Type: A• Definition: Counts the number of current RSE registers before an
RSE_EVENT_RETIRED occurred. The Intel® Itanium® processor 9300 series can have a total of 96 per cycle. The middle 3 bits are stored in this counter (bits 5:3).
RSE_CURRENT_REGS_6• Title: Current RSE Registers (Bit 6)• Category: RSE Events IAR/DAR/OPC: N/N/N• Event Code: 0x26, Max. Inc/Cyc: 1, MT Capture Type: A• Definition: Counts the number of current RSE registers before an
RSE_EVENT_RETIRED occurred. The IIntel® Itanium® processor 9300 series can have a total of 96 per cycle. The highest 1 bit is stored in this counter (bit 6).
RSE_DIRTY_REGS_2_TO_0• Title: Dirty RSE Registers (Bits 2:0)• Category: RSE Events IAR/DAR/OPC: N/N/N• Event Code: 0x29, Max. Inc/Cyc: 7, MT Capture Type: A• Definition: Counts the number of dirty RSE registers before an
RSE_EVENT_RETIRED occurred. The Intel® Itanium® processor 9300 series can have a total of 96 per cycle. The lowest 3 bits are stored in this counter (bits 2:0).
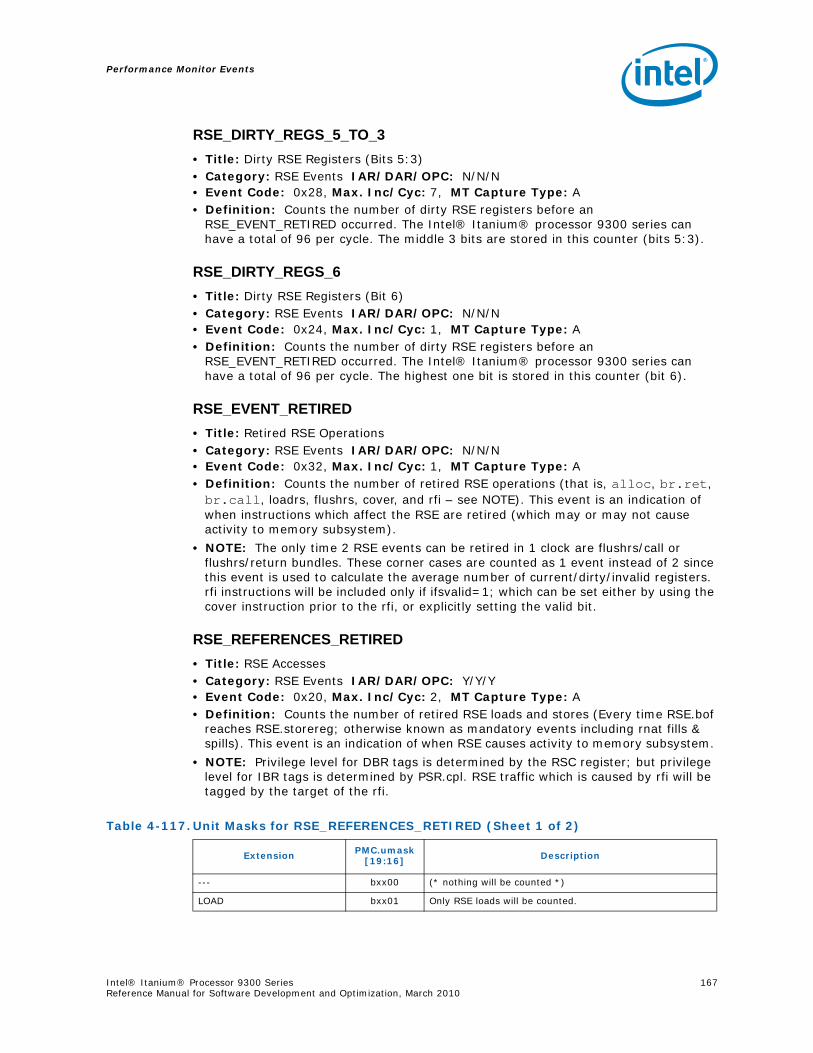
Performance Monitor Events
Intel® Itanium® Processor 9300 Series 167Reference Manual for Software Development and Optimization, March 2010
RSE_DIRTY_REGS_5_TO_3• Title: Dirty RSE Registers (Bits 5:3)• Category: RSE Events IAR/DAR/OPC: N/N/N• Event Code: 0x28, Max. Inc/Cyc: 7, MT Capture Type: A• Definition: Counts the number of dirty RSE registers before an
RSE_EVENT_RETIRED occurred. The Intel® Itanium® processor 9300 series can have a total of 96 per cycle. The middle 3 bits are stored in this counter (bits 5:3).
RSE_DIRTY_REGS_6• Title: Dirty RSE Registers (Bit 6)• Category: RSE Events IAR/DAR/OPC: N/N/N• Event Code: 0x24, Max. Inc/Cyc: 1, MT Capture Type: A• Definition: Counts the number of dirty RSE registers before an
RSE_EVENT_RETIRED occurred. The Intel® Itanium® processor 9300 series can have a total of 96 per cycle. The highest one bit is stored in this counter (bit 6).
RSE_EVENT_RETIRED• Title: Retired RSE Operations• Category: RSE Events IAR/DAR/OPC: N/N/N• Event Code: 0x32, Max. Inc/Cyc: 1, MT Capture Type: A• Definition: Counts the number of retired RSE operations (that is, alloc, br.ret, br.call, loadrs, flushrs, cover, and rfi – see NOTE). This event is an indication of when instructions which affect the RSE are retired (which may or may not cause activity to memory subsystem).
• NOTE: The only time 2 RSE events can be retired in 1 clock are flushrs/call or flushrs/return bundles. These corner cases are counted as 1 event instead of 2 since this event is used to calculate the average number of current/dirty/invalid registers. rfi instructions will be included only if ifsvalid=1; which can be set either by using the cover instruction prior to the rfi, or explicitly setting the valid bit.
RSE_REFERENCES_RETIRED• Title: RSE Accesses• Category: RSE Events IAR/DAR/OPC: Y/Y/Y• Event Code: 0x20, Max. Inc/Cyc: 2, MT Capture Type: A• Definition: Counts the number of retired RSE loads and stores (Every time RSE.bof
reaches RSE.storereg; otherwise known as mandatory events including rnat fills & spills). This event is an indication of when RSE causes activity to memory subsystem.
• NOTE: Privilege level for DBR tags is determined by the RSC register; but privilege level for IBR tags is determined by PSR.cpl. RSE traffic which is caused by rfi will be tagged by the target of the rfi.
Table 4-117.Unit Masks for RSE_REFERENCES_RETIRED (Sheet 1 of 2)
Extension PMC.umask[19:16] Description
--- bxx00 (* nothing will be counted *)
LOAD bxx01 Only RSE loads will be counted.
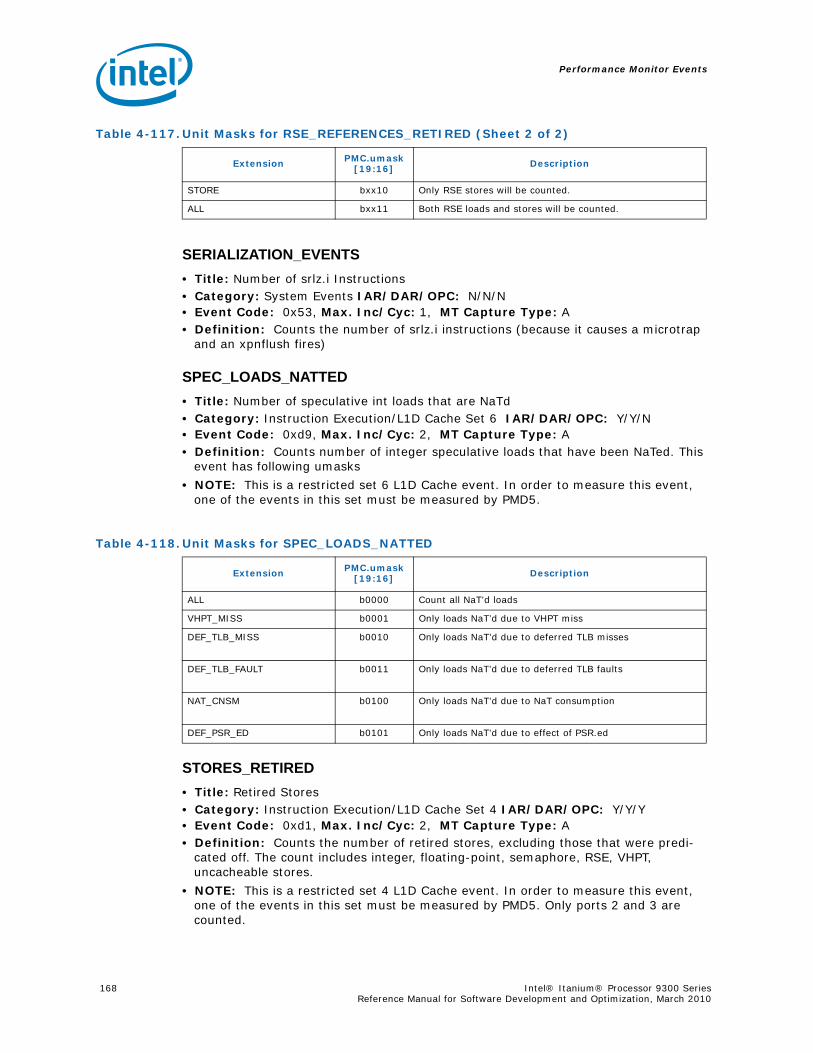
Performance Monitor Events
168 Intel® Itanium® Processor 9300 Series Reference Manual for Software Development and Optimization, March 2010
SERIALIZATION_EVENTS• Title: Number of srlz.i Instructions• Category: System Events IAR/DAR/OPC: N/N/N• Event Code: 0x53, Max. Inc/Cyc: 1, MT Capture Type: A• Definition: Counts the number of srlz.i instructions (because it causes a microtrap
and an xpnflush fires)
SPEC_LOADS_NATTED• Title: Number of speculative int loads that are NaTd• Category: Instruction Execution/L1D Cache Set 6 IAR/DAR/OPC: Y/Y/N• Event Code: 0xd9, Max. Inc/Cyc: 2, MT Capture Type: A• Definition: Counts number of integer speculative loads that have been NaTed. This
event has following umasks
• NOTE: This is a restricted set 6 L1D Cache event. In order to measure this event, one of the events in this set must be measured by PMD5.
STORES_RETIRED• Title: Retired Stores• Category: Instruction Execution/L1D Cache Set 4 IAR/DAR/OPC: Y/Y/Y• Event Code: 0xd1, Max. Inc/Cyc: 2, MT Capture Type: A• Definition: Counts the number of retired stores, excluding those that were predi-
cated off. The count includes integer, floating-point, semaphore, RSE, VHPT, uncacheable stores.
• NOTE: This is a restricted set 4 L1D Cache event. In order to measure this event, one of the events in this set must be measured by PMD5. Only ports 2 and 3 are counted.
STORE bxx10 Only RSE stores will be counted.
ALL bxx11 Both RSE loads and stores will be counted.
Table 4-117.Unit Masks for RSE_REFERENCES_RETIRED (Sheet 2 of 2)
Extension PMC.umask[19:16] Description
Table 4-118.Unit Masks for SPEC_LOADS_NATTED
Extension PMC.umask[19:16] Description
ALL b0000 Count all NaT’d loads
VHPT_MISS b0001 Only loads NaT’d due to VHPT miss
DEF_TLB_MISS b0010 Only loads NaT’d due to deferred TLB misses
DEF_TLB_FAULT b0011 Only loads NaT’d due to deferred TLB faults
NAT_CNSM b0100 Only loads NaT’d due to NaT consumption
DEF_PSR_ED b0101 Only loads NaT’d due to effect of PSR.ed

Performance Monitor Events
Intel® Itanium® Processor 9300 Series 169Reference Manual for Software Development and Optimization, March 2010
SYLL_NOT_DISPERSED• Title: Syllables Not Dispersed• Category: Instruction Dispersal Events IAR/DAR/OPC: Y/N/N• Event Code: 0x4e, Max. Inc/Cyc: 5, MT Capture Type: A• Definition: Counts the number of syllables not dispersed due to all reasons except
stalls. A unit mask can break this down to 1 of 4 possible components.
Table 4-119.Unit Masks for SYLL_NOT_DISPERSED (Sheet 1 of 2)
Extension PMC.umask[19:16] Description
EXPL b0001 Count syllables not dispersed due to explicit stop bits. These consist of programmer specified architected S-bit and templates 1 and 5. Dispersal takes a 6-syllable (3-syllable) hit for every template 1/5 in bundle 0(1). Dispersal takes a 3-syllable (0 syllable) hit for every S-bit in bundle 0(1)
IMPL b0010 Count syllables not dispersed due to implicit stop bits. These consist of all of the non-architected stop bits (asymmetry, oversubscription, implicit). Dispersal takes a 6-syllable (3-syllable) hit for every implicit stop bits in bundle 0(1).
IMPL_EXPL b0011 Count syllables not dispersed due to either implicit or explicit stop bits. See component umask (b0001, b0010) descriptions for more details.
FE b0100 Count syllables not dispersed due to front-end not providing valid bundles or providing valid illegal templates. Dispersal takes a 3-syllable hit for every invalid bundle or valid illegal template from front-end. Bundle 1 with front-end fault, is counted here (3-syllable hit).
FE_EXPL b0101 Count syllables not dispersed due to either the front-end not providing valid bundles/templates or explicit stop bits. See component umask (b0001, b0100) descriptions for more details.
FE_IMPL b0110 Count syllables not dispersed due to either the front-end not providing valid bundles/templates or implicit stop bits. See component umask (b0010, b0100) descriptions for more details.
FE_IMPL_EXPL b0111 Count syllables not dispersed due to either the front-end not providing valid bundles/templates, explicit or implicit stop bits. See component umask (b0001, b0010, b0100) descriptions for more details.
MLX b1000 Count syllables not dispersed due to MLX bundle and resteers to non-0 syllable. Dispersal takes a 1 syllable hit for each MLX bundle. Dispersal could take 0-2 syllable hit de pending on which syllable we re-steer to. Bundle 1 with front-end fault which is split, is counted here (0-2 syllable hit).
MLX_EXPL b1001 Count syllables not dispersed due to either an MLX bundle and resteer to non-0 syllable or explicit stop bits. See component umask (b0001, b1000) descriptions for more details.
MLX_IMPL b1010 Count syllables not dispersed due to either an MLX bundle and resteer to non-0 syllable or implicit stop bits. See component umask (b0010, b1000,) descriptions for more details.
MLX_IMPL_EXPL b1011 Count syllables not dispersed due to either an MLX bundle and resteer to non-0 syllable, implicit or explicit stop bits. See component umask (b0001, b0010, b1000) descriptions for more details.
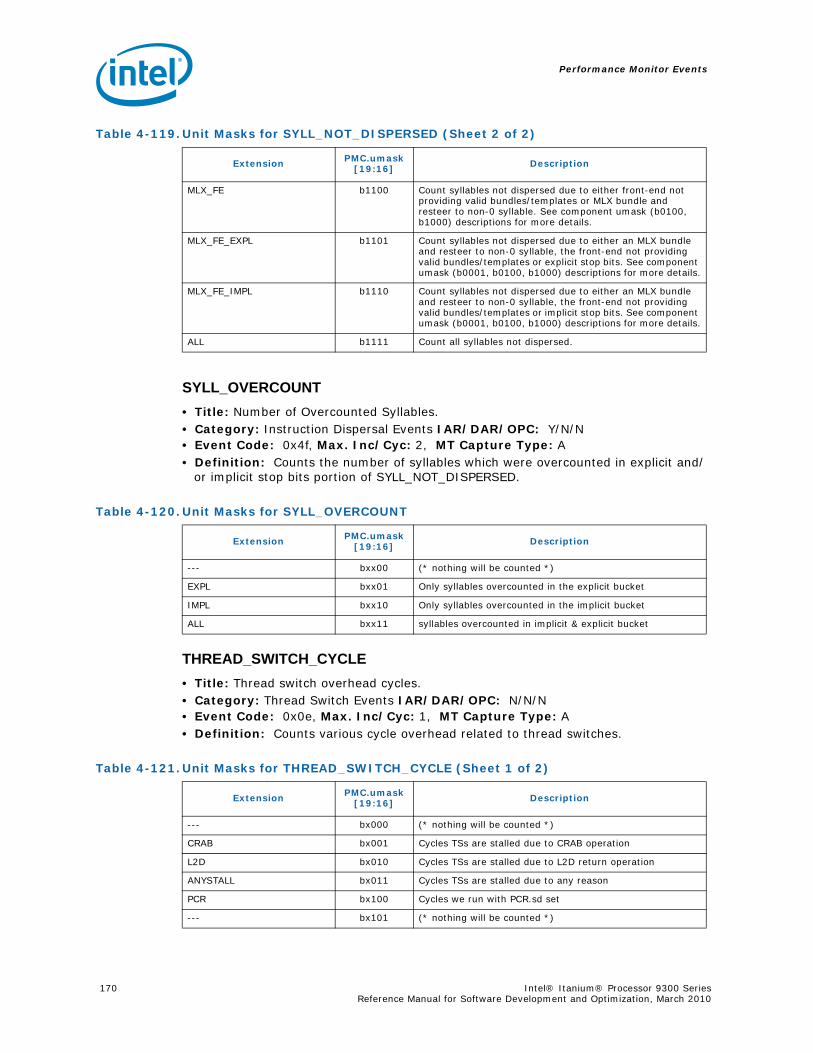
Performance Monitor Events
170 Intel® Itanium® Processor 9300 Series Reference Manual for Software Development and Optimization, March 2010
SYLL_OVERCOUNT• Title: Number of Overcounted Syllables.• Category: Instruction Dispersal Events IAR/DAR/OPC: Y/N/N• Event Code: 0x4f, Max. Inc/Cyc: 2, MT Capture Type: A• Definition: Counts the number of syllables which were overcounted in explicit and/
or implicit stop bits portion of SYLL_NOT_DISPERSED.
THREAD_SWITCH_CYCLE• Title: Thread switch overhead cycles.• Category: Thread Switch Events IAR/DAR/OPC: N/N/N• Event Code: 0x0e, Max. Inc/Cyc: 1, MT Capture Type: A• Definition: Counts various cycle overhead related to thread switches.
MLX_FE b1100 Count syllables not dispersed due to either front-end not providing valid bundles/templates or MLX bundle and resteer to non-0 syllable. See component umask (b0100, b1000) descriptions for more details.
MLX_FE_EXPL b1101 Count syllables not dispersed due to either an MLX bundle and resteer to non-0 syllable, the front-end not providing valid bundles/templates or explicit stop bits. See component umask (b0001, b0100, b1000) descriptions for more details.
MLX_FE_IMPL b1110 Count syllables not dispersed due to either an MLX bundle and resteer to non-0 syllable, the front-end not providing valid bundles/templates or implicit stop bits. See component umask (b0001, b0100, b1000) descriptions for more details.
ALL b1111 Count all syllables not dispersed.
Table 4-119.Unit Masks for SYLL_NOT_DISPERSED (Sheet 2 of 2)
Extension PMC.umask[19:16] Description
Table 4-120.Unit Masks for SYLL_OVERCOUNT
Extension PMC.umask[19:16] Description
--- bxx00 (* nothing will be counted *)
EXPL bxx01 Only syllables overcounted in the explicit bucket
IMPL bxx10 Only syllables overcounted in the implicit bucket
ALL bxx11 syllables overcounted in implicit & explicit bucket
Table 4-121.Unit Masks for THREAD_SWITCH_CYCLE (Sheet 1 of 2)
Extension PMC.umask[19:16] Description
--- bx000 (* nothing will be counted *)
CRAB bx001 Cycles TSs are stalled due to CRAB operation
L2D bx010 Cycles TSs are stalled due to L2D return operation
ANYSTALL bx011 Cycles TSs are stalled due to any reason
PCR bx100 Cycles we run with PCR.sd set
--- bx101 (* nothing will be counted *)

Performance Monitor Events
Intel® Itanium® Processor 9300 Series 171Reference Manual for Software Development and Optimization, March 2010
THREAD_SWITCH_EVENTS• Title: Thread switch events.• Category: Thread Switch Events IAR/DAR/OPC: N/N/N• Event Code: 0x0c, Max. Inc/Cyc: 1, MT Capture Type: A• Definition: Counts the number of thread switches and their causes.
THREAD_SWITCH_GATED• Title: Thread switches gated• Category: Thread Switch Events IAR/DAR/OPC: N/N/N• Event Code: 0x0d, Max. Inc/Cyc: 1, MT Capture Type: A• Definition: Counts the number of thread switches gated and their causes.
ALL_GATED bx110 Cycles TSs are gated due to any reasonNOTE: THREAD_SWITCH_GATED event is available to monitor the number of times TSs have been gated.
TOTAL bx111 Total time from TS opportunity is seized to TS happens.
Table 4-121.Unit Masks for THREAD_SWITCH_CYCLE (Sheet 2 of 2)
Extension PMC.umask[19:16] Description
Table 4-122.Unit Masks for THREAD_SWITCH_EVENTS
Extension PMC.umask[19:16] Description
MISSED bx000 TS opportunities missed
L3MISS bx001 TSs due to L3 miss
TIMER bx010 TSs due to time out
HINT bx011 TSs due to hint instruction
LP_EXE_STALL bx100 TSs due to low power operation or an EXE stall.
L2RTRN bx101 TSs due to L2 returns in the ‘other’ thread. TSs caused by debug operations are also counter here.
ALAT bx110 TSs due to ALAT invalidation of the ‘other’ thread. TSs caused by the HW Event Injector are also counted here.
ALL bx111 All taken TSs
Table 4-123.Unit Masks for THREAD_SWITCH_GATED
Extension PMC.umask[19:16] Description
--- bx000 (* nothing will be counted *)
LP bx001 TSs gated due to LP
--- bx010 (* nothing will be counted *)
--- bx011 (* nothing will be counted *)
PIPE bx100 Gated due to pipeline operations
FWDPRO bx101 Gated due to forward progress reasons
--- bx110 (* nothing will be counted *)
ALL bx111 TSs gated for any reason
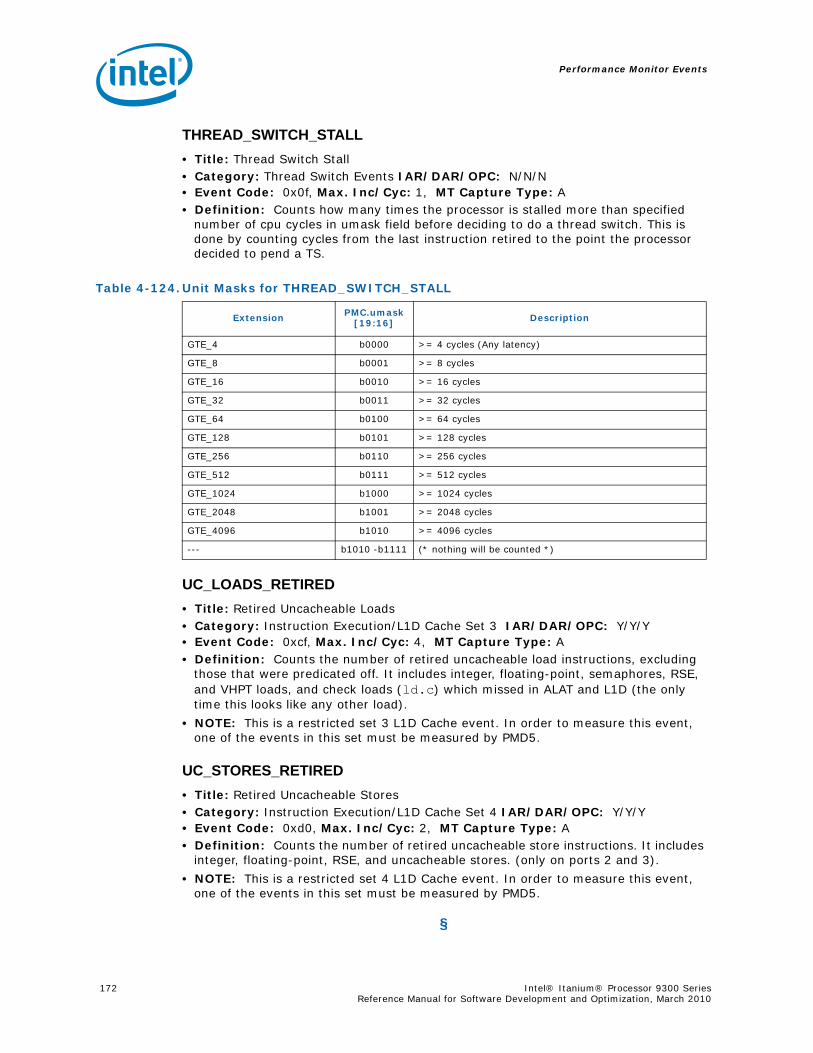
Performance Monitor Events
172 Intel® Itanium® Processor 9300 Series Reference Manual for Software Development and Optimization, March 2010
THREAD_SWITCH_STALL• Title: Thread Switch Stall• Category: Thread Switch Events IAR/DAR/OPC: N/N/N• Event Code: 0x0f, Max. Inc/Cyc: 1, MT Capture Type: A• Definition: Counts how many times the processor is stalled more than specified
number of cpu cycles in umask field before deciding to do a thread switch. This is done by counting cycles from the last instruction retired to the point the processor decided to pend a TS.
UC_LOADS_RETIRED• Title: Retired Uncacheable Loads• Category: Instruction Execution/L1D Cache Set 3 IAR/DAR/OPC: Y/Y/Y• Event Code: 0xcf, Max. Inc/Cyc: 4, MT Capture Type: A• Definition: Counts the number of retired uncacheable load instructions, excluding
those that were predicated off. It includes integer, floating-point, semaphores, RSE, and VHPT loads, and check loads (ld.c) which missed in ALAT and L1D (the only time this looks like any other load).
• NOTE: This is a restricted set 3 L1D Cache event. In order to measure this event, one of the events in this set must be measured by PMD5.
UC_STORES_RETIRED• Title: Retired Uncacheable Stores• Category: Instruction Execution/L1D Cache Set 4 IAR/DAR/OPC: Y/Y/Y• Event Code: 0xd0, Max. Inc/Cyc: 2, MT Capture Type: A• Definition: Counts the number of retired uncacheable store instructions. It includes
integer, floating-point, RSE, and uncacheable stores. (only on ports 2 and 3).
• NOTE: This is a restricted set 4 L1D Cache event. In order to measure this event, one of the events in this set must be measured by PMD5.
§
Table 4-124.Unit Masks for THREAD_SWITCH_STALL
Extension PMC.umask[19:16] Description
GTE_4 b0000 >= 4 cycles (Any latency)
GTE_8 b0001 >= 8 cycles
GTE_16 b0010 >= 16 cycles
GTE_32 b0011 >= 32 cycles
GTE_64 b0100 >= 64 cycles
GTE_128 b0101 >= 128 cycles
GTE_256 b0110 >= 256 cycles
GTE_512 b0111 >= 512 cycles
GTE_1024 b1000 >= 1024 cycles
GTE_2048 b1001 >= 2048 cycles
GTE_4096 b1010 >= 4096 cycles
--- b1010 -b1111 (* nothing will be counted *)
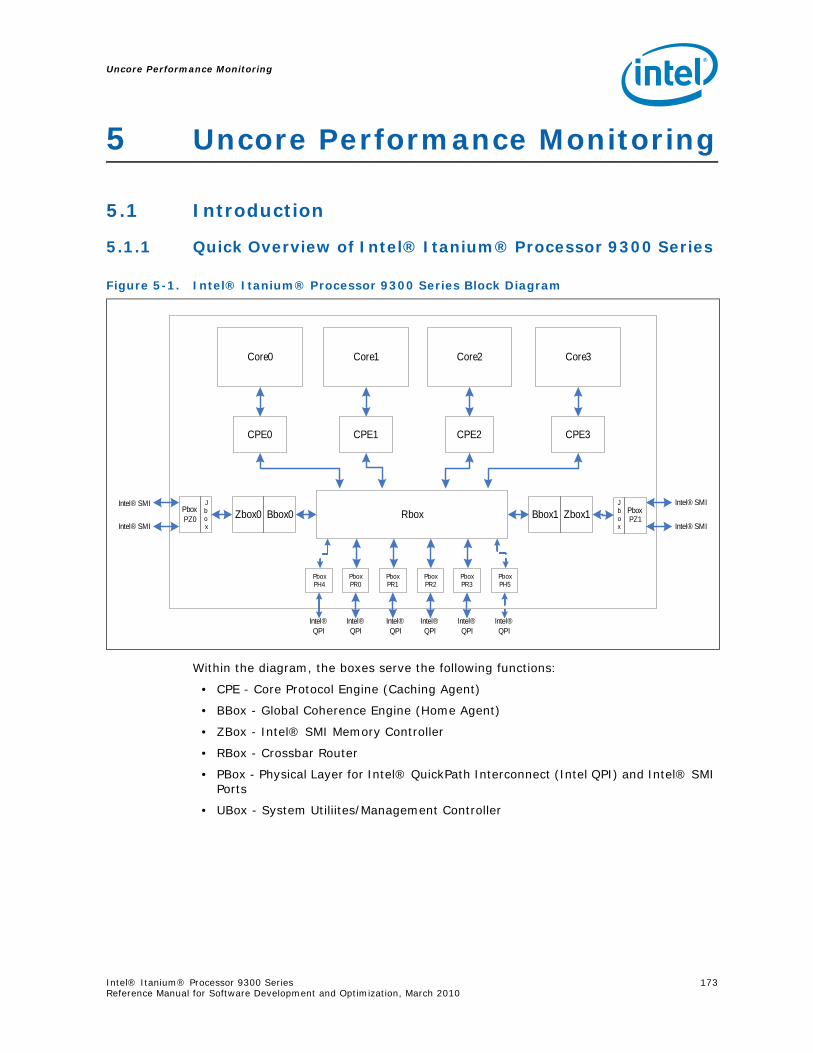
Uncore Performance Monitoring
Intel® Itanium® Processor 9300 Series 173Reference Manual for Software Development and Optimization, March 2010
5 Uncore Performance Monitoring
5.1 Introduction
5.1.1 Quick Overview of Intel® Itanium® Processor 9300 Series
Within the diagram, the boxes serve the following functions:
• CPE - Core Protocol Engine (Caching Agent)
• BBox - Global Coherence Engine (Home Agent)
• ZBox - Intel® SMI Memory Controller
• RBox - Crossbar Router
• PBox - Physical Layer for Intel® QuickPath Interconnect (Intel QPI) and Intel® SMI Ports
• UBox - System Utiliites/Management Controller
Figure 5-1. Intel® Itanium® Processor 9300 Series Block Diagram
Core0 Core3Core2Core1
CPE0 CPE3CPE2CPE1
RboxBbox0Zbox0Jbox
Zbox1Bbox1 Pbox PZ1
Jbox
Pbox PR1
Pbox PR0
Pbox PH4
Pbox PH5
Pbox PR3
Pbox PR2
Intel® SMI Intel® SMI
Intel® QPI
Intel® QPI
Intel® QPI
Intel® QPI
Intel® QPI
Intel® QPI
Pbox PZ0
Intel® SMI Intel® SMI

Uncore Performance Monitoring
174 Intel® Itanium® Processor 9300 Series Reference Manual for Software Development and Optimization, March 2010
5.1.2 Uncore PMU Overview
Intel® Itanium® processor 9300 series uncore performance monitoring is supported by PMUs local to each of the Z, B, and R boxes. PMUs may be frozen locally (per box) or globally, either manually or due to uncore PMU counter overflow. In other words, any of the available uncore PMU ‘counters’ may be configured to freeze, upon overflow, either the other PMUs that reside within its box, or all uncore PMU counters.
All of the Intel® Itanium® processor 9300 series uncore performance monitoring features are accessed through privileged Chip Set Registers (CSRs). SAL or the OS may access CSRs directly rather than asking PAL for access.
The general performance monitoring capabilities in each box are outlined in the following table:
The following sections provide a breakdown of the performance monitoring capabilities of each box:
• Section 5.4, “D-Box Global Performance Monitoring Control”
• Section 5.5, “B-Box Performance Monitoring”
• Section 5.6, “R-Box Performance Monitoring”
• Section 5.7, “Z-Box Performance Monitoring”
• Section 5.8, “Packet Matching Reference”
5.2 Uncore PMU Programming OverviewSoftware can access these CSR registers, which contain the uncore PMUs, through apertures in the physical address space. Although several apertures exist, most of the necessary registers are accessible through the PAL aperture.
To access the a specific register, the address is built in hierarchical fashion beginning with the aperture base address, adding in the socket, then the uncore box of choice and finally the specific CSR residing within the box.
PAL Aperture Base - 0x8003FFFB.xxxxxxxx
PAL Aperture Length - 0x100000000
Table 5-1. Per-Box Performance Monitoring Capabilities
Box # Boxes#
Counters/Box
Generic Counters?
Packet Match/Mask
Filters?Bit Width
BBox 2 8 N, subctl Y 40
ZBox 2 5 N, subctl N 40(split 32+8)
RBox 1 (L/R sides) 12 (2 per port, 6 per side)
N, subctl Y 48, (split
32+16)
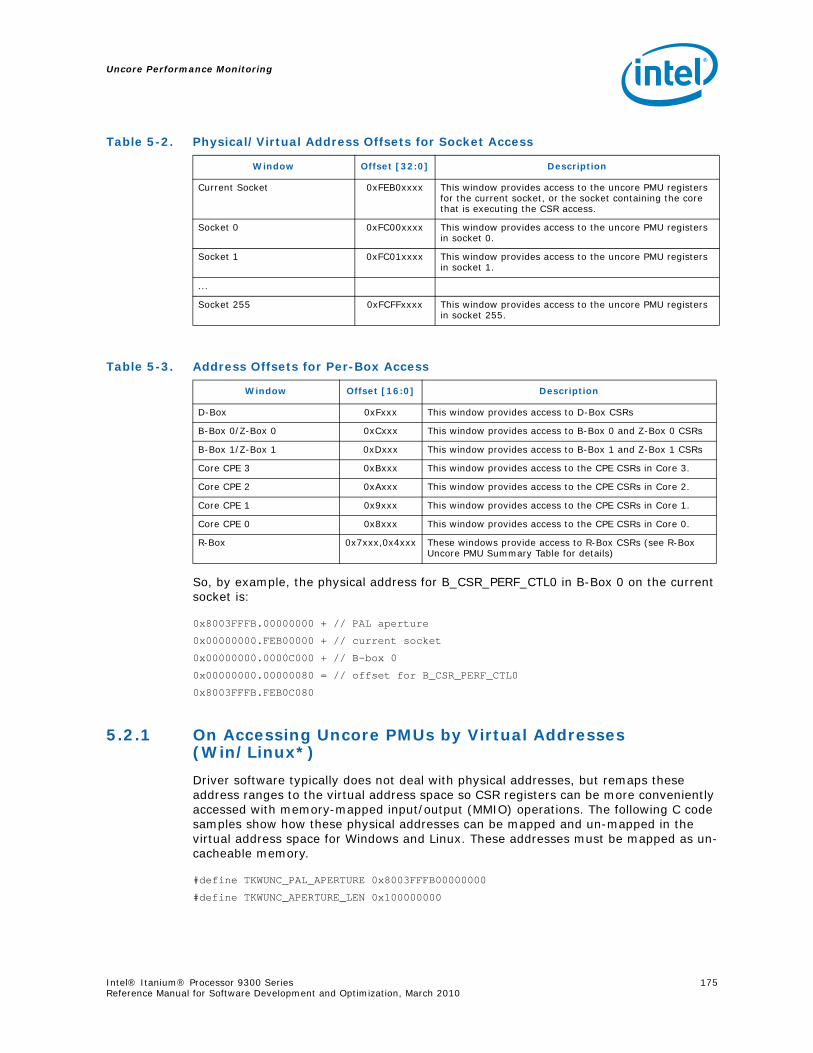
Uncore Performance Monitoring
Intel® Itanium® Processor 9300 Series 175Reference Manual for Software Development and Optimization, March 2010
So, by example, the physical address for B_CSR_PERF_CTL0 in B-Box 0 on the current socket is:
0x8003FFFB.00000000 + // PAL aperture
0x00000000.FEB00000 + // current socket
0x00000000.0000C000 + // B-box 0
0x00000000.00000080 = // offset for B_CSR_PERF_CTL0
0x8003FFFB.FEB0C080
5.2.1 On Accessing Uncore PMUs by Virtual Addresses (Win/Linux*)
Driver software typically does not deal with physical addresses, but remaps these address ranges to the virtual address space so CSR registers can be more conveniently accessed with memory-mapped input/output (MMIO) operations. The following C code samples show how these physical addresses can be mapped and un-mapped in the virtual address space for Windows and Linux. These addresses must be mapped as un-cacheable memory.
#define TKWUNC_PAL_APERTURE 0x8003FFFB00000000
#define TKWUNC_APERTURE_LEN 0x100000000
Table 5-2. Physical/Virtual Address Offsets for Socket Access
Window Offset [32:0] Description
Current Socket 0xFEB0xxxx This window provides access to the uncore PMU registers for the current socket, or the socket containing the core that is executing the CSR access.
Socket 0 0xFC00xxxx This window provides access to the uncore PMU registers in socket 0.
Socket 1 0xFC01xxxx This window provides access to the uncore PMU registers in socket 1.
...
Socket 255 0xFCFFxxxx This window provides access to the uncore PMU registers in socket 255.
Table 5-3. Address Offsets for Per-Box Access
Window Offset [16:0] Description
D-Box 0xFxxx This window provides access to D-Box CSRs
B-Box 0/Z-Box 0 0xCxxx This window provides access to B-Box 0 and Z-Box 0 CSRs
B-Box 1/Z-Box 1 0xDxxx This window provides access to B-Box 1 and Z-Box 1 CSRs
Core CPE 3 0xBxxx This window provides access to the CPE CSRs in Core 3.
Core CPE 2 0xAxxx This window provides access to the CPE CSRs in Core 2.
Core CPE 1 0x9xxx This window provides access to the CPE CSRs in Core 1.
Core CPE 0 0x8xxx This window provides access to the CPE CSRs in Core 0.
R-Box 0x7xxx,0x4xxx These windows provide access to R-Box CSRs (see R-Box Uncore PMU Summary Table for details)
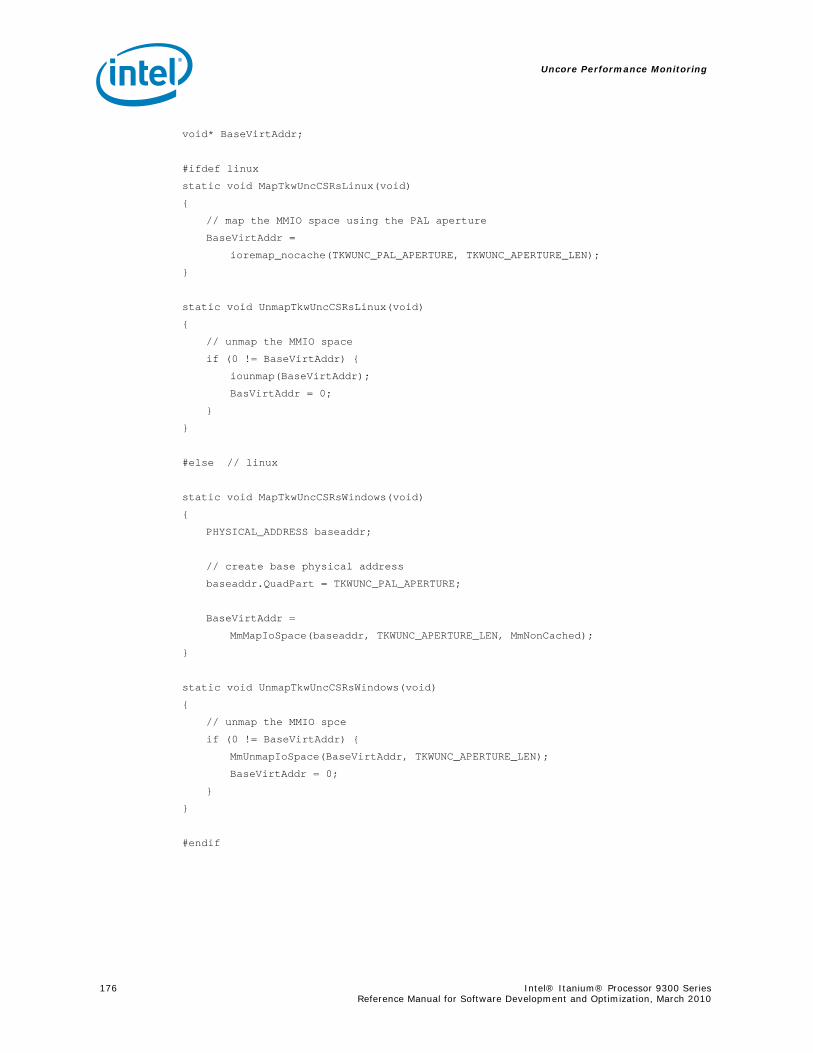
Uncore Performance Monitoring
176 Intel® Itanium® Processor 9300 Series Reference Manual for Software Development and Optimization, March 2010
void* BaseVirtAddr;
#ifdef linux
static void MapTkwUncCSRsLinux(void)
{
// map the MMIO space using the PAL aperture
BaseVirtAddr =
ioremap_nocache(TKWUNC_PAL_APERTURE, TKWUNC_APERTURE_LEN);
}
static void UnmapTkwUncCSRsLinux(void)
{
// unmap the MMIO space
if (0 != BaseVirtAddr) {
iounmap(BaseVirtAddr);
BasVirtAddr = 0;
}
}
#else // linux
static void MapTkwUncCSRsWindows(void)
{
PHYSICAL_ADDRESS baseaddr;
// create base physical address
baseaddr.QuadPart = TKWUNC_PAL_APERTURE;
BaseVirtAddr =
MmMapIoSpace(baseaddr, TKWUNC_APERTURE_LEN, MmNonCached);
}
static void UnmapTkwUncCSRsWindows(void)
{
// unmap the MMIO spce
if (0 != BaseVirtAddr) {
MmUnmapIoSpace(BaseVirtAddr, TKWUNC_APERTURE_LEN);
BaseVirtAddr = 0;
}
}
#endif
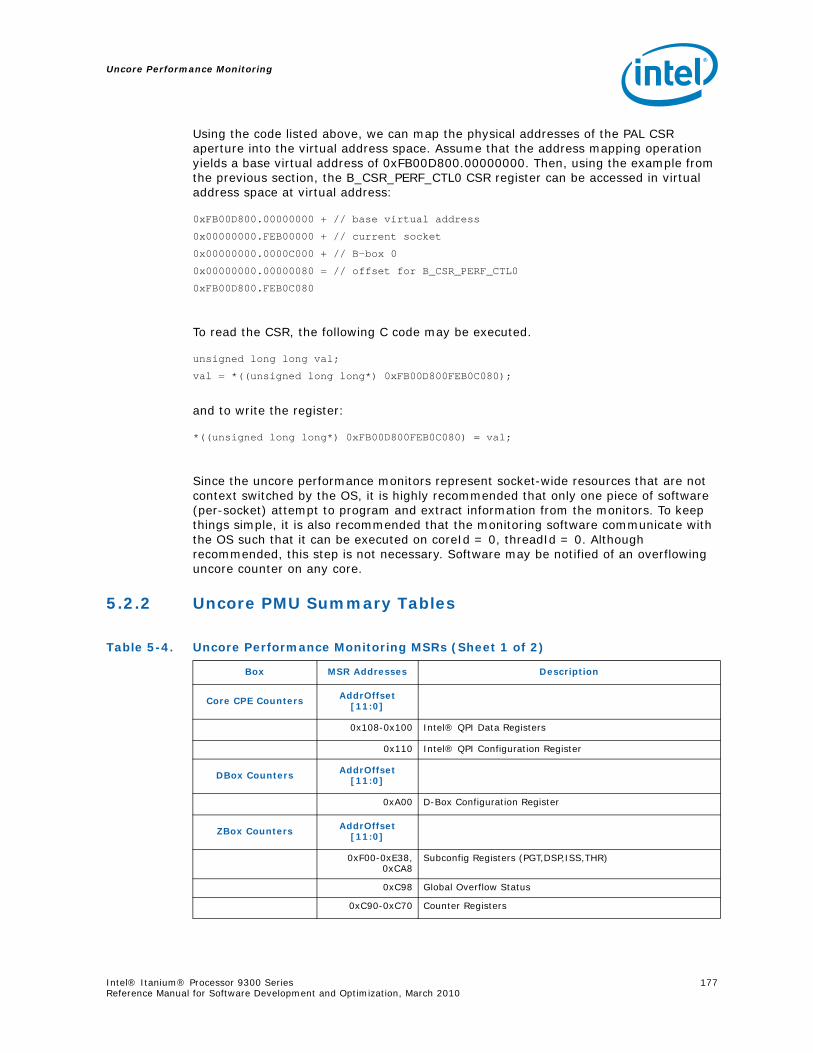
Uncore Performance Monitoring
Intel® Itanium® Processor 9300 Series 177Reference Manual for Software Development and Optimization, March 2010
Using the code listed above, we can map the physical addresses of the PAL CSR aperture into the virtual address space. Assume that the address mapping operation yields a base virtual address of 0xFB00D800.00000000. Then, using the example from the previous section, the B_CSR_PERF_CTL0 CSR register can be accessed in virtual address space at virtual address:
0xFB00D800.00000000 + // base virtual address
0x00000000.FEB00000 + // current socket
0x00000000.0000C000 + // B-box 0
0x00000000.00000080 = // offset for B_CSR_PERF_CTL0
0xFB00D800.FEB0C080
To read the CSR, the following C code may be executed.
unsigned long long val;
val = *((unsigned long long*) 0xFB00D800FEB0C080);
and to write the register:
*((unsigned long long*) 0xFB00D800FEB0C080) = val;
Since the uncore performance monitors represent socket-wide resources that are not context switched by the OS, it is highly recommended that only one piece of software (per-socket) attempt to program and extract information from the monitors. To keep things simple, it is also recommended that the monitoring software communicate with the OS such that it can be executed on coreId = 0, threadId = 0. Although recommended, this step is not necessary. Software may be notified of an overflowing uncore counter on any core.
5.2.2 Uncore PMU Summary Tables
Table 5-4. Uncore Performance Monitoring MSRs (Sheet 1 of 2)
Box MSR Addresses Description
Core CPE Counters AddrOffset [11:0]
0x108-0x100 Intel® QPI Data Registers
0x110 Intel® QPI Configuration Register
DBox Counters AddrOffset [11:0]
0xA00 D-Box Configuration Register
ZBox Counters AddrOffset [11:0]
0xF00-0xE38,0xCA8
Subconfig Registers (PGT,DSP,ISS,THR)
0xC98 Global Overflow Status
0xC90-0xC70 Counter Registers
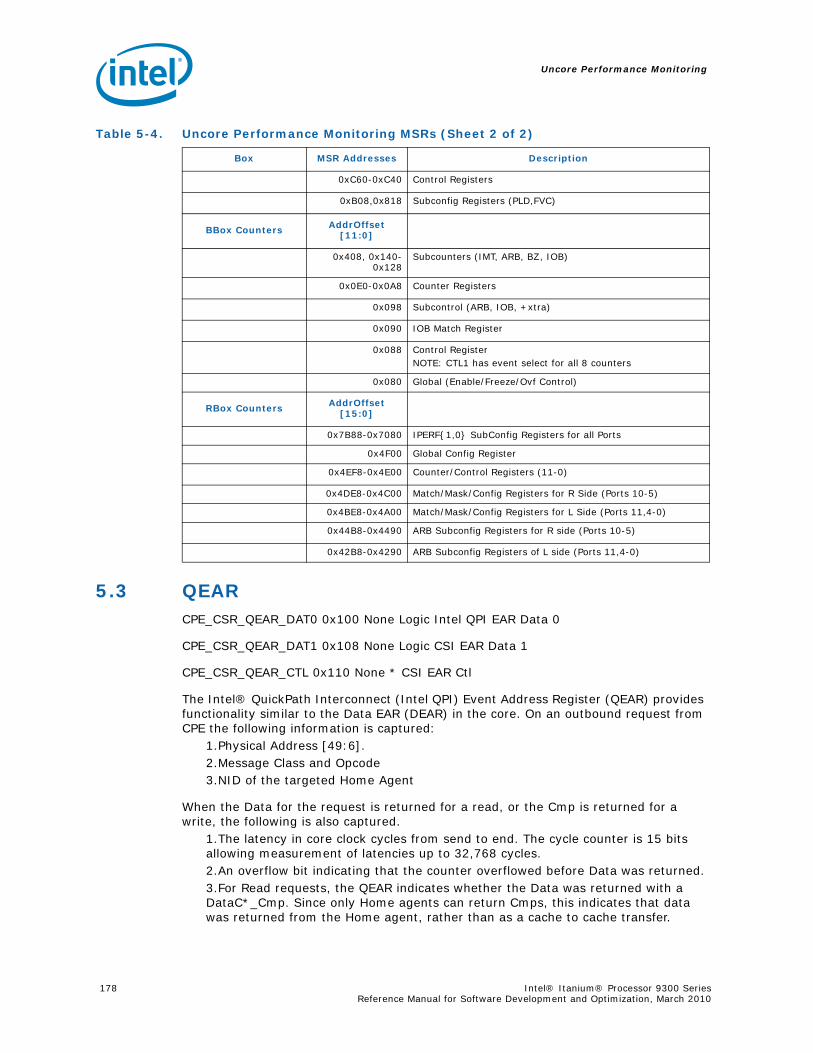
Uncore Performance Monitoring
178 Intel® Itanium® Processor 9300 Series Reference Manual for Software Development and Optimization, March 2010
5.3 QEARCPE_CSR_QEAR_DAT0 0x100 None Logic Intel QPI EAR Data 0
CPE_CSR_QEAR_DAT1 0x108 None Logic CSI EAR Data 1
CPE_CSR_QEAR_CTL 0x110 None * CSI EAR Ctl
The Intel® QuickPath Interconnect (Intel QPI) Event Address Register (QEAR) provides functionality similar to the Data EAR (DEAR) in the core. On an outbound request from CPE the following information is captured:
1.Physical Address [49:6].2.Message Class and Opcode3.NID of the targeted Home Agent
When the Data for the request is returned for a read, or the Cmp is returned for a write, the following is also captured.
1.The latency in core clock cycles from send to end. The cycle counter is 15 bits allowing measurement of latencies up to 32,768 cycles.2.An overflow bit indicating that the counter overflowed before Data was returned.3.For Read requests, the QEAR indicates whether the Data was returned with a DataC*_Cmp. Since only Home agents can return Cmps, this indicates that data was returned from the Home agent, rather than as a cache to cache transfer.
0xC60-0xC40 Control Registers
0xB08,0x818 Subconfig Registers (PLD,FVC)
BBox Counters AddrOffset [11:0]
0x408, 0x140-0x128
Subcounters (IMT, ARB, BZ, IOB)
0x0E0-0x0A8 Counter Registers
0x098 Subcontrol (ARB, IOB, +xtra)
0x090 IOB Match Register
0x088 Control RegisterNOTE: CTL1 has event select for all 8 counters
0x080 Global (Enable/Freeze/Ovf Control)
RBox Counters AddrOffset [15:0]
0x7B88-0x7080 IPERF{1,0} SubConfig Registers for all Ports
0x4F00 Global Config Register
0x4EF8-0x4E00 Counter/Control Registers (11-0)
0x4DE8-0x4C00 Match/Mask/Config Registers for R Side (Ports 10-5)
0x4BE8-0x4A00 Match/Mask/Config Registers for L Side (Ports 11,4-0)
0x44B8-0x4490 ARB Subconfig Registers for R side (Ports 10-5)
0x42B8-0x4290 ARB Subconfig Registers of L side (Ports 11,4-0)
Table 5-4. Uncore Performance Monitoring MSRs (Sheet 2 of 2)
Box MSR Addresses Description
Uncore Performance Monitoring
Intel® Itanium® Processor 9300 Series 179Reference Manual for Software Development and Optimization, March 2010
NOTE: Some OEM node controller Home agents may send DataC* and Cmp separately, so having this bit clear may not imply a cache to cache transfer.
The QEAR does not support the measurement of the latency of the Cmp for read requests. On a completed transaction, the QEAR can signal a PMU event to increment PMDs and it will also respond to the subsequent PMD freeze to halt subsequent sampling. CSR reads may then be used to access the logged information.
The QEAR also supports a mode to measure the latency separation between the Data returns of two v64 reads. In this mode only RdData, RdInvOwn and RdCode transactions can be measured. In this mode the QEAR waits for the 1st DataC* return for either of the two requests, and then starts counting until the second DataC* request is returned.
Since the QEAR is located on the CPE’s interface to Intel QPI, its latency count will not include the latencies induced by any Core , EBL, or CPB structure. It will include the latencies of the CPE packet building and packet decoding logic (including any latencies waiting for Intel QPI credits), the clock synchronizer from CPE to the sysint, and all sysint and off-socket resources.
Note: Aside from the PMU event and response to PMU freeze, the QEAR is controlled almost entirely by CSR with no connection to the core PMU block. Thus it can not be programmed by PMCs and does not respond to any PMU tagging. The QEAR is not a threaded resource. It is shared between threads. Therefore it can not be used to measure requests from a particular thread. The QEAR can not measure protected addresses (core physical address[49]=1). unless enabled via PAL in CPE_CSR_CPP_CFG. The QEAR has no communication with the core IP-EAR or D-EAR.
The QEAR provides the following configurability:1.Count threshold - The QEAR will only signal a PMU event if the captured count is above 128, 256 or 512 core cycles.2.LFSR - The QEAR includes an LFSR to randomly select either 1 of 8 requests. The LFSR can be set to be ignored. The LFSR value is not readable or directly writeable. On a write to CPE_QEAR_CSR_CTL, the LFSR is reset to a fixed value. Then it progresses each cycle.3.Opcode Match & Mask and Message Class Selects - Regular (non-v64) latency measurements can be done on any HOM0, NCS, or NCB opcode that CPE supports. Opcode Match & Mask and Message Class selects can be used to restrict the operations that are measured. v64 measurements will only measure HOM0 RdData, RdCode and RdIvnown, thus the Message Class selects are ignored and the Opcode Match & Mask must select at least one of those 3 opcodes.
One limitation of the Intel QPI EAR logic is that when a request is initially targeted for sampling, the address, message class, opcode and homeNID are automatically logged into the QEAR CSRs and the counter is reset. The latency counts in the CSRs are free running until the transaction completes. Thus if software polls the QEAR CSRs while a measurement is in progress, it will see the address and other information for the measurement in progress, and will see the free running latency and overflow values for the current measurement. Additionally, if the QEAR is not frozen, reads from the various QEAR registers may correspond to measurements for completely different operations if the QEAR triggers on a new request. To avoid this problem the QEAR must be configured to use the PMD overflow mechanism of the core. To do this:
1.Program a core PMD to capture CPE_CPP_MISC.QEAR events. The QEAR event will trigger once for every measurement.
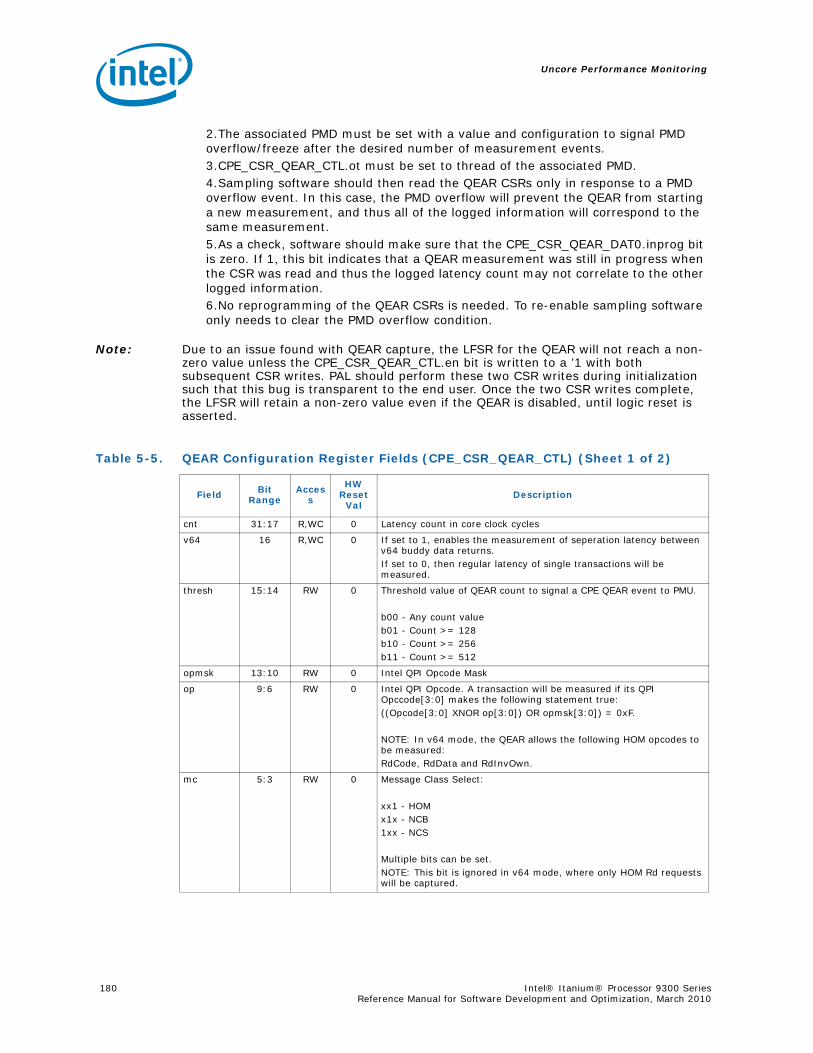
Uncore Performance Monitoring
180 Intel® Itanium® Processor 9300 Series Reference Manual for Software Development and Optimization, March 2010
2.The associated PMD must be set with a value and configuration to signal PMD overflow/freeze after the desired number of measurement events.3.CPE_CSR_QEAR_CTL.ot must be set to thread of the associated PMD.4.Sampling software should then read the QEAR CSRs only in response to a PMD overflow event. In this case, the PMD overflow will prevent the QEAR from starting a new measurement, and thus all of the logged information will correspond to the same measurement.5.As a check, software should make sure that the CPE_CSR_QEAR_DAT0.inprog bit is zero. If 1, this bit indicates that a QEAR measurement was still in progress when the CSR was read and thus the logged latency count may not correlate to the other logged information.6.No reprogramming of the QEAR CSRs is needed. To re-enable sampling software only needs to clear the PMD overflow condition.
Note: Due to an issue found with QEAR capture, the LFSR for the QEAR will not reach a non-zero value unless the CPE_CSR_QEAR_CTL.en bit is written to a ’1 with both subsequent CSR writes. PAL should perform these two CSR writes during initialization such that this bug is transparent to the end user. Once the two CSR writes complete, the LFSR will retain a non-zero value even if the QEAR is disabled, until logic reset is asserted.
Table 5-5. QEAR Configuration Register Fields (CPE_CSR_QEAR_CTL) (Sheet 1 of 2)
Field Bit Range
Access
HW Reset
ValDescription
cnt 31:17 R,WC 0 Latency count in core clock cycles
v64 16 R,WC 0 If set to 1, enables the measurement of seperation latency between v64 buddy data returns. If set to 0, then regular latency of single transactions will be measured.
thresh 15:14 RW 0 Threshold value of QEAR count to signal a CPE QEAR event to PMU.
b00 - Any count valueb01 - Count >= 128b10 - Count >= 256b11 - Count >= 512
opmsk 13:10 RW 0 Intel QPI Opcode Mask
op 9:6 RW 0 Intel QPI Opcode. A transaction will be measured if its QPI Opccode[3:0] makes the following statement true: ((Opcode[3:0] XNOR op[3:0]) OR opmsk[3:0]) = 0xF.
NOTE: In v64 mode, the QEAR allows the following HOM opcodes to be measured: RdCode, RdData and RdInvOwn.
mc 5:3 RW 0 Message Class Select:
xx1 - HOMx1x - NCB1xx - NCS
Multiple bits can be set. NOTE: This bit is ignored in v64 mode, where only HOM Rd requests will be captured.
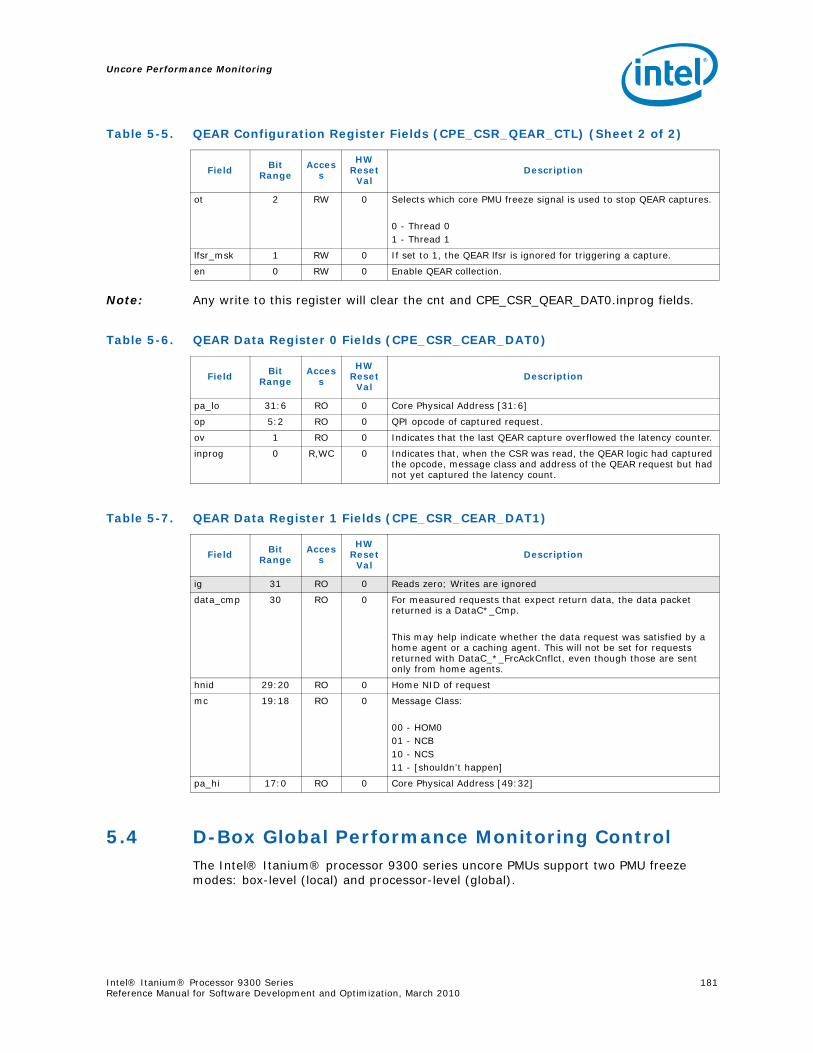
Uncore Performance Monitoring
Intel® Itanium® Processor 9300 Series 181Reference Manual for Software Development and Optimization, March 2010
Note: Any write to this register will clear the cnt and CPE_CSR_QEAR_DAT0.inprog fields.
5.4 D-Box Global Performance Monitoring ControlThe Intel® Itanium® processor 9300 series uncore PMUs support two PMU freeze modes: box-level (local) and processor-level (global).
ot 2 RW 0 Selects which core PMU freeze signal is used to stop QEAR captures.
0 - Thread 01 - Thread 1
lfsr_msk 1 RW 0 If set to 1, the QEAR lfsr is ignored for triggering a capture.
en 0 RW 0 Enable QEAR collection.
Table 5-5. QEAR Configuration Register Fields (CPE_CSR_QEAR_CTL) (Sheet 2 of 2)
Field Bit Range
Access
HW Reset
ValDescription
Table 5-6. QEAR Data Register 0 Fields (CPE_CSR_CEAR_DAT0)
Field Bit Range
Access
HW Reset
ValDescription
pa_lo 31:6 RO 0 Core Physical Address [31:6]
op 5:2 RO 0 QPI opcode of captured request.
ov 1 RO 0 Indicates that the last QEAR capture overflowed the latency counter.
inprog 0 R,WC 0 Indicates that, when the CSR was read, the QEAR logic had captured the opcode, message class and address of the QEAR request but had not yet captured the latency count.
Table 5-7. QEAR Data Register 1 Fields (CPE_CSR_CEAR_DAT1)
Field Bit Range
Access
HW Reset
ValDescription
ig 31 RO 0 Reads zero; Writes are ignored
data_cmp 30 RO 0 For measured requests that expect return data, the data packet returned is a DataC*_Cmp.
This may help indicate whether the data request was satisfied by a home agent or a caching agent. This will not be set for requests returned with DataC_*_FrcAckCnflct, even though those are sent only from home agents.
hnid 29:20 RO 0 Home NID of request
mc 19:18 RO 0 Message Class:
00 - HOM001 - NCB10 - NCS11 - [shouldn’t happen]
pa_hi 17:0 RO 0 Core Physical Address [49:32]
Uncore Performance Monitoring
182 Intel® Itanium® Processor 9300 Series Reference Manual for Software Development and Optimization, March 2010
If an uncore counter (for example, in the Z-Box) is configured to generate a box-level freeze when an overflow is detected from the counter, only the PMUs within the box (e.g. the other Z-Box PMUs) are frozen. PMUs in other boxes remain unaffected by this local freeze. However, if the uncore counter is configured to generated a socket-wide freeze, when a overflow is detected from the counter, all uncore PMUs within the same socket will be frozen.
In a similar fashion, it is possible to configure the Intel® Itanium® processor 9300 series uncore PMUs for box-level or processor-level unfreeze mode. If programmed in socket-level unfreeze mode, the users are expected to unfreeze individual PMUs separately. When in processor-level unfreeze mode, users can unfreeze all uncore PMus by writing to one CSR bit (DBX_CSR_MISC.unfrz_all).
If a counter is configured for processor-level or box-level freeze, an interrupt will be sent to the U-Box upon detection of counter overflow.
NOTE: an interrupt will only be sent to the U-box on ‘natural’ freezes (counter overflow). Should SW set any of the freeze bits, no interrupt will be sent.
Specifically, if the counter belongs to the...:
• B-Box – the appropriate bit in B_CSR_PERF_CTL0.aov must be set to 1
• R-Box – R_CSR_PERF_GBLCFG[7] must be set to 1 and R_CSR_PERF_CNT_CTRL_{15-0}.frz_en must be set to 1.
• Z-Box – Z_CSR_PMU_CNT_CTL_{5-0}.frz_mode = 1
In socket-level freeze mode, if a second overflow is detected in the window of time it takes the first overflow to freeze all the uncore PMUs, an additional interrupt request will be sent to the U-Box.
Global control of uncore PMU freezing and unfreezing is contained within the D-Box.
Note: It is not possible to configure uncore PMUs for a mixed freeze mode, where certain PMUs (say in the Z-Box) generate a local freeze while others (say in the R-Box) generate a global freeze.
5.4.1 Global Freeze/Unfreeze
Global freeze/unfreeze capabilities are configured in DBX_CSR_MISC.
By setting DBX_CSR_MISC.frz_en and DBX_CSR_MISC.ov_box_en, uncore PMU global freeze is enabled. DBX_CSR_MISC.ov_box bits inform a user which Box’s PMUs generated the global freeze. Once a user has gathered and reset the values within the frozen uncore PMUs, they may be unfrozen by writing the DBX_CSR_MISC.unfrz_all bit.
Similarly, it is also possible to manually freeze all PMUs simply by writing to DBX_CSR_MISC.frz_all
5.4.2 Setting up a monitoring session
Use the global freeze mechanism (refer to Section 5.4.1, “Global Freeze/Unfreeze”) to ensure that no counting is taking place while the session is being configured.
The following steps must be taken to set up a new monitoring session:
1) Select event to monitor:
Uncore Performance Monitoring
Intel® Itanium® Processor 9300 Series 183Reference Manual for Software Development and Optimization, March 2010
Determine what events should be captured and program the control registers to capture them (i.e. refer to individual box sections for details).
i.e., Set B_CSR_PERF_CTL1.cnt3_sel to 0x1b to capture SNP_REQ_ALL.
2) Enable counting locally:
For events captured in the R and R-Boxes, the enable bits are found within the individual control register (R/Z_CSR_PERF_CNT_CTRL_X.en). The enable bits are collected in the B_CSR_PEFF_CTL0 register in the B_Box.
i.e., Set B_CSR_PERF_CTL0.cnt_en[3] to 1.
3) Select how to gather data. If polling, skip to 4. If sampling:
To set up a sample interval, software can pre-program the data register with a value of [2^40- sample interval length (or 2^48 for R-Box counters)]. Doing so allows software, through use of the pmi mechanism, to be notified when the number of events in the sample have been captured. Capturing a performance monitoring sample every ‘X cycles’ (i.e. B_CYCLES) is a common use of this mechanism.
i.e., To stop counting and receive notification when the 1,000th SNP_REQ_ALL has been detected,
- set B_CSR_PERF_CNT[3] to (2^40- 1000)
- set B_CSR_PERF_CTL0.aov[3] to 1
- set DBX_CSR_MISC.frz_all to 1
4) Unfreeze all PMU counters by setting DBX_CSR_MISC.unfrz to 1.
And with that, counting will begin.
5.4.3 Reading the sample interval
Software can either poll the counters whenever it chooses, or wait to be notified that a counter has overflowed (by receiving a PMI).
a) Polling - before reading, it is recommended that software freeze the counters (by setting DBX_CSR_MISC.frz_all).
b) Frozen counters - If software set up the counters to freeze on overflow and send notification when it happens, the next question is: Who caused the freeze?
Overflow bits are stored within each box and summarized in the D-Box. First, software should read DBX_CSR_MISC.ov_box bits to determine which box(es) contain the overlflowing counter. Once the box(es) has been identified, read that box’s overflow bits (B_CSR_PERF_CNTx.ov, R_CSR_PERF_CNT_CTRL_x.ov and Z_CSR_PMU_CNT_STATUS.cntrX_ov) to find the overflowing counter.
Note: More than one counter may overflow at any given time.
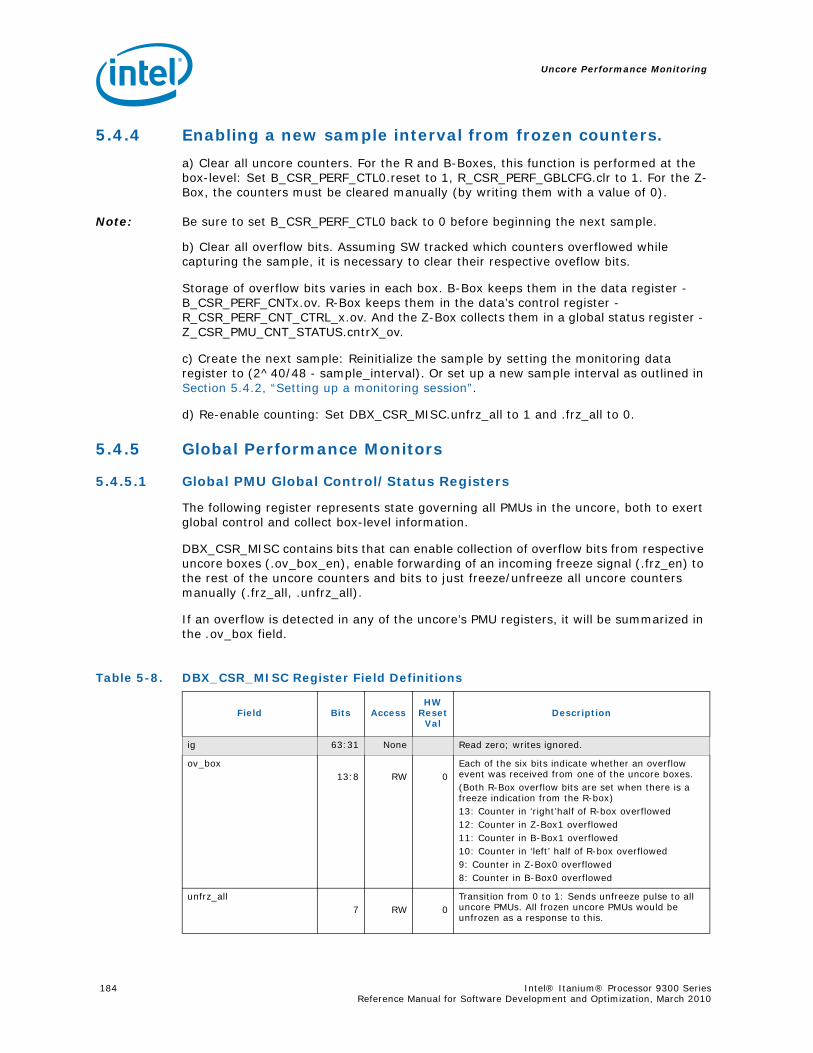
Uncore Performance Monitoring
184 Intel® Itanium® Processor 9300 Series Reference Manual for Software Development and Optimization, March 2010
5.4.4 Enabling a new sample interval from frozen counters.
a) Clear all uncore counters. For the R and B-Boxes, this function is performed at the box-level: Set B_CSR_PERF_CTL0.reset to 1, R_CSR_PERF_GBLCFG.clr to 1. For the Z-Box, the counters must be cleared manually (by writing them with a value of 0).
Note: Be sure to set B_CSR_PERF_CTL0 back to 0 before beginning the next sample.
b) Clear all overflow bits. Assuming SW tracked which counters overflowed while capturing the sample, it is necessary to clear their respective oveflow bits.
Storage of overflow bits varies in each box. B-Box keeps them in the data register - B_CSR_PERF_CNTx.ov. R-Box keeps them in the data’s control register - R_CSR_PERF_CNT_CTRL_x.ov. And the Z-Box collects them in a global status register - Z_CSR_PMU_CNT_STATUS.cntrX_ov.
c) Create the next sample: Reinitialize the sample by setting the monitoring data register to (2^40/48 - sample_interval). Or set up a new sample interval as outlined in Section 5.4.2, “Setting up a monitoring session”.
d) Re-enable counting: Set DBX_CSR_MISC.unfrz_all to 1 and .frz_all to 0.
5.4.5 Global Performance Monitors
5.4.5.1 Global PMU Global Control/Status Registers
The following register represents state governing all PMUs in the uncore, both to exert global control and collect box-level information.
DBX_CSR_MISC contains bits that can enable collection of overflow bits from respective uncore boxes (.ov_box_en), enable forwarding of an incoming freeze signal (.frz_en) to the rest of the uncore counters and bits to just freeze/unfreeze all uncore counters manually (.frz_all, .unfrz_all).
If an overflow is detected in any of the uncore’s PMU registers, it will be summarized in the .ov_box field.
Table 5-8. DBX_CSR_MISC Register Field Definitions
Field Bits AccessHW
Reset Val
Description
ig 63:31 None Read zero; writes ignored.
ov_box13:8 RW 0
Each of the six bits indicate whether an overflow event was received from one of the uncore boxes.(Both R-Box overflow bits are set when there is a freeze indication from the R-box)13: Counter in ‘right’half of R-box overflowed12: Counter in Z-Box1 overflowed11: Counter in B-Box1 overflowed10: Counter in ‘left’ half of R-box overflowed9: Counter in Z-Box0 overflowed8: Counter in B-Box0 overflowed
unfrz_all 7 RW 0
Transition from 0 to 1: Sends unfreeze pulse to all uncore PMUs. All frozen uncore PMUs would be unfrozen as a response to this.
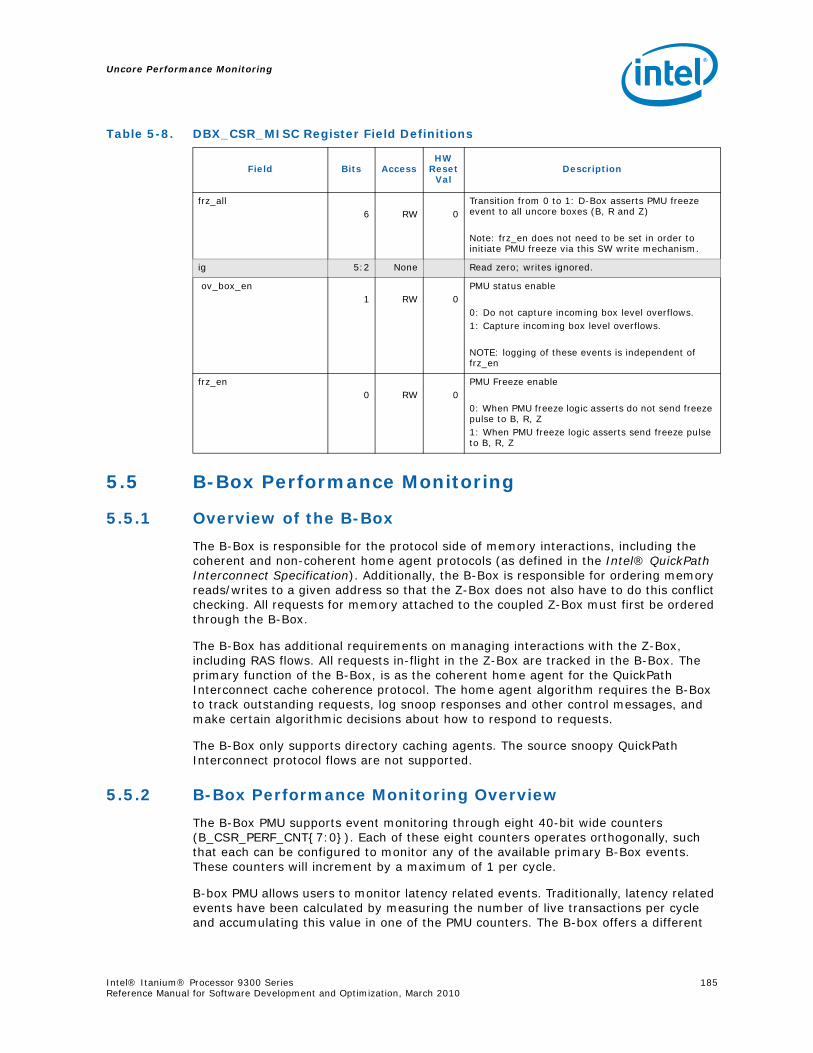
Uncore Performance Monitoring
Intel® Itanium® Processor 9300 Series 185Reference Manual for Software Development and Optimization, March 2010
5.5 B-Box Performance Monitoring
5.5.1 Overview of the B-Box
The B-Box is responsible for the protocol side of memory interactions, including the coherent and non-coherent home agent protocols (as defined in the Intel® QuickPath Interconnect Specification). Additionally, the B-Box is responsible for ordering memory reads/writes to a given address so that the Z-Box does not also have to do this conflict checking. All requests for memory attached to the coupled Z-Box must first be ordered through the B-Box.
The B-Box has additional requirements on managing interactions with the Z-Box, including RAS flows. All requests in-flight in the Z-Box are tracked in the B-Box. The primary function of the B-Box, is as the coherent home agent for the QuickPath Interconnect cache coherence protocol. The home agent algorithm requires the B-Box to track outstanding requests, log snoop responses and other control messages, and make certain algorithmic decisions about how to respond to requests.
The B-Box only supports directory caching agents. The source snoopy QuickPath Interconnect protocol flows are not supported.
5.5.2 B-Box Performance Monitoring Overview
The B-Box PMU supports event monitoring through eight 40-bit wide counters (B_CSR_PERF_CNT{7:0}). Each of these eight counters operates orthogonally, such that each can be configured to monitor any of the available primary B-Box events. These counters will increment by a maximum of 1 per cycle.
B-box PMU allows users to monitor latency related events. Traditionally, latency related events have been calculated by measuring the number of live transactions per cycle and accumulating this value in one of the PMU counters. The B-box offers a different
frz_all 6 RW 0
Transition from 0 to 1: D-Box asserts PMU freeze event to all uncore boxes (B, R and Z)
Note: frz_en does not need to be set in order to initiate PMU freeze via this SW write mechanism.
ig 5:2 None Read zero; writes ignored.
ov_box_en1 RW 0
PMU status enable 0: Do not capture incoming box level overflows.1: Capture incoming box level overflows.
NOTE: logging of these events is independent of frz_en
frz_en0 RW 0
PMU Freeze enable
0: When PMU freeze logic asserts do not send freeze pulse to B, R, Z1: When PMU freeze logic asserts send freeze pulse to B, R, Z
Table 5-8. DBX_CSR_MISC Register Field Definitions
Field Bits AccessHW
Reset Val
Description
Uncore Performance Monitoring
186 Intel® Itanium® Processor 9300 Series Reference Manual for Software Development and Optimization, March 2010
approach. A number of live counters are dedicated to track live entries in different queues and structures. Rather than directly accumulate the live counter values in the PMU counters, they are fed to a number of accumulators (widths ranging from 6 to 11bits). Overflow of these accumulator values are then fed into the main PMU counters. In order to capture an accurate live entry count for a specific queue, the accumulator assigned to it will have to be shifted in as the LSB of the count captured in the PMU.
Unlike other boxes, the B-Box does not have a control register for each counter. Rather, there is a single control that must be configured to select primary events for all counters (B_CSR_PERF_CTL1) another control which be used to refine the selected event (B_CSR_PERF_CTL2). Since there is only one B_CSR_PERF_CTL2, in cases where it is used to select a subevent, other counters cannot capture different versions of the same event.
5.5.2.1 B-Box PMU - Overflow, Freeze and Unfreeze
B-Box PMUs support the same overflow and freeze related mechanisms that are supported by the other uncore PMUs. Users can choose to freeze all the B-Box PMUs, or all of the uncore PMUs (refer to Section 5.4.1, “Global Freeze/Unfreeze”), when a B-Box counter overflows by setting the corresponding bit in the B_CSR_PERF_CTL0.aov field to 1.
B-box PMU can be frozen due to one of three reasons
• Globally: D-box sends a freeze signal
• Manually: SW forces a freeze either through the global (Section 5.4.1, “Global Freeze/Unfreeze”) or local (a write to B_CSR_PERF_CTL0.frz) mechanism.
• Locally: A B-box counter overflowed and that counter’s .aov bit was set to 1.
Each overflow bit can be found in its data register (B_CSR_PERF_CNT_x.ov) where it can be inspected to determine if a counter overflow was repsonsible for the freeze.
Once a freeze has occurred, in order to see a new freeze, the overflow field responsible for the freeze, must be cleared by setting it to 0. It is also necessary to ensure that B_CSR_PERF_CTL0.reset has been cleared. Assuming all the counters have been locally enabled (bits in B_CSR_PERF_CTL0.cnt_en for relevant counters have been set to 1) and the overflow bit(s) has been cleared, the B-Box is prepared for a new sample interval. Once the global controls have been re-enabled (Section 5.4.4, “Enabling a new sample interval from frozen counters.”), counting will resume.
To unfreeze the B-Box PMU, which is necessary to continue counting, either:
• Set DBX_CSR_MISC.unfrz_all to 1 or
• Clear the B_CSR_PERF_CTL0.frz bit.
Note: If B_CSR_PERF_CTL0_CNT{0-7}.aov was set to 0 when an overflow in one of the counters has occurred, writing 1 to the corresponding aov field will cause a delayed freeze.
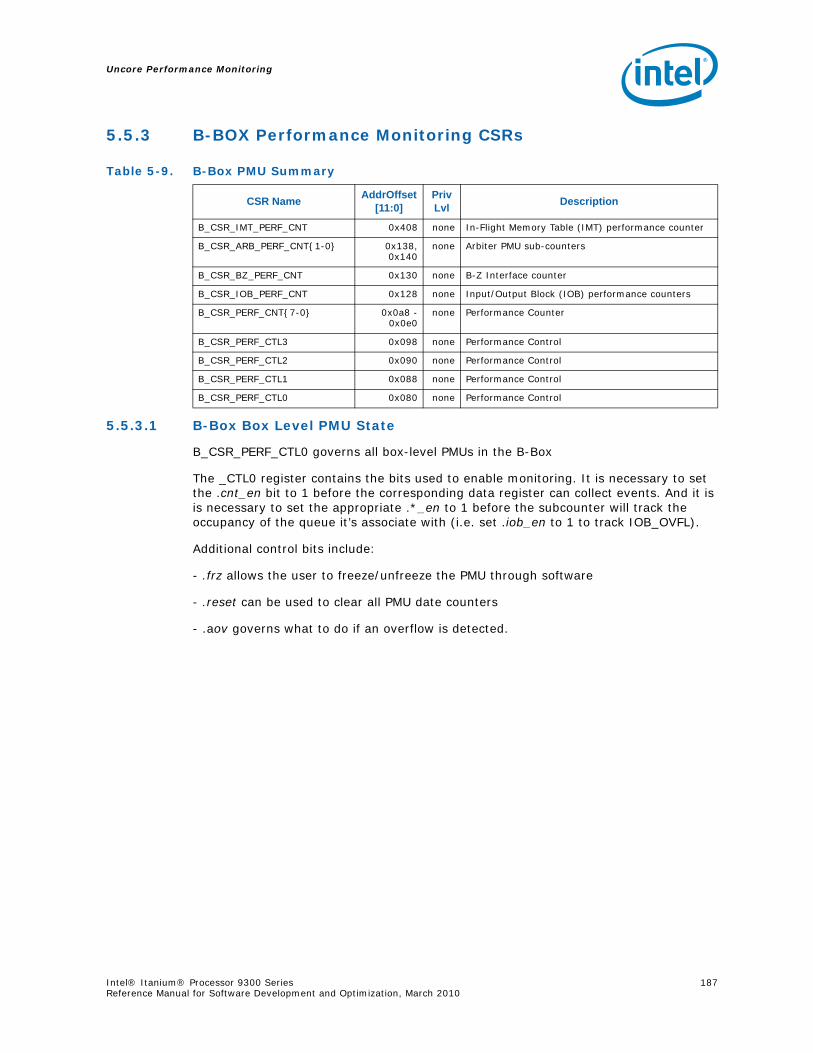
Uncore Performance Monitoring
Intel® Itanium® Processor 9300 Series 187Reference Manual for Software Development and Optimization, March 2010
5.5.3 B-BOX Performance Monitoring CSRs
5.5.3.1 B-Box Box Level PMU State
B_CSR_PERF_CTL0 governs all box-level PMUs in the B-Box
The _CTL0 register contains the bits used to enable monitoring. It is necessary to set the .cnt_en bit to 1 before the corresponding data register can collect events. And it is is necessary to set the appropriate .*_en to 1 before the subcounter will track the occupancy of the queue it’s associate with (i.e. set .iob_en to 1 to track IOB_OVFL).
Additional control bits include:
- .frz allows the user to freeze/unfreeze the PMU through software
- .reset can be used to clear all PMU date counters
- .aov governs what to do if an overflow is detected.
Table 5-9. B-Box PMU Summary
CSR Name AddrOffset [11:0]
Priv Lvl Description
B_CSR_IMT_PERF_CNT 0x408 none In-Flight Memory Table (IMT) performance counter
B_CSR_ARB_PERF_CNT{1-0} 0x138,0x140
none Arbiter PMU sub-counters
B_CSR_BZ_PERF_CNT 0x130 none B-Z Interface counter
B_CSR_IOB_PERF_CNT 0x128 none Input/Output Block (IOB) performance counters
B_CSR_PERF_CNT{7-0} 0x0a8 -0x0e0
none Performance Counter
B_CSR_PERF_CTL3 0x098 none Performance Control
B_CSR_PERF_CTL2 0x090 none Performance Control
B_CSR_PERF_CTL1 0x088 none Performance Control
B_CSR_PERF_CTL0 0x080 none Performance Control
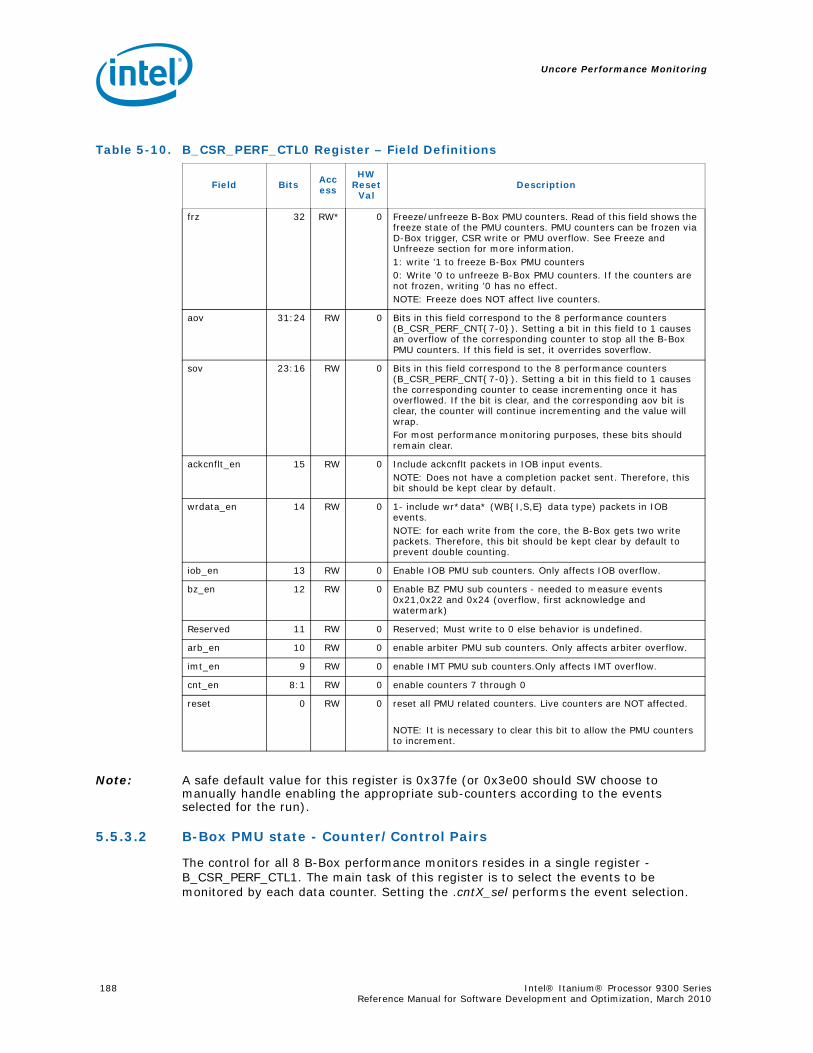
Uncore Performance Monitoring
188 Intel® Itanium® Processor 9300 Series Reference Manual for Software Development and Optimization, March 2010
Note: A safe default value for this register is 0x37fe (or 0x3e00 should SW choose to manually handle enabling the appropriate sub-counters according to the events selected for the run).
5.5.3.2 B-Box PMU state - Counter/Control Pairs
The control for all 8 B-Box performance monitors resides in a single register - B_CSR_PERF_CTL1. The main task of this register is to select the events to be monitored by each data counter. Setting the .cntX_sel performs the event selection.
Table 5-10. B_CSR_PERF_CTL0 Register – Field Definitions
Field Bits Access
HW Reset
ValDescription
frz 32 RW* 0 Freeze/unfreeze B-Box PMU counters. Read of this field shows the freeze state of the PMU counters. PMU counters can be frozen via D-Box trigger, CSR write or PMU overflow. See Freeze and Unfreeze section for more information. 1: write ’1 to freeze B-Box PMU counters0: Write ’0 to unfreeze B-Box PMU counters. If the counters are not frozen, writing ’0 has no effect.NOTE: Freeze does NOT affect live counters.
aov 31:24 RW 0 Bits in this field correspond to the 8 performance counters (B_CSR_PERF_CNT{7-0}). Setting a bit in this field to 1 causes an overflow of the corresponding counter to stop all the B-Box PMU counters. If this field is set, it overrides soverflow.
sov 23:16 RW 0 Bits in this field correspond to the 8 performance counters (B_CSR_PERF_CNT{7-0}). Setting a bit in this field to 1 causes the corresponding counter to cease incrementing once it has overflowed. If the bit is clear, and the corresponding aov bit is clear, the counter will continue incrementing and the value will wrap. For most performance monitoring purposes, these bits should remain clear.
ackcnflt_en 15 RW 0 Include ackcnflt packets in IOB input events.NOTE: Does not have a completion packet sent. Therefore, this bit should be kept clear by default.
wrdata_en 14 RW 0 1- include wr*data* (WB{I,S,E} data type) packets in IOB events.NOTE: for each write from the core, the B-Box gets two write packets. Therefore, this bit should be kept clear by default to prevent double counting.
iob_en 13 RW 0 Enable IOB PMU sub counters. Only affects IOB overflow.
bz_en 12 RW 0 Enable BZ PMU sub counters - needed to measure events 0x21,0x22 and 0x24 (overflow, first acknowledge and watermark)
Reserved 11 RW 0 Reserved; Must write to 0 else behavior is undefined.
arb_en 10 RW 0 enable arbiter PMU sub counters. Only affects arbiter overflow.
imt_en 9 RW 0 enable IMT PMU sub counters.Only affects IMT overflow.
cnt_en 8:1 RW 0 enable counters 7 through 0
reset 0 RW 0 reset all PMU related counters. Live counters are NOT affected.
NOTE: It is necessary to clear this bit to allow the PMU counters to increment.
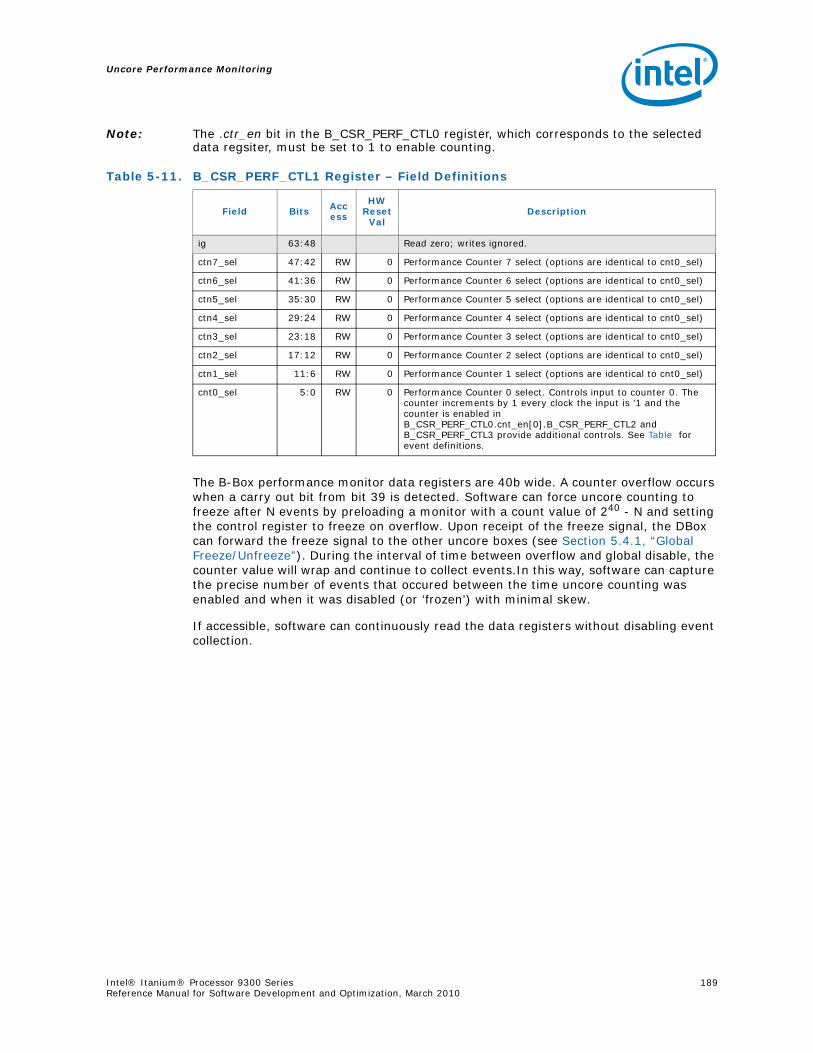
Uncore Performance Monitoring
Intel® Itanium® Processor 9300 Series 189Reference Manual for Software Development and Optimization, March 2010
Note: The .ctr_en bit in the B_CSR_PERF_CTL0 register, which corresponds to the selected data regsiter, must be set to 1 to enable counting.
The B-Box performance monitor data registers are 40b wide. A counter overflow occurs when a carry out bit from bit 39 is detected. Software can force uncore counting to freeze after N events by preloading a monitor with a count value of 240 - N and setting the control register to freeze on overflow. Upon receipt of the freeze signal, the DBox can forward the freeze signal to the other uncore boxes (see Section 5.4.1, “Global Freeze/Unfreeze”). During the interval of time between overflow and global disable, the counter value will wrap and continue to collect events.In this way, software can capture the precise number of events that occured between the time uncore counting was enabled and when it was disabled (or ‘frozen’) with minimal skew.
If accessible, software can continuously read the data registers without disabling event collection.
Table 5-11. B_CSR_PERF_CTL1 Register – Field Definitions
Field Bits Access
HW Reset
ValDescription
ig 63:48 Read zero; writes ignored.
ctn7_sel 47:42 RW 0 Performance Counter 7 select (options are identical to cnt0_sel)
ctn6_sel 41:36 RW 0 Performance Counter 6 select (options are identical to cnt0_sel)
ctn5_sel 35:30 RW 0 Performance Counter 5 select (options are identical to cnt0_sel)
ctn4_sel 29:24 RW 0 Performance Counter 4 select (options are identical to cnt0_sel)
ctn3_sel 23:18 RW 0 Performance Counter 3 select (options are identical to cnt0_sel)
ctn2_sel 17:12 RW 0 Performance Counter 2 select (options are identical to cnt0_sel)
ctn1_sel 11:6 RW 0 Performance Counter 1 select (options are identical to cnt0_sel)
cnt0_sel 5:0 RW 0 Performance Counter 0 select. Controls input to counter 0. The counter increments by 1 every clock the input is ’1 and the counter is enabled in B_CSR_PERF_CTL0.cnt_en[0].B_CSR_PERF_CTL2 and B_CSR_PERF_CTL3 provide additional controls. See Table for event definitions.
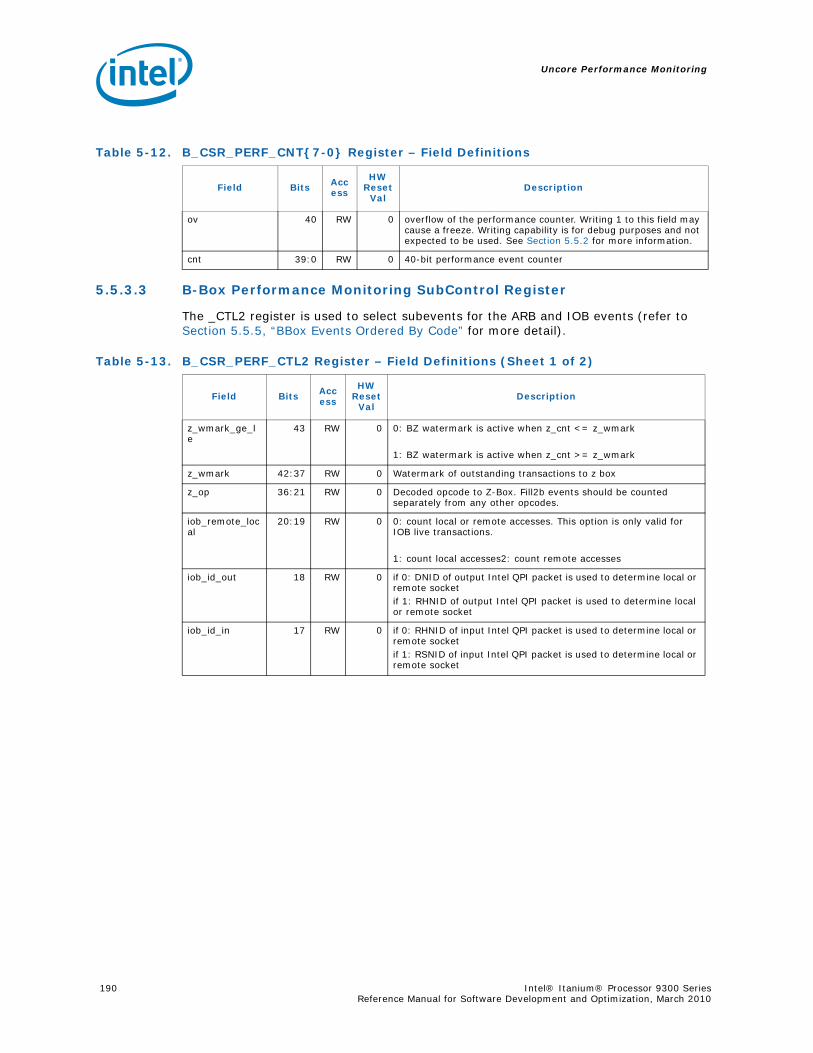
Uncore Performance Monitoring
190 Intel® Itanium® Processor 9300 Series Reference Manual for Software Development and Optimization, March 2010
5.5.3.3 B-Box Performance Monitoring SubControl Register
The _CTL2 register is used to select subevents for the ARB and IOB events (refer to Section 5.5.5, “BBox Events Ordered By Code” for more detail).
Table 5-12. B_CSR_PERF_CNT{7-0} Register – Field Definitions
Field Bits Access
HW Reset
ValDescription
ov 40 RW 0 overflow of the performance counter. Writing 1 to this field may cause a freeze. Writing capability is for debug purposes and not expected to be used. See Section 5.5.2 for more information.
cnt 39:0 RW 0 40-bit performance event counter
Table 5-13. B_CSR_PERF_CTL2 Register – Field Definitions (Sheet 1 of 2)
Field Bits Access
HW Reset
ValDescription
z_wmark_ge_le
43 RW 0 0: BZ watermark is active when z_cnt <= z_wmark
1: BZ watermark is active when z_cnt >= z_wmark
z_wmark 42:37 RW 0 Watermark of outstanding transactions to z box
z_op 36:21 RW 0 Decoded opcode to Z-Box. Fill2b events should be counted separately from any other opcodes.
iob_remote_local
20:19 RW 0 0: count local or remote accesses. This option is only valid for IOB live transactions.
1: count local accesses2: count remote accesses
iob_id_out 18 RW 0 if 0: DNID of output Intel QPI packet is used to determine local or remote socketif 1: RHNID of output Intel QPI packet is used to determine local or remote socket
iob_id_in 17 RW 0 if 0: RHNID of input Intel QPI packet is used to determine local or remote socketif 1: RSNID of input Intel QPI packet is used to determine local or remote socket

Uncore Performance Monitoring
Intel® Itanium® Processor 9300 Series 191Reference Manual for Software Development and Optimization, March 2010
NOTE regarding the iob_trans_sel, iob_id_in, iob_id_out, and iob_remote_local events:
iob_trans_sel 16:15 RW 0 This field affects selection of types of transactions that are used in accumulator of outstanding transactions in IOB.
0: match opcode and class (defined in B_CSR_PERF_CTL3 register) to output and input flits.
1: match opcode for input flits and count all outgoing *cmp* flits that correspond to the input flits.
2: track snoops (class, opcode and iob_id) selection has no effect.
arbq_sel1 11:6 RW 0 Arbiter queue selection for Arbiter event set1. The value programmed here selects the queue monitored by the event codes 0x0d to 0x11 described in Table , “”. The values this field can be programmed and their meanings are as described above for arbq_sel0. Note that the Live counter1 and accumulator1 always monitor the number of transactions in all address conflict queues. It is not possible for this live counter and accumulator to monitor anything else.
arbq_sel0 5:0 RW 0 Arbiter queue selection for Arbiter event set0. The value programmed here selects the queue monitored by the event codes 0x08 to 0x0c described in Table , “”. Possible values for this field are 0-37, 39-41. However, not all of these values are supported by all the events with codes 0x08 to 0x0c. Refer the Table , “” for more details.
If supported, the value of this field generally select the following queues:
31-0: selects corresponding address conflict queue32: any address conflict queue. Insert or remove indicate a push or pop an entry to any conflict queue. When this value is selected arbiter accumulator0 accumulates the number of entries occupied in all conflict queues. This is analogous to treating all 32 conflict queues as one queue.33:RIAQ. If the field is programmed to this value Live counter and accumulator contain riaq queue entries.34: WIAQ. Live counter and accumulator contain wiaq queue entries.35: BRAQ. Live counter and accumulator contain braq queue entries.36: NBRAQ. Live counter and accumulator contain nbraq queue entries.37: COHQ. Live counter and accumulator contain cohq queue entries.38: reserved39: CLM. Live counter and accumulator contain clm queue entries.40: SAQ (combination of riaq,wiaq,braq and clm) 41: monitor non-empty conflict queues. Insert indicates a write to one of the empty conflict queues. Live counter and accumulator contain number of non-empty conflict queues.NOTE: In some cases (Remove, non-empty and full), setting this to 41 is the same as setting it to 32.
Table 5-13. B_CSR_PERF_CTL2 Register – Field Definitions (Sheet 2 of 2)
Field Bits Access
HW Reset
ValDescription

Uncore Performance Monitoring
192 Intel® Itanium® Processor 9300 Series Reference Manual for Software Development and Optimization, March 2010
If you want to change iob_trans_sel from 0 or 1, you MUST write to PERF_CTL3 immediately afterwards. If iob_trans_sel is 0 or 1 and you want to change iob_id_in, you must write PERF_CTL3 immediately afterwards.
iob_trans_sel == 1 cannot be used in mirroring configurations.This is because under mirroring, the primary sometimes issues NcRd* to the slave instead of issuing Cmps for the incoming packet. Because iob_trans_sel == 1 causes a decrement of the live counter only on outgoing Cmp* and NOT on outgoing NcRd*, the live counter would end up with too many increments and no corresponding decrements causing the live counter to lose count of live transactions.
iob_trans_sel == 0 - This mode is most useful when mirroring is turned on. However, if you plan to use events 0x16-0x18 in this config when mirroring is turned on, then you need to:
Set PERF_CTL0.ackcnflt_en to 1, PERF_CTL2.remote_local to 03., PERF_CTL3.{opcode_in,opcode_out} to 0xffff4, PERF_CTL3.class_in to 0xfff9 and PERF_CTL3.class_out to 0x4014. In effect, if mirroring is enabled, iob_trans_sel== 0 can only be used to measure the average latency of all transactions (including AckCnflt) that are serviced by the B-Box. We cannot measure the latency of a subset of opcodes.
5.5.3.4 B-Box Register for IOB Related Mask/Match Facility
For many of the IOB events (i.e. IOB_IN_PCKTS), it is possible to filter according to the opcode and message class of the packets. Since the match/mask fields are one-hot encoded, any combination of opcodes/message classes may be tracked simultaneously. Details for how to select among the available message classes and opcodes are included in Table , “” and Table , “”.
Table 5-14. B_CSR_PERF_CTL3 Register – Field Definitions
NOTE: SW should set this register to all 1s by default so that events are not filtered according to class or opcode.
Field Bits Access
HW Reset
ValDescription
opcode_out 63:48 RW 0 Match output message opcodes (decoded)
class_out 47:32 RW 0 Match output message class (decoded)
opcode_in 31:16 RW 0 Match input message opcodes (decoded)
class_in 15:0 RW 0 Match input message class (decoded). Note.When monitoring IOB latency, this filed should not be set to include message class “Snoop Responses” (MC=1). If MC=1 is selected by making class_in[1]=1, the latency values could be grossly exaggerated. B-Box IOB internal counters could be reset only by another write to this CSR. Until then the IOB live counters could be incorrect.

Uncore Performance Monitoring
Intel® Itanium® Processor 9300 Series 193Reference Manual for Software Development and Optimization, March 2010
Table 5-15. Intel® QuickPath Interconnect (Intel® QPI) Packet Message Classes
Code Name Definition
0x0001 HOM0 Home - Requests
0x0002 HOM1 Home - Responses
0x0004 NDR Non-Data Responses
0x0008 SNP Snoops
0x0010 NCS Non-Coherent Standard
---
0x0800 NCB Non-Coherent Bypass
---
0x4000 DRS Data Response
Table 5-16. Opcode Match by Message Class for the B-Box (Sheet 1 of 2)
Decoded Opcode HOM0 HOM1 SNP DRS
0x0001 RdCur RspI SnpCur ---
0x0002 RdCode RspS SnpCode DataC_(FEIMS)_FrcAckCnflt
0x0004 RdData --- SnpData DataC_(FEIMS)_Cmp
0x0008 --- --- --- DataNc
0x0010 RdInvOwn RspCnflt SnpInvOwn WbIData
0x0020 InvXtoI --- SnpInvXtoI WbSData
0x0040 EvctCln --- --- WbEData
0x0080 --- --- --- ---
0x0100 InvItoE RspFwd SnpInvItoE WbIDataPtl
0x0200 --- RspFwdI --- ---
0x0400 --- RspFwdS --- WbEDataPtl
0x0800 --- RspFwdIWb --- ---
0x1000 WbMtoI RspFwdSWb --- ---
0x2000 WbMtoE RspIWb --- ---
0x4000 WbMtoS RspSWb --- ---
0x8000 AckCnflt --- --- ---
NDR NCB NCS
0x0001 Gnt_Cmp NcWr NcRd
0x0002 Gnt_FrcAckCnflt --- ---
0x0004 --- --- ---
0x0008 --- --- ---
0x0010 --- --- NcRdPtl
0x0020 --- --- ---
0x0040 --- --- ---
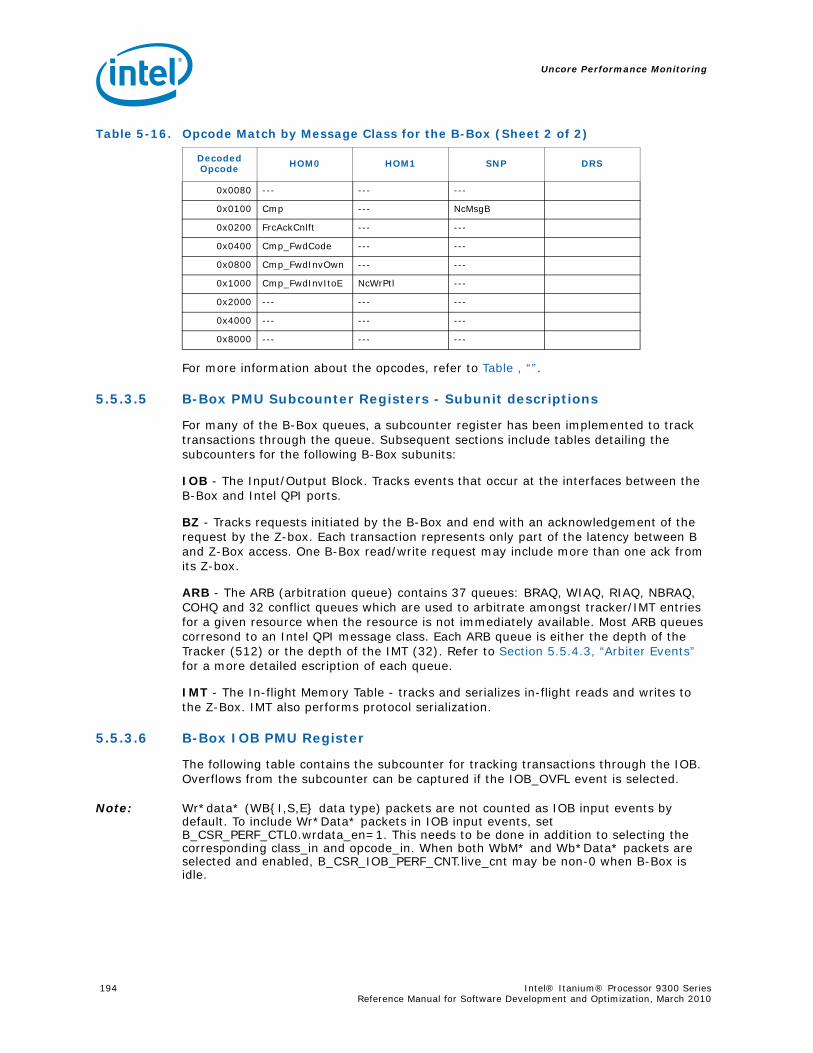
Uncore Performance Monitoring
194 Intel® Itanium® Processor 9300 Series Reference Manual for Software Development and Optimization, March 2010
For more information about the opcodes, refer to Table , “”.
5.5.3.5 B-Box PMU Subcounter Registers - Subunit descriptions
For many of the B-Box queues, a subcounter register has been implemented to track transactions through the queue. Subsequent sections include tables detailing the subcounters for the following B-Box subunits:
IOB - The Input/Output Block. Tracks events that occur at the interfaces between the B-Box and Intel QPI ports.
BZ - Tracks requests initiated by the B-Box and end with an acknowledgement of the request by the Z-box. Each transaction represents only part of the latency between B and Z-Box access. One B-Box read/write request may include more than one ack from its Z-box.
ARB - The ARB (arbitration queue) contains 37 queues: BRAQ, WIAQ, RIAQ, NBRAQ, COHQ and 32 conflict queues which are used to arbitrate amongst tracker/IMT entries for a given resource when the resource is not immediately available. Most ARB queues corresond to an Intel QPI message class. Each ARB queue is either the depth of the Tracker (512) or the depth of the IMT (32). Refer to Section 5.5.4.3, “Arbiter Events” for a more detailed escription of each queue.
IMT - The In-flight Memory Table - tracks and serializes in-flight reads and writes to the Z-Box. IMT also performs protocol serialization.
5.5.3.6 B-Box IOB PMU Register
The following table contains the subcounter for tracking transactions through the IOB. Overflows from the subcounter can be captured if the IOB_OVFL event is selected.
Note: Wr*data* (WB{I,S,E} data type) packets are not counted as IOB input events by default. To include Wr*Data* packets in IOB input events, set B_CSR_PERF_CTL0.wrdata_en=1. This needs to be done in addition to selecting the corresponding class_in and opcode_in. When both WbM* and Wb*Data* packets are selected and enabled, B_CSR_IOB_PERF_CNT.live_cnt may be non-0 when B-Box is idle.
0x0080 --- --- ---
0x0100 Cmp --- NcMsgB
0x0200 FrcAckCnlft --- ---
0x0400 Cmp_FwdCode --- ---
0x0800 Cmp_FwdInvOwn --- ---
0x1000 Cmp_FwdInvItoE NcWrPtl ---
0x2000 --- --- ---
0x4000 --- --- ---
0x8000 --- --- ---
Table 5-16. Opcode Match by Message Class for the B-Box (Sheet 2 of 2)
Decoded Opcode HOM0 HOM1 SNP DRS
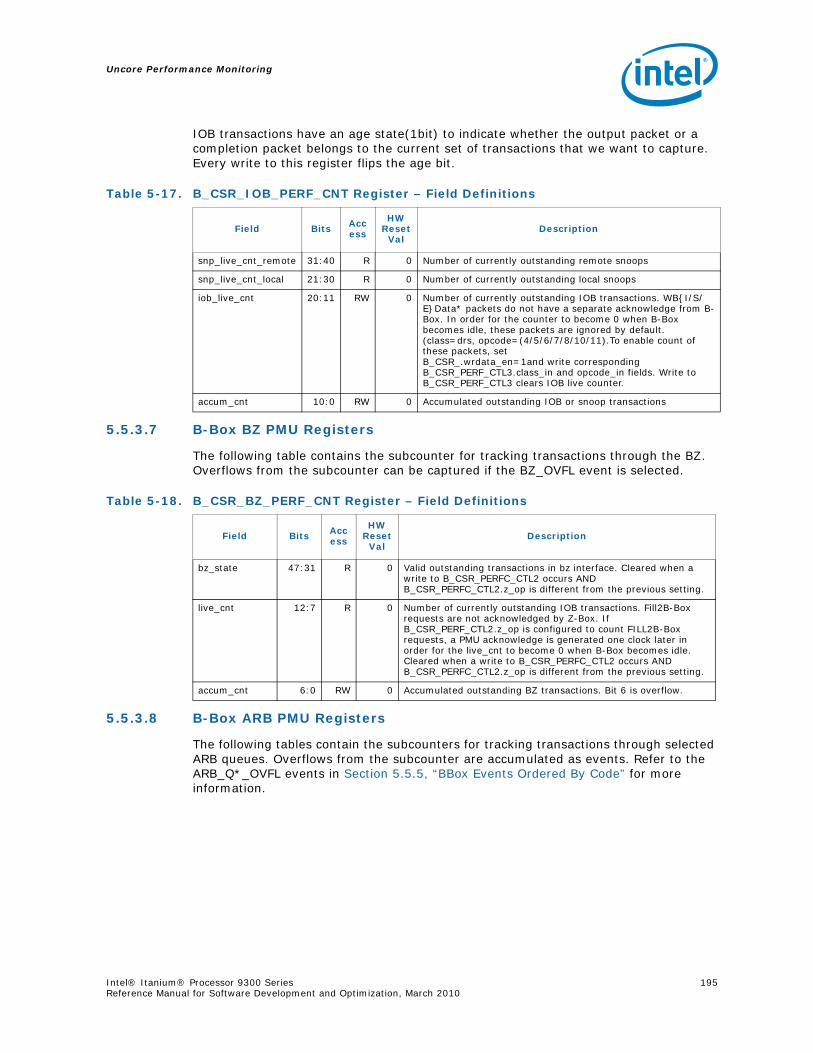
Uncore Performance Monitoring
Intel® Itanium® Processor 9300 Series 195Reference Manual for Software Development and Optimization, March 2010
IOB transactions have an age state(1bit) to indicate whether the output packet or a completion packet belongs to the current set of transactions that we want to capture. Every write to this register flips the age bit.
5.5.3.7 B-Box BZ PMU Registers
The following table contains the subcounter for tracking transactions through the BZ. Overflows from the subcounter can be captured if the BZ_OVFL event is selected.
5.5.3.8 B-Box ARB PMU Registers
The following tables contain the subcounters for tracking transactions through selected ARB queues. Overflows from the subcounter are accumulated as events. Refer to the ARB_Q*_OVFL events in Section 5.5.5, “BBox Events Ordered By Code” for more information.
Table 5-17. B_CSR_IOB_PERF_CNT Register – Field Definitions
Field Bits Access
HW Reset
ValDescription
snp_live_cnt_remote 31:40 R 0 Number of currently outstanding remote snoops
snp_live_cnt_local 21:30 R 0 Number of currently outstanding local snoops
iob_live_cnt 20:11 RW 0 Number of currently outstanding IOB transactions. WB{I/S/E}Data* packets do not have a separate acknowledge from B-Box. In order for the counter to become 0 when B-Box becomes idle, these packets are ignored by default. (class=drs, opcode=(4/5/6/7/8/10/11).To enable count of these packets, set B_CSR_.wrdata_en=1and write corresponding B_CSR_PERF_CTL3.class_in and opcode_in fields. Write to B_CSR_PERF_CTL3 clears IOB live counter.
accum_cnt 10:0 RW 0 Accumulated outstanding IOB or snoop transactions
Table 5-18. B_CSR_BZ_PERF_CNT Register – Field Definitions
Field Bits Access
HW Reset
ValDescription
bz_state 47:31 R 0 Valid outstanding transactions in bz interface. Cleared when a write to B_CSR_PERFC_CTL2 occurs AND B_CSR_PERFC_CTL2.z_op is different from the previous setting.
live_cnt 12:7 R 0 Number of currently outstanding IOB transactions. Fill2B-Box requests are not acknowledged by Z-Box. If B_CSR_PERF_CTL2.z_op is configured to count FILL2B-Box requests, a PMU acknowledge is generated one clock later in order for the live_cnt to become 0 when B-Box becomes idle. Cleared when a write to B_CSR_PERFC_CTL2 occurs AND B_CSR_PERFC_CTL2.z_op is different from the previous setting.
accum_cnt 6:0 RW 0 Accumulated outstanding BZ transactions. Bit 6 is overflow.
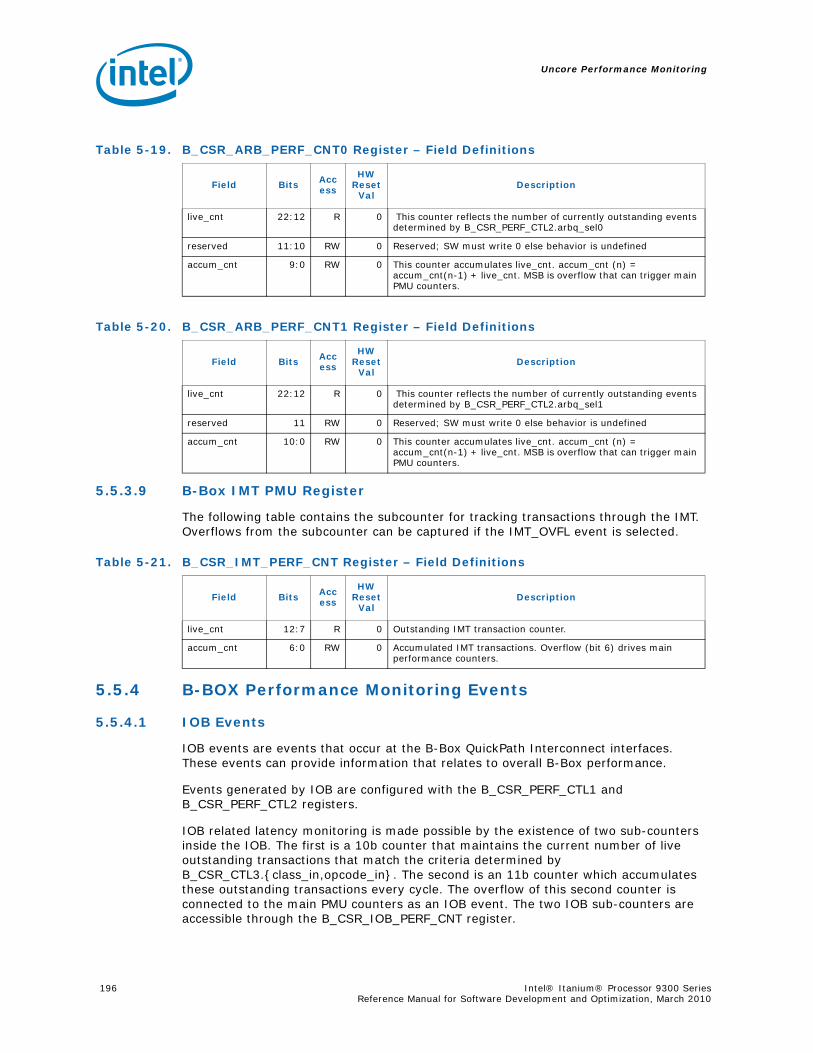
Uncore Performance Monitoring
196 Intel® Itanium® Processor 9300 Series Reference Manual for Software Development and Optimization, March 2010
5.5.3.9 B-Box IMT PMU Register
The following table contains the subcounter for tracking transactions through the IMT. Overflows from the subcounter can be captured if the IMT_OVFL event is selected.
5.5.4 B-BOX Performance Monitoring Events
5.5.4.1 IOB Events
IOB events are events that occur at the B-Box QuickPath Interconnect interfaces. These events can provide information that relates to overall B-Box performance.
Events generated by IOB are configured with the B_CSR_PERF_CTL1 and B_CSR_PERF_CTL2 registers.
IOB related latency monitoring is made possible by the existence of two sub-counters inside the IOB. The first is a 10b counter that maintains the current number of live outstanding transactions that match the criteria determined by B_CSR_CTL3.{class_in,opcode_in}. The second is an 11b counter which accumulates these outstanding transactions every cycle. The overflow of this second counter is connected to the main PMU counters as an IOB event. The two IOB sub-counters are accessible through the B_CSR_IOB_PERF_CNT register.
Table 5-19. B_CSR_ARB_PERF_CNT0 Register – Field Definitions
Field Bits Access
HW Reset
ValDescription
live_cnt 22:12 R 0 This counter reflects the number of currently outstanding events determined by B_CSR_PERF_CTL2.arbq_sel0
reserved 11:10 RW 0 Reserved; SW must write 0 else behavior is undefined
accum_cnt 9:0 RW 0 This counter accumulates live_cnt. accum_cnt (n) = accum_cnt(n-1) + live_cnt. MSB is overflow that can trigger main PMU counters.
Table 5-20. B_CSR_ARB_PERF_CNT1 Register – Field Definitions
Field Bits Access
HW Reset
ValDescription
live_cnt 22:12 R 0 This counter reflects the number of currently outstanding events determined by B_CSR_PERF_CTL2.arbq_sel1
reserved 11 RW 0 Reserved; SW must write 0 else behavior is undefined
accum_cnt 10:0 RW 0 This counter accumulates live_cnt. accum_cnt (n) = accum_cnt(n-1) + live_cnt. MSB is overflow that can trigger main PMU counters.
Table 5-21. B_CSR_IMT_PERF_CNT Register – Field Definitions
Field Bits Access
HW Reset
ValDescription
live_cnt 12:7 R 0 Outstanding IMT transaction counter.
accum_cnt 6:0 RW 0 Accumulated IMT transactions. Overflow (bit 6) drives main performance counters.
Uncore Performance Monitoring
Intel® Itanium® Processor 9300 Series 197Reference Manual for Software Development and Optimization, March 2010
IOB events are selected by opcode, class and locality (remote/local/any). Any set of different class and opcode packets can be selected for counting. To calculate average latency, snoop requests and responses need to be selected separately. To determine the latency of non-snoop packets, any completion packet can be selected by setting B_CSR_PERF_CTL2.iob_trans_sel to 1. Wr*data* (WB{I,S,E} Data Type) packets are not selected by default in B_CSR_PERF_CTL3. This is done to obtain correct latency results for WR* packets.
Input packet locality is determined by either RHNID (Requester Home Node ID) or RSNID (Requester Snoop Node ID). Output packet locality is determined by either DNID (Destination ID) or RHNID.
Four types of response forward packets can be counted, local to local, remote to local, local to remote and remote to remote.
5.5.4.2 BZ Events
BZ requests are initiated by the B-Box and are completed when the Z-Box acknowledges (‘ack’s) the request. This is a partial latency of a B-Box to Z-Box access. One B-Box read or write request may include more than one ack from the Z-Box.
Two counters exist to compute the average latency of BZ requests. The first is a 6b that maintains the current number of outstanding requests. The second is a 7b counter which accumulates these outstanding requests each cycles. The overflow of the second counter is connected to the main PMU counters as a BZ event (BZ_OVFL).
Since FILL2B opcodes are not acknowledged by the Z-Box, this opcode should be excluded from the Z-Box opcode selection when average latency data is required.
NOTE: To determine average Z-Box Latency, one can measure BZ_OVFL / BZ_ACK. These events can be further filtered by Z-Box opcode. See appropriate event descriptions for more information.
5.5.4.3 Arbiter Events
The arbiter contains 37 queues: BRAQ, WIAQ, RIAQ, NBRAQ, COHQ and 32 conflict queues. The arbiter sub counters are 10 and 11b respectively and can either accumulate the outstanding transactions in one of the queues or accumulate the number of non-empty arbiter queues. B_CSR_PERF_ARB_PERF_CNT{1-0} provide access to these sub-counters. The B_CSR_PERF_CTL2 CSR contains fields controlling the counters. Overflows of the two counters are connected to main PMU counters as arbiter events ARB_Q{0,1}_OVFL.
The arbitration queues are used to arbitrate amongst Tracker/IMT entries for a given resource when the resource is not immediately available. Examples of unavailable resources are: QuickPath Interconnect credits to send a packet out of the B-Box, the R-Box output port is busy or the IMT is full. Most ARB queues correspond to QuickPath Interconnect message classes. Two of the ARB queues (the COHQ and the CNFLTQ) are used to arbitrate for access to the IMT itself.
Following arbQs are present in the design:
• 1) RIAQ (Read ARBq) – this queue holds failover reads that target a B-Box slave. It is used only in mirroring flows. 32 entries.
• 2) WIAQ (Write ARBq) – this queue holds writes that target a B-Box slave. It is used only in migration/mirroring flows. 32 entries.

Uncore Performance Monitoring
198 Intel® Itanium® Processor 9300 Series Reference Manual for Software Development and Optimization, March 2010
• 3) BRAQ (Block Response ARBq)- this queue holds requests that are waiting to send DataC_x_Cmp to the requestor. The reason these are queued up in the BRAQ is either due to lack of credits or output port (to R-Box) business. 32 entries.
• 4) NBRAQ (Non-Block Response ARBq) – this queue holds requests that are waiting to send a Cmp (NDR) packet to the requestor. The reason these are queued up in the NBRAQ is either due to lack of credits or output port (to R-Box) business. Note that in the case of NBRAQ, the IMT entry may already have been de-allocated (such is not the case for BRAQ though). 512 entries.
• 5) COHQ (aka RSRCQ) – this queue holds requests that encountered a full IMT. Since the home message class (new requests) must be sunk due to tracker pre-allocation, a queue must keep track of entries that could not be immediately allocated into the IMT. The COHQ serves this purpose. 512 entries.
• 6) CLMQ – (Cell Local Memory Queue) this queue is used to implement the CLM-mode3 optimization. Writebacks from IOH agents are pushed into this queue till the DC has written out the hint indicating who the next consumer owner of the line would be. 32 entries.
• 7) CNFLTQ (Conflict Queues) – this is a collection of 32 separate queues (one per each IMT entry) of 64 entry deep each. The queue holds all conflictors (max 64 since the Bbox only supports a 6b nid, and each caching agent can have at most one request to the same address).
5.5.4.4 IMT Events
In-flight memory table events enable calculation of average occupation of IMT. There are 5 IMT events: sub-counter overflow, pop conflict, allocate, non-empty and full. The number of IMT inserts is a sum of pop conflict and allocate events. All IMT events are defined in B_CSR_PERF_CTL1.
5.5.5 BBox Events Ordered By Code
Table 5-22 summarizes the directly-measured BBox events.
Table 5-22. Performance Monitor Events for BBox Events (Sheet 1 of 2)
Symbol Name Event Code
SubCtl Dep?
Max Inc/Cyc Description
RFP_LOC_LOC 0x00 1 RFP Local/Local
RFP_REM_LOC 0x01 1 RFP Remote/Local
RFP_LOC_REM 0x02 1 RFP Local/Remote
RFP_REM_REM 0x03 1 RFP Remote/Remote
IMT_OVFL 0x04 1 IMT Overflows
IMT_ALLOC 0x05 1 IMT Allocations
IMT_POP_CFL 0x06 1 IMT Pop Conflicts
IMT_NOT_EMPTY 0x07 1 Cycles IMT Not Empty
ARB_Q0_OVFL 0x08 CTL2 1 Arb Queue 0 Counter Overflow
ARB_Q0_INSERTS 0x09 CTL2 1 Arb Queue 0 Inerts
ARB_Q0_REMOVE 0x0A CTL2 1 Arb Queue 0 Remove
ARB_Q0_NOT_EMPTY 0x0B CTL2 1 Arb Queue 0 Not Empty
ARB_Q0_FULL 0x0C CTL2 1 Arb Queue 0 Full
ARB_Q1_OVFL 0x0D 1 Arb Queue 1 Counter Overflow
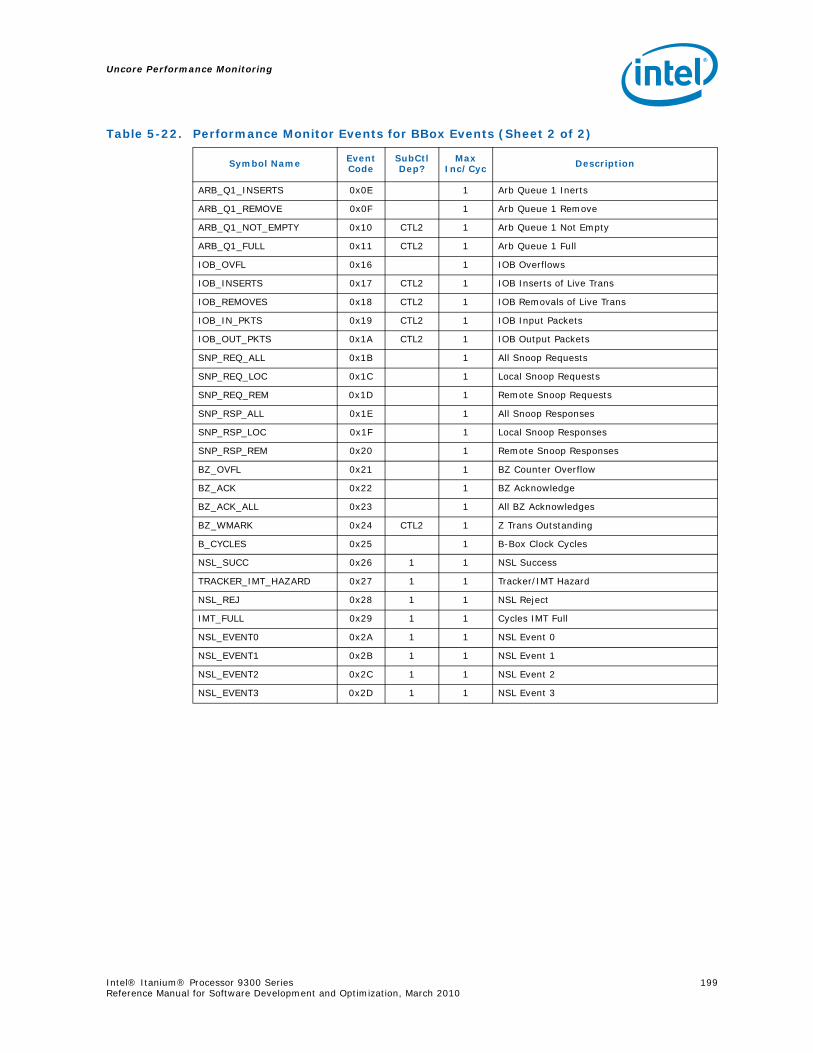
Uncore Performance Monitoring
Intel® Itanium® Processor 9300 Series 199Reference Manual for Software Development and Optimization, March 2010
ARB_Q1_INSERTS 0x0E 1 Arb Queue 1 Inerts
ARB_Q1_REMOVE 0x0F 1 Arb Queue 1 Remove
ARB_Q1_NOT_EMPTY 0x10 CTL2 1 Arb Queue 1 Not Empty
ARB_Q1_FULL 0x11 CTL2 1 Arb Queue 1 Full
IOB_OVFL 0x16 1 IOB Overflows
IOB_INSERTS 0x17 CTL2 1 IOB Inserts of Live Trans
IOB_REMOVES 0x18 CTL2 1 IOB Removals of Live Trans
IOB_IN_PKTS 0x19 CTL2 1 IOB Input Packets
IOB_OUT_PKTS 0x1A CTL2 1 IOB Output Packets
SNP_REQ_ALL 0x1B 1 All Snoop Requests
SNP_REQ_LOC 0x1C 1 Local Snoop Requests
SNP_REQ_REM 0x1D 1 Remote Snoop Requests
SNP_RSP_ALL 0x1E 1 All Snoop Responses
SNP_RSP_LOC 0x1F 1 Local Snoop Responses
SNP_RSP_REM 0x20 1 Remote Snoop Responses
BZ_OVFL 0x21 1 BZ Counter Overflow
BZ_ACK 0x22 1 BZ Acknowledge
BZ_ACK_ALL 0x23 1 All BZ Acknowledges
BZ_WMARK 0x24 CTL2 1 Z Trans Outstanding
B_CYCLES 0x25 1 B-Box Clock Cycles
NSL_SUCC 0x26 1 1 NSL Success
TRACKER_IMT_HAZARD 0x27 1 1 Tracker/IMT Hazard
NSL_REJ 0x28 1 1 NSL Reject
IMT_FULL 0x29 1 1 Cycles IMT Full
NSL_EVENT0 0x2A 1 1 NSL Event 0
NSL_EVENT1 0x2B 1 1 NSL Event 1
NSL_EVENT2 0x2C 1 1 NSL Event 2
NSL_EVENT3 0x2D 1 1 NSL Event 3
Table 5-22. Performance Monitor Events for BBox Events (Sheet 2 of 2)
Symbol Name Event Code
SubCtl Dep?
Max Inc/Cyc Description
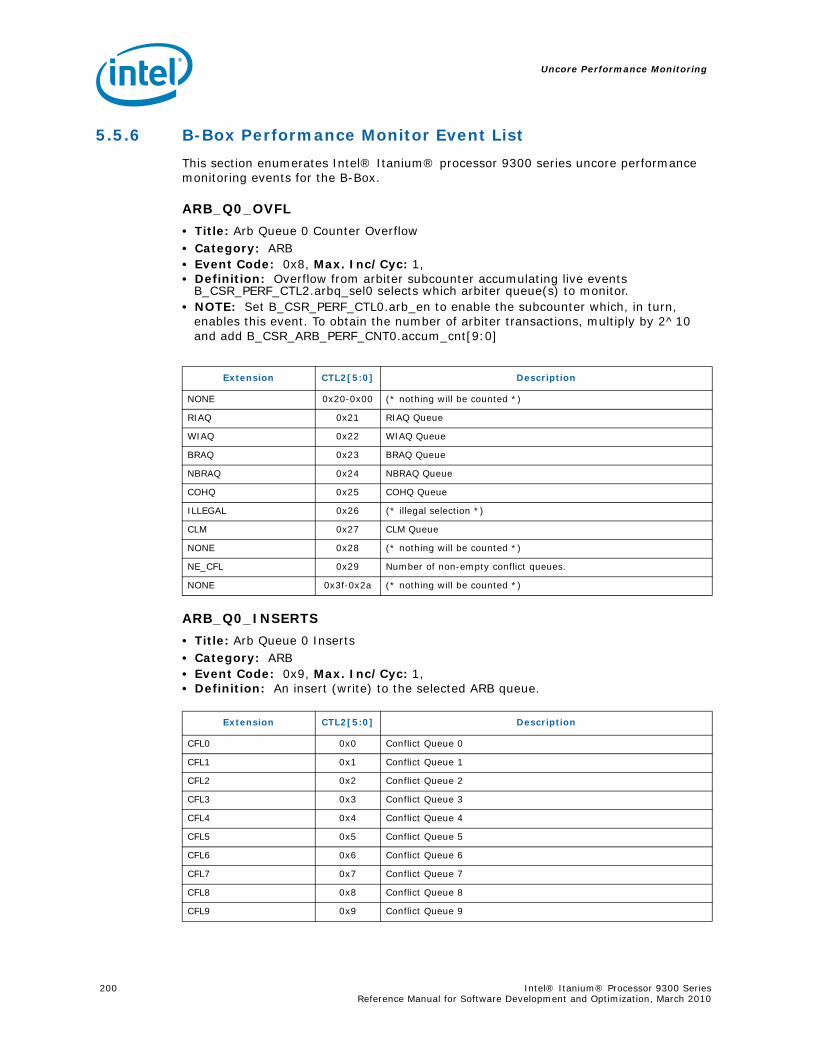
Uncore Performance Monitoring
200 Intel® Itanium® Processor 9300 Series Reference Manual for Software Development and Optimization, March 2010
5.5.6 B-Box Performance Monitor Event List
This section enumerates Intel® Itanium® processor 9300 series uncore performance monitoring events for the B-Box.
ARB_Q0_OVFL
• Title: Arb Queue 0 Counter Overflow• Category: ARB• Event Code: 0x8, Max. Inc/Cyc: 1, • Definition: Overflow from arbiter subcounter accumulating live events
B_CSR_PERF_CTL2.arbq_sel0 selects which arbiter queue(s) to monitor.• NOTE: Set B_CSR_PERF_CTL0.arb_en to enable the subcounter which, in turn,
enables this event. To obtain the number of arbiter transactions, multiply by 2^10 and add B_CSR_ARB_PERF_CNT0.accum_cnt[9:0]
ARB_Q0_INSERTS
• Title: Arb Queue 0 Inserts• Category: ARB• Event Code: 0x9, Max. Inc/Cyc: 1, • Definition: An insert (write) to the selected ARB queue.
Extension CTL2[5:0] Description
NONE 0x20-0x00 (* nothing will be counted *)
RIAQ 0x21 RIAQ Queue
WIAQ 0x22 WIAQ Queue
BRAQ 0x23 BRAQ Queue
NBRAQ 0x24 NBRAQ Queue
COHQ 0x25 COHQ Queue
ILLEGAL 0x26 (* illegal selection *)
CLM 0x27 CLM Queue
NONE 0x28 (* nothing will be counted *)
NE_CFL 0x29 Number of non-empty conflict queues.
NONE 0x3f-0x2a (* nothing will be counted *)
Extension CTL2[5:0] Description
CFL0 0x0 Conflict Queue 0
CFL1 0x1 Conflict Queue 1
CFL2 0x2 Conflict Queue 2
CFL3 0x3 Conflict Queue 3
CFL4 0x4 Conflict Queue 4
CFL5 0x5 Conflict Queue 5
CFL6 0x6 Conflict Queue 6
CFL7 0x7 Conflict Queue 7
CFL8 0x8 Conflict Queue 8
CFL9 0x9 Conflict Queue 9
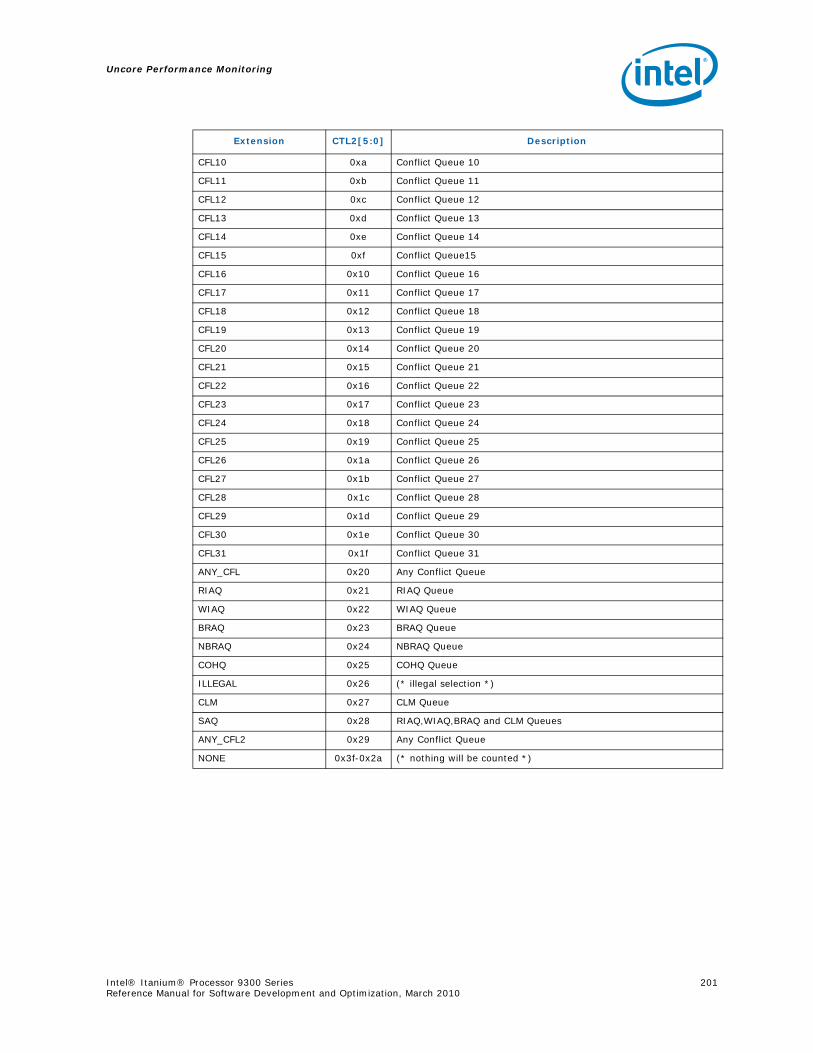
Uncore Performance Monitoring
Intel® Itanium® Processor 9300 Series 201Reference Manual for Software Development and Optimization, March 2010
CFL10 0xa Conflict Queue 10
CFL11 0xb Conflict Queue 11
CFL12 0xc Conflict Queue 12
CFL13 0xd Conflict Queue 13
CFL14 0xe Conflict Queue 14
CFL15 0xf Conflict Queue15
CFL16 0x10 Conflict Queue 16
CFL17 0x11 Conflict Queue 17
CFL18 0x12 Conflict Queue 18
CFL19 0x13 Conflict Queue 19
CFL20 0x14 Conflict Queue 20
CFL21 0x15 Conflict Queue 21
CFL22 0x16 Conflict Queue 22
CFL23 0x17 Conflict Queue 23
CFL24 0x18 Conflict Queue 24
CFL25 0x19 Conflict Queue 25
CFL26 0x1a Conflict Queue 26
CFL27 0x1b Conflict Queue 27
CFL28 0x1c Conflict Queue 28
CFL29 0x1d Conflict Queue 29
CFL30 0x1e Conflict Queue 30
CFL31 0x1f Conflict Queue 31
ANY_CFL 0x20 Any Conflict Queue
RIAQ 0x21 RIAQ Queue
WIAQ 0x22 WIAQ Queue
BRAQ 0x23 BRAQ Queue
NBRAQ 0x24 NBRAQ Queue
COHQ 0x25 COHQ Queue
ILLEGAL 0x26 (* illegal selection *)
CLM 0x27 CLM Queue
SAQ 0x28 RIAQ,WIAQ,BRAQ and CLM Queues
ANY_CFL2 0x29 Any Conflict Queue
NONE 0x3f-0x2a (* nothing will be counted *)
Extension CTL2[5:0] Description
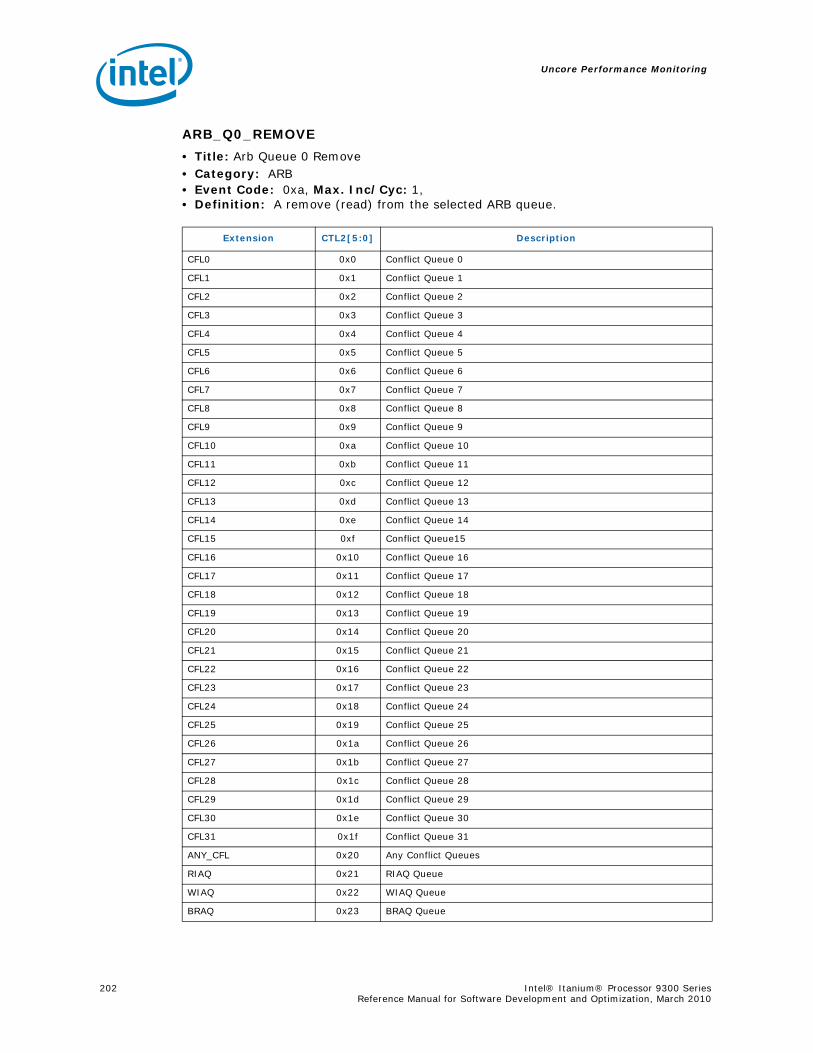
Uncore Performance Monitoring
202 Intel® Itanium® Processor 9300 Series Reference Manual for Software Development and Optimization, March 2010
ARB_Q0_REMOVE
• Title: Arb Queue 0 Remove• Category: ARB• Event Code: 0xa, Max. Inc/Cyc: 1, • Definition: A remove (read) from the selected ARB queue.
Extension CTL2[5:0] Description
CFL0 0x0 Conflict Queue 0
CFL1 0x1 Conflict Queue 1
CFL2 0x2 Conflict Queue 2
CFL3 0x3 Conflict Queue 3
CFL4 0x4 Conflict Queue 4
CFL5 0x5 Conflict Queue 5
CFL6 0x6 Conflict Queue 6
CFL7 0x7 Conflict Queue 7
CFL8 0x8 Conflict Queue 8
CFL9 0x9 Conflict Queue 9
CFL10 0xa Conflict Queue 10
CFL11 0xb Conflict Queue 11
CFL12 0xc Conflict Queue 12
CFL13 0xd Conflict Queue 13
CFL14 0xe Conflict Queue 14
CFL15 0xf Conflict Queue15
CFL16 0x10 Conflict Queue 16
CFL17 0x11 Conflict Queue 17
CFL18 0x12 Conflict Queue 18
CFL19 0x13 Conflict Queue 19
CFL20 0x14 Conflict Queue 20
CFL21 0x15 Conflict Queue 21
CFL22 0x16 Conflict Queue 22
CFL23 0x17 Conflict Queue 23
CFL24 0x18 Conflict Queue 24
CFL25 0x19 Conflict Queue 25
CFL26 0x1a Conflict Queue 26
CFL27 0x1b Conflict Queue 27
CFL28 0x1c Conflict Queue 28
CFL29 0x1d Conflict Queue 29
CFL30 0x1e Conflict Queue 30
CFL31 0x1f Conflict Queue 31
ANY_CFL 0x20 Any Conflict Queues
RIAQ 0x21 RIAQ Queue
WIAQ 0x22 WIAQ Queue
BRAQ 0x23 BRAQ Queue
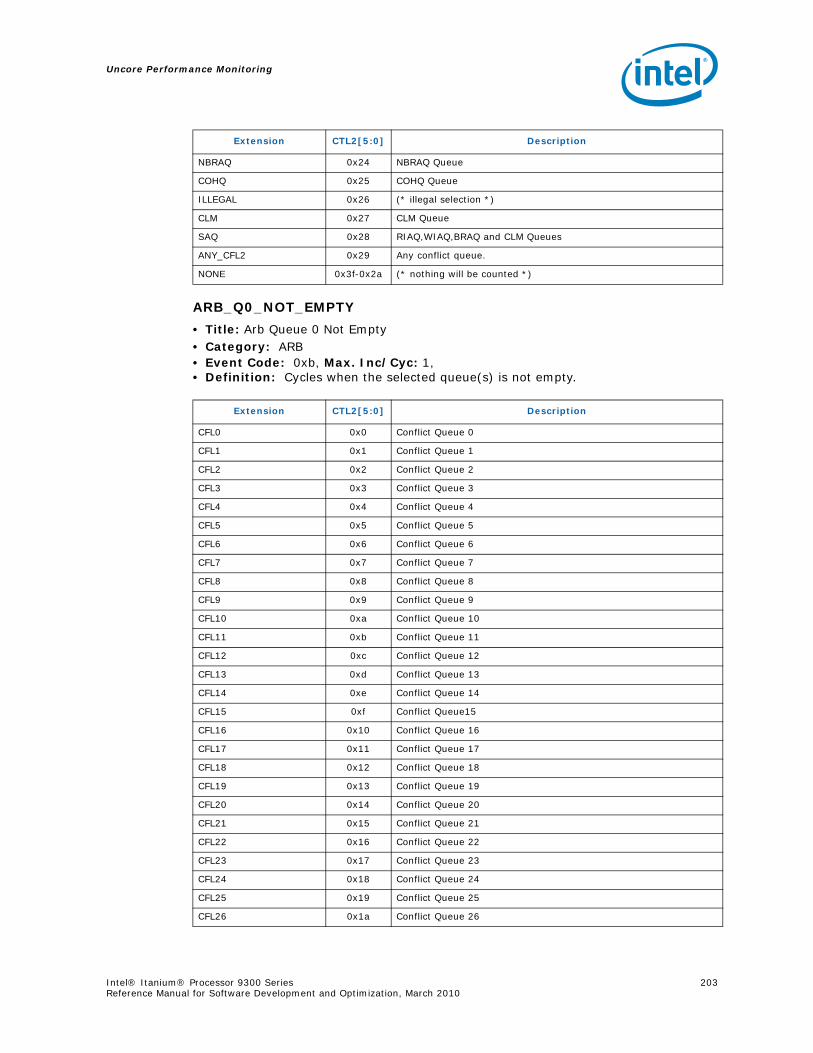
Uncore Performance Monitoring
Intel® Itanium® Processor 9300 Series 203Reference Manual for Software Development and Optimization, March 2010
ARB_Q0_NOT_EMPTY
• Title: Arb Queue 0 Not Empty• Category: ARB• Event Code: 0xb, Max. Inc/Cyc: 1, • Definition: Cycles when the selected queue(s) is not empty.
NBRAQ 0x24 NBRAQ Queue
COHQ 0x25 COHQ Queue
ILLEGAL 0x26 (* illegal selection *)
CLM 0x27 CLM Queue
SAQ 0x28 RIAQ,WIAQ,BRAQ and CLM Queues
ANY_CFL2 0x29 Any conflict queue.
NONE 0x3f-0x2a (* nothing will be counted *)
Extension CTL2[5:0] Description
Extension CTL2[5:0] Description
CFL0 0x0 Conflict Queue 0
CFL1 0x1 Conflict Queue 1
CFL2 0x2 Conflict Queue 2
CFL3 0x3 Conflict Queue 3
CFL4 0x4 Conflict Queue 4
CFL5 0x5 Conflict Queue 5
CFL6 0x6 Conflict Queue 6
CFL7 0x7 Conflict Queue 7
CFL8 0x8 Conflict Queue 8
CFL9 0x9 Conflict Queue 9
CFL10 0xa Conflict Queue 10
CFL11 0xb Conflict Queue 11
CFL12 0xc Conflict Queue 12
CFL13 0xd Conflict Queue 13
CFL14 0xe Conflict Queue 14
CFL15 0xf Conflict Queue15
CFL16 0x10 Conflict Queue 16
CFL17 0x11 Conflict Queue 17
CFL18 0x12 Conflict Queue 18
CFL19 0x13 Conflict Queue 19
CFL20 0x14 Conflict Queue 20
CFL21 0x15 Conflict Queue 21
CFL22 0x16 Conflict Queue 22
CFL23 0x17 Conflict Queue 23
CFL24 0x18 Conflict Queue 24
CFL25 0x19 Conflict Queue 25
CFL26 0x1a Conflict Queue 26
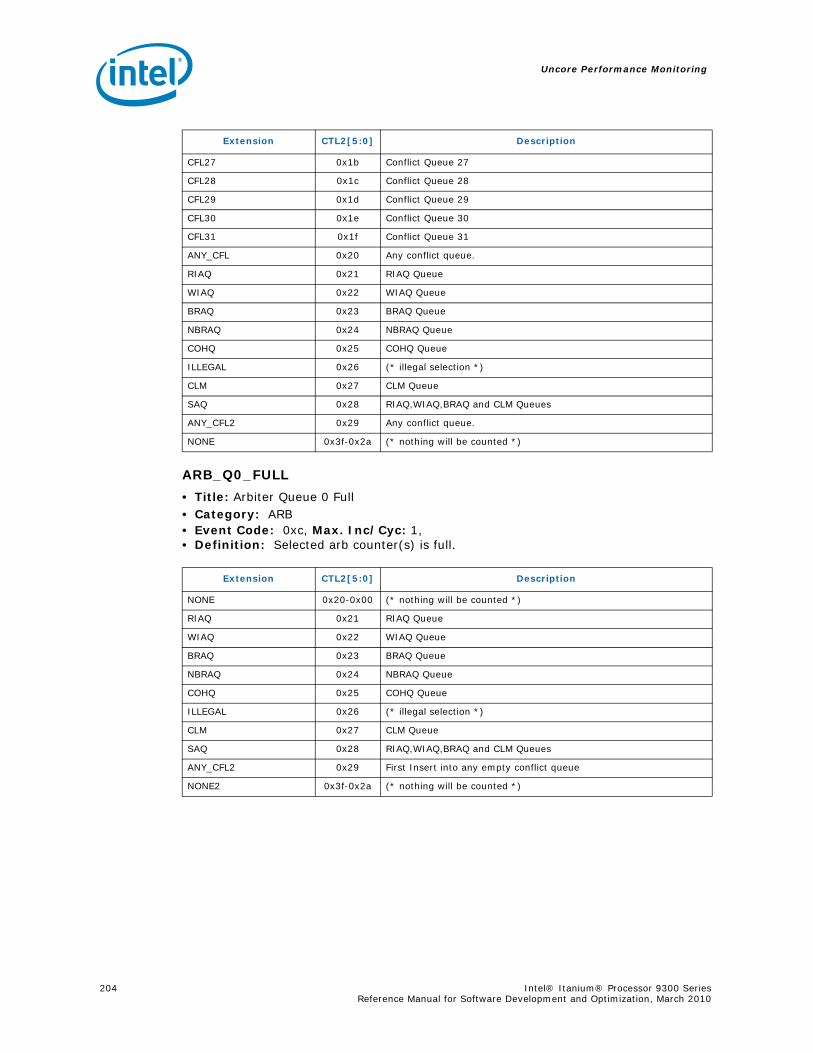
Uncore Performance Monitoring
204 Intel® Itanium® Processor 9300 Series Reference Manual for Software Development and Optimization, March 2010
ARB_Q0_FULL
• Title: Arbiter Queue 0 Full• Category: ARB• Event Code: 0xc, Max. Inc/Cyc: 1, • Definition: Selected arb counter(s) is full.
CFL27 0x1b Conflict Queue 27
CFL28 0x1c Conflict Queue 28
CFL29 0x1d Conflict Queue 29
CFL30 0x1e Conflict Queue 30
CFL31 0x1f Conflict Queue 31
ANY_CFL 0x20 Any conflict queue.
RIAQ 0x21 RIAQ Queue
WIAQ 0x22 WIAQ Queue
BRAQ 0x23 BRAQ Queue
NBRAQ 0x24 NBRAQ Queue
COHQ 0x25 COHQ Queue
ILLEGAL 0x26 (* illegal selection *)
CLM 0x27 CLM Queue
SAQ 0x28 RIAQ,WIAQ,BRAQ and CLM Queues
ANY_CFL2 0x29 Any conflict queue.
NONE 0x3f-0x2a (* nothing will be counted *)
Extension CTL2[5:0] Description
Extension CTL2[5:0] Description
NONE 0x20-0x00 (* nothing will be counted *)
RIAQ 0x21 RIAQ Queue
WIAQ 0x22 WIAQ Queue
BRAQ 0x23 BRAQ Queue
NBRAQ 0x24 NBRAQ Queue
COHQ 0x25 COHQ Queue
ILLEGAL 0x26 (* illegal selection *)
CLM 0x27 CLM Queue
SAQ 0x28 RIAQ,WIAQ,BRAQ and CLM Queues
ANY_CFL2 0x29 First Insert into any empty conflict queue
NONE2 0x3f-0x2a (* nothing will be counted *)
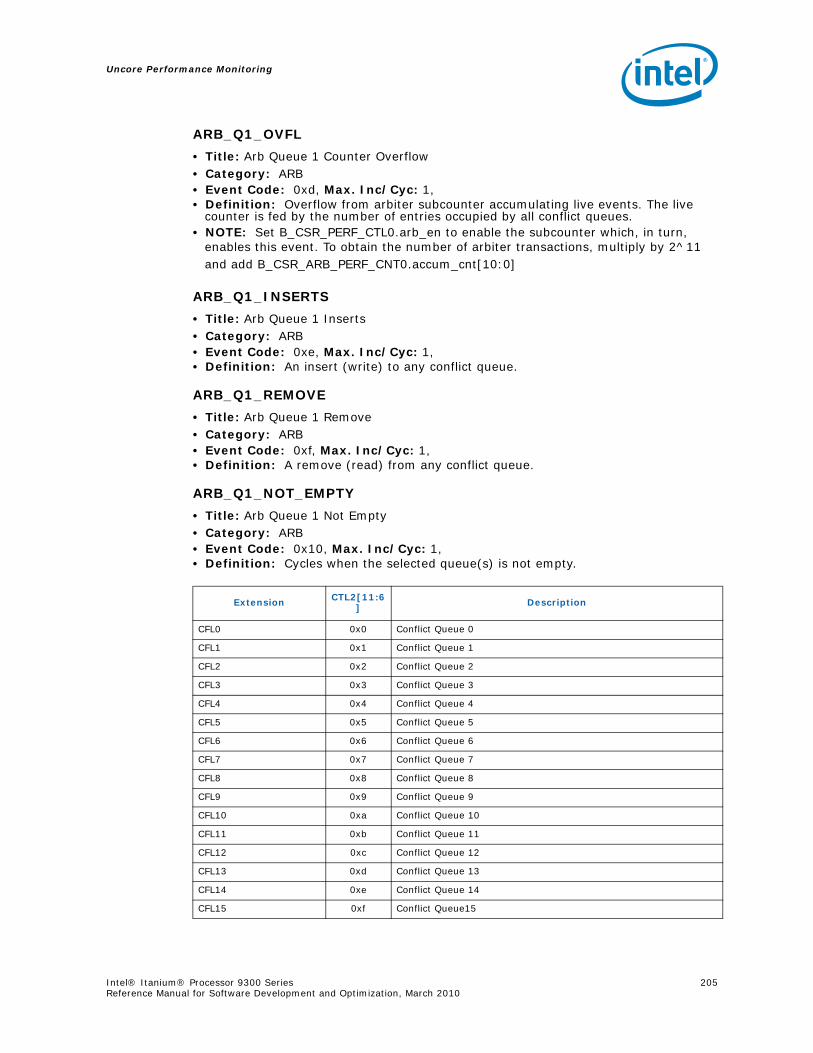
Uncore Performance Monitoring
Intel® Itanium® Processor 9300 Series 205Reference Manual for Software Development and Optimization, March 2010
ARB_Q1_OVFL
• Title: Arb Queue 1 Counter Overflow• Category: ARB• Event Code: 0xd, Max. Inc/Cyc: 1, • Definition: Overflow from arbiter subcounter accumulating live events. The live
counter is fed by the number of entries occupied by all conflict queues.• NOTE: Set B_CSR_PERF_CTL0.arb_en to enable the subcounter which, in turn,
enables this event. To obtain the number of arbiter transactions, multiply by 2^11 and add B_CSR_ARB_PERF_CNT0.accum_cnt[10:0]
ARB_Q1_INSERTS
• Title: Arb Queue 1 Inserts• Category: ARB• Event Code: 0xe, Max. Inc/Cyc: 1, • Definition: An insert (write) to any conflict queue.
ARB_Q1_REMOVE
• Title: Arb Queue 1 Remove• Category: ARB• Event Code: 0xf, Max. Inc/Cyc: 1, • Definition: A remove (read) from any conflict queue.
ARB_Q1_NOT_EMPTY
• Title: Arb Queue 1 Not Empty• Category: ARB• Event Code: 0x10, Max. Inc/Cyc: 1, • Definition: Cycles when the selected queue(s) is not empty.
Extension CTL2[11:6] Description
CFL0 0x0 Conflict Queue 0
CFL1 0x1 Conflict Queue 1
CFL2 0x2 Conflict Queue 2
CFL3 0x3 Conflict Queue 3
CFL4 0x4 Conflict Queue 4
CFL5 0x5 Conflict Queue 5
CFL6 0x6 Conflict Queue 6
CFL7 0x7 Conflict Queue 7
CFL8 0x8 Conflict Queue 8
CFL9 0x9 Conflict Queue 9
CFL10 0xa Conflict Queue 10
CFL11 0xb Conflict Queue 11
CFL12 0xc Conflict Queue 12
CFL13 0xd Conflict Queue 13
CFL14 0xe Conflict Queue 14
CFL15 0xf Conflict Queue15
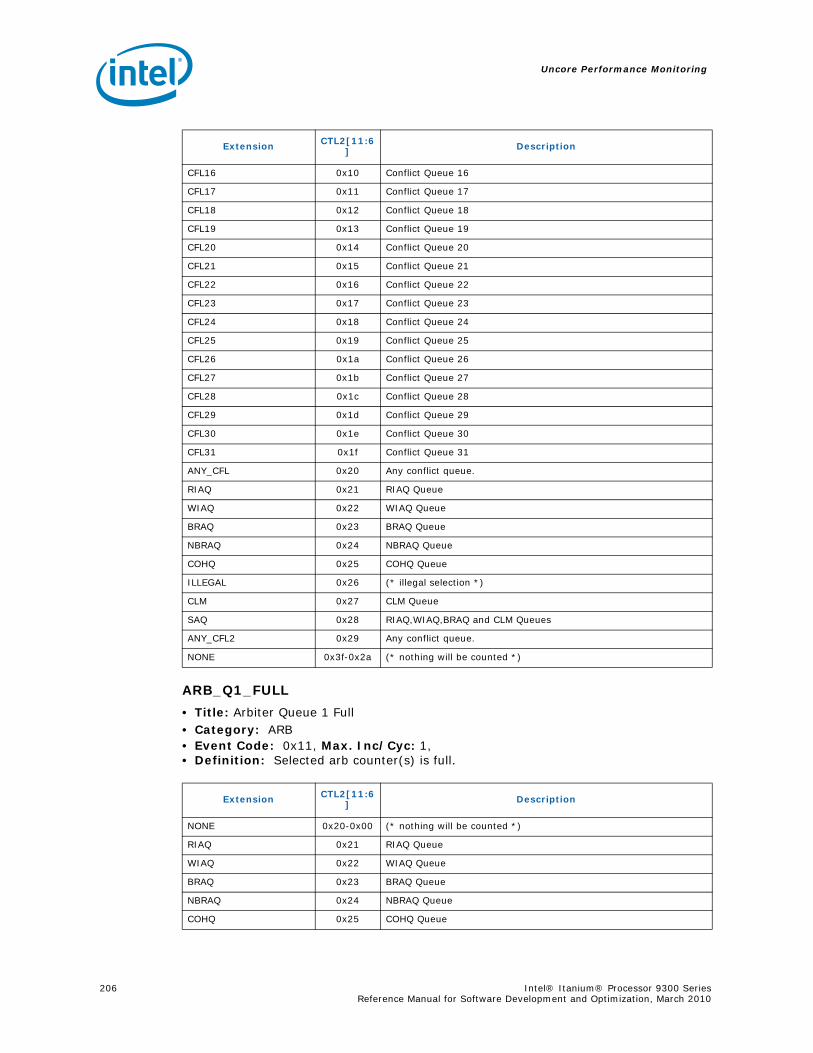
Uncore Performance Monitoring
206 Intel® Itanium® Processor 9300 Series Reference Manual for Software Development and Optimization, March 2010
ARB_Q1_FULL
• Title: Arbiter Queue 1 Full• Category: ARB• Event Code: 0x11, Max. Inc/Cyc: 1, • Definition: Selected arb counter(s) is full.
CFL16 0x10 Conflict Queue 16
CFL17 0x11 Conflict Queue 17
CFL18 0x12 Conflict Queue 18
CFL19 0x13 Conflict Queue 19
CFL20 0x14 Conflict Queue 20
CFL21 0x15 Conflict Queue 21
CFL22 0x16 Conflict Queue 22
CFL23 0x17 Conflict Queue 23
CFL24 0x18 Conflict Queue 24
CFL25 0x19 Conflict Queue 25
CFL26 0x1a Conflict Queue 26
CFL27 0x1b Conflict Queue 27
CFL28 0x1c Conflict Queue 28
CFL29 0x1d Conflict Queue 29
CFL30 0x1e Conflict Queue 30
CFL31 0x1f Conflict Queue 31
ANY_CFL 0x20 Any conflict queue.
RIAQ 0x21 RIAQ Queue
WIAQ 0x22 WIAQ Queue
BRAQ 0x23 BRAQ Queue
NBRAQ 0x24 NBRAQ Queue
COHQ 0x25 COHQ Queue
ILLEGAL 0x26 (* illegal selection *)
CLM 0x27 CLM Queue
SAQ 0x28 RIAQ,WIAQ,BRAQ and CLM Queues
ANY_CFL2 0x29 Any conflict queue.
NONE 0x3f-0x2a (* nothing will be counted *)
Extension CTL2[11:6] Description
Extension CTL2[11:6] Description
NONE 0x20-0x00 (* nothing will be counted *)
RIAQ 0x21 RIAQ Queue
WIAQ 0x22 WIAQ Queue
BRAQ 0x23 BRAQ Queue
NBRAQ 0x24 NBRAQ Queue
COHQ 0x25 COHQ Queue
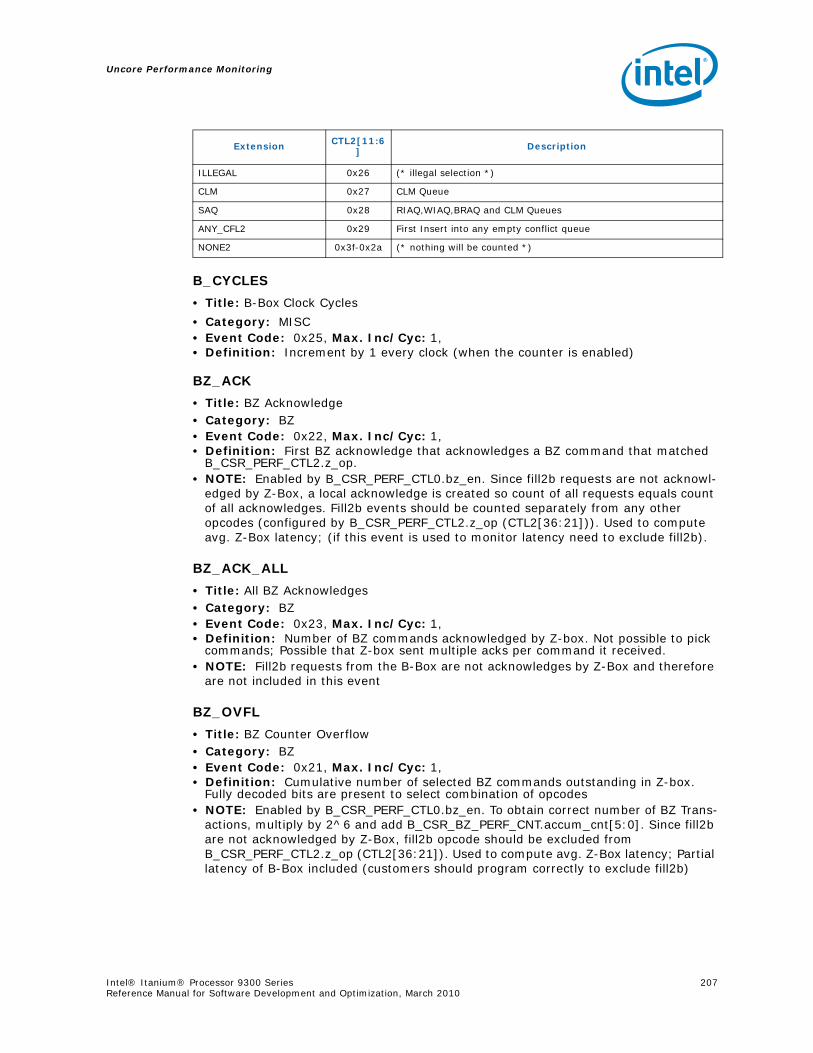
Uncore Performance Monitoring
Intel® Itanium® Processor 9300 Series 207Reference Manual for Software Development and Optimization, March 2010
B_CYCLES
• Title: B-Box Clock Cycles
• Category: MISC• Event Code: 0x25, Max. Inc/Cyc: 1, • Definition: Increment by 1 every clock (when the counter is enabled)
BZ_ACK
• Title: BZ Acknowledge• Category: BZ• Event Code: 0x22, Max. Inc/Cyc: 1, • Definition: First BZ acknowledge that acknowledges a BZ command that matched
B_CSR_PERF_CTL2.z_op. • NOTE: Enabled by B_CSR_PERF_CTL0.bz_en. Since fill2b requests are not acknowl-
edged by Z-Box, a local acknowledge is created so count of all requests equals count of all acknowledges. Fill2b events should be counted separately from any other opcodes (configured by B_CSR_PERF_CTL2.z_op (CTL2[36:21])). Used to compute avg. Z-Box latency; (if this event is used to monitor latency need to exclude fill2b).
BZ_ACK_ALL
• Title: All BZ Acknowledges• Category: BZ• Event Code: 0x23, Max. Inc/Cyc: 1, • Definition: Number of BZ commands acknowledged by Z-box. Not possible to pick
commands; Possible that Z-box sent multiple acks per command it received.• NOTE: Fill2b requests from the B-Box are not acknowledges by Z-Box and therefore
are not included in this event
BZ_OVFL
• Title: BZ Counter Overflow• Category: BZ• Event Code: 0x21, Max. Inc/Cyc: 1, • Definition: Cumulative number of selected BZ commands outstanding in Z-box.
Fully decoded bits are present to select combination of opcodes• NOTE: Enabled by B_CSR_PERF_CTL0.bz_en. To obtain correct number of BZ Trans-
actions, multiply by 2^6 and add B_CSR_BZ_PERF_CNT.accum_cnt[5:0]. Since fill2b are not acknowledged by Z-Box, fill2b opcode should be excluded from B_CSR_PERF_CTL2.z_op (CTL2[36:21]). Used to compute avg. Z-Box latency; Partial latency of B-Box included (customers should program correctly to exclude fill2b)
ILLEGAL 0x26 (* illegal selection *)
CLM 0x27 CLM Queue
SAQ 0x28 RIAQ,WIAQ,BRAQ and CLM Queues
ANY_CFL2 0x29 First Insert into any empty conflict queue
NONE2 0x3f-0x2a (* nothing will be counted *)
Extension CTL2[11:6] Description
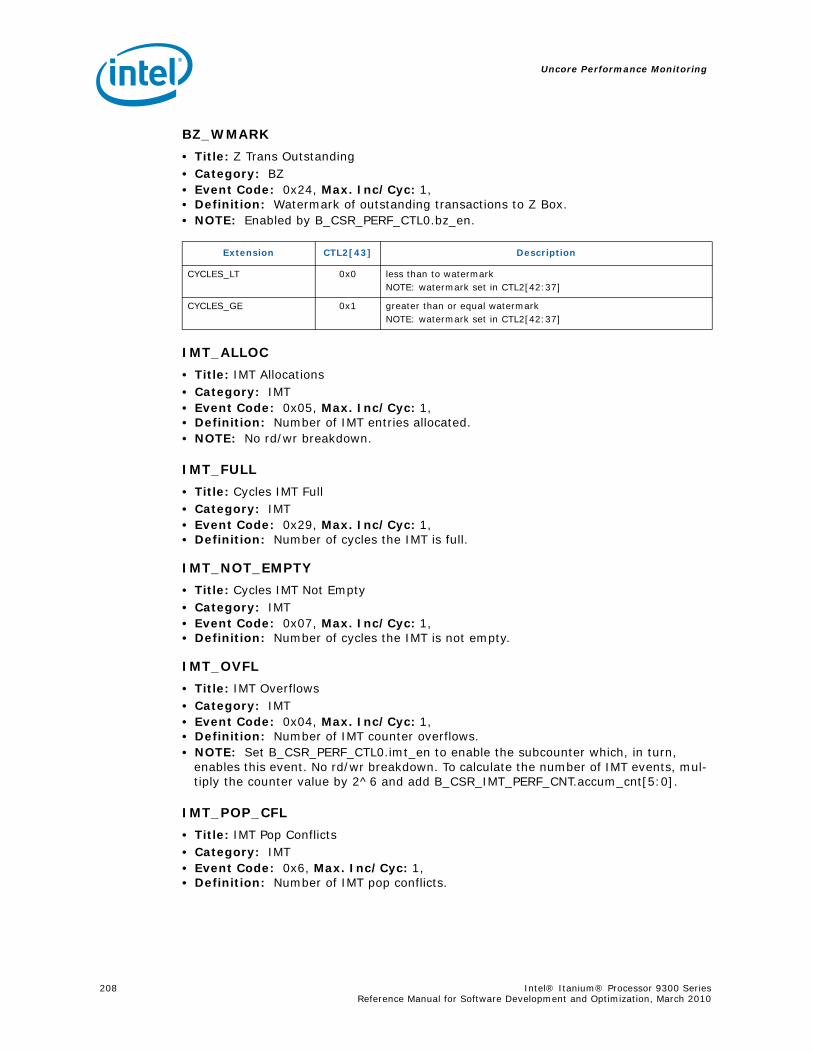
Uncore Performance Monitoring
208 Intel® Itanium® Processor 9300 Series Reference Manual for Software Development and Optimization, March 2010
BZ_WMARK
• Title: Z Trans Outstanding• Category: BZ• Event Code: 0x24, Max. Inc/Cyc: 1, • Definition: Watermark of outstanding transactions to Z Box.• NOTE: Enabled by B_CSR_PERF_CTL0.bz_en.
IMT_ALLOC
• Title: IMT Allocations• Category: IMT• Event Code: 0x05, Max. Inc/Cyc: 1, • Definition: Number of IMT entries allocated.• NOTE: No rd/wr breakdown.
IMT_FULL
• Title: Cycles IMT Full• Category: IMT• Event Code: 0x29, Max. Inc/Cyc: 1, • Definition: Number of cycles the IMT is full.
IMT_NOT_EMPTY
• Title: Cycles IMT Not Empty• Category: IMT• Event Code: 0x07, Max. Inc/Cyc: 1, • Definition: Number of cycles the IMT is not empty.
IMT_OVFL
• Title: IMT Overflows• Category: IMT• Event Code: 0x04, Max. Inc/Cyc: 1, • Definition: Number of IMT counter overflows.• NOTE: Set B_CSR_PERF_CTL0.imt_en to enable the subcounter which, in turn,
enables this event. No rd/wr breakdown. To calculate the number of IMT events, mul-tiply the counter value by 2^6 and add B_CSR_IMT_PERF_CNT.accum_cnt[5:0].
IMT_POP_CFL
• Title: IMT Pop Conflicts• Category: IMT• Event Code: 0x6, Max. Inc/Cyc: 1, • Definition: Number of IMT pop conflicts.
Extension CTL2[43] Description
CYCLES_LT 0x0 less than to watermarkNOTE: watermark set in CTL2[42:37]
CYCLES_GE 0x1 greater than or equal watermarkNOTE: watermark set in CTL2[42:37]
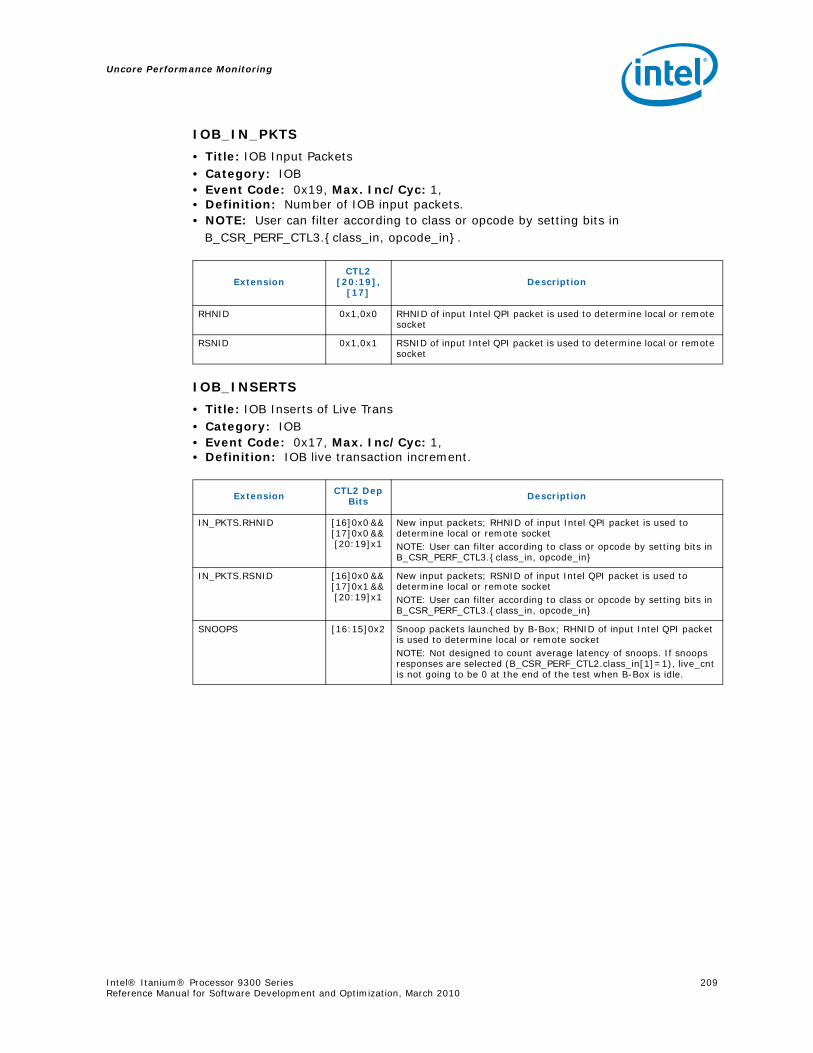
Uncore Performance Monitoring
Intel® Itanium® Processor 9300 Series 209Reference Manual for Software Development and Optimization, March 2010
IOB_IN_PKTS
• Title: IOB Input Packets• Category: IOB• Event Code: 0x19, Max. Inc/Cyc: 1, • Definition: Number of IOB input packets.• NOTE: User can filter according to class or opcode by setting bits in
B_CSR_PERF_CTL3.{class_in, opcode_in}.
IOB_INSERTS
• Title: IOB Inserts of Live Trans• Category: IOB• Event Code: 0x17, Max. Inc/Cyc: 1, • Definition: IOB live transaction increment.
ExtensionCTL2
[20:19], [17]
Description
RHNID 0x1,0x0 RHNID of input Intel QPI packet is used to determine local or remote socket
RSNID 0x1,0x1 RSNID of input Intel QPI packet is used to determine local or remote socket
Extension CTL2 Dep Bits Description
IN_PKTS.RHNID [16]0x0 && [17]0x0 && [20:19]x1
New input packets; RHNID of input Intel QPI packet is used to determine local or remote socketNOTE: User can filter according to class or opcode by setting bits in B_CSR_PERF_CTL3.{class_in, opcode_in}
IN_PKTS.RSNID [16]0x0 && [17]0x1 && [20:19]x1
New input packets; RSNID of input Intel QPI packet is used to determine local or remote socketNOTE: User can filter according to class or opcode by setting bits in B_CSR_PERF_CTL3.{class_in, opcode_in}
SNOOPS [16:15]0x2 Snoop packets launched by B-Box; RHNID of input Intel QPI packet is used to determine local or remote socketNOTE: Not designed to count average latency of snoops. If snoops responses are selected (B_CSR_PERF_CTL2.class_in[1]=1), live_cnt is not going to be 0 at the end of the test when B-Box is idle.
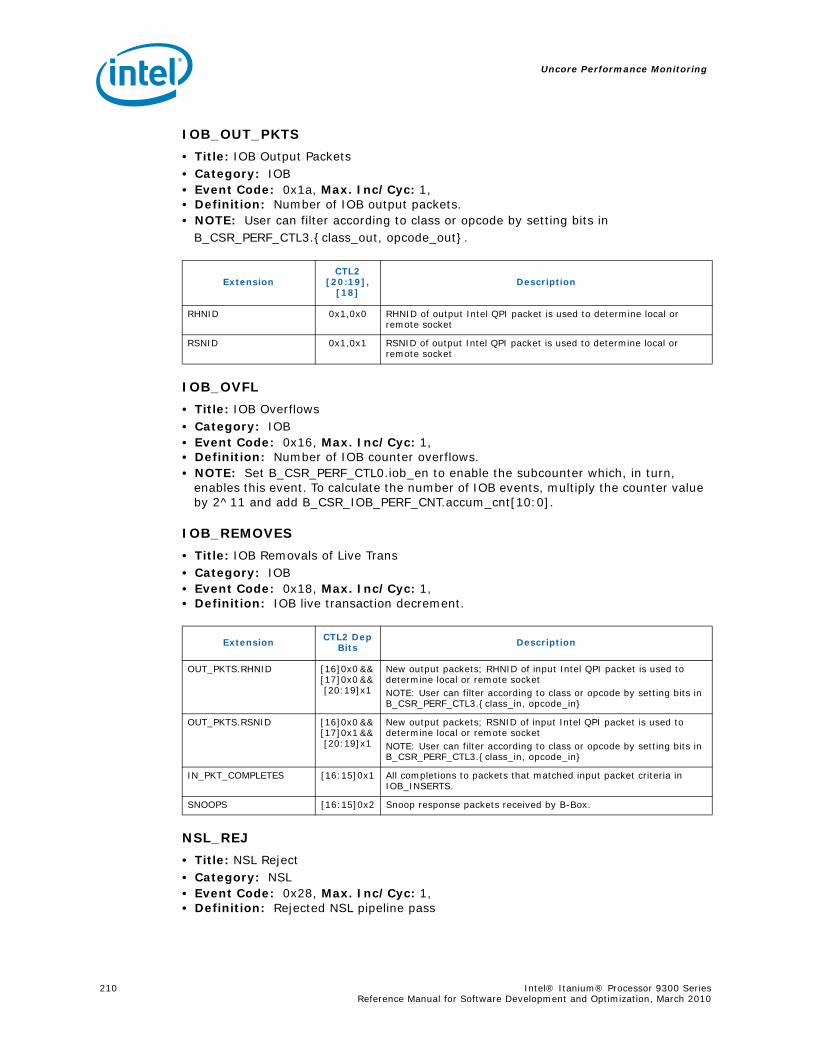
Uncore Performance Monitoring
210 Intel® Itanium® Processor 9300 Series Reference Manual for Software Development and Optimization, March 2010
IOB_OUT_PKTS
• Title: IOB Output Packets• Category: IOB• Event Code: 0x1a, Max. Inc/Cyc: 1, • Definition: Number of IOB output packets.• NOTE: User can filter according to class or opcode by setting bits in
B_CSR_PERF_CTL3.{class_out, opcode_out}.
IOB_OVFL
• Title: IOB Overflows• Category: IOB• Event Code: 0x16, Max. Inc/Cyc: 1, • Definition: Number of IOB counter overflows.• NOTE: Set B_CSR_PERF_CTL0.iob_en to enable the subcounter which, in turn,
enables this event. To calculate the number of IOB events, multiply the counter value by 2^11 and add B_CSR_IOB_PERF_CNT.accum_cnt[10:0].
IOB_REMOVES
• Title: IOB Removals of Live Trans• Category: IOB• Event Code: 0x18, Max. Inc/Cyc: 1, • Definition: IOB live transaction decrement.
NSL_REJ
• Title: NSL Reject• Category: NSL• Event Code: 0x28, Max. Inc/Cyc: 1, • Definition: Rejected NSL pipeline pass
ExtensionCTL2
[20:19], [18]
Description
RHNID 0x1,0x0 RHNID of output Intel QPI packet is used to determine local or remote socket
RSNID 0x1,0x1 RSNID of output Intel QPI packet is used to determine local or remote socket
Extension CTL2 Dep Bits Description
OUT_PKTS.RHNID [16]0x0 && [17]0x0 && [20:19]x1
New output packets; RHNID of input Intel QPI packet is used to determine local or remote socketNOTE: User can filter according to class or opcode by setting bits in B_CSR_PERF_CTL3.{class_in, opcode_in}
OUT_PKTS.RSNID [16]0x0 && [17]0x1 && [20:19]x1
New output packets; RSNID of input Intel QPI packet is used to determine local or remote socketNOTE: User can filter according to class or opcode by setting bits in B_CSR_PERF_CTL3.{class_in, opcode_in}
IN_PKT_COMPLETES [16:15]0x1 All completions to packets that matched input packet criteria in IOB_INSERTS.
SNOOPS [16:15]0x2 Snoop response packets received by B-Box.
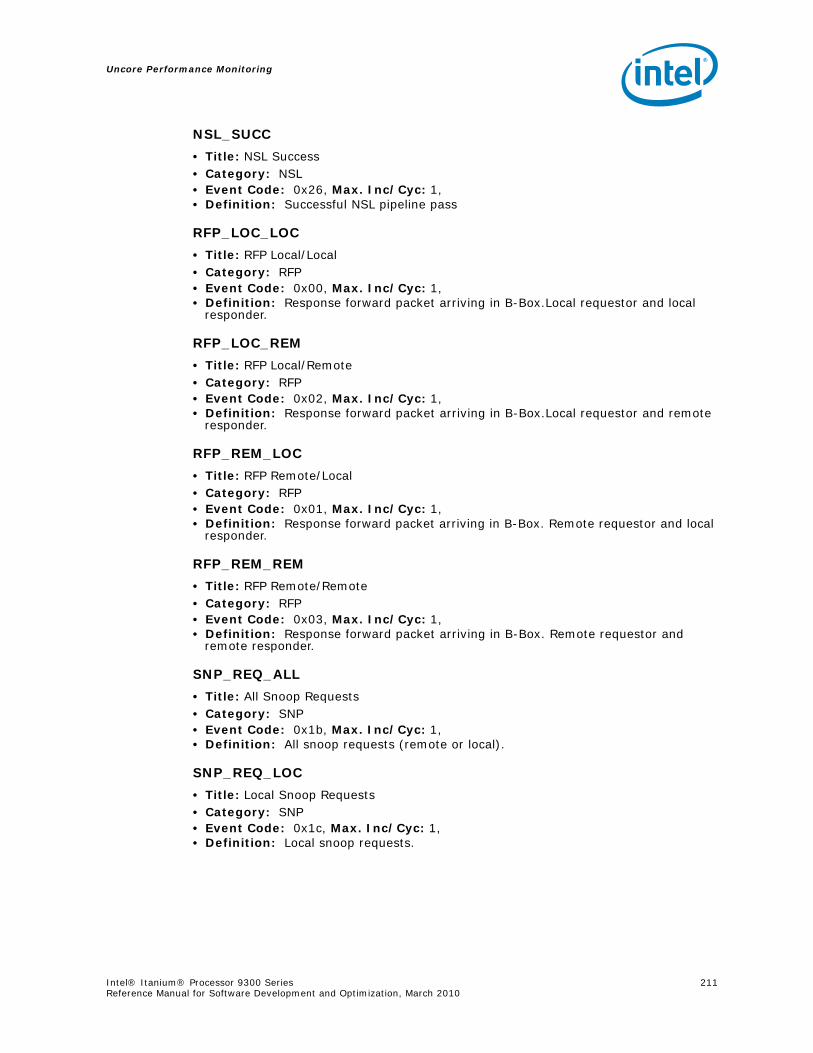
Uncore Performance Monitoring
Intel® Itanium® Processor 9300 Series 211Reference Manual for Software Development and Optimization, March 2010
NSL_SUCC
• Title: NSL Success• Category: NSL• Event Code: 0x26, Max. Inc/Cyc: 1, • Definition: Successful NSL pipeline pass
RFP_LOC_LOC
• Title: RFP Local/Local• Category: RFP• Event Code: 0x00, Max. Inc/Cyc: 1, • Definition: Response forward packet arriving in B-Box.Local requestor and local
responder.
RFP_LOC_REM
• Title: RFP Local/Remote• Category: RFP• Event Code: 0x02, Max. Inc/Cyc: 1, • Definition: Response forward packet arriving in B-Box.Local requestor and remote
responder.
RFP_REM_LOC
• Title: RFP Remote/Local• Category: RFP• Event Code: 0x01, Max. Inc/Cyc: 1, • Definition: Response forward packet arriving in B-Box. Remote requestor and local
responder.
RFP_REM_REM
• Title: RFP Remote/Remote• Category: RFP• Event Code: 0x03, Max. Inc/Cyc: 1, • Definition: Response forward packet arriving in B-Box. Remote requestor and
remote responder.
SNP_REQ_ALL
• Title: All Snoop Requests• Category: SNP• Event Code: 0x1b, Max. Inc/Cyc: 1, • Definition: All snoop requests (remote or local).
SNP_REQ_LOC
• Title: Local Snoop Requests• Category: SNP• Event Code: 0x1c, Max. Inc/Cyc: 1, • Definition: Local snoop requests.
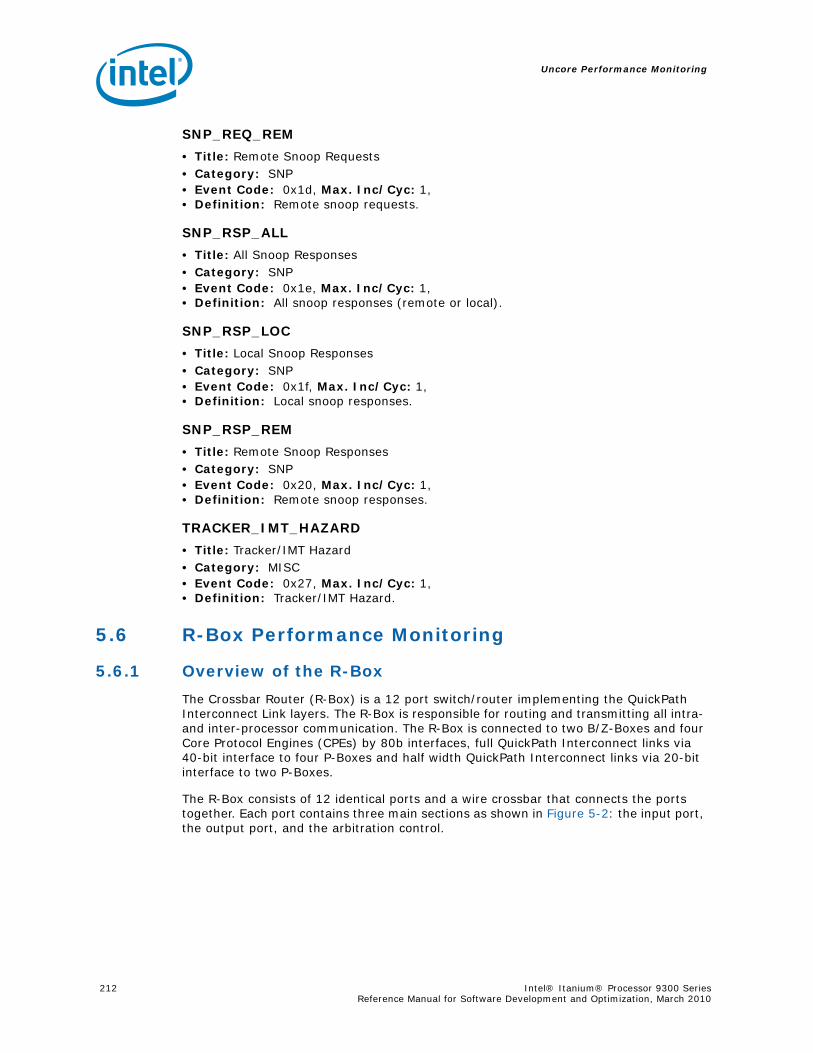
Uncore Performance Monitoring
212 Intel® Itanium® Processor 9300 Series Reference Manual for Software Development and Optimization, March 2010
SNP_REQ_REM
• Title: Remote Snoop Requests• Category: SNP• Event Code: 0x1d, Max. Inc/Cyc: 1, • Definition: Remote snoop requests.
SNP_RSP_ALL
• Title: All Snoop Responses• Category: SNP• Event Code: 0x1e, Max. Inc/Cyc: 1, • Definition: All snoop responses (remote or local).
SNP_RSP_LOC
• Title: Local Snoop Responses• Category: SNP• Event Code: 0x1f, Max. Inc/Cyc: 1, • Definition: Local snoop responses.
SNP_RSP_REM
• Title: Remote Snoop Responses• Category: SNP• Event Code: 0x20, Max. Inc/Cyc: 1, • Definition: Remote snoop responses.
TRACKER_IMT_HAZARD
• Title: Tracker/IMT Hazard• Category: MISC• Event Code: 0x27, Max. Inc/Cyc: 1, • Definition: Tracker/IMT Hazard.
5.6 R-Box Performance Monitoring
5.6.1 Overview of the R-Box
The Crossbar Router (R-Box) is a 12 port switch/router implementing the QuickPath Interconnect Link layers. The R-Box is responsible for routing and transmitting all intra- and inter-processor communication. The R-Box is connected to two B/Z-Boxes and four Core Protocol Engines (CPEs) by 80b interfaces, full QuickPath Interconnect links via 40-bit interface to four P-Boxes and half width QuickPath Interconnect links via 20-bit interface to two P-Boxes.
The R-Box consists of 12 identical ports and a wire crossbar that connects the ports together. Each port contains three main sections as shown in Figure 5-2: the input port, the output port, and the arbitration control.
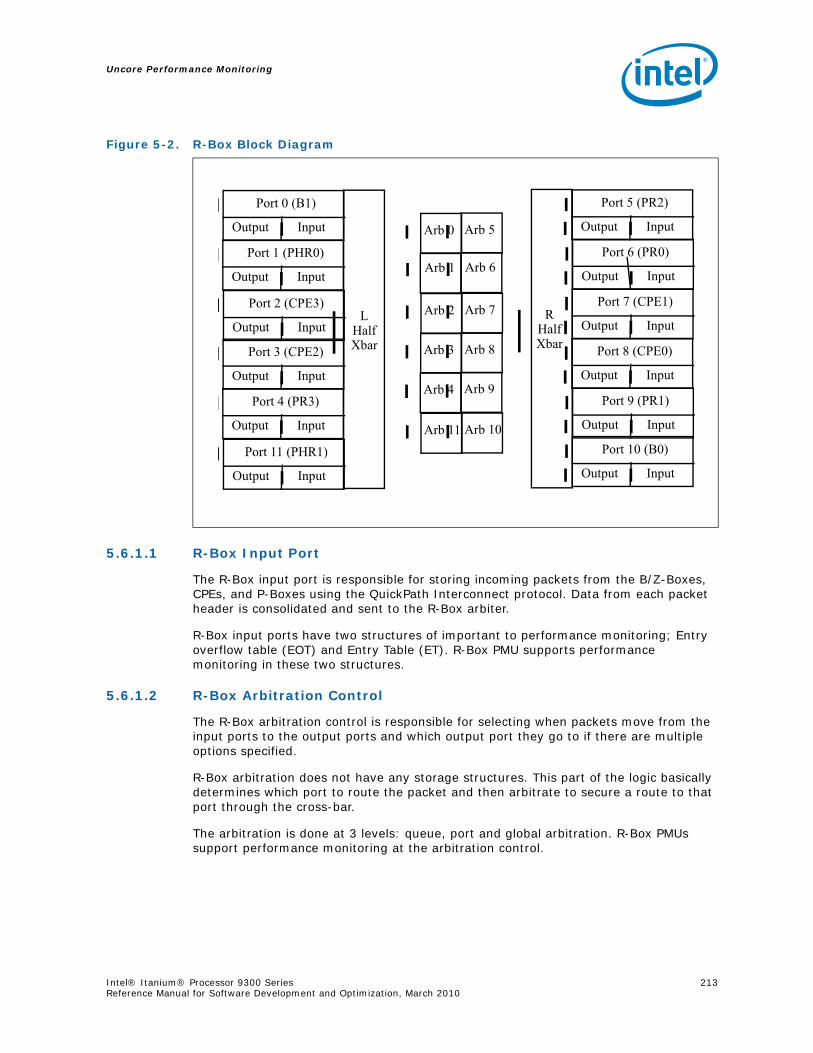
Uncore Performance Monitoring
Intel® Itanium® Processor 9300 Series 213Reference Manual for Software Development and Optimization, March 2010
5.6.1.1 R-Box Input Port
The R-Box input port is responsible for storing incoming packets from the B/Z-Boxes, CPEs, and P-Boxes using the QuickPath Interconnect protocol. Data from each packet header is consolidated and sent to the R-Box arbiter.
R-Box input ports have two structures of important to performance monitoring; Entry overflow table (EOT) and Entry Table (ET). R-Box PMU supports performance monitoring in these two structures.
5.6.1.2 R-Box Arbitration Control
The R-Box arbitration control is responsible for selecting when packets move from the input ports to the output ports and which output port they go to if there are multiple options specified.
R-Box arbitration does not have any storage structures. This part of the logic basically determines which port to route the packet and then arbitrate to secure a route to that port through the cross-bar.
The arbitration is done at 3 levels: queue, port and global arbitration. R-Box PMUs support performance monitoring at the arbitration control.
Figure 5-2. R-Box Block Diagram
Output Input
Port 0 (B1)
Output Input
Port 1 (PHR0)
Output Input
Port 2 (CPE3)
Output Input
Port 3 (CPE2)
Output Input
Port 4 (PR3)
Output Input
Port 11 (PHR1)
Output Input
Port 5 (PR2)
Output Input
Port 6 (PR0)
Output Input
Port 7 (CPE1)
Output Input
Port 8 (CPE0)
Output Input
Port 9 (PR1)
Output Input
Port 10 (B0)
L Half Xbar
R Half Xbar
Arb 0
Arb 1
Arb 2
Arb 3
Arb 4
Arb 11
Arb 5
Arb 6
Arb 7
Arb 8
Arb 9
Arb 10
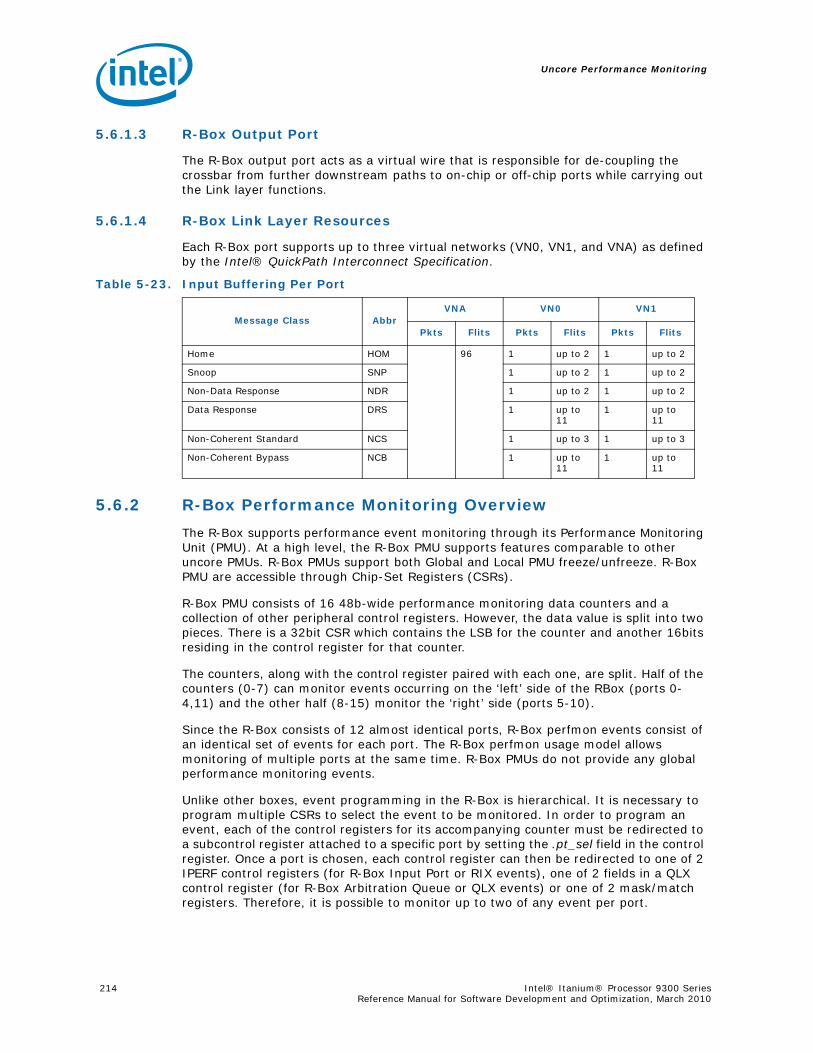
Uncore Performance Monitoring
214 Intel® Itanium® Processor 9300 Series Reference Manual for Software Development and Optimization, March 2010
5.6.1.3 R-Box Output Port
The R-Box output port acts as a virtual wire that is responsible for de-coupling the crossbar from further downstream paths to on-chip or off-chip ports while carrying out the Link layer functions.
5.6.1.4 R-Box Link Layer Resources
Each R-Box port supports up to three virtual networks (VN0, VN1, and VNA) as defined by the Intel® QuickPath Interconnect Specification.
5.6.2 R-Box Performance Monitoring Overview
The R-Box supports performance event monitoring through its Performance Monitoring Unit (PMU). At a high level, the R-Box PMU supports features comparable to other uncore PMUs. R-Box PMUs support both Global and Local PMU freeze/unfreeze. R-Box PMU are accessible through Chip-Set Registers (CSRs).
R-Box PMU consists of 16 48b-wide performance monitoring data counters and a collection of other peripheral control registers. However, the data value is split into two pieces. There is a 32bit CSR which contains the LSB for the counter and another 16bits residing in the control register for that counter.
The counters, along with the control register paired with each one, are split. Half of the counters (0-7) can monitor events occurring on the ‘left’ side of the RBox (ports 0-4,11) and the other half (8-15) monitor the ‘right’ side (ports 5-10).
Since the R-Box consists of 12 almost identical ports, R-Box perfmon events consist of an identical set of events for each port. The R-Box perfmon usage model allows monitoring of multiple ports at the same time. R-Box PMUs do not provide any global performance monitoring events.
Unlike other boxes, event programming in the R-Box is hierarchical. It is necessary to program multiple CSRs to select the event to be monitored. In order to program an event, each of the control registers for its accompanying counter must be redirected to a subcontrol register attached to a specific port by setting the .pt_sel field in the control register. Once a port is chosen, each control register can then be redirected to one of 2 IPERF control registers (for R-Box Input Port or RIX events), one of 2 fields in a QLX control register (for R-Box Arbitration Queue or QLX events) or one of 2 mask/match registers. Therefore, it is possible to monitor up to two of any event per port.
Table 5-23. Input Buffering Per Port
Message Class Abbr VNA VN0 VN1
Pkts Flits Pkts Flits Pkts Flits
Home HOM 96 1 up to 2 1 up to 2
Snoop SNP 1 up to 2 1 up to 2
Non-Data Response NDR 1 up to 2 1 up to 2
Data Response DRS 1 up to 11
1 up to 11
Non-Coherent Standard NCS 1 up to 3 1 up to 3
Non-Coherent Bypass NCB 1 up to 11
1 up to 11

Uncore Performance Monitoring
Intel® Itanium® Processor 9300 Series 215Reference Manual for Software Development and Optimization, March 2010
The R-Box also includes a pair of mask/match registers on each port that allow a user to match packets serviced (packet is transferred from input to output port) by the R-Box according to various standard packet fields such as message class, opcode, etc.
5.6.2.1 Choosing An Event To Monitor - Example
1) Pick an event to monitor (e.g. FLITS_SENT)
2) Pick a port to monitor on (e.g. CPE2)
3) Pick a generic counter (control+data) that can monitor an event on that port. (e.g R_CSR_PERF_CNT/CNT_CTRL4) and set the control to point to it (R_CSR_PERF_CNT_CTRL_4.pt_sel == 0x3).
4) Pick one of the two sub counters that allow a user to monitor the event (R_CSR_P03_IPERF1), program it to monitor the chosen event (R_CSR_P03_IPERF1[31] = 0x1) and set the generic control to point to it (R_CSR_PERF_CNT_CTRL4.ev_sel == 0x1).
5) Enable the monitor (e.g. R_CSR_PERF_CNT_CTRL4.en == 0x1)
5.6.2.2 R-Box PMU - Overflow, Freeze and Unfreeze
R-Box PMUs support the same overflow and freeze related mechanisms that are supported by the other uncore PMUs. Users can choose to freeze all the R-Box PMUs, or all of the uncore PMUs (refer to Section 5.4.1, “Global Freeze/Unfreeze”), when an R-Box counter overflows by setting R_CSR_PERF_CNT_CTRL_x.frz_en to 1.
R-box PMU can be frozen due to one of three reasons
• Globally: D-box sends a freeze signal
• Manually: SW forces a freeze either through the global (Section 5.4.1, “Global Freeze/Unfreeze”) or local (a write to R_CSR_PERF_GBLCFG.frz) mechanism.
• Locally: An R-box counter overflowed and that counter’s .frz bit was set to 1.
Each overflow bit can be found in its control register (R_CSR_PERF_CNT_CTRL_x.ov) where it can be inspected to determine if a counter overflow was repsonsible for the freeze.
Once a freeze has occurred, in order to see a new freeze, the overflow field responsible for the freeze, must be cleared by setting it to 0. Assuming all the counters have been locally enabled (.en bits in the relevant counter control registers) and the overflow bit(s) has been cleared, the R-Box is prepared for a new sample interval. Once the global controls have been re-enabled (Section 5.4.4, “Enabling a new sample interval from frozen counters.”), counting will resume.
To unfreeze the R-Box PMU, which is necessary to continue counting, either:
• Set DBX_CSR_MISC.unfrz_all to 1 or
• Set R_CSR_PERF_GBLCFG.unfrz to 1.
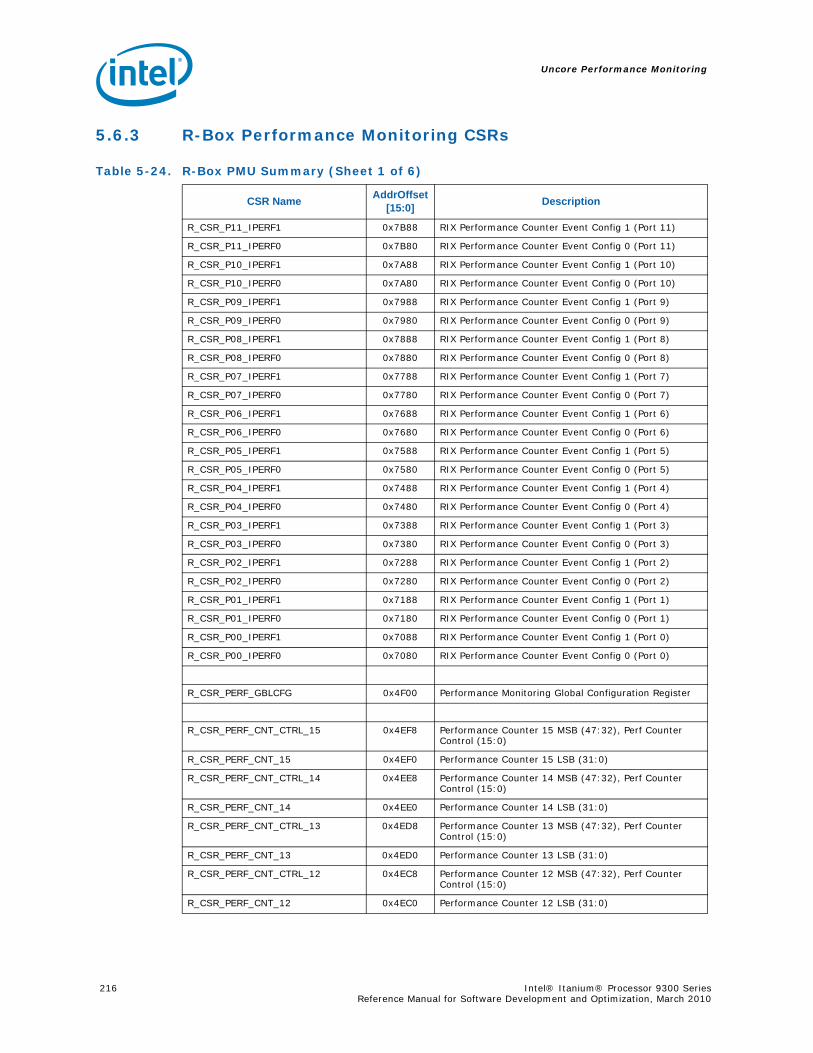
Uncore Performance Monitoring
216 Intel® Itanium® Processor 9300 Series Reference Manual for Software Development and Optimization, March 2010
5.6.3 R-Box Performance Monitoring CSRs
Table 5-24. R-Box PMU Summary (Sheet 1 of 6)
CSR Name AddrOffset [15:0] Description
R_CSR_P11_IPERF1 0x7B88 RIX Performance Counter Event Config 1 (Port 11)
R_CSR_P11_IPERF0 0x7B80 RIX Performance Counter Event Config 0 (Port 11)
R_CSR_P10_IPERF1 0x7A88 RIX Performance Counter Event Config 1 (Port 10)
R_CSR_P10_IPERF0 0x7A80 RIX Performance Counter Event Config 0 (Port 10)
R_CSR_P09_IPERF1 0x7988 RIX Performance Counter Event Config 1 (Port 9)
R_CSR_P09_IPERF0 0x7980 RIX Performance Counter Event Config 0 (Port 9)
R_CSR_P08_IPERF1 0x7888 RIX Performance Counter Event Config 1 (Port 8)
R_CSR_P08_IPERF0 0x7880 RIX Performance Counter Event Config 0 (Port 8)
R_CSR_P07_IPERF1 0x7788 RIX Performance Counter Event Config 1 (Port 7)
R_CSR_P07_IPERF0 0x7780 RIX Performance Counter Event Config 0 (Port 7)
R_CSR_P06_IPERF1 0x7688 RIX Performance Counter Event Config 1 (Port 6)
R_CSR_P06_IPERF0 0x7680 RIX Performance Counter Event Config 0 (Port 6)
R_CSR_P05_IPERF1 0x7588 RIX Performance Counter Event Config 1 (Port 5)
R_CSR_P05_IPERF0 0x7580 RIX Performance Counter Event Config 0 (Port 5)
R_CSR_P04_IPERF1 0x7488 RIX Performance Counter Event Config 1 (Port 4)
R_CSR_P04_IPERF0 0x7480 RIX Performance Counter Event Config 0 (Port 4)
R_CSR_P03_IPERF1 0x7388 RIX Performance Counter Event Config 1 (Port 3)
R_CSR_P03_IPERF0 0x7380 RIX Performance Counter Event Config 0 (Port 3)
R_CSR_P02_IPERF1 0x7288 RIX Performance Counter Event Config 1 (Port 2)
R_CSR_P02_IPERF0 0x7280 RIX Performance Counter Event Config 0 (Port 2)
R_CSR_P01_IPERF1 0x7188 RIX Performance Counter Event Config 1 (Port 1)
R_CSR_P01_IPERF0 0x7180 RIX Performance Counter Event Config 0 (Port 1)
R_CSR_P00_IPERF1 0x7088 RIX Performance Counter Event Config 1 (Port 0)
R_CSR_P00_IPERF0 0x7080 RIX Performance Counter Event Config 0 (Port 0)
R_CSR_PERF_GBLCFG 0x4F00 Performance Monitoring Global Configuration Register
R_CSR_PERF_CNT_CTRL_15 0x4EF8 Performance Counter 15 MSB (47:32), Perf Counter Control (15:0)
R_CSR_PERF_CNT_15 0x4EF0 Performance Counter 15 LSB (31:0)
R_CSR_PERF_CNT_CTRL_14 0x4EE8 Performance Counter 14 MSB (47:32), Perf Counter Control (15:0)
R_CSR_PERF_CNT_14 0x4EE0 Performance Counter 14 LSB (31:0)
R_CSR_PERF_CNT_CTRL_13 0x4ED8 Performance Counter 13 MSB (47:32), Perf Counter Control (15:0)
R_CSR_PERF_CNT_13 0x4ED0 Performance Counter 13 LSB (31:0)
R_CSR_PERF_CNT_CTRL_12 0x4EC8 Performance Counter 12 MSB (47:32), Perf Counter Control (15:0)
R_CSR_PERF_CNT_12 0x4EC0 Performance Counter 12 LSB (31:0)
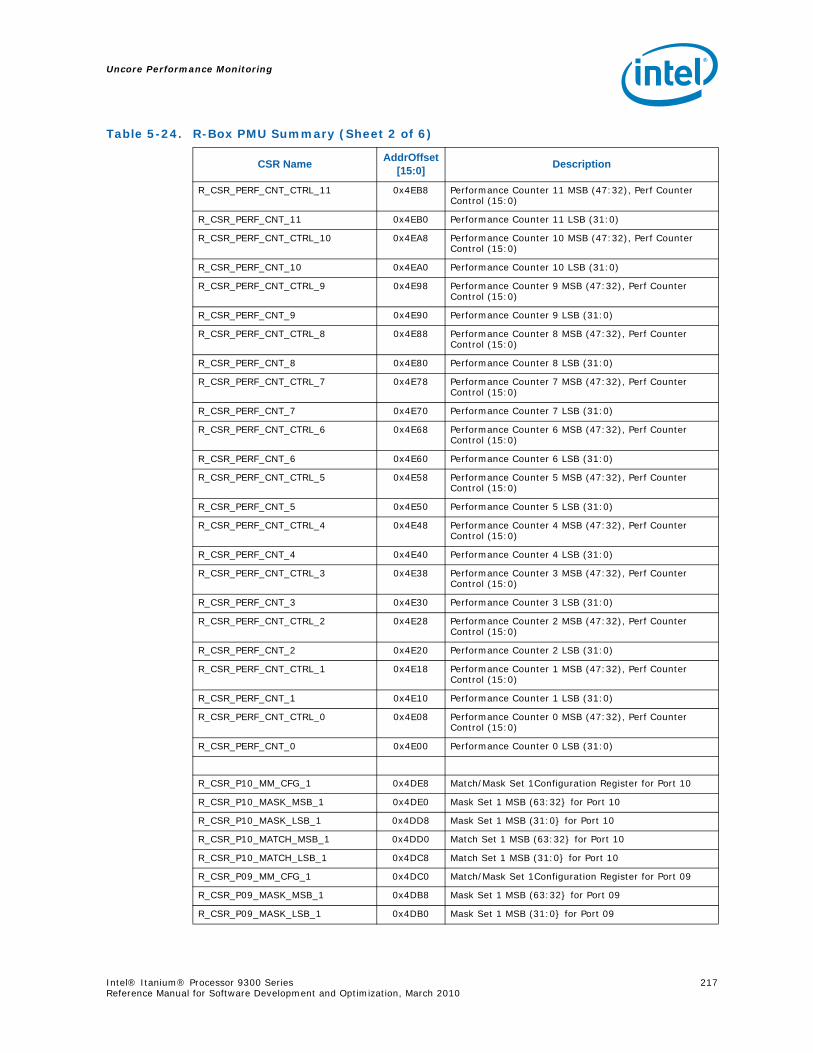
Uncore Performance Monitoring
Intel® Itanium® Processor 9300 Series 217Reference Manual for Software Development and Optimization, March 2010
R_CSR_PERF_CNT_CTRL_11 0x4EB8 Performance Counter 11 MSB (47:32), Perf Counter Control (15:0)
R_CSR_PERF_CNT_11 0x4EB0 Performance Counter 11 LSB (31:0)
R_CSR_PERF_CNT_CTRL_10 0x4EA8 Performance Counter 10 MSB (47:32), Perf Counter Control (15:0)
R_CSR_PERF_CNT_10 0x4EA0 Performance Counter 10 LSB (31:0)
R_CSR_PERF_CNT_CTRL_9 0x4E98 Performance Counter 9 MSB (47:32), Perf Counter Control (15:0)
R_CSR_PERF_CNT_9 0x4E90 Performance Counter 9 LSB (31:0)
R_CSR_PERF_CNT_CTRL_8 0x4E88 Performance Counter 8 MSB (47:32), Perf Counter Control (15:0)
R_CSR_PERF_CNT_8 0x4E80 Performance Counter 8 LSB (31:0)
R_CSR_PERF_CNT_CTRL_7 0x4E78 Performance Counter 7 MSB (47:32), Perf Counter Control (15:0)
R_CSR_PERF_CNT_7 0x4E70 Performance Counter 7 LSB (31:0)
R_CSR_PERF_CNT_CTRL_6 0x4E68 Performance Counter 6 MSB (47:32), Perf Counter Control (15:0)
R_CSR_PERF_CNT_6 0x4E60 Performance Counter 6 LSB (31:0)
R_CSR_PERF_CNT_CTRL_5 0x4E58 Performance Counter 5 MSB (47:32), Perf Counter Control (15:0)
R_CSR_PERF_CNT_5 0x4E50 Performance Counter 5 LSB (31:0)
R_CSR_PERF_CNT_CTRL_4 0x4E48 Performance Counter 4 MSB (47:32), Perf Counter Control (15:0)
R_CSR_PERF_CNT_4 0x4E40 Performance Counter 4 LSB (31:0)
R_CSR_PERF_CNT_CTRL_3 0x4E38 Performance Counter 3 MSB (47:32), Perf Counter Control (15:0)
R_CSR_PERF_CNT_3 0x4E30 Performance Counter 3 LSB (31:0)
R_CSR_PERF_CNT_CTRL_2 0x4E28 Performance Counter 2 MSB (47:32), Perf Counter Control (15:0)
R_CSR_PERF_CNT_2 0x4E20 Performance Counter 2 LSB (31:0)
R_CSR_PERF_CNT_CTRL_1 0x4E18 Performance Counter 1 MSB (47:32), Perf Counter Control (15:0)
R_CSR_PERF_CNT_1 0x4E10 Performance Counter 1 LSB (31:0)
R_CSR_PERF_CNT_CTRL_0 0x4E08 Performance Counter 0 MSB (47:32), Perf Counter Control (15:0)
R_CSR_PERF_CNT_0 0x4E00 Performance Counter 0 LSB (31:0)
R_CSR_P10_MM_CFG_1 0x4DE8 Match/Mask Set 1Configuration Register for Port 10
R_CSR_P10_MASK_MSB_1 0x4DE0 Mask Set 1 MSB (63:32} for Port 10
R_CSR_P10_MASK_LSB_1 0x4DD8 Mask Set 1 MSB (31:0} for Port 10
R_CSR_P10_MATCH_MSB_1 0x4DD0 Match Set 1 MSB (63:32} for Port 10
R_CSR_P10_MATCH_LSB_1 0x4DC8 Match Set 1 MSB (31:0} for Port 10
R_CSR_P09_MM_CFG_1 0x4DC0 Match/Mask Set 1Configuration Register for Port 09
R_CSR_P09_MASK_MSB_1 0x4DB8 Mask Set 1 MSB (63:32} for Port 09
R_CSR_P09_MASK_LSB_1 0x4DB0 Mask Set 1 MSB (31:0} for Port 09
Table 5-24. R-Box PMU Summary (Sheet 2 of 6)
CSR Name AddrOffset [15:0] Description
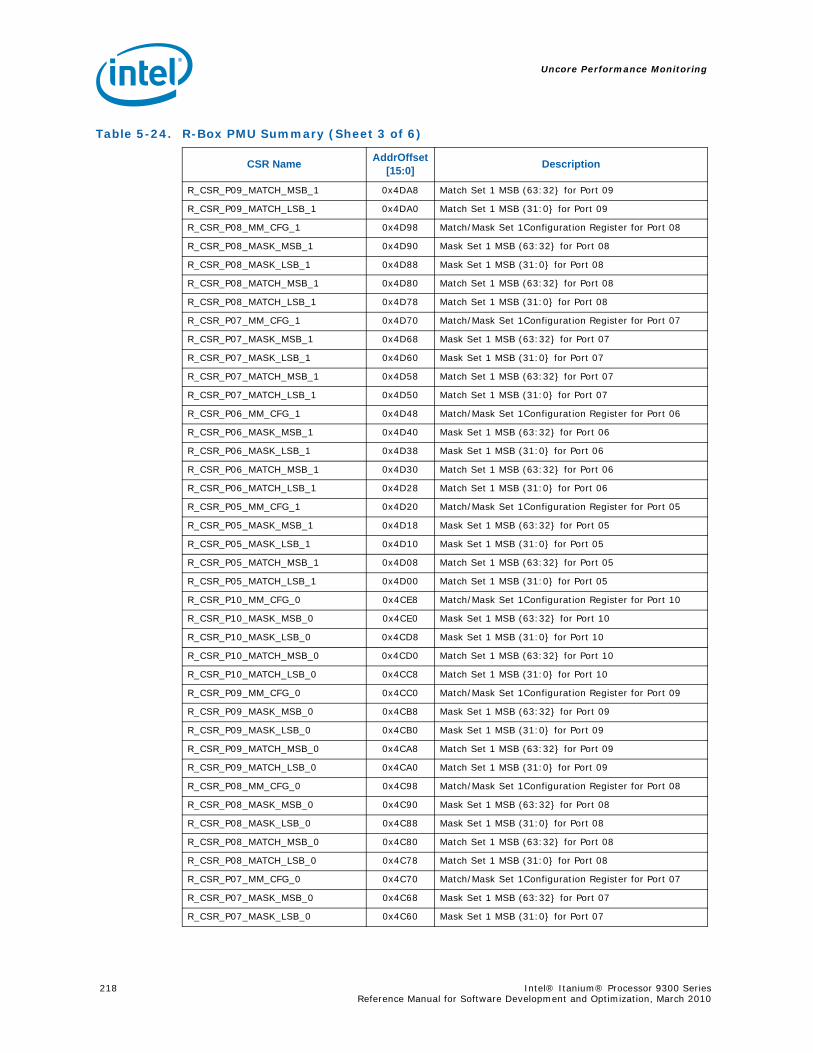
Uncore Performance Monitoring
218 Intel® Itanium® Processor 9300 Series Reference Manual for Software Development and Optimization, March 2010
R_CSR_P09_MATCH_MSB_1 0x4DA8 Match Set 1 MSB (63:32} for Port 09
R_CSR_P09_MATCH_LSB_1 0x4DA0 Match Set 1 MSB (31:0} for Port 09
R_CSR_P08_MM_CFG_1 0x4D98 Match/Mask Set 1Configuration Register for Port 08
R_CSR_P08_MASK_MSB_1 0x4D90 Mask Set 1 MSB (63:32} for Port 08
R_CSR_P08_MASK_LSB_1 0x4D88 Mask Set 1 MSB (31:0} for Port 08
R_CSR_P08_MATCH_MSB_1 0x4D80 Match Set 1 MSB (63:32} for Port 08
R_CSR_P08_MATCH_LSB_1 0x4D78 Match Set 1 MSB (31:0} for Port 08
R_CSR_P07_MM_CFG_1 0x4D70 Match/Mask Set 1Configuration Register for Port 07
R_CSR_P07_MASK_MSB_1 0x4D68 Mask Set 1 MSB (63:32} for Port 07
R_CSR_P07_MASK_LSB_1 0x4D60 Mask Set 1 MSB (31:0} for Port 07
R_CSR_P07_MATCH_MSB_1 0x4D58 Match Set 1 MSB (63:32} for Port 07
R_CSR_P07_MATCH_LSB_1 0x4D50 Match Set 1 MSB (31:0} for Port 07
R_CSR_P06_MM_CFG_1 0x4D48 Match/Mask Set 1Configuration Register for Port 06
R_CSR_P06_MASK_MSB_1 0x4D40 Mask Set 1 MSB (63:32} for Port 06
R_CSR_P06_MASK_LSB_1 0x4D38 Mask Set 1 MSB (31:0} for Port 06
R_CSR_P06_MATCH_MSB_1 0x4D30 Match Set 1 MSB (63:32} for Port 06
R_CSR_P06_MATCH_LSB_1 0x4D28 Match Set 1 MSB (31:0} for Port 06
R_CSR_P05_MM_CFG_1 0x4D20 Match/Mask Set 1Configuration Register for Port 05
R_CSR_P05_MASK_MSB_1 0x4D18 Mask Set 1 MSB (63:32} for Port 05
R_CSR_P05_MASK_LSB_1 0x4D10 Mask Set 1 MSB (31:0} for Port 05
R_CSR_P05_MATCH_MSB_1 0x4D08 Match Set 1 MSB (63:32} for Port 05
R_CSR_P05_MATCH_LSB_1 0x4D00 Match Set 1 MSB (31:0} for Port 05
R_CSR_P10_MM_CFG_0 0x4CE8 Match/Mask Set 1Configuration Register for Port 10
R_CSR_P10_MASK_MSB_0 0x4CE0 Mask Set 1 MSB (63:32} for Port 10
R_CSR_P10_MASK_LSB_0 0x4CD8 Mask Set 1 MSB (31:0} for Port 10
R_CSR_P10_MATCH_MSB_0 0x4CD0 Match Set 1 MSB (63:32} for Port 10
R_CSR_P10_MATCH_LSB_0 0x4CC8 Match Set 1 MSB (31:0} for Port 10
R_CSR_P09_MM_CFG_0 0x4CC0 Match/Mask Set 1Configuration Register for Port 09
R_CSR_P09_MASK_MSB_0 0x4CB8 Mask Set 1 MSB (63:32} for Port 09
R_CSR_P09_MASK_LSB_0 0x4CB0 Mask Set 1 MSB (31:0} for Port 09
R_CSR_P09_MATCH_MSB_0 0x4CA8 Match Set 1 MSB (63:32} for Port 09
R_CSR_P09_MATCH_LSB_0 0x4CA0 Match Set 1 MSB (31:0} for Port 09
R_CSR_P08_MM_CFG_0 0x4C98 Match/Mask Set 1Configuration Register for Port 08
R_CSR_P08_MASK_MSB_0 0x4C90 Mask Set 1 MSB (63:32} for Port 08
R_CSR_P08_MASK_LSB_0 0x4C88 Mask Set 1 MSB (31:0} for Port 08
R_CSR_P08_MATCH_MSB_0 0x4C80 Match Set 1 MSB (63:32} for Port 08
R_CSR_P08_MATCH_LSB_0 0x4C78 Match Set 1 MSB (31:0} for Port 08
R_CSR_P07_MM_CFG_0 0x4C70 Match/Mask Set 1Configuration Register for Port 07
R_CSR_P07_MASK_MSB_0 0x4C68 Mask Set 1 MSB (63:32} for Port 07
R_CSR_P07_MASK_LSB_0 0x4C60 Mask Set 1 MSB (31:0} for Port 07
Table 5-24. R-Box PMU Summary (Sheet 3 of 6)
CSR Name AddrOffset [15:0] Description
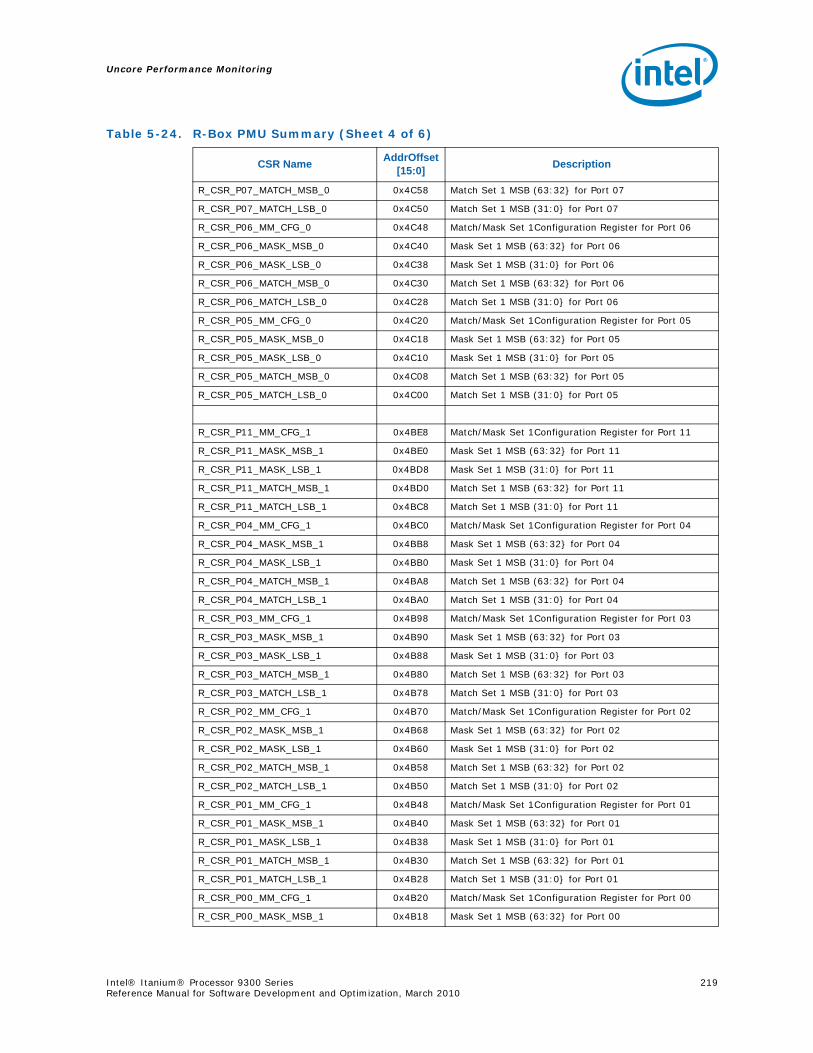
Uncore Performance Monitoring
Intel® Itanium® Processor 9300 Series 219Reference Manual for Software Development and Optimization, March 2010
R_CSR_P07_MATCH_MSB_0 0x4C58 Match Set 1 MSB (63:32} for Port 07
R_CSR_P07_MATCH_LSB_0 0x4C50 Match Set 1 MSB (31:0} for Port 07
R_CSR_P06_MM_CFG_0 0x4C48 Match/Mask Set 1Configuration Register for Port 06
R_CSR_P06_MASK_MSB_0 0x4C40 Mask Set 1 MSB (63:32} for Port 06
R_CSR_P06_MASK_LSB_0 0x4C38 Mask Set 1 MSB (31:0} for Port 06
R_CSR_P06_MATCH_MSB_0 0x4C30 Match Set 1 MSB (63:32} for Port 06
R_CSR_P06_MATCH_LSB_0 0x4C28 Match Set 1 MSB (31:0} for Port 06
R_CSR_P05_MM_CFG_0 0x4C20 Match/Mask Set 1Configuration Register for Port 05
R_CSR_P05_MASK_MSB_0 0x4C18 Mask Set 1 MSB (63:32} for Port 05
R_CSR_P05_MASK_LSB_0 0x4C10 Mask Set 1 MSB (31:0} for Port 05
R_CSR_P05_MATCH_MSB_0 0x4C08 Match Set 1 MSB (63:32} for Port 05
R_CSR_P05_MATCH_LSB_0 0x4C00 Match Set 1 MSB (31:0} for Port 05
R_CSR_P11_MM_CFG_1 0x4BE8 Match/Mask Set 1Configuration Register for Port 11
R_CSR_P11_MASK_MSB_1 0x4BE0 Mask Set 1 MSB (63:32} for Port 11
R_CSR_P11_MASK_LSB_1 0x4BD8 Mask Set 1 MSB (31:0} for Port 11
R_CSR_P11_MATCH_MSB_1 0x4BD0 Match Set 1 MSB (63:32} for Port 11
R_CSR_P11_MATCH_LSB_1 0x4BC8 Match Set 1 MSB (31:0} for Port 11
R_CSR_P04_MM_CFG_1 0x4BC0 Match/Mask Set 1Configuration Register for Port 04
R_CSR_P04_MASK_MSB_1 0x4BB8 Mask Set 1 MSB (63:32} for Port 04
R_CSR_P04_MASK_LSB_1 0x4BB0 Mask Set 1 MSB (31:0} for Port 04
R_CSR_P04_MATCH_MSB_1 0x4BA8 Match Set 1 MSB (63:32} for Port 04
R_CSR_P04_MATCH_LSB_1 0x4BA0 Match Set 1 MSB (31:0} for Port 04
R_CSR_P03_MM_CFG_1 0x4B98 Match/Mask Set 1Configuration Register for Port 03
R_CSR_P03_MASK_MSB_1 0x4B90 Mask Set 1 MSB (63:32} for Port 03
R_CSR_P03_MASK_LSB_1 0x4B88 Mask Set 1 MSB (31:0} for Port 03
R_CSR_P03_MATCH_MSB_1 0x4B80 Match Set 1 MSB (63:32} for Port 03
R_CSR_P03_MATCH_LSB_1 0x4B78 Match Set 1 MSB (31:0} for Port 03
R_CSR_P02_MM_CFG_1 0x4B70 Match/Mask Set 1Configuration Register for Port 02
R_CSR_P02_MASK_MSB_1 0x4B68 Mask Set 1 MSB (63:32} for Port 02
R_CSR_P02_MASK_LSB_1 0x4B60 Mask Set 1 MSB (31:0} for Port 02
R_CSR_P02_MATCH_MSB_1 0x4B58 Match Set 1 MSB (63:32} for Port 02
R_CSR_P02_MATCH_LSB_1 0x4B50 Match Set 1 MSB (31:0} for Port 02
R_CSR_P01_MM_CFG_1 0x4B48 Match/Mask Set 1Configuration Register for Port 01
R_CSR_P01_MASK_MSB_1 0x4B40 Mask Set 1 MSB (63:32} for Port 01
R_CSR_P01_MASK_LSB_1 0x4B38 Mask Set 1 MSB (31:0} for Port 01
R_CSR_P01_MATCH_MSB_1 0x4B30 Match Set 1 MSB (63:32} for Port 01
R_CSR_P01_MATCH_LSB_1 0x4B28 Match Set 1 MSB (31:0} for Port 01
R_CSR_P00_MM_CFG_1 0x4B20 Match/Mask Set 1Configuration Register for Port 00
R_CSR_P00_MASK_MSB_1 0x4B18 Mask Set 1 MSB (63:32} for Port 00
Table 5-24. R-Box PMU Summary (Sheet 4 of 6)
CSR Name AddrOffset [15:0] Description
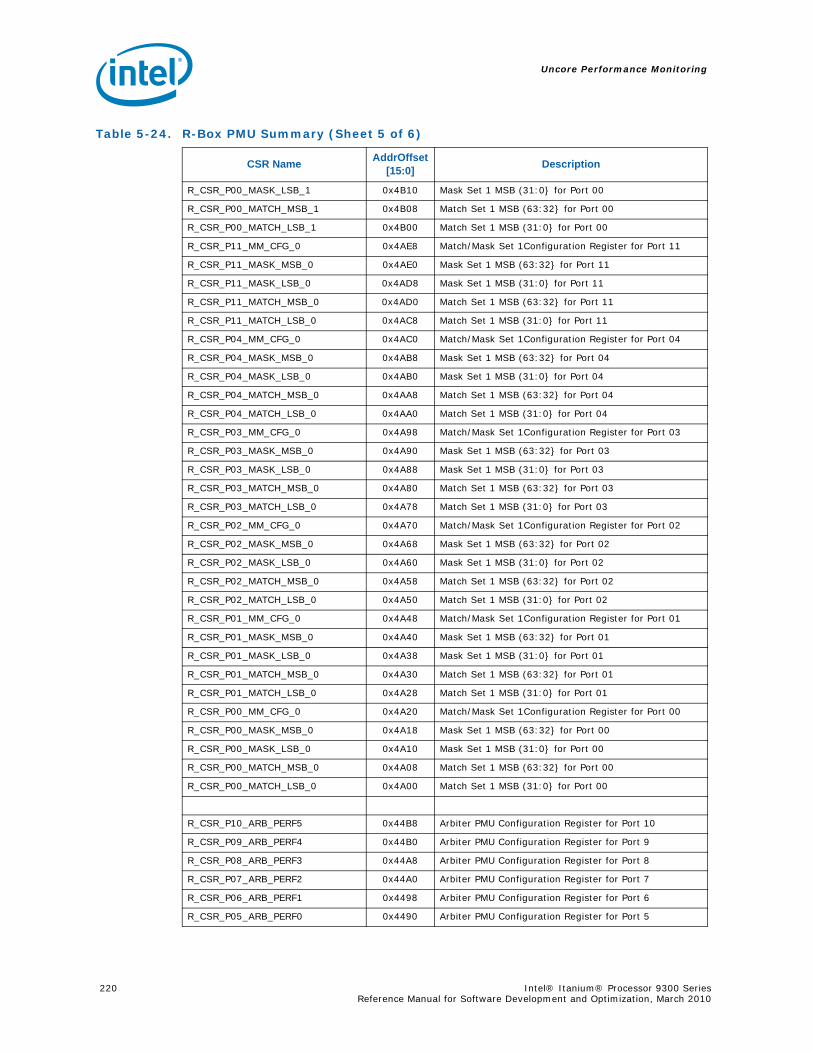
Uncore Performance Monitoring
220 Intel® Itanium® Processor 9300 Series Reference Manual for Software Development and Optimization, March 2010
R_CSR_P00_MASK_LSB_1 0x4B10 Mask Set 1 MSB (31:0} for Port 00
R_CSR_P00_MATCH_MSB_1 0x4B08 Match Set 1 MSB (63:32} for Port 00
R_CSR_P00_MATCH_LSB_1 0x4B00 Match Set 1 MSB (31:0} for Port 00
R_CSR_P11_MM_CFG_0 0x4AE8 Match/Mask Set 1Configuration Register for Port 11
R_CSR_P11_MASK_MSB_0 0x4AE0 Mask Set 1 MSB (63:32} for Port 11
R_CSR_P11_MASK_LSB_0 0x4AD8 Mask Set 1 MSB (31:0} for Port 11
R_CSR_P11_MATCH_MSB_0 0x4AD0 Match Set 1 MSB (63:32} for Port 11
R_CSR_P11_MATCH_LSB_0 0x4AC8 Match Set 1 MSB (31:0} for Port 11
R_CSR_P04_MM_CFG_0 0x4AC0 Match/Mask Set 1Configuration Register for Port 04
R_CSR_P04_MASK_MSB_0 0x4AB8 Mask Set 1 MSB (63:32} for Port 04
R_CSR_P04_MASK_LSB_0 0x4AB0 Mask Set 1 MSB (31:0} for Port 04
R_CSR_P04_MATCH_MSB_0 0x4AA8 Match Set 1 MSB (63:32} for Port 04
R_CSR_P04_MATCH_LSB_0 0x4AA0 Match Set 1 MSB (31:0} for Port 04
R_CSR_P03_MM_CFG_0 0x4A98 Match/Mask Set 1Configuration Register for Port 03
R_CSR_P03_MASK_MSB_0 0x4A90 Mask Set 1 MSB (63:32} for Port 03
R_CSR_P03_MASK_LSB_0 0x4A88 Mask Set 1 MSB (31:0} for Port 03
R_CSR_P03_MATCH_MSB_0 0x4A80 Match Set 1 MSB (63:32} for Port 03
R_CSR_P03_MATCH_LSB_0 0x4A78 Match Set 1 MSB (31:0} for Port 03
R_CSR_P02_MM_CFG_0 0x4A70 Match/Mask Set 1Configuration Register for Port 02
R_CSR_P02_MASK_MSB_0 0x4A68 Mask Set 1 MSB (63:32} for Port 02
R_CSR_P02_MASK_LSB_0 0x4A60 Mask Set 1 MSB (31:0} for Port 02
R_CSR_P02_MATCH_MSB_0 0x4A58 Match Set 1 MSB (63:32} for Port 02
R_CSR_P02_MATCH_LSB_0 0x4A50 Match Set 1 MSB (31:0} for Port 02
R_CSR_P01_MM_CFG_0 0x4A48 Match/Mask Set 1Configuration Register for Port 01
R_CSR_P01_MASK_MSB_0 0x4A40 Mask Set 1 MSB (63:32} for Port 01
R_CSR_P01_MASK_LSB_0 0x4A38 Mask Set 1 MSB (31:0} for Port 01
R_CSR_P01_MATCH_MSB_0 0x4A30 Match Set 1 MSB (63:32} for Port 01
R_CSR_P01_MATCH_LSB_0 0x4A28 Match Set 1 MSB (31:0} for Port 01
R_CSR_P00_MM_CFG_0 0x4A20 Match/Mask Set 1Configuration Register for Port 00
R_CSR_P00_MASK_MSB_0 0x4A18 Mask Set 1 MSB (63:32} for Port 00
R_CSR_P00_MASK_LSB_0 0x4A10 Mask Set 1 MSB (31:0} for Port 00
R_CSR_P00_MATCH_MSB_0 0x4A08 Match Set 1 MSB (63:32} for Port 00
R_CSR_P00_MATCH_LSB_0 0x4A00 Match Set 1 MSB (31:0} for Port 00
R_CSR_P10_ARB_PERF5 0x44B8 Arbiter PMU Configuration Register for Port 10
R_CSR_P09_ARB_PERF4 0x44B0 Arbiter PMU Configuration Register for Port 9
R_CSR_P08_ARB_PERF3 0x44A8 Arbiter PMU Configuration Register for Port 8
R_CSR_P07_ARB_PERF2 0x44A0 Arbiter PMU Configuration Register for Port 7
R_CSR_P06_ARB_PERF1 0x4498 Arbiter PMU Configuration Register for Port 6
R_CSR_P05_ARB_PERF0 0x4490 Arbiter PMU Configuration Register for Port 5
Table 5-24. R-Box PMU Summary (Sheet 5 of 6)
CSR Name AddrOffset [15:0] Description
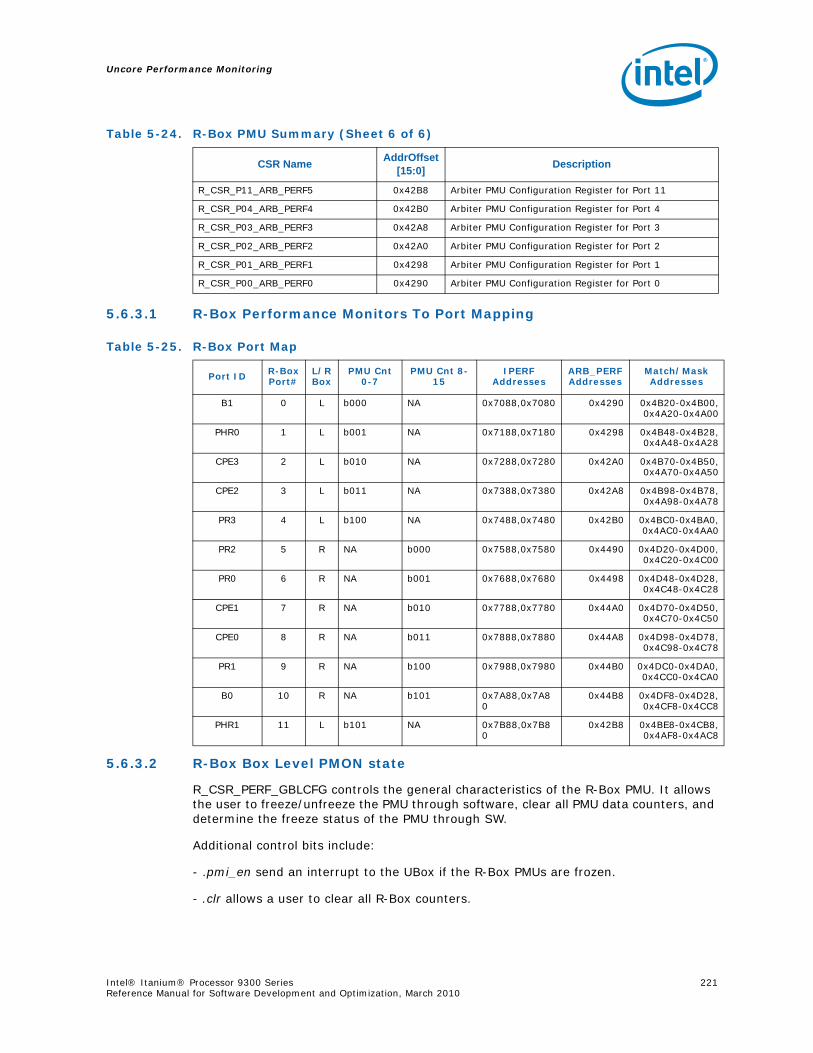
Uncore Performance Monitoring
Intel® Itanium® Processor 9300 Series 221Reference Manual for Software Development and Optimization, March 2010
5.6.3.1 R-Box Performance Monitors To Port Mapping
5.6.3.2 R-Box Box Level PMON state
R_CSR_PERF_GBLCFG controls the general characteristics of the R-Box PMU. It allows the user to freeze/unfreeze the PMU through software, clear all PMU data counters, and determine the freeze status of the PMU through SW.
Additional control bits include:
- .pmi_en send an interrupt to the UBox if the R-Box PMUs are frozen.
- .clr allows a user to clear all R-Box counters.
R_CSR_P11_ARB_PERF5 0x42B8 Arbiter PMU Configuration Register for Port 11
R_CSR_P04_ARB_PERF4 0x42B0 Arbiter PMU Configuration Register for Port 4
R_CSR_P03_ARB_PERF3 0x42A8 Arbiter PMU Configuration Register for Port 3
R_CSR_P02_ARB_PERF2 0x42A0 Arbiter PMU Configuration Register for Port 2
R_CSR_P01_ARB_PERF1 0x4298 Arbiter PMU Configuration Register for Port 1
R_CSR_P00_ARB_PERF0 0x4290 Arbiter PMU Configuration Register for Port 0
Table 5-25. R-Box Port Map
Port ID R-Box Port#
L/R Box
PMU Cnt 0-7
PMU Cnt 8-15
IPERF Addresses
ARB_PERF Addresses
Match/Mask Addresses
B1 0 L b000 NA 0x7088,0x7080 0x4290 0x4B20-0x4B00,0x4A20-0x4A00
PHR0 1 L b001 NA 0x7188,0x7180 0x4298 0x4B48-0x4B28,0x4A48-0x4A28
CPE3 2 L b010 NA 0x7288,0x7280 0x42A0 0x4B70-0x4B50,0x4A70-0x4A50
CPE2 3 L b011 NA 0x7388,0x7380 0x42A8 0x4B98-0x4B78,0x4A98-0x4A78
PR3 4 L b100 NA 0x7488,0x7480 0x42B0 0x4BC0-0x4BA0,0x4AC0-0x4AA0
PR2 5 R NA b000 0x7588,0x7580 0x4490 0x4D20-0x4D00,0x4C20-0x4C00
PR0 6 R NA b001 0x7688,0x7680 0x4498 0x4D48-0x4D28,0x4C48-0x4C28
CPE1 7 R NA b010 0x7788,0x7780 0x44A0 0x4D70-0x4D50,0x4C70-0x4C50
CPE0 8 R NA b011 0x7888,0x7880 0x44A8 0x4D98-0x4D78,0x4C98-0x4C78
PR1 9 R NA b100 0x7988,0x7980 0x44B0 0x4DC0-0x4DA0,0x4CC0-0x4CA0
B0 10 R NA b101 0x7A88,0x7A80
0x44B8 0x4DF8-0x4D28,0x4CF8-0x4CC8
PHR1 11 L b101 NA 0x7B88,0x7B80
0x42B8 0x4BE8-0x4CB8,0x4AF8-0x4AC8
Table 5-24. R-Box PMU Summary (Sheet 6 of 6)
CSR Name AddrOffset [15:0] Description
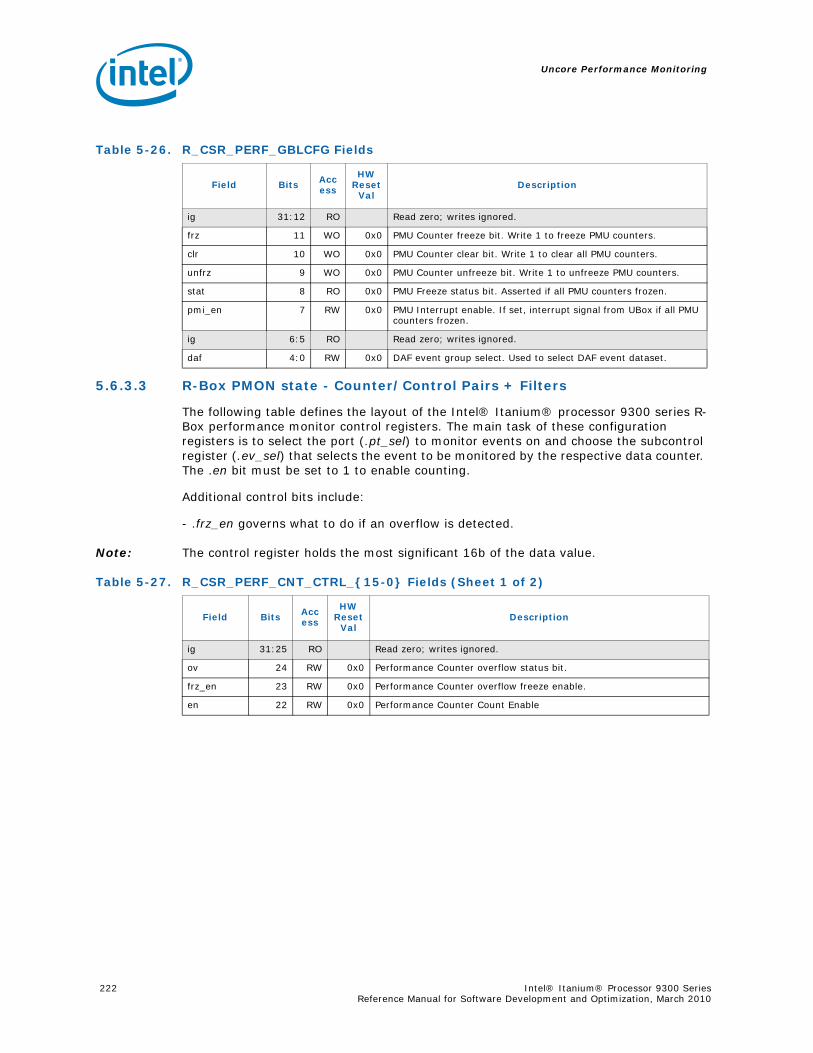
Uncore Performance Monitoring
222 Intel® Itanium® Processor 9300 Series Reference Manual for Software Development and Optimization, March 2010
5.6.3.3 R-Box PMON state - Counter/Control Pairs + Filters
The following table defines the layout of the Intel® Itanium® processor 9300 series R-Box performance monitor control registers. The main task of these configuration registers is to select the port (.pt_sel) to monitor events on and choose the subcontrol register (.ev_sel) that selects the event to be monitored by the respective data counter. The .en bit must be set to 1 to enable counting.
Additional control bits include:
- .frz_en governs what to do if an overflow is detected.
Note: The control register holds the most significant 16b of the data value.
Table 5-26. R_CSR_PERF_GBLCFG Fields
Field Bits Access
HW Reset
ValDescription
ig 31:12 RO Read zero; writes ignored.
frz 11 WO 0x0 PMU Counter freeze bit. Write 1 to freeze PMU counters.
clr 10 WO 0x0 PMU Counter clear bit. Write 1 to clear all PMU counters.
unfrz 9 WO 0x0 PMU Counter unfreeze bit. Write 1 to unfreeze PMU counters.
stat 8 RO 0x0 PMU Freeze status bit. Asserted if all PMU counters frozen.
pmi_en 7 RW 0x0 PMU Interrupt enable. If set, interrupt signal from UBox if all PMU counters frozen.
ig 6:5 RO Read zero; writes ignored.
daf 4:0 RW 0x0 DAF event group select. Used to select DAF event dataset.
Table 5-27. R_CSR_PERF_CNT_CTRL_{15-0} Fields (Sheet 1 of 2)
Field Bits Access
HW Reset
ValDescription
ig 31:25 RO Read zero; writes ignored.
ov 24 RW 0x0 Performance Counter overflow status bit.
frz_en 23 RW 0x0 Performance Counter overflow freeze enable.
en 22 RW 0x0 Performance Counter Count Enable
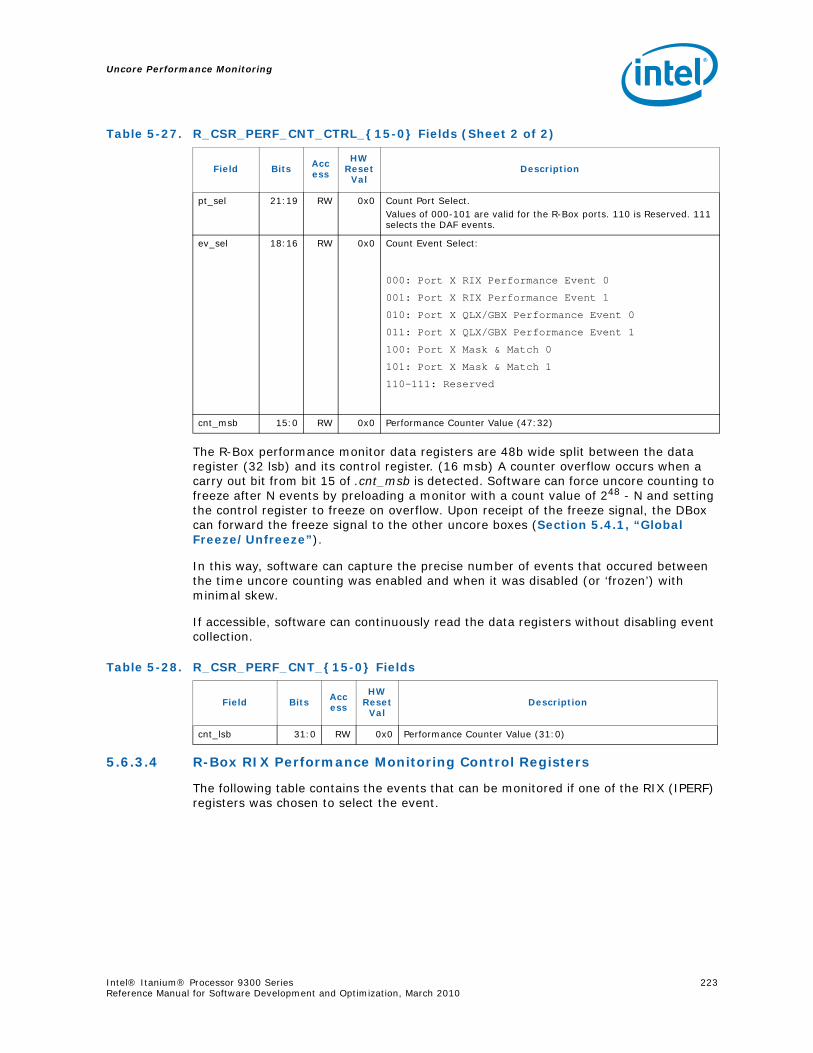
Uncore Performance Monitoring
Intel® Itanium® Processor 9300 Series 223Reference Manual for Software Development and Optimization, March 2010
The R-Box performance monitor data registers are 48b wide split between the data register (32 lsb) and its control register. (16 msb) A counter overflow occurs when a carry out bit from bit 15 of .cnt_msb is detected. Software can force uncore counting to freeze after N events by preloading a monitor with a count value of 248 - N and setting the control register to freeze on overflow. Upon receipt of the freeze signal, the DBox can forward the freeze signal to the other uncore boxes (Section 5.4.1, “Global Freeze/Unfreeze”).
In this way, software can capture the precise number of events that occured between the time uncore counting was enabled and when it was disabled (or ‘frozen’) with minimal skew.
If accessible, software can continuously read the data registers without disabling event collection.
5.6.3.4 R-Box RIX Performance Monitoring Control Registers
The following table contains the events that can be monitored if one of the RIX (IPERF) registers was chosen to select the event.
pt_sel 21:19 RW 0x0 Count Port Select. Values of 000-101 are valid for the R-Box ports. 110 is Reserved. 111 selects the DAF events.
ev_sel 18:16 RW 0x0 Count Event Select:
000: Port X RIX Performance Event 0
001: Port X RIX Performance Event 1
010: Port X QLX/GBX Performance Event 0
011: Port X QLX/GBX Performance Event 1
100: Port X Mask & Match 0
101: Port X Mask & Match 1
110-111: Reserved
cnt_msb 15:0 RW 0x0 Performance Counter Value (47:32)
Table 5-27. R_CSR_PERF_CNT_CTRL_{15-0} Fields (Sheet 2 of 2)
Field Bits Access
HW Reset
ValDescription
Table 5-28. R_CSR_PERF_CNT_{15-0} Fields
Field Bits Access
HW Reset
ValDescription
cnt_lsb 31:0 RW 0x0 Performance Counter Value (31:0)

Uncore Performance Monitoring
224 Intel® Itanium® Processor 9300 Series Reference Manual for Software Development and Optimization, March 2010
Table 5-29. R_CSR_P{11-0}_IPERF{1-0} Registers (Sheet 1 of 2)
Field Bits Access
HW Reset
ValDescription
FLT_SENT 31 RW 0x0 Flit Sent
FLT_RCVD 30 RW 0x0 Flit Received
NSP_SENT 29 RW 0x0 Non-special Flit Sent
NSP_RCVD 28 RW 0x0 Non-special Flit Received
OUTB_OV 27 RW 0x0 Running Counter of Output Buffer depth Overflow
OUTB_WR 26 RW 0x0 Flit written into Output Buffer
OUTB_NE 25 RW 0x0 Output Buffer Not Empty
RETQ_RD 24 RW 0x0 Retry Buffer Read Count
INPCKTERR 23 RW 0x0 Incoming Packet Error
FSTENOUGH 22 RW 0x0 Fast Enough path used
EOT_OV 21 RW 0x0 Running Counter of EOT Depth Overflow
EOT_WR 20 RW 0x0 EOT Entry inserted
EOTMSGSEL 19:17 RW 0x0 Message Class select for EOT Depth Overflow and EOT Entry inserted events.
001: Home0
010: Home1
011: Snoop
100: Non-Data Response
101: Data Response
110: Non-Coherent Standard
111: Non-Coherent Bypass
EOT_NE 16 RW 0x0 Count cycles EOT is not Empty
ARB_MSGSEL 15:9 RW 0x04 Allocation to Arb Select Bit Mask:
0b1XXXXXX: Home
0bX1XXXXX: Home1
0bXX1XXXX: Snoop
0bXXX1XXX: Non-Data Response
0bXXXX1XX: Data Response
0bXXXXX1X: Non-Coherent Standard
0bXXXXXX1: Non-Coherent Bypass
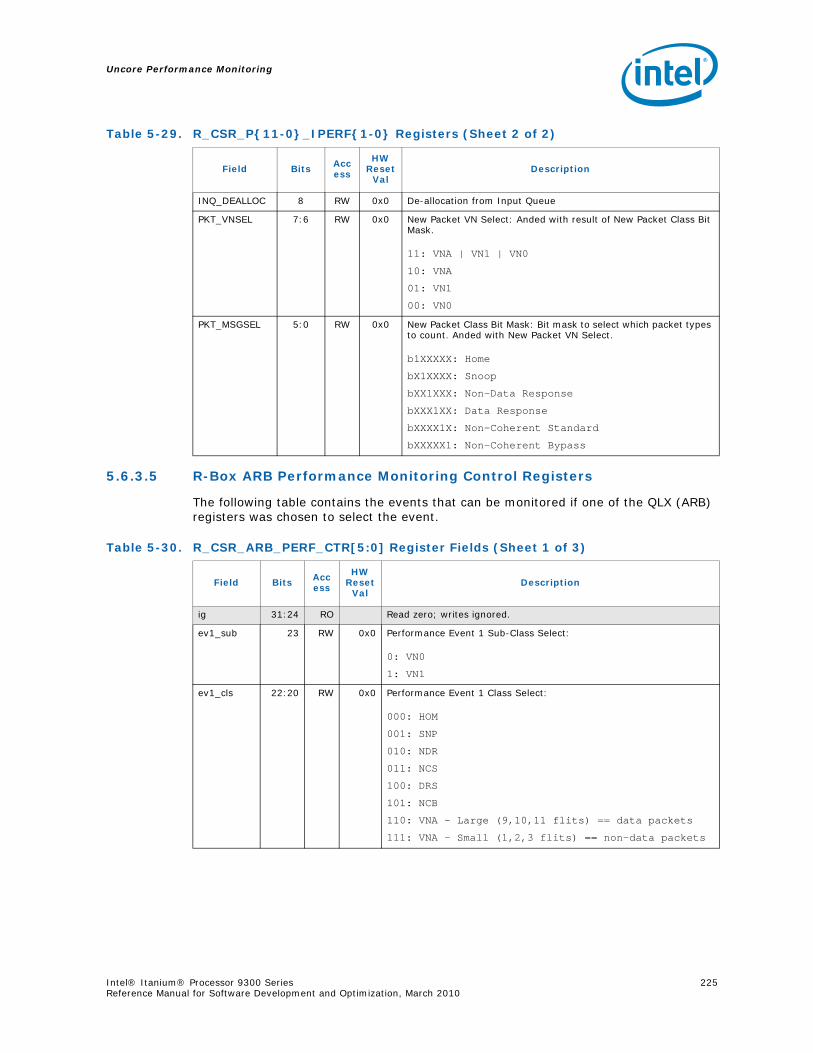
Uncore Performance Monitoring
Intel® Itanium® Processor 9300 Series 225Reference Manual for Software Development and Optimization, March 2010
5.6.3.5 R-Box ARB Performance Monitoring Control Registers
The following table contains the events that can be monitored if one of the QLX (ARB) registers was chosen to select the event.
INQ_DEALLOC 8 RW 0x0 De-allocation from Input Queue
PKT_VNSEL 7:6 RW 0x0 New Packet VN Select: Anded with result of New Packet Class Bit Mask.
11: VNA | VN1 | VN0
10: VNA
01: VN1
00: VN0
PKT_MSGSEL 5:0 RW 0x0 New Packet Class Bit Mask: Bit mask to select which packet types to count. Anded with New Packet VN Select.
b1XXXXX: Home
bX1XXXX: Snoop
bXX1XXX: Non-Data Response
bXXX1XX: Data Response
bXXXX1X: Non-Coherent Standard
bXXXXX1: Non-Coherent Bypass
Table 5-29. R_CSR_P{11-0}_IPERF{1-0} Registers (Sheet 2 of 2)
Field Bits Access
HW Reset
ValDescription
Table 5-30. R_CSR_ARB_PERF_CTR[5:0] Register Fields (Sheet 1 of 3)
Field Bits Access
HW Reset
ValDescription
ig 31:24 RO Read zero; writes ignored.
ev1_sub 23 RW 0x0 Performance Event 1 Sub-Class Select:
0: VN0
1: VN1
ev1_cls 22:20 RW 0x0 Performance Event 1 Class Select:
000: HOM
001: SNP
010: NDR
011: NCS
100: DRS
101: NCB
110: VNA - Large (9,10,11 flits) == data packets
111: VNA - Small (1,2,3 flits) == non-data packets
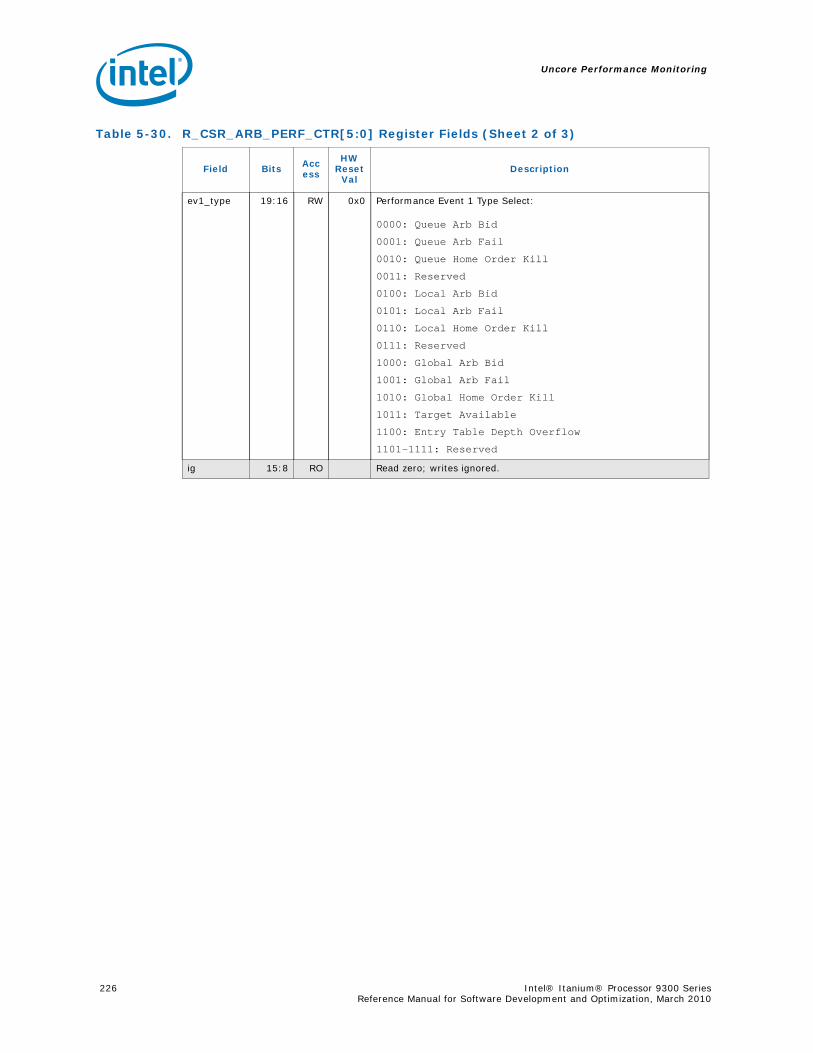
Uncore Performance Monitoring
226 Intel® Itanium® Processor 9300 Series Reference Manual for Software Development and Optimization, March 2010
ev1_type 19:16 RW 0x0 Performance Event 1 Type Select:
0000: Queue Arb Bid
0001: Queue Arb Fail
0010: Queue Home Order Kill
0011: Reserved
0100: Local Arb Bid
0101: Local Arb Fail
0110: Local Home Order Kill
0111: Reserved
1000: Global Arb Bid
1001: Global Arb Fail
1010: Global Home Order Kill
1011: Target Available
1100: Entry Table Depth Overflow
1101-1111: Reserved
ig 15:8 RO Read zero; writes ignored.
Table 5-30. R_CSR_ARB_PERF_CTR[5:0] Register Fields (Sheet 2 of 3)
Field Bits Access
HW Reset
ValDescription
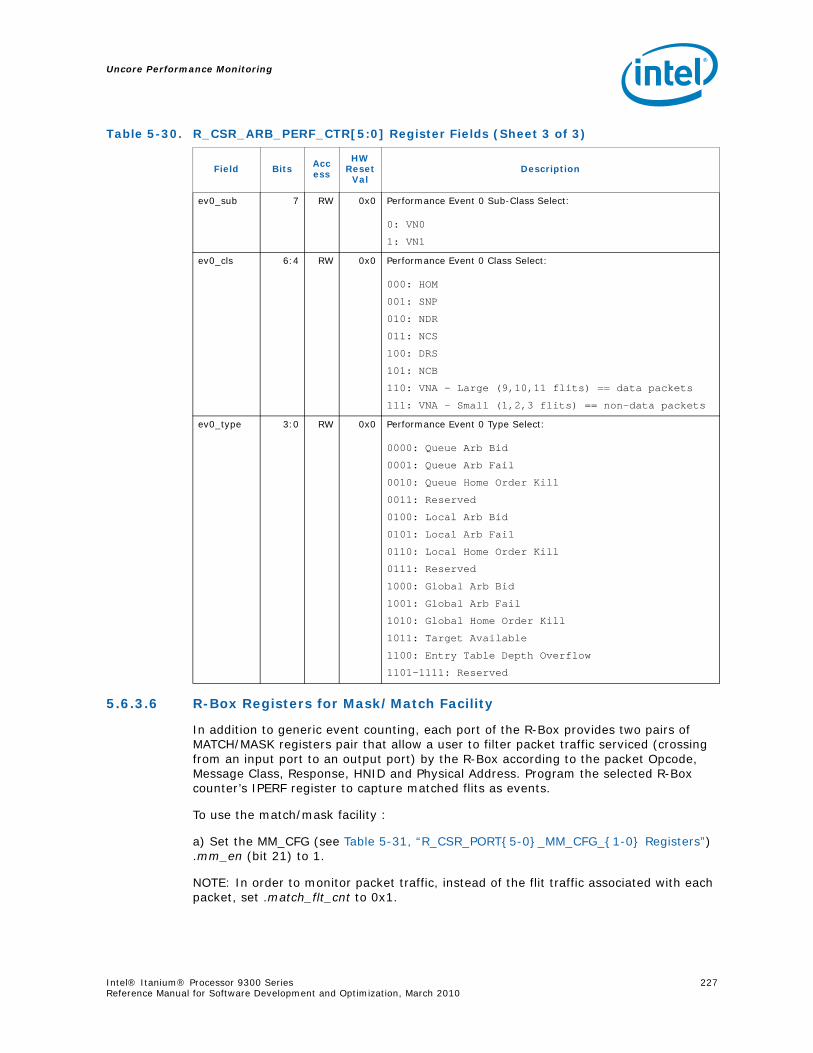
Uncore Performance Monitoring
Intel® Itanium® Processor 9300 Series 227Reference Manual for Software Development and Optimization, March 2010
5.6.3.6 R-Box Registers for Mask/Match Facility
In addition to generic event counting, each port of the R-Box provides two pairs of MATCH/MASK registers pair that allow a user to filter packet traffic serviced (crossing from an input port to an output port) by the R-Box according to the packet Opcode, Message Class, Response, HNID and Physical Address. Program the selected R-Box counter’s IPERF register to capture matched flits as events.
To use the match/mask facility :
a) Set the MM_CFG (see Table 5-31, “R_CSR_PORT{5-0}_MM_CFG_{1-0} Registers”) .mm_en (bit 21) to 1.
NOTE: In order to monitor packet traffic, instead of the flit traffic associated with each packet, set .match_flt_cnt to 0x1.
ev0_sub 7 RW 0x0 Performance Event 0 Sub-Class Select:
0: VN0
1: VN1
ev0_cls 6:4 RW 0x0 Performance Event 0 Class Select:
000: HOM
001: SNP
010: NDR
011: NCS
100: DRS
101: NCB
110: VNA - Large (9,10,11 flits) == data packets
111: VNA - Small (1,2,3 flits) == non-data packets
ev0_type 3:0 RW 0x0 Performance Event 0 Type Select:
0000: Queue Arb Bid
0001: Queue Arb Fail
0010: Queue Home Order Kill
0011: Reserved
0100: Local Arb Bid
0101: Local Arb Fail
0110: Local Home Order Kill
0111: Reserved
1000: Global Arb Bid
1001: Global Arb Fail
1010: Global Home Order Kill
1011: Target Available
1100: Entry Table Depth Overflow
1101-1111: Reserved
Table 5-30. R_CSR_ARB_PERF_CTR[5:0] Register Fields (Sheet 3 of 3)
Field Bits Access
HW Reset
ValDescription
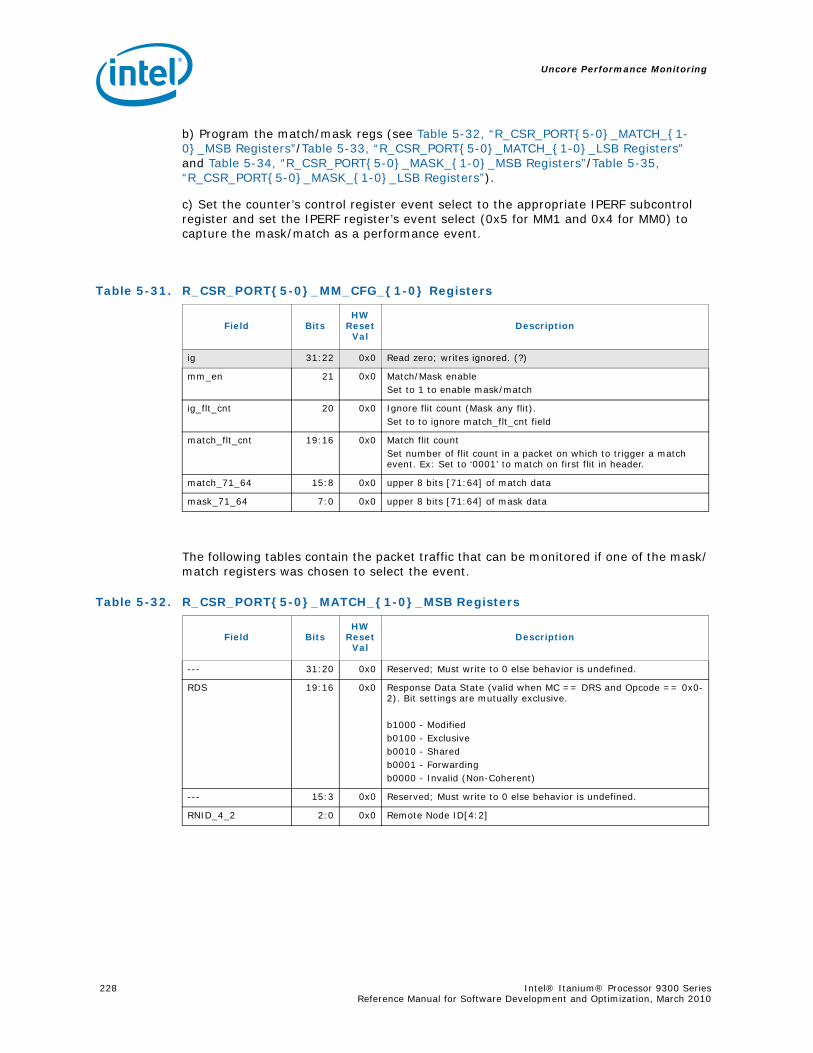
Uncore Performance Monitoring
228 Intel® Itanium® Processor 9300 Series Reference Manual for Software Development and Optimization, March 2010
b) Program the match/mask regs (see Table 5-32, “R_CSR_PORT{5-0}_MATCH_{1-0}_MSB Registers”/Table 5-33, “R_CSR_PORT{5-0}_MATCH_{1-0}_LSB Registers” and Table 5-34, “R_CSR_PORT{5-0}_MASK_{1-0}_MSB Registers”/Table 5-35, “R_CSR_PORT{5-0}_MASK_{1-0}_LSB Registers”).
c) Set the counter’s control register event select to the appropriate IPERF subcontrol register and set the IPERF register’s event select (0x5 for MM1 and 0x4 for MM0) to capture the mask/match as a performance event.
The following tables contain the packet traffic that can be monitored if one of the mask/match registers was chosen to select the event.
Table 5-31. R_CSR_PORT{5-0}_MM_CFG_{1-0} Registers
Field BitsHW
Reset Val
Description
ig 31:22 0x0 Read zero; writes ignored. (?)
mm_en 21 0x0 Match/Mask enableSet to 1 to enable mask/match
ig_flt_cnt 20 0x0 Ignore flit count (Mask any flit).Set to to ignore match_flt_cnt field
match_flt_cnt 19:16 0x0 Match flit countSet number of flit count in a packet on which to trigger a match event. Ex: Set to ‘0001’ to match on first flit in header.
match_71_64 15:8 0x0 upper 8 bits [71:64] of match data
mask_71_64 7:0 0x0 upper 8 bits [71:64] of mask data
Table 5-32. R_CSR_PORT{5-0}_MATCH_{1-0}_MSB Registers
Field BitsHW
Reset Val
Description
--- 31:20 0x0 Reserved; Must write to 0 else behavior is undefined.
RDS 19:16 0x0 Response Data State (valid when MC == DRS and Opcode == 0x0-2). Bit settings are mutually exclusive.
b1000 - Modifiedb0100 - Exclusiveb0010 - Sharedb0001 - Forwardingb0000 - Invalid (Non-Coherent)
--- 15:3 0x0 Reserved; Must write to 0 else behavior is undefined.
RNID_4_2 2:0 0x0 Remote Node ID[4:2]
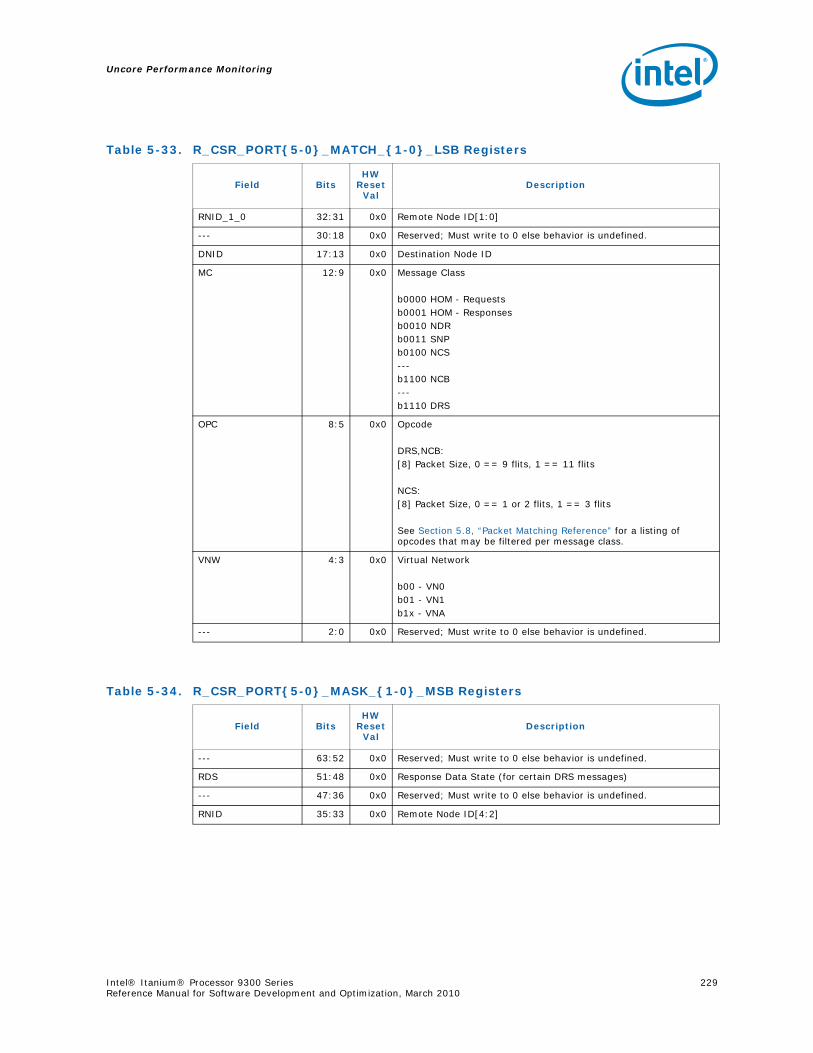
Uncore Performance Monitoring
Intel® Itanium® Processor 9300 Series 229Reference Manual for Software Development and Optimization, March 2010
Table 5-33. R_CSR_PORT{5-0}_MATCH_{1-0}_LSB Registers
Field BitsHW
Reset Val
Description
RNID_1_0 32:31 0x0 Remote Node ID[1:0]
--- 30:18 0x0 Reserved; Must write to 0 else behavior is undefined.
DNID 17:13 0x0 Destination Node ID
MC 12:9 0x0 Message Class
b0000 HOM - Requestsb0001 HOM - Responsesb0010 NDRb0011 SNPb0100 NCS---b1100 NCB---b1110 DRS
OPC 8:5 0x0 Opcode
DRS,NCB:[8] Packet Size, 0 == 9 flits, 1 == 11 flits
NCS:[8] Packet Size, 0 == 1 or 2 flits, 1 == 3 flits
See Section 5.8, “Packet Matching Reference” for a listing of opcodes that may be filtered per message class.
VNW 4:3 0x0 Virtual Network
b00 - VN0b01 - VN1b1x - VNA
--- 2:0 0x0 Reserved; Must write to 0 else behavior is undefined.
Table 5-34. R_CSR_PORT{5-0}_MASK_{1-0}_MSB Registers
Field BitsHW
Reset Val
Description
--- 63:52 0x0 Reserved; Must write to 0 else behavior is undefined.
RDS 51:48 0x0 Response Data State (for certain DRS messages)
--- 47:36 0x0 Reserved; Must write to 0 else behavior is undefined.
RNID 35:33 0x0 Remote Node ID[4:2]
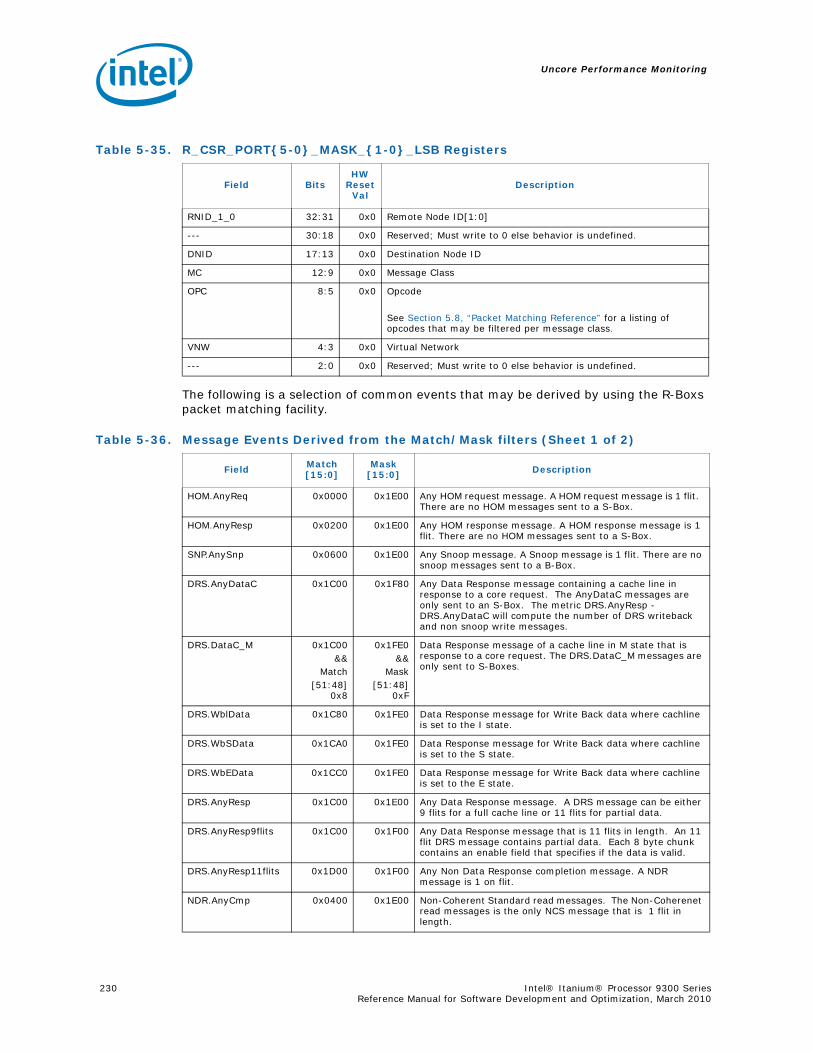
Uncore Performance Monitoring
230 Intel® Itanium® Processor 9300 Series Reference Manual for Software Development and Optimization, March 2010
The following is a selection of common events that may be derived by using the R-Boxs packet matching facility.
Table 5-35. R_CSR_PORT{5-0}_MASK_{1-0}_LSB Registers
Field BitsHW
Reset Val
Description
RNID_1_0 32:31 0x0 Remote Node ID[1:0]
--- 30:18 0x0 Reserved; Must write to 0 else behavior is undefined.
DNID 17:13 0x0 Destination Node ID
MC 12:9 0x0 Message Class
OPC 8:5 0x0 Opcode
See Section 5.8, “Packet Matching Reference” for a listing of opcodes that may be filtered per message class.
VNW 4:3 0x0 Virtual Network
--- 2:0 0x0 Reserved; Must write to 0 else behavior is undefined.
Table 5-36. Message Events Derived from the Match/Mask filters (Sheet 1 of 2)
Field Match[15:0]
Mask[15:0] Description
HOM.AnyReq 0x0000 0x1E00 Any HOM request message. A HOM request message is 1 flit. There are no HOM messages sent to a S-Box.
HOM.AnyResp 0x0200 0x1E00 Any HOM response message. A HOM response message is 1 flit. There are no HOM messages sent to a S-Box.
SNP.AnySnp 0x0600 0x1E00 Any Snoop message. A Snoop message is 1 flit. There are no snoop messages sent to a B-Box.
DRS.AnyDataC 0x1C00 0x1F80 Any Data Response message containing a cache line in response to a core request. The AnyDataC messages are only sent to an S-Box. The metric DRS.AnyResp - DRS.AnyDataC will compute the number of DRS writeback and non snoop write messages.
DRS.DataC_M 0x1C00&&
Match[51:48]
0x8
0x1FE0&&
Mask[51:48]
0xF
Data Response message of a cache line in M state that is response to a core request. The DRS.DataC_M messages are only sent to S-Boxes.
DRS.WblData 0x1C80 0x1FE0 Data Response message for Write Back data where cachline is set to the I state.
DRS.WbSData 0x1CA0 0x1FE0 Data Response message for Write Back data where cachline is set to the S state.
DRS.WbEData 0x1CC0 0x1FE0 Data Response message for Write Back data where cachline is set to the E state.
DRS.AnyResp 0x1C00 0x1E00 Any Data Response message. A DRS message can be either 9 flits for a full cache line or 11 flits for partial data.
DRS.AnyResp9flits 0x1C00 0x1F00 Any Data Response message that is 11 flits in length. An 11 flit DRS message contains partial data. Each 8 byte chunk contains an enable field that specifies if the data is valid.
DRS.AnyResp11flits 0x1D00 0x1F00 Any Non Data Response completion message. A NDR message is 1 on flit.
NDR.AnyCmp 0x0400 0x1E00 Non-Coherent Standard read messages. The Non-Coherenet read messages is the only NCS message that is 1 flit in length.
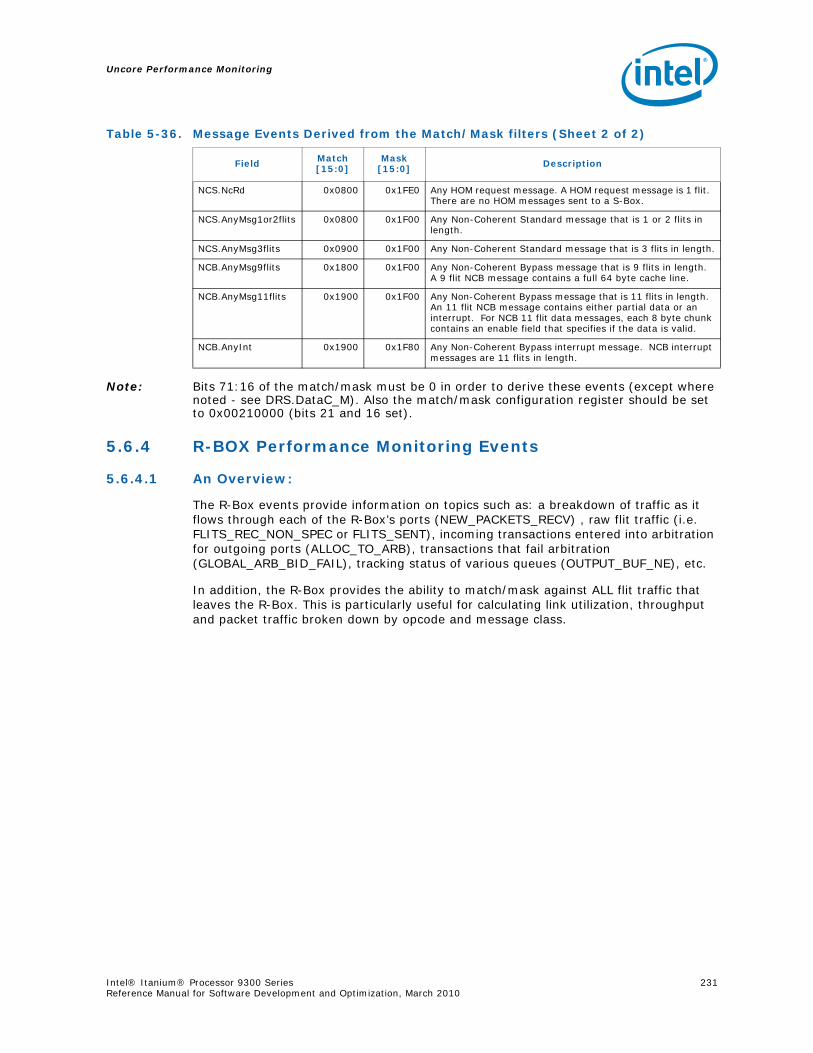
Uncore Performance Monitoring
Intel® Itanium® Processor 9300 Series 231Reference Manual for Software Development and Optimization, March 2010
Note: Bits 71:16 of the match/mask must be 0 in order to derive these events (except where noted - see DRS.DataC_M). Also the match/mask configuration register should be set to 0x00210000 (bits 21 and 16 set).
5.6.4 R-BOX Performance Monitoring Events
5.6.4.1 An Overview:
The R-Box events provide information on topics such as: a breakdown of traffic as it flows through each of the R-Box’s ports (NEW_PACKETS_RECV) , raw flit traffic (i.e. FLITS_REC_NON_SPEC or FLITS_SENT), incoming transactions entered into arbitration for outgoing ports (ALLOC_TO_ARB), transactions that fail arbitration (GLOBAL_ARB_BID_FAIL), tracking status of various queues (OUTPUT_BUF_NE), etc.
In addition, the R-Box provides the ability to match/mask against ALL flit traffic that leaves the R-Box. This is particularly useful for calculating link utilization, throughput and packet traffic broken down by opcode and message class.
NCS.NcRd 0x0800 0x1FE0 Any HOM request message. A HOM request message is 1 flit. There are no HOM messages sent to a S-Box.
NCS.AnyMsg1or2flits 0x0800 0x1F00 Any Non-Coherent Standard message that is 1 or 2 flits in length.
NCS.AnyMsg3flits 0x0900 0x1F00 Any Non-Coherent Standard message that is 3 flits in length.
NCB.AnyMsg9flits 0x1800 0x1F00 Any Non-Coherent Bypass message that is 9 flits in length. A 9 flit NCB message contains a full 64 byte cache line.
NCB.AnyMsg11flits 0x1900 0x1F00 Any Non-Coherent Bypass message that is 11 flits in length. An 11 flit NCB message contains either partial data or an interrupt. For NCB 11 flit data messages, each 8 byte chunk contains an enable field that specifies if the data is valid.
NCB.AnyInt 0x1900 0x1F80 Any Non-Coherent Bypass interrupt message. NCB interrupt messages are 11 flits in length.
Table 5-36. Message Events Derived from the Match/Mask filters (Sheet 2 of 2)
Field Match[15:0]
Mask[15:0] Description
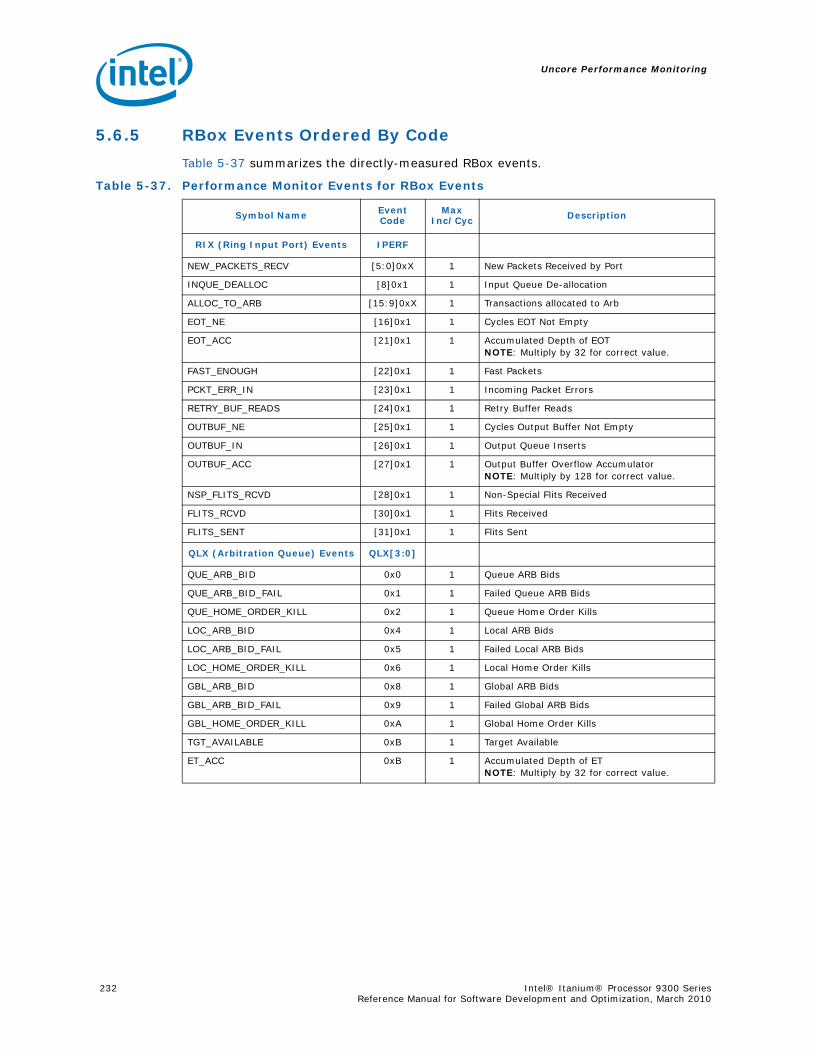
Uncore Performance Monitoring
232 Intel® Itanium® Processor 9300 Series Reference Manual for Software Development and Optimization, March 2010
5.6.5 RBox Events Ordered By Code
Table 5-37 summarizes the directly-measured RBox events.
Table 5-37. Performance Monitor Events for RBox Events
Symbol Name Event Code
Max Inc/Cyc Description
RIX (Ring Input Port) Events IPERF
NEW_PACKETS_RECV [5:0]0xX 1 New Packets Received by Port
INQUE_DEALLOC [8]0x1 1 Input Queue De-allocation
ALLOC_TO_ARB [15:9]0xX 1 Transactions allocated to Arb
EOT_NE [16]0x1 1 Cycles EOT Not Empty
EOT_ACC [21]0x1 1 Accumulated Depth of EOTNOTE: Multiply by 32 for correct value.
FAST_ENOUGH [22]0x1 1 Fast Packets
PCKT_ERR_IN [23]0x1 1 Incoming Packet Errors
RETRY_BUF_READS [24]0x1 1 Retry Buffer Reads
OUTBUF_NE [25]0x1 1 Cycles Output Buffer Not Empty
OUTBUF_IN [26]0x1 1 Output Queue Inserts
OUTBUF_ACC [27]0x1 1 Output Buffer Overflow AccumulatorNOTE: Multiply by 128 for correct value.
NSP_FLITS_RCVD [28]0x1 1 Non-Special Flits Received
FLITS_RCVD [30]0x1 1 Flits Received
FLITS_SENT [31]0x1 1 Flits Sent
QLX (Arbitration Queue) Events QLX[3:0]
QUE_ARB_BID 0x0 1 Queue ARB Bids
QUE_ARB_BID_FAIL 0x1 1 Failed Queue ARB Bids
QUE_HOME_ORDER_KILL 0x2 1 Queue Home Order Kills
LOC_ARB_BID 0x4 1 Local ARB Bids
LOC_ARB_BID_FAIL 0x5 1 Failed Local ARB Bids
LOC_HOME_ORDER_KILL 0x6 1 Local Home Order Kills
GBL_ARB_BID 0x8 1 Global ARB Bids
GBL_ARB_BID_FAIL 0x9 1 Failed Global ARB Bids
GBL_HOME_ORDER_KILL 0xA 1 Global Home Order Kills
TGT_AVAILABLE 0xB 1 Target Available
ET_ACC 0xB 1 Accumulated Depth of ET NOTE: Multiply by 32 for correct value.
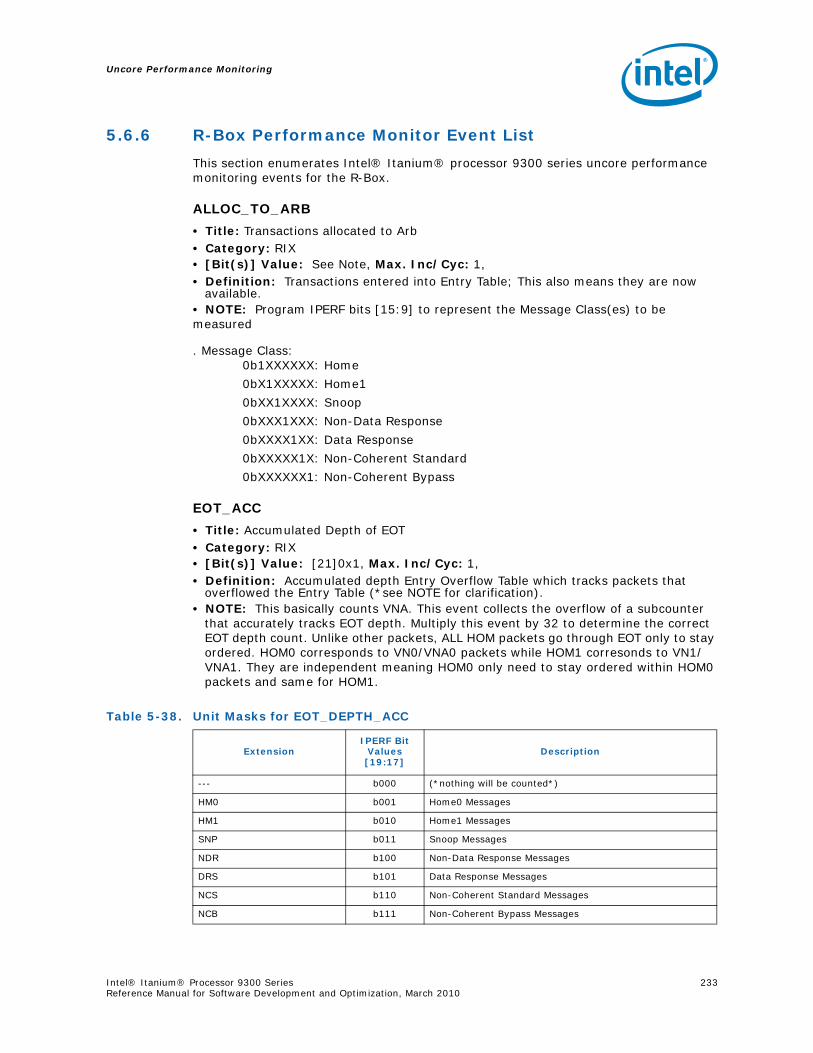
Uncore Performance Monitoring
Intel® Itanium® Processor 9300 Series 233Reference Manual for Software Development and Optimization, March 2010
5.6.6 R-Box Performance Monitor Event List
This section enumerates Intel® Itanium® processor 9300 series uncore performance monitoring events for the R-Box.
ALLOC_TO_ARB
• Title: Transactions allocated to Arb• Category: RIX • [Bit(s)] Value: See Note, Max. Inc/Cyc: 1, • Definition: Transactions entered into Entry Table; This also means they are now
available.• NOTE: Program IPERF bits [15:9] to represent the Message Class(es) to be measured
. Message Class: 0b1XXXXXX: Home
0bX1XXXXX: Home1
0bXX1XXXX: Snoop
0bXXX1XXX: Non-Data Response
0bXXXX1XX: Data Response
0bXXXXX1X: Non-Coherent Standard
0bXXXXXX1: Non-Coherent Bypass
EOT_ACC
• Title: Accumulated Depth of EOT• Category: RIX • [Bit(s)] Value: [21]0x1, Max. Inc/Cyc: 1, • Definition: Accumulated depth Entry Overflow Table which tracks packets that
overflowed the Entry Table (*see NOTE for clarification).• NOTE: This basically counts VNA. This event collects the overflow of a subcounter
that accurately tracks EOT depth. Multiply this event by 32 to determine the correct EOT depth count. Unlike other packets, ALL HOM packets go through EOT only to stay ordered. HOM0 corresponds to VN0/VNA0 packets while HOM1 corresonds to VN1/VNA1. They are independent meaning HOM0 only need to stay ordered within HOM0 packets and same for HOM1.
Table 5-38. Unit Masks for EOT_DEPTH_ACC
ExtensionIPERF Bit
Values[19:17]
Description
--- b000 (*nothing will be counted*)
HM0 b001 Home0 Messages
HM1 b010 Home1 Messages
SNP b011 Snoop Messages
NDR b100 Non-Data Response Messages
DRS b101 Data Response Messages
NCS b110 Non-Coherent Standard Messages
NCB b111 Non-Coherent Bypass Messages
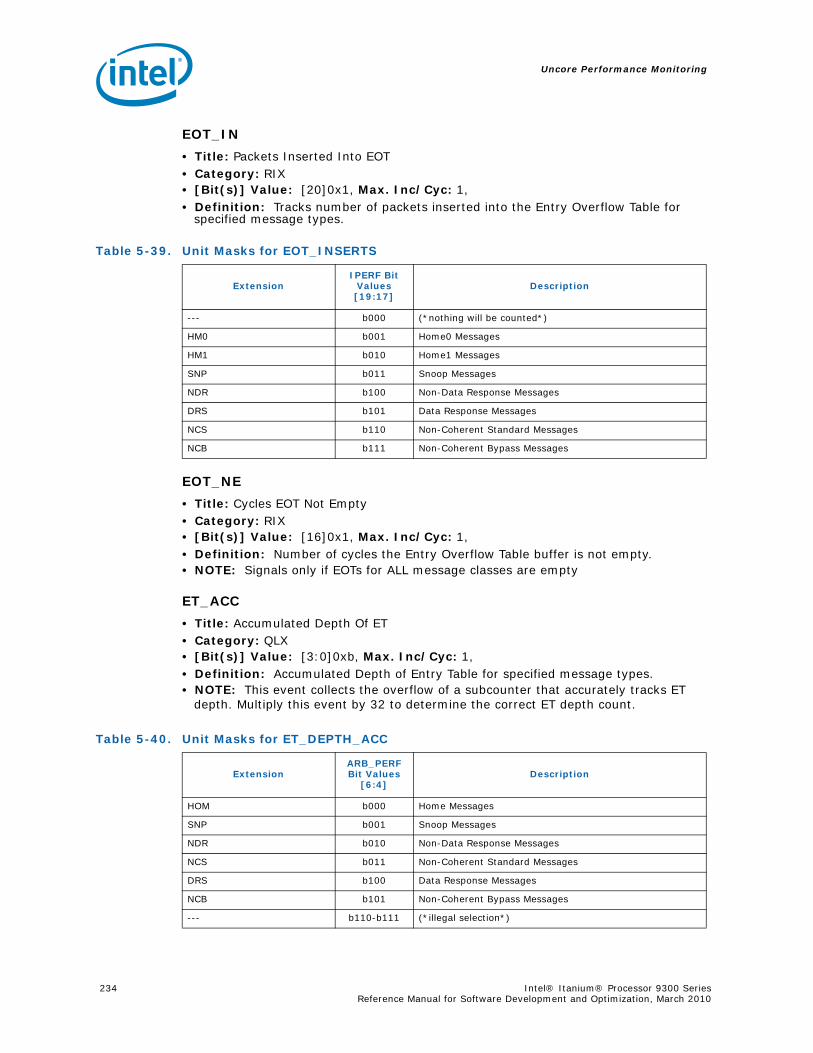
Uncore Performance Monitoring
234 Intel® Itanium® Processor 9300 Series Reference Manual for Software Development and Optimization, March 2010
EOT_IN
• Title: Packets Inserted Into EOT• Category: RIX • [Bit(s)] Value: [20]0x1, Max. Inc/Cyc: 1, • Definition: Tracks number of packets inserted into the Entry Overflow Table for
specified message types.
EOT_NE
• Title: Cycles EOT Not Empty• Category: RIX • [Bit(s)] Value: [16]0x1, Max. Inc/Cyc: 1, • Definition: Number of cycles the Entry Overflow Table buffer is not empty.• NOTE: Signals only if EOTs for ALL message classes are empty
ET_ACC
• Title: Accumulated Depth Of ET• Category: QLX • [Bit(s)] Value: [3:0]0xb, Max. Inc/Cyc: 1, • Definition: Accumulated Depth of Entry Table for specified message types.• NOTE: This event collects the overflow of a subcounter that accurately tracks ET
depth. Multiply this event by 32 to determine the correct ET depth count.
Table 5-39. Unit Masks for EOT_INSERTS
ExtensionIPERF Bit
Values[19:17]
Description
--- b000 (*nothing will be counted*)
HM0 b001 Home0 Messages
HM1 b010 Home1 Messages
SNP b011 Snoop Messages
NDR b100 Non-Data Response Messages
DRS b101 Data Response Messages
NCS b110 Non-Coherent Standard Messages
NCB b111 Non-Coherent Bypass Messages
Table 5-40. Unit Masks for ET_DEPTH_ACC
ExtensionARB_PERF Bit Values
[6:4]Description
HOM b000 Home Messages
SNP b001 Snoop Messages
NDR b010 Non-Data Response Messages
NCS b011 Non-Coherent Standard Messages
DRS b100 Data Response Messages
NCB b101 Non-Coherent Bypass Messages
--- b110-b111 (*illegal selection*)
Uncore Performance Monitoring
Intel® Itanium® Processor 9300 Series 235Reference Manual for Software Development and Optimization, March 2010
FAST_ENOUGH
• Title: Fast Packets• Category: RIX • [Bit(s)] Value: [22]0x1, Max. Inc/Cyc: 1, • Definition: How often a multi-flit packet uses the optimized path.
FLITS_RCVD
• Title: Flits Received• Category: RIX • [Bit(s)] Value: [30]0x1, Max. Inc/Cyc: 1, • Definition: Counts all flits received.
FLITS_SENT
• Title: Flits Sent• Category: RIX • [Bit(s)] Value: [31]0x1, Max. Inc/Cyc: 1, • Definition: Counts all flits
FLITS_NSP_RCVD
• Title: Non-Special Flits Received• Category: RIX • [Bit(s)] Value: [28]0x1, Max. Inc/Cyc: 1, • Definition: Counts all non-special flits received.
GBL_ARB_BID
• Title: Global ARB Bids• Category: QLX • [Bit(s)] Value: [3:0]0x8, Max. Inc/Cyc: 1, • Definition: Count global arbitration bids from the port. Occurs on output port.
GBL_ARB_BID_FAIL
• Title: Failed Global ARB Bids• Category: QLX • [Bit(s)] Value: [3:0]0x9, Max. Inc/Cyc: 1, • Definition: Count failed global arbitration bids from the port. Occurs on output port. • NOTE: Multi-flit packets will only receive a single fail signal.
GBL_HOME_ORDER_KILL
• Title: Global Home Order Kills• Category: QLX • [Bit(s)] Value: [3:0]0xa, Max. Inc/Cyc: 1, • Definition: Arbitration attempts killed in the HOM channel of the global ARB that
violate ordering. HOM packets may be issued back to back through the ARBs, but if the first HOM was not chosen by the ARB, the second one will be killed due to order-ing rules. This event accounts for how often this situation occurs in the global ARB.
Uncore Performance Monitoring
236 Intel® Itanium® Processor 9300 Series Reference Manual for Software Development and Optimization, March 2010
INQUE_DEALLOC
• Title: Input Queue De-allocation• Category: RIX • [Bit(s)] Value: [8]0x1, Max. Inc/Cyc: 1, • Definition: De-allocation from Input Queue
LOL_ARB_BID
• Title: Local ARB Bids• Category: QLX • [Bit(s)] Value: [3:0]0x4, Max. Inc/Cyc: 1, • Definition: Number of bids to exit port. Occurs on input port.
LOC_ARB_BID_FAIL
• Title: Failed Local ARB Bids• Category: QLX • [Bit(s)] Value: [3:0]0x5, Max. Inc/Cyc: 1, • Definition: Number of bids to exit port that failed. Occurs on input port.
LOC_HOME_ORDER_KILL
• Title: Local Home Order Kills• Category: QLX • [Bit(s)] Value: [3:0]0x6, Max. Inc/Cyc: 1, • Definition: Arbitration attempts killed in the HOM channel of the local ARB that vio-
late ordering. HOM packets may be issued back to back through the ARBs, but if the first HOM was not chosen by the ARB, the second one will be killed due to ordering rules. This event accounts for often this situation occurs in the local ARB.
NEW_PACKETS_RECV
• Title: New Packets Received by Port
• Category: RIX • [Bit(s)] Value: see table, Max. Inc/Cyc: 1, • Definition: Counts new packets received according to the Virtual Network and Mes-
sage Class specified.• NOTE: Program IPERF bits [5:0] to represent the Message Class(es) to be measured. Each packet gets allocated to the ARB exactly once.
Message Class: 0b1XXXXX: Snoop
0bX1XXXX: Home
0bXX1XXX: Non-Data Response
0bXXX1XX: Data Response
0bXXXX1X: Non-Coherent Standard
0bXXXXX1: Non-Coherent Bypass
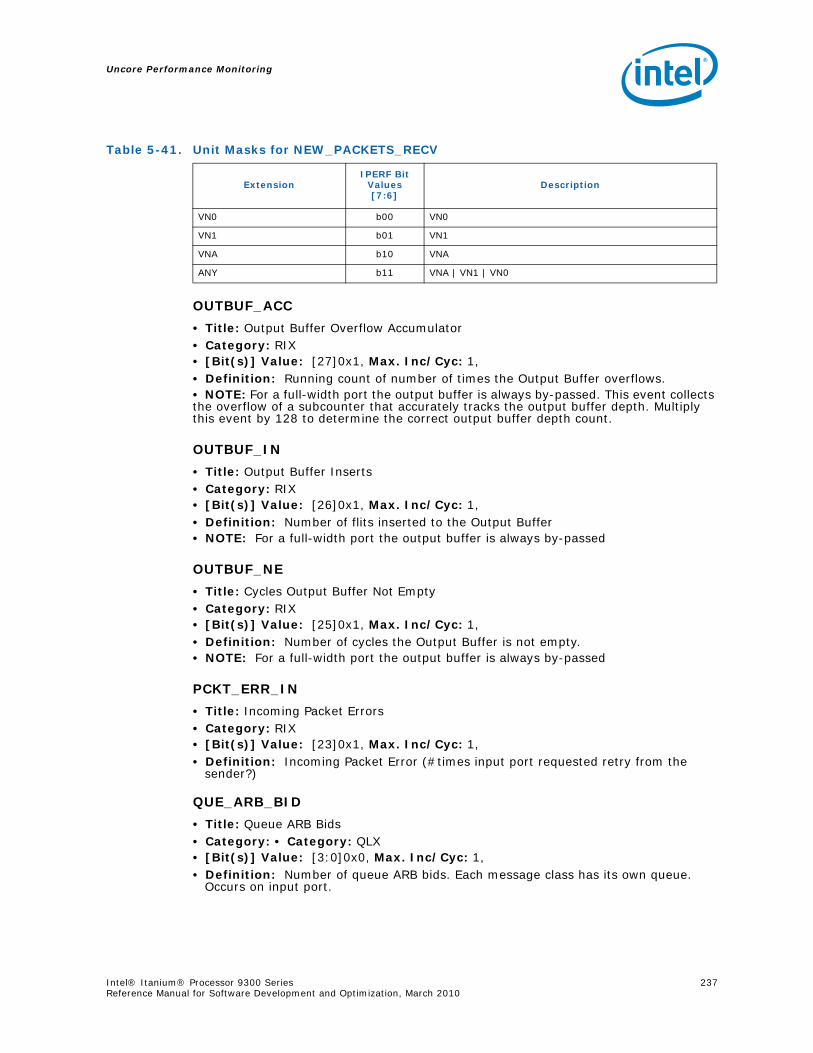
Uncore Performance Monitoring
Intel® Itanium® Processor 9300 Series 237Reference Manual for Software Development and Optimization, March 2010
OUTBUF_ACC
• Title: Output Buffer Overflow Accumulator• Category: RIX • [Bit(s)] Value: [27]0x1, Max. Inc/Cyc: 1, • Definition: Running count of number of times the Output Buffer overflows.• NOTE: For a full-width port the output buffer is always by-passed. This event collects the overflow of a subcounter that accurately tracks the output buffer depth. Multiply this event by 128 to determine the correct output buffer depth count.
OUTBUF_IN
• Title: Output Buffer Inserts• Category: RIX • [Bit(s)] Value: [26]0x1, Max. Inc/Cyc: 1, • Definition: Number of flits inserted to the Output Buffer• NOTE: For a full-width port the output buffer is always by-passed
OUTBUF_NE
• Title: Cycles Output Buffer Not Empty• Category: RIX • [Bit(s)] Value: [25]0x1, Max. Inc/Cyc: 1, • Definition: Number of cycles the Output Buffer is not empty.• NOTE: For a full-width port the output buffer is always by-passed
PCKT_ERR_IN
• Title: Incoming Packet Errors• Category: RIX • [Bit(s)] Value: [23]0x1, Max. Inc/Cyc: 1, • Definition: Incoming Packet Error (#times input port requested retry from the
sender?)
QUE_ARB_BID
• Title: Queue ARB Bids• Category: • Category: QLX • [Bit(s)] Value: [3:0]0x0, Max. Inc/Cyc: 1, • Definition: Number of queue ARB bids. Each message class has its own queue.
Occurs on input port.
Table 5-41. Unit Masks for NEW_PACKETS_RECV
ExtensionIPERF Bit
Values[7:6]
Description
VN0 b00 VN0
VN1 b01 VN1
VNA b10 VNA
ANY b11 VNA | VN1 | VN0
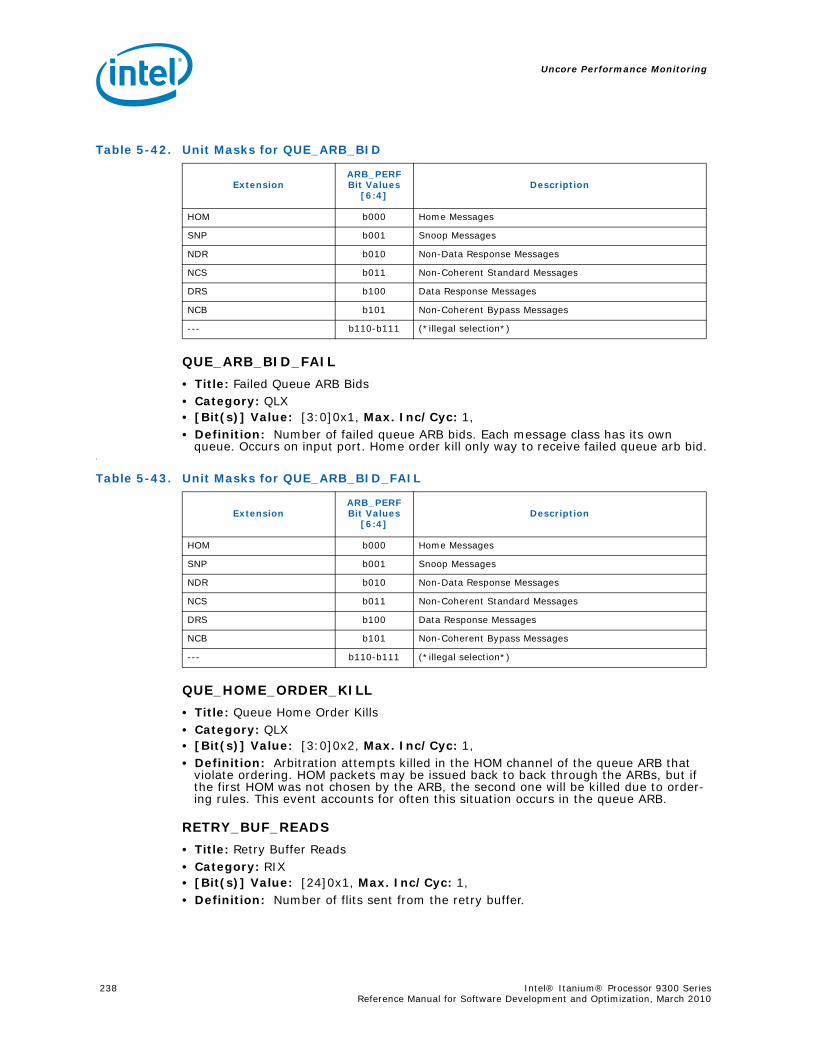
Uncore Performance Monitoring
238 Intel® Itanium® Processor 9300 Series Reference Manual for Software Development and Optimization, March 2010
QUE_ARB_BID_FAIL
• Title: Failed Queue ARB Bids• Category: QLX • [Bit(s)] Value: [3:0]0x1, Max. Inc/Cyc: 1, • Definition: Number of failed queue ARB bids. Each message class has its own
queue. Occurs on input port. Home order kill only way to receive failed queue arb bid.f
QUE_HOME_ORDER_KILL
• Title: Queue Home Order Kills• Category: QLX • [Bit(s)] Value: [3:0]0x2, Max. Inc/Cyc: 1, • Definition: Arbitration attempts killed in the HOM channel of the queue ARB that
violate ordering. HOM packets may be issued back to back through the ARBs, but if the first HOM was not chosen by the ARB, the second one will be killed due to order-ing rules. This event accounts for often this situation occurs in the queue ARB.
RETRY_BUF_READS
• Title: Retry Buffer Reads• Category: RIX • [Bit(s)] Value: [24]0x1, Max. Inc/Cyc: 1, • Definition: Number of flits sent from the retry buffer.
Table 5-42. Unit Masks for QUE_ARB_BID
ExtensionARB_PERF Bit Values
[6:4]Description
HOM b000 Home Messages
SNP b001 Snoop Messages
NDR b010 Non-Data Response Messages
NCS b011 Non-Coherent Standard Messages
DRS b100 Data Response Messages
NCB b101 Non-Coherent Bypass Messages
--- b110-b111 (*illegal selection*)
Table 5-43. Unit Masks for QUE_ARB_BID_FAIL
ExtensionARB_PERF Bit Values
[6:4]Description
HOM b000 Home Messages
SNP b001 Snoop Messages
NDR b010 Non-Data Response Messages
NCS b011 Non-Coherent Standard Messages
DRS b100 Data Response Messages
NCB b101 Non-Coherent Bypass Messages
--- b110-b111 (*illegal selection*)
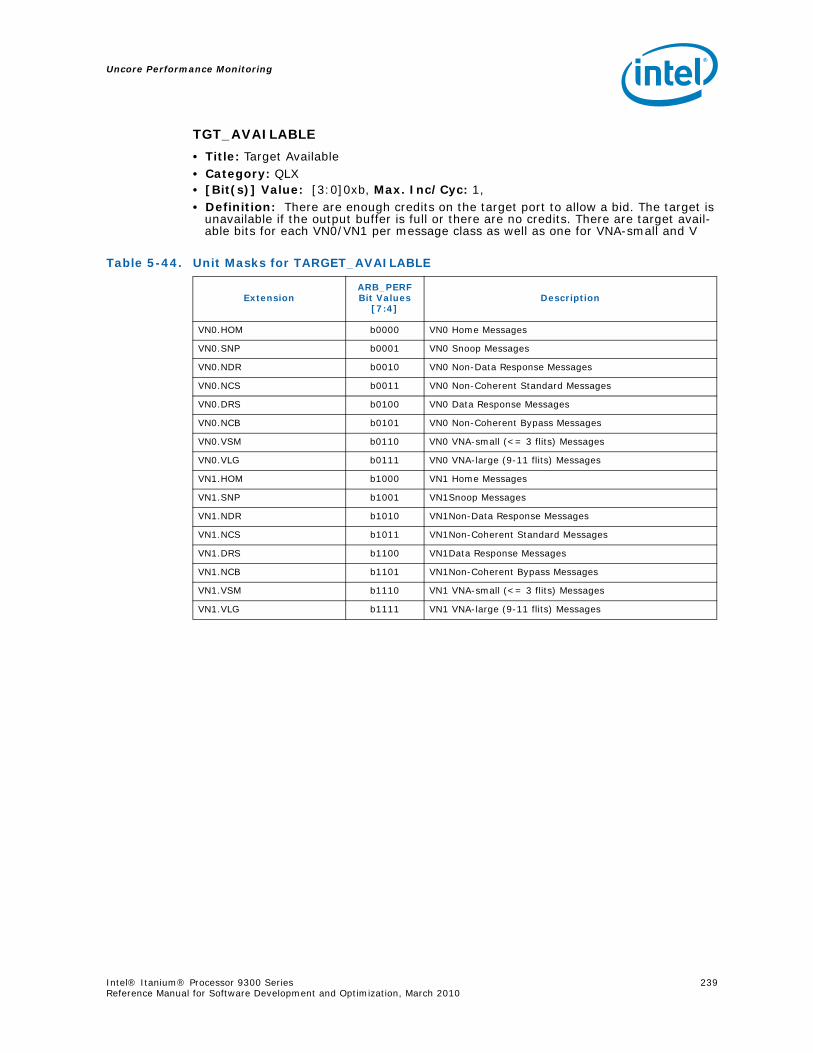
Uncore Performance Monitoring
Intel® Itanium® Processor 9300 Series 239Reference Manual for Software Development and Optimization, March 2010
TGT_AVAILABLE
• Title: Target Available• Category: QLX • [Bit(s)] Value: [3:0]0xb, Max. Inc/Cyc: 1, • Definition: There are enough credits on the target port to allow a bid. The target is
unavailable if the output buffer is full or there are no credits. There are target avail-able bits for each VN0/VN1 per message class as well as one for VNA-small and V
Table 5-44. Unit Masks for TARGET_AVAILABLE
ExtensionARB_PERF Bit Values
[7:4]Description
VN0.HOM b0000 VN0 Home Messages
VN0.SNP b0001 VN0 Snoop Messages
VN0.NDR b0010 VN0 Non-Data Response Messages
VN0.NCS b0011 VN0 Non-Coherent Standard Messages
VN0.DRS b0100 VN0 Data Response Messages
VN0.NCB b0101 VN0 Non-Coherent Bypass Messages
VN0.VSM b0110 VN0 VNA-small (<= 3 flits) Messages
VN0.VLG b0111 VN0 VNA-large (9-11 flits) Messages
VN1.HOM b1000 VN1 Home Messages
VN1.SNP b1001 VN1Snoop Messages
VN1.NDR b1010 VN1Non-Data Response Messages
VN1.NCS b1011 VN1Non-Coherent Standard Messages
VN1.DRS b1100 VN1Data Response Messages
VN1.NCB b1101 VN1Non-Coherent Bypass Messages
VN1.VSM b1110 VN1 VNA-small (<= 3 flits) Messages
VN1.VLG b1111 VN1 VNA-large (9-11 flits) Messages
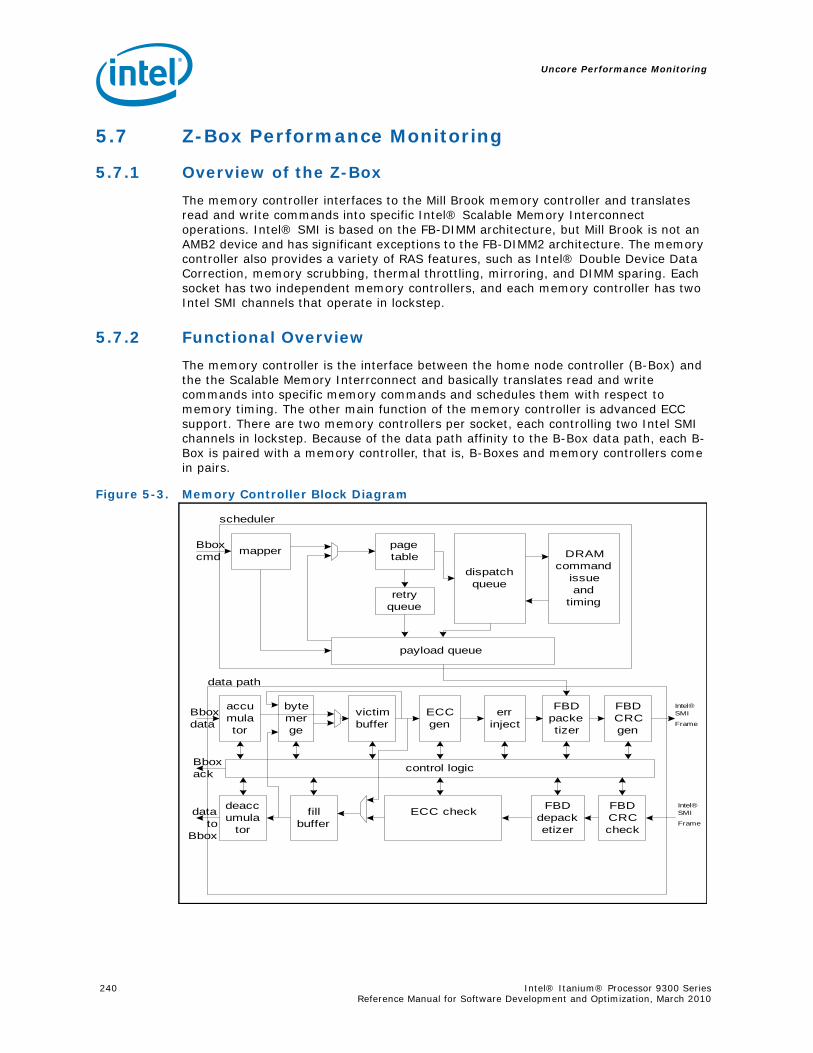
Uncore Performance Monitoring
240 Intel® Itanium® Processor 9300 Series Reference Manual for Software Development and Optimization, March 2010
5.7 Z-Box Performance Monitoring
5.7.1 Overview of the Z-Box
The memory controller interfaces to the Mill Brook memory controller and translates read and write commands into specific Intel® Scalable Memory Interconnect operations. Intel® SMI is based on the FB-DIMM architecture, but Mill Brook is not an AMB2 device and has significant exceptions to the FB-DIMM2 architecture. The memory controller also provides a variety of RAS features, such as Intel® Double Device Data Correction, memory scrubbing, thermal throttling, mirroring, and DIMM sparing. Each socket has two independent memory controllers, and each memory controller has two Intel SMI channels that operate in lockstep.
5.7.2 Functional Overview
The memory controller is the interface between the home node controller (B-Box) and the the Scalable Memory Interrconnect and basically translates read and write commands into specific memory commands and schedules them with respect to memory timing. The other main function of the memory controller is advanced ECC support. There are two memory controllers per socket, each controlling two Intel SMI channels in lockstep. Because of the data path affinity to the B-Box data path, each B-Box is paired with a memory controller, that is, B-Boxes and memory controllers come in pairs.
Figure 5-3. Memory Controller Block Diagram
mapper
dispatchqueue
page table DRAM
commandissueand
timingretry
queue
payload queue
accumulator
byte merge
victim buffer
ECC gen
FBD packetizer
FBD CRC gen
err inject
deaccumula
tor
fill buffer
FBD depacketizer
FBD CRC check
ECC check
control logic
scheduler
data path
Bbox cmd
Bbox ack
Bbox data
data to
Bbox
Intel® SMI
Frame
Intel® SMI
Frame
Uncore Performance Monitoring
Intel® Itanium® Processor 9300 Series 241Reference Manual for Software Development and Optimization, March 2010
The memory controller interfaces to the router through the B-Box (home node coherence controller) and to the P-Box pads. The P-Box pads connect to Intel SMI memory via a synchronizer (the J-Box). This enables memory controller (which runs at system interface frequency with the home node controller and router (B/R-Boxes)) to interface to various speeds of FB-DIMMs.
5.7.2.1 Mill Brook Memory Controller
The Intel® Itanium® processor 9300 series supports Mill Brook memory controllers on the Intel SMI channels.
• Intel® SMI protocol and signalling includes support for the following:
— 4.8 Gbs, 6.4 Gbs signalling
— forwarded clock fail-over NB and SB.
— 9 data lanes plus 1 CRC lane plus 1 spare lane SB.
— 12 data lanes plus 1 CRC lane plus 1 spare NB.
— Support for integrating RDIMM thermal sensor information into Intel® SMI Status Frame.
• No support for daisy chaining (Mill Brook is the only Intel® SMI device in the channel).
• No support for FB-DIMM1 protocol and signaling.
The Mill Brook memory controller provides an interface to DDR3 DIMMs and supports the following DDR3 functionality:
• DDR3 protocol and signalling, includes support for the following:
— Up to two RDIMMs per DDR3 bus
— Up to eight physical ranks per DDR3 bus (sixteen per Mill Brook)
— 800 MT/s or 1066 MT/s (both DDR3 buses must operate at the same frequency)
— Single Rank x4, Dual Rank x4, Single Rank x8, Dual Rank x8, Quad Rank x4, Quad Rank x8
— 1 GB, 2 GB, 4 GB, 8 GB, 16 GB DIMM
— DRAM device sizes: 1 Gb, 2 Gb
— Mixed DIMM types (no requirement that DIMMs must be the same type, except that all DIMMs attached to Mill Brook must run with a common frequency and core timings). (Host lockstep requirements may impose additional requirements on DIMMs on separate Intel® SMI channels).
— DDR buses may contain different number of DIMMs, zero through two. (Host lockstep requirements may impose additional requirements on DIMMs on separate Intel® SMI channels).
— Cmd/Addr parity generation and error logging.
• No support for non-ECC DIMMs
• No support for DDR2 protocol and signaling
• Support for integrating RDIMM thermal sensor information into Intel® SMI Status Frame.
See the RS - Mill Brook External Design Specification for more information.
Uncore Performance Monitoring
242 Intel® Itanium® Processor 9300 Series Reference Manual for Software Development and Optimization, March 2010
5.7.3 Z-Box Perfmon Overview
For performance monitoring, the Z-Box supports 5 incrementing counters, each existing across two registers to form a 40b wide counter. Each counter has a data register Z_CSR_PMU_CNT_{4-0}, which contains the upper 32 bits of the counter value, and a control register Z_CSR_PMU_CNT_CTL_{4-0} which also contains the lower 8 bits of the counter value. Although the lower 8 bits of the counter data share physical space with the control bits, it is possible to write any given value to the counter data bits without modifying any control bits in the same register. To do this, set cnt_lo_we (bit 23) to 1 while writing to the CTL register.
Although each of the Z_CSR_PMU_CNT* register can be configured to monitor any available event through its companion control register, a good chunk of the generic events defer configuration to various subcontrol registers (as detailed below). Since there are a limited number of control registers, software must pay attention to various restrictions as to what events may be counted simultaneously.
The count values of all 5 counters can be cleared by writing the Z_CSR_PMU_CNT_CTL_0.clr_all bit.
Each counter can be disabled for power dissipation reasons. The counters can be initialized to an arbitrary value through CSRs. Unlike other uncore PMUs, Z-Box PMU counters are capable of incrementing by up to 32 every cycle.
5.7.3.1 Choosing An Event To Monitor - Example using subcontrol registers
As has been stated, monitoring a particular event often requires configuring auxillary CSRs.
For instance, to count (in counter 0) the number of RAS DRAM commands (PLD_DRAM_EV.DRAM_CMD.RAS) that have been issued, set up is as follows:
Z_CSR_PMU_CNT_CTL_0.en [0] = 1
Z_ZSR_PMU_CNT_CTL_0.inc_sel [9:4] = 0xa
Z_CSR_PMU_PLD.cmd [0] = 0x0
Z_CSR_PMU_PLD.dram_cmd [12:8] = 0x2
To count (in counter 2) the number of Victim to Fill Buffer transfers from the B to the ZBox (FVC_EV*.BBOX_CMDS.V2F), set up is as follows:
Z_CSR_PMU_CNT_CTL_2.en [0] = 1
Z_CSR_PMU_CNT_CTL_0.inc_sel [9:4] = 0x0f
Z_CSR_PMU_ZDP_CTL_FVC.evnt3 [20:18] = 0x5 (User can chose between 4 different FVC events, here the 3rd slot was arbitrarily chosen.)
Z_CSR_PMU_ZDP_CTL_FVC.bcmd [8:5] = 0x3
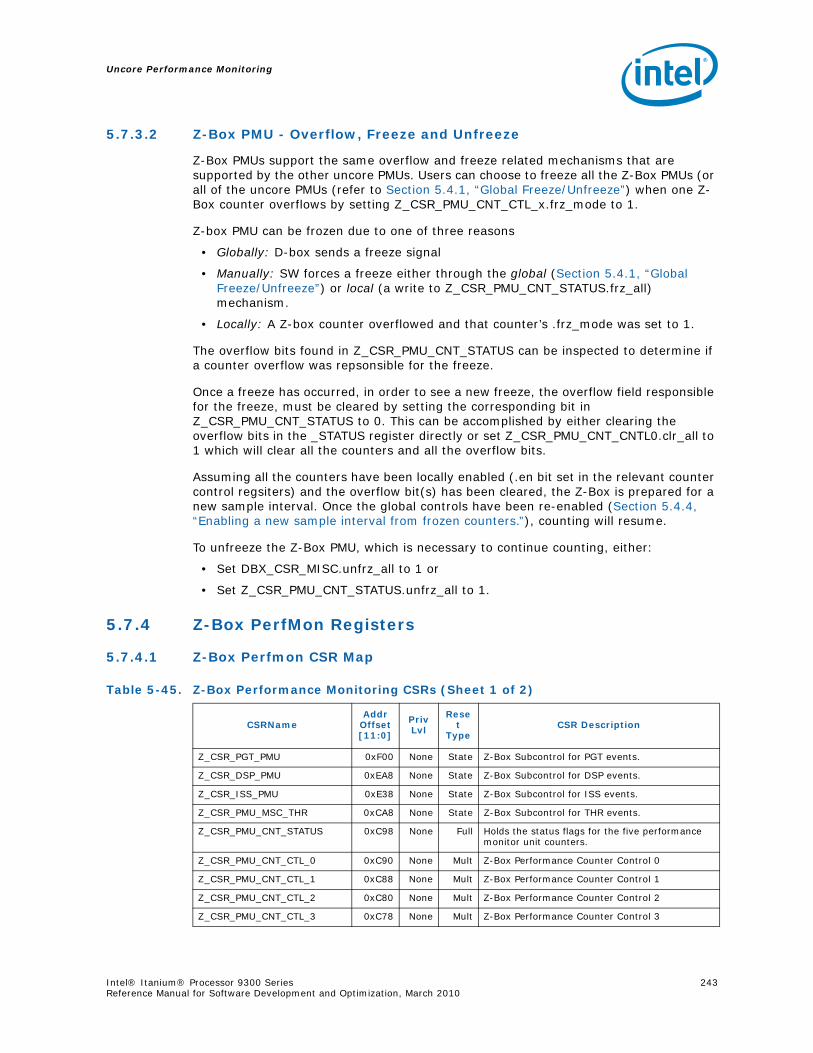
Uncore Performance Monitoring
Intel® Itanium® Processor 9300 Series 243Reference Manual for Software Development and Optimization, March 2010
5.7.3.2 Z-Box PMU - Overflow, Freeze and Unfreeze
Z-Box PMUs support the same overflow and freeze related mechanisms that are supported by the other uncore PMUs. Users can choose to freeze all the Z-Box PMUs (or all of the uncore PMUs (refer to Section 5.4.1, “Global Freeze/Unfreeze”) when one Z-Box counter overflows by setting Z_CSR_PMU_CNT_CTL_x.frz_mode to 1.
Z-box PMU can be frozen due to one of three reasons
• Globally: D-box sends a freeze signal
• Manually: SW forces a freeze either through the global (Section 5.4.1, “Global Freeze/Unfreeze”) or local (a write to Z_CSR_PMU_CNT_STATUS.frz_all) mechanism.
• Locally: A Z-box counter overflowed and that counter’s .frz_mode was set to 1.
The overflow bits found in Z_CSR_PMU_CNT_STATUS can be inspected to determine if a counter overflow was repsonsible for the freeze.
Once a freeze has occurred, in order to see a new freeze, the overflow field responsible for the freeze, must be cleared by setting the corresponding bit in Z_CSR_PMU_CNT_STATUS to 0. This can be accomplished by either clearing the overflow bits in the _STATUS register directly or set Z_CSR_PMU_CNT_CNTL0.clr_all to 1 which will clear all the counters and all the overflow bits.
Assuming all the counters have been locally enabled (.en bit set in the relevant counter control regsiters) and the overflow bit(s) has been cleared, the Z-Box is prepared for a new sample interval. Once the global controls have been re-enabled (Section 5.4.4, “Enabling a new sample interval from frozen counters.”), counting will resume.
To unfreeze the Z-Box PMU, which is necessary to continue counting, either:
• Set DBX_CSR_MISC.unfrz_all to 1 or
• Set Z_CSR_PMU_CNT_STATUS.unfrz_all to 1.
5.7.4 Z-Box PerfMon Registers
5.7.4.1 Z-Box Perfmon CSR Map
Table 5-45. Z-Box Performance Monitoring CSRs (Sheet 1 of 2)
CSRNameAddr
Offset [11:0]
Priv Lvl
Reset
TypeCSR Description
Z_CSR_PGT_PMU 0xF00 None State Z-Box Subcontrol for PGT events.
Z_CSR_DSP_PMU 0xEA8 None State Z-Box Subcontrol for DSP events.
Z_CSR_ISS_PMU 0xE38 None State Z-Box Subcontrol for ISS events.
Z_CSR_PMU_MSC_THR 0xCA8 None State Z-Box Subcontrol for THR events.
Z_CSR_PMU_CNT_STATUS 0xC98 None Full Holds the status flags for the five performance monitor unit counters.
Z_CSR_PMU_CNT_CTL_0 0xC90 None Mult Z-Box Performance Counter Control 0
Z_CSR_PMU_CNT_CTL_1 0xC88 None Mult Z-Box Performance Counter Control 1
Z_CSR_PMU_CNT_CTL_2 0xC80 None Mult Z-Box Performance Counter Control 2
Z_CSR_PMU_CNT_CTL_3 0xC78 None Mult Z-Box Performance Counter Control 3
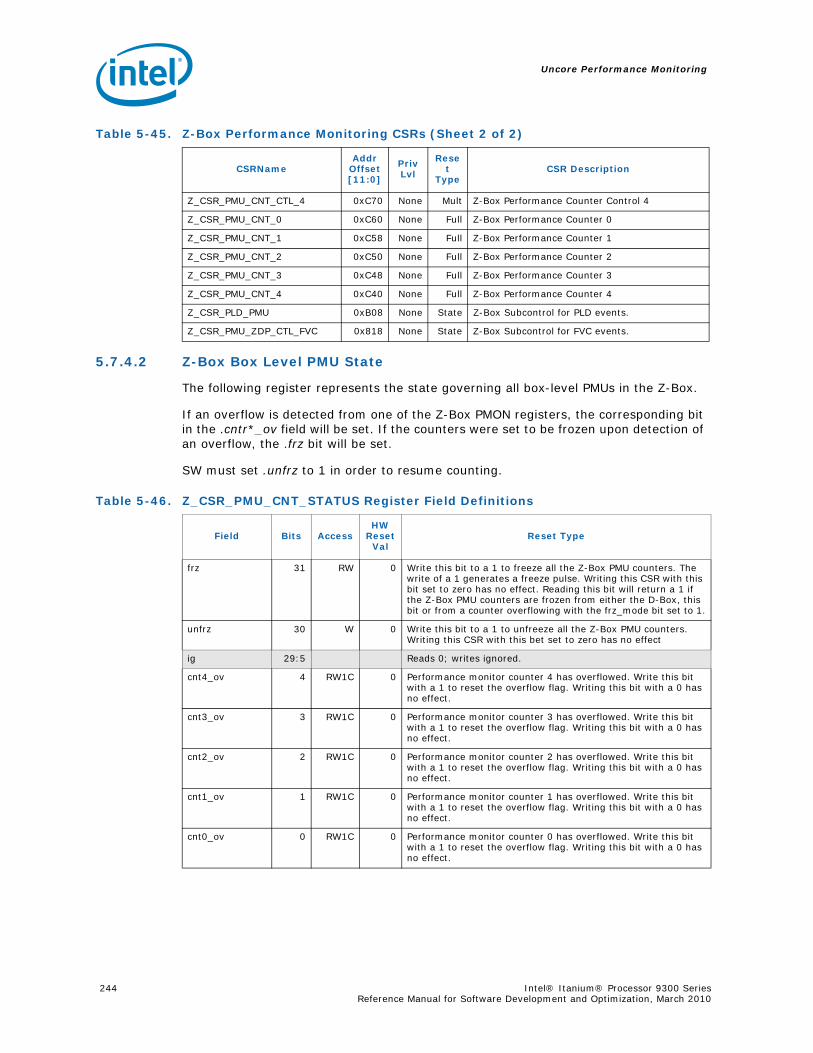
Uncore Performance Monitoring
244 Intel® Itanium® Processor 9300 Series Reference Manual for Software Development and Optimization, March 2010
5.7.4.2 Z-Box Box Level PMU State
The following register represents the state governing all box-level PMUs in the Z-Box.
If an overflow is detected from one of the Z-Box PMON registers, the corresponding bit in the .cntr*_ov field will be set. If the counters were set to be frozen upon detection of an overflow, the .frz bit will be set.
SW must set .unfrz to 1 in order to resume counting.
Z_CSR_PMU_CNT_CTL_4 0xC70 None Mult Z-Box Performance Counter Control 4
Z_CSR_PMU_CNT_0 0xC60 None Full Z-Box Performance Counter 0
Z_CSR_PMU_CNT_1 0xC58 None Full Z-Box Performance Counter 1
Z_CSR_PMU_CNT_2 0xC50 None Full Z-Box Performance Counter 2
Z_CSR_PMU_CNT_3 0xC48 None Full Z-Box Performance Counter 3
Z_CSR_PMU_CNT_4 0xC40 None Full Z-Box Performance Counter 4
Z_CSR_PLD_PMU 0xB08 None State Z-Box Subcontrol for PLD events.
Z_CSR_PMU_ZDP_CTL_FVC 0x818 None State Z-Box Subcontrol for FVC events.
Table 5-45. Z-Box Performance Monitoring CSRs (Sheet 2 of 2)
CSRNameAddr
Offset [11:0]
Priv Lvl
Reset
TypeCSR Description
Table 5-46. Z_CSR_PMU_CNT_STATUS Register Field Definitions
Field Bits AccessHW
Reset Val
Reset Type
frz 31 RW 0 Write this bit to a 1 to freeze all the Z-Box PMU counters. The write of a 1 generates a freeze pulse. Writing this CSR with this bit set to zero has no effect. Reading this bit will return a 1 if the Z-Box PMU counters are frozen from either the D-Box, this bit or from a counter overflowing with the frz_mode bit set to 1.
unfrz 30 W 0 Write this bit to a 1 to unfreeze all the Z-Box PMU counters. Writing this CSR with this bet set to zero has no effect
ig 29:5 Reads 0; writes ignored.
cnt4_ov 4 RW1C 0 Performance monitor counter 4 has overflowed. Write this bit with a 1 to reset the overflow flag. Writing this bit with a 0 has no effect.
cnt3_ov 3 RW1C 0 Performance monitor counter 3 has overflowed. Write this bit with a 1 to reset the overflow flag. Writing this bit with a 0 has no effect.
cnt2_ov 2 RW1C 0 Performance monitor counter 2 has overflowed. Write this bit with a 1 to reset the overflow flag. Writing this bit with a 0 has no effect.
cnt1_ov 1 RW1C 0 Performance monitor counter 1 has overflowed. Write this bit with a 1 to reset the overflow flag. Writing this bit with a 0 has no effect.
cnt0_ov 0 RW1C 0 Performance monitor counter 0 has overflowed. Write this bit with a 1 to reset the overflow flag. Writing this bit with a 0 has no effect.
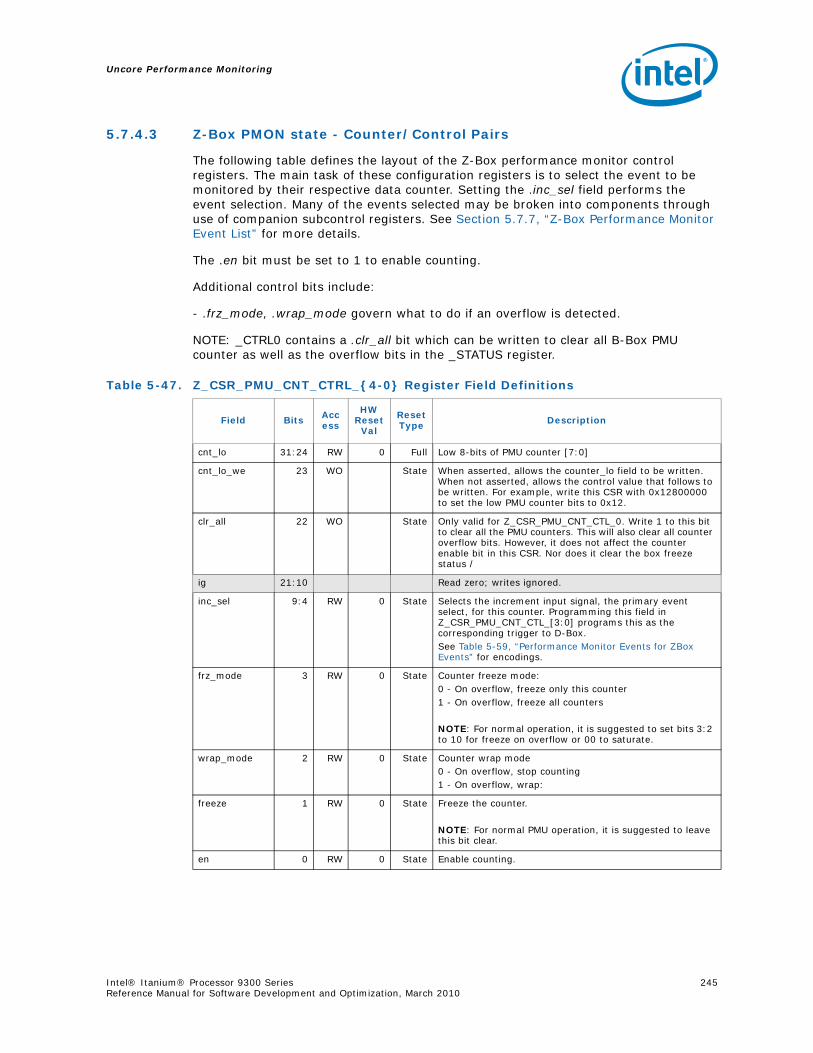
Uncore Performance Monitoring
Intel® Itanium® Processor 9300 Series 245Reference Manual for Software Development and Optimization, March 2010
5.7.4.3 Z-Box PMON state - Counter/Control Pairs
The following table defines the layout of the Z-Box performance monitor control registers. The main task of these configuration registers is to select the event to be monitored by their respective data counter. Setting the .inc_sel field performs the event selection. Many of the events selected may be broken into components through use of companion subcontrol registers. See Section 5.7.7, “Z-Box Performance Monitor Event List” for more details.
The .en bit must be set to 1 to enable counting.
Additional control bits include:
- .frz_mode, .wrap_mode govern what to do if an overflow is detected.
NOTE: _CTRL0 contains a .clr_all bit which can be written to clear all B-Box PMU counter as well as the overflow bits in the _STATUS register.
Table 5-47. Z_CSR_PMU_CNT_CTRL_{4-0} Register Field Definitions
Field Bits Access
HW Reset
Val
Reset Type Description
cnt_lo 31:24 RW 0 Full Low 8-bits of PMU counter [7:0]
cnt_lo_we 23 WO State When asserted, allows the counter_lo field to be written. When not asserted, allows the control value that follows to be written. For example, write this CSR with 0x12800000 to set the low PMU counter bits to 0x12.
clr_all 22 WO State Only valid for Z_CSR_PMU_CNT_CTL_0. Write 1 to this bit to clear all the PMU counters. This will also clear all counter overflow bits. However, it does not affect the counter enable bit in this CSR. Nor does it clear the box freeze status /
ig 21:10 Read zero; writes ignored.
inc_sel 9:4 RW 0 State Selects the increment input signal, the primary event select, for this counter. Programming this field in Z_CSR_PMU_CNT_CTL_[3:0] programs this as the corresponding trigger to D-Box. See Table 5-59, “Performance Monitor Events for ZBox Events” for encodings.
frz_mode 3 RW 0 State Counter freeze mode:0 - On overflow, freeze only this counter1 - On overflow, freeze all counters
NOTE: For normal operation, it is suggested to set bits 3:2 to 10 for freeze on overflow or 00 to saturate.
wrap_mode 2 RW 0 State Counter wrap mode0 - On overflow, stop counting1 - On overflow, wrap:
freeze 1 RW 0 State Freeze the counter.
NOTE: For normal PMU operation, it is suggested to leave this bit clear.
en 0 RW 0 State Enable counting.
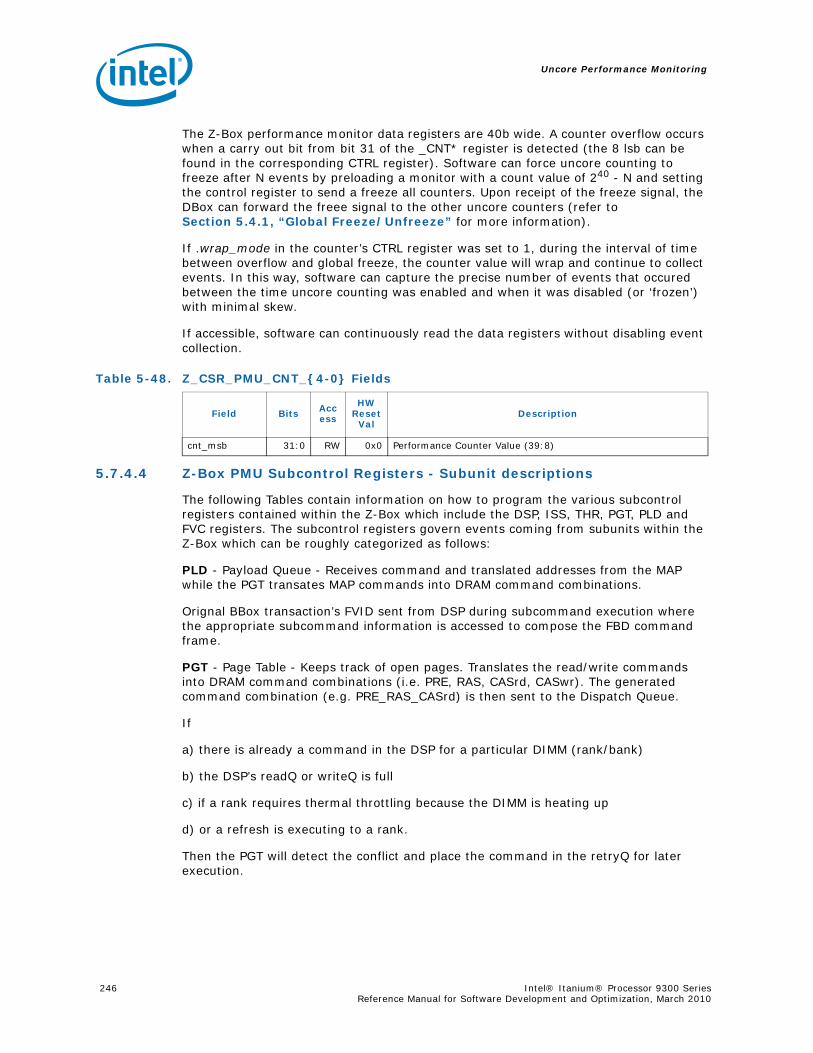
Uncore Performance Monitoring
246 Intel® Itanium® Processor 9300 Series Reference Manual for Software Development and Optimization, March 2010
The Z-Box performance monitor data registers are 40b wide. A counter overflow occurs when a carry out bit from bit 31 of the _CNT* register is detected (the 8 lsb can be found in the corresponding CTRL register). Software can force uncore counting to freeze after N events by preloading a monitor with a count value of 240 - N and setting the control register to send a freeze all counters. Upon receipt of the freeze signal, the DBox can forward the freee signal to the other uncore counters (refer to Section 5.4.1, “Global Freeze/Unfreeze” for more information).
If .wrap_mode in the counter’s CTRL register was set to 1, during the interval of time between overflow and global freeze, the counter value will wrap and continue to collect events. In this way, software can capture the precise number of events that occured between the time uncore counting was enabled and when it was disabled (or ‘frozen’) with minimal skew.
If accessible, software can continuously read the data registers without disabling event collection.
5.7.4.4 Z-Box PMU Subcontrol Registers - Subunit descriptions
The following Tables contain information on how to program the various subcontrol registers contained within the Z-Box which include the DSP, ISS, THR, PGT, PLD and FVC registers. The subcontrol registers govern events coming from subunits within the Z-Box which can be roughly categorized as follows:
PLD - Payload Queue - Receives command and translated addresses from the MAP while the PGT transates MAP commands into DRAM command combinations.
Orignal BBox transaction’s FVID sent from DSP during subcommand execution where the appropriate subcommand information is accessed to compose the FBD command frame.
PGT - Page Table - Keeps track of open pages. Translates the read/write commands into DRAM command combinations (i.e. PRE, RAS, CASrd, CASwr). The generated command combination (e.g. PRE_RAS_CASrd) is then sent to the Dispatch Queue.
If
a) there is already a command in the DSP for a particular DIMM (rank/bank)
b) the DSP’s readQ or writeQ is full
c) if a rank requires thermal throttling because the DIMM is heating up
d) or a refresh is executing to a rank.
Then the PGT will detect the conflict and place the command in the retryQ for later execution.
Table 5-48. Z_CSR_PMU_CNT_{4-0} Fields
Field Bits Access
HW Reset
ValDescription
cnt_msb 31:0 RW 0x0 Performance Counter Value (39:8)
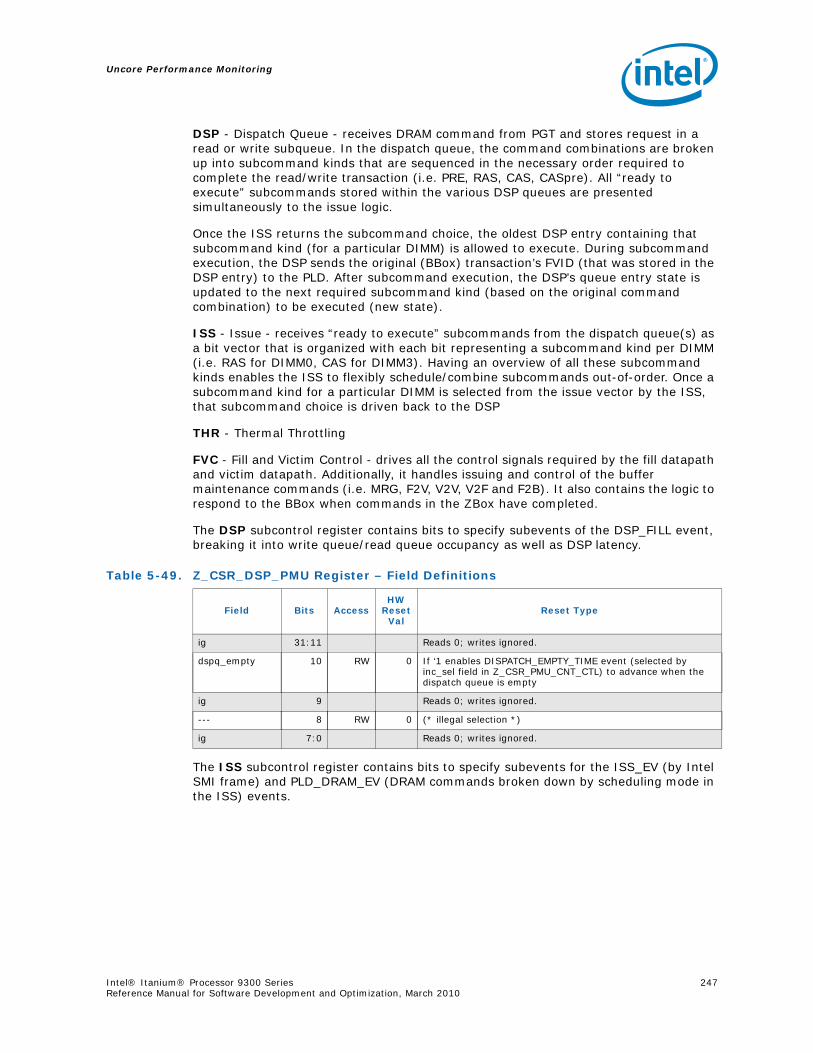
Uncore Performance Monitoring
Intel® Itanium® Processor 9300 Series 247Reference Manual for Software Development and Optimization, March 2010
DSP - Dispatch Queue - receives DRAM command from PGT and stores request in a read or write subqueue. In the dispatch queue, the command combinations are broken up into subcommand kinds that are sequenced in the necessary order required to complete the read/write transaction (i.e. PRE, RAS, CAS, CASpre). All “ready to execute” subcommands stored within the various DSP queues are presented simultaneously to the issue logic.
Once the ISS returns the subcommand choice, the oldest DSP entry containing that subcommand kind (for a particular DIMM) is allowed to execute. During subcommand execution, the DSP sends the original (BBox) transaction’s FVID (that was stored in the DSP entry) to the PLD. After subcommand execution, the DSP’s queue entry state is updated to the next required subcommand kind (based on the original command combination) to be executed (new state).
ISS - Issue - receives “ready to execute” subcommands from the dispatch queue(s) as a bit vector that is organized with each bit representing a subcommand kind per DIMM (i.e. RAS for DIMM0, CAS for DIMM3). Having an overview of all these subcommand kinds enables the ISS to flexibly schedule/combine subcommands out-of-order. Once a subcommand kind for a particular DIMM is selected from the issue vector by the ISS, that subcommand choice is driven back to the DSP
THR - Thermal Throttling
FVC - Fill and Victim Control - drives all the control signals required by the fill datapath and victim datapath. Additionally, it handles issuing and control of the buffer maintenance commands (i.e. MRG, F2V, V2V, V2F and F2B). It also contains the logic to respond to the BBox when commands in the ZBox have completed.
The DSP subcontrol register contains bits to specify subevents of the DSP_FILL event, breaking it into write queue/read queue occupancy as well as DSP latency.
The ISS subcontrol register contains bits to specify subevents for the ISS_EV (by Intel SMI frame) and PLD_DRAM_EV (DRAM commands broken down by scheduling mode in the ISS) events.
Table 5-49. Z_CSR_DSP_PMU Register – Field Definitions
Field Bits AccessHW
Reset Val
Reset Type
ig 31:11 Reads 0; writes ignored.
dspq_empty 10 RW 0 If ‘1 enables DISPATCH_EMPTY_TIME event (selected by inc_sel field in Z_CSR_PMU_CNT_CTL) to advance when the dispatch queue is empty
ig 9 Reads 0; writes ignored.
--- 8 RW 0 (* illegal selection *)
ig 7:0 Reads 0; writes ignored.
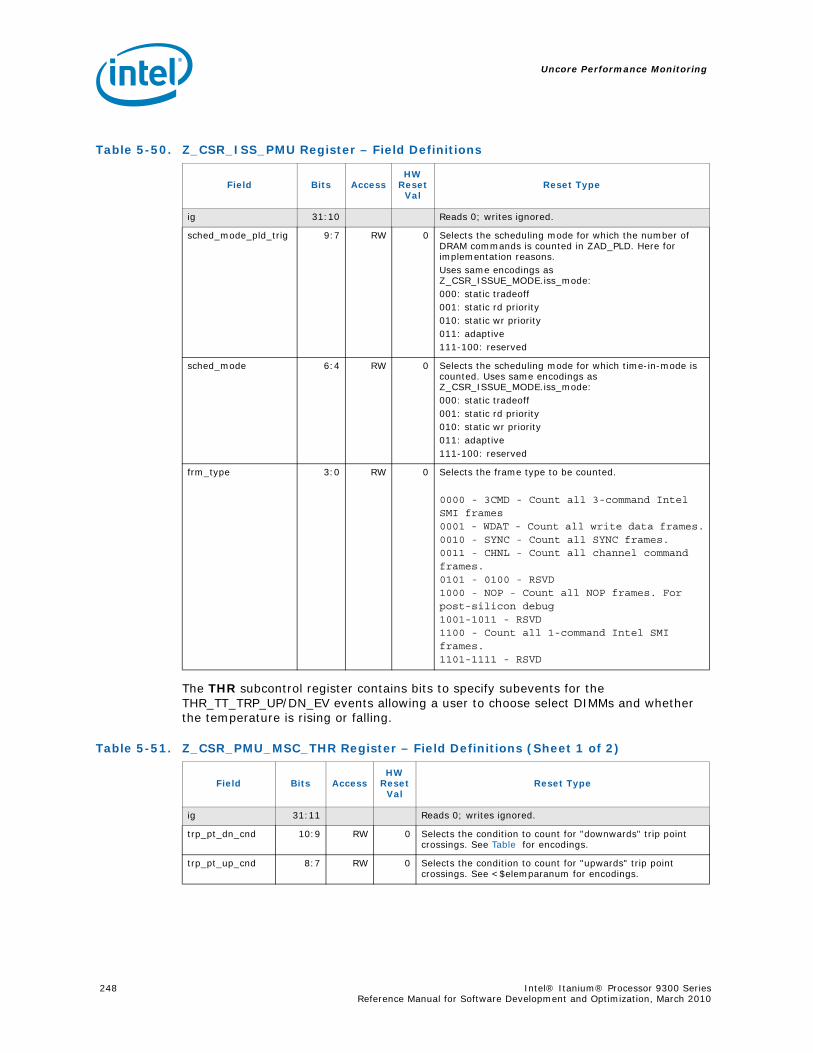
Uncore Performance Monitoring
248 Intel® Itanium® Processor 9300 Series Reference Manual for Software Development and Optimization, March 2010
The THR subcontrol register contains bits to specify subevents for the THR_TT_TRP_UP/DN_EV events allowing a user to choose select DIMMs and whether the temperature is rising or falling.
Table 5-50. Z_CSR_ISS_PMU Register – Field Definitions
Field Bits AccessHW
Reset Val
Reset Type
ig 31:10 Reads 0; writes ignored.
sched_mode_pld_trig 9:7 RW 0 Selects the scheduling mode for which the number of DRAM commands is counted in ZAD_PLD. Here for implementation reasons. Uses same encodings as Z_CSR_ISSUE_MODE.iss_mode:000: static tradeoff001: static rd priority010: static wr priority011: adaptive111-100: reserved
sched_mode 6:4 RW 0 Selects the scheduling mode for which time-in-mode is counted. Uses same encodings as Z_CSR_ISSUE_MODE.iss_mode:000: static tradeoff001: static rd priority010: static wr priority011: adaptive111-100: reserved
frm_type 3:0 RW 0 Selects the frame type to be counted.
0000 - 3CMD - Count all 3-command Intel SMI frames0001 - WDAT - Count all write data frames.0010 - SYNC - Count all SYNC frames.0011 - CHNL - Count all channel command frames.0101 - 0100 - RSVD1000 - NOP - Count all NOP frames. For post-silicon debug1001-1011 - RSVD1100 - Count all 1-command Intel SMI frames.1101-1111 - RSVD
Table 5-51. Z_CSR_PMU_MSC_THR Register – Field Definitions (Sheet 1 of 2)
Field Bits AccessHW
Reset Val
Reset Type
ig 31:11 Reads 0; writes ignored.
trp_pt_dn_cnd 10:9 RW 0 Selects the condition to count for "downwards" trip point crossings. See Table for encodings.
trp_pt_up_cnd 8:7 RW 0 Selects the condition to count for "upwards" trip point crossings. See <$elemparanum for encodings.
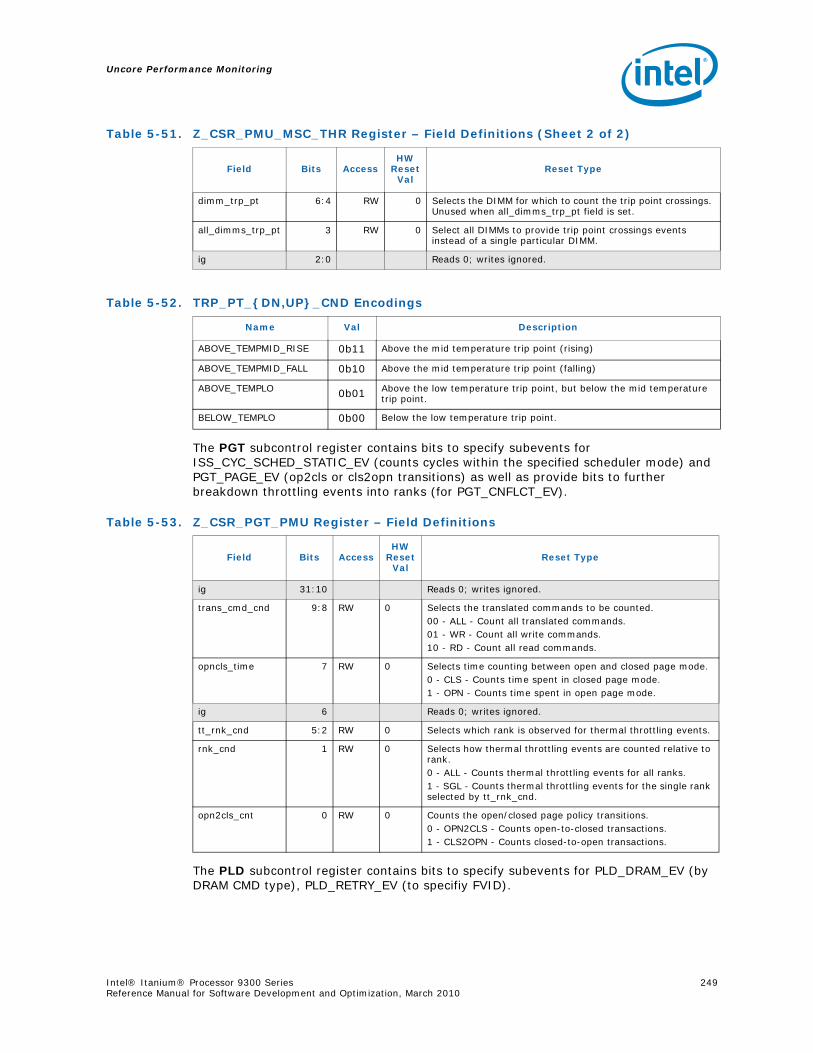
Uncore Performance Monitoring
Intel® Itanium® Processor 9300 Series 249Reference Manual for Software Development and Optimization, March 2010
The PGT subcontrol register contains bits to specify subevents for ISS_CYC_SCHED_STATIC_EV (counts cycles within the specified scheduler mode) and PGT_PAGE_EV (op2cls or cls2opn transitions) as well as provide bits to further breakdown throttling events into ranks (for PGT_CNFLCT_EV).
The PLD subcontrol register contains bits to specify subevents for PLD_DRAM_EV (by DRAM CMD type), PLD_RETRY_EV (to specifiy FVID).
dimm_trp_pt 6:4 RW 0 Selects the DIMM for which to count the trip point crossings. Unused when all_dimms_trp_pt field is set.
all_dimms_trp_pt 3 RW 0 Select all DIMMs to provide trip point crossings events instead of a single particular DIMM.
ig 2:0 Reads 0; writes ignored.
Table 5-52. TRP_PT_{DN,UP}_CND Encodings
Name Val Description
ABOVE_TEMPMID_RISE 0b11 Above the mid temperature trip point (rising)
ABOVE_TEMPMID_FALL 0b10 Above the mid temperature trip point (falling)
ABOVE_TEMPLO 0b01 Above the low temperature trip point, but below the mid temperature trip point.
BELOW_TEMPLO 0b00 Below the low temperature trip point.
Table 5-51. Z_CSR_PMU_MSC_THR Register – Field Definitions (Sheet 2 of 2)
Field Bits AccessHW
Reset Val
Reset Type
Table 5-53. Z_CSR_PGT_PMU Register – Field Definitions
Field Bits AccessHW
Reset Val
Reset Type
ig 31:10 Reads 0; writes ignored.
trans_cmd_cnd 9:8 RW 0 Selects the translated commands to be counted.00 - ALL - Count all translated commands.01 - WR - Count all write commands.10 - RD - Count all read commands.
opncls_time 7 RW 0 Selects time counting between open and closed page mode.0 - CLS - Counts time spent in closed page mode.1 - OPN - Counts time spent in open page mode.
ig 6 Reads 0; writes ignored.
tt_rnk_cnd 5:2 RW 0 Selects which rank is observed for thermal throttling events.
rnk_cnd 1 RW 0 Selects how thermal throttling events are counted relative to rank.0 - ALL - Counts thermal throttling events for all ranks.1 - SGL - Counts thermal throttling events for the single rank selected by tt_rnk_cnd.
opn2cls_cnt 0 RW 0 Counts the open/closed page policy transitions.0 - OPN2CLS - Counts open-to-closed transactions.1 - CLS2OPN - Counts closed-to-open transactions.

Uncore Performance Monitoring
250 Intel® Itanium® Processor 9300 Series Reference Manual for Software Development and Optimization, March 2010
The FVC subcontrol register contains bits to break the FVC_EV into events observed by the Fill and Victim Control logic (i.e. BBOX commands, BBOX responses, various error conditions, etc). The FVC register can be set up to monitor four independent FVC-subevents simultaneously. However, many of the FVC-subevents depend on additional FVC fields which detail BBox response and commands. Therefore, only one BBox response or command may be monitored at any one time.
Table 5-54. Z_CSR_PLD_PMU Register – Field Definitions
Field Bits AccessHW
Reset Val
Reset Type
ig 31:14 Reads 0; writes ignored.
addr_match1 13 RW 0 Qualify trigger with address match as specified by Z_CSR_INJ_ERR_ADDR_1. Z_CSR_INJ_ERR_CTL_1.match_* and Z_CSR_INJ_ERR_CTL_1.inj_err_* fields control the match condition.
dram_cmd 12:8 RW 0 The DRAM command type to be counted.0x00 NOP0x01 Precharge Single0x02 RAS0x04 CAS Read (no auto-precharge) (open page mode)0x08 Refresh0x09 Precharge All0x0c CAS read/precharge (closed page mode)0x10 Write Trickle0x11 SYNC0x14 CAS write (no auto-precharge) (open page mode)0x16 Write command register0x17 Read command register0x18 ZQCAL command0x1c CAS write/precharge (closed page mode)
rtry_sngl_fvid 7 RW 0 Controls FVID (Fill Victim Index) selection for which the number of retries is to be counted.0 - ALL - All retries are counted, regardless of FVID1 - FVID - Counts only the retries whose FVIDs match this CSR’s fvid field.
fvid 6:1 RW 0 The FVID for which the number of retries is to be counted.
cmd 0 RW 0 Qualifies the DRAM commands counted by Z_CSR_ISS_PMU.sched_mode. Z_CSR_PLD_PMU.dram_cmd always needs to be matched and has no enable bit.0 - ALL - Count all DRAM commands.1 - SCHED - Count only the DRAM commands that come in while the ZAD_ISS section is in the scheduling mode selected by Z_CSR_ISS_PMU.sched_mode_pld_trig.
Table 5-55. Z_CSR_PMU_ZDP_CTL_FVC Register – Field Definitions (Sheet 1 of 2)
Field Bits AccessHW
Reset Val
HW Reset
ValReset Type
Reserved 31:24 —
evnt3 23:21 RW 0 0 FVC subevent 3 selection. See Table , “”
evnt2 20:18 RW 0 0 FVC subevent 2 selection. See Table , “”
evnt1 17:15 RW 0 0 FVC subevent 1 selection. See Table , “”
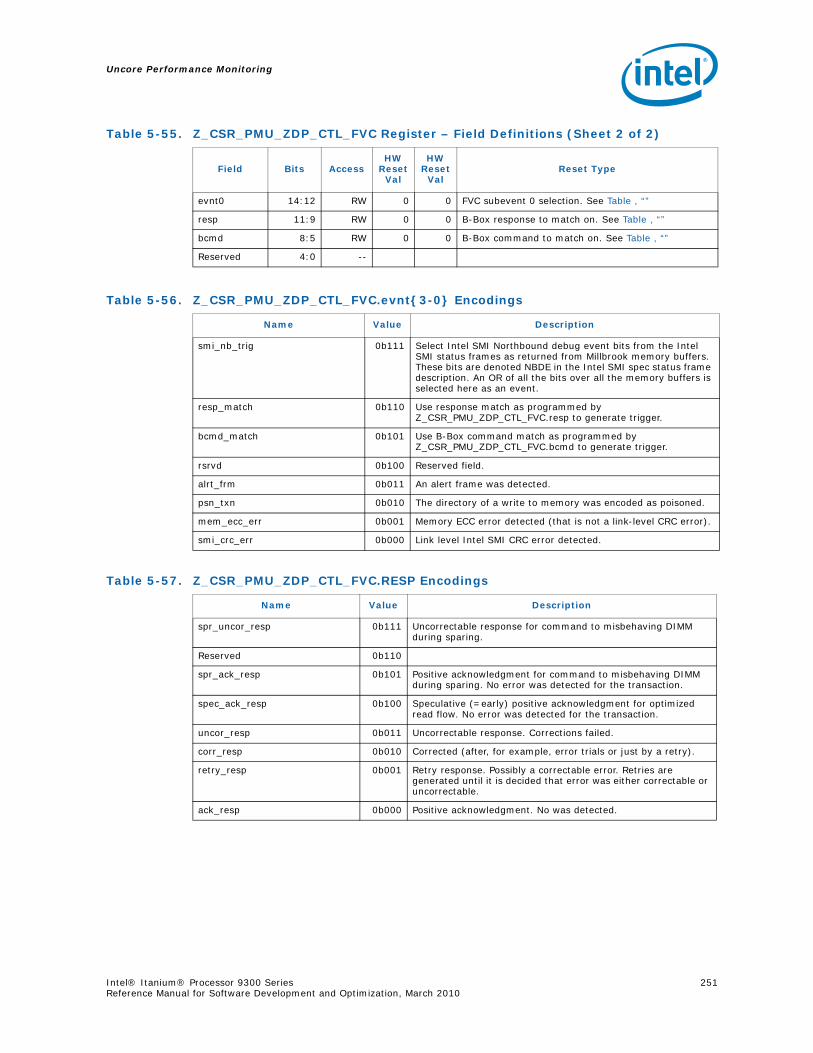
Uncore Performance Monitoring
Intel® Itanium® Processor 9300 Series 251Reference Manual for Software Development and Optimization, March 2010
evnt0 14:12 RW 0 0 FVC subevent 0 selection. See Table , “”
resp 11:9 RW 0 0 B-Box response to match on. See Table , “”
bcmd 8:5 RW 0 0 B-Box command to match on. See Table , “”
Reserved 4:0 --
Table 5-56. Z_CSR_PMU_ZDP_CTL_FVC.evnt{3-0} Encodings
Name Value Description
smi_nb_trig 0b111 Select Intel SMI Northbound debug event bits from the Intel SMI status frames as returned from Millbrook memory buffers. These bits are denoted NBDE in the Intel SMI spec status frame description. An OR of all the bits over all the memory buffers is selected here as an event.
resp_match 0b110 Use response match as programmed by Z_CSR_PMU_ZDP_CTL_FVC.resp to generate trigger.
bcmd_match 0b101 Use B-Box command match as programmed by Z_CSR_PMU_ZDP_CTL_FVC.bcmd to generate trigger.
rsrvd 0b100 Reserved field.
alrt_frm 0b011 An alert frame was detected.
psn_txn 0b010 The directory of a write to memory was encoded as poisoned.
mem_ecc_err 0b001 Memory ECC error detected (that is not a link-level CRC error).
smi_crc_err 0b000 Link level Intel SMI CRC error detected.
Table 5-57. Z_CSR_PMU_ZDP_CTL_FVC.RESP Encodings
Name Value Description
spr_uncor_resp 0b111 Uncorrectable response for command to misbehaving DIMM during sparing.
Reserved 0b110
spr_ack_resp 0b101 Positive acknowledgment for command to misbehaving DIMM during sparing. No error was detected for the transaction.
spec_ack_resp 0b100 Speculative (=early) positive acknowledgment for optimized read flow. No error was detected for the transaction.
uncor_resp 0b011 Uncorrectable response. Corrections failed.
corr_resp 0b010 Corrected (after, for example, error trials or just by a retry).
retry_resp 0b001 Retry response. Possibly a correctable error. Retries are generated until it is decided that error was either correctable or uncorrectable.
ack_resp 0b000 Positive acknowledgment. No was detected.
Table 5-55. Z_CSR_PMU_ZDP_CTL_FVC Register – Field Definitions (Sheet 2 of 2)
Field Bits AccessHW
Reset Val
HW Reset
ValReset Type
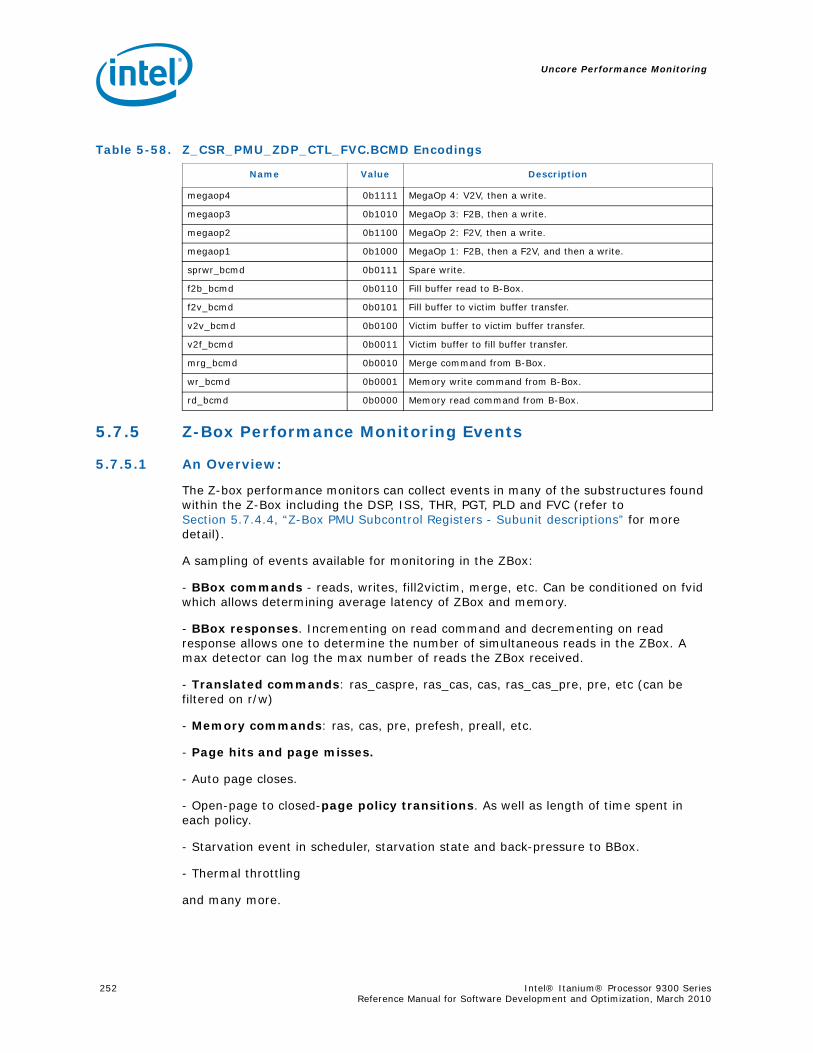
Uncore Performance Monitoring
252 Intel® Itanium® Processor 9300 Series Reference Manual for Software Development and Optimization, March 2010
5.7.5 Z-Box Performance Monitoring Events
5.7.5.1 An Overview:
The Z-box performance monitors can collect events in many of the substructures found within the Z-Box including the DSP, ISS, THR, PGT, PLD and FVC (refer to Section 5.7.4.4, “Z-Box PMU Subcontrol Registers - Subunit descriptions” for more detail).
A sampling of events available for monitoring in the ZBox:
- BBox commands - reads, writes, fill2victim, merge, etc. Can be conditioned on fvid which allows determining average latency of ZBox and memory.
- BBox responses. Incrementing on read command and decrementing on read response allows one to determine the number of simultaneous reads in the ZBox. A max detector can log the max number of reads the ZBox received.
- Translated commands: ras_caspre, ras_cas, cas, ras_cas_pre, pre, etc (can be filtered on r/w)
- Memory commands: ras, cas, pre, prefesh, preall, etc.
- Page hits and page misses.
- Auto page closes.
- Open-page to closed-page policy transitions. As well as length of time spent in each policy.
- Starvation event in scheduler, starvation state and back-pressure to BBox.
- Thermal throttling
and many more.
Table 5-58. Z_CSR_PMU_ZDP_CTL_FVC.BCMD Encodings
Name Value Description
megaop4 0b1111 MegaOp 4: V2V, then a write.
megaop3 0b1010 MegaOp 3: F2B, then a write.
megaop2 0b1100 MegaOp 2: F2V, then a write.
megaop1 0b1000 MegaOp 1: F2B, then a F2V, and then a write.
sprwr_bcmd 0b0111 Spare write.
f2b_bcmd 0b0110 Fill buffer read to B-Box.
f2v_bcmd 0b0101 Fill buffer to victim buffer transfer.
v2v_bcmd 0b0100 Victim buffer to victim buffer transfer.
v2f_bcmd 0b0011 Victim buffer to fill buffer transfer.
mrg_bcmd 0b0010 Merge command from B-Box.
wr_bcmd 0b0001 Memory write command from B-Box.
rd_bcmd 0b0000 Memory read command from B-Box.

Uncore Performance Monitoring
Intel® Itanium® Processor 9300 Series 253Reference Manual for Software Development and Optimization, March 2010
5.7.6 ZBox Events Ordered By Code
Table 5-59 summarizes the directly-measured ZBox events.
Table 5-59. Performance Monitor Events for ZBox Events (Sheet 1 of 2)
Symbol Name CNT_CTLx[9:4]
SubCtl Dep
Max Inc/Cyc Description
CYC_ZFULL 0x01 1 Z-Box Full Cycles
RETRY_ZFULL 0x02 1 Retry ZFull
RETRY_STARVE 0x03 1 Retry Starve
THR_TT_TRP_UP_EV 0x04 THR 1 THR UP Related Events
THR_TT_TRP_DN_EV 0x05 THR 1 THR DOWN Related Events
REFRESH 0x06 1 Refresh Commands
REFRESH_CNFLT 0x07 1 Refresh Conflict
SCHED_MODE_CHANGES 0x08 1 Scheduling Mode Changes
ISS_EV 0x09 ISS 1 ISS Related Events
PLD_DRAM_EV 0x0a PLD,ISS 1 PLD Related DRAM Events
PLD_RETRY_EV 0x0b PLD 1 PLD Related Retry Events
SMI_FAST_RESETS 0x0c 1 Fast Resets
FVC_EV0 0x0d FVC 1 FVC Event 0
FVC_EV1 0x0e FVC 1 FVC Event 1
FVC_EV2 0x0f FVC 1 FVC Event 2
FVC_EV3 0x10 FVC 1 FVC Event 3
PGT_CYC_EV 0x11 PGT 1 PGT Related Cycles Events
PGT_DISPQ_EV 0x12 PGT 1 PGT Related DISPQ Events
PAGE_MISS 0x13 1 Page Table Misses
PAGE_HITS 0x14 1 Page Table Hits
PAGE_AUTOCLS_CMD 0x15 1 Page Table Autoclose Commands
PGT_PAGE_EV 0x16 PGT 1 PGT Related Page Table Events
PAGE_COLLISION 0x18 1 Refresh Commands
PGT_CNFLCT_EV 0x19 PGT 1 PGT Related Conflict Events
BBOX_CMDS_ALL 0x1a 1 All B-Box Commands
CYCLES 0x1b 1 Z-Box Cycles
SCHED_INFLIGHT_CMDS 0x1c 1 Scheduler In-flight Commands
INFLIGHT_CMDS 0x1d 1 In-flight Commands
DISPQ_CYC 0x20 DSP 1 Dispatch Queue Cycle Count
RETRY_OPS 0x22 1 Retry Ops
CYC_RETRYQ_BADLYSTARVED 0x23 1 Badly Starved RetryQ Cycles
ISS_CYC_SCHED_STATIC_EV 0x24 PGT 1 ISS Static Scheduler Cycles
CYC_RETRYQ_BADLYSTARVED 0x23 1 Badly Starved RetryQ Cycles
DISPQ_RD_CNT 0x38 1 Dispatch Queue Read Count
FVID_FIFO_COUNT 0x39 1 FVID FIFO Count
FVID_FIFO_WRITES 0x3A 1 FVID FIFO Writes
LIVE_OPS_INFLIGHT 0x3B 1 Live Ops In-flight
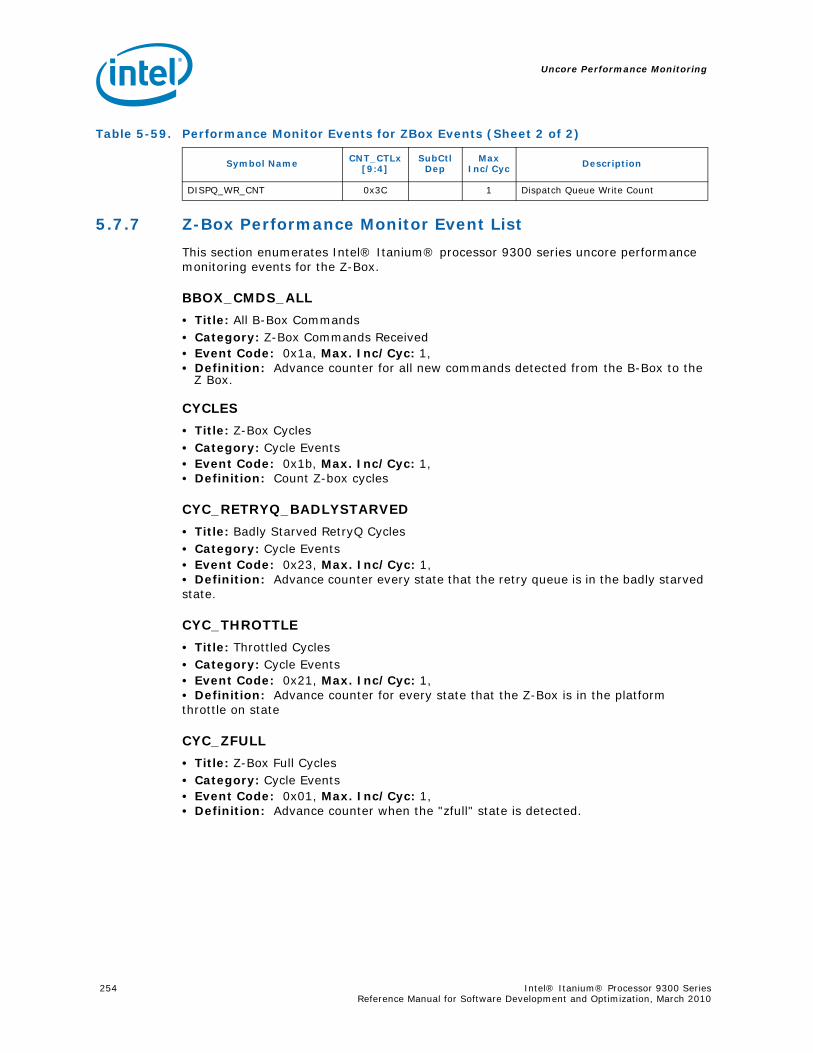
Uncore Performance Monitoring
254 Intel® Itanium® Processor 9300 Series Reference Manual for Software Development and Optimization, March 2010
5.7.7 Z-Box Performance Monitor Event List
This section enumerates Intel® Itanium® processor 9300 series uncore performance monitoring events for the Z-Box.
BBOX_CMDS_ALL
• Title: All B-Box Commands• Category: Z-Box Commands Received • Event Code: 0x1a, Max. Inc/Cyc: 1, • Definition: Advance counter for all new commands detected from the B-Box to the
Z Box.
CYCLES
• Title: Z-Box Cycles• Category: Cycle Events • Event Code: 0x1b, Max. Inc/Cyc: 1, • Definition: Count Z-box cycles
CYC_RETRYQ_BADLYSTARVED
• Title: Badly Starved RetryQ Cycles• Category: Cycle Events • Event Code: 0x23, Max. Inc/Cyc: 1, • Definition: Advance counter every state that the retry queue is in the badly starved state.
CYC_THROTTLE
• Title: Throttled Cycles• Category: Cycle Events • Event Code: 0x21, Max. Inc/Cyc: 1, • Definition: Advance counter for every state that the Z-Box is in the platform throttle on state
CYC_ZFULL
• Title: Z-Box Full Cycles• Category: Cycle Events • Event Code: 0x01, Max. Inc/Cyc: 1, • Definition: Advance counter when the "zfull" state is detected.
DISPQ_WR_CNT 0x3C 1 Dispatch Queue Write Count
Table 5-59. Performance Monitor Events for ZBox Events (Sheet 2 of 2)
Symbol Name CNT_CTLx[9:4]
SubCtl Dep
Max Inc/Cyc Description
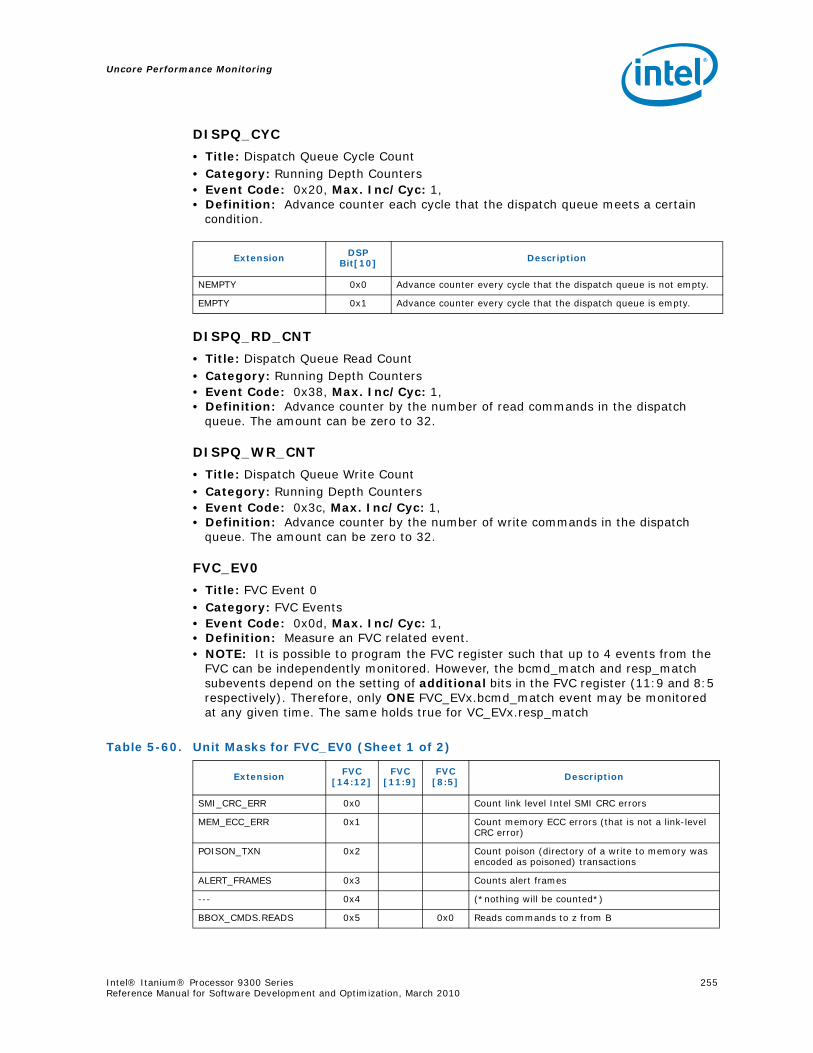
Uncore Performance Monitoring
Intel® Itanium® Processor 9300 Series 255Reference Manual for Software Development and Optimization, March 2010
DISPQ_CYC
• Title: Dispatch Queue Cycle Count• Category: Running Depth Counters • Event Code: 0x20, Max. Inc/Cyc: 1, • Definition: Advance counter each cycle that the dispatch queue meets a certain
condition.
DISPQ_RD_CNT
• Title: Dispatch Queue Read Count• Category: Running Depth Counters • Event Code: 0x38, Max. Inc/Cyc: 1, • Definition: Advance counter by the number of read commands in the dispatch
queue. The amount can be zero to 32.
DISPQ_WR_CNT
• Title: Dispatch Queue Write Count• Category: Running Depth Counters • Event Code: 0x3c, Max. Inc/Cyc: 1, • Definition: Advance counter by the number of write commands in the dispatch
queue. The amount can be zero to 32.
FVC_EV0
• Title: FVC Event 0• Category: FVC Events • Event Code: 0x0d, Max. Inc/Cyc: 1, • Definition: Measure an FVC related event.• NOTE: It is possible to program the FVC register such that up to 4 events from the
FVC can be independently monitored. However, the bcmd_match and resp_match subevents depend on the setting of additional bits in the FVC register (11:9 and 8:5 respectively). Therefore, only ONE FVC_EVx.bcmd_match event may be monitored at any given time. The same holds true for VC_EVx.resp_match
Extension DSP Bit[10] Description
NEMPTY 0x0 Advance counter every cycle that the dispatch queue is not empty.
EMPTY 0x1 Advance counter every cycle that the dispatch queue is empty.
Table 5-60. Unit Masks for FVC_EV0 (Sheet 1 of 2)
Extension FVC[14:12]
FVC[11:9]
FVC[8:5] Description
SMI_CRC_ERR 0x0 Count link level Intel SMI CRC errors
MEM_ECC_ERR 0x1 Count memory ECC errors (that is not a link-level CRC error)
POISON_TXN 0x2 Count poison (directory of a write to memory was encoded as poisoned) transactions
ALERT_FRAMES 0x3 Counts alert frames
--- 0x4 (*nothing will be counted*)
BBOX_CMDS.READS 0x5 0x0 Reads commands to z from B
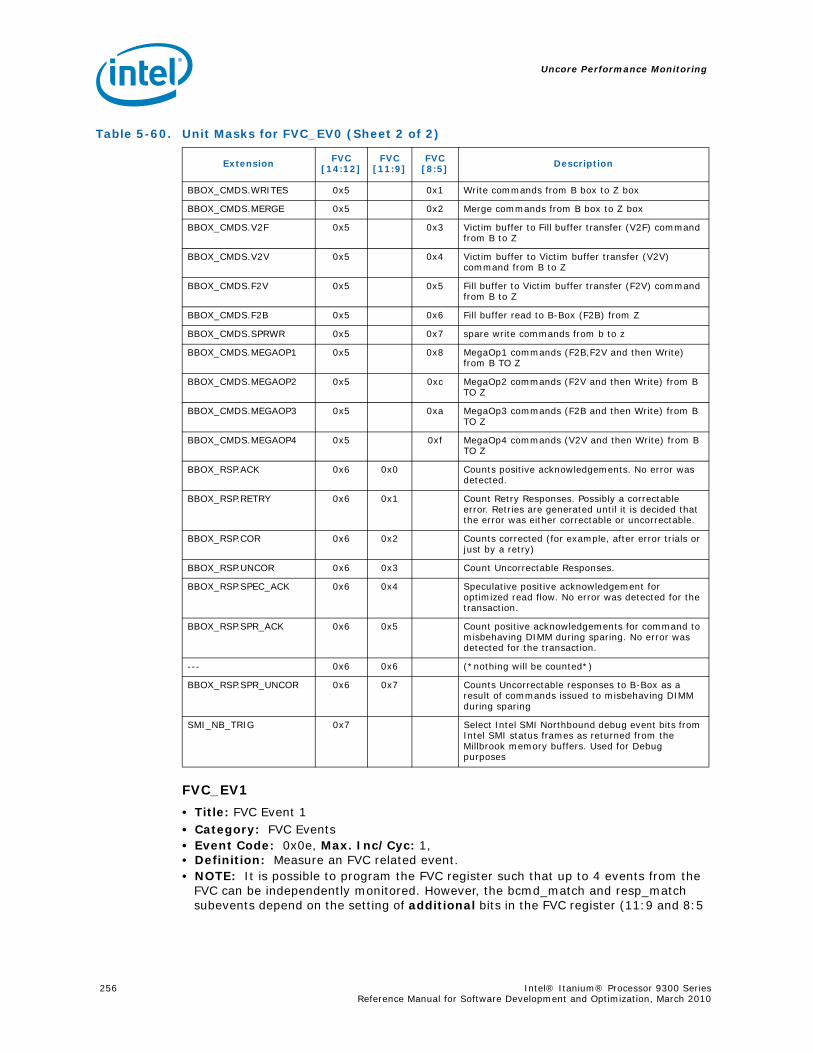
Uncore Performance Monitoring
256 Intel® Itanium® Processor 9300 Series Reference Manual for Software Development and Optimization, March 2010
FVC_EV1
• Title: FVC Event 1• Category: FVC Events• Event Code: 0x0e, Max. Inc/Cyc: 1, • Definition: Measure an FVC related event.• NOTE: It is possible to program the FVC register such that up to 4 events from the
FVC can be independently monitored. However, the bcmd_match and resp_match subevents depend on the setting of additional bits in the FVC register (11:9 and 8:5
BBOX_CMDS.WRITES 0x5 0x1 Write commands from B box to Z box
BBOX_CMDS.MERGE 0x5 0x2 Merge commands from B box to Z box
BBOX_CMDS.V2F 0x5 0x3 Victim buffer to Fill buffer transfer (V2F) command from B to Z
BBOX_CMDS.V2V 0x5 0x4 Victim buffer to Victim buffer transfer (V2V) command from B to Z
BBOX_CMDS.F2V 0x5 0x5 Fill buffer to Victim buffer transfer (F2V) command from B to Z
BBOX_CMDS.F2B 0x5 0x6 Fill buffer read to B-Box (F2B) from Z
BBOX_CMDS.SPRWR 0x5 0x7 spare write commands from b to z
BBOX_CMDS.MEGAOP1 0x5 0x8 MegaOp1 commands (F2B,F2V and then Write) from B TO Z
BBOX_CMDS.MEGAOP2 0x5 0xc MegaOp2 commands (F2V and then Write) from B TO Z
BBOX_CMDS.MEGAOP3 0x5 0xa MegaOp3 commands (F2B and then Write) from B TO Z
BBOX_CMDS.MEGAOP4 0x5 0xf MegaOp4 commands (V2V and then Write) from B TO Z
BBOX_RSP.ACK 0x6 0x0 Counts positive acknowledgements. No error was detected.
BBOX_RSP.RETRY 0x6 0x1 Count Retry Responses. Possibly a correctable error. Retries are generated until it is decided that the error was either correctable or uncorrectable.
BBOX_RSP.COR 0x6 0x2 Counts corrected (for example, after error trials or just by a retry)
BBOX_RSP.UNCOR 0x6 0x3 Count Uncorrectable Responses.
BBOX_RSP.SPEC_ACK 0x6 0x4 Speculative positive acknowledgement for optimized read flow. No error was detected for the transaction.
BBOX_RSP.SPR_ACK 0x6 0x5 Count positive acknowledgements for command to misbehaving DIMM during sparing. No error was detected for the transaction.
--- 0x6 0x6 (*nothing will be counted*)
BBOX_RSP.SPR_UNCOR 0x6 0x7 Counts Uncorrectable responses to B-Box as a result of commands issued to misbehaving DIMM during sparing
SMI_NB_TRIG 0x7 Select Intel SMI Northbound debug event bits from Intel SMI status frames as returned from the Millbrook memory buffers. Used for Debug purposes
Table 5-60. Unit Masks for FVC_EV0 (Sheet 2 of 2)
Extension FVC[14:12]
FVC[11:9]
FVC[8:5] Description

Uncore Performance Monitoring
Intel® Itanium® Processor 9300 Series 257Reference Manual for Software Development and Optimization, March 2010
respectively). Therefore, only ONE FVC_EVx.bcmd_match event may be monitored at any given time. The same holds true for VC_EVx.resp_match
Table 5-61. Unit Masks for FVC_EV1 (Sheet 1 of 2)
Extension FVC[17:15]
FVC[11:9]
FVC[8:5] Description
SMI_CRC_ERR 0x0 Count link level Intel SMI CRC errors
MEM_ECC_ERR 0x1 Count memory ECC errors (that is not a link-level CRC error)
POISON_TXN 0x2 Count poison (directory of a write to memory was encoded as poisoned) transactions
ALERT_FRAMES 0x3 Counts alert frames
--- 0x4 (*nothing will be counted*)
BBOX_CMDS.READS 0x5 0x0 Reads commands to z from B
BBOX_CMDS.WRITES 0x5 0x1 Write commands from B box to Z box
BBOX_CMDS.MERGE 0x5 0x2 Merge commands from B box to Z box
BBOX_CMDS.V2F 0x5 0x3 Victim buffer to Fill buffer transfer (V2F) command from B to Z
BBOX_CMDS.V2V 0x5 0x4 Victim buffer to Victim buffer transfer (V2V) command from B to Z
BBOX_CMDS.F2V 0x5 0x5 Fill buffer to Victim buffer transfer (F2V) command from B to Z
BBOX_CMDS.F2B 0x5 0x6 Fill buffer read to B-Box (F2B) from Z
BBOX_CMDS.SPRWR 0x5 0x7 spare write commands from b to z
BBOX_CMDS.MEGAOP1 0x5 0x8 MegaOp1 commands (F2B,F2V and then Write) from B TO Z
BBOX_CMDS.MEGAOP2 0x5 0xc MegaOp2 commands (F2V and then Write) from B TO Z
BBOX_CMDS.MEGAOP3 0x5 0xa MegaOp3 commands (F2B and then Write) from B TO Z
BBOX_CMDS.MEGAOP4 0x5 0xf MegaOp4 commands (V2V and then Write) from B TO Z
BBOX_RSP.ACK 0x6 0x0 Counts positive acknowledgements. No error was detected.
BBOX_RSP.RETRY 0x6 0x1 Count Retry Responses. Possibly a correctable error. Retries are generated until it is decided that the error was either correctable or uncorrectable.
BBOX_RSP.COR 0x6 0x2 Counts corrected (for example, after error trials or just by a retry)
BBOX_RSP.UNCOR 0x6 0x3 Count Uncorrectable Responses.
BBOX_RSP.SPEC_ACK 0x6 0x4 Speculative positive acknowledgement for optimized read flow. No error was detected for the transaction.
BBOX_RSP.SPR_ACK 0x6 0x5 Count positive acknowledgements for command to misbehaving DIMM during sparing. No error was detected for the transaction.
--- 0x6 0x6 (*nothing will be counted*)
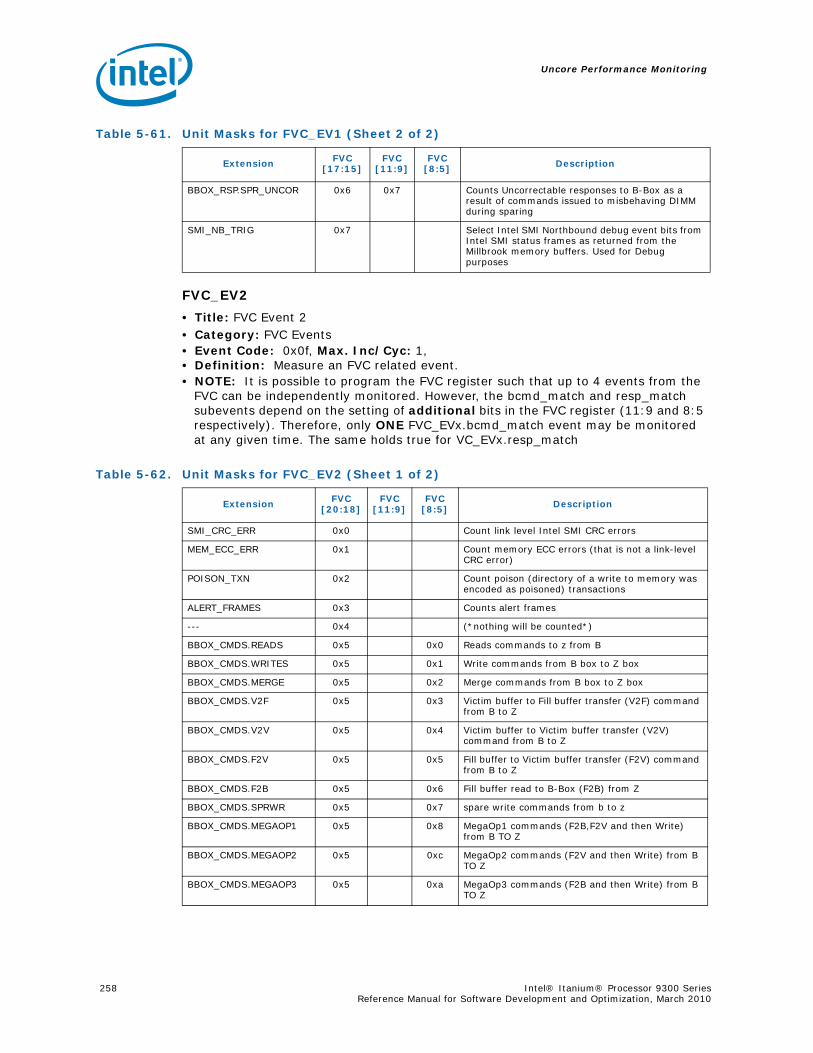
Uncore Performance Monitoring
258 Intel® Itanium® Processor 9300 Series Reference Manual for Software Development and Optimization, March 2010
FVC_EV2
• Title: FVC Event 2• Category: FVC Events • Event Code: 0x0f, Max. Inc/Cyc: 1, • Definition: Measure an FVC related event.• NOTE: It is possible to program the FVC register such that up to 4 events from the
FVC can be independently monitored. However, the bcmd_match and resp_match subevents depend on the setting of additional bits in the FVC register (11:9 and 8:5 respectively). Therefore, only ONE FVC_EVx.bcmd_match event may be monitored at any given time. The same holds true for VC_EVx.resp_match
BBOX_RSP.SPR_UNCOR 0x6 0x7 Counts Uncorrectable responses to B-Box as a result of commands issued to misbehaving DIMM during sparing
SMI_NB_TRIG 0x7 Select Intel SMI Northbound debug event bits from Intel SMI status frames as returned from the Millbrook memory buffers. Used for Debug purposes
Table 5-61. Unit Masks for FVC_EV1 (Sheet 2 of 2)
Extension FVC[17:15]
FVC[11:9]
FVC[8:5] Description
Table 5-62. Unit Masks for FVC_EV2 (Sheet 1 of 2)
Extension FVC[20:18]
FVC[11:9]
FVC[8:5] Description
SMI_CRC_ERR 0x0 Count link level Intel SMI CRC errors
MEM_ECC_ERR 0x1 Count memory ECC errors (that is not a link-level CRC error)
POISON_TXN 0x2 Count poison (directory of a write to memory was encoded as poisoned) transactions
ALERT_FRAMES 0x3 Counts alert frames
--- 0x4 (*nothing will be counted*)
BBOX_CMDS.READS 0x5 0x0 Reads commands to z from B
BBOX_CMDS.WRITES 0x5 0x1 Write commands from B box to Z box
BBOX_CMDS.MERGE 0x5 0x2 Merge commands from B box to Z box
BBOX_CMDS.V2F 0x5 0x3 Victim buffer to Fill buffer transfer (V2F) command from B to Z
BBOX_CMDS.V2V 0x5 0x4 Victim buffer to Victim buffer transfer (V2V) command from B to Z
BBOX_CMDS.F2V 0x5 0x5 Fill buffer to Victim buffer transfer (F2V) command from B to Z
BBOX_CMDS.F2B 0x5 0x6 Fill buffer read to B-Box (F2B) from Z
BBOX_CMDS.SPRWR 0x5 0x7 spare write commands from b to z
BBOX_CMDS.MEGAOP1 0x5 0x8 MegaOp1 commands (F2B,F2V and then Write) from B TO Z
BBOX_CMDS.MEGAOP2 0x5 0xc MegaOp2 commands (F2V and then Write) from B TO Z
BBOX_CMDS.MEGAOP3 0x5 0xa MegaOp3 commands (F2B and then Write) from B TO Z
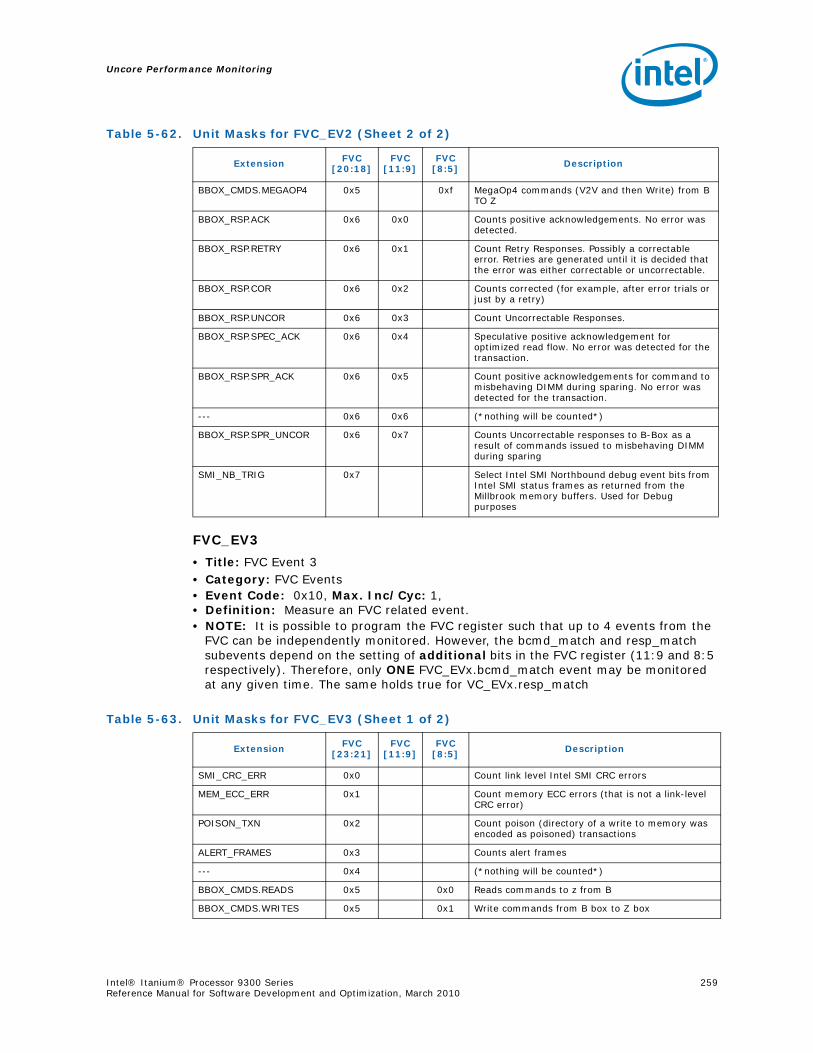
Uncore Performance Monitoring
Intel® Itanium® Processor 9300 Series 259Reference Manual for Software Development and Optimization, March 2010
FVC_EV3
• Title: FVC Event 3• Category: FVC Events • Event Code: 0x10, Max. Inc/Cyc: 1, • Definition: Measure an FVC related event.• NOTE: It is possible to program the FVC register such that up to 4 events from the
FVC can be independently monitored. However, the bcmd_match and resp_match subevents depend on the setting of additional bits in the FVC register (11:9 and 8:5 respectively). Therefore, only ONE FVC_EVx.bcmd_match event may be monitored at any given time. The same holds true for VC_EVx.resp_match
BBOX_CMDS.MEGAOP4 0x5 0xf MegaOp4 commands (V2V and then Write) from B TO Z
BBOX_RSP.ACK 0x6 0x0 Counts positive acknowledgements. No error was detected.
BBOX_RSP.RETRY 0x6 0x1 Count Retry Responses. Possibly a correctable error. Retries are generated until it is decided that the error was either correctable or uncorrectable.
BBOX_RSP.COR 0x6 0x2 Counts corrected (for example, after error trials or just by a retry)
BBOX_RSP.UNCOR 0x6 0x3 Count Uncorrectable Responses.
BBOX_RSP.SPEC_ACK 0x6 0x4 Speculative positive acknowledgement for optimized read flow. No error was detected for the transaction.
BBOX_RSP.SPR_ACK 0x6 0x5 Count positive acknowledgements for command to misbehaving DIMM during sparing. No error was detected for the transaction.
--- 0x6 0x6 (*nothing will be counted*)
BBOX_RSP.SPR_UNCOR 0x6 0x7 Counts Uncorrectable responses to B-Box as a result of commands issued to misbehaving DIMM during sparing
SMI_NB_TRIG 0x7 Select Intel SMI Northbound debug event bits from Intel SMI status frames as returned from the Millbrook memory buffers. Used for Debug purposes
Table 5-62. Unit Masks for FVC_EV2 (Sheet 2 of 2)
Extension FVC[20:18]
FVC[11:9]
FVC[8:5] Description
Table 5-63. Unit Masks for FVC_EV3 (Sheet 1 of 2)
Extension FVC[23:21]
FVC[11:9]
FVC[8:5] Description
SMI_CRC_ERR 0x0 Count link level Intel SMI CRC errors
MEM_ECC_ERR 0x1 Count memory ECC errors (that is not a link-level CRC error)
POISON_TXN 0x2 Count poison (directory of a write to memory was encoded as poisoned) transactions
ALERT_FRAMES 0x3 Counts alert frames
--- 0x4 (*nothing will be counted*)
BBOX_CMDS.READS 0x5 0x0 Reads commands to z from B
BBOX_CMDS.WRITES 0x5 0x1 Write commands from B box to Z box
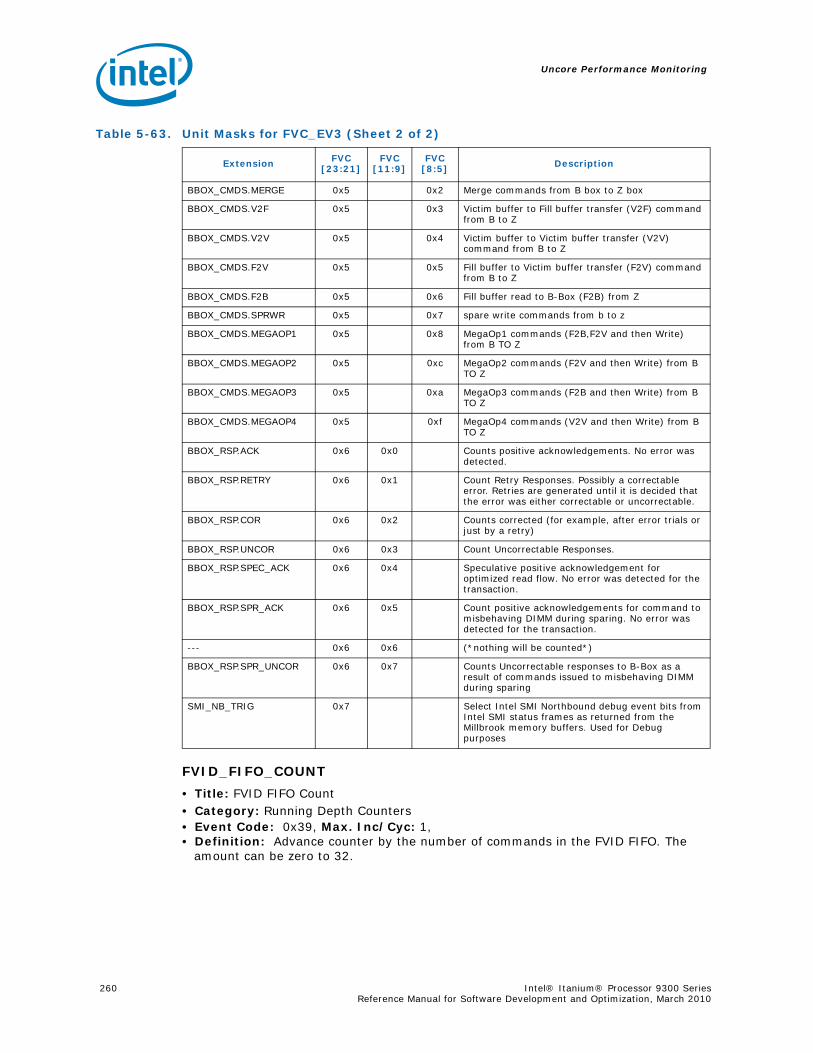
Uncore Performance Monitoring
260 Intel® Itanium® Processor 9300 Series Reference Manual for Software Development and Optimization, March 2010
FVID_FIFO_COUNT
• Title: FVID FIFO Count• Category: Running Depth Counters • Event Code: 0x39, Max. Inc/Cyc: 1, • Definition: Advance counter by the number of commands in the FVID FIFO. The
amount can be zero to 32.
BBOX_CMDS.MERGE 0x5 0x2 Merge commands from B box to Z box
BBOX_CMDS.V2F 0x5 0x3 Victim buffer to Fill buffer transfer (V2F) command from B to Z
BBOX_CMDS.V2V 0x5 0x4 Victim buffer to Victim buffer transfer (V2V) command from B to Z
BBOX_CMDS.F2V 0x5 0x5 Fill buffer to Victim buffer transfer (F2V) command from B to Z
BBOX_CMDS.F2B 0x5 0x6 Fill buffer read to B-Box (F2B) from Z
BBOX_CMDS.SPRWR 0x5 0x7 spare write commands from b to z
BBOX_CMDS.MEGAOP1 0x5 0x8 MegaOp1 commands (F2B,F2V and then Write) from B TO Z
BBOX_CMDS.MEGAOP2 0x5 0xc MegaOp2 commands (F2V and then Write) from B TO Z
BBOX_CMDS.MEGAOP3 0x5 0xa MegaOp3 commands (F2B and then Write) from B TO Z
BBOX_CMDS.MEGAOP4 0x5 0xf MegaOp4 commands (V2V and then Write) from B TO Z
BBOX_RSP.ACK 0x6 0x0 Counts positive acknowledgements. No error was detected.
BBOX_RSP.RETRY 0x6 0x1 Count Retry Responses. Possibly a correctable error. Retries are generated until it is decided that the error was either correctable or uncorrectable.
BBOX_RSP.COR 0x6 0x2 Counts corrected (for example, after error trials or just by a retry)
BBOX_RSP.UNCOR 0x6 0x3 Count Uncorrectable Responses.
BBOX_RSP.SPEC_ACK 0x6 0x4 Speculative positive acknowledgement for optimized read flow. No error was detected for the transaction.
BBOX_RSP.SPR_ACK 0x6 0x5 Count positive acknowledgements for command to misbehaving DIMM during sparing. No error was detected for the transaction.
--- 0x6 0x6 (*nothing will be counted*)
BBOX_RSP.SPR_UNCOR 0x6 0x7 Counts Uncorrectable responses to B-Box as a result of commands issued to misbehaving DIMM during sparing
SMI_NB_TRIG 0x7 Select Intel SMI Northbound debug event bits from Intel SMI status frames as returned from the Millbrook memory buffers. Used for Debug purposes
Table 5-63. Unit Masks for FVC_EV3 (Sheet 2 of 2)
Extension FVC[23:21]
FVC[11:9]
FVC[8:5] Description
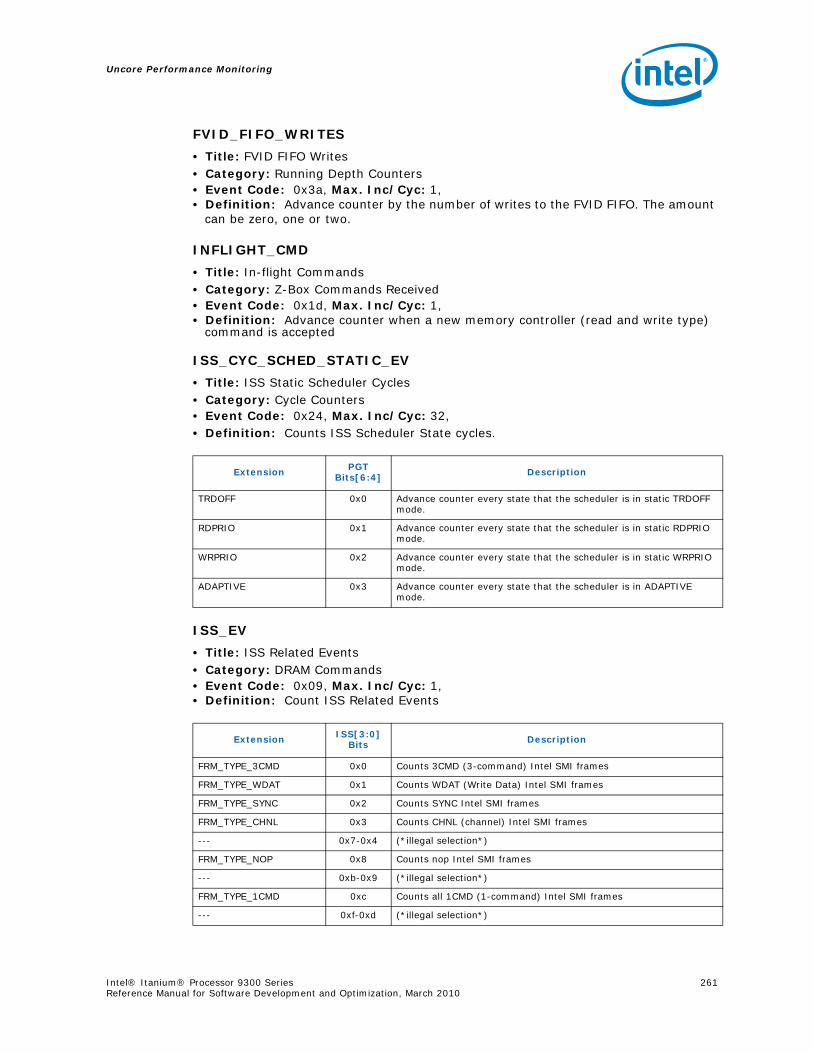
Uncore Performance Monitoring
Intel® Itanium® Processor 9300 Series 261Reference Manual for Software Development and Optimization, March 2010
FVID_FIFO_WRITES
• Title: FVID FIFO Writes• Category: Running Depth Counters • Event Code: 0x3a, Max. Inc/Cyc: 1, • Definition: Advance counter by the number of writes to the FVID FIFO. The amount
can be zero, one or two.
INFLIGHT_CMD
• Title: In-flight Commands• Category: Z-Box Commands Received • Event Code: 0x1d, Max. Inc/Cyc: 1, • Definition: Advance counter when a new memory controller (read and write type)
command is accepted
ISS_CYC_SCHED_STATIC_EV
• Title: ISS Static Scheduler Cycles• Category: Cycle Counters • Event Code: 0x24, Max. Inc/Cyc: 32, • Definition: Counts ISS Scheduler State cycles.
ISS_EV
• Title: ISS Related Events • Category: DRAM Commands • Event Code: 0x09, Max. Inc/Cyc: 1, • Definition: Count ISS Related Events
Extension PGT Bits[6:4] Description
TRDOFF 0x0 Advance counter every state that the scheduler is in static TRDOFF mode.
RDPRIO 0x1 Advance counter every state that the scheduler is in static RDPRIO mode.
WRPRIO 0x2 Advance counter every state that the scheduler is in static WRPRIO mode.
ADAPTIVE 0x3 Advance counter every state that the scheduler is in ADAPTIVE mode.
Extension ISS[3:0]Bits Description
FRM_TYPE_3CMD 0x0 Counts 3CMD (3-command) Intel SMI frames
FRM_TYPE_WDAT 0x1 Counts WDAT (Write Data) Intel SMI frames
FRM_TYPE_SYNC 0x2 Counts SYNC Intel SMI frames
FRM_TYPE_CHNL 0x3 Counts CHNL (channel) Intel SMI frames
--- 0x7-0x4 (*illegal selection*)
FRM_TYPE_NOP 0x8 Counts nop Intel SMI frames
--- 0xb-0x9 (*illegal selection*)
FRM_TYPE_1CMD 0xc Counts all 1CMD (1-command) Intel SMI frames
--- 0xf-0xd (*illegal selection*)
Uncore Performance Monitoring
262 Intel® Itanium® Processor 9300 Series Reference Manual for Software Development and Optimization, March 2010
LIVE_OPS_INFLIGHT
• Title: Live Ops In-flight• Category: Running Depth • Event Code: 0x3b, Max. Inc/Cyc: 32, • Definition: Advance counter by the number of pending commands in the Z-Box.
The amount can be zero to 32.
PAGE_AUTOCLS_CMD
• Title: Page Table Autoclose Commands• Category: Page Table Related • Event Code: 0x15, Max. Inc/Cyc: 1, • Definition: Advance counter when an auto page close command is detected.
PAGE_COLLISION
• Title: Refresh Commands• Category: Page Table Related • Event Code: 0x18, Max. Inc/Cyc: 1, • Definition: Advance counter when page collision is detected (that is, a command
requires a PRE-RAS-CAS sequence).
PAGE_HITS
• Title: Page Table Hits• Category: Page Table Related • Event Code: 0x14, Max. Inc/Cyc: 1, • Definition: Advance counter when a page hit is detected (that is, a command
requires only a CAS).
• NOTE: Will not increment in closed-page mode.
PAGE_MISS
• Title: Page Table Misses• Category: Page Table Related • Event Code: 0x13, Max. Inc/Cyc: 1, • Definition: Advance counter when a page miss is detected (that is, a command
requires a RAS-CAS to complete).
Uncore Performance Monitoring
Intel® Itanium® Processor 9300 Series 263Reference Manual for Software Development and Optimization, March 2010
PGT_CNFLCT_EV
• Title: PGT Related Conflict Events • Category: Thermal Throttle • Event Code: 0x19, Max. Inc/Cyc: 1, • Definition: Count PGT Conflict Related Events
PGT_CYC_EV
• Title: PGT Related Cycles Events • Category: Page Table Related • Event Code: 0x11, Max. Inc/Cyc: 1, • Definition: Counts PGT Related Cycle Events.
PGT_DISPQ_EV
• Title: PGT Related DISPQ Events • Category: RD/WR Dispatch Queue Related • Event Code: 0x12, Max. Inc/Cyc: 1, • Definition: Counts PGT Related DISPQ Events
Extension PGT[1] Bits Description
TT_RANK_ALL 0x0 Advance counter when a command conflict occurs due to thermal throttling.
TT_RANK_N 0x1 Advance counter when a ranked command conflict occurs due to thermal throttling.NOTE: Rank can be specified by the user in PGT Bits[5:2]
Extension PGT Bit[7] Description
CLS_PAGE_PLCY 0x0 Advance counter every state the page table is in close page mode.
OPN_PAGE_PLCY 0x1 Advance counter every state the page table is in open page mode.
Extension PGT Bits[9:8] Description
--- 0x3 (*nothing is counted*)
--- 0x2-0x1 (*illegal selection*)
INSERTS_ALL 0x0 Advance counter when a translated command enters any DispQ.
Uncore Performance Monitoring
264 Intel® Itanium® Processor 9300 Series Reference Manual for Software Development and Optimization, March 2010
PGT_PAGE_EV
• Title: PGT Related Page Table Events • Category: Page Table Related • Event Code: 0x16, Max. Inc/Cyc: 1, • Definition: Counts PGT Related Page Table Events.
PLD_DRAM_EV
• Title: PLD Related DRAM Events • Category: DRAM Commands • Event Code: 0x0a, Max. Inc/Cyc: 1, • Definition: Count PLD Related DRAM Events• NOTE: Tn order to measure a non-filtered version of the .DRAM_CMD events, it is
necessary to make sure the PLD Dep bits [13,7,0] are also set to 0
Extension PGT Bits[0] Description
OPN2CLS 0x1 Advance counter when an open-to-closed page transition is detected.
CLS2OPN 0x0 Advance counter when an closed-to-open page transition is detected.
Extension PLD Dep Bits
ISS Dep Bits Description
CMD_ALL [0]0x0 Advance counter when a DRAM command is detected.
DRAM_CMD.NOP [12:8]0x0 Count NOP DRAM commands.
DRAM_CMD.PRCH_SGL [12:8]0x1 Count Precharge Single DRAM commands.
DRAM_CMD.RAS [12:8]0x2 Count RAS DRAM commands.
DRAM_CMD.CAS_RD_OPN [12:8]0x4 Count CAS Read (no auto-precharge, open page mode) DRAM commands.
DRAM_CMD.REF [12:8]0x8 Count Refresh DRAM commands.
DRAM_CMD.PRCH_ALL [12:8]0x9 Count Precharge All DRAM commands.
DRAM_CMD.CAS_RD_CLS [12:8]0xc Count CAS Read (precharge, closed page mode) DRAM commands.
DRAM_CMD.WRITE_TR [12:8]0x10 Count Write DRAM commands.
DRAM_CMD.SYNC [12:8]0x11 Count SYNC DRAM commands.
DRAM_CMD.CAS_WR_OPN [12:8]0x14 Count CAS Write (no auto-precharge, open page mode) DRAM commands.
DRAM_CMD.WR_CMD [12:8]0x16 Count Write Command Register DRAM commands.
DRAM_CMD.RD_CMD [12:8]0x17 Count Read Command Register DRAM commands.
DRAM_CMD.ZQCAL [12:8]0x18 Count ZQCAL DRAM commands.
DRAM_CMD.CAS_WR_CLS [12:8]0x1c Count CAS Write (precharge, closed page mode) DRAM commands.
DRAM_CMD_STRDOFF [13]0x0 [9:7]0x0 Count all DRAM commands during "static trade off" scheduling mode
DRAM_CMD_SRDPRIO [13]0x0 [9:7]0x1 Count all DRAM commands during "static read priority" scheduling mode
Uncore Performance Monitoring
Intel® Itanium® Processor 9300 Series 265Reference Manual for Software Development and Optimization, March 2010
PLD_RETRY_EV
• Title: PLD Related Retry Events • Category: Retry Events • Event Code: 0x0b, Max. Inc/Cyc: 1, • Definition: Count PLD Related Retry Events
REFRESH
• Title: Refresh Commands• Category: DRAM Commands • Event Code: 0x06, Max. Inc/Cyc: 1, • Definition: Advance counter when a refresh command is detected.
REFRESH_CNFLT
• Title: Refresh Conflict• Category: DRAM Commands • Event Code: 0x07, Max. Inc/Cyc: 1, • Definition: Advance counter when a refresh conflict is detected.
RETRY_OPS
• Title: Retry Ops• Category: RetryQ • Event Code: 0x22, Max. Inc/Cyc: 1, • Definition: Advance counter for every new command that gets pushed into the
retry queue.
RETRY_STARVE
• Title: Retry Starve• Category: Retry Events• Event Code: 0x03, Max. Inc/Cyc: 1, • Definition: Advance counter every cycle when a retry is detected in the "starved"
state.
RETRY_ZFULL
• Title: Retry ZFull• Category: Retry Events• Event Code: 0x02, Max. Inc/Cyc: 1, • Definition: Advance counter when a retry is detected in the "zfull" state.
DRAM_CMD_SWRPRIO [13]0x0 [9:7]0x2 Count all DRAM commands during "static write priority" scheduling mode
DRAM_CMD_ADAPT [13]0x0 [9:7]0x3 Count all DRAM commands during "adaptive" scheduling mode
Extension PLD Dep Bits
ISS Dep Bits Description
Extension PLD[7] Description
RETRIES_ALL b0 Advance counter when a retry is detected.
RETRIES_FVID b1 Advance counter when a retry to a certain FVID is detected.NOTE: The FVID is programmed into PLD[6:1]
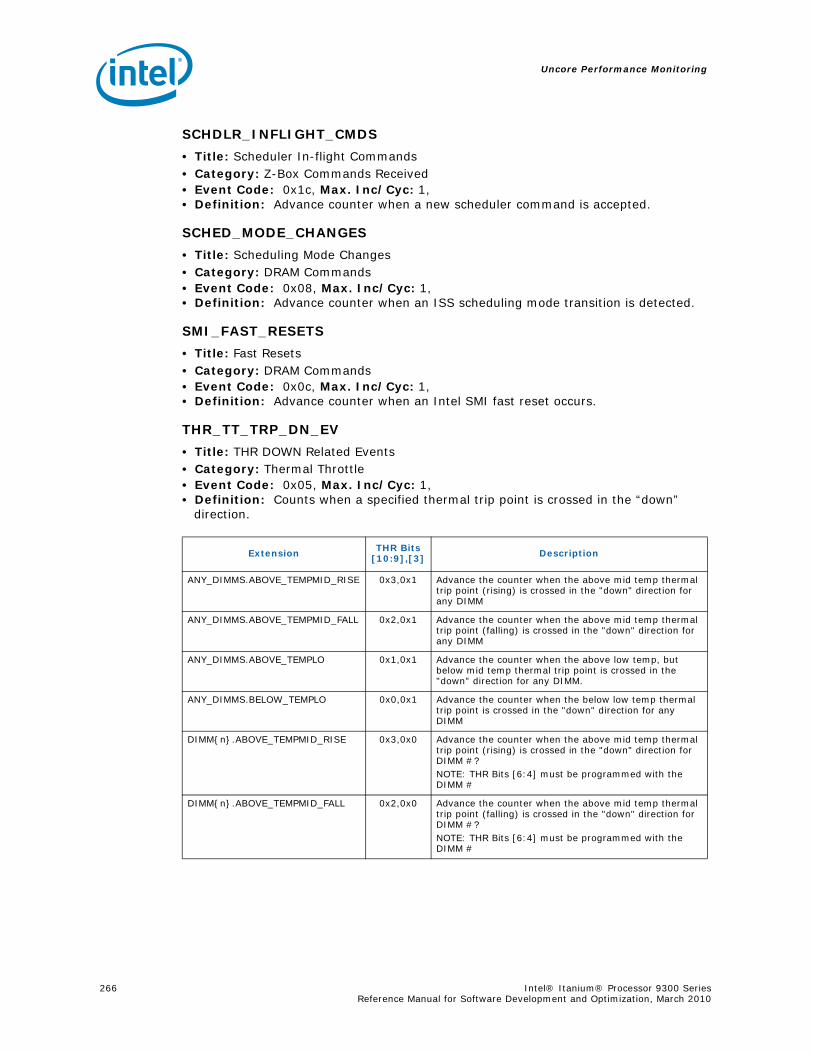
Uncore Performance Monitoring
266 Intel® Itanium® Processor 9300 Series Reference Manual for Software Development and Optimization, March 2010
SCHDLR_INFLIGHT_CMDS
• Title: Scheduler In-flight Commands• Category: Z-Box Commands Received • Event Code: 0x1c, Max. Inc/Cyc: 1, • Definition: Advance counter when a new scheduler command is accepted.
SCHED_MODE_CHANGES
• Title: Scheduling Mode Changes• Category: DRAM Commands • Event Code: 0x08, Max. Inc/Cyc: 1, • Definition: Advance counter when an ISS scheduling mode transition is detected.
SMI_FAST_RESETS
• Title: Fast Resets• Category: DRAM Commands • Event Code: 0x0c, Max. Inc/Cyc: 1, • Definition: Advance counter when an Intel SMI fast reset occurs.
THR_TT_TRP_DN_EV
• Title: THR DOWN Related Events • Category: Thermal Throttle • Event Code: 0x05, Max. Inc/Cyc: 1, • Definition: Counts when a specified thermal trip point is crossed in the “down”
direction.
Extension THR Bits[10:9],[3] Description
ANY_DIMMS.ABOVE_TEMPMID_RISE 0x3,0x1 Advance the counter when the above mid temp thermal trip point (rising) is crossed in the "down" direction for any DIMM
ANY_DIMMS.ABOVE_TEMPMID_FALL 0x2,0x1 Advance the counter when the above mid temp thermal trip point (falling) is crossed in the "down" direction for any DIMM
ANY_DIMMS.ABOVE_TEMPLO 0x1,0x1 Advance the counter when the above low temp, but below mid temp thermal trip point is crossed in the "down" direction for any DIMM.
ANY_DIMMS.BELOW_TEMPLO 0x0,0x1 Advance the counter when the below low temp thermal trip point is crossed in the "down" direction for any DIMM
DIMM{n}.ABOVE_TEMPMID_RISE 0x3,0x0 Advance the counter when the above mid temp thermal trip point (rising) is crossed in the "down" direction for DIMM #?NOTE: THR Bits [6:4] must be programmed with the DIMM #
DIMM{n}.ABOVE_TEMPMID_FALL 0x2,0x0 Advance the counter when the above mid temp thermal trip point (falling) is crossed in the "down" direction for DIMM #?NOTE: THR Bits [6:4] must be programmed with the DIMM #
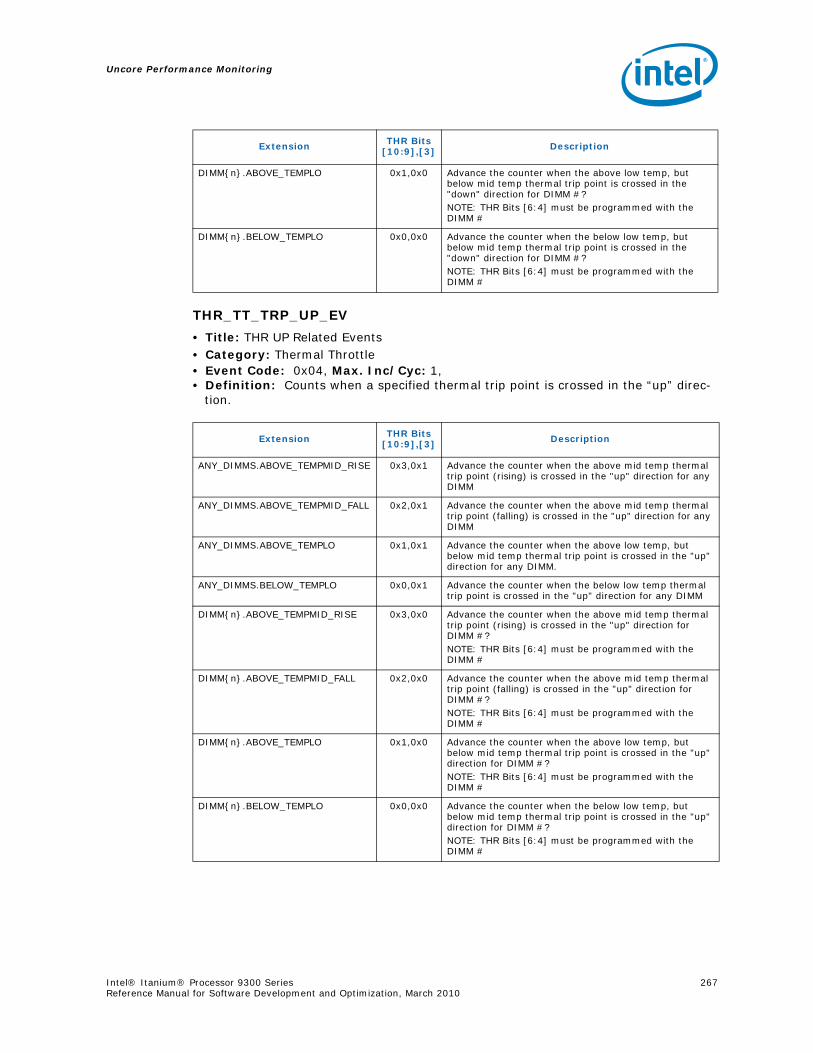
Uncore Performance Monitoring
Intel® Itanium® Processor 9300 Series 267Reference Manual for Software Development and Optimization, March 2010
THR_TT_TRP_UP_EV
• Title: THR UP Related Events • Category: Thermal Throttle • Event Code: 0x04, Max. Inc/Cyc: 1, • Definition: Counts when a specified thermal trip point is crossed in the “up” direc-
tion.
DIMM{n}.ABOVE_TEMPLO 0x1,0x0 Advance the counter when the above low temp, but below mid temp thermal trip point is crossed in the "down" direction for DIMM #?NOTE: THR Bits [6:4] must be programmed with the DIMM #
DIMM{n}.BELOW_TEMPLO 0x0,0x0 Advance the counter when the below low temp, but below mid temp thermal trip point is crossed in the "down" direction for DIMM #?NOTE: THR Bits [6:4] must be programmed with the DIMM #
Extension THR Bits[10:9],[3] Description
Extension THR Bits[10:9],[3] Description
ANY_DIMMS.ABOVE_TEMPMID_RISE 0x3,0x1 Advance the counter when the above mid temp thermal trip point (rising) is crossed in the "up" direction for any DIMM
ANY_DIMMS.ABOVE_TEMPMID_FALL 0x2,0x1 Advance the counter when the above mid temp thermal trip point (falling) is crossed in the "up" direction for any DIMM
ANY_DIMMS.ABOVE_TEMPLO 0x1,0x1 Advance the counter when the above low temp, but below mid temp thermal trip point is crossed in the "up" direction for any DIMM.
ANY_DIMMS.BELOW_TEMPLO 0x0,0x1 Advance the counter when the below low temp thermal trip point is crossed in the "up" direction for any DIMM
DIMM{n}.ABOVE_TEMPMID_RISE 0x3,0x0 Advance the counter when the above mid temp thermal trip point (rising) is crossed in the "up" direction for DIMM #?NOTE: THR Bits [6:4] must be programmed with the DIMM #
DIMM{n}.ABOVE_TEMPMID_FALL 0x2,0x0 Advance the counter when the above mid temp thermal trip point (falling) is crossed in the "up" direction for DIMM #?NOTE: THR Bits [6:4] must be programmed with the DIMM #
DIMM{n}.ABOVE_TEMPLO 0x1,0x0 Advance the counter when the above low temp, but below mid temp thermal trip point is crossed in the "up" direction for DIMM #?NOTE: THR Bits [6:4] must be programmed with the DIMM #
DIMM{n}.BELOW_TEMPLO 0x0,0x0 Advance the counter when the below low temp, but below mid temp thermal trip point is crossed in the "up" direction for DIMM #?NOTE: THR Bits [6:4] must be programmed with the DIMM #
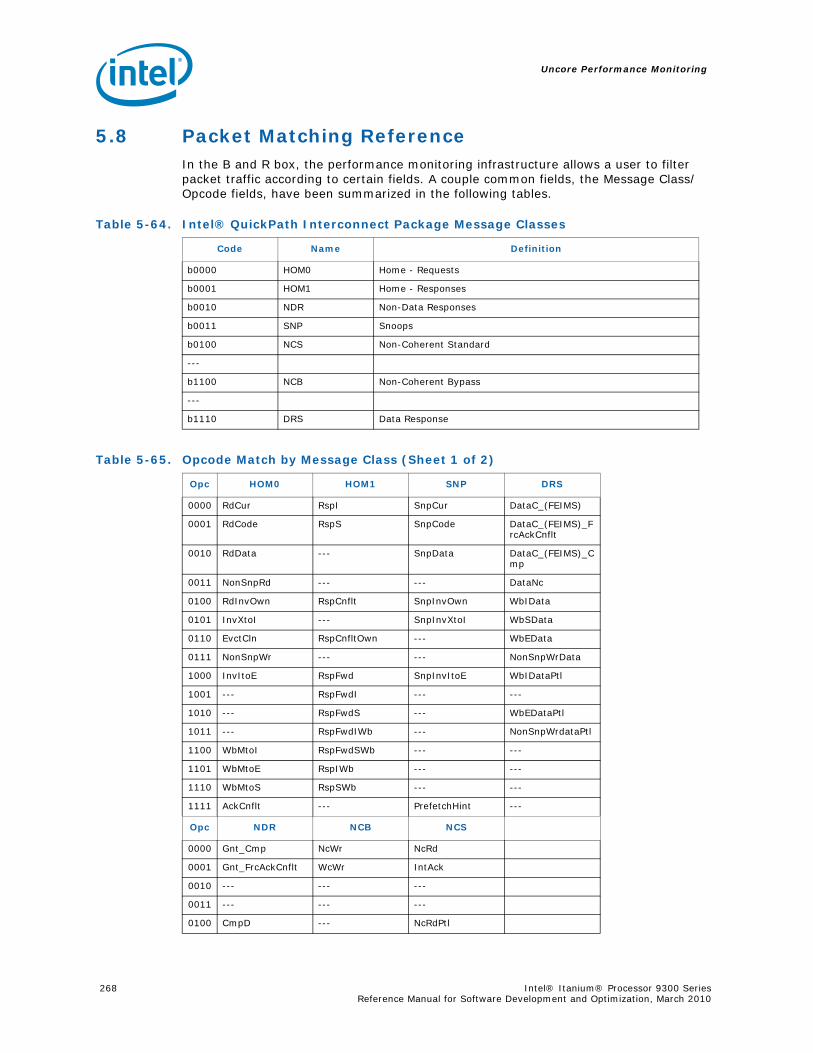
Uncore Performance Monitoring
268 Intel® Itanium® Processor 9300 Series Reference Manual for Software Development and Optimization, March 2010
5.8 Packet Matching ReferenceIn the B and R box, the performance monitoring infrastructure allows a user to filter packet traffic according to certain fields. A couple common fields, the Message Class/Opcode fields, have been summarized in the following tables.
Table 5-64. Intel® QuickPath Interconnect Package Message Classes
Code Name Definition
b0000 HOM0 Home - Requests
b0001 HOM1 Home - Responses
b0010 NDR Non-Data Responses
b0011 SNP Snoops
b0100 NCS Non-Coherent Standard
---
b1100 NCB Non-Coherent Bypass
---
b1110 DRS Data Response
Table 5-65. Opcode Match by Message Class (Sheet 1 of 2)
Opc HOM0 HOM1 SNP DRS
0000 RdCur RspI SnpCur DataC_(FEIMS)
0001 RdCode RspS SnpCode DataC_(FEIMS)_FrcAckCnflt
0010 RdData --- SnpData DataC_(FEIMS)_Cmp
0011 NonSnpRd --- --- DataNc
0100 RdInvOwn RspCnflt SnpInvOwn WbIData
0101 InvXtoI --- SnpInvXtoI WbSData
0110 EvctCln RspCnfltOwn --- WbEData
0111 NonSnpWr --- --- NonSnpWrData
1000 InvItoE RspFwd SnpInvItoE WbIDataPtl
1001 --- RspFwdI --- ---
1010 --- RspFwdS --- WbEDataPtl
1011 --- RspFwdIWb --- NonSnpWrdataPtl
1100 WbMtoI RspFwdSWb --- ---
1101 WbMtoE RspIWb --- ---
1110 WbMtoS RspSWb --- ---
1111 AckCnflt --- PrefetchHint ---
Opc NDR NCB NCS
0000 Gnt_Cmp NcWr NcRd
0001 Gnt_FrcAckCnflt WcWr IntAck
0010 --- --- ---
0011 --- --- ---
0100 CmpD --- NcRdPtl
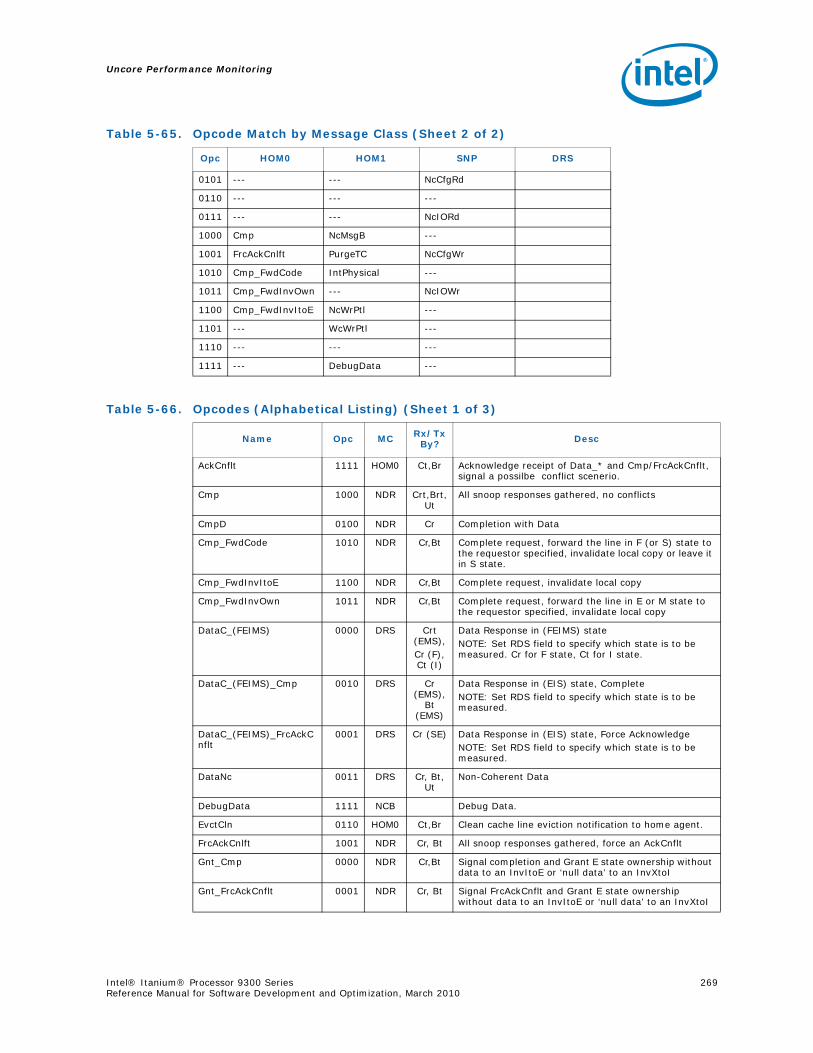
Uncore Performance Monitoring
Intel® Itanium® Processor 9300 Series 269Reference Manual for Software Development and Optimization, March 2010
0101 --- --- NcCfgRd
0110 --- --- ---
0111 --- --- NcIORd
1000 Cmp NcMsgB ---
1001 FrcAckCnlft PurgeTC NcCfgWr
1010 Cmp_FwdCode IntPhysical ---
1011 Cmp_FwdInvOwn --- NcIOWr
1100 Cmp_FwdInvItoE NcWrPtl ---
1101 --- WcWrPtl ---
1110 --- --- ---
1111 --- DebugData ---
Table 5-66. Opcodes (Alphabetical Listing) (Sheet 1 of 3)
Name Opc MC Rx/Tx By? Desc
AckCnflt 1111 HOM0 Ct,Br Acknowledge receipt of Data_* and Cmp/FrcAckCnflt, signal a possilbe conflict scenerio.
Cmp 1000 NDR Crt,Brt,Ut
All snoop responses gathered, no conflicts
CmpD 0100 NDR Cr Completion with Data
Cmp_FwdCode 1010 NDR Cr,Bt Complete request, forward the line in F (or S) state to the requestor specified, invalidate local copy or leave it in S state.
Cmp_FwdInvItoE 1100 NDR Cr,Bt Complete request, invalidate local copy
Cmp_FwdInvOwn 1011 NDR Cr,Bt Complete request, forward the line in E or M state to the requestor specified, invalidate local copy
DataC_(FEIMS) 0000 DRS Crt (EMS),Cr (F), Ct (I)
Data Response in (FEIMS) stateNOTE: Set RDS field to specify which state is to be measured. Cr for F state, Ct for I state.
DataC_(FEIMS)_Cmp 0010 DRS Cr (EMS),
Bt (EMS)
Data Response in (EIS) state, CompleteNOTE: Set RDS field to specify which state is to be measured.
DataC_(FEIMS)_FrcAckCnflt
0001 DRS Cr (SE) Data Response in (EIS) state, Force AcknowledgeNOTE: Set RDS field to specify which state is to be measured.
DataNc 0011 DRS Cr, Bt, Ut
Non-Coherent Data
DebugData 1111 NCB Debug Data.
EvctCln 0110 HOM0 Ct,Br Clean cache line eviction notification to home agent.
FrcAckCnlft 1001 NDR Cr, Bt All snoop responses gathered, force an AckCnflt
Gnt_Cmp 0000 NDR Cr,Bt Signal completion and Grant E state ownership without data to an InvItoE or ‘null data’ to an InvXtoI
Gnt_FrcAckCnflt 0001 NDR Cr, Bt Signal FrcAckCnflt and Grant E state ownership without data to an InvItoE or ‘null data’ to an InvXtoI
Table 5-65. Opcode Match by Message Class (Sheet 2 of 2)
Opc HOM0 HOM1 SNP DRS

Uncore Performance Monitoring
270 Intel® Itanium® Processor 9300 Series Reference Manual for Software Development and Optimization, March 2010
IntAck 0001 NCS Ct Interrupt acknowledge to legacy 8259 interrupt controller
PurgeTC 1001 NCB Ctr Purge target’s page table caches
IntPhysical 1010 NCB Ct,Ur Physical mode interrupt to processor
InvItoE 1000 HOM0 Ct,Br Invalidate to E state requests exclusive ownership of a cache line without data.
InvXtoI 0101 HOM0 Br Flush a cache line from all caches (that is, downgrade all clean copies to I and cause any dirty copy to be written back to memory).
NcCfgRd 0101 NCS Ct Configuration read from configuration space
NcCfgWr 1001 NCS Ct Configuration write to configuration space
NcIORd 0111 NCS Ct Read from legacy I/O space
NcIOWr 1011 NCS Ct Write to legacy I/O space
NcMsgB 1000 NCB Bt Non-coherent Message (non-coherent bypass channel)
NcRd 0000 NCS Ct,Ur Read from non-coherent memory mapped I/O space
NcRdPtl 0100 NCS Ct,B*,Ur
Partial read from non-coherent memory mapped I/O space* Home Agent acting as mirroring slave receives, mirroring primary will transmit
NcWr 0000 NCB B*,Ur Write to non-coherent memory mapped I/O space* Home Agent acting as mirroring slave receives, mirroring primary will transmit
NcWrPtl 1100 NCB Ct,B*,Ur
Partial write to non-coherent memory mapped I/O space- Home Agent acting as mirroring slave receives, mirroring primary will transmit
RdCode 0001 HOM0 Ct,Br Read cache line in F (or S, if the F state not supported)
RdCur 0000 HOM0 Br Request a cache line in I. Typically issued by I/O proxy entities, RdCur is used to obtain a coherent snapshot of an uncached cache line.
RdData 0010 HOM0 Ct,Br Read cache line in either E or F (or S, if F state not supported). The choice between F (or S) and E is determined by whether or not per caching agent has cache line in S state.
RdInvOwn 0100 HOM0 Ct,Br Read Invalidate Own requests a cache line in M or E state. M or E is determined by whether requester is forwarded an M copy by a peer caching agent or sent an E copy by home agent.
RspCnflt 0100 HOM1 Ct,Br Peer is left with line in I or S state, and the peer has a conflicting outstanding request.
RspCnfltOwn 0110 HOM1 Peer has a buried M copy for this line with an oustanding conflicting request.
RspFwd 1000 HOM1 Ct,Br Peer has sent data to requestor with no change in cache state
RspFwdI 1001 HOM1 Ct,Br Peer has sent data to requestor and is left with line in I state
RspFwdIWb 1011 HOM1 Ct,Br Peer has sent data to requestor and a WbIData to the home, and is left with line in I state
RspFwdS 1010 HOM1 Ct,Br Peer has sent data to requestor and is left with line in S state
Table 5-66. Opcodes (Alphabetical Listing) (Sheet 2 of 3)
Name Opc MC Rx/Tx By? Desc
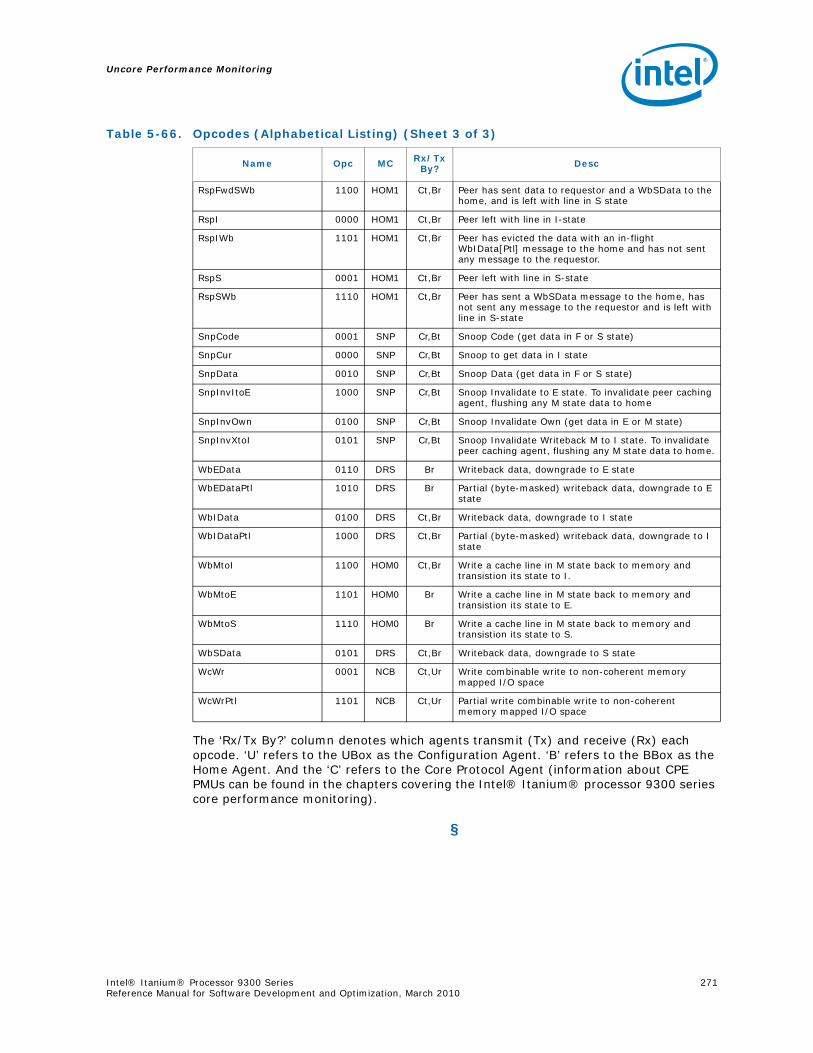
Uncore Performance Monitoring
Intel® Itanium® Processor 9300 Series 271Reference Manual for Software Development and Optimization, March 2010
The ‘Rx/Tx By?’ column denotes which agents transmit (Tx) and receive (Rx) each opcode. ‘U’ refers to the UBox as the Configuration Agent. ‘B’ refers to the BBox as the Home Agent. And the ‘C’ refers to the Core Protocol Agent (information about CPE PMUs can be found in the chapters covering the Intel® Itanium® processor 9300 series core performance monitoring).
§
RspFwdSWb 1100 HOM1 Ct,Br Peer has sent data to requestor and a WbSData to the home, and is left with line in S state
RspI 0000 HOM1 Ct,Br Peer left with line in I-state
RspIWb 1101 HOM1 Ct,Br Peer has evicted the data with an in-flight WbIData[Ptl] message to the home and has not sent any message to the requestor.
RspS 0001 HOM1 Ct,Br Peer left with line in S-state
RspSWb 1110 HOM1 Ct,Br Peer has sent a WbSData message to the home, has not sent any message to the requestor and is left with line in S-state
SnpCode 0001 SNP Cr,Bt Snoop Code (get data in F or S state)
SnpCur 0000 SNP Cr,Bt Snoop to get data in I state
SnpData 0010 SNP Cr,Bt Snoop Data (get data in F or S state)
SnpInvItoE 1000 SNP Cr,Bt Snoop Invalidate to E state. To invalidate peer caching agent, flushing any M state data to home
SnpInvOwn 0100 SNP Cr,Bt Snoop Invalidate Own (get data in E or M state)
SnpInvXtoI 0101 SNP Cr,Bt Snoop Invalidate Writeback M to I state. To invalidate peer caching agent, flushing any M state data to home.
WbEData 0110 DRS Br Writeback data, downgrade to E state
WbEDataPtl 1010 DRS Br Partial (byte-masked) writeback data, downgrade to E state
WbIData 0100 DRS Ct,Br Writeback data, downgrade to I state
WbIDataPtl 1000 DRS Ct,Br Partial (byte-masked) writeback data, downgrade to I state
WbMtoI 1100 HOM0 Ct,Br Write a cache line in M state back to memory and transistion its state to I.
WbMtoE 1101 HOM0 Br Write a cache line in M state back to memory and transistion its state to E.
WbMtoS 1110 HOM0 Br Write a cache line in M state back to memory and transistion its state to S.
WbSData 0101 DRS Ct,Br Writeback data, downgrade to S state
WcWr 0001 NCB Ct,Ur Write combinable write to non-coherent memory mapped I/O space
WcWrPtl 1101 NCB Ct,Ur Partial write combinable write to non-coherent memory mapped I/O space
Table 5-66. Opcodes (Alphabetical Listing) (Sheet 3 of 3)
Name Opc MC Rx/Tx By? Desc

Uncore Performance Monitoring
272 Intel® Itanium® Processor 9300 Series Reference Manual for Software Development and Optimization, March 2010
Identifying Multi-Core and Multi-Threading
Intel® Itanium® Processor 9300 Series 273Reference Manual for Software Development and Optimization, March 2010
A Identifying Multi-Core and Multi-Threading
The dual-core Intel® Itanium® processors and the Intel® Itanium® processor 9300 series support multi-threading and multi-core technologies. This chapter covers common programming questions related to these technologies. The rest of the chapter is organized into two parts – the first part describes architectural support for system software to detect multi-threading and multi-core technologies as well as cache sharing information by the logical processors; the second part highlights operating system-specific mechanisms to return such information to applications.
A.1 Architectural Support
A.1.1 Terminology
Physical Processor / Physical Processor Package – A physical processor or physical processor package can contain one or more logical processors, organized into threads and cores.
Logical Processor – A logical processor is a compute-capability-centric view of the CPU that allows the physical processor package to execute from more than one instruction stream. A physical processor package that can execute from n instruction streams has n logical processors.
Threads – Threads are logical processors that share core pipeline execution resources.
Cores – Cores are defined as a collection of hardware that implements the main execution pipeline of the processor. Multiple cores on a physical processor package do not share core pipeline resources but may share caches and bus interfaces. A core may support multiple threads of execution.
A.1.2 Detection of Hyper-Threading Technology
The PAL procedure PAL_LOGICAL_TO_PHYSICAL can be used to detect the availability of multi-threading. This PAL procedure is supported on all processor implementations that contain more than one logical processor in a physical processor package. The tpc (threads per core) field in log_overview return value indicates whether multi-threading is available on the physical processor package the procedure called was made.
Please refer to "Processor Abstraction Layer" chapter in Volume 2 of the Intel® Itanium® Architecture Software Developer’s Manual for definition and usage of PAL_LOGICAL_TO_PHYSICAL procedure.
Identifying Multi-Core and Multi-Threading
274 Intel® Itanium® Processor 9300 Series Reference Manual for Software Development and Optimization, March 2010
A.1.3 Number of Cores on a Physical Processor
The PAL procedure PAL_LOGICAL_TO_PHYSICAL returns information on logical to physical processor mappings. When this procedure is called on a logical processor, the field cpp (cores per processor) in the return value log_overview indicates the number of cores of the physical processor on which the logical processor belongs to.
Please refer to "Processor Abstraction Layer" chapter in Volume 2 of the Intel® Itanium® Architecture Software Developer’s Manual for definition and usage of PAL_LOGICAL_TO_PHYSICAL procedure.
A.1.4 Number of Threads in a Core
The PAL procedure PAL_LOGICAL_TO_PHYSICAL returns information on logical to physical processor mappings. When this procedure is called on a logical processor, the field tpc (threads per core) in the return value log_overview indicates the number of threads in the core on which the logical processor belongs to.
Please refer to "Processor Abstraction Layer" chapter in Volume 2 of the Intel® Itanium® Architecture Software Developer’s Manual for definition and usage of PAL_LOGICAL_TO_PHYSICAL procedure.
A.1.5 Number of Logical Processors Enabled on a Physical Processor
The PAL procedure PAL_LOGICAL_TO_PHYSICAL returns information on logical to physical processor mappings. When this procedure is called on a logical processor, the field num_log in the return value log_overview indicates the number of logical processors enabled on the physical processor.
Please refer to "Processor Abstraction Layer" chapter in volume 2 of the Intel® Itanium® Architecture Software Developer’s Manual for definition and usage of PAL_LOGICAL_TO_PHYSICAL procedure.
A.1.6 Logical to Physical Translation
The PAL procedure PAL_LOGICAL_TO_PHYSICAL returns information on logical to physical processor mappings. When PAL_LOGICAL_TO_PHYSICAL procedure is called on a logical processor, the procedure returns the unique tid (thread ID), cid (core ID) and ppid (physical processor package ID) values corresponding of the logical processor.
Please refer to "Processor Abstraction Layer" chapter in volume 2 of the Intel® Itanium® Architecture Software Developer’s Manual for definition and usage of PAL_LOGICAL_TO_PHYSICAL procedure.
A.1.7 Number of Logical Processors Sharing a Cache
The PAL procedure PAL_CACHE_SHARED_INFO provides information on the number of logical processors sharing a certain cache level. The num_shared return value indicates the number of logical processors that share the specified processor cache level.
Please refer to "Processor Abstraction Layer" chapter in volume 2 of the Intel® Itanium® Architecture Software Developer's Manual for definition and usage of PAL_CACHE_SHARED_INFO procedure.
Identifying Multi-Core and Multi-Threading
Intel® Itanium® Processor 9300 Series 275Reference Manual for Software Development and Optimization, March 2010
A.1.8 Determine which Logical Processors are Sharing a Cache
The steps below can be used to identify the logical processors sharing a certain cache level within a physical processor package:
1. Call PAL_CACHE_SHARED_INFO to determine the number of threads that shares the specific cache level. The return value num_shared indicates the number of logical processors sharing the specified cache level.
2. For the specific cache level, call PAL_CACHE_SHARED_INFO with different proc_number parameter in a loop and record the tid (thread ID), cid (core ID) and la (Logical address) of each logical processor sharing that cache level.
Repeat the above steps as needed for other cache levels.
Parse the thread and core information recorded from the steps above to identify the logical processors sharing the same core. Caches can be shared at core level by multiple threads or at physical package level by multiple cores.
Please refer to "Processor Abstraction Layer" chapter in volume 2 of the Intel® Itanium® Architecture Software Developer’s Manual for definition and usage of PAL_CACHE_SHARED_INFO procedure.
A.2 Operating System Specific MechanismsThe following sections highlight multi-core and multi-threading support available on HP-UX*, Linux, and Microsoft Windows. For up-to-date information and operating systems not listed in this section, please refer to documentations from corresponding operating system vendor.
A.2.1 HP-UX*
Please refer to the following documents for design considerations, system calls and code samples on multi-core and multi-threading programming for the HP-UX operating system:
• "Dynamic logical processors for Hyper-Threading on HP-UX 11i v3
• "HP-UX Reference: Section 2: System Calls
Both documents are available at http://www.hp.com.
A.2.2 Linux*
Older versions of Linux provide topology information only through /proc/cpuinfo. Each online logical processor in the system is listed in turn with entries describing various attributes of that logical processor. Useful items are:
• ""physical id" – This number will be the same for logical processors that are part of the same physical processor package.
• ""siblings" – Total number of logical processors that share a physical processor package.
• ""core id" – Identifies to which core on a package this logical cpu belongs.
• ""thread id" – Identifies which thread on a core.
Identifying Multi-Core and Multi-Threading
276 Intel® Itanium® Processor 9300 Series Reference Manual for Software Development and Optimization, March 2010
Versions of Linux newer than 2.6.15 provide more information through a number of files in /sys/devices/system/cpu/cpuN/topology/:
• ""physical_package_id" – same as "physical id" in /proc/cpuinfo.
• ""core_id" – same as "core id" in /proc/cpuinfo.
• ""core_siblings" – Hexadecimal representation of a bitmask showing which logical cpus share a physical package. For example, 8881 means that logical cpu numbers 0, 7, 11 and 15 share a package.
• ""thread_siblings" – Bitmask showing which logical cpus are threads sharing the same core. For example, 0801 means cpus 0 and 11.
Linux versions newer than 2.6.17 provide cache topology information in /sys/devices/system/cpu/cpuN/cache/indexM/*. For each cache level and type the following informational files are provided:
• ""level", "type" – Cache level (1-3), and type (Instruction, Data or Unified).
• ""shared_cpu_map" – bit mask of logical cpus that share this cache.
A.2.3 Microsoft Windows*
Windows-based applications can obtain processor topology and cache sharing information through GetLogicalProcessorInformation API. Please refer to Microsoft Developer Network (MSDN) for details.
Platform topology enumeration sample code is available under Intel® Software Network. (http://www3.intel.com/cd/ids/developer/asmo-na/eng/dc/itanium/335391.htm)
§