Embed Size (px)
Citation preview

Intel® JTAG Debugger
1

Copyright© 2013, Intel Corporation. All rights reserved. *Other brands and names are the property of their respective owners.
What you will learn from this slide deck
• Intel® JTAG Debugger for
Linux*, Android* & Tizen™ Targets
• In-depth explanation of JTAG features for each development environment mentioned above
• Please see subsequent slide decks for in-depth technical training on other components
2

Copyright© 2013, Intel Corporation. All rights reserved. *Other brands and names are the property of their respective owners.
Intel® JTAG Debugger 2014
Accelerate system bring up and validation
3
Key Features • New: JTAG debug for Intel® Core™, Xeon® & Quark SoC-based platforms
• New: Agent based UEFI debug
• JTAG system debug with event tracing (SVEN)
• Bitfield editor with full register description
• EFI/UEFI Firmware, bootloader debug, Linux* OS awareness
• Flashing and peripheral register support
• Access to page translation and descriptor tables
• Dynamically loaded kernel module debug
• LBR On-Chip instruction trace support, SMP run control support

Copyright© 2013, Intel Corporation. All rights reserved. *Other brands and names are the property of their respective owners.
Intel® JTAG Debugger 2014
Page Translation Table Insight into Memory Configuration
4
• Identify why memory access failed
• Complete register description & manipulation
• Instant and simple resolution & translation
between virtual and physical address space
Take control of memory configuration issues and memory leaks
Memory address translation
Fast issue tracking
• Bitfield Editor
• Edit registers
• Full register
description

Copyright© 2013, Intel Corporation. All rights reserved. *Other brands and names are the property of their respective owners. 5
Intel® JTAG Debugger & GDB* System Debug and Validation
5
Kernel & user mode • Platform stability and start-up
• Firmware & bootloader
• Flash write & repair
• Operating system & driver
• Application debug

Copyright© 2013, Intel Corporation. All rights reserved. *Other brands and names are the property of their respective owners.
Intel® JTAG Debugger 2014 Instruction Trace Support
Where did things start to go wrong?
Unroll past execution flow for fast issue resolution
6
Executed Branch Trace Buffer Restore complete execution path from branch points + source code
Executed Application
Register Stack
Record Branches
Kernel or Application Source Code
Send branch trace information to Debugger
Intel® Atom™ and 4th Gen. Intel® Core™ Processor supports Last Branch Record (LBR)
Set breakpoint in OS signal event handler
Unroll execution flow leading up to stack overflow or segmentation fault
Follow execution backwards to where it deviated from expectation
Re-run to that point and analyze memory accesses

Copyright© 2013, Intel Corporation. All rights reserved. *Other brands and names are the property of their respective owners.
SVEN - A Stethoscope for your System System & SoC trace through JTAG
7
Trace Visualization
Advanced navigation, search & filter
Graphical and textual event display
User controlled trace line grouping
Smart Event Triggers
Live JTAG system debug with event tracing
Smart breakpoints that interrupt execution on trace event calls
Set smart breakpoints for in-depth analysis
For example:
Break on any event from the USB driver
Break on any Debug String that starts with “ERROR”
Break if register X is accessed
Break if register X bits [7-9] have value 0b101
• Timeline view
• Search & Filter
• Smart Event Trigger
definition
Enhance system stability through powerful JTAG & event tracing

Copyright© 2013, Intel Corporation. All rights reserved. *Other brands and names are the property of their respective owners. 8
Flash Memory Tool
• Broad flash type support - NOR and NAND
• Flash binary and hex files
• Mechanism to recover corrupted flash - Intel® Atom™ Processor CE5300
• Backup flash contents into binary file on host
• Erase/unlock/lock blocks
• Ideal for fast BIOS update
Flash Memory
• Burn
• Erase/Unlock
• Backup
Easy to use flashing tool • Multiple flash types • NOR & NAND
Updating key system software stack components, made easy
Intel® JTAG Debugger 2014 Flashing Target Images & Bootloader

Copyright© 2013, Intel Corporation. All rights reserved. *Other brands and names are the property of their respective owners.
Phase Component Feature Benefit
Verify,
Debug
& Flash
Intel® JTAG Debugger
20141
In-depth system and application debug
• Intel® Core & Intel® Xeon & Intel® Quark support
• Source level debug of OS kernel software, drivers, firmware,
BIOS, UEFI
• SVEN 1.0 - Ultra-fast software SoC trace infrastructure for
debug
• In-depth debug insight into CPU, SoC and chipset for
fast issue resolution
• Leave trace instrumentation in production code for
fast system-wide issue resolution
GDB* Debugger • Enhanced GDB* application debugger
• Detailed application debug and trace for fast issue
resolution
• Data race detection in parallel software
Intel® Inspector 2014
for Systems • Memory & threading analysis for improved code quality
• Increased productivity and code quality, and lowers
cost, finds memory, threading , and security defects
before they happen
Tune
Intel® VTune™ Amplifier
2014 for Systems
In-depth software analysis and tuning
• SoC wide analysis
• Power and performance profiling
• Fast in-depth analysis of SoC behavior
• Remove guesswork, saves time, makes it easier to
optimize for power efficiency and find performance
optimization opportunities
• In-depth analysis on resource limited targets
Intel® Graphics
Performance
Analyzers
• In-depth GPU analysis for Android* • Optimize user experience of IA-based Android*
devices
Build
Intel® C++ Compiler 14
Compiler and performance libraries
• High-performance C/C++ cross compiler; Intel® Cilk™ Plus
threading runtime • Eclipse and sysroot support
• A set of high-performance software building blocks for signal,
media, and data processing
• Leading provider of high-performance math functions for
operations such as FFTs (1/2/3-d), linear algebra, and others
• Boost system performance for IA-based embedded
designs and achieve scalability benefits of multicore
and forward scale to many-core
• Cross platform development and integration into
Eclipse for ease-of-use
• Speed up development & performance with key
software building blocks for signal, data, and media
processing
• GCC* compatibility
Intel® Integrated
Performance
Primitives 8.1
Intel® Math Kernel
Library 11.1
Enhance power efficiency, system reliability, and boost performance with Intel® System Studio 2014
Intel® System Studio 2014
9 1 Optional component

Copyright© 2013, Intel Corporation. All rights reserved. *Other brands and names are the property of their respective owners.
Windows* Host Build and Debug Support with Eclipse* Integration
10
Windows* Host Eclipse* integration for SVEN, GDB and Intel® C++ Compiler

Copyright© 2013, Intel Corporation. All rights reserved. *Other brands and names are the property of their respective owners.
Supported OSs
11
Host: • Red Hat Enterprise* Linux* 5, 6 • Ubuntu* 10.04 LTS, 12.04 LTS, 13.04 • Fedora* 17, 18 • Wind River* Linux* 4, 5 • openSUSE 12.1 • SUSE LINUX Enterprise Server* 11 SP2 • Microsoft* Windows* 7,8
Target:
• Yocto Project* 1.3, 1.4, and newer based environment • CE Linux* PR32 based environment • Tizen* IVI 1.0, 2.0 • Wind River* Linux* 4, 5 based environment • Android 4.0.x – 4.4.x

Copyright© 2013, Intel Corporation. All rights reserved. *Other brands and names are the property of their respective owners.
Intel® JTAG Debugger(XDB) System Software Debug Solution
• EFI/UEFI Firmware Debug • ELF Dwarf / PDB symbol info support • Complex Software Breakpoints • Source File Bookmarks • Memory Layout and Page Table views • Descriptor Table Views (GDT, LDT, IDT) • Linux* OS awareness
Kernel Thread Views, Kernel Module Debug • Hardware/Platform register access • Hardware Threads • LBR based Hardware trace capability support • Advanced Scripting • Flash Writer
System Software Debug with in-depth register and memory configuration awareness – from Firmware to OS
IPT Support

Copyright© 2013, Intel Corporation. All rights reserved. *Other brands and names are the property of their respective owners.
Debug Firmware and Bootloaders
• Debug SEC, PEI, DXE phase EFI debug support • Source level debug for modules in flash, RAM and shadowed mode • Tree view of firmware modules • Automatic load of source files • Step and set breakpoints as in any high level language debugger
3
JTAG assisted firmware and bootloader debug made easy

Copyright© 2013, Intel Corporation. All rights reserved. *Other brands and names are the property of their respective owners.
Agenda
HW requirements
Installation
Start-up
GUI features
– Run control
– Symbol handling
– Breakpoints
– Display features
Command line
BIOS & OS/OS driver debugging
Additional features & Summary
14

Copyright© 2013, Intel Corporation. All rights reserved. *Other brands and names are the property of their respective owners.
Hardware requirements
15
Target: 1. A supported Atom processor CPU 2. An access port for the JTAG probe: – Macraigor Usb2Demon™ - Intel® ITP-XDP3 3. Memory for debugee

Copyright© 2013, Intel Corporation. All rights reserved. *Other brands and names are the property of their respective owners.
Installation
• Different flavours of the debugger depending on what target OS support you require. Example:
– Vanilla 2.6 & 3.0 Linux kernel
– Yocto 1.1/1.2 Embedded Linux kernel
• Debugger part of different tool packages
• Depending on the tool suite there might be restrictions on what host OS is required [Windows (XP,7), Linux (Ubuntu/Fedora) 32/64 bit]
• Run the installation script [part of the tool suite installation]
16

Copyright© 2013, Intel Corporation. All rights reserved. *Other brands and names are the property of their respective owners.
Start-up
1. Make sure the probe is connected to target [and host]
2. Probe driver installed and loaded
3. Target running
4. Select debugger start-up script and run
Probe
CPU
17

Copyright© 2013, Intel Corporation. All rights reserved. *Other brands and names are the property of their respective owners.
What can go wrong?
Check for any Debugger Error message!
Some typical issues:
- On Linux host:
- Debugger GUI requires JRE [version 1.6 or later]
- Initial probe communication require ‘fxload’ to be installed on host
- Are the rules file correctly installed
- Probe driver installed
18
Copyright© 2013, Intel Corporation. All rights reserved. *Other brands and names are the property of their respective owners.
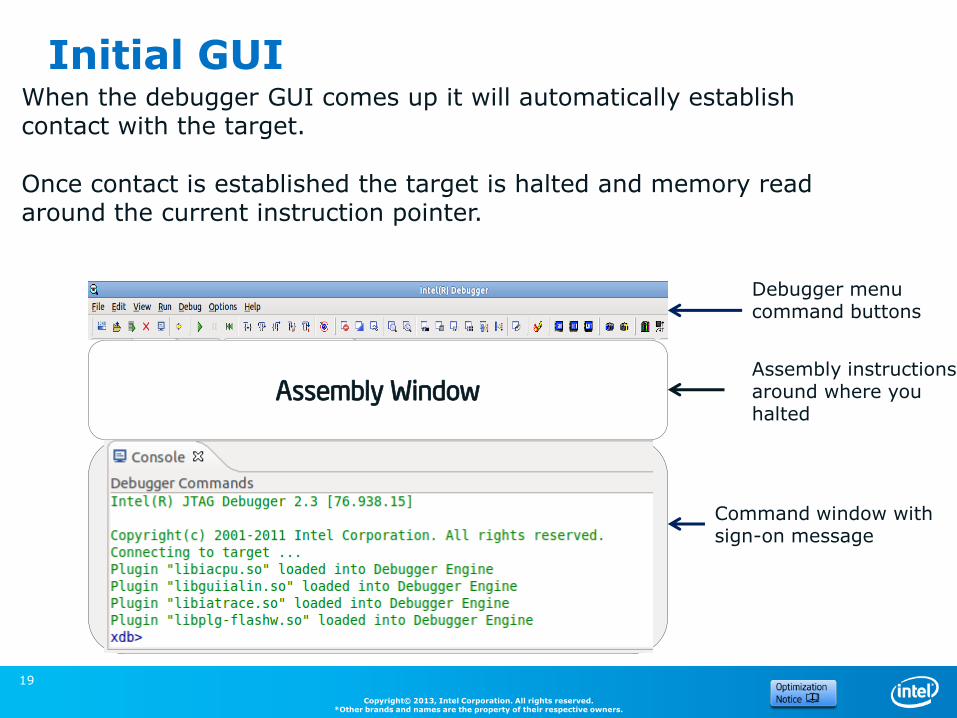
Initial GUI When the debugger GUI comes up it will automatically establish contact with the target.
Once contact is established the target is halted and memory read around the current instruction pointer.
Assembly Window
Debugger menu command buttons
Assembly instructions around where you halted
Command window with sign-on message
19

Copyright© 2013, Intel Corporation. All rights reserved. *Other brands and names are the property of their respective owners.
Source files
20

Copyright© 2013, Intel Corporation. All rights reserved. *Other brands and names are the property of their respective owners.
GUI – target run control
Run/continue, single step, stop/halt and reset are basic features. Three ways of specifying any command:
- Using a control/function key combination on your keyboard (ex. F5 for run/continue)
- Writing the command in console window
- Using the GUI menu icons
21

Copyright© 2013, Intel Corporation. All rights reserved. *Other brands and names are the property of their respective owners.
Run control icons (& key-code)
Instruction (asm) step over (F7)
Instruction (asm) step into (F6)
Run until caller (Shift + F11)
Step one source line proceeding through function calls (F12)
Step program until next source line (F11)
Target reset (Shift + Cntrl + F5)
Suspend execution (Pause)
Run or Continue (F5)
22

Copyright© 2013, Intel Corporation. All rights reserved. *Other brands and names are the property of their respective owners.
Symbol handling
The debugger allows source level debugging (using symbols) provided that we have symbol information for the binary loaded in the target.
Target System
Debugger
GUI
JTAG probe
Binary file with debug information
Dowloaded or in Flash
Debugger needs this information
23
Copyright© 2013, Intel Corporation. All rights reserved. *Other brands and names are the property of their respective owners.
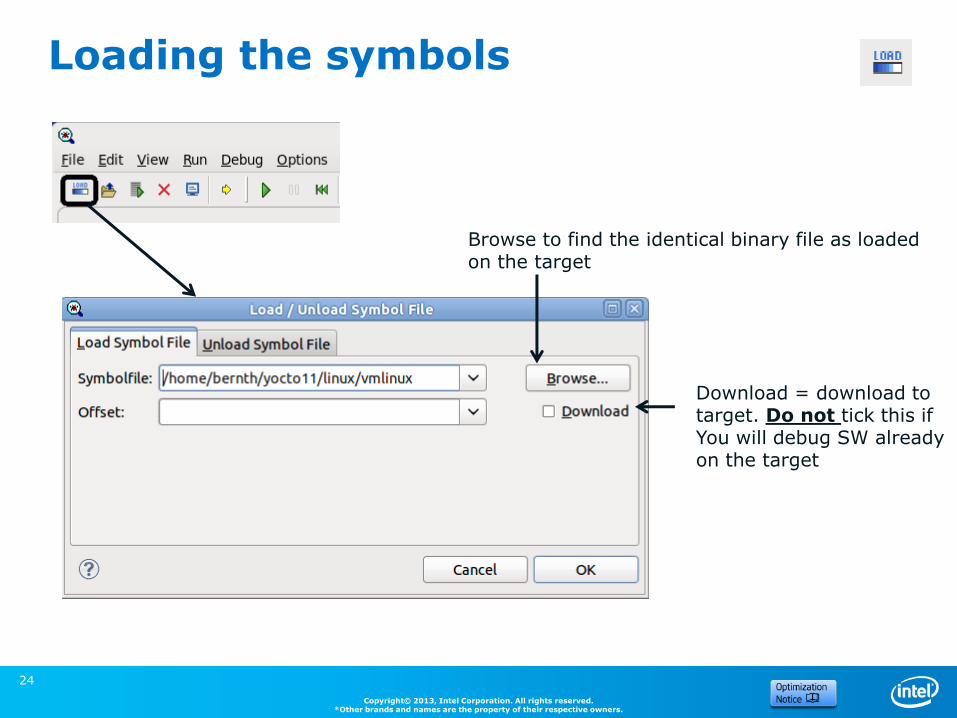
Loading the symbols
Browse to find the identical binary file as loaded on the target
Download = download to target. Do not tick this if You will debug SW already on the target
24

Copyright© 2013, Intel Corporation. All rights reserved. *Other brands and names are the property of their respective owners.
How to find the sources The debugger will try to find the source file which matches the current instruction pointer. If it cannot find the file it will ask you to do a manual search.
25

Copyright© 2013, Intel Corporation. All rights reserved. *Other brands and names are the property of their respective owners.
Select source files to view
With the ‘Source Files’ icon you can open a window which contains the source tree as found in the binary file loaded in the debugger. Just double click on any of the source file names to open the file in the source window.
26

Copyright© 2013, Intel Corporation. All rights reserved. *Other brands and names are the property of their respective owners.
“You know the name of the source file”
Click on Open Source File icon and in the dialog which open: - scroll to the file - type the name of the file in the filter field
27

Copyright© 2013, Intel Corporation. All rights reserved. *Other brands and names are the property of their respective owners.
Evaluate symbols
Hover the curser over a variable and the debugger will show you its value
Highlight a variable and use the ‘right mouse click’ – additional options are now available
28

Copyright© 2013, Intel Corporation. All rights reserved. *Other brands and names are the property of their respective owners.
Local variables
Local variable window will display all variables which are accessible from within current scope
The example above shows part of the ‘rq’ structure
In expression field indicate that this is a compound element and that it has been Expanded ( > for not expanded)
29

Copyright© 2013, Intel Corporation. All rights reserved. *Other brands and names are the property of their respective owners.
How did I reach the current location?
Function tree – bottom up Only address presented when no debug information available
Source file: line number Current file
30

Copyright© 2013, Intel Corporation. All rights reserved. *Other brands and names are the property of their respective owners.
Breakpoints
There are basically two types of breakpoints: - Code Breakpoints - Watchpoints or data breakpoints ; also include I/O accesses
As Breakpoints are an essential feature for a debugger there are a number of way of defining a breakpoint:
- Via menu entry dialog box - In the source window - From the Breakpoint window
31

Copyright© 2013, Intel Corporation. All rights reserved. *Other brands and names are the property of their respective owners.
Create a breakpoint
Minimum - code location is required. Hard option allow you to set a breakpoint even if the memory location is not accessible
For Watchpoints the location, access type and length are important
32

Copyright© 2013, Intel Corporation. All rights reserved. *Other brands and names are the property of their respective owners. 33
Breakpoints cont.
Extract from source code:
Code breakpoint
Data breakpoint

Copyright© 2013, Intel Corporation. All rights reserved. *Other brands and names are the property of their respective owners.
Display features - registers
Next slide
34

Copyright© 2013, Intel Corporation. All rights reserved. *Other brands and names are the property of their respective owners.
Example: System Controller Registers entry. With many of the registers having individual bits with unique
interpretations the programmer can use a bit field editor to inspect and change those values
35

Copyright© 2013, Intel Corporation. All rights reserved. *Other brands and names are the property of their respective owners. 36
Vector registers

Copyright© 2013, Intel Corporation. All rights reserved. *Other brands and names are the property of their respective owners.
More display features - memory
As address you can specify: - logical address - linear address - browse for a symbol - physical address: phys(0xnnnnnnnn)
37

Copyright© 2013, Intel Corporation. All rights reserved. *Other brands and names are the property of their respective owners.
What about paging?
Double click on a page table/directory entry and You will have the ability to modify the attribute bits with the bit field editor
38

Copyright© 2013, Intel Corporation. All rights reserved. *Other brands and names are the property of their respective owners.
Virtual -> physical address mapping
Select an address and press Translate to find the address mapping. When you press OK the page directory/table involved will be shown in the Paging window
39

Copyright© 2013, Intel Corporation. All rights reserved. *Other brands and names are the property of their respective owners.
Descriptor tables - view
For each entry in the descriptor tables you can view the important bits - excluding the address information (base + limit)
40

Copyright© 2013, Intel Corporation. All rights reserved. *Other brands and names are the property of their respective owners.
41

Copyright© 2013, Intel Corporation. All rights reserved. *Other brands and names are the property of their respective owners.
Instruction Trace Support
Intel® Atom™ Processor supports Last Branch Record (LBR) using a set of internal registers
Debugger can display the collected trace data – reconstructed execution flow
Code executed on target
Register stack
Read by the debugger
42

Copyright© 2013, Intel Corporation. All rights reserved. *Other brands and names are the property of their respective owners.
Enable & Display trace
open the trace window with the icon Enable / Disable trace by right mouse click in the trace window and select from the options.
The collected data will be displayed in the open trace window
Run to collect data
43

Copyright© 2013, Intel Corporation. All rights reserved. *Other brands and names are the property of their respective owners.
Multiple HW threads
The debugger can display how the multiple logical cores are used and indicate which logical core is used by the current code displayed. You can select a logical core and continue debugging the SW running there.
44

Copyright© 2013, Intel Corporation. All rights reserved. *Other brands and names are the property of their respective owners.
Command line usage
You can specify all the commands which we have looked at so far from command line. In the console window you find often a lot of text – here the debugger output error/warning messages and the equivalent command line for the GUI selections done. The bottom line in the console window is ‘reserved’ for your input [commands].
Example:
45

Copyright© 2013, Intel Corporation. All rights reserved. *Other brands and names are the property of their respective owners.
Generate & Run script files
You can record a debug session and later ‘replay’ it.
Useful for generating ‘over-night-tests’
There are two options to generate a script file: - ‘Start Command Recording’ will store all commands you make in the file [specified in the dialog which opens] until you select Stop Command Recording - ‘Start IO Recording’ will also, in addition, collect any outputs from the debugger
To run any script file click on the icon and provide the data needed (min name of the script file) in the dialog which opens
46

Copyright© 2013, Intel Corporation. All rights reserved. *Other brands and names are the property of their respective owners.
EFI BIOS debugging
47
EFI environment uses relocatable code modules. To debug any of those modules you need to provide the address of the code to the debugger. There are a set of console commands to identify an efi-module and load corresponding symbols.
xdb> efi "loadthis" INFO: Software debugger set to: efi64 - EFI/PI compliant BIOS (64-bit mode) INFO: Using DRAM search semantics, align=0x00001000 range=0x00100000 INFO: Searching backwards from 0x00000000809FB6C3 to 0x00000000808FB6C3 for PE/COFF header INFO: Found PE/COFF module at 0x00000000809FB000 - 0x00000000809FF1C0 (size: 16832 bytes) INFO: Loading debug symbols found at: e:\dev.efi\work\Build\MdeModule\NOOPT_VS2008x86\X64\MdeModulePkg\Application\xdbefiutil\ xdbefiutil\DEBUG\xdbefiutil.efi
xdb> efi showsystab INFO: Software debugger set to: efi64 - EFI/PI compliant BIOS (64-bit mode) INFO: Reading EFI_DEBUG_IMAGE_INFO table, this could take a little while... EFI System table at 0x00000000AF536F18 Configuration Tables: ________________________________________________________________________ GUID: Pointer: Name: GUID 05ad34ba, 6f02, 4214, {...} 0xae72bdb0 DXE_SERVICES_TABLE
xdb> efi showmodules INFO: Software debugger set to: efi64 - EFI/PI compliant BIOS (64-bit mode) INFO: Using cached EFI State Information ________________________________________________________________________ ModuleID Base Size Name 00000 0x00000000AE71C000 0x00013F51 DxeMain.efi … xdb> efi "load Shell.efi"

Copyright© 2013, Intel Corporation. All rights reserved. *Other brands and names are the property of their respective owners.
Debugging BIOS & Linux kernel
The Debugger is OS agnostic* – you can source level debug any code provided that you have the symbol information. * With the exception that it is aware of Linux kernel threads which can be displayed by selecting the icon
48

Copyright© 2013, Intel Corporation. All rights reserved. *Other brands and names are the property of their respective owners.
Debugging loadable modules
There is a Linux kernel module [idbntf] provided with the debugger which you can build and install – you then can load & debug Linux kernel modules [for example: loadable drivers]
Before driver loaded:
After driver loaded – insmod sum3.ko:
49

Copyright© 2013, Intel Corporation. All rights reserved. *Other brands and names are the property of their respective owners.
Additional features: Modify target code on the fly
Powerful tool for on-the-fly testing and rerun of test and firmware code
• Open memory window or disassembly window
• The hex values can be modified – memory window
• Opcodes or mnemonics can be overwritten – disassembly window
50

Copyright© 2013, Intel Corporation. All rights reserved. *Other brands and names are the property of their respective owners.
Additional features cont.
Flashing Target Images and Bootloader
Intel® JTAG Debugger Flash Memory Tool – Flash binary and hex files – Erase/unlock/lock blocks – Backup flash contents into binary file on host – Ideal for BIOS update
Flash "select /board= 'target board'" Flash "change offset 0x00" Flash "change data file '/home/qa/BIOS50.bin'" Flash "burn flash false true true"
51

Copyright© 2013, Intel Corporation. All rights reserved. *Other brands and names are the property of their respective owners.
SoC Trace – low overhead technology for static instrumentation of key SoC components
52
Intrumented Software Modules of Devices & Systems
Event Recorder
JTAG Device
Device
Kernel
User
• Event tracing with JTAG • Smart breakpoints
• Interrupt execution on key events
• Visualize, Analyze and Debug system event traces • Command line
interface • Graphical interface
SVEN Event: V

Copyright© 2013, Intel Corporation. All rights reserved. *Other brands and names are the property of their respective owners.
Additional features cont. SoC Trace support
This feature require System Software support on target!
53
Trace Visualization • Advanced navigation and search
capabilities • Graphical and textual event displays
Smart Event Triggers • Live JTAG system debug with event
tracing • Smart breakpoints that interrupt
execution on trace event calls

Copyright© 2013, Intel Corporation. All rights reserved. *Other brands and names are the property of their respective owners.
Summary
Intel® JTAG Debugger is a powerful tool which allows you to:
• Use GUI based source level debugging of BIOS, OS kernels and drivers
– Bitfield editor supporting Atom™ based CPUs and SoCs
– Flashing and peripheral register support
– Access to page translation and descriptor tables
– Dynamically loaded kernel module debug
– On-Chip trace support
– SMP run control support
– Linux* awareness support
54

Copyright© 2013, Intel Corporation. All rights reserved. *Other brands and names are the property of their respective owners.
Summary / Next Steps Intel® System Studio 2014
55
http://intel.ly/system-studio
The next step in Intelligent Systems Software Development
1. Windows* Host and Linux* Host Support with Eclipse* Integration 2. Support for Intel® Atom™ Processor E3xxx (Baytrail SoC) 3. Support for Tizen* IVI 4. Intel® C++ Compiler Improvements
• Optimizations for latest Intel processors • improved sysroot and GNU cross-build integration support • Cross-build support for Windows* host and Wind River* Linux* target
5. Extended Intel® VTune™ Amplifier System-Wide Analysis 6. Yocto Project* Compatible 7. Intel® JTAG Debugger support for next generation processors of all sizes$
8. Graphical installer for both Windows* host and Linux* host

Copyright© 2013, Intel Corporation. All rights reserved. *Other brands and names are the property of their respective owners.
INFORMATION IN THIS DOCUMENT IS PROVIDED “AS IS”. NO LICENSE, EXPRESS OR IMPLIED, BY ESTOPPEL OR OTHERWISE, TO ANY INTELLECTUAL PROPERTY RIGHTS IS GRANTED BY THIS DOCUMENT. INTEL ASSUMES NO LIABILITY WHATSOEVER AND INTEL DISCLAIMS ANY EXPRESS OR IMPLIED WARRANTY, RELATING TO THIS INFORMATION INCLUDING LIABILITY OR WARRANTIES RELATING TO FITNESS FOR A PARTICULAR PURPOSE, MERCHANTABILITY, OR INFRINGEMENT OF ANY PATENT, COPYRIGHT OR OTHER INTELLECTUAL PROPERTY RIGHT. Software and workloads used in performance tests may have been optimized for performance only on Intel microprocessors. Performance tests, such as SYSmark and MobileMark, are measured using specific computer systems, components, software, operations and functions. Any change to any of those factors may cause the results to vary. You should consult other information and performance tests to assist you in fully evaluating your contemplated purchases, including the performance of that product when combined with other products. Copyright © , Intel Corporation. All rights reserved. Intel, the Intel logo, Xeon, Core, VTune, and Cilk are trademarks of Intel Corporation in the U.S. and other countries.
Optimization Notice
Intel’s compilers may or may not optimize to the same degree for non-Intel microprocessors for optimizations that are not unique to Intel microprocessors. These optimizations include SSE2, SSE3, and SSSE3 instruction sets and other optimizations. Intel does not guarantee the availability, functionality, or effectiveness of any optimization on microprocessors not manufactured by Intel. Microprocessor-dependent optimizations in this product are intended for use with Intel microprocessors. Certain optimizations not specific to Intel microarchitecture are reserved for Intel microprocessors. Please refer to the applicable product User and Reference Guides for more information regarding the specific instruction sets covered by this notice.
Notice revision #20110804
Legal Disclaimer & Optimization Notice
Copyright© 2012, Intel Corporation. All rights reserved. *Other brands and names are the property of their respective owners.
56
2/19/2014

Intel® System Studio JTAG Debugger

Agenda
• HW requirements
• GUI features
• OS/OS Driver debugging
• Summary
58

Hardware requirements
Target: 1. An Atom-based Phone/Tablet (Merrifield/Cherry Trail…) 2. Intel® ITP-XDP3 3. Debug card to connect between the phone and ITP 59

start_xdb_XDP3_Merrifield.sh
start_xdb_XDP3_CherryTrail.sh
Start-up
1. Make sure the probe is connected to target [and host]
2. Probe driver installed and loaded (libusb & fxload)
3. Target running
4. Select debugger’s start-up script of your target and run
Probe Type
Processor Type 60

Source files
61

Debugger needs this information
Symbol handling
• The debugger allows source level debugging (using symbols) provided that we have symbol information for the binary loaded in the target.
Target Phone/Tablet
Debugger
GUI Debug Card & ITP
Binary file with debug information
62

Example: System Controller Registers entry. With many of the registers having individual bits with unique
interpretations the programmer can use a bit field editor to inspect and change those values
63

Enable & Display trace
open the trace window with the icon Enable / Disable trace by right mouse click in the trace window and select from the options.
The collected data will be displayed in the open trace window
Run to collect data
64

Debugging Android* kernel
The Debugger is OS agnostic* – you can source level debug any code provided that you have the symbol information. * With the exception that it is aware of Android kernel threads which can be displayed by selecting an icon
65

Summary
• Intel® JTAG Debugger is a powerful tool which allows you to:
• Use GUI based source level debugging of OS kernels and drivers • Bitfield editor supporting Atom™ based CPUs and SoCs
• Access to page translation and descriptor tables
• Dynamically loaded kernel module debug
• On-Chip trace support
• Android* awareness support
66
BACKUP

Installation
• Windows*: Just use the exe installer!
• Linux* (Ubuntu*):
68