Embed Size (px)
Citation preview

Master Thesis, Spring 2011
Intellectual Capital
‐ A comparison between internal and
external disclosures
Authors Tutor
Henrik Larsson 830613 ‐ 4852 Johan Dergård
Carl Leijonhielm 851107 ‐ 5999
ii
Preface
The authors would like to express our gratitude to all the people that have supported us
during this study. First of all, we want to thank our tutor and supervisor Johan Dergård for all
his fruitful insights, constructive discussions, guidance and advice during our process of
research and completion of this master thesis. Secondly, a special thank goes to our collegue
Peder Holst.
We would also like to thank all the respondents because they, despite other obligations,
took the time to answer our extensive questionnaire.
Finally we feel the deepest gratitude toward friends, families, room mates and girlfriends
who have put up with us during the time of this study and have motivated and pushed us
forward.
Lund, 25 may 2011
Henrik Larsson Carl Leijonhielm

iii
Abstract
Title: Intellectual Capital – A comparison between external and internal disclosures.
Seminar date: 1th of June, 2011
Course: BUSP03 Degree Project, 15 ECTS
Authors: Henrik Larsson, Carl Leijonhielm
Advisor: Johan Dergård
Five key concepts: Intellectual capital, Human Capital, Relational Capital, Structural Capital, Value creation.
Purpose: The purpose of this thesis is to empirically study companies internal and external reporting of intellectual capital to answer the following three questions: i) How much and what kind of IC information is reported to the top‐management inside a company and ii) How much and what kind of IC information is presented to the stakeholders in the annual report. iii) Is there a correlation or is there discrepancies between I and II. How potential discrepancies exploited between i) and ii) could be explained with the help of theories.
Methodology: An iterative approach has been used. Quantitative data has been collected through email questionnaires with CFO’s, and annual reports have been analyzed with content analysis.
Theoretical perspectives: Mainly the Stakeholder theory backed up with reasoning around the concept of value creation.
Empirical foundation: The empirics derive from answers (1) collected from questionnaires that were sent to the examined companies, and (2) from a content analysis made on the annual reports on those companies.
Conclusions: In the final chapter we present the findings of our research in accordance with its purpose. Furthermore we carry out some critical review of the used methodology. Lastly we present some suggestions for further research.
iv
Table of contest 1. Introduction ................................................................................................................ 1
1.1 Background .................................................................................................................. 1
1.2 Problematization .......................................................................................................... 4
1.3 Purpose ........................................................................................................................ 5
1.4 Outline ......................................................................................................................... 6
2. Method ....................................................................................................................... 7
2.1 Research strategy ......................................................................................................... 7
2.2 Quantitative/Qualitative .............................................................................................. 8
2.3 Selection of companies ................................................................................................ 9
2.4 E‐mail Questionnaires ................................................................................................ 11
2.5 Content analysis of annual reports ............................................................................ 12
2.6 Reliability, validity and objectivity ............................................................................. 14
2.7 Method for analysis ................................................................................................... 15
2.8 Theoretical Framework .............................................................................................. 15
3. Theory ....................................................................................................................... 17
3.1.1 A background to why intellectual capital matters to companies of today .......... 17
3.1.2 How to define IC .................................................................................................. 18
3.1.3 Early definitions of intellectual capital (IC) .......................................................... 19
3.1.4 The state of the current categorization of intellectual capital ............................ 20
3.1.5.1 Human Capital (HC) ................................................................................................. 21
3.1.5.2 Relational Capital (RC) ............................................................................................. 22
3.1.5.3 Structural Capital (SC) ............................................................................................. 23
3.2 Stakeholder Theory .................................................................................................... 23
3.2.1 Ethical versus Positive approach to stakeholder theory ..................................... 25
3.2.2 Complementing Theories .................................................................................... 26
3.2.3 Value creation ..................................................................................................... 27
4. Empirics .................................................................................................................... 28
4.1 Introduction ............................................................................................................... 28
4.2 External Disclosures ................................................................................................... 28
4.2.1 NETCOMP ............................................................................................................ 29
4.2.2 Medcomp ............................................................................................................ 30
v
4.2.3 Alucomp .............................................................................................................. 32
4.2.4 Cellcomp .............................................................................................................. 34
4.2.5 Labelcomp ........................................................................................................... 35
4.2.6 Furcomp .............................................................................................................. 36
4.2.7 Itcomp ................................................................................................................. 37
4.2.8 Biocomp ............................................................................................................... 39
4.3 Internal disclosures .................................................................................................... 40
4.3.1 Summary internal disclosures ............................................................................. 41
4.3.2 Company for company ........................................................................................ 42
4.3.3 Value creation ..................................................................................................... 44
5. Analyze ..................................................................................................................... 46
5.1 Introduction ............................................................................................................... 46
5.2 Charts of the correlation between internal and external disclosures ........................ 47
5.3 Analyze company by company ................................................................................... 51
5.3.1 NETCOMP ............................................................................................................ 51
5.3.2 Furcomp .............................................................................................................. 52
5.3.3 Medcomp ............................................................................................................ 53
5.3.4 Itcomp ................................................................................................................. 54
5.3.5 Alucomp .............................................................................................................. 55
5.3.6 Cellcomp .............................................................................................................. 57
5.3.7 Biocomp ............................................................................................................... 58
5.3.8 Labelcomp ........................................................................................................... 59
6. Conclusion ................................................................................................................ 61
6.1 Conclusion and results ............................................................................................... 61
6.2 Methodology critique ................................................................................................ 62
6.3 Suggestions for further research ................................................................................ 63
7. Source reference ....................................................................................................... 64
7.1 Literature ................................................................................................................... 64
7.2 Articles ....................................................................................................................... 64
7.3 Internet sources ......................................................................................................... 68
8. Appendix – Questionnaire ........................................................................................... 1

1
1. Introduction
The purpose of this introductory chapter is to give the reader a background to the topic of
this thesis. The background is the basis for the subsequent discussion, problematization and
purpose. The chapter ends with a disposition chart of the essay.
1.1 Background
In the background the concept of intellectual capital (IC) is explained and the development
of IC during the last two decades is presented. The reader is provided with an idea of why IC
is an interesting area of study.
Accounting models constantly need to develop in order for them to display relevant
information through internal and external reporting. The reporting is intended to give both
internal and external stakeholders a picture of the current state and future prospects of the
company. To make a correct evaluation of a company it is not enough to look at its tangible
assets. In complement, the intangible assets of the company should be taken into
consideration for a more accurate valuation (Bukh, 2003). Intellectual capital is the most
common model to define and classify the intangible assets (Choong. 2008).
One way of describing the importance of intellectual capital is to use a metaphor, put
forward by Edvinsson (1997). He argues that in order to understand how healthy a tree is at
a given moment, the taste of its fruits or the color of the leaves provides you with suitable
information. However, if you are interested in how the tree will grow in years to come
studying the root system provides you with more interesting information. In a corporate
setting the tangible assets would be the fruits and leaves, while the Intellectual capital is
found in the roots. In the same line of thought, Choong argues that Intellectual capital is the
hidden driver behind success because it possesses values that generate future benefits
(Choong, 2008).
There are many possible explanations to why the interest in intellectual capital has evolved
during the last two decades. An important driving force seems to be that certain industries
are characterized by a highly competitive business environment and simultaneously faced

2
with an exceptionally limited amount of resources. Intellectual capital is a crucial asset under
such circumstances (Kaufman & Schneider, 2004). Another reason for the recent focus on
intellectual capital is the growing importance of knowledge in the economy of today.
Knowledge could be seen as a commodity and should be accounted for just like any other
commodity owned by a company (Kaufman & Schneider, 2004; Alvesson, 2004).
Although intellectual capital is theoretically considered to be increasingly important, this
development still does not seem to be fully accompanied by a different attitude and focus
regarding the disclosure of intellectual capital in the external reporting. One reason why
companies are reluctant to present information about intellectual capital in the annual
report is because the benefits generated by this capital are not necessarily immediately
identifiable, but rather accrued over a long time period (Abeysekera, 2008). If the company
has a short sight focus the IC information is likely not prioritized in the report.
Another reason for the reluctance to disclose IC information is that the investors, who are
important stakeholders, are ambivalent or even critical to IC information compared to
financial data. The investor skepticism has at least four explanations:
• They do not understand that IC is a major contributor to company value creation.
• Even if they understand the connection between IC and value creation they do not
rely on the indicators.
• They distrust al IC that relates to human knowledge because the intangible asset
cannot be owned by the company.
• They cannot control that the measures actually matter in management control
processes.
(Johansson, 2003)
The main reason for the poorly developed IC reporting in the 1990s and early 2000s has
probably been the lack of a formalization of IC via an appropriate definition and
categorization. The unification process has speeded up in the last years with notable
contributions from EU funded projects (MERITUM‐project, RICARDIS‐project) and scientific
research articles (Choong (2008) and Kaufman & Schneider (2004)). Evidence indicating

3
maturity in the field is that a widely recommended framework for categorizing IC has
evolved. In this framework intellectual capital is divided into the three subcategories:
• Human capital
• Relational capital
• Structural capital.
It is important to note that IC information is measured and disclosed through a variety of
methods within companies. There are plenty of examples of more or less famous models
attempting to measure the IC in a company. Two Swedes have received international
recognition in the development of these models. Leif Edvinsson created the Skandia
Navigator that measures key figures regarding human capital, customers and processes. (Ax,
Johansson, Kullvén, 2005). Karl‐Erik Sveiby developed another model called “Intangible Asset
Model”. This model includes indicators of growth, renewal, efficiency, stability and risk
(Sveiby, 1997). The Balanced Scorecard developed by Kaplan and Norton (1992) is a model
which is used in many companies and which also captures a great portion of IC in the three
perspectives customers, internal processes and learning and growth. The BSC was, however,
not designed to capture intangibles in particular like the Edvinsson and Sveiby models
(Kaufman & Schneider, 2004). These examples illustrate how IC information is gathered in
practice in different kinds of management control models.
In the sections above an explanation is given of the rapid development of Intellectual capital
during the last two decades. A framework has been built up of how to measure company
assets that are not recognized in the balance sheet. The actual use of models to measure IC
in companies indicates that companies view IC as something important. The tight connection
between IC and the company’s ability to create value catches our interest. We find it
interesting to execute a study on the companies reporting behavior because it could tell the
story of how information about the companies’ future value creating capacity is accounted
for and disclosed to stakeholders.

4
1.2 Problematization
The problematization discusses how IC information is gathered for two distinct reasons and
a potential problem that could be a product of that is defined.
Today´s companies have a variety of stakeholders to take into consideration when
presenting annual reports. The different stakeholders are interested in the actions, the value
and the performance of the company. According to theories described both in the
introduction and in the theory section IC information is, or at least could be, a vital
component to give the stakeholders the opportunity to correctly analyze the company.
Consequently, IC disclosures are expected in the annual report. Previous research has
studied the disclosure patterns of IC. A suitable method when searching for IC disclosures is
content analysis (Beattie & Thomson 2007). Content analysis is further explained in the
method section of the study. The reason is that IC tends to be disclosed in a variety of ways
including in headings, in body copy sections, in graphs and tables. The advantage of content
analysis is that it manages to evaluate material disclosed in such various ways.
Companies are also expected to gather IC data for internal use. This is a basic condition for
identifying strengths and weaknesses in the different types of IC that a company has built up
to stay competitive. Results from such IC work could be found by looking at internal models
that measure IC levels like the Skandia Navigator, the Balanced Scorecard or by interviewing
or sending out a questionnaire to the company. We have chosen the questionnaire method
due to reasons explained in the method section.
The IC information is therefore collected for two reasons: (1) To provide stakeholders with
information, and (2) to provide internal management with information for internal analysis.
If stakeholders are seen as indispensible it is logical to assume that the IC disclosed to them
should be of the same quality and quantity as the IC information that is intended for the
internal management. If this is the case, the situation could be considered as fair in the
sense that internal management and external stakeholders are given the chance to make
decisions based on the same information.

5
In summary our research question can be formulated as follows:
Are there discrepancies between the external and the internal dimensions of IC information
and can these discrepancies be explained through the use of contemporary theories?
We are interested in studying whether the IC information disclosed in the internal‐ and the
external dimensions are the same both in terms of total quantity and type of information. If
there are discrepancies, we find it also interesting to explain these with the help of relevant
theories. This discussion leads us to the following purpose of the thesis.
1.3 Purpose
The purpose of this thesis is to empirically study companies’ internal and external reporting of
intellectual capital to answer the following three questions: i) How much and what kind of IC
information is reported to the top‐management inside a company? ii) How much and what
kind of IC information is presented to the stakeholders in the annual report? iii) Is there a
correlation or are there discrepancies between i) and ii) and what potential discrepancies
exploited between i) and ii) could be explained with the help of theories?

6
1.4 Outline
Figure 1. Thesis outline.
Introducmon
• The purpose of this introductory chapter is to give the reader a background to this thesis topic. The backround is the basis for the subsequent discussion, problemaDzaDon and purpose. The chapter ends with a disposiDon over the essay.
Method
• In the following chapter the outlines for the thesis methodological choice is presented. We present the research strategy, moDvate our choice of a quanDtaDve study, discuss validity and reliability, discuss our selecDon of theory’s and parDcipants (respondents and companies) in the thesis and examine pros and cons with content analysis and moDvate why we chose this approach.
Theory
• In the theory chapter the key concept of intellectual capital is presented and the definiDon that we use in the thesis is explained. ThereaJer follow a review of the stakeholder theory which is used to explain external disclosures of IC. The chapter ends with a descripDon of the term value creaDon which is used in the quesDonnaire in the study of internal IC reporDng.
Empirics
• In this secDon we present the results from the study of internal and external disclosures of IC. This is made company by company. It starts with a presentaDon of the results from the content analysis. This is displayed both through key figures and text exemplificaDons. AJer that the results from the e‐mail quesDonnaire follow. This is exclusively made by key figures and the results show both the quanDty of IC reported internally and how value creaDng the companies finds IC.
Analyze
• In this secDon we compare the empirical results from the study of internal IC‐reporDng with the study of external IC disclosures. Firstly, we display the overall results in diagrams to show how well the two dimensions of internal and external disclosures correlate. We then analyze the material company by company to explain individual conformity or discrepancy towards the overall result.
Conclusion
• In the final chapter we present our findings of our research in accordance with its purpose. Furthermore carry out some criDcal review of the used methodology. Lastly we present some suggesDons for further research.

7
2. Method
In the following chapter the outline for the thesis’ methodological stand is presented. We
present the research strategy, motivate our choice of a quantitative study, discuss validity
and reliability and discuss our selection of theories and participants (respondents and
companies) in the thesis. The pros and cons with content analysis are discussed we motivate
why we chose this approach.
2.1 Research strategy
To fulfill the purpose of our study, the starting point for this thesis is derived from are
previous literature and theories. The reason for this is that the idea of this paper is to
examine existing theories and see how well they conform to reality rather than to generate
new theories using the empirical investigation. Hence, in terms of the relationship between
theory and research it can therefore be argued that a deductive approach is appropriate to
apply. A deductive approach inclines that existing theory is used as a starting point and steer
the thesis subsequent research to achieve a result that leads to either confirmation or
revision of the theory (Bryman & Bell, 2007). This approach differs from the inductive
approach where the empirical investigation is used as a basis for generating new theories
(Bryman & Bell, 2007). As mentioned in the problem discussion, the authors also intend to
contribute to the improvement of the theories of the emergence of such a need, a target of
inductive character. The authors have thus fluctuated back and forth between data and
theory, as well as being both deductive and inductive, which means that a so‐called iterative
approach has been used (Bryman & Bell, 2007). The choice of the iterative approach is
justified by the existence of numerous studies in the field whose results have been
considered interesting but slightly limited and that this review may lead to a contributing
complement to the theory.
The current studies of intellectual capital (IC) are rather limited in our point of view and they
have mainly focused on external disclosures as exemplified in Beattie and Thomson’s article
“Lifting the lid on use of content analysis to investigate intellectual capital disclosures”
(Beattie & Thomson, 2007). Studies that have investigated the link between external and
internal IC disclosures have focused mainly on one part of intellectual capital, namely Human
capital, while we have extended our study to comprehend the whole concept. We have also

8
tried to explain the findings of our research with theories such as stakeholder theory and
this is also a new input to the existing research.
2.2 Quantitative/Qualitative
There are two distinctive methods that can be applied in the research strategy for collecting
data, namely quantitative and qualitative research (Bryman & Bell, 2007). Most researchers
find it helpful to relate to one of the two paradigms. Quantitative research focus on
collection and analysis of data, while qualitative researches emphasizes words rather than
quantity and numbers in the analysis, and view the social reality as a continuously changing
and constructed by individuals. The choice between qualitative and quantitative methods is
based on which type of information that is desired for the purpose and intended result of
the research (Bryman & Bell, 2007).
For our purpose, we started with the thought of applying a mainly quantitative approach
because we believe it to be more suitable for the iterative approach, even though we realize
that the approach shifts between quantitative and qualitative methods. Our aim is to
provide a more generalizable study than possible if a qualitative method with very few
research respondents had been chosen. This is because of the need of extensive information
from the companies that are examined. The ambition is to make it easier to make a valid
analysis and help the reader to understand the figures and results. The authors choose
questionnaires instead of interviews so that the observer role does not have any effect on
the respondents’ answers in the companies. Lundahl & Skärvad (1999) confirms that the
interviewer might affect the interviewee. This is because the researchers, in this case the
authors, are external observers that cannot affect the respondent examined in the same way
as we could have done if it was an interview face‐to‐face or over telephone. A totally
quantitative approach is difficult because of the limited amount of companies examined, as
well as the fact that information gathered from the companies incorporates widespread
information which makes it hard to capture al of it through quantitative methods. Despite
this we used a typical quantitative method to collect our empirical data material, namely a
questionnaire that we e‐mailed to the respondents. The reason for using a questionnaire
instead of personal interviews was that the questionnaire was designed to only have

9
numerical and graded answers and to fulfill the purpose of the study we did not desire any
extensive answers in floating text from the respondents.
Because of the extensive and widespread nature of the information collected both internally
and externally we also applied some qualitative reasoning in both the empirics, where we
gave some examples of the important ICs disclosures from the annual reports, as well as in
the analysis where we evaluated qualitatively to add depth to the more numerical charts and
tables.
2.3 Selection of companies
There are two central steps when applying quantitative methods for collecting data and
these are (1) selection of a research site, and (2) selection of documents (Bryman & Bell). We
choose to only examine Swedish companies. The reason for this is that Swedish companies
are expected to have much management practices and knowledge around IC (Ax & Marton,
2008). The range of companies is limited to publicly listed companies and the reason for this
is that the comparison between internal and external disclosures becomes interesting only if
they have disclosed enough information in their annual reports. It is necessary to have
publicly listed companies because private companies with a concentrated ownership do not
need to disclose more information than necessary, and we make the assumption that they
do not disclose more than needed.
The study includes Biotech/Medical companies, Manufacturing companies and Data/
IT/Telecom companies. The reason behind this is that we do not want randomly chosen
companies from different industries if, as we assume, there are some context‐specific
conditions in their disclosure that could weaken the result of our study. We chose these
industries because they are big industries with a considerable number of listed companies so
that it would be possible to get in contact with a sufficient amount of companies. There are
approximately 500 publicly listed companies in Sweden and over 60 of them can be found in
these 3 categories (Retriever Bolagsinfo, 2011). In order to find appropriate companies, the
database “Retriever Bolagsinfo” was used. All companies that have a total turnover of at
least 1 MSEK in the chosen industries were selected. The reason for this is the same as
above, that those companies are assumed to disclose more IC items. This is because we
expect that larger companies, that have greater resources, have made considerable

10
deliberations on intellectual capital related disclosures to incorporate in the annual report.
There was also a maximum number of 1000 MSEK of total turnover because the authors
assume that CFO:s of very large corporations are hard to get in contact with and it could also
be assumed that they disclose such a large amount of intellectual capital in their annual
reports that it would be too much to analyze in this type of study.
Several of the representatives that answered our questionnaire expressed their desire for
anonymity, so the authors have chosen not to disclose the company names or the names of
the individual respondents. Another advantage with keeping the respondents confidential is
that they hopefully answered more honestly with a low risk of their answers being biased to
a significant extent (Lundahl & Skärvad, 1999).
Instead of calling the companies “Company 1” and “Company 2” we use fictitious names
when we anonymise the companies. The reason for doing this is to make it easier to
separate the companies for the reader. We selected names that were closely related to the
line of business that the company operates in. Consequently, the anonymized coded names
that are being used for the companies in this study are the following:
‐ The Aluminum company = Alucomp
‐ The IT company = Itcomp
‐ The Biotech company = Biocomp
‐ The Net operator = Netcomp
‐ The Furniture company = Furcomp
‐ The Blood cell company = Cellcomp
‐ The Medical instrument company = Medcomp
‐ The Electronic label company = Labelcomp
To achieve a higher rate of recurrence of answers we initially called all the CFO’s that
participated in our email questionnaire to inform them of our study. The questionnaire is as
stated before quite extensive with several dimensions, and to make sure that the
participants understood the questionnaire and filled it out in a correct way, we rigorously
explained how they should interpret it. It is of utmost importance that the questionnaire is
interpreted in the same way by the respondents. We also explained the main concepts of
intellectual capital to make sure that the respondents had a good understanding of the

11
concepts so that they would give us sufficiently accurate answers. Furthermore, we
examined the companies from a group perspective and not only the single parent company.
This is important because the IC disclosed in the annual reports often refers to the whole
group and not solely the parent company or subsidiary.
Out of the 60 companies we contacted, 16 respondents said that they would respond to the
questionnaire before we sent it out. Out of those 16, answers were collected from 8
companies, which meant a total response rate of 13 percent. According to Bryman and Bell
(2007) a low percent of response rate isn’t good and weakens the result of a study, and the
authors are well aware of this. However, we chose to narrow our search according to our
criteria (specific industries, Swedish companies, turnover between 1 MSEK and 1000 MSEK)
which means that the population is rather small and the entire population was asked to
answer our questionnaire. This procedure is significantly different from picking a sample of
companies to contact out of a much larger population, and hence a lower response rate is to
be expected.
2.4 E‐mail Questionnaires
The e‐mail questionnaire has been designed after extensive literature review, where the
items and assumptions have been supported by the studies from Ax & Marton (2008) and
Edvinsson et al. (1997). We seek answers to questions of how much IC disclosures exist
internally and how much that type of IC contributes to the value creation within the
company. To answer these questions, we constructed an extensive questionnaire with a
considerable amount of questions categorized into Human capital (HC), Relational capital
(RC) and Structural capital (SC) where the respondents were asked if they have internal
written rapports, steering documents or other policies regarding IC. The questionnaire is
attached in Appendix 1.
The questionnaire is divided into 4 different parts where part 1 is focused on the importance
of different stakeholders, while part 2 ‐ 4 consists of questions related to intellectual capital.
Part 2‐4 is divided into two separate columns where column 1 is about the extent to which
the company has internal disclosures about different intellectual capital items. Column 2
approaches to what extent the particular items add value to the company. The scale in the
questionnaire is a Likert scale, ranging from 1‐7. When answering a Likert questionnaire,

12
respondents indicate their level of agreement to a statement/question (Likert, 1932; Bryman
&Bell, 2007). In column one the answer “1” stands for “to a very limited extent” and a “7”
for “a very large extent”. In column 2 the answer “1” stands for “not important” and a “7”
stands for “very important”.
The language of the questionnaire sent out is Swedish because of the assumption that it
would give more qualified answers and a higher response rate if the respondents could
answer on their native language. The translation of the questions and items in the
questionnaire was then validated by our tutor to secure the quality of the translation.
2.5 Content analysis of annual reports
The study of external reports has been carried out through a content analysis of the
companies’ annual reports.
The main reason why a content analysis of annual reports were chosen is because it has
been widely used In accounting research and Krippendorf (1980) states that it is a good
technique “for making replicable and valid interferences from data according to their
context” (p.21). Furthermore, the content analysis is advantageous since it is a transparent
method which is easily replicable (Bryman & Bell, 2007)
In the content analysis the information from the annual reports is broken down into words,
sentences and diagrams. These are scrutinized, evaluated and then summarized down to
figures to make a valid comparison of the answers from the annual reports and the answers
from the questionnaires. Again, the content analysis proved to be a good choice of method
because it is a flexible method that researchers can use to analyze unstructured information.
It is important to explain in more technical terms how we have conducted the search. A
central point is to explain how the unit of analysis is defined (Bryman & Bell, 2007). This
paragraph explains how that is made in this study. When a piece of information about IC is
found in the annual report it needs to be judged by the authors if the particular “hit” really
refers to or describes intellectual capital in the company. We have identified three criteria
for classifying “hits” as “false hits” (and consequently not count them). By using these
criteria, we aim to avoid subjectivity in our judgment. The criteria are (1) The IC information
has nothing to do with the company, e.g. “An ISO standard could be a way of measuring

13
quality” (this is an explanation of an ISO‐standard, not an indication that it is in place in the
company) (Beattie & Thomson, 2007). (2) The IC information is too vague for being
characterized as an indicator on IC in the company, e.g. “…members of the company board
have heard and like the idea about a new ISO standard”. (3) The word is mentioned two
times but it is still only one indication on IC, e.g. “…our company comply with this ISO‐
standard (true hit). This is because this ISO‐standard is good (false hit)”. A normal single “hit”
in this case would typically be disclosed like “We are certified with ISO‐standard”.
In order to eliminate “false hits” in the content analysis, we carried out the search manually
and not electronically. When examining entire annual reports the manual method allows us
to make the judgments described in the paragraph above. The electronical search has two
distinct disadvantages in this setting. The first is that we would have had to make a selection
of words or expressions to search for. Given that intellectual capital is a broad term we
would need to search for hundreds of words to find a reasonable amount of IC disclosures,
which is complex and time consuming. Bontis (2003) found that electronical search results in
a very limited amount of IC disclosures. A possible explanation was that he did not include a
sufficient amount of words in his electronical search and the results therefore became less
reliable.
The second problem with electronical search is the inadequacies rising from not evaluating
every single “hit” and consequently take in “false hits“ in the total amount. Earlier studies
regarding IC reporting confirm that the whole sentence should be analyzed in order to grasp
the meaning of an IC disclosure (Milne & Adler, 1999).
In the empirical section, the result from the content analysis is presented company by
company. Along with the numbers we describe what type of IC disclosures the particular
company focus on and present examples of such. This study is primarily quantitative but we
argue that this descriptive selection is motivated as a supplement to the number of “hits”
displayed. The reason is that the text explains interesting details that are not revealed by the
numbers and this information is useful as a complement to the analysis.

14
2.6 Reliability, validity and objectivity
Reliability refers to the question of whether the outcome of a study are repeatable and
stable so that the reader (or other stakeholders) of the study can be confident that the result
do not fluctuate too much and are not too sample dependent. Usually, a test‐retest method
is used to test if the quantitative data analyses have a high correlation (Bryman & Bell,
2007). Due to the limitation in time and resources, the authors have been unable to do a
qualified re‐test and we are aware that this limits the reliability of our research and that
there are qualitative features that influence the results which the quantitative method do
not take into account. The authors are also aware of the reliability issues so that we have
been able to alleviate problems related to subjective self‐perception. We still acknowledge
that researcher objectivity is hard to achieve (e.g. Alvesson & Sköldberg, 2009)
However, since the study is based on a structured questionnaire, the findings are reliable to
the extent that the respondents all have answered the same questions. That is, of course,
under the assumption that our precautions to make the respondents answer truthfully and
interpret the questions in the same way, has been successful.
Validity is concerned with the issue of whether a measure really does reflect the concept
that it is supposed to measure (Bryman & Bell, 2007). To strengthen the report's validity and
to ensure what we seek and intend to measure, the questionnaire was sent out to potential
respondents with similar duties and hierarchical status in different companies in different
industries, which should eliminate some industry‐ and company‐specific factors, which is
desirable because we are seeking conformity in disclosing procedures regardless of industry.
The respondents in the survey were solely Chief Financial Officers (CFO’s) or equivalent. We
chose CFO:s although we assumed that we would get fewer respondents (due to their heavy
work burden) so that we could get the highest possible quality and relevance in the answers.
By quality we refer to the fact that CFO’s are in a very high hierarchical position within the
company and therefore presumably possess greater knowledge than subordinates.
The researchers' personal values can always have an effect on a study (Jacobsen, 2002),
which we have tried to avoid during the study. This has been sought by the questions in the
questionnaires derives from theories and previous research from several different

15
researchers. By doing this the authors have strengthened the validity in this area of the
study (Bryman & Bell, 2007).
2.7 Method for analysis
In the analysis of this study, we compare the values that we got from the answers from the
questionnaire with the values that we got from the content analysis. These two values often
have completely different scales and meanings. This makes them comparable only relative to
each other, i.e. if company A had the most hits in the annual report by the companies we
examined they had “many hits” and if it had few hits in the annual report it “disclosed little
IC”. The essence of this is that while the answers from the questionnaire can be judged
based on the absolute scale, the values from the analysis of annual reports only carry value if
related to other research objects.
2.8 Theoretical Framework
The theories used in the study are chosen because they are helpful both to explain what is
included in the term intellectual capital and how IC is disclosed both internally and externally
in companies. We also need theories in our attempt to answer the question of why IC is
disclosed in a certain pattern.
Regarding intellectual capital, we start out with stating that the concept is fairly young and
has undergone a substantial development during the last two decades. A review of the most
common models used to measure IC demonstrates the wide range of possibilities to account
for IC.
Our choice of IC framework is partly explained by its widespread acceptance – the particular
model has been argumented for by prominent academics in the field, for instance Edvinsson
(1997) and Bontis (1998) and it is supported by guidelines from EU‐funded reports
(MERITUM‐report and RICARDIS‐report). Another reason for the choice is that our model
aim to identify and measure the whole spectra of IC through the three distinct subcategories
of human‐, relational‐ and structural capital. This ambition suits the purpose of the study
and consequently, present IC models are too narrowly focused on a specific part of IC, like
the models used by Ax and Marton (2008) (Human capital focus) or Sveiby (1997) (Structural
focus), which is not acceptable.

16
The IC theories chosen are analyzed in the three respective parts of HC, RC and SC. This
provides us with knowledge of what kind of information to (1) ask for when designing the e‐
mail questionnaire intended for the company CFO:s and (2) look for in the content analysis
of the annual reports.
In order to understand why companies chose to disclose some IC related information and
not other it is useful to consider a theory that describes how an organization relates to the
external environment. After scrutinizing several such theories we chose Stakeholder theory
e.g. Freeman (1984) as the most suitable tool to help us understand the disclosure behavior
of the examined companies. The reason for this is two‐folded. (1) It has been proved useful
in previous similar IC studies (Gray 1995). (2) We base our study of external reporting on the
analysis of annual reports. This document is not exclusively directed to a specific stakeholder
but intended as communication channel to all stakeholders of the company. Stakeholder
theory emphasizes the importance of taking many stakeholders into consideration and, is
consequently suitable in this study.
The last section of the theory is devoted to a definition of the term Value creation. Even
though value creation might not be formally considered a theory it is important for us to
define how the expression is interpreted in this study. The reason for this is that the e‐mail
questionnaire states a specific meaning of value creation which has implications for the
analysis.

17
3. Theory
In the theory chapter the key concept of intellectual capital is presented and the definition
that we use in the thesis is explained. Thereafter follow a review of the stakeholder theory
which is used to explain external disclosures of IC. The chapter ends with a description of the
term value creation which is used in the questionnaire in the study of internal IC reporting.
3.1.1 A background to why intellectual capital matters to companies of today
This theoretical background elaborates further on the question addressed in the
introduction: Why is IC information important?
The need for reporting intellectual capital is rooted in the changes that have taken place in
the economy from the last decades of the 20th century until present time. During this period
different forms of intangible assets have become a key determinant of value creation in
companies. As a result of this transition company stakeholders request a disclosure of IC
information by companies since it is an indispensable aspect to take into consideration in the
analysis of a company (Meritum project 2002). If we measure modern companies with an old
and unmodified framework for accounting and financial reporting we will not be able to
correctly evaluate the companies of today. (Sveiby, 1997)
There is a significant difference between the traditional point of view on capital and the
position taken in intellectual capital regarding the purpose of valuation. The objective of
presenting intellectual capital data is to explain to the stakeholders how the company
creates value and how it intends to create value in the future. The objective of valuation is
therefore value creation. This is fundamentally different to the traditional valuation, which
aims at describing the current state of assets in the company (Mouritzen, 2001).
The traditional accounting model is not only focusing on today’s numbers but it is also
backwards looking. In other words, it is a system measuring historical cost. That is a logical
starting point in assessing the performance of a company but it is, however, not sufficient to
get the complete picture of the prospect of it (RICARDIS‐report, 2006). The explanation to
this is that only a fraction of all the intellectual capital inherent in a company is accounted

18
for in the balance sheet under the section intangible assets. Most components of intellectual
capital are forward looking and therefore crucial to account for in order to make accurate
predictions.
3.1.2 How to define IC
A starting point when describing the term intellectual capital is to define the intangible
assets held by a company. (Choong, 2008) According to IFRS, intangible assets are resources
held by an organization that comply with the following three requisites.
• The asset should be identifiable.
• It must be controlled by the organization as a result of past events.
• Future economic benefits from increased revenues or reduced costs are considered
to be expected to be generated from the intangible asset.
(IAS plus, 2011)
Intangible assets such as patents, goodwill and copyrights are one part of what constitutes
intellectual capital. However, the concept is much broader because it goes beyond the
capital assets reported in the balance sheet. A result of this is that a stakeholder who only
uses the financial statement does not get a complete picture of the intangibles that are
either controlled or owned by a company. (Meritum project, 2002).
A description of IC where there is consensus among researchers is that a key characteristic of
all IC is that it is resources, activities and systems that are expected to generate future cash
flows that are typically accrued over a long term period rather than quickly gained by the
organization (Meritum project, 2002; Abeysekera, 2006). Beyond this definition of cash flow
generating capacity IC it is hard to find common traits in the wide range of IC frameworks
that we will present in the two next sections.

19
3.1.3 Early definitions of intellectual capital (IC)
In this section we describe early attempts made to define and classify IC. We shortly review
three models that are of relevance since they have had influence on the model for IC
reporting that is recommended today.
One of the first concepts developed of how to measure IC is was made by Edvinsson &
Malone (1997) and Brennan (2001). These authors compare the market value of a company
to the book value of the company´s equity. The difference between the two values indicates
the amount of intellectual capital. By displaying the difference to stakeholders, the relevance
of the reporting is increased. This in turn would make it more reliable to base investments
on the information in external reports. When Edvinsson et al. break down IC in components
they consider it to consist of three components: human, organizational and customer
capital. The notable IC researchers Bontis (1998) and Sullivan (1998) accede to this
framework.
The first prominent classification model of IC coming from a non‐accountant was developed
by Sveiby (1997). His focus was slightly different from the model described above. Sveibys
framework focused on measuring employee (individual) competence, internal structure and
external structure.
Another way of describing intellectual capital was suggested by Brooking (1996). Her
framework built upon the assumption that an enterprise only consists of tangible asset plus
intellectual capital. A condensed description of IC in this setting is to say that it is everything
that enables a company to function. More specifically Brooking´s theoretical framework
divides IC into four separate categories: Market assets, human centered assets, intellectual
property assets and infrastructure assets. By combining these assets a company
demonstrates its intellectual capital. (Brooking, 1996)
The models described above were developed during the 1990s. This was relatively early in
the study of this field but the pioneering research has had a significant influence on later
attempts of constructing a standardized model of how to account for intellectual capital. The

20
standardization process is positive in the sense that it increases the comparability and
interpretability of the IC information displayed. The lack of a uniform definition of IC opens
up the possibility to form individual definitions. A result of this could be that companies
disclose IC in an ad‐hoc fashion that fit their own purposes (Martensson, 2000). The
reporting loses both relevance and comparability under such circumstances. Rigid rules
ensure that companies report in accordance with a certain scheme could also bring negative
effects since the IC reporting should be designed around features specific for a certain
company or industry. (RICARDIS‐report, 2006).
3.1.4 The state of the current categorization of intellectual capital
In this text we discuss two EU‐funded‐projects that propose recommendations about IC
reporting and what framework to use for internal and external disclosures. Both projects
have taken models described in the last section into consideration. This section is motivated
in the study because the reports referred to is fundamental for our interpretation of IC.
The first report is the RICARDIS‐report (2006). It provides small and medium Enterprises
(SME) in the EU with general principles of how to report intellectual capital. The
recommendations focus on three key areas which are described and analyzed in the sections
below.
The first recommendation concerns the question of how to classify and group different parts
of intellectual capital. The idea here is to use the same taxonomy that is present for
intangible assets today and use it to identify all IC elements. The idea is thereby not to create
a new set of tags but rather to expand existing ones. (RICARDIS‐report, 2006)
The second area of interest deals with the level of specificity and detail in the indicators
reported. In this respect RICARDIS classifies into the information in three levels. It ranges
from a basic set of general indicators, over to sector (industry) specific indicators to the
organization specific indicators. The standardization is particularly directed towards the first
level with the aim of using measures that could be calculated by all companies and relevant
in comparisons. The standardization process should also take place at the second level

21
where industry trade organizations are the appropriate body to specify important indicators.
At the company level no standardization take place. In this discussion it is important to
emphasize that what is described is the amount of standardized IC information that are
expected to be disclosured at the different levels. The companies are on top of this expected
to present IC information that is specific or unique for their own company and could be of
interest for stakeholders. (RICARDIS‐report, 2006)
The third area concerns the structure by which IC information is to be presented. Regarding
this point the RICARDIS‐report refer to a model presented in the MERITUM‐report which is
another EU‐funded report from 2002. The term Intellectual capital is divided into three
subgroups: Human capital, structural capital and relational capital.
The RICARDIS‐report recommends this model for two reasons. Firstly, the model is designed
to embrace all kinds of intangibles. Secondly, it is widely accepted and used by many
companies in their IC reporting. It is important to remember that it is only a
recommendation and that companies could classify and measure IC according to another
system that better fit their organization. (RICARDIS, 2006). We have chosen to structure our
search for empirical data after the MERTIUM project model. In the following sections we
explain what kind of intellectual capital that are recognized and measured in the categories
human capital, relational capital and structural capital.
3.1.5.1 Human Capital (HC)
Human capital could be defined as the knowledge that the employees take with them if they
decide to leave the company (Meritum‐project, 2002). The intellectual capital held by an
employee is in part explained by genetic heritage and in part by the experiences and
educations an employee is exposed to and his/her attitude towards these experience and
educations (Hudson, 1993). The ability for an individual to gain human capital is explained by
pointing at certain personality traits as key factors. More specifically, persons that are
energetic, committed, reliable, imaginative, creative and have the desire to share
information are likely to build up strong human capital. (Fitz‐enz, 2000) Human capital is
manifested through knowledge, skills and abilities (Meritum project 2002).

22
Employees are often regarded as a company’s most important asset. (Abeysekera et al,
2004). In the highly technological and changeable business climate of the 2000s, the demand
for an intelligent and adoptable workforce is greater than ever. The main reason for this
opinion is that a working force characterized by high human capital possesses the ability to
create innovations and undergo strategic renewal (Bontis, 1998; Abeysekera et al, 2004).
3.1.5.2 Relational Capital (RC)
The relational capital is the component of the intellectual capital that focuses on the
relations with stakeholders outside the organization. The major part of the relational capital
is customer capital which consists of customer interactions and market knowledge. Devoting
internal resources to build customer capital is important because the process of developing
knowledge about customer preference is the most complex task in managing IC (Bontis,
1998).
Besides managing customers, relational capital refers to the interplay between the
organization and other influential stakeholders. One example is the control over marketing
channels which is a factor determining competitive advantage in industries dealing with fast‐
moving customer goods. In other industries the contract terms regarding licensees or
franchisees are examples of relational capital information relevant to stakeholders.
(MERITUM, 2002)
The relational capital is intended to build, store and maintain a strong organizational image
(RICARDIS‐report, 2006, p.29). In order to do this a sole focus on customers is not enough.
Resources should also be allocated to support key suppliers with information. If the
company is part of a strategic alliance or joint venture, governing the relations with partners
strengthen the relational capital. If the company is frequently debated in media, the media
relations are important since they can affect stakeholder perceptions about the company. A
key issue in creating all types of relational capital is to influence the stakeholder’s perception
about the organization (Meritum project, 2002).
23
3.1.5.3 Structural Capital (SC)
Structural capital consists of what is left in the company at the end of a working day when
the human capital has gone home. (Edvinsson & Richtner, 1999). A definition of structural
capital has been suggested by Winter (1987): “The myriads of relationships that enable the
organization to function in a coordinated way [but] are reasonably understood by [at most]
the participants in the relationship and a few others…” This means that “the organization
is…accomplishing its aims by following rules that are not known as such to most of the
participants in the organization” (p.171). Consequently, an employee at a firm can have
good qualification to do excellent work but if the company has poor procedures and systems
to take advantage of the individual’s performance his total intellectual capital will not be
utilized optimally. Nicolini (1993), referred to in Bontis (1998) goes one step further when he
states that if you structure your intellectual capital in good ways that benefits the
organizations, individuals “know‐how” it could be turned into a group property.
According to Bontis (1998), structural capital is quite difficult to measure. He means that the
core lies in the knowledge rooted in the routines of an organization. In a wider meaning,
structural capital consists of a companys routines, procedures, systems, cultures, databases,
etc; For example, a firm’s flexibility, the use of information technologies and the capacity to
learn (Meritum project, 2002).
3.2 Stakeholder Theory
In this section stakeholder theory is discussed. The different branches of the theory and the
motives behind these are explained. We also explain why stakeholder theory is suitable for
the setting of our study.
A company consists of a broad range of internal and external parties who affect or are
affected by the actions taken by the company. Generally speaking these parties are
characterized as stakeholders in organizational management. (Business dictionary, 2011)
Swedish business culture is to a high degree based on the concept of mutual agreements
between different stakeholders and because of this, Swedish business culture could be

24
characterized as “stakeholder capitalism” (Bjerke (1999); Näsi (1995); Grenness, (2003) in Ax
& Marton, 2008). Another piece of evidence of this is that Swedish companies care about
satisfying not only the shareholders, but also other relevant stakeholders of the company
through the widespread use of the Balanced Scorecard. A substantial share of Swedish
companies have even adopted a modified version of the original Kaplan and Norton
Balanced scorecard model which puts more emphasis on employees, who are stakeholders,
to the degree that they are measured under a separate perspective (Ax & Björkenak, 2005).
The stakeholder theory was originally presented by Edward Freeman and the fundamental
idea is that the management of a company need to meet the needs and expectations of all
different stakeholders (Freeman, 1984). A company needs to analyze different stakeholders
in order to understand their particular concerns as a group. By doing so, a company gets
access to information and knowledge about how to develop objectives that stakeholders are
likely to support. A company could only expect to stay successful in the long run by gaining
this kind of broad support from different stakeholders. (Freeman & McVea, 2001) Examples
of stakeholders are suppliers, customers, employees, the Government, regulators, Non‐
Governmental organizations, Banks and private investors. This theory represents a sharp
contrast to the Stockholder theory, put forward by Milton Friedman in which the sole
responsibility of the company management is to look after the interest of the company
shareholders and consequently generate large profits. (Friedman, 1962). These conflicting
theories of corporate governance have become a polarizing pair over the last decades.
(Waldkirch, 2008)
In the theoretical framework of this study we have chosen stakeholder theory as the main
point of reference. There are several reasons why we argue that stakeholder theory is a
better tool than stockholder theory in explaining behavior taking place in Swedish listed
companies in the 21st century. In the following section we outline different types of
justifications behind the stakeholder theory and which of them we find most relevant for our
study.

25
3.2.1 Ethical versus Positive approach to stakeholder theory Stakeholder theory has two main branches, one ethical (moral) branch and one positive
(managerial) branch (Guthrie & Ricceri, 2006). Advocates of the ethical branch argues that
business in capitalist secular society possess resources and carry out burdens that historically
where entrusted to the Government or the Church. Along with this role comes a
responsibility to behave ethically correct towards all parts of society involved or affected by
the business (Phillips, 2010). The accounting scandals of Enron and WorldCom in the 2000s
and the financial crisis in 2008 are modern examples of the devastating effects resulting
from partly reprehensible moral actions taken by accounting and financial management in
various firms. The counterargument that finance and accounting are immoral services is
likely to meet fierce criticism when taking into account the unemployment and money losses
resulting from such scandals. (Phillips, 2010). Argumentation for stakeholder theory out of
ethical reasons is however not the main reason why we think it is a suitable theory in this
study.
It is also possible to justify the choice of stakeholder theory with another line of reasoning.
Instead of emphasizing the moral obligations towards stakeholders that follow with
corporate activity one could look at it the other way around. This implicates that if a
company wishes to be successful it must recognize the needs of different stakeholders. A
way to distinguish this justification from the ethics justification is by referring to Peter
Druckers (1984) explanation of two different motives behind corporate social responsibility.
He points out the clear distinction between “Do good in order to do well” and “Do well in
order to do good” (p.54). These quotes refer specifically to the subject of corporate social
responsibility but the line of thinking is applicable for a company dealing with different
stakeholders. The reason for not treating the different stakeholders in isolation and always
trying to meet demands from all types of stakeholder is based upon the idea that superior
stakeholder satisfaction lead to successful results. Through the work of DÁveni (1994), this
statement is proved to be valid and of special importance to companies in a
hypercompetitive environment. Most of the companies analyzed in this thesis do find
themselves in such an environment and therefore this theory is relevant in our work.

26
The reasoning in the paragraph above refers to the positive branch of stakeholder theory. It
motivates the company management to focus on the balanced interest from different
stakeholders not for ethical reasons but for the sake of organizational survival. This view
goes further in that it states that a company will not answer to all stakeholders equally. The
degree of attention and compliance in the relations vary. The explaining factor behind a
stakeholder’s power and legitimacy is its degree of control over resources required by the
company (Watts & Zimmerman, 1990). The demands from Stakeholders that possess
something that is critical for business success or has the power of changing people’s
opinions about a company are consequently addressed with great awareness. (Deegan,
2000).
Examples of such stakeholders could be found in a variety of people/organizations in a
company´s environment. It could be a supplier delivering a unique component, it could be a
union leader with the ability to raise opinion, it could be an investigating journalist or simply
a key customer. All of these stakeholders must be managed in order to avoid risk.
Consequently, a non‐profitable customer or an employee that is easily replaceable to a low
cost does not get the same amount of attention from the company management. This
fictive example points not only to the big difference between positive stakeholder theory
compared to the owner‐focused stockholder theory but also in comparison with ethically
based stakeholder theory where all stakeholders ideally deserve and could expect genuine
attention.
3.2.2 Complementing Theories
Since we have chosen to use stakeholder theory, an assumption is made that the disclosing
of information on intellectual capital is made to satisfy the company’s most important
stakeholders. This theoretical approach is a widely accepted tool and used in previous
research on disclosure and reporting behavior (Gray et al., 1995).
It is important to note that other theories have been used to explain results in studies
regarding company disclosure. Ax and Marton use the decision‐usefulness theory where the
reporting of human capital is explained by the degree of usefulness to the user of the

27
information. (Ax & Marton, 2008). Another example of a theory possible to use in the thesis
is the resource‐dependency theory which states that the external resources of organizations
affect the behavior of the organization. (Pfeffer & Salancik, 1978). This study is linkable with
one of these theories or with an eclectic approach where several theories are used to give
the best explanation to our empirical result. We have however decided to stick to one
theory to reduce the complexity of the analysis and on the basis that stakeholder theory has
been used in earlier studies in the field as noted above.
3.2.3 Value creation In our empirical studies we ask how different kinds of intellectual capital are related to value
creation in the companies. Value creation could be regarded as vague and the term is
possible to interpret in many different ways. We have chosen to use the definition that value
creation takes place when a business earns a revenue (or return on capital) that exceeds the
expenses (the cost of capital) (Reference for business, 2011)
Consequently we ask our respondents to answer how much different components of
intellectual capital (e.g. customer relations, employee training, company routines etc.)
contribute in creating value according to the above mentioned definition. We are well aware
that it is hardly possible to indicate the exact connection between a specific item of
intellectual capital and to what extent it is a driving force behind value creation. What we
are aiming for is to understand how important the respondents view each specific item. This
provides us with an explaining factor when analyzing discrepancies or similarities regarding
internal and external reporting in the thesis.

28
4. Empirics
In this section we present the results from the study of internal and external disclosures of IC.
This is made company by company. It starts with a presentation of the results from the
content analysis. These are displayed both through key figures and text exemplifications.
After that the results from the e‐mail questionnaire follows. This is exclusively made by key
figures and the results show both the quantity of IC reported internally and the extent to
which companies finds IC value creating.
4.1 Introduction
In this section we present the results from the content analysis that we have made on the
annual reports. The content analysis is a technique for coding and counting text units. We
have chosen to use it because it generates a quantifiable result and it has been tested as
analyzing technique in previous studies of intellectual capital in annual reports. (Beattie &
Thomson, 2007).
It is important to clarify what we are looking for in the content analysis. We have divided the
theoretical concept of Intellectual capital (IC) into three subcategories, Human capital (HC),
Relational capital (RC) and Structural capital (SC). This is based on the classification of IC that
we have stated in the theoretical frame of reference. A thorough discussion of the content
analysis including a technical explanation of how the search was performed is placed in the
method section 2.4.
4.2 External Disclosures
A summary of the total hits of intellectual capital from their annual reports in the examined companies:
Table 4.1. Hits in the annual report from content analysis.
Company Hits in the annual report from the content analysis HC RC SC IC 1. NETCOMP 16 34 13 = 63 2. Medcomp 10 29 12 = 51 3. Alucomp 13 20 13 = 46 4. Cellcomp 8 19 11 = 38

29
5. Labelcomp 9 16 9 = 34 6. Furcomp 5 25 3 = 33 7. Itcomp 8 16 2 = 26 8. Biocomp 5 9 11 = 25 Mean = 9.25 21 9.25 = 39.5
4.2.1 NETCOMP
Human capital items: 16
Relational capital items: 34
Structural capital items: 13
= Total intellectual capital Items: 63
Netcomp is a company in the telecom industry that delivers services in data
communications, IT‐service and telephony. The company only handles business to business
relations and most customers are large retailers that are typically situated in many cities and
towns in Sweden. The company is the parent company of the NETCOMP group. In 2010 the
group turnover was 296,3 MSEK and the net income was 29,7 MSEK.
The disclosures of Intellectual capital mainly take the shape of relational capital and
structural capital. The customer analysis is carried out in detail and other stakeholders are
both categorized on the basis of importance and addressed accordingly. The use of quality
standards and different sustainability initiatives are also elaborated on.
Market trends and customer preferences in the business are described in detail. The
strategic choices taken by the company, such as aiming for total solutions for the clients
demand for IT and telephony services and favoring long‐term clients is explained by the
disclosure of different rates of return by different segments. The company also points at the
frequent contact and visits to clients and the importance of offering supplementary
consulting services to strengthen customer loyalty. (Relational capital)
For the second consecutive year the company presented its sustainability reporting in line
with the Global Reporting Initiative (GRI). The company was one of the first listed companies
on Nasdaq Stockholm OMX small cap to live up to this standard. A central feature is to
30
prioritize issues of sustainability in relation to the importance and urgency to stakeholders
(1) and the importance and urgency to the company (2). Issues that score high in both (1)
and (2) are consequently the most relevant to inform about through disclosures. In this case
matters of gender equality, energy consumption, the production of greenhouse gases and
information security was determined most important issues. The company goes through
these four in detail and explains how they use routines, processes and standards to control
each area. An example of such control in place is the environmental standard ISO 40001.
Another example is the discussion about how the company actively searches for female
applicants, encourages women to apply to top‐management and has eliminated the salary
discrimination between genders. A third example is the wide use of real‐time video
conferences that is environmental friendly because the staff travels less frequently.
(Structural capital and Relational capital)
Beside the demands from the most important stakeholders the company disclose
information about their philanthropy ambitions. The project “The digital hope” where they
provide IT‐ and English education to children in Vietnam is an example of such social
sponsorship. (Relational Capital)
The company is certified to ISO20000. This indicates solid quality in strategic and operational
processes. This certification postulate interaction with suppliers and implies the company to
implement continuous improvements in its processes. (Structural Capital)
There are very little human capital disclosures in the annual report. However, the company
points out that they do acquire front edge competence through the process of acquisitions.
In the year of 2010 they strengthend this kind of human capital since they incorporated two
new subsidiaries to the group. (Human Capital)
4.2.2 Medcomp Human capital items: 10
Relational capital items: 29
Structural capital items: 12

31
= Total intellectual capital Items: 51
Medcomp develop, manufacture and market medical devices. The turnover for 2010 was
83,4 MSEK and the net loss was ‐2,6 MSEK.
In the annual report Medcomp is one of the companies that we examined that disclosed
most intellectual capital information. They have examples of all the three main aspects of IC,
namely Human capital (HC), Relational capital (RC) and Structural capital (SC) but they have
an emphasize on relational capital. Below follow the most common and accented IC
disclosures in the annual report.
Medcomp states that one of their key determinants for success it to continue to deliver high
standard products that are rather expensive, and make their costumer pay for quality. To be
able to reach out to the market Medcomp have invested in their sales department and
brought in a lot of new faces. The feedbacks from their customers and distributors have
generally been positive about these changes and they have initiated discussions with several
new customer. Still they lost one major customer during the year. They have also updated
the way they communicate with the market. Examples of this are a new homepage, a more
distinct focus on their products and generally a whole new marketing material. Besides this
they also participate in strategic important exhibitions. (Relational capital)
The underlying growth for the company is driven by demographic and socioeconomic factors
such as increasing life expectancy and higher welfare. The United States is Medcomps
biggest market and is expected to continue growing. Medcomp have a world market share of
between one and two percent. (Relational capital)
Medcomp implements a business system that are prepared and certified in accordance with
ISO 13485:2003. The certification covers the design, manufacture, sale and servicing of the
company. They also work with sustainability and to minimize their impact on the
environment. To do this they keep records of their use of chemicals and they strive do lower
the use and dependence of it. (Structural capital)

32
Medcomp seeks to minimize occupational injuries and ill‐health within the organization.
Health care is an important element of the company and they have regular health checks
and massages. They also have a systematic rotation between different jobs to avoid
monotonic work and the related injuries that repetitive work brings. (Human capital)
The average number of employees was 52 under 2010, and of those 31 percent were
women. (Human capital)
4.2.3 Alucomp Human capital items: 13
Relational capital items: 20
Structural capital items: 13
= Total intellectual capital Items: 46
Alucomp is a manufacturer of customized sections and components in Aluminum. It is the
parent component in the Alucomp group. The group turnover for 2010 is 901,4 MSEK and
the net income 15,6 MSEK.
The company discloses a lot of intellectual capital information in the annual report. There is
plenty of examples how resources are allocated to produce or maintain human‐, relational‐
and structural capital. We will present the IC disclosures that are most common and
emphasized in the Annual report.
The company states that the employees’ level of personal and professional progress is a key
determinant for success. A couple of initiatives the company stresses are the wide use of job
rotation and the continuous investment in supplementary training. The company received a
EU‐subsidy earmarked to education of the employees. (Human Capital)
The initiative to provide free health and gym service to all employees is highlighted and
described as a reason behind the decreasing and generally low levels of absence due to
illness. All employees undertake cardiopulmonary resuscitation (CPR) training. During the

33
year an employee’s life was saved due to his colleagues’ knowledge of how to give first aid in
a situation of cardiac arrest. (Human Capital)
The company does indicate solid market knowledge and uses several pages and diagrams to
display their own market share and the development and potential in new markets. Further
they present a thorough customer analysis where they go through different segments and
reason about the amount and size of the customers and to what extent they contribute to
total profits. (Relational Capital)
During the year the company recruited a new CEO. Both the replaced and the new CEO write
in their respective personal letters that the company focuses on both good relations and a
high degree of integration with suppliers. The importance of suppliers is manifested through
the project “Aluminum in new ways” where 500 employees, mostly from key suppliers, were
provided with industry specific competence. (Relational Capital)
The company did attend the national Aluminum conference and did set up commitments
with valuable clients. Further the company has increased the level of employees with
industry specific knowledge at customer visits. (Relational Capital)
The company did 2010 initiate a large‐scale programme aimed at improving processes. The
programme was set up with the Kaizen methodology of small but continuous improvements
to smoothen the flow of materials and to speed up the production. (Structural Capital)
The company is dependent on staying innovative and flexible to manage the business
concept of providing relatively complex customized components. The integration of
suppliers, the constant search and evaluation of possible acquisitions to gain core
competence and the company motto of encouraging employees to question routines and
processes are all concrete examples on this strive stated in the annual report. (Structural
Capital)

34
The company is environmentally certified through ISO 14001. They also disclose both the
emission rates of aluminum and the company levels of energy consumptions (Structural
Capital).
4.2.4 Cellcomp
Human capital items: 8
Relational capital items: 19
Structural capital items: 11
= Total intellectual capital Items: 38
Cellcomp is a company in the biotech industry that develop and market systems solutions in
medical microscopy. Cellcomp is the parent company of the Cellcomp Group. In 2009 the
Group turnover was 109,0 MSEK and the net income was 14,2 MSEK.
The company discloses a fairly large amount of IC in all three subcategories (HC, RC and SC).
Knowledge about market trends and driving forces behind change are both major sources to
disclosures in this report. The structural capital is also highlighted with a focus on processes
and routines. Human capital is mainly emphasized through the efforts of cultivating the staff.
Several initiatives leading to the development of employees are disclosed. Examples of such
are the removal of monotonous work, a high degree of participation from low level
employees in project‐groups and the recruitment of committed talents with a high ability to
learn and make progress. (Human Capital)
The majority of the products are sold in foreign markets and especially USA or Japan.
Information about these customers’ preferences and the problems they wanted to be solved
is displayed in the annual report. (Relational Capital)
Internal rules and routines and control systems are disclosed and presented as an important
condition in order for processes to be trustworthy and efficient. IT‐security and quality
systems are especially important control areas. (Structural Capital)

35
Another type of structural capital presented in the annual report were deals with company
patents. It is a fundamental building block for staying competitive. Disclosures are made
about the current amount of patents. A description is given of the key patent regarding a
special method used in microscopic test slide analysis. Furthermore the company provides
information on how they try to stay innovative in order to create new patents. The
company’s technological front edge R&D are supplemented with a tight collaboration with
customers and a creative working atmosphere. (Structural Capital)
4.2.5 Labelcomp
Human capital items: 9
Relational capital items: 16
Structural capital items: 9
= Total intellectual capital Items: 34
Labelcomp provides the retail industry with electronic display and solutions for
communicating price and product information on the retail floor. The company key factor for
success is driven mainly by information technology so therefore we categorize the company
to a company within the category Data, IT and telecom company. The group turnover for
2009 was 327,3 MSEK and the net income 25,2 MSEK.
In the annual report Labelcomp disclosed quite ordinary information that could be described
as intellectual capital. There is a rather equal distribution between human‐, relational‐ and
structural capital with a small emphasize on relational capital.
Labelcomp’s encourage responsiveness and short decision‐making path within the company
and it’s employees. The employees are also encouraged to seek additional knowledge and
they continuously attend courses to improve their competencies. (Human capital)
Labelcomp has been re‐evaluated by there key clients and has been re‐validated as a key
strategic supplier by all of them. Labelcomp has a market share at 55 percent and there

36
systems are installed in stores in over 40 countries, where France and Japan stands for the
biggest part of all installations. They only have one big competitor in the industry. Both
Labelcomp’s studies and analyses made by their customers’ show that in average there is a
payback period of less than one year in installing a Labelcomp system. (Relational capital)
The company has a rather small number of large customers who accounts for the main part
of their sales. Labelcomp actively seeks to reduce its dependence on individual businesses by
creating partnerships and adding a larger number of customers. (Relational capital)
2009 was a year where the food retail had to adapt to financial troubles and therefore
Labelcomps had some troubles with the sales of their products to the retail industry. Still
they withheld a high profit. This was possible because of improving efficiency throughout the
organization, such as introducing programs to lower carriage costs and improve customer
response. (Structural capital)
Labelcomp it taking effort to ensure that expertise is retained within the company. It is
always a risk that employees leave with key competencies but by working with knowledge
transfer and documentation of work processes they try to reduce this risk. During 2009
Labelcomp has also invested extensively in increased efficiency, capacity and alternate
suppliers of critical components. (Structural capital)
4.2.6 Furcomp
Human capital items: 5
Relational capital items: 25
Structural capital items: 3
= Total intellectual capital Items: 33
Furcomp is a manufacturer of furniture (87%) and eyewear (13%). In 2010 the group
turnover was 778 MSEK and the net income was 24,2 MSEK.
In the annual report the company discloses quite little IC information. 25 out of the 33 hits
found are related to relational capital. Most of the Relational capital is different forms of

37
customer or market related information that concerns the same issues under separate
business areas. Consequently the company does not disclose a wide variety of IC related
pieces of information.
There is a lot of analysis about future market development. The disclosures around this topic
take the form of predictions of customer preferences, new opportunities rising from
material and design development and explanations of how economic factors affect the
industry. (Relational capital)
The company sell a substantial proportion of its products to large customers such as libraries
and customers and administrative authorities. These customers’ demands and level of
satisfaction is emphasized throughout the report. (Relational Capital)
Apart from the customer focus the company few examples could be found where the annual
report is used as a communication channel to nurture the relation to other stakeholders. On
exception are the disclosures on sustainability efforts. The ISO 14001 certification and the
environmentally friendly processes described in the report indicate awareness in this area.
The company also complies with ISO 26000 about social responsibility (Relational Capital).
The company discloses a few paragraphs about the recruitment strategy of contracting
famous designers to increase the likelihood of creating innovative furniture and to build a
strong brand. (Human capital)
4.2.7 Itcomp
Human capital items: 8
Relational capital items: 16
Structural capital items: 2
= Total intellectual capital Items: 26
Itcomp is a company in the telecom industry and a vendor of TV and music streaming
services. They have both businesses and consumers as costumers. They are the parent

38
company of the Itcomp group. In 2010 the company turnover was 270,9 MSEK and the net
loss was 130,9 MSEK.
The most information and numerical data that are disclosed in the annual report regarding
intellectual capital are different forms of relational capital and more specifically
stockholder‐, customer‐ and market knowledge. Another centre of attention is the well
defined and articulated company culture which is part of the structural capital.
The company devotes about 10 pages of the annual report to descriptions of the markets
they currently act. They carefully consider the TV, music, mobile solutions and mobile search
markets. In all these sections they reason about market and customer trends and
occasionally strengthen that with numerical data. (Relational Capital)
They are active in young and relatively unstable markets. As a result of this there is a
constant evaluation of where to compete. Itcomp uses the instrument of forecasting in an
attempt of constantly staying up to date with shifts in preferences and the creation of new
digital services. The company’s tendency to rely on trends spotted is exemplified through the
decision taken in 2010 to sell of the previous core business of Mobile Entertainment
business segment. The reason behind this decision was a forecasted poor market situation
and not only current losses. (Relational capital)
The stockholders are addressed specifically in a separate section of the annual report.
Information is disclosed about the staff stock option program that is in place in the company.
The discussion of the program focus both on the technical setup and on the underlying idea
of creating incentives for senior managers to participate in company value growth and strive
for company progress. The dividend policy is also explained to stockholder in great detail.
Two pages of diagrams and graphs specifically directed towards stockholder end this section.
(Relational capital)
The company culture is broken down into the five core values: Brave, Innovative,
Committed, Enthusiastic, Playful (BICEP). The culture is underlined as a driving force behind
the goal of delivering “world class experiences that really make a difference in people’s

39
everyday lives”. The devotion to this culture is the only big sign of structural capital
expressed in the annual report (No description of how they actually work with processes or
resource allocation etc. to form innovative services). (Structural capital)
The human capital disclosures are presented rather condensed. The information disclosed
are average age on employee, average work experience (years), staff turnover and
percentage of employees with academic degree. This is presented both in words and
diagrams. (Human Capital)
4.2.8 Biocomp
Human capital items: 5
Relational capital items: 9
Structural capital items: 11
= Total intellectual capital Items: 25
Biocomp is a company in the biotech industry that develops, produce, market and sell
biosensing techniques. The product is used for detecting micronutrients from different
substances. It is the parent company of the Biocomp group. In 2010 the group turnover was
6,8 MSEK and the net loss 46,0 MSEK.
Most of the intellectual capital disclosed in the annual report is characterized as different
types of structural capital. They devote several sections to describe the two latest product
lines that include two patents. According to the company board these patents are crucial to
position themselves as a cutting edge biotech firm. (Structural Capital)
Beside these products the company explains how they have both acquired a German
technology research company and started up an R/D focused subsidy during the year. The
goal with these investments is to enlarge the internal R/D capacity. A possible outcome is a
variety of structural capital such as “knowhow”, patents and intangible assets. (Structural
Capital)

40
There is a short but detailed discussion about all the different patents owned. It is described
how the patents protect technologies both regarding the chemical structure of products and
technical constructions in instruments. They also inform about how they constantly analyze
and modify the portfolio of patents to stay competitive. (Structural capital)
The company call attention to the development of the organization. During the year they
have slimmed the organization and dismissed three out of 16 people. In order to strengthen
both the marketing and the sales departments the company has allocated resources that
have the expertise and ability to penetrate markets more intensely. (Human resources)
Biocomp display informative charts and explain the market situation. The focus is on the past
and the current situation but information about prospect market and trends in current
markets are provided rather scarcely. (Relational Capital)
In a passage the company disclose policies and numbers regarding compensation with a
specific focus on bonuses. Information like the chairman of the board is pay three Swedish
prisbasbelopp per year and the CEOs compensation package is a combination of a “a set
salary, a yearly bonus, pension benefits and severance payment. (Human Capital)
4.3 Internal disclosures
In this section we present the results from the e‐mail questionnaire that has been answered
by the company CFO:s. The structure of the questionnaire follows the thesis´s theoretical
frame of reference. The questionnaire is divided into three main sections: Human capital
(HC), Relational capital (RC) and Structural capital (SC). Under each section we ask 20 (HC),
20 (RC) and 11 (SC) questions. In order for the questions to adequately represent important
issues in each section we have looked for guidance from studies conducted in this field with
a similar idea of how to define and classify IC. The main areas to cover under each section
are inspired by Beattie and Thomson (2007), Edvinson and Malone (1997) and Ax and
Marton (2008) and those articles have been helpful in providing innumerable examples of IC
measurements (Beattie & Thomson, 2007), (Edvinsson et al, 1997) (Ax & Marton, 2008)

41
The questions focus on how much internal report, steering documents and written policies
that the company holds about different kind of IC. All questions are complemented by a
second question about the extent to which that particular part of IC contributes to the
company value creation. The link to value creation is important in order to explain why
certain IC is prioritized over other in the internal reports.
The answers to all questions were made by putting a cross for the most suitable alternative
in a scale from 1‐7. In the IC‐questions the range looked like this: 1= to a very limited extent
– 7= to a very large extent. In the supplementary Value creation‐questions the range looked
like this: 1=Not important for value creation – 7= Very important for value creation. The
questionnaire is part of the appendix in order for the reader to have the opportunity to look
at the complete instructions and questions in detail.
The answers from the questionnaire have been analyzed and below follow a presentation on
the key figures of internal IC reporting in the respective companies. All questions are equally
important and are weighted the same when calculating those numbers. We find this
calculation method adequate since we think that most of the 51 unique questions asked
cover IC spectra’s that are relatively equal in size.
4.3.1 Summary internal disclosures
Table 4.2. A list of total amount of intellectual capital in the examined companies:
Company HC RC SC IC 1. Medcomp 5.21 4.17 5.42 = 4.93 2. Cellcomp 4.3 3.49 5.53 = 4.44 3. NETCOMP 4.42 4.29 4.08 = 4.26 4. Alucomp 4.04 4.74 3.64 = 4.14 5. Labelcomp 3.57 2.71 2.81 = 3.03 6. Itcomp 2.44 4.05 1.67 = 2.72 7. Biocomp 3.41 2.02 2.58 = 2.67 8. Furcomp 2.37 1.54 1.75 = 1.89 Mean = 3.72 3.38 3.44 = 3.51

42
Table 4.3. Sorted by category of intellectual capital:
Summation Internal reports Value creation IC 3.51 3.87 HC 3.72 4.03 RC 3.38 3.82 SC 3.44 3.77
4.3.2 Company for company
The tables below are the calculated means of intellectual capital and value creation, presented company by company. The complete answers from the questionnaire are attached in the appendix. The tables are sorted from top to below of the amount of internal disclosures of intellectual capital, with the highest starting from the top:
Table 4.4 Medcomp internal means
Medcomp Internal reports Value creation IC 4.93 5.78 HC 5.21 5.86 RC 4.17 5.06 SC 5.42 6.43
Table 4.5. Cellcomp internal means
Cellcomp Internal reports Value creation IC 4.44 4.43 HC 4.30 4.87 RC 3.49 3.47 SC 5.53 4.94
Table 4.6. Netcomp internal means
NETCOMP Internal reports Value creation IC 4.26 4.07 HC 4.42 3.99 RC 4.29 4.48 SC 4.08 3.75

43
Table 4.7. Alucomp internal means
Alucomp Internal reports Value creation IC 4.14 4.71 HC 4.04 4.74 RC 4.74 4.95 SC 3.64 4.44
Table 4.8. Labelcomp internal means
Labelcomp Internal reports Value creation IC 3.03 4.18 HC 3.57 3.50 RC 2.71 4.56 SC 2.81 4.47
Table 4.9. Itcomp internal means
Itcomp Internal reports Value creation IC 2.72 2.93 HC 2.44 3.41 RC 4.05 3.54 SC 1.67 1.83
Table 4.10. Biocomp internal means
Biocomp Internal reports Value creation IC 2.67 2.81 HC 3.41 3.00 RC 2.02 2.85 SC 2.58 2.58
Table 4.11 Furcomp internal means
Furcomp Internal reports Value creation IC 1.89 2.08 HC 2.37 2.84 RC 1.54 1.64 SC 1.75 1.75

44
4.3.3 Value creation
The questionnaire also included a column were the respondents answered how important every IC item is for the value creation in the company.
Below follow charts with the companies answers summarized in the categories human capital, relational capital and structural capital. The charts are sorted from top to bottom with the company with the highest amount at the top to the lowest at the bottom. The scale ranges from: 1 = unimportant to very important = 7.
Table 4.12. Value creation means:
Company HC RC SC IC 1. Medcomp 5.86 5.06 6.43 = 5.78 2. Alucomp 4.74 4.95 4.44 = 4.71 3. Cellcomp 4.87 3.47 4.94 = 4.43 4. Labelcomp 3.50 4.56 4.47 = 4.18 5. NETCOMP 3.99 4.48 3.75 = 4.07 6. Itcomp 3.41 3.54 1.83 = 2.93 7. Biocomp 3.00 2.85 2.58 = 2.81 8. Furcomp 2.84 1.64 1.75 = 2.08 Mean = 4.03 3.82 3.77 = 3.87
Table 4.13. Value creation intellectual capital summary:
Company Value creation IC 1. Medcomp 5.78 2. Alucomp 4.71 3. Cellcomp 4.43 4. Labelcomp 4.18 5. NETCOMP 4.07 6. Itcomp 2.93 7. Biocomp 2.81 8. Furcomp 2.08 Mean = 3.87
Table 4.14. Value creation human capital:
Company Value Creation HC 1. Medcomp 5.86 2. Cellcomp 4.87 3. Alucomp 4.74 4. NETCOMP 3.99 5. Labelcomp 3.50 6. Itcomp 3.41 7. Biocomp 3.00

45
8. Furcomp 2.84 Mean = 4.03
Table 4.15.Value creation relational capital:
Company Value creation RC 1. Medcomp 5.06 2. Alucomp 4.95 3. Labelcomp 4.56 4. NETCOMP 4.48 5. Itcomp 3.54 6. Cellcomp 3.47 7. Biocomp 2.85 8. Furcomp 1.64 Mean = 3.82
Table 4.16. Value creation structural capital:
Company Value creation SC 1. Medcomp 6.43 2. Cellcomp 4.94 3. Labelcomp 4.47 4. Alucomp 4.44 5. NETCOMP 3.75 6. Biocomp 2.58 7. Itcomp 1.83 8. Furcomp 1.75 Mean = 3.77

46
5. Analyze
In this section we compare the empirical results from the study of internal IC‐reporting with
the study of external IC disclosures. Firstly, we display the overall results in diagrams to show
how well the two dimensions of internal and external disclosures correlate. We then analyze
the material company by company to explain individual conformity or discrepancy towards
the overall result.
5.1 Introduction
In the empirical part of the thesis we have studied both internal and external reporting of IC.
In the analysis we are interested in comparing those empirical results in line with the
purpose of the thesis. In the first section of the analysis we consolidate the results into four
diagrams (IC, HC, RC and SC). The diagrams are designed to show the correlation between
internal and external reporting for the eight companies examined.
As explained in the introduction such a correlation could be motivated with the following
line of thought. If a company devotes a lot of internal resources to generate and document
IC, the IC would logically be seen as a value creating activity for the company. In order to
describe the current state and future prospects correctly to company stakeholders the same
company would be interested in including IC in the annual report (the central document for
communication with stakeholders).
In the second section after the charts we go through the results company by company.
Conformity and discrepancies between the internal and the external reporting are identified.
With the help from positive stakeholder theory and the company’s opinion about different
types of ICs value creating capacity we try to explain the reporting behavior.

47
5.2 Charts of the correlation between internal and external disclosures
Chart 1. Chart of the correlation between the internal means of IC and hits in the annual
report
Table 5.1. Table of the internal means of IC and the IC hits in the annual report
Company External hits
Internal IC mean
Medcomp 63 4,93 Cellcomp 51 4,44 Netcomp 46 4,26 Alucomp 38 4,14 Labelcomp 34 3,03 Itcomp 33 2,72 Biocomp 26 2,67 Furcomp 25 1,89
0
1
2
3
4
5
6
0 10 20 30 40 50 60 70
Internal disclosures
Hits in annual report
Total IC
Medcomp
Cellcomp
Netcomp
Alucomp
Labelcomp
Itcomp
Biocomp
Furcomp

48
Chart 2. Chart of the correlation between the internal means of HC and the HC hits in the
annual report
Table 5.2 Table of the internal means of HC and the HC hits in the annual report
Company External hits
Internal HC means
Netcomp 16 4,42 Medcomp 10 5,21 Alucomp 13 4,04 Cellcomp 8 4,3 Labelcomp 9 3,57 Furcomp 5 2,37 Itcomp 8 2,44 Biocomp 5 3,41
0
1
2
3
4
5
6
0 2 4 6 8 10 12 14 16 18
Internal disclosures
Hits in annual report
HC
Netcomp
Medcomp
Alucomp
Cellcomp
Labelcomp
Furcomp
Itcomp
Biocomp

49
Chart 3. Chart of the correlation between the internal means of RC and the RC hits in the
annual report
Table 5.3 Table of the internal means of RC and the RC hits in the annual report
Company External hits
Internal RC means
Netcomp 34 4,29 Medcomp 29 4,17 Alucomp 20 4,74 Cellcomp 19 3,49 Labelcomp 16 2,71 Furcomp 25 1,54 Itcomp 16 4,05 Biocomp 9 2,02
0
0,5
1
1,5
2
2,5
3
3,5
4
4,5
5
0 5 10 15 20 25 30 35 40
Internal re
ports
Hits in annual report
RC
Netcomp
Medcomp
Alucomp
Cellcomp
Labelcomp
Furcomp
Itcomp
Biocomp

50
Chart 4. Chart of the correlation between the internal means of SC and the SC hits in the
annual report
Table 5.4 Table of the internal means of SC and the SC hits in the annual report
Company External hits
Internal SC means
Netcomp 13 4,08 Medcomp 12 5,42 Alucomp 13 3,64 Cellcomp 11 5,53 Labelcomp 9 2,81 Furcomp 3 1,75 Itcomp 2 1,67 Biocomp 11 2,58
0
1
2
3
4
5
6
0 2 4 6 8 10 12 14
Internal disclosures
Hits in annual report
SC
Netcomp
Medcomp
Alucomp
Cellcomp
Labelcomp
Furcomp
Itcomp
Biocomp

51
5.3 Analyze company by company
5.3.1 NETCOMP
Table 5.5. Value creation means:
Company HC RC SC IC 1. Medcomp 5.86 5.06 6.43 = 5.78
Table 5.6. External disclosures:
Company Hits in the annual report from the content analysis HC RC SC IC 1. NETCOMP 16 34 13 = 63
Table 5.7. Internal disclosures:
NETCOMP Internal reports Value creation IC 4.26 4.07 HC 4.42 3.99 RC 4.29 4.48 SC 4.08 3.75
NETCOMP is the company examined with the highest amount of external IC hits (63). This
observation correlates well with the relatively high amount of internal IC reporting (4.26).
The correlation is not surprising because the company thinks that IC reporting is an
important factor behind value creation (4.07). According to stakeholder theory the
disclosure behavior is logical since the company is eager to provide the stakeholders that
legitimize the existence of the company with relevant information regarding the company
performance.
RC is identified by 34 hits. Behind this high number is a disclosure pattern of caring about a
lot of different stakeholders. Information about philanthropy projects, detailed
environmental ambitions and disclosures about the rigorous use of standards is a mix of
information directed to a variety of stakeholders. This focus is also found in the broad
spectra internal disclosures of RC pointed out by the high RC Mean from the questionnaire
(4.48).

52
The company focuses more on RC and SC (In relative terms) than on HC in the Annual
Report. It is not possible to explain this by arguing that HC has a weak connection to value
creation since the company has indicated that HC is not unimportant for value creation
(3.99).
5.3.2 Furcomp
Table 5.8. Value creation means:
Company HC RC SC IC 8. Furcomp 2.84 1.64 1.75 = 2.08
Table 5.9. External disclosures:
Company Hits in the annual report from the content analysis HC RC SC IC 6. Furcomp 5 25 3 = 33
Table 5.10. Internal disclosures:
Furcomp Internal reports Value creation IC 1.89 2.08 HC 2.37 2.84 RC 1.54 1.64 SC 1.75 1.75
Furcomp is the company in the study that had the weakest correlation between the internal
and external IC disclosures. The content analysis resulted in 33 IC hits which are below but
not very far from the overall external IC mean of the study (39.5). The internal disclosures
are extremely rare with a mean of only 1.89 which by far is the lowest in the study. The low
rate is in line with the view that internal IC reporting is weakly connected to value creation
(2.08). This discrepancy between internal and external IC reporting could be explained in
several ways. One possibility is that the company wants its stakeholders to believe that they
have an IC focus. The reason for this could be that IC is regarded by modern business
research (described in the IC theory section) to be an important source behind competitive
advantage and consequently of interest to company stakeholders.

53
Human and Structural capital are both reported to a very limited extent in the annual report
(3 and 5 hits). In these categories their disclosures correlate well between internal and
external reporting.
The overall discrepancies are rooted in the different disclosure of RC. The CFO:s description
of the internal reporting summed up in a very low RC mean (1.54) while the content analysis
found 25 hits which are 4 hits higher than the mean for all companies. This could be
interpreted as a strong will to please stakeholders in the sense that the tiny efforts put on
stakeholder relational work internally are overemphasized or exaggerated in the annual
report.
5.3.3 Medcomp
Table 5.11. Value creation means:
Company HC RC SC IC 1. Medcomp 5.86 5.06 6.43 = 5.78
Table 5.12. External disclosures:
Company Hits in the annual report from the content analysis HC RC SC IC 2. Medcomp 10 29 12 = 51
Table 5.13. Internal disclosures:
Medcomp Internal reports Value creation IC 4.93 5.78 HC 5.21 5.86 RC 4.17 5.06 SC 5.42 6.43
Medcomp is the company with the most internal reports and the company really thinks IC is
important for the value creation. This is also reflected in the annual report where Medcomp
has the second most hits of external IC disclosures of the companies in our survey (51). This
correlates very well with the internal report of IC that shows a high extent of disclosures

54
(4.93). They also seem to truly think that IC disclosures matter because they show a high
correlation between the internal and external disclosures and to what extent this
information contributes to the value creation (5.78).
The high correlation is a theme that is applicable for Medcomp even if we break down IC
into the categories HC, RC and SC. The company has quite a few hits on HC in the annual
report (10) and has a high correlation against the internal disclosures with a high extent of
reports and documents (5.21). Medcomp also seem to appraise human capital disclosures
high because they also have a high figure in the column value creation (5.78)
There is also correlation between the internal and external disclosures when it comes to RC
where Medcomp have lots of hits in the annual report (29) and at the same time have lots of
internal disclosures (4.17) that they believe are important factors for success in the company
because of the high number in value creation (5.06).
Finally Medcomp has 12 hits of SC in the annual report. This is high in relative terms in a
comparison to the other companies in our study and this is also reflected in their internal
reports where they have a high figure (5.42) and think that SC is very important disclosures
for the value creation (6.43).
5.3.4 Itcomp
Table 5.14. Value creation means:
Company HC RC SC IC 6. Itcomp 3.41 3.54 1.83 = 2.93
Table 5.15. External disclosures:
Company Hits in the annual report from the content analysis HC RC SC IC 7. Itcomp 8 16 2 = 26
Table 5.16 Internal disclosures:
Itcomp Internal reports Value creation IC 2.72 2.93 HC 2.44 3.41

55
RC 4.05 3.54 SC 1.67 1.83
Itcomp was one of the company’s in the content analysis with the lowest amount of external
IC hits (26). This observation correlates very well with the low amount of internal IC
reporting (2.72). The correlation also conforms to the fact that the respondent doesn’t think
that IC is an important factor behind value creation for the company (2.93). So in this case
there are no discrepancies between their internal‐ and external disclosures if we analyze
their total amount of intellectual disclosures.
When we analyzed and broke down IC in the 3 sub‐categorize they also correlated quite
well. The company has 8 hits of HC in their annual report and they don’t have a high value,
i.e. don’t disclose much, in their internal rapports (2.44). But here there is a higher
discrepancy with how important they think HC are for their value creation (3.41). This does
not correspond so well with the stakeholder theory that states that Itcomp should disclose
much HC disclosures in the annual report if they think it’s important for the value creation
and therefore reasonably should also be of importance for different stakeholders. On the
other hand they don’t have that much of internal disclosures to disclose in the annual
report.
Itcomp have 16 hits of RC in their annual report. That’s relatively low compared to the other
companies. Here is also a discrepancy compared to their internal rapport were they have a
quite high number of internal disclosures (4.05) that correlates rather well with how much it
adds to the value creation (3.54). In this case you can apply the same reasoning as above,
namely that it’s rather odd that Itcomp doesn’t disclose more RC in their annual report,
especially as they have pretty much disclosures of RC internally.
Finally they only disclose 2 hits of SC in their annual report. But this correlates well with their
internal reports because the company has very little internal reports of SC (1.67) and they
don’t think it’s valuable for the value creation (1.83).
5.3.5 Alucomp
Table 5.17. Value creation means:
Company HC RC SC IC
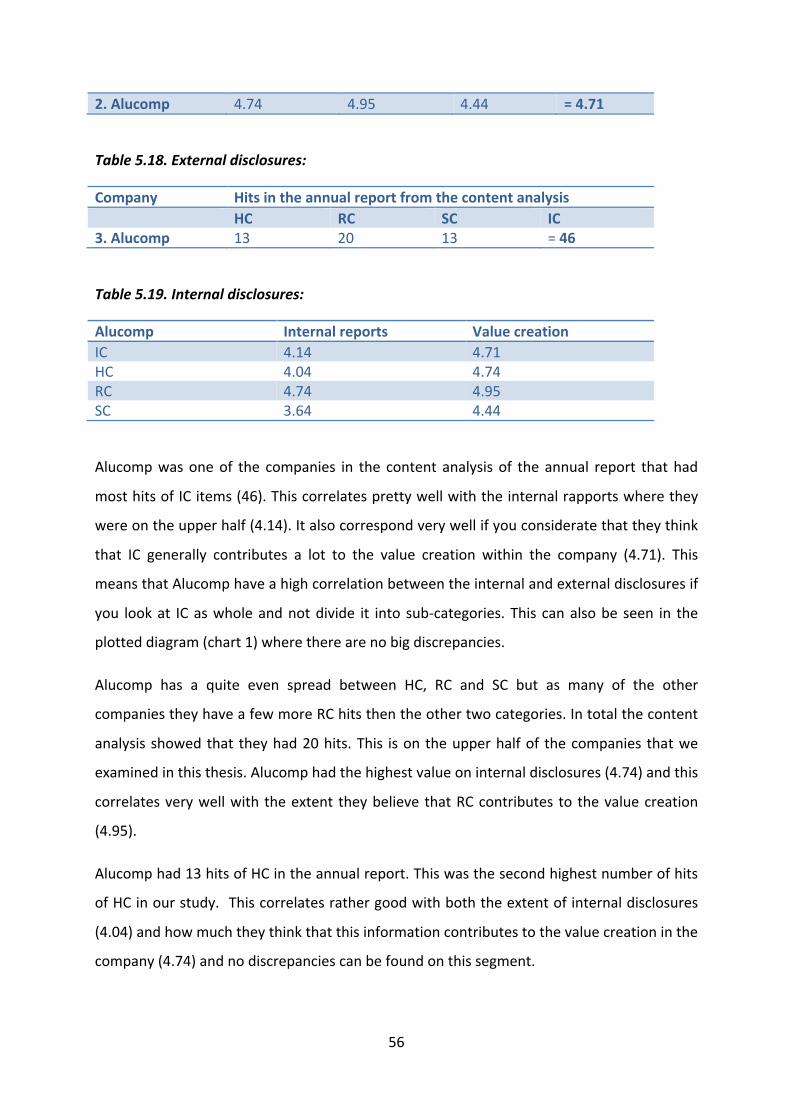
56
2. Alucomp 4.74 4.95 4.44 = 4.71
Table 5.18. External disclosures:
Company Hits in the annual report from the content analysis HC RC SC IC 3. Alucomp 13 20 13 = 46
Table 5.19. Internal disclosures:
Alucomp Internal reports Value creation IC 4.14 4.71 HC 4.04 4.74 RC 4.74 4.95 SC 3.64 4.44
Alucomp was one of the companies in the content analysis of the annual report that had
most hits of IC items (46). This correlates pretty well with the internal rapports where they
were on the upper half (4.14). It also correspond very well if you considerate that they think
that IC generally contributes a lot to the value creation within the company (4.71). This
means that Alucomp have a high correlation between the internal and external disclosures if
you look at IC as whole and not divide it into sub‐categories. This can also be seen in the
plotted diagram (chart 1) where there are no big discrepancies.
Alucomp has a quite even spread between HC, RC and SC but as many of the other
companies they have a few more RC hits then the other two categories. In total the content
analysis showed that they had 20 hits. This is on the upper half of the companies that we
examined in this thesis. Alucomp had the highest value on internal disclosures (4.74) and this
correlates very well with the extent they believe that RC contributes to the value creation
(4.95).
Alucomp had 13 hits of HC in the annual report. This was the second highest number of hits
of HC in our study. This correlates rather good with both the extent of internal disclosures
(4.04) and how much they think that this information contributes to the value creation in the
company (4.74) and no discrepancies can be found on this segment.

57
Conclusively Alucomp had lots of SC‐hits in the external reporting (13). On this sub‐category
there are some discrepancies between the internal reporting were they only had a pretty
average reporting (3.64). On the other hand they think that SC is important for the value
creation in the company (4.44) and therefore this can be the explanation for the pretty
widespread disclosure in the annual report. This correspond well with the stakeholder
theory which says that if you think that something is important for your company it is also
important to disclose and provide this information to the companies stakeholders.
5.3.6 Cellcomp
Table 5.20. Value creation means:
Company HC RC SC IC 3. Cellcomp 4.87 3.47 4.94 = 4.43
Table 5.21. External disclosures:
Company Hits in the annual report from the content analysis HC RC SC IC 4. Cellcomp 8 19 11 = 38
Table 5.22. Internal disclosures:
Cellcomp Internal reports Value creation IC 4.44 4.43 HC 4.30 4.87 RC 3.49 3.47 SC 5.53 4.94
Cellcomp have as most companies in the study with very few exceptions, a very high
correlation between the internal and external disclosures. But they have a little bigger focus
on internal disclosures and have a tendency to disclose a little bit less in the annual report.
They have 38 hits of IC in their annual report and this is very near the mean of the
companies we examined. At the same time Cellcomp have a high number (4.44) in internal
reports and a rather high value in the weighted value creation (4.43) but the discrepancy is
very small and too little to draw any conclusions from.

58
Both the HC internal reports (4.30) and value creation mean (4.87) and SC internal reports
(5.53) and value creation (4.94) mean shows a very high correlation with the hits from the
annual report (8 HC hits and 11 SC hits). But there is a little higher discrepancy between the
relational capital figures. Here Cellcomp as many other companies have lots of disclosures in
the annual report (19) but they don’t have so many internal documents (3.49) or think this
information contributes to the value creation (3.47) in any large extent. The only logical
explanation that we can think of is that the company itself doesn’t think it’s so important for
the value creation (in relative terms) but they do believe it’s important to please certain
stakeholders and therefore overemphasize their RC disclosures in the annual report to
please the stakeholders.
5.3.7 Biocomp
Table 5.23. Value creation means:
Company HC RC SC IC 7. Biocomp 3.00 2.85 2.58 = 2.81
Table 5.24. External disclosures:
Company Hits in the annual report from the content analysis HC RC SC IC 8. Biocomp 5 9 11 = 25
Table 5.25. Internal disclosures:
Biocomp Internal reports Value creation IC 2.67 2.81 HC 3.41 3.00 RC 2.02 2.85 SC 2.58 2.58
Biocomp is the company with the least amount of hits in the annual report with 25 IC‐hits.
Although this are low numbers of IC in the external disclosures it correlates well with their
internal reports which show a very limited extent of disclosures (2.67). The respondent from

59
Biocomp does not think that IC generally contributes to the value creation in any wider
extent (2.81).
The only thing that’s noteworthy that makes Biocomp stand out a little bit from the other
companies are that they have more SC disclosures than RC disclosures in their annual report.
All other companies that we have reviewed had most RC disclosed of the 3 sub‐categories in
the external disclosures. But there are no discrepancies in Biocomp because they have a
higher value of internal reports on SC (2.58) than on RC (2.02) so the correlation conform
very well with the annual report where they have 11 SC hits compared to 9 RC hits.
5.3.8 Labelcomp
Table 5.26. Value creation means:
Company HC RC SC IC 4. Labelcomp 3.50 4.56 4.47 = 4.18
Table 5.27. External disclosures:
Company Hits in the annual report from the content analysis HC RC SC IC 5. Labelcomp 9 16 9 = 34
Table 5.28. Internal disclosures:
Labelcomp Internal reports Value creation IC 3.03 4.18 HC 3.57 3.50 RC 2.71 4.56 SC 2.81 4.47
Labelcomp has a quite average number of IC hits in their annual report. This correlates well
with their internal reports were they also have a rather average number of internal reports
(3.03). Despite this they tend to think IC is fairly important if you review the value creation
figures where the mean are 4.18. This discrepancy is difficult to find any good explanation
behind other than that Labelcomp as an individual company maybe has some areas to

60
improve in terms of reports and disclosures that they find important. This is particularly
striking if you review the RC and SC figures where Labelcomp has rather decent amount of
hits in the annual report (16 and 9) but really low extent of internal reports (2.71 and 2.81).
The only kind of intellectual capital where Labelcomp doesn’t have any discrepancies is in
the disclosures of HC. There are good correlations both externally (9 hits (average)) and
internally (3.57 (average)), and with how much they think this information contributes to the
value creation (3.50).

61
6. Conclusion
In the final chapter we present our findings of our research in accordance with its purpose.
Furthermore carry out some critical review of the used methodology. Lastly we present some
suggestions for further research.
6.1 Conclusion and results
The purpose of our study is as stated under section 1.3:
The purpose of this thesis is to empirically study companies internal and external reporting of
intellectual capital to answer the following three questions: i) How much and what kind of IC
information is reported to the top‐management inside a company and ii) How much and
what kind of IC information is presented to the stakeholders in the annual report. iii) Is there
a correlation or are there discrepancies between I and II and how potential discrepancies
exploited between i) and ii) could be explained with the help of theories.
Firstly the authors state that it’s difficult to draw an absolute trueness that is generalizable
from our study. The reason behind this is that the sample of companies that we examined is
to small to give any certainty that the findings also are true and applicable for a larger
population. Nevertheless the study showed significant and valuable results.
(i) The first question is answered under section 4.3.1 in table 4.2. From the table it
can be deduced that the companies examined had a mean of 3,51 of internal IC
disclosures in the scale 1‐7, where the pivot are 4. So neither large nor small
amounts of IC are reported internally. Among the 3 different types of IC it was a
fairly even distribution with most HC disclosures (3.72), middling SC disclosures
(3.44) and least of RC disclosures (3.38).
(ii) Question two can only be analyzed in relative terms because it is the number of
hits in the annual report that are examined and nor high or low extent as the
internal disclosures were. The number of hits was analyzed company by company
against how much internal IC disclosures they had and the result showed a very
high correlation which is easily observed under the scattered chart 1 under
section 5.2.

62
(iii) As stated under (ii) our studies showed a very high correlation between internal
and external disclosures with very few discrepancies between (i) and (ii). Another
interesting observation is that almost all companies had most RC hits in their
annual reports, despite the fact that it was the category that they hade least
internal disclosures on, as stated above. The reason behind this is not clear but if
you apply the logics in the stakeholder theory it could be argued that the
companies think that information about customer relations and other relational
capital disclosures are important information for the stakeholders. Therefore the
companies disclose a lot of information about RC even though their internal
disclosures aren’t as extensive.
6.2 Methodology critique
Finally we want to end this thesis with a critical review of our chosen methodology, and if it
was suitable and worked as intended, or whether a different methodology had been better.
The Authors believe that our methodology of using questionnaires was quite solid but a few
things could have been better. To start with we want to declare that it was a difficult task to
construct a perfect methodology to reach a desirable result and fulfill the purpose because
of the limited number of comparable studies that we could gain inspiration from. The
biggest disadvantage with the empirics from our study is the low response rate from the
respondents. In retrospect it could have been better to not apply such an extensive
questionnaire, and in that way increase the chance of receiving more answers. Nevertheless
this would of course had the effect that we would not have acquired so much information to
analyze that we wanted to get a holistic perspective on the companies’ internal intellectual
capital. One way to get a higher response rate without lowering the extent of the
questionnaire could have been to use a questionnaire that the respondents could answer in
the web browser instead of via e‐mail. This is often practical and one respondent even gave
us that tip. So if we should have started from the beginning with a similar quantitative study
we would presumably revise this possibility.
At last the authors are pleased with the other parts of the methodology in the study. It is
worth mentioning that it is almost impossible to apply a perfect coding manual for the

63
content analysis without interpretations from the coders but we are satisfied how that part
of the thesis turned out.
6.3 Suggestions for further research
As mentioned in the conclusion above our result isn’t so generalizable due to the small
sample that we examined. Hence a larger sample in future studies would be desirable, and
would hopefully lead to a considerable contribution to the current theories.
The authors used stakeholder theory and reasoning around value creation to analyze the
result of our study. It would also be interesting to use other theories and models to explain
disclosure behaviour. It would also contribute to the research if a more qualitative approach
could be used to examine the companies that show discrepancies between internal and
external disclosures. It is almost impossible to scrutinize and come up with the real reasons
behind possible mis‐matches between internal‐ and external disclosures if you only do
quantitative reasearches.
Finally the authors would find it interesting to involve an external factor such as profitability,
cost of capital or stock price to examine if the companies that have a good correlation
between internal and external disclosures of intellectual capital have advantages against the
ones that don’t.

64
7. Source reference
7.1 Literature
Alvesson, M (2004) Knowledge work and knowledge‐intensive firms, Oxford University Press,
New York
Alvesson, M & Skäldberg, K (2009) Reflexive methodology: new vistas for qualitative
research, SAGE Publications Ltd, London
Bryman, A & Bell, E (2007) Business research methods, Oxford University Press.
Edvinsson, L. and Malone, M.l. Intellectual Capital: Realizing Your Companys True Value by
Finding Its Hidden Brainpower. New York: HarperBusiness, 1997.
Friedman, M. (1962). Capitalism and Freedom. University of Chicago Press, Chicago, USA.
Jacobsen, D. I. (2002) Vad, hur och varför? Om metodval i företagsekonomi och andra
samhällsvetenskapliga ämnen (Lund: Studentlitteratur)
7.2 Articles
Abeysekera, I. & Guthrie, J. (2004). Human Capital Reporting in a Developing Nation. British
Accounting Review, 36(3), pp. 251‐268.
Abeysekera, I. The project of intellectual capital disclosure: research the research (2006),
Journal of Intellectual Capital, Vol 7 No 1, pp 61‐77.
Ax, C. and Björkenak, T. (2005) Bundling and diffusion of management accounting
innovations: The case of the balanced scorecard in Sweden”, Management Accounting
research Vol 16 No 1, pp. 1‐20

65
Ax, C. and Marton, J. (2008) Human capital disclosures and management practices, School of
Business, Göteborg, Sweden. Journal of intellectual capital Vol 9 No 3, pp. 433‐455
Beattie, V. & Thomson, S.J. Lifting the lid on the use of content analysis to investigate
intellectual capital disclosures. Accounting Forum 31 (2007) 129‐163.
Bontis, N. (1998) Intellectual Capital: an explanatory study that develops measures and
models. Management Decisions, 36/2 pp. 63‐76. MCB University Press.
Bontis, N. (2003). Intellectual capital disclosure in Canadian corporations. Journal of Human
Resource Costing and Accounting, 7(1‐2), 9‐20.
Brennan, N. (2001) “Reporting intellectual capital in annual reports: Evidence from Ireland”
Accounting, Auditing & Accountability Journal, Vol 14 No 4 pp 423‐436
Bukh, P. N. (2003) The relevance of intellectual capital: a paradox, Accounting, Auditing and
Accountability Journal, Vol. 16 No. 1 pp. 49‐56.
Choong, K.K. (2008) Intellectual capital: definitions, categorization and reporting models,
Journal of Intellectual Capital, Vol. 9 No. 4 pp. 609‐638.
Deegan, C. (2000) Financial Accounting Theory. McGraw‐Hill, Sydney.
Dunning JH. The eclectic (OLI) paradigm of international production: past, present and
future. International Journal of the Economics of Business 2001;8(2):173–90.
Drucker, P. (1984) The new meaning of Corporate social responsibility. California
management review Vol 26 No 2. University of California, USA.
DÁveni, R.A. (1994) Hypercompetition: Managing the Dynamics of strategic maneuvering.
The Free Press, New York, USA.

66
Edvinsson L and Richtner A (1999) Words of value ‐ giving words to IC, Skandia, Sweden.
Fitz‐enz (2000). The ROI of Human Capital, measuring the economic value of employee
performance, Amacom, New York, USA.
Freeman, R. E. (1984). Strategic management : A stakeholder approach. Pitman, Boston MA,
USA.
Freeman, E. & McVea. A (2001) Stakeholder Approach to strategic Management, Darden
Business school: Working Paper No 01‐02, University of Virginia. Page 5
Gray, R. Kouhy, R. and Lavers, S. (1995) Corporate social and environmental responsibility: A
review of the literature and a longitudinal study of UK disclosure. University of Dundee,
Scotland. Accounting, Auditing & Accountability Journal Vol 8, nr 2, page 52. Pp 44‐47.
Guthrie, J. Petty, R. Ricceri, F. (2006) The voluntary reporting of intellectual capital ‐
Comparing evidence from Hong Kong and Australia. Journal of Intellectual Capital 7(2): 254‐
271.
Hudson, W (1993), Intellectual Capital: How to Build it, Enhance it, Use it. John Wiley & Sons,
New York, NY, USA.
Johanson, U. (2003) Why are capital market actors ambivalent to information about certain
indicators on intellectual capital?, Accounting, Auditing & Accountability Journal, Vol. 16 Iss:
1, pp.31 – 38.
Kaplan, R & Norton, D (1992), The Balanced Scorecard ‐ Measures that drive performance,
Harvard Business Review, No 92105, pp 72‐79
Likert, Rensis (1932). "A Technique for the Measurement of Attitudes". Archives of
Psychology 140: 1–55.

67
Martensson, M (2000) “A critical review of knowledge management as a management tool “.
Journal of intellectual capital, Vol 4 No. 3, pp.204‐16
Milne, M., & Adler, R (1999). Exploring the reliability of social and environmental disclosures
content analysis. Accounting, Auditing & Accountability Journal, 16(1), 18‐30.
Mouritzen, J.; Larsen, H.T. & Bukh, P.N. (2001) Valuing the future: intellectual capital
supplements at Skandia. Accounting, Auditing & Accountability Journal, Vol 14 No. 4, pp.
399‐422. Copenhagen Business School, Fredriksbergs, Denmark.
Nicolini, D. (1993), “Apprendimento organizzativ e pubblica amministrazione locale”, Autonomie Locali e Servizi Sociali, Vol. 16 No. 2.
Pfeffer, J. and G. R. Salancik (1978). The External Control of Organizations: A Resource
Dependence Perspective. New York, NY, Harper and Row.
Phillips, R. (2010) An excerpt from: Stakeholder theory and Organizational Ethics
Berret‐Koehler Publishers.
Roslender, R & Dyson J.R (1992). Accounting for the worth of employees: a new look at an
old problem. The British Accounting Review, vol 24, pp 311‐329.
Sveiby, K‐E (1997), The new Organizational Wealth, Managing and Measuring Knowledge‐
based Assets, 5th ed., Barrett‐Koehler, San Francisco, CA, USA.
Suchmann, M.C. (1995) “Managing Legitimacy: Strategic and Institutional Approaches”.
Academy of management Journal. Vol 20, nr 3, pp. 571‐609.
Sullivan, P.H (1998) Profiting from intellectual capital, Extracting Value from Innovation, John
Wiley, New York, NY.
Waldtkirch, R. (2008). The Shareholder vs the Stakeholder Debate reconsidered Discussion
paper 2008‐2.

68
Watts, R. & Zimmerman, J. (1990) Positive Accounting Theory: A ten year perspective. The
accounting review Vol 65 No 1 pp. 131‐156.
Winter, S.G. (1987), Knowledge and competence as strategic assets, in Teece, P.J (Ed.), The
Competitive Challenge: Strategies of Industrial Innovation and Renewal. Cambridge, MA pp.
159‐184
Reporting Intellectual capital to Augment research, Development and Innovations in SMEs.
(2006). Report to the Commission of the High Level Group on RICARDIS. EU Directorate‐
General for Research. Luxembourg: Office for Official Publications of the European
Communities.
Guidelines for managing and reporting on intangibles (Intellectual Capital report) (2002)
Chief Editor: Canibano, L. Professor of Accounting and Finance Autonomous University of
Madrid. The MERITUM project report – A project funded by the European Union within the
framework of the TSER programme.
7.3 Internet sources
Retriever Bolagsinfo (2011) https://web.retriever‐info.com/services/businessinfo.html
(use of database 2011‐04‐17‐2011‐04‐28)
Brooking (2011):
http://www.google.com/books?hl=sv&lr=&id=yxUP5ezSBKkC&oi=fnd&pg=PR9&dq=Annie+Brooking+
Intellectual+capital+1996&ots=14HRnETovo&sig=WdHHY‐fB‐WazF8DOYi9qQ‐
9yhEY#v=onepage&q&f=false)
(collected: 2011‐04‐25)
Business Dictionary (2011)
http://www.businessdictionary.com/definition/stakeholder.html
(collected: 2011‐05‐10)

69
IASPLUS (2011)
http://www.iasplus.com/standard/ias38.htm
(collected: 2011‐05‐13)
Reference for Business (2011)
http://www.referenceforbusiness.com/management/Tr-Z/Value-Creation.html
(collected: 2011‐05‐15)

1
8. Appendix – Questionnaire
Appendix 1. Questionnaire.
Part 1b ‐ Different stakeholders' importance to the value creation
The scale ranges from 1 = very limited extent to 7 = very large extent. Enter with an "X"
To what extent do the relationships with these external stakeholders, contribute to increased value creation (input of capital and work make a positive return over time) in your company?
N/A
1 2 3 4 5 6 7
1. current customers? 2. potential customers? 3. current shareholder? 4. investors? 5. financial analysts? 6. legislators, lobbyists and other regulators? 7. media? 8. trade associations? 9. universities/education centers 10. business partners? 11. suppliers? 12. lenders? 13. any other stakeholders? Specify which: Part 2 ‐ Questions regarding reporting of human capital Human capital is the value that the employees of a business provide through the application, skills and know-how. Examples are Experience, team-work capacity, employee flexibility, motivation, satisfaction, learning capacity, loyalty and formal training. Below are various aspects of human capital that companies can report around There are two ways to answer. (1) If you have marked an X in column 1, you should also mark an X in column 2. (2) Mark with an X in column N/A if your company does not report, or if question is not applicable for you. Column 1. To what extent do you have INTERNAL written reports, policy documents or policies relating to: (scale ranges from: 1 = very limited extent to 7 = Very great extent. Indicate with an "X" in column 1)
Column N/A
Column 1 Column 2
Column 2. How important is information on this matter for the value creation in your company? (scale ranges from: 1 = unimportant to very important = 7. Indicate with an "X" in column 2) 1 2 3 4 5 6 7 1 2 3 4 5 6 7
2.1 General questions 1. employees' computer skills and IT skills? 2. the employees' average length of employment? 3. the level of employee motivation?

2
4. documents with a percentage of middle managers with higher academic education? 5. staff gender distribution? 2.2 Recruitment 1. a recruitment strategy to ensure a diversified work force (gender, cultural background, educational background, previous working life experience)? 2. formal tests being part of your company’s recruitment process (e.g. IQ‐test, written cases to solve, personality questionnaires)? 3. recruitment at universities (Take part in career fair (arbetsmarknadsdagar) through showcases or promotional speeches? 4. The individual´s capacity for innovation and creativity an important in your recruitment process?) 2.3 Staff development 1. the internal education and training undertaken by your employees? 2. the external education and training undertaken by your employees? 3. key figures measuring the expenses put on employee development?
2.4 Compensation and Job Opportunities 1. job rotation to broaden the level of competence? 2. the factors determine promotion of employees?
3. compensation for working over‐time? 4. compensation for meeting or surpassing preset goals/budgets?
2.5 Staff Health and Job Satisfaction
1. Employee overall satisfaction?
2. the level of absence among employees? 3. giving incentives to the employees to care about their health (e.g. serve health food in company restaurant, provide gym cards)?
4. the annual turnover of full‐time employees?

3
Part 3 ‐ Questions relating to the reporting of relational capital Relational capital is intangible asset held by a company in the shape of relations to external customers. Examples are image, customer loyalty, customer satisfaction, and links with suppliers, commercial power and negotiating capacity. Below are various aspects of relationship capital that companies can report around There are two ways to answer. (1) If you have marked an X in column 1, you should also mark an X in column 2. (2) Mark with an X in column N/A if your company does not report, or if question is not applicable for you. Column 1. To what extent do you have INTERNAL written reports, policy documents or policies relating to: (scale ranges from: 1 = very limited extent to 7 = Very great extent. Indicate with an "X" in column 1)
Column N/A
Column 1 Column 2
Column 2. How important is information on this matter for the value creation in your company? (scale ranges from: 1 = unimportant to very important = 7. Indicate with an "X" in column 2) 1 2 3 4 5 6 7 1 2 3 4 5 6 7
3.1 Customer analysis
1. the number of customers and the average duration of a customer?
2. an internal rating system describing each customer’s level of importance?
3. number of new customers each year?
4. number of customers lost each year?
3.2 Customer contact
1. the amount of sales contacts compared sales closed?
2. the level of satisfaction held by customers (A customer satisfaction index, a report compiling customer complaints etc)?
3. the amount of promotional visits by your company taking place at potential customers?
4. the amount of money spent on marketing every year?
3.3 Other important stakeholders
1. what type of information about the company that should be displayed when dealing with media?
2. the type of information to be communicated to financial analysts?

4
3. complaints or ideas from suppliers of how to improve the business?
4. how your company work with environmental sustainability?
5. voluntary disclosures that are displayed to the shareholders in the annual?
6. relationship to the company's investors
7. how you intend to influence law / regulations through lobbying or other informal channels
3.4 Market knowledge
1. forecast reporting to analyze the market (By this we mean reports that gives a picture of the market conditions based upon the analysis of parameters such as macro‐economic factors, competitor analysis etc)?
2. how to penetrate the market more effectively?
3. market share numbers?
4. the development of substitutes to your product/service?
5. information about strategic decisions regarding entering/exit different markets?
Part 4 ‐ Issues relating to the reporting of structural capital Structural capital is the supportive processes and infra structure that enables the human capital in the company to function. Examples are Routines, Processes, systems, software, patents and trademarks. Below are various aspects of structural capital that companies can report around. There are two ways to answer. (1) If you have marked an X in column 1, you should also mark an X in column 2. (2) Mark with an X in column N/A if your company does not report, or if question is not applicable for you Column 1. To what extent do you have INTERNAL written reports, policy documents or policies relating to: (scale ranges from: 1 = very limited extent to 7 = Very great extent. Indicate with an "X" in column 1)
Column N/A
Column 1 Column 2
Column 2. How important is information on this matter for the value creation in your company? (scale ranges from: 1 = unimportant to very important = 7. Indicate with an "X" in column 2) 1 2 3 4 5 6 7 1 2 3 4 5 6 7
4.1 Organizational 1. certain methods to achieve improvements in your processes (Kaizen‐ improvements, Just‐in‐time thinking etc) 2. the performance and current competitive position of key suppliers and customers?

5
3. the employees level of empowerment? 4.2 Innovation 1. a knowledge center or an internal database to capture knowledge gained through internal research and innovations? 2. intellectual property rights (patents, trademarks, copyrights, trade secrets or industrial design rights)? 3. results from internal research and development? 4. where in the organization innovations or renewals of the company are initiated (From top‐management, in R&D lab, ideas from customers via front‐line employees, grass‐root level ideas from the production staff)? 4.3 Process 1. corporate quality performance standards (e.g. ISO 9000)? 2. measurements that built upon a combination of performance and quality? 3. the average time until completion regarding projects in the company? 4. administrative cost per employee?
Thank you for your participation! Please send your completed document to carl(a)leijonhielm.se or henriklarsson1983(a)hotmail.com
Best regards Carl Leijonhielm 0739 ‐ XX XX XX Henrik Larsson 0734 ‐ XX XX XX