Embed Size (px)
Citation preview
14 / Regulation / WINTER 2019–2020
‘Patent Tigers’ and Global Innovation
Far from impeding developing countries, intellectual property rights can unleash their economies.✒ BY JONATHAN M. BARNETT
I N T E L L E C T UA L P R O P E R T Y
It is often argued that robust patent protection poses a barrier to economic development by limiting access to the knowledge inputs required to move up the global value chain. In short: the patent system keeps poor countries poor and rich countries rich. In an empirical study that surveyed 50 years (1965–2015) of patenting at the U.S. Patent and Trademark Office
(USPTO), I identified evidence indicating that sometimes just the opposite occurs.
First, I found that patenting data evidenced a pronounced shift of innovation activity to East Asia, which by 1990 had eclipsed Europe as the principal non-U.S. region-level recipient of patents at the USPTO. Second, I identified a cluster of emerging-market countries—Israel, South Korea, and Taiwan—that have invested substantially in intellectual and human capital, made intensive use of the U.S. patent system, and now constitute critical nodes in the global technology ecosystem. Starting in the 1990s, these late-developing countries exhibited a steep growth in patenting activity at the USPTO. They now consistently appear among the leading recipients of USPTO-issued patents annually when measured on a per-capita and per–gross domestic product basis. These countries’ investments in innovation have yielded economic dividends. During this same period, their economies have grown significantly and reached parity with the domestic per-capita GDP levels of middle- to upper-middle-income developed countries.
All these trends persist when the data are updated through 2018 (aside from a universal decline in USPTO patent awards
JONATHAN M. BAR NETT is the Torrey H. Webb Professor of Law at the University of Southern California Gould School of Law. This article is based on his paper, “Pat-ent Tigers: The New Geography of Global Innovation,” Criterion Journal on Innovation 2: 429–489 (2017). That paper was supported by a grant from the Leonardo Da Vinci Fellowship at the Center for the Protection of Intellectual Property at George Mason University Antonin Scalia Law School.
in 2018). Subject to the standard disclaimer that correlation does not imply causation, these findings support the curiously unconventional view that intensive patenting—in particular, pat-enting strategies targeted at the wealthiest and largest consumer markets—is not only compatible with, but can promote, a positive trajectory of economic growth and development.
GLOBALIZATION OF THE U.S. PATENT SYSTEM
Since patents are territorial rights, a U.S. patent only has legal force against domestic infringement. However, as a practical matter, it has extraterritorial reach for two reasons. First, the owner of a U.S. patent can block the importation of infringing products through the International Trade Commission (ITC), a U.S. administrative entity. Second, the United States offers entre-preneurs the world’s largest consumer market that, unlike the European market, can be accessed through a single patent office. Given these factors, non-U.S. innovators that seek to maximize the global economic value of their technology are likely to seek patent protection at the USPTO.
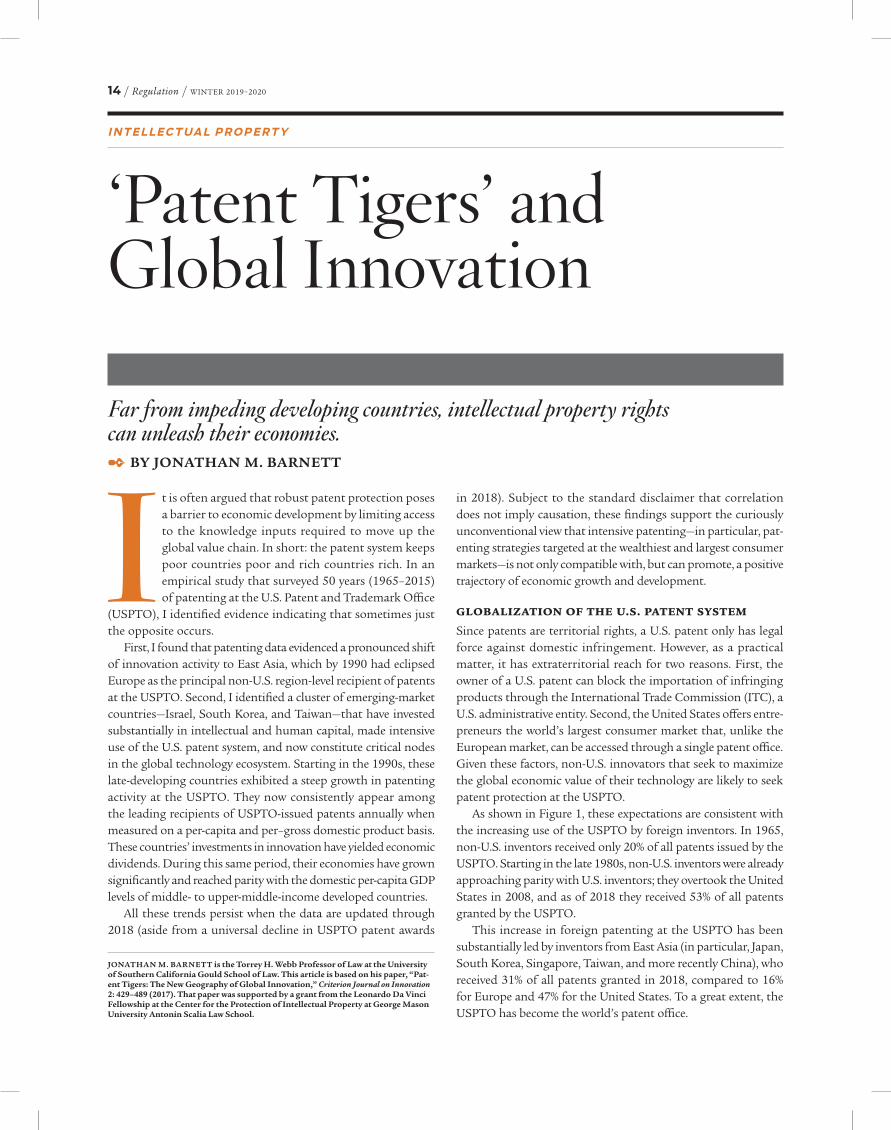
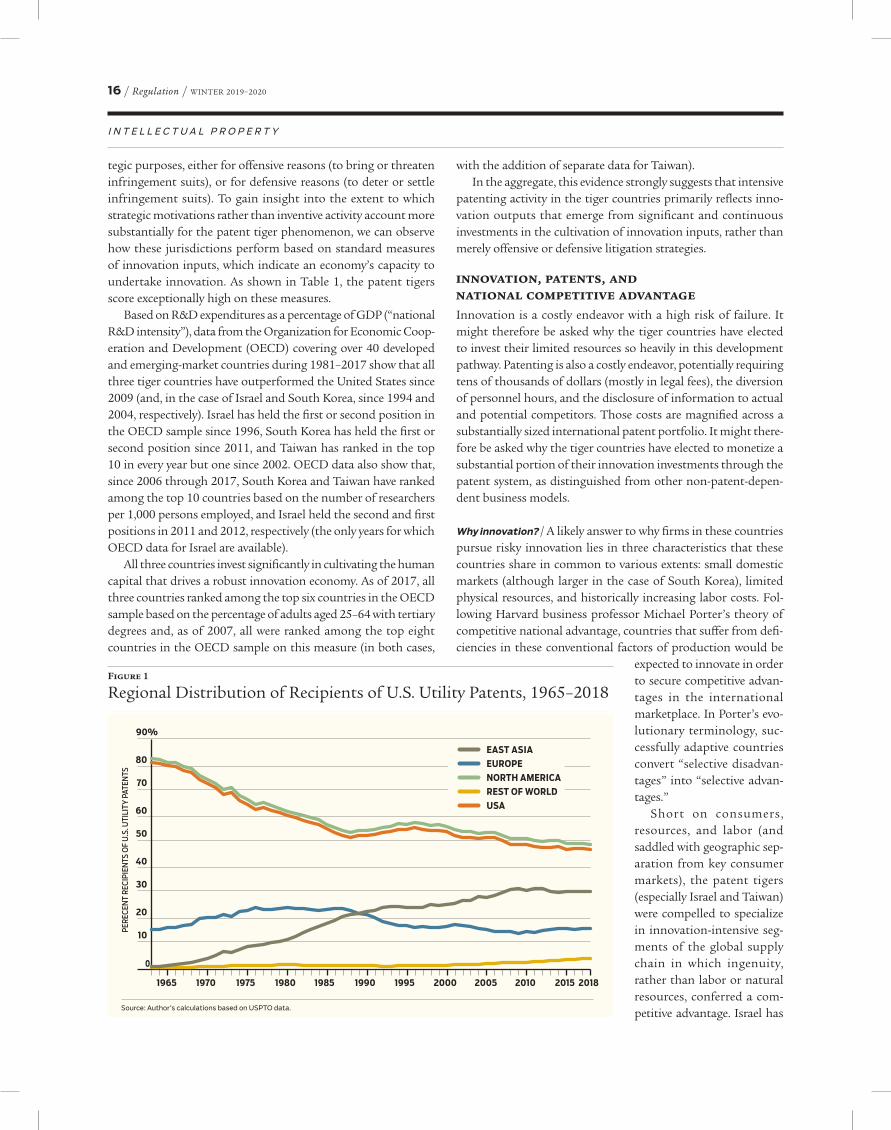
As shown in Figure 1, these expectations are consistent with the increasing use of the USPTO by foreign inventors. In 1965, non-U.S. inventors received only 20% of all patents issued by the USPTO. Starting in the late 1980s, non-U.S. inventors were already approaching parity with U.S. inventors; they overtook the United States in 2008, and as of 2018 they received 53% of all patents granted by the USPTO.
This increase in foreign patenting at the USPTO has been substantially led by inventors from East Asia (in particular, Japan, South Korea, Singapore, Taiwan, and more recently China), who received 31% of all patents granted in 2018, compared to 16% for Europe and 47% for the United States. To a great extent, the USPTO has become the world’s patent office.
WINTER 2019–2020 / Regulation / 15
THE RISE OF THE PATENT TIGERS
The “patent tigers” stand out even among the group of foreign countries whose inventors regularly file applications at the USPTO.
Patenting rates on a country-by-country basis are often described in terms of absolute values. While this tends to obscure the inventive output of smaller countries, even absolute values suggest that cer-tain smaller countries are “punching above their weight” in terms of patenting activity. As of 2018, South Korea, Taiwan, and Israel all appear among the top 10 non-U.S. recipients of patents at the USPTO. South Korea is in second place, ahead of larger countries such as Germany and China. Taiwan (ranked in fifth place) was awarded more U.S. patents in 2018 than the United Kingdom, which has almost three times as many people, while Israel (ranked in 10th place) was awarded more U.S. patents in 2018 than Italy, which has approximately seven times as many people.
If measured on a per-capita basis, the tiger countries’ excep-tionally and continuously high patenting levels are more salient. Since 1996, 2005, and 2009, respectively, Taiwan, Israel, and South Korea have ranked, together with the United States and Japan,
among the top five recipients of USPTO patents on a per-capita basis. Since 2015 through 2018, Israel and Taiwan have exchanged the first and second positions. If measured on a per-GDP basis, the patent tigers have all appeared among the top five countries since 1997 and Taiwan has held the first position on a per-GDP basis since 1993. Whether measured on a per-capita or per-GDP basis, the members of the “top five” exhibit levels of patenting that substantially exceed even other countries whose inventors are otherwise the most active customers at the USPTO.
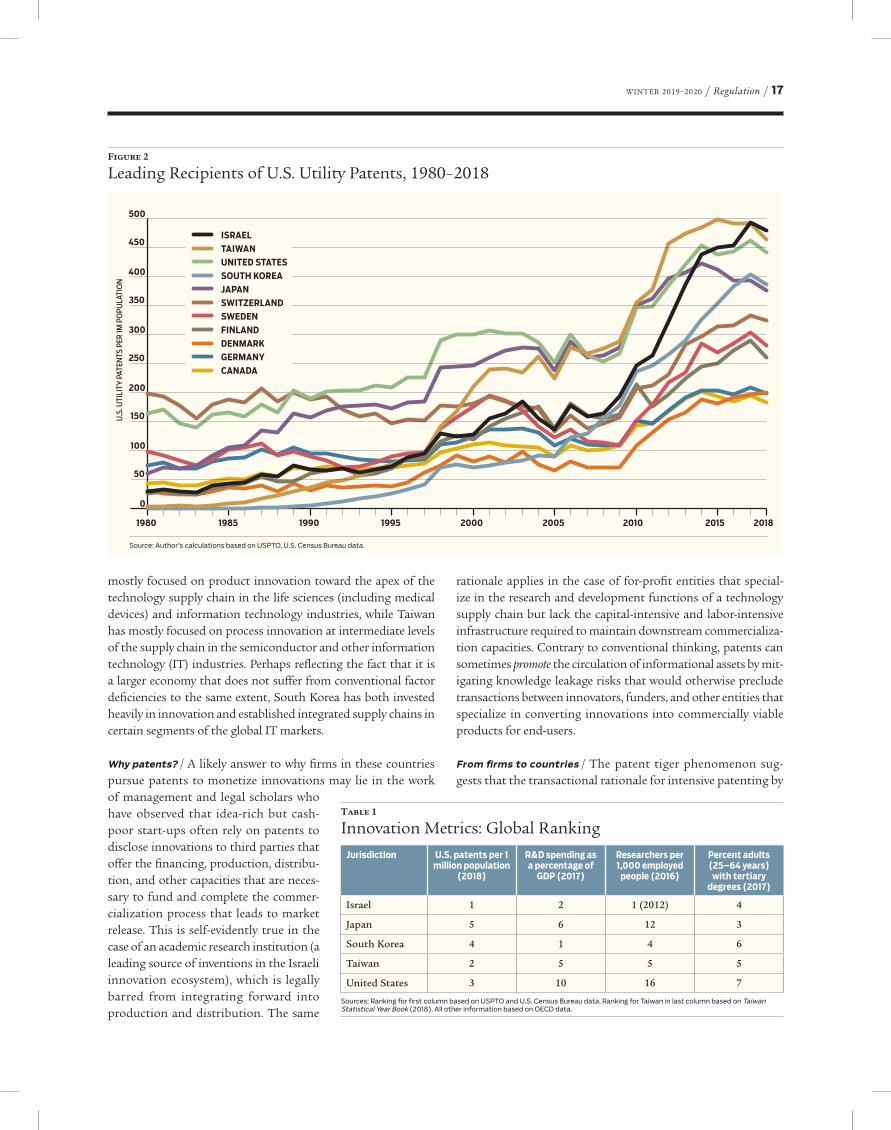
These trends can be seen in Figure 2, which shows the rise of the patent tigers starting in the 1990s, accompanied by eight other countries that together constituted the top 11 recipients of USPTO-issued patents on a per-capita basis as of 2018. (The 11th country, Canada, is included because it is arbitrarily close to the 10th-ranked country in 2018.)
PATENT TIGERS = INNOVATION TIGERS
High patenting output is not necessarily indicative of high levels of inventive output. Firms sometimes apply for patents for stra-
16 / Regulation / WINTER 2019–2020
I N T E L L E C T U A L P R O P E R T Y
tegic purposes, either for offensive reasons (to bring or threaten infringement suits), or for defensive reasons (to deter or settle infringement suits). To gain insight into the extent to which strategic motivations rather than inventive activity account more substantially for the patent tiger phenomenon, we can observe how these jurisdictions perform based on standard measures of innovation inputs, which indicate an economy’s capacity to undertake innovation. As shown in Table 1, the patent tigers score exceptionally high on these measures.
Based on R&D expenditures as a percentage of GDP (“national R&D intensity”), data from the Organization for Economic Coop-eration and Development (OECD) covering over 40 developed and emerging-market countries during 1981–2017 show that all three tiger countries have outperformed the United States since 2009 (and, in the case of Israel and South Korea, since 1994 and 2004, respectively). Israel has held the first or second position in the OECD sample since 1996, South Korea has held the first or second position since 2011, and Taiwan has ranked in the top 10 in every year but one since 2002. OECD data also show that, since 2006 through 2017, South Korea and Taiwan have ranked among the top 10 countries based on the number of researchers per 1,000 persons employed, and Israel held the second and first positions in 2011 and 2012, respectively (the only years for which OECD data for Israel are available).
All three countries invest significantly in cultivating the human capital that drives a robust innovation economy. As of 2017, all three countries ranked among the top six countries in the OECD sample based on the percentage of adults aged 25–64 with tertiary degrees and, as of 2007, all were ranked among the top eight countries in the OECD sample on this measure (in both cases,
with the addition of separate data for Taiwan). In the aggregate, this evidence strongly suggests that intensive
patenting activity in the tiger countries primarily reflects inno-vation outputs that emerge from significant and continuous investments in the cultivation of innovation inputs, rather than merely offensive or defensive litigation strategies.
INNOVATION, PATENTS, AND NATIONAL COMPETITIVE ADVANTAGE
Innovation is a costly endeavor with a high risk of failure. It might therefore be asked why the tiger countries have elected to invest their limited resources so heavily in this development pathway. Patenting is also a costly endeavor, potentially requiring tens of thousands of dollars (mostly in legal fees), the diversion of personnel hours, and the disclosure of information to actual and potential competitors. Those costs are magnified across a substantially sized international patent portfolio. It might there-fore be asked why the tiger countries have elected to monetize a substantial portion of their innovation investments through the patent system, as distinguished from other non-patent-depen-dent business models.
Why innovation? / A likely answer to why firms in these countries pursue risky innovation lies in three characteristics that these countries share in common to various extents: small domestic markets (although larger in the case of South Korea), limited physical resources, and historically increasing labor costs. Fol-lowing Harvard business professor Michael Porter’s theory of competitive national advantage, countries that suffer from defi-ciencies in these conventional factors of production would be
expected to innovate in order to secure competitive advan-tages in the international marketplace. In Porter’s evo-lutionary terminology, suc-cessfully adaptive countries convert “selective disadvan-tages” into “selective advan-tages.”
Short on consumers, resources, and labor (and saddled with geographic sep-aration from key consumer markets), the patent tigers (especially Israel and Taiwan) were compelled to specialize in innovation-intensive seg-ments of the global supply chain in which ingenuity, rather than labor or natural resources, conferred a com-petitive advantage. Israel has
Figure 1
Regional Distribution of Recipients of U.S. Utility Patents, 1965–2018
0
20
40
60
80
10
30
50
70
90%
1965 1970 1975 1980 1985 1990 1995 2000 2005 2010 2015 2018
EAST ASIAEUROPENORTH AMERICAREST OF WORLDUSA
PER
ECEN
T R
ECIP
IEN
TS O
F U
.S. U
TILI
TY P
ATEN
TS
Source: Author’s calculations based on USPTO data.
WINTER 2019–2020 / Regulation / 17
mostly focused on product innovation toward the apex of the technology supply chain in the life sciences (including medical devices) and information technology industries, while Taiwan has mostly focused on process innovation at intermediate levels of the supply chain in the semiconductor and other information technology (IT) industries. Perhaps reflecting the fact that it is a larger economy that does not suffer from conventional factor deficiencies to the same extent, South Korea has both invested heavily in innovation and established integrated supply chains in certain segments of the global IT markets.
Why patents? / A likely answer to why firms in these countries pursue patents to monetize innovations may lie in the work of management and legal scholars who have observed that idea-rich but cash-poor start-ups often rely on patents to disclose innovations to third parties that offer the financing, production, distribu-tion, and other capacities that are neces-sary to fund and complete the commer-cialization process that leads to market release. This is self-evidently true in the case of an academic research institution (a leading source of inventions in the Israeli innovation ecosystem), which is legally barred from integrating forward into production and distribution. The same
rationale applies in the case of for-profit entities that special-ize in the research and development functions of a technology supply chain but lack the capital-intensive and labor-intensive infrastructure required to maintain downstream commercializa-tion capacities. Contrary to conventional thinking, patents can sometimes promote the circulation of informational assets by mit-igating knowledge leakage risks that would otherwise preclude transactions between innovators, funders, and other entities that specialize in converting innovations into commercially viable products for end-users.
From firms to countries / The patent tiger phenomenon sug-gests that the transactional rationale for intensive patenting by
Figure 2
Leading Recipients of U.S. Utility Patents, 1980–2018
0
100
200
300
400
500
1980 1985 1990 1995 2000 2005 2010 2015 2018
ISRAELTAIWANUNITED STATESSOUTH KOREAJAPANSWITZERLANDSWEDENFINLANDDENMARKGERMANYCANADA
U.S
. UTI
LITY
PAT
ENTS
PER
1M P
OPU
LATI
ON
50
150
250
350
450
Source: Author’s calculations based on USPTO, U.S. Census Bureau data.
Table 1
Innovation Metrics: Global RankingJurisdiction U.S. patents per 1
million population (2018)
R&D spending as a percentage of
GDP (2017)
Researchers per 1,000 employed
people (2016)
Percent adults (25–64 years)
with tertiary degrees (2017)
Israel 1 2 1 (2012) 4
Japan 5 6 12 3
South Korea 4 1 4 6
Taiwan 2 5 5 5
United States 3 10 16 7
Sources: Ranking for first column based on USPTO and U.S. Census Bureau data. Ranking for Taiwan in last column based on Taiwan Statistical Year Book (2018). All other information based on OECD data.
I N T E L L E C T U A L P R O P E R T Y
18 / Regulation / WINTER 2019–2020
R&D-specialist entities can be extrapolated from the entity-level to the economy-level of analysis in global innovation markets. Like a start-up in a market dominated by large incumbents endowed with difficult-to-replicate financing, production, and distribution capacities, a country characterized by a small market, high labor costs, and limited natural resources can nonetheless compete internationally by investing in R&D and extracting returns from the resulting innovation outputs by contracting with commercialization specialists to reach the target foreign markets.
But there is a key diff erence between exporting textiles and polished diamonds (once among Taiwan’s and Israel’s main exports, respectively) and exporting a semiconductor chip design or cybersecurity software application. Unlike tangible goods, intangible goods are inherently prone to uncompensated capture and low-cost replication by third parties. This is where robust intellectual property (IP) protections can play a critical role. So long as the issuing jurisdictions provide a reliable enforcement backstop, an international IP portfolio can enhance the “comfort level” of innovators in small-market countries that must share valuable information with business partners on the commercial-ization pathway to the target foreign market. That in turn triggers a virtuous cycle in which venture capital rationally fl ows to these small-market innovators.
THE STORY OF THE CHIP DESIGN FIRM AND THE FOUNDRY
The following not-so-hypothetical example can illustrate the role played by a USPTO-issued patent in mitigating the transactional hazards faced by innovators in the Israeli and Taiwanese markets.
Consider an Israeli semiconductor fi rm that specializes in chip design for certain consumer electronics devices but lacks internal fi nancing, production, and distribution capacities. The costs of constructing an independent chip fabrication facility are prohibitive for even some of the world’s largest fi rms, given that current estimates for one are in the order of several billions of dollars. Protected by a USPTO patent portfolio, supplemented by technological and contractual precautions to protect its com-plementary know-how and other informational assets, the fi rm can enter at a reasonable level of confi dence into a relationship with a Taiwanese “foundry” that lacks chip design capacities but can off er world-class chip fabrication facilities and related competencies.
The foundry, however, is likely also concerned about its own expropriation risk. It is not suffi ciently appreciated that chip foundries make signifi cant R&D investments in developing novel wafer production methods, which may be inevitably revealed in the course of interacting with its clients’ engineering teams. (TSMC, the world’s leading foundry, is located in Taiwan and makes substantial R&D expenditures, holding over 34,000 pat-ents worldwide.) For the foundry, a robust patent portfolio can also assist in mitigating the risk of knowledge leakage that might
otherwise preclude interfi rm transactions with technically sophis-ticated counterparties.
On both sides of the design–foundry relationship, each fi rm’s patent portfolio, coupled with contractual, technological, and reputational mechanisms for controlling the use of disclosed information, can alleviate risks that might otherwise lead each fi rm to conclude that the proposed relationship would unrea-sonably endanger control over its knowledge assets. Multiplied many times over, these patent-mediated transactions between innovators and implementers enable global technology markets that deliver innovations to consumers at the lowest possible cost and shortest possible time to market.
ALL ROADS LEAD TO (AND FROM) THE USPTO
The story of the chip design fi rm and the foundry is represen-tative of the surprisingly global role played by USPTO-issued patents in international technology supply chains that engage thousands of specialized fi rms in value-enhancing relationships that extend far beyond the USPTO in Arlington, VA, the ITC in Washington, DC, and the various federal courts that adjudicate patent disputes. Given the centrality of the U.S. market, these institutions support technology supply chains that underlie global IT markets that have been widely characterized by the economic virtues of continuous innovation, expanding output, and quality-adjusted declining prices.
Conventional wisdom among a good deal of the IP policymak-ing and certain business communities often refl exively asserts that robust enforcement of the patent system hinders innovation, constrains output, and raises prices to the detriment of con-sumers and, in the international context, to the disadvantage of developing countries. This has driven a decade-long and partially successful drive to weaken protections for the owners of U.S. patents (which may account for the universal decline in USPTO patent awards in 2018) and even longer-standing resistance to the international extension of robust patent protections. A closer look at the globalization of innovation activity as refl ected through USPTO data and, in particular, the strong record of growth exhibited by at least three late-developing economies that have monetized intellectual capital through the U.S. patent system, paint a diff erent picture.
READINGS
■ “Mitigating Procurement Hazards in the Context of Innovation,” by John de Figueredo and David J. Teece. Industrial & Corporate Change 5(2): 537–559 (1996).
■ “Patents and the Wealth of Nations,” by Stephen Haber. George Mason Law Review 23(4): 811–835 (2016).
■ “Specialized Supply Firms, Property Rights and Firm Boundaries,” by Ashish Arora and Robert P. Merges. Industrial & Corporate Change 13(3): 451–475 (2004).
■ The Competitive Advantage of Nations, by Michael E. Porter. Free Press, 1990.
■ “TRIPS and Development,” by Daniel Gervais. In Intellectual Property, Trade and Development: Strategies to Optimize Economic Development in a TRIPS-Plus Era, edited by Daniel Gervais; Oxford University Press, 2007.
IMPROVE CONSERVATION OUTCOMES
HARNESSING THE POWER OF INCENTIVES TO
The home ofFree Market Environmentalism
LEARN MORE @ PERC.org