Embed Size (px)
Citation preview
Intellectual property rights and firm performance in the European Union Firm-level analysis report, February 2021
2 ImprintForeword
Foreword
By effectively protecting their intellectual property, innovative companies can secure financing, grow, collaborate and create value. But how does owning intellectual property rights (IPRs) impact their performance? In 2015, an EUIPO study revealed that EU firms with at least one patent, trade mark or registered design record higher revenues per employee and pay higher wages than companies with no IPRs.
This joint follow-up report by the EUIPO and the EPO covering the period from 2007-2019 delves deeper into the role of IPRs by analysing a representative sample of over 127 000 European firms from all 27 EU member states and the UK. According to this analysis, firms that own IPRs generate 20% higher revenues per employee than their counterparts without an IP portfolio.
The highest revenue-per-employee gains are linked to bundles of trademarks, with performance premiums of 63% for trade mark and design owners, and 60% for combined patent, trade mark and design owners. Firms that own IPRs also pay on average 19% higher wages than firms that do not.
These figures are undoubtedly impressive, but a more detailed analysis of the overall picture reveals significant potential, especially when it comes to small and medium-sized enterprises (SMEs). Although fewer than 9% of European SMEs rely on IPRs, this subset of companies appears to generate 68% higher revenues per employee than SMEs without IPR portfolios.
This, in our view, is a critical message for European businesses and policymakers. Our latest report not only outlines the virtuous cycle between IP and economic performance, but also highlights considerable scope for value gains by making IP more accessible to SMEs.
Looking to the future, IPR-intensive industries in general, and SMEs innovating with new technologies in particular, can be expected to play a crucial role in pulling Europe’s economy out of post-pandemic recession.
This report highlights the need to provide enhanced support for innovative SMEs echoed in the vision set out in the EPO Strategic Plan 2023 and the EUIPO Strategic Plan 2025, through its SME Programme, as well as the SME strategy outlined in the European Commission’s recent IP Action Plan. By contributing to a wider understanding of the role played by IPRs in the EU’s society and economy, this report helps bring home the fundamental message that IPRs are for everyone.
Christian Archambeau António CampinosExecutive Director, EUIPO President, EPO
Foreword 3
Joint project team
EPO project team EUIPO project team
Yann Ménière, Chief Economist Nathan Wajsman, Chief EconomistIlja Rudyk, Economist Michał Kazimierczak, EconomistMuzio Grilli, Economist Carolina Arias Burgos, Economist
Acknowledgements
The authors are grateful for comments on an earlier version of this report from Katrin Hussinger of the University of Luxembourg, Federico Munari of the University of Bologna and Hansueli Stamm of the Swiss Federal Institute of Intellectual Property.

4 Imprint4 Table of contents
List of tables 6
List of figures 7
List of abbreviations 8
List of countries 9
1. Executive summary 10
1.1 Methodology 11
1.2 Key findings 12
1.3 Discussion and conclusions 15
2. Introduction 16
2.1 Setting the scene: the increasing importance of intellectual property rights for firms 17
2.2 Contribution of the study 19
2.3 Outline of the report 20
3. Data and methodology 21
3.1 Data 23
3.1.1 Firm data 23
3.1.2 IPR data 25
3.1.3 Matching process 26
3.2 Variables included in the dataset 27
3.3 Summary and limitations of the data 28
Table of contents
Foreword 5Table of contents 5
4. Descriptive statistics 29
4.1 Key financial and company variables 30
4.2 IPR ownership by firm characteristic 32
4.2.1 IPR ownership by firm size 32
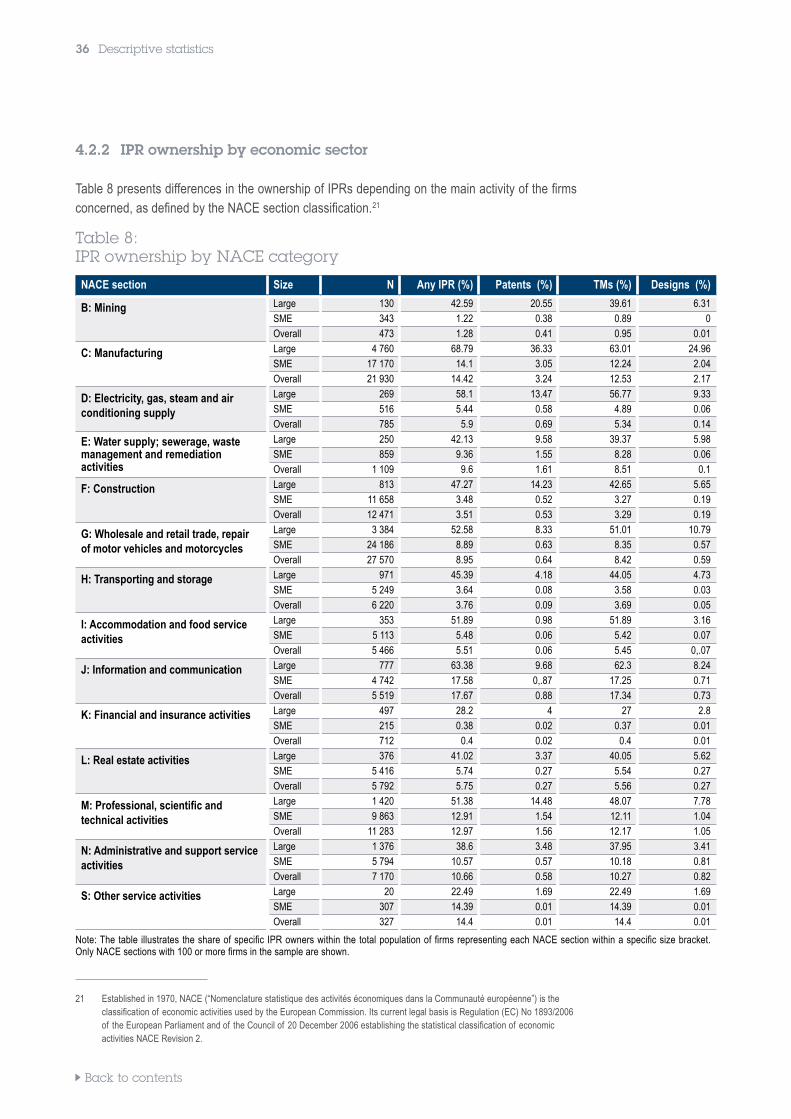
4.2.2 IPR ownership by economic sector 36
4.2.3 IPR ownership by EU Member State 40
5. IPRs and firm performance: econometric analysis 43
5.1 Selection of variables 43
5.1.1 Dependent variable 43
5.1.2 Explanatory variables 44
5.2 Econometric methodology 45
5.2.1 Panel data 45
5.2.2 Logarithmic transformation 46
5.3 Results 46
5.3.1 Interpreting regression results 46
5.3.2 IPR ownership and firm performance 47
5.4 Discussion of the results 52
6. Conclusions 54
Annex / Supplementary econometric analysis 56
Impact of macroeconomic conditions 56
Impact of innovation status of home country 61
References 68
6 Imprint
List of tables
TablesTable E1: Average values of selected variables by IPR ownership, 2015-2018 12
Table E2: Top 10 NACE categories for IPR ownership 13
Table E3: Main results of the econometric analysis 14
Table 1: Key characteristics of the methodological approach 21
Table 2: Distribution of firms in the sample 24
Table 3: Average values of performance variables by IPR ownership 31
Table 4: IPR ownership by firm size 32
Table 5: Ownership of European and national IPRs by firm size (IPR owners only) 33
Table 6: Type of IPR ownership by size (IPR owners only) 34
Table 7: Average stock (counts) of IPRs by firm size (IPR owners only), 2018 35
Table 8: IPR ownership by NACE category 36
Table 9: Share of IPR owners by EU Member state (overall) 41
Table 10: Share of IPR owners by EU Member State (SMEs) 42
Table 11: Results of models with IPR ownership dummy 48
Table 12: Results of models with IPR ownership type dummies by firm size 50
Table A1: Results of models with control for stagnation period 57
Table A2: Results of models with control for GDP growth 59
Table A3: Results of models with IPR ownership dummy by innovation rank of home country 62
Table A4: Results of models with IPR ownership types dummies by innovation rank of home country 64
Table A5: Results of the tests of a single linear combination of parameters for full sample model shown in Table 12
66
Table A6: Results of the tests of a single linear combination of parameters for SMEs sample model shown in Table 12
66
Table A7: Results of the tests of a single linear combination of parameters for large firm sample model shown in Table 12
67
6 List of tables
Foreword 7List of figures 7
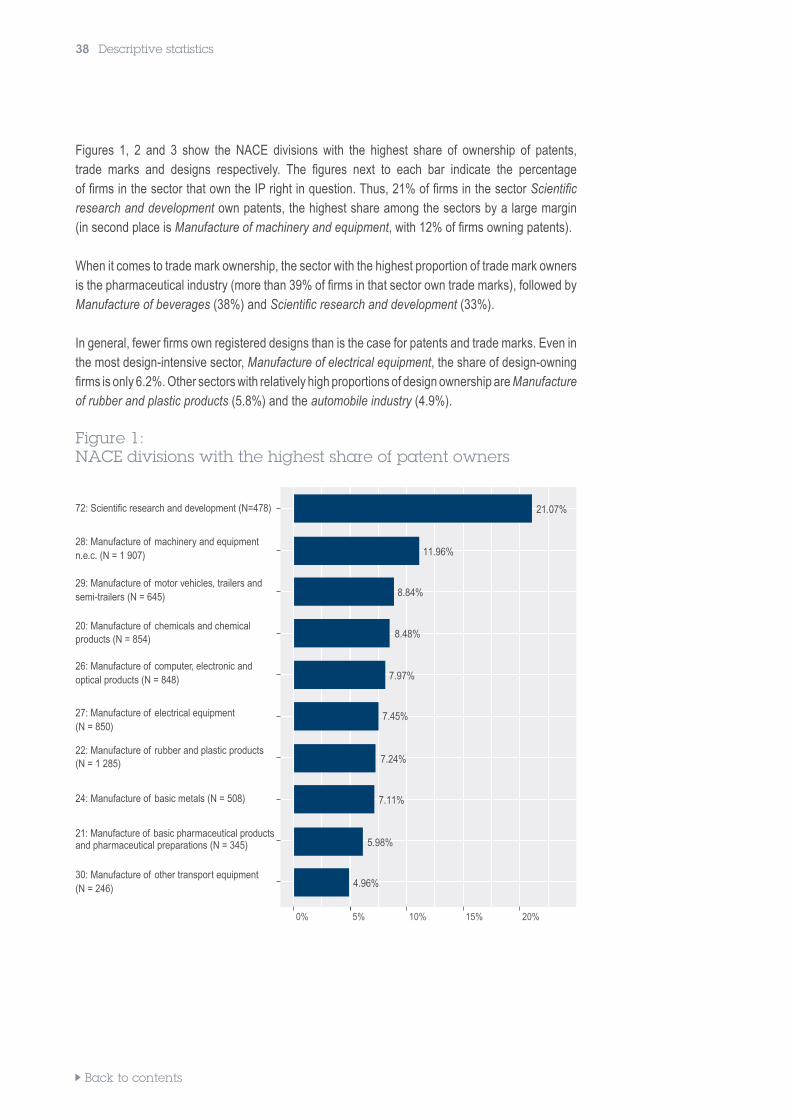
FiguresFigure 1: NACE divisions with the highest share of patent owners 38
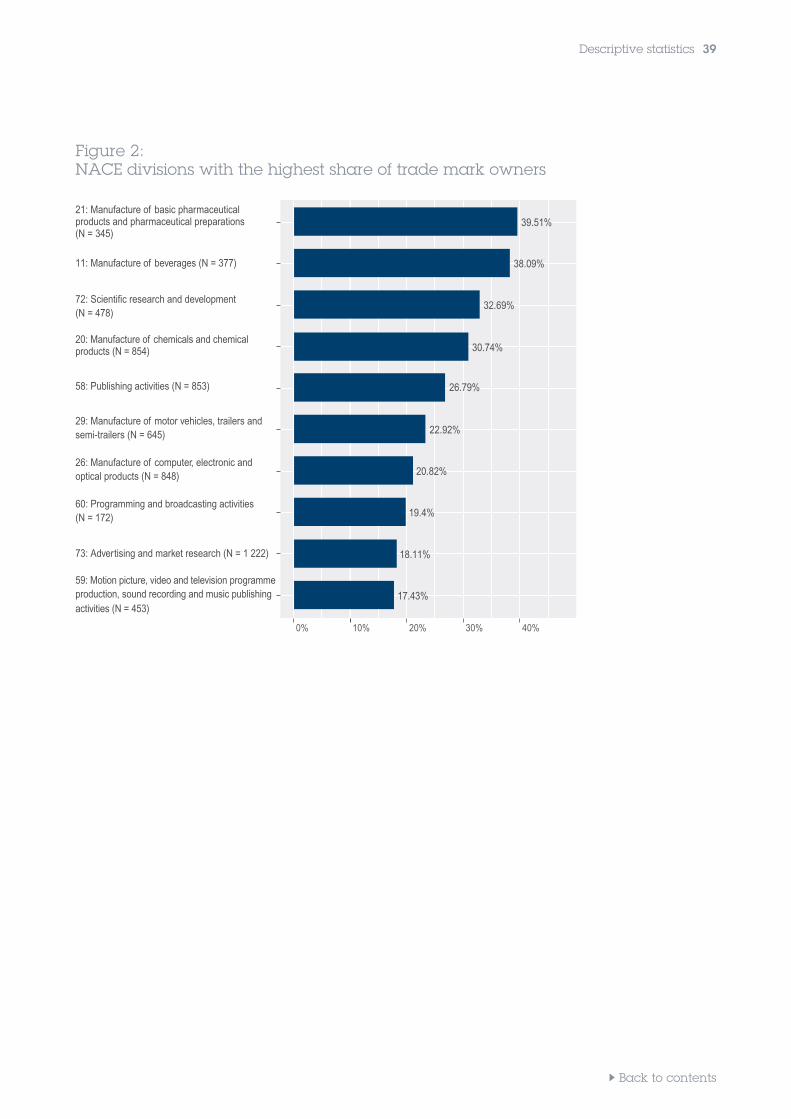
Figure 2: NACE divisions with the highest share of trade mark owners 39
Figure 3: NACE divisions with the highest share of design owners 40
Figure 4: Differences in IPR ownership premium by firm size 49
Figure 5: Differences in the various types of IPR ownership premiums by firm size 51
Figure A1: GDP growth rate (EU28), 2008-2019 56
Figure A2: Differences in marginal effects of IPR ownership during periods of stagnation and economic growth
58
Figure A3: Marginal effects of IPR ownership at various levels of GDP growth 60
Figure A4: 2020 European Innovation Scoreboard results 61
Figure A5: Differences in IPR ownership premium by innovation rank of home country 63
Figure A6: Differences in the various types of IPR ownership premiums by innovation rank of home country 65
List of figures
8 Imprint8 List of abbreviations
List of abbreviations
EC European Commission
EPO European Patent Office
EU European Union
EUIPO European Union Intellectual Property Office
EUTM European Union trade mark
GDP Gross domestic product
IP Intellectual property
IPRs Intellectual property rights
IQR Interquartile range
NACE Nomenclature générale des activités économiques dans les Communautés Européennes (Statistical classification of economic activities in the European Community)
OHIM Office for Harmonization in the Internal Market (since 23 March 2016: EUIPO)
PATSTAT EPO’s Worldwide Patent Statistical Database
R&D Research and development
RCD Registered Community design
SMEs Small and medium-sized enterprises
Foreword 9List of countries 9
AT Austria
BE Belgium
BG Bulgaria
CY Cyprus
CZ Czech Republic
DE Germany
DK Denmark
EE Estonia
ES Spain
FI Finland
FR France
GR Greece
HR Croatia
HU Hungary
IE Ireland
IT Italy
LT Lithuania
LU Luxembourg
LV Latvia
MT Malta
NL Netherlands
PL Poland
PT Portugal
RO Romania
SE Sweden
SI Slovenia
SK Slovakia
UK United Kingdom
List of countries
Back to contents
10 Executive summary
1. Executive summary
One of the mandates of the European Observatory on Infringements of Intellectual Property Rights, which is part of the European Union Intellectual Property Office (EUIPO), is to provide evidence-based data on the impact, role and public perception of intellectual property in the economy of the European Union (EU). In order to meet that objective, the Observatory is undertaking a programme of socio-economic studies.
Similarly, the Strategic Plan 2023 of the European Patent Office (EPO) prioritises the conduct of economic studies to meet the increasing demand among stakeholders for greater awareness of the impact of the European patent system and its development.
In 2013, the two offices published a joint study which assessed the combined contribution of industries that make intensive use of the various types of intellectual property right (IPR) to the economies of the EU as a whole and to the individual EU Member States.1 The study was updated in 2016 and again in 2019.2 Among the main findings of the 2019 edition was that industries that make above-average use of IPRs contributed 29% of employment and 45% of GDP in the EU, with these proportions having risen since the previous study in 2016.
The present report is a follow-up study that delves deeper into the role of IPRs by analysing a large representative sample of over 127 000 European firms in order to compare the economic performance of firms that own IPRs with those that do not. In 2015, the EUIPO (then known as OHIM) published a similar study 3 which showed that companies that own IPRs have higher revenue per employee and pay higher wages than companies that do not. The present joint EPO/EUIPO study is an update of the 2015 EUIPO study, with improved data and methodology. In contrast with the earlier study, which was based on data from 12 Member States, this new study includes data from companies in all 28 Member States.4
The IPRs included in the study are patents, trade marks and designs (or any combination of the three). Because of their nature, copyright, plant variety rights and geographical indications, which were part of the industry-level studies, are not included here. 5 On the other hand, the present study includes both European and national IPRs, an important enhancement to the data, and provides a complete view of each company’s IPR portfolio, both European and national.
1 Intellectual property rights intensive industries: Contribution to the economic performance and employment in the European Union. Industry-Level Analysis Report, September 2013.2 Intellectual property rights intensive industries and economic performance in the European Union. Industry-Level Analysis Report, October 2016. Second edition; IPR-intensive industries and economic performance in the European Union. Industry-Level Analysis Report, September 2019. Third edition.3 Intellectual property rights and firm performance in Europe: an economic analysis. Firm-Level Analysis Report, June 2015.4 The UK left the EU on 31 January 2020. However, the period covered by this study is 2007-2019, during which the UK was a member state, so data on UK companies is included.5 Copyright is not always registered, while geographical indications are not registered by individual companies, so data on the
ownership of those IPRs at company level does not exist. Plant variety rights are the subject of a separate research project at the EUIPO.
Back to contents
Executive summary 11
The data on each company’s IPR portfolio was matched with information contained in the commercial database ORBIS. This database provides financial and other information on millions of European companies, collected from the filings and accounting reports made by companies in the commercial registers of the EU Member States. The study uses financial and other information about companies that are registered as formal owners of patents, trade marks and/or designs. Some companies that are part of a larger group structure may not be the formal owners of IPRs (their headquarters may have the formal ownership), but they may still use IPRs in their commercial activities.
There are various ways to measure the economic performance of a company. Because of data constraints and the need for like-for-like comparisons (eliminating the effect of firm size on the statistical results), “revenue per employee” was chosen as the main indicator of firm performance.
The dataset was constructed in such a way that the sample is representative of the general populations of firms in the EU. This allows a comparison of the performance of companies that own IPRs with companies that do not, while controlling for relevant factors such as country, sector or size of company. To our knowledge, the coverage of the dataset is significantly larger than that of any other data source of this type currently available, ensuring a sample sufficiently large to draw robust and representative conclusions.
The study makes no policy recommendations, as this is not within its scope. Instead, it provides evidence that can be used by policymakers in their work, and serves as a basis for raising awareness of IP among Europe’s citizens in general, and small and medium-sized enterprises (SMEs) in particular.
1.1 Methodology The data was analysed using two types of methodology.
First, descriptive statistics were compiled to illustrate the differences between owners and non-owners of IPRs in terms of economic characteristics. Differences were tested for statistical significance. Chapter 4 presents the results of this analysis.
Chapter 5 reports the findings of an econometric analysis of the data. It allows for an in-depth examination of the relationship between firms’ ownership of IPRs and their economic performance. While causality cannot be proven in the strict sense of the word, given the available data, econometric analysis allows researchers to control for several additional factors that affect economic performance and to “isolate” the relationship between IPR ownership and firm performance. The results of the analysis strongly suggest that there is a systematic, positive relationship between ownership of IPRs and economic performance at individual firm level.
Back to contents
12 Executive summary
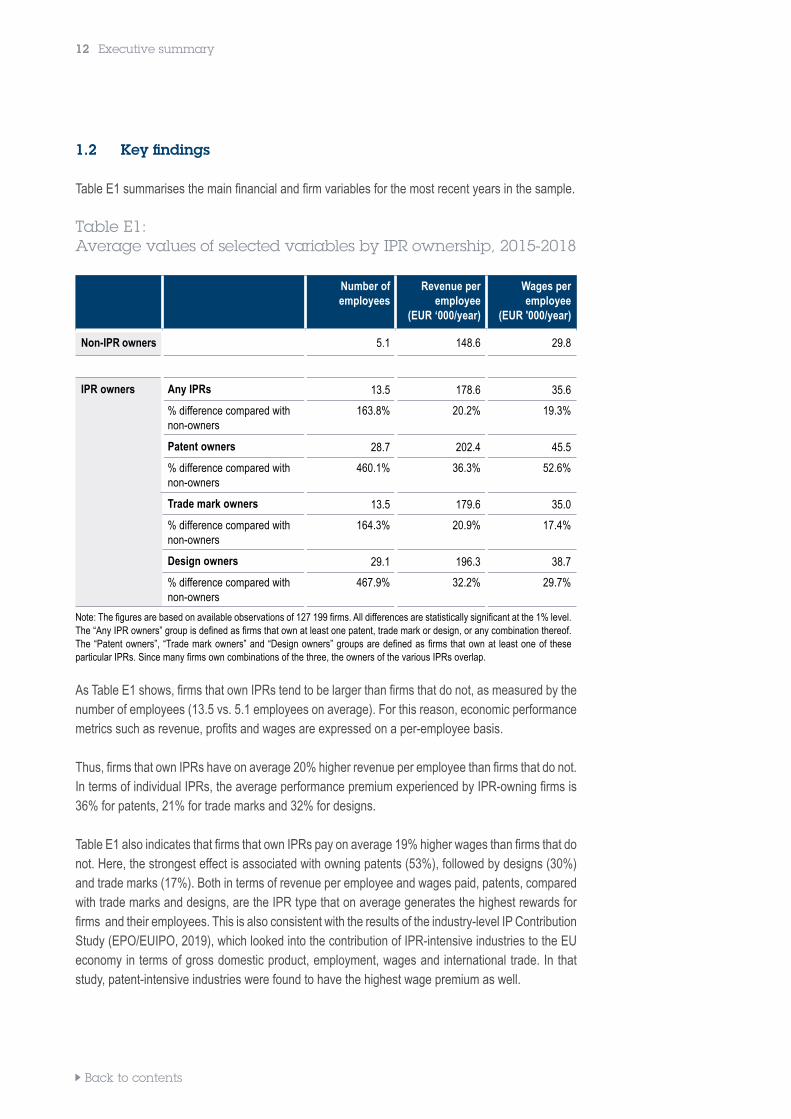
1.2 Key findings Table E1 summarises the main financial and firm variables for the most recent years in the sample.
Table E1: Average values of selected variables by IPR ownership, 2015-2018
Number of employees
Revenue per employee
(EUR ‘000/year)
Wages per employee
(EUR '000/year)
Non-IPR owners 5.1 148.6 29.8
IPR owners Any IPRs 13.5 178.6 35.6
% difference compared with non-owners
163.8% 20.2% 19.3%
Patent owners 28.7 202.4 45.5
% difference compared with non-owners
460.1% 36.3% 52.6%
Trade mark owners 13.5 179.6 35.0
% difference compared with non-owners
164.3% 20.9% 17.4%
Design owners 29.1 196.3 38.7
% difference compared with non-owners
467.9% 32.2% 29.7%
Note: The figures are based on available observations of 127 199 firms. All differences are statistically significant at the 1% level. The “Any IPR owners” group is defined as firms that own at least one patent, trade mark or design, or any combination thereof. The “Patent owners”, “Trade mark owners” and “Design owners” groups are defined as firms that own at least one of these particular IPRs. Since many firms own combinations of the three, the owners of the various IPRs overlap.
As Table E1 shows, firms that own IPRs tend to be larger than firms that do not, as measured by the number of employees (13.5 vs. 5.1 employees on average). For this reason, economic performance metrics such as revenue, profits and wages are expressed on a per-employee basis.
Thus, firms that own IPRs have on average 20% higher revenue per employee than firms that do not. In terms of individual IPRs, the average performance premium experienced by IPR-owning firms is 36% for patents, 21% for trade marks and 32% for designs.
Table E1 also indicates that firms that own IPRs pay on average 19% higher wages than firms that do not. Here, the strongest effect is associated with owning patents (53%), followed by designs (30%) and trade marks (17%). Both in terms of revenue per employee and wages paid, patents, compared with trade marks and designs, are the IPR type that on average generates the highest rewards for firms and their employees. This is also consistent with the results of the industry-level IP Contribution Study (EPO/EUIPO, 2019), which looked into the contribution of IPR-intensive industries to the EU economy in terms of gross domestic product, employment, wages and international trade. In that study, patent-intensive industries were found to have the highest wage premium as well.
Back to contents
Executive summary 13
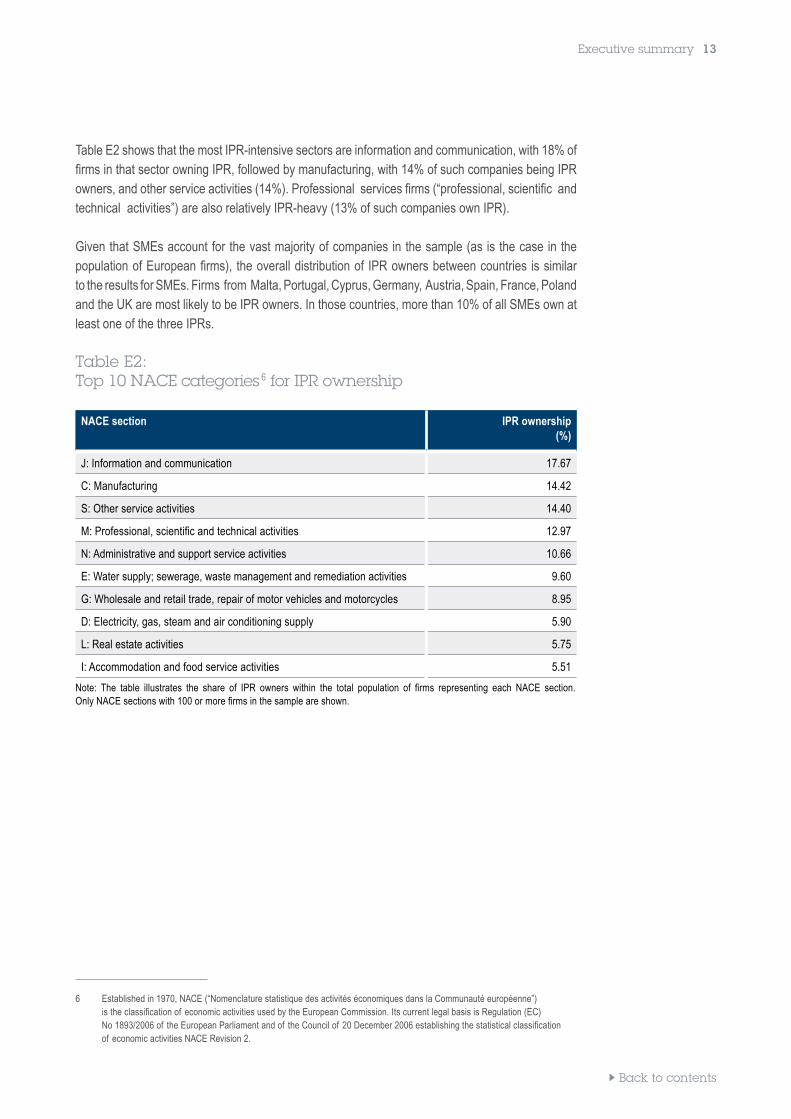
Table E2 shows that the most IPR-intensive sectors are information and communication, with 18% of firms in that sector owning IPR, followed by manufacturing, with 14% of such companies being IPR owners, and other service activities (14%). Professional services firms (“professional, scientific and technical activities”) are also relatively IPR-heavy (13% of such companies own IPR).
Given that SMEs account for the vast majority of companies in the sample (as is the case in the population of European firms), the overall distribution of IPR owners between countries is similar to the results for SMEs. Firms from Malta, Portugal, Cyprus, Germany, Austria, Spain, France, Poland and the UK are most likely to be IPR owners. In those countries, more than 10% of all SMEs own at least one of the three IPRs.
Table E2: Top 10 NACE categories 6 for IPR ownership
NACE section IPR ownership(%)
J: Information and communication 17.67
C: Manufacturing 14.42
S: Other service activities 14.40
M: Professional, scientific and technical activities 12.97
N: Administrative and support service activities 10.66
E: Water supply; sewerage, waste management and remediation activities 9.60
G: Wholesale and retail trade, repair of motor vehicles and motorcycles 8.95
D: Electricity, gas, steam and air conditioning supply 5.90
L: Real estate activities 5.75
I: Accommodation and food service activities 5.51
Note: The table illustrates the share of IPR owners within the total population of firms representing each NACE section. Only NACE sections with 100 or more firms in the sample are shown.
6 Established in 1970, NACE (“Nomenclature statistique des activités économiques dans la Communauté européenne”) is the classification of economic activities used by the European Commission. Its current legal basis is Regulation (EC) No 1893/2006 of the European Parliament and of the Council of 20 December 2006 establishing the statistical classification of economic activities NACE Revision 2.
Back to contents
14 Executive summary
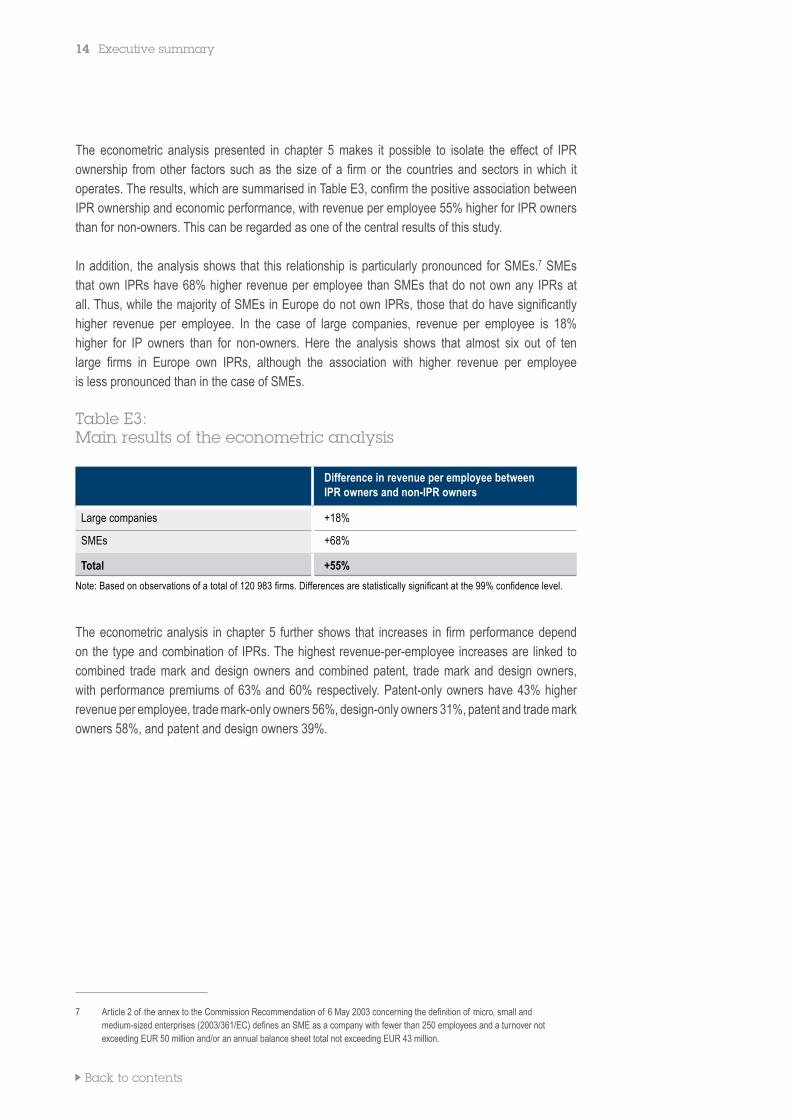
The econometric analysis presented in chapter 5 makes it possible to isolate the effect of IPR ownership from other factors such as the size of a firm or the countries and sectors in which it operates. The results, which are summarised in Table E3, confirm the positive association between IPR ownership and economic performance, with revenue per employee 55% higher for IPR owners than for non-owners. This can be regarded as one of the central results of this study.
In addition, the analysis shows that this relationship is particularly pronounced for SMEs.7 SMEs that own IPRs have 68% higher revenue per employee than SMEs that do not own any IPRs at all. Thus, while the majority of SMEs in Europe do not own IPRs, those that do have significantly higher revenue per employee. In the case of large companies, revenue per employee is 18% higher for IP owners than for non-owners. Here the analysis shows that almost six out of ten large firms in Europe own IPRs, although the association with higher revenue per employee is less pronounced than in the case of SMEs.
Table E3: Main results of the econometric analysis
Difference in revenue per employee between IPR owners and non-IPR owners
Large companies +18%
SMEs +68%
Total +55%
Note: Based on observations of a total of 120 983 firms. Differences are statistically significant at the 99% confidence level.
The econometric analysis in chapter 5 further shows that increases in firm performance depend on the type and combination of IPRs. The highest revenue-per-employee increases are linked to combined trade mark and design owners and combined patent, trade mark and design owners, with performance premiums of 63% and 60% respectively. Patent-only owners have 43% higher revenue per employee, trade mark-only owners 56%, design-only owners 31%, patent and trade mark owners 58%, and patent and design owners 39%.
7 Article 2 of the annex to the Commission Recommendation of 6 May 2003 concerning the definition of micro, small and medium-sized enterprises (2003/361/EC) defines an SME as a company with fewer than 250 employees and a turnover not exceeding EUR 50 million and/or an annual balance sheet total not exceeding EUR 43 million.
Back to contents
Executive summary 15
1.3 Discussion and conclusions The analysis presented in this study confirms that there is a strong positive relationship between the ownership of different types of IPR and firm performance as measured by revenue per employee and average wages paid. This finding is consistent with the earlier 2015 study (OHIM, 2015), as well as with the industry-level IP contribution studies and the 2019 study of high-growth firms, which found a positive relationship between a company’s IPR activity and the likelihood of achieving high growth in subsequent years (EPO/EUIPO, 2019).
As with every statistical analysis, these results must be interpreted with care. They do not constitute conclusive proof that encouraging firms to make greater use of IPRs will cause their performance to increase. The study shows a positive relationship between firms that own IPRs and their performance (as measured by revenue per employee). Indeed, there may be several mechanisms through which the link between the ownership of IPRs and firm performance may work. However, given the available data, it is not possible to disentangle these in the analysis.
The positive association between IPR ownership and economic performance is particularly strong for SMEs. At the same time, less than 9% of SMEs in the sample own one of the three IP rights included in the study. The reasons for the low uptake are explored in the EUIPO survey of European SMEs (EUIPO, 2019). This study (as well its earlier edition from 2015) indicated that barriers faced by SMEs include lack of knowledge about IPRs, a perception that registration procedures are complex and costly, and the high cost of enforcement of those rights, a particular burden for SMEs (EUIPO, 2017). Given this, and the importance of SMEs in the European economy, the EPO and the EUIPO are taking steps as IP offices to address those concerns so as to enable European SMEs to take full advantage of their innovation and intellectual property, in the context of the EPO’s Strategic Plan 2023, the EUIPO Strategic Plan 2025 and the European Commission’s SME strategy formulated in early 2020 (EC, 2020).
Back to contents
16 Introduction
2. Introduction
What types of company own more IPRs in Europe: SMEs or large companies? What proportion of large companies and SMEs owns IPRs? Do firms that own IPRs exhibit better performance than those that do not? Do companies register patents, trade marks and designs as single IPRs or as bundles?
This report presents the findings of an empirical economic analysis of the relationship between IPRs and the performance of firms in Europe. The study was carried out jointly by the economic teams of the EPO and the EUIPO, acting through the European Observatory on Infringements of Intellectual Property Rights. It is a follow-up to an earlier study linking IPR ownership with firm performance published by the EUIPO (then known as OHIM) in 2015 (OHIM, 2015).
In 2013, the EPO and the EUIPO published a joint study on the contribution of IPR-intensive industries to the EU economy (EPO/OHIM 2013), in terms of gross domestic product, employment, wages and international trade. This study was updated in 2016 and 2019 (EPO/EUIPO, 2016; EPO/EUIPO, 2019). The 2019 edition showed that IPR-intensive industries account for 39% of (direct and indirect) employment and 45% of GDP in the EU. Those earlier studies focused on industries, the present study is aimed at firm level. While the earlier studies quantified the impact of IPR-intensive industries on main macro-economic variables, the present study quantifies the ownership of IPRs in terms of firm performance indicators. Finally, the industry-level studies were of a purely descriptive nature: they examined the structure of the EU economy to identify sectors that use IPRs intensively, and quantified their “weight” in the overall economy. In contrast, this firm-level study is analytical in nature: the unit of analysis is the individual firm, and a very large sample of more than 127 000 companies is analysed using statistical techniques to discern whether there is an association between IPR ownership and economic performance. While the studies – both industry-based and firm-based - concluded that IPRs are important in a modern economy, the analysis in the current study provides a much stronger indication of this importance for the performance of firms, especially SMEs.
Back to contents
Introduction 17
2.1 Setting the scene: the increasing importance of intellectual property rights for firms
Judging by the strong growth in usage, in recent decades IPRs have become increasingly important for firms. They are no longer perceived merely as tools that reward creativity and inventiveness, deter imitation and secure the reputation of a company’s products and services. Beyond their traditional function, IPRs provide companies with new opportunities to reap the benefits of their original works and adequately monetise their intellectual property. IPRs have become flexible instruments that provide firms with an array of strategic options. Firms can for example decide to open up IPRs for use by others through licensing programmes or through R&D joint ventures, thus creating valuable economic activity.
Patent portfolios, technology licensing programmes, brand equity and goodwill determine much of the value of many modern companies, and have become central to their financial performance. Indeed, the corporate value of many large firms in advanced economies is now mostly accounted for by intangible rather than tangible assets (Brand Finance, 2019). Ideas and creativity are often the most valuable source of inputs, replacing the more traditional factors of production such as land, labour and capital. Within this changing environment, businesses are adapting their models accordingly, and seek to appropriate returns on their investments by exploiting their intangible assets. A range of options from formal to informal tools of protection of their intellectual assets is at their disposal. The choice of specific tools depends on a number of factors, including the size of the firm and the sector in which it operates. Additionally, instead of focusing on one IPR at a time, companies increasingly look at their intellectual assets collectively and take the combination and interaction of various IPRs into account in their decisions. In fact the use of IPRs as a bundle displays significant potential for firms to strengthen their competitive position in the market, and research has shown that IPRs can be used in a complementary way in order to generate additional streams of revenue and to improve a firm’s financial performance (EUIPO, 2020).
Back to contents
18 Introduction
Box 1: Patents, trade marks and designs
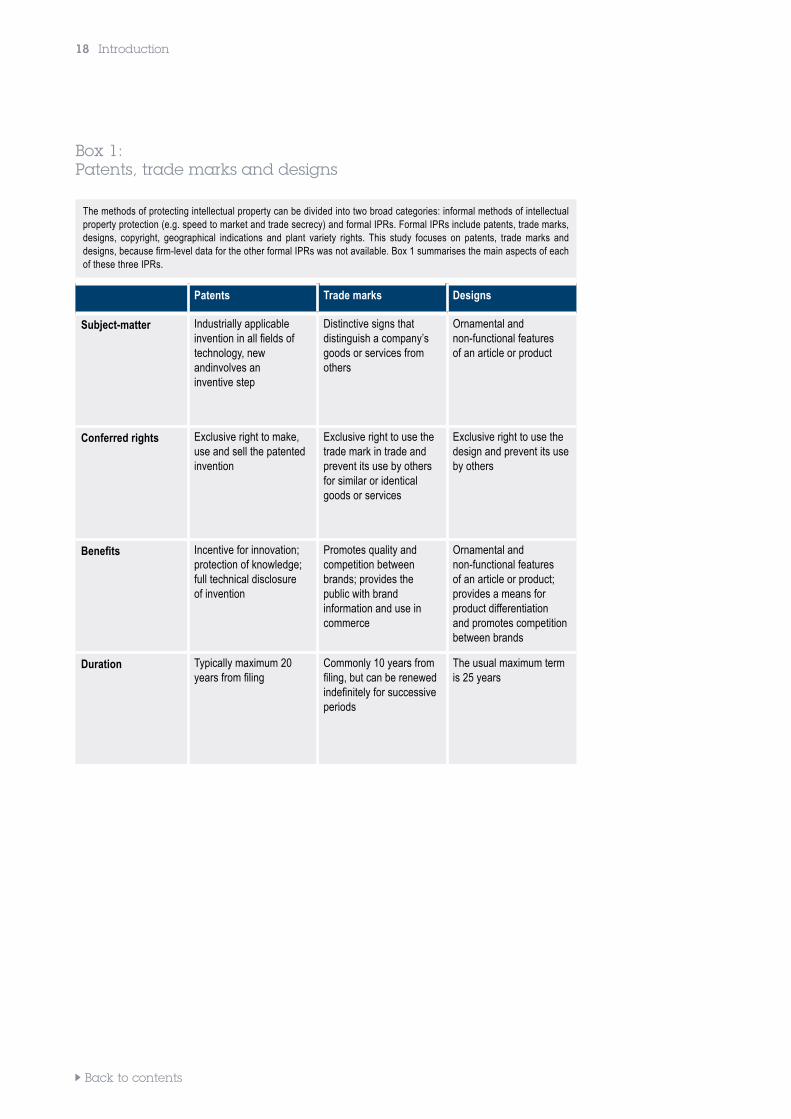
The methods of protecting intellectual property can be divided into two broad categories: informal methods of intellectual property protection (e.g. speed to market and trade secrecy) and formal IPRs. Formal IPRs include patents, trade marks, designs, copyright, geographical indications and plant variety rights. This study focuses on patents, trade marks and designs, because firm-level data for the other formal IPRs was not available. Box 1 summarises the main aspects of each of these three IPRs.
Patents Trade marks Designs
Subject-matter Industrially applicable invention in all fields of technology, new andinvolves an inventive step
Distinctive signs that distinguish a company’s goods or services from others
Ornamental andnon-functional features of an article or product
Conferred rights Exclusive right to make, use and sell the patented invention
Exclusive right to use the trade mark in trade and prevent its use by others for similar or identical goods or services
Exclusive right to use the design and prevent its use by others
Benefits Incentive for innovation; protection of knowledge; full technical disclosureof invention
Promotes quality and competition between brands; provides the public with brand information and use in commerce
Ornamental andnon-functional features of an article or product; provides a means for product differentiationand promotes competition between brands
Duration Typically maximum 20 years from filing
Commonly 10 years from filing, but can be renewed indefinitely for successive periods
The usual maximum term is 25 years
Back to contents
Introduction 19
2.2 Contribution of the study
Several attempts have been made in the academic and management literature to show how firms use IPRs and how such use is linked to their economic and financial performance. While most of these studies focus on patents, some also document the use of trade marks, designs, or combinations of different IPRs (e.g., Hall et al., 2014; EUIPO, 2017b, Thoma, 2020). Studies assessing the direct link between IPR use and various measures of firm performance remain scarce (Arora et al., 2008; Munari, 2012; Greenhalgh and Rogers 2012; Crass and Peters, 2014, Crass, 2014; Schautschick and Greenhalgh, 2016; Llerena and Millot, 2020), due in particular to the methodological constraints dictated by the nature of the available data. While those studies by and large found a positive link between IPR protection and performance of firms, they differ as regards the size of such a premium and the sectoral scope thereof.
The EPO and the EUIPO have been carrying out such research since 2015, when the EUIPO 8 published the first edition of the present study, based on a sample of 130 000 firms from 12 EU Member States (OHIM, 2015). The main contribution of that study was in the construction and analysis of a unique and large dataset with financial variables and IPR data at firm level for European enterprises. The dataset contained company-level information for multiple years on patents, trade marks and designs (at both national and European level), together with data on the financial performance and structural data of the firms for the period 2002-2010. Using this data, the relationship between IPR ownership and economic performance was analysed, and a positive relationship was found.
In 2019, the EPO and the EUIPO published a joint study in which they examined the link between the IPR activity of SMEs and their subsequent growth (EPO/EUIPO, 2019). The main finding of the study was that SMEs that had filed at least one patent, trade mark or registered design were more likely to experience growth in turnover and employment in subsequent years than SMEs that were not active in the IPR space.
The present study is a continuation of the EUIPO’s 2015 study, incorporating several enhancements:
➔ The study is based on data for all 28 EU Member States as of 1 January 2020.➔ The sampling methodology has been improved to ensure that the results are representative
for the population of European firms.➔ Additional factors and controls have been taken into account in the econometric analysis.
As was the case in the previous studies, an in-depth analysis of the data in this study has found clear (statistically significant) and positive relationships between the ownership of IPRs and firm performance as measured by revenue per employee. Moreover, this relationship is more pronounced for SMEs than for large firms.
8 Prior to March 2016, the EUIPO was known as the Office for Harmonization in the Internal Market (OHIM).
Back to contents
20 Introduction
Due to data and methodological limitations, caution is needed in interpreting such findings. The findings indeed bear out strong correlations between IPR and economic performance but do not allow for confirmation of causal links. Causality can potentially work in two different directions: the ownership of IPRs could lead to better financial performance, or it could be the case that firms own more IPRs because they are performing better. Also there could be other variables confounding the relationship between IPR usage and economic performance. Nevertheless, economic theory on IPRs sets out various possible ways in which IPRs can lead to superior economic performance. IPRs create incentives for firms to engage in innovative activity by raising appropriability (Romer, 1990; Schotchmer, 2006,) that allows them to reduce costs (mainly process innovation) or/and raise profitability and sales (mainly product innovation). The ownership of IPRs is therefore likely to be a proxy for a firm’s general ability to generate intangible assets. The positive relationship between IPR ownership and economic performance might partially be due to the positive influence that intangible assets can have on productivity. Licensing activity enabled by IPRs brings additional revenue to innovative firms without them having to engage directly in the corresponding production activity. Finally, the exclusive rights conferred by patents, trade marks and designs can lead to reduced competitive pressure on their holders, and thus to higher profits.
Conversely, strong economic performance can also impact a firm’s decision to apply for formal IPRs. Companies that have already been able to generate high financial returns in the past might turn to using tradable and enforceable IPRs to protect their revenue streams in the future. Finally, it is important to bear in mind that the statistical association found between IPRs and performance may be driven primarily by unobserved firm-specific features (e.g. management practices, quality of management). However, the available data and the econometric methodology used meant that it was possible to reduce this risk considerably.
2.3 Outline of the report
The structure of this report is as follows:
➔ Chapter 3 describes the data sources, the data-matching methodology applied, the resulting dataset and the types of analysis carried out in this study.
➔ Chapter 4 provides a first look at the evidence, in the form of descriptive statistics of the dataset.➔ Chapter 5 sets out the main findings of the econometric analysis.➔ Chapter 6 summarises and discusses the findings of the study.➔ The annex contains supplementary information and analyses.
Back to contents
Data and methodology 21
3. Data and methodology
The main purpose of the present study is to examine the relationship between firms’ ownership of IPRs as registered in the official national and European IPR registers and their economic performance. Productivity (revenue per employee) was chosen as the main measure of economic performance. Other metrics, such as profitability, could have been chosen, but the coverage of such metrics in the ORBIS database (see below) is less complete than for revenue. Furthermore, revenue is less subject to accounting considerations than profit.
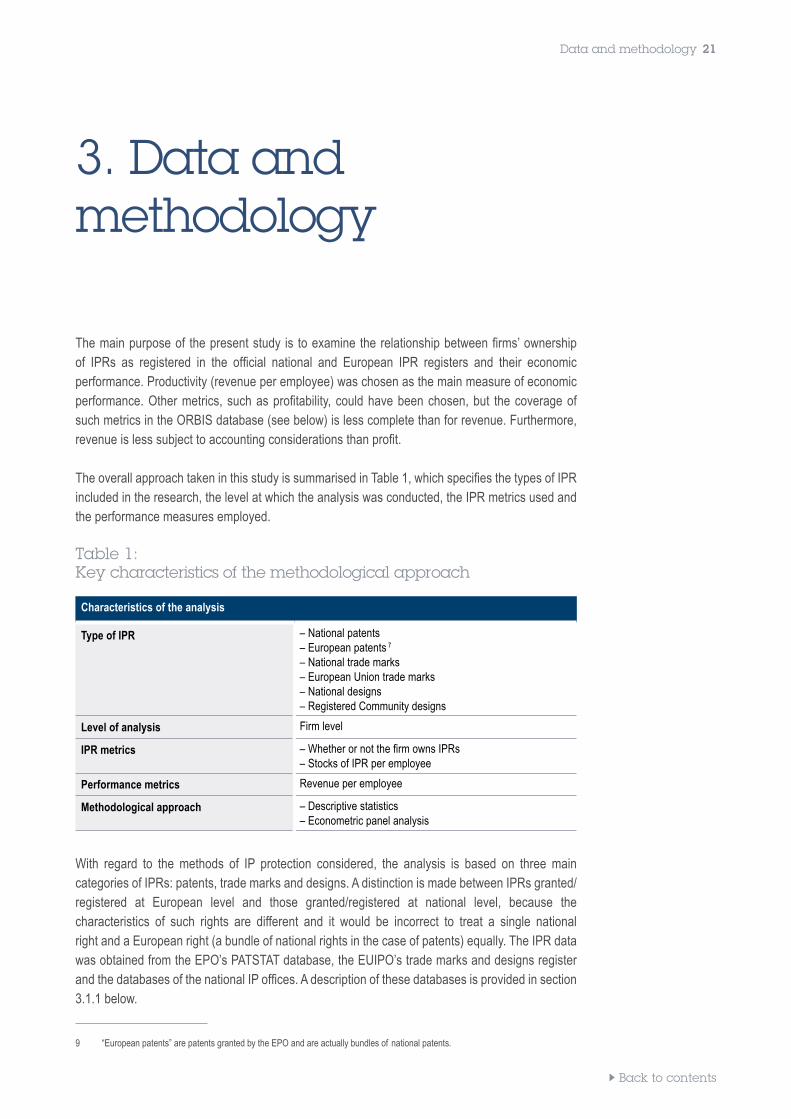
The overall approach taken in this study is summarised in Table 1, which specifies the types of IPR included in the research, the level at which the analysis was conducted, the IPR metrics used and the performance measures employed.
Table 1: Key characteristics of the methodological approach
Characteristics of the analysis
Type of IPR – National patents – European patents 7 9
– National trade marks– European Union trade marks– National designs– Registered Community designs
Level of analysis Firm level
IPR metrics – Whether or not the firm owns IPRs– Stocks of IPR per employee
Performance metrics Revenue per employee
Methodological approach – Descriptive statistics– Econometric panel analysis
With regard to the methods of IP protection considered, the analysis is based on three main categories of IPRs: patents, trade marks and designs. A distinction is made between IPRs granted/ registered at European level and those granted/registered at national level, because the characteristics of such rights are different and it would be incorrect to treat a single national right and a European right (a bundle of national rights in the case of patents) equally. The IPR data was obtained from the EPO’s PATSTAT database, the EUIPO’s trade marks and designs register and the databases of the national IP offices. A description of these databases is provided in section 3.1.1 below.
9 “European patents” are patents granted by the EPO and are actually bundles of national patents.
Back to contents
22 Data and methodology
The relationship between economic performance and IPR ownership is assessed in this study at firm level. Information on the financial performance and basic characteristics of firms was obtained from the ORBIS database and was matched with the IPR data described above. A more detailed discussion of these issues is provided in section 3.1.2.
This study employs two methodological approaches to identify links between IPR status and performance: descriptive statistics and econometric analysis.
These methodological approaches are complementary. The descriptive statistics provide a basic overview of the characteristics of firms included in the dataset and identify the extent to which the level of IPR ownership differs between firms with different characteristics (e.g. sector, country, size, etc.). The econometric analysis moves beyond pure description and seeks to identify the relationship between IPR ownership and the performance of a firm, controlling for other factors that affect performance. The results of these two types of analysis are presented in chapters 4 and 5 respectively.
Many of the analyses presented in this report are modelled on the previous firm-level study (OHIM, 2015). However, the present study is based on a broader range of firms with their principal place of business in all 28 Member States of the European Union as at 1 January 2020 (compared with 12 Member States in 2015). There are also other methodological improvements that make the findings of the present report more robust. In particular, the descriptive statistics have been conducted on a post-stratified sample with weights adjusted to account for missing observations and to match the firms’ distribution among the EU Member States. In the econometric models, additional controls, such as number of employees, have been added to account for factors that might have an impact on revenue per employee, so as to strengthen the statistical validity of the analysis.
Back to contents
Data and methodology 23
3.1 Data
The results presented in this report are based on a newly produced dataset which consists of a panel of 13 years (2007-2019) that includes information on more than 127 000 companies from all 28 EU Member States as of 1 January 2020.
The dataset used for this study combines financial information reported by a large number of European firms (ORBIS database, see below) and details of intellectual property rights obtained by these firms from national and European IP offices (see the following section for a description of the data sources). To the best of the authors’ knowledge, the coverage of the dataset is significantly larger than that of any other data source of this type currently available, ensuring a sufficiently large sample to draw robust and representative conclusions.
3.1.1 Firm data
The source of data on firms’ demographic and financial variables was the ORBIS dataset. This dataset, compiled by Bureau van Dijk, contains information on millions of firms in Europe. The advantage of ORBIS compared with other commercial firm-level datasets is the breadth and scope of the data available. The data is collected from publicly available business registers and includes all types of firms obliged to disclose annual financial statements in the relevant national business registers. ORBIS covers firms of all types and sizes, although financial data availability may be lower for some firm categories, e.g. small firms for which the reporting regime in some Member States is less stringent than for larger companies.
The selection of a random sample of firms from ORBIS was the first step in the data preparation process. The sample selection process was conducted separately in four size strata: micro, small, medium and large companies.10 This ensured a sufficient number of observations in each stratum to obtain statistically significant results of the various analyses.
The number of observations in each stratum and country was pre-determined on the basis of the population of each country and the number of firms with their principal place of business in each country as shown in Eurostat statistics. Firms were also pre-selected on the basis of the availability of turnover and employment data in ORBIS (at least three consecutive years with employment or turnover data available between 2007 and 2016).11 In the case of some Member States for which the number of eligible firms in some strata was lower than pre-determined, all the eligible firms were added to the sample. Otherwise, the sample was selected randomly from among eligible firms representing each stratum and country.12
10 Ideally the strata are based on seat country, size and industry affiliation to account for the different industry compositions of each MS. However, there are too many missing data points in Eurostat statistics for this strategy to be feasible.11 For many firms there are breaks in the time series for particular years. There are only 5 242 firms with either employment or turnover data available for the entire 13 year period. Depending on the specific analysis, the number of firms in the subsamples may be lower than the overall number of firms in the entire sample.12 There are substantial differences in data availability for specific country and strata. It affects mostly firms of smaller size for which reporting requirements are less burdensome than for larger firms. To account for possible bias stemming from data availability, a specific binary control for country effects is included in the econometric specifications.
Back to contents
24 Data and methodology
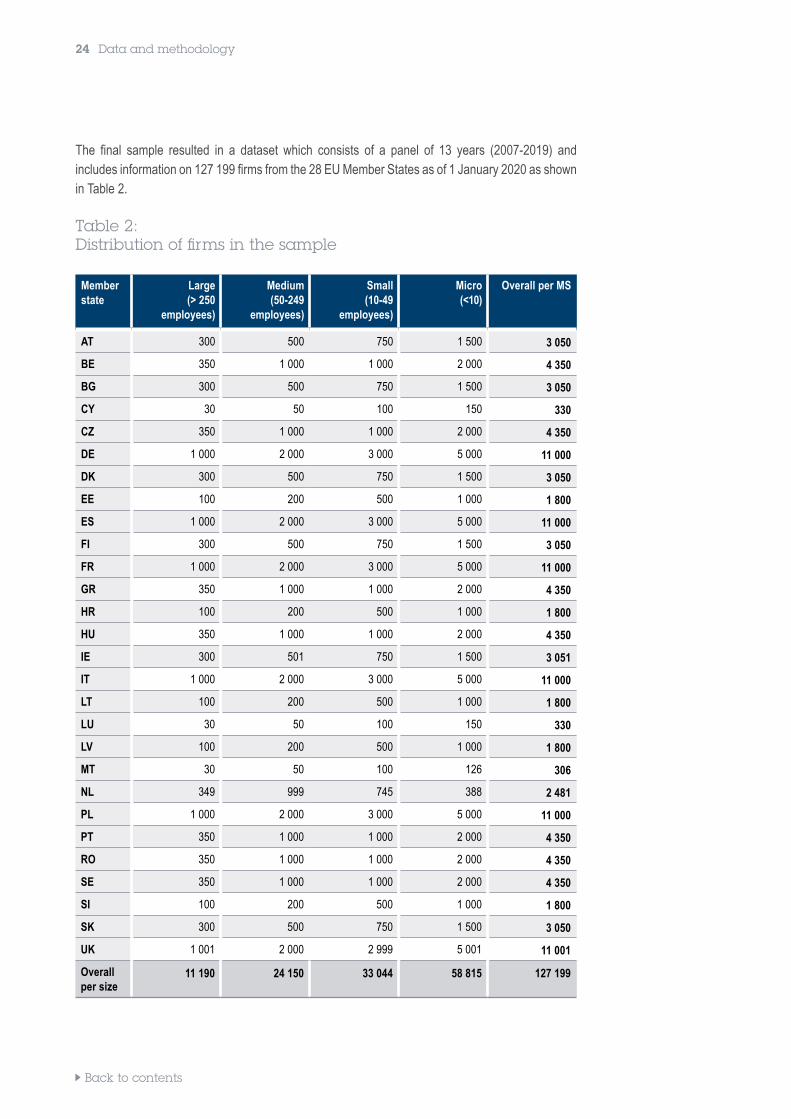
The final sample resulted in a dataset which consists of a panel of 13 years (2007-2019) and includes information on 127 199 firms from the 28 EU Member States as of 1 January 2020 as shown in Table 2.
Table 2: Distribution of firms in the sample
Member state
Large (> 250
employees)
Medium (50-249
employees)
Small (10-49
employees)
Micro (<10)
Overall per MS
AT 300 500 750 1 500 3 050
BE 350 1 000 1 000 2 000 4 350
BG 300 500 750 1 500 3 050
CY 30 50 100 150 330
CZ 350 1 000 1 000 2 000 4 350
DE 1 000 2 000 3 000 5 000 11 000
DK 300 500 750 1 500 3 050
EE 100 200 500 1 000 1 800
ES 1 000 2 000 3 000 5 000 11 000
FI 300 500 750 1 500 3 050
FR 1 000 2 000 3 000 5 000 11 000
GR 350 1 000 1 000 2 000 4 350
HR 100 200 500 1 000 1 800
HU 350 1 000 1 000 2 000 4 350
IE 300 501 750 1 500 3 051
IT 1 000 2 000 3 000 5 000 11 000
LT 100 200 500 1 000 1 800
LU 30 50 100 150 330
LV 100 200 500 1 000 1 800
MT 30 50 100 126 306
NL 349 999 745 388 2 481
PL 1 000 2 000 3 000 5 000 11 000
PT 350 1 000 1 000 2 000 4 350
RO 350 1 000 1 000 2 000 4 350
SE 350 1 000 1 000 2 000 4 350
SI 100 200 500 1 000 1 800
SK 300 500 750 1 500 3 050
UK 1 001 2 000 2 999 5 001 11 001
Overall per size
11 190 24 150 33 044 58 815 127 199
Back to contents
Data and methodology 25
As the size of each stratum in the final dataset does not completely reflect the distribution of the population of European firms between Member States and size categories, subsequent analyses were conducted using weights specific to each Member State and stratum (descriptive statistics) or using relevant size, 13 Member State and sector controls (econometric analysis) that make it possible to draw conclusions that are valid for the population of European firms in general.
3.1.2 IPR data
Once the sample of firms had been selected, the following IPR data repositories were queried for information on IPRs registered by firms in the sample:
➔ PATSTAT, the EPO’s Worldwide Patent Statistical Database. This database contains all records of published patents filed at the EPO and the vast majority of national patent offices around the world. It includes information such as filing and grant dates, legal events, citations and classification data. The dataset used in this report includes information extracted from PATSTAT’s April 2020 version.14
➔ The EUIPO Register. The Register contains data on filing, registration and expiry of EU trade marks and registered Community designs registered at the EUIPO.
➔ TMView and DesignView. Maintained by the EUIPO, these databases provided information on national trade marks and designs.
Part of the statistical analysis in this study relies on the construction of stocks of IPRs.15 It was therefore necessary to account for the application and expiry dates of each individual IPR. This information is well covered in the European-level IPR repositories. For some countries, however, although information on the current status was available, the exact expiry date of specific IPRs that are no longer valid was not included in the data. In such cases, the expiry year was imputed based on the average validity period of the same type of national IPR with similar status in the same Member State or within the entire dataset of national rights.
In a few cases,16 information on expired IPRs was not available at all, so stock variables include only partial information, comprising rights which are still valid.
13 The size control in the econometric analysis was a binary SME/large company variable. No distinction was made between micro/small/medium companies within the SME category.14 During the patent data extraction process only those national patent applications have been considered that did not contain a European patent application in the DOCDB patent family.15 Total number of valid IPRs in each year of the analysis.16 This was the case for national trade marks of Spain and national designs for Italy.
Back to contents
26 Data and methodology
3.1.3 Matching process
As there was no common identifier available in all the data sources, several fields available in all the datasets, i.e. name of firm, legal form and address, served to identify the firms across multiple databases. Before the final matching was executed, the relevant fields in all the data sources were cleaned of non-distinctive information, such as legal forms, and standardised using the same pre-processing algorithms. The data cleaning and standardisation processes were modelled on the algorithms prepared by the Catholic University Leuven (Magerman et al., 2006) and were further refined by the project team.17
The join between various data sources was performed using the standardised and harmonised name fields. The matching process included out-of-sample ORBIS records to verify whether a match between firms included in the sample and IPR records was the best possible one.
The exact match process was used to match ORBIS with the IPR data. In cases where several ORBIS records linked to one IPR record, various disambiguation procedures based on comparisons of legal forms and addresses were employed to choose the best available match. In cases where there was not enough information in the data, or if the out-of-sample firms provided a better match than the firms included in the sample, the match between the sample firm and the IPR records was deemed to have failed and was rejected. Because in the IPR repositories the same company may be associated with different identifiers, after the matching, the stock of IPR information was consolidated on the level of the ORBIS identifier which denotes the individual firm establishment in the final panel dataset. Since the authors were interested in comparing the performance of firms that are indicated as owners of IPRs in IPR registers with those that are not, neither IPR ownership data nor financial and employment variables were consolidated on the level of economic group. This may introduce some bias, as the benefits of IPRs may be distributed among a wider array of firms within the group, and not only those that are formal owners of IPRs. Consequently, some of the firms with non-IPR owner status in the data may in fact benefit from IPRs held within the economic groups of which they are members.
As the final sample consists of firms with sufficient key data availability and the sample is reweighted to reflect the composition of the population of European firms, all the analyses in the present report were conducted on the entire sample with the necessary post-stratification adjustments.18
17 A detailed description of the matching process, including the matching algorithm, is available on request.18 Post-stratification consisted in assigning an individual weight to each observation, such that weighted data resembled the distribution of firms between Member States and size classes in the EU.
Back to contents
Data and methodology 27
3.2 Variables included in the dataset
Firm variables➔ ORBIS identity number➔ Member State where company is located➔ Year of incorporation➔ NACE Rev. 2 code - original NACE class industry (4-digit) code as shown in ORBIS. On the basis of this code, the more aggregated NACE division (2-digit) code is used in some descriptive statistics.➔ Revenue➔ Number of employees➔ Size: micro, small, medium or large according to the European Commission definition. For the assignation of a firm to a specific size category, both employment and turnover were considered. Whenever the size indicators calculated on the basis of employment and revenue did not coincide, the firm was assigned to the larger size category.➔ Wages (cost of employees).
IPR variables➔ Binary indicators of IPR ownership Based on the sample data, several variables were constructed to capture the IPR ownership status of each firm. The main focus of the study is to assess systematic performance differences between two groups of firms: those that are IPR-active and those which are not using registered IPR. IPR ownership status was therefore defined as a time-invariant variable with IPR owner status assigned to a firm if it was the owner of any IPR during any of the years covered by the panel.19 In the descriptive statistics and econometric models, several combinations of binary IPR variables were used to reflect the entire set of possible ownership of individual IPRs and their bundles at both national and European level. ➔ Stocks of IP rights The application and expiry dates were used to construct for each firm in each of the years covered in the panel: – European patent stock including applications with filing date starting from 1981; – national patent stock including applications with filing date starting from 1981; – European Union trade mark stock including applications with filing date starting from 1996; – national trade mark stock including applications with filing date starting from 1876; – Registered Community design stock including applications with filing date starting from 2003; – national design stock including applications with filing date starting from 1891;
Due to the complexity of the data cleaning, standardisation and matching processes and the quality of information on national IPRs, the matching to national IPRs was restricted only to rights assigned in the seat country of each firm in the sample.
19 The time frame between the IPR aquistion and possible effects on economic performance may be different for various IPRs and combinations thereof included in the study. The effects may also depend on the industry in which the firm is active. Given the broad scope of the analysis and lack of consensus in the economic literature about the proper time lags for each IPRs and their combinations in different industries, the IPR status is defined as time-invariant. This choice is also justified by a study design which focuses on performance differences between IP owners and non-owners, rather than analysis of the causal relationship between IPR and firm performance.
Back to contents
28 Data and methodology
3.3 Summary and limitations of the data
The present study is built on the foundations of a carefully constructed dataset. To the best of the authors’ knowledge, the coverage of the dataset is significantly larger than any other data source of this type currently available, ensuring a sufficiently large sample to draw robust and representative conclusions.
Nevertheless, there are limitations as regards both the data and the methodology that must be noted. Some of these limitations are inherent in the methodology or the data, while others can hopefully be overcome in future studies.
One of the limitations of this study is the lack of data on intangible assets (some of which can be protected by IPRs, as investment in R&D and design and marketing activities) and on the quality of those assets. The dataset at hand contains no information on a firm’s investments in intangible assets, and it is therefore impossible to control for this characteristic in the analysis. If, for example, firms that have many IPRs are also those that invest more in intangible assets in general, then the apparent relationship between IPR ownership and economic performance found in this study could be explained by the higher investment in intangibles. Without data on intangible investments, this hypothesis cannot be ruled out, nor can its potential impact on the results be assessed.
The quality of the economic and financial data in ORBIS largely depends on the reporting requirements in the various Member States, and on the degree to which firms comply with these requirements. Significant efforts were made in this study to correct for this problem. Nevertheless, the fact remains that to the extent that data is not supplied by firms to the relevant national authorities, there is no alternative source of such data — it simply does not exist in an accessible form.
The econometric analysis was conducted in a manner so as to correct for potential problems in the data, such as unobserved heterogeneity. However, the fact remains that the observed relationships in the data could be a result of some underlying factors that are difficult to measure, such as quality of the management or features of invention that may both be correlated with the propensity to use IPR and boost economic performance of a firm. This is an inherent potential risk in every econometric analysis.
Back to contents
Descriptive statistics 29
4. Descriptive statistics
This chapter presents descriptive statistics which explore patterns of IPR ownership by firms in Europe. It starts by focussing on whether on average IPR-owning firms exhibit significant differences compared with non-IPR-owning firms, in terms of key financial and company variables, including revenue and number of employees. Next, it investigates how IPR ownership is associated with firms characteristics. The analysis relies on cross-tabulations to study how IPR ownership varies across large firms and SMEs and firms in different sectors or different Member States. In addition, this chapter will also analyse the average stocks of IPRs and compare them across firm types.
In the tables in this chapter, the number of firms (indicated for each variable in the tables) may vary throughout the tables since not all variables are available for all firms. In computing the statistics, the outlier observations, defined as those in the top and bottom 2.5% of the distribution of the applicable variable, were omitted from the calculations.
All the calculations in this section have been performed on the post-stratified sample. Each observation in the sample has been assigned a specific individual weight reflecting the number of firms with similar characteristics in the overall population of the EU firms. This procedure allows for calculation of the statistics representative for the EU. As a result, the descriptive statistics in the overall sample are driven mainly by results of the SME subgroup. As SMEs constitute a large majority of firms in the overall population of the firms in the EU Member States, the weight of those firms in the overall result is much higher than the weight of large firms.
Back to contents
30 Descriptive statistics
4.1 Key financial and company variables
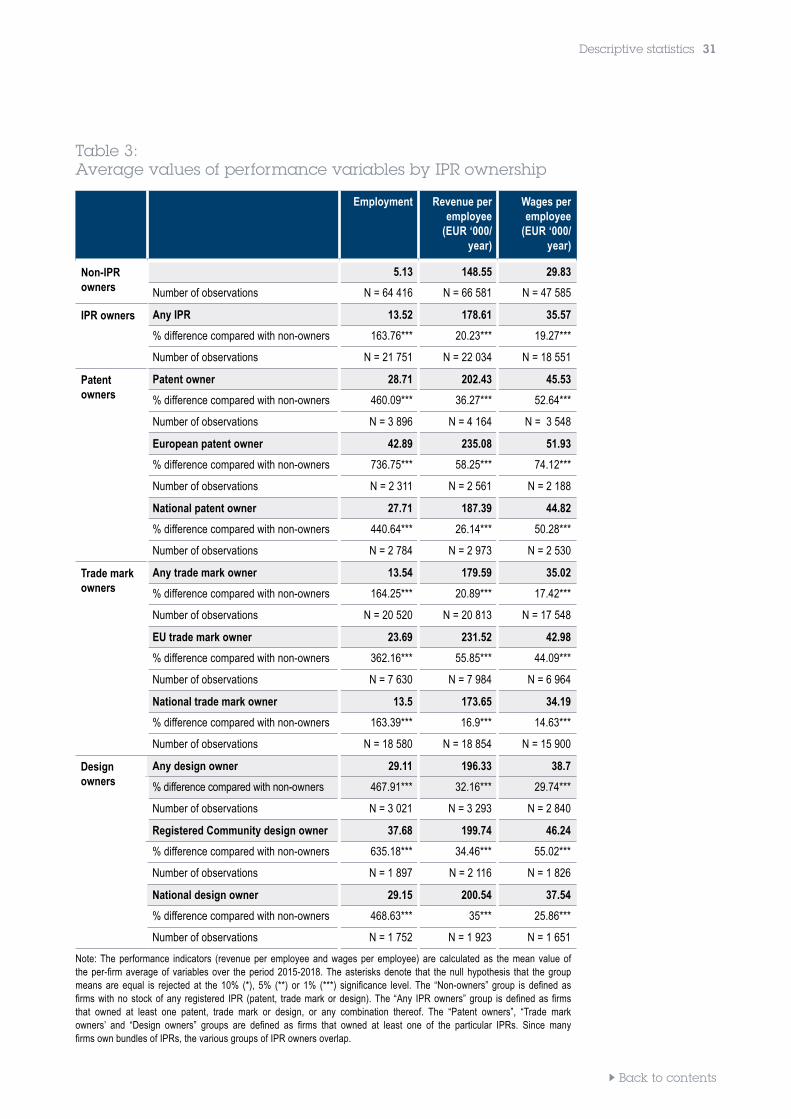
Table 3 summarises the key financial and company variables in the sample (revenue per employee, number of employees, wages), broken down by owners and non-owners of IPRs and also by type of IPR. Significance tests were conducted to determine whether the mean values of interest between the group of owners and the group of non-owners were significantly different for each type of IPR. All the differences shown in the table are statistically significant at the 1% level.20
The results of these statistical tests show that:
➔ Revenue per employee is significantly greater for owners than for non-owners of IPRs. When considering all IPRs, revenue per employee is 20.2% higher for IPR owners than for non-owners. The average premium in the case of patents, trade marks and designs is 36.3%, 20.9% and 32.2% respectively. The premiums for European-level rights are higher than for national rights in the case of patents and trade marks, and equal to national rights in the case of designs.
➔ Owners of patents, trade marks and/or designs have a greater number of employees than non-owners do (employing 2.6 times the number of workers compared with non-owners). These differences are particularly large for patent and design owners, especially those firms that own European-level rights.
20 Significance tests are used to calculate the probability that the observed difference could have come about merely by chance (and therefore does not reflect a real difference between owners and non-owners). If the calculated probability is less than 1%, then the result (that is, the observed difference) is said to be significant at the 1% significance level.
Back to contents
Descriptive statistics 31
Table 3: Average values of performance variables by IPR ownership
Employment Revenue per employee
(EUR ‘000/year)
Wages per employee
(EUR ‘000/year)
Non-IPR owners
5.13 148.55 29.83
Number of observations N = 64 416 N = 66 581 N = 47 585
IPR owners Any IPR 13.52 178.61 35.57
% difference compared with non-owners 163.76*** 20.23*** 19.27***
Number of observations N = 21 751 N = 22 034 N = 18 551
Patent owners
Patent owner 28.71 202.43 45.53
% difference compared with non-owners 460.09*** 36.27*** 52.64***
Number of observations N = 3 896 N = 4 164 N = 3 548
European patent owner 42.89 235.08 51.93
% difference compared with non-owners 736.75*** 58.25*** 74.12***
Number of observations N = 2 311 N = 2 561 N = 2 188
National patent owner 27.71 187.39 44.82
% difference compared with non-owners 440.64*** 26.14*** 50.28***
Number of observations N = 2 784 N = 2 973 N = 2 530
Trade mark owners
Any trade mark owner 13.54 179.59 35.02
% difference compared with non-owners 164.25*** 20.89*** 17.42***
Number of observations N = 20 520 N = 20 813 N = 17 548
EU trade mark owner 23.69 231.52 42.98
% difference compared with non-owners 362.16*** 55.85*** 44.09***
Number of observations N = 7 630 N = 7 984 N = 6 964
National trade mark owner 13.5 173.65 34.19
% difference compared with non-owners 163.39*** 16.9*** 14.63***
Number of observations N = 18 580 N = 18 854 N = 15 900
Design owners
Any design owner 29.11 196.33 38.7
% difference compared with non-owners 467.91*** 32.16*** 29.74***
Number of observations N = 3 021 N = 3 293 N = 2 840
Registered Community design owner 37.68 199.74 46.24
% difference compared with non-owners 635.18*** 34.46*** 55.02***
Number of observations N = 1 897 N = 2 116 N = 1 826
National design owner 29.15 200.54 37.54
% difference compared with non-owners 468.63*** 35*** 25.86***
Number of observations N = 1 752 N = 1 923 N = 1 651
Note: The performance indicators (revenue per employee and wages per employee) are calculated as the mean value of the per-firm average of variables over the period 2015-2018. The asterisks denote that the null hypothesis that the group means are equal is rejected at the 10% (*), 5% (**) or 1% (***) significance level. The “Non-owners” group is defined as firms with no stock of any registered IPR (patent, trade mark or design). The “Any IPR owners” group is defined as firms that owned at least one patent, trade mark or design, or any combination thereof. The “Patent owners”, “Trade mark owners’ and “Design owners” groups are defined as firms that owned at least one of the particular IPRs. Since many firms own bundles of IPRs, the various groups of IPR owners overlap.
Back to contents
32 Descriptive statistics
Employees of companies that own patents, trade marks and/or designs earn higher wages (19.3% on average) than those that work for companies that do not own these types of IPR. Here, the strongest effect is associated with owning patents (52.6%), followed by designs (29.7%) and trade marks (17.4%). European-level rights are associated with higher wage premiums than national rights for all three types of IPR.
4.2 IPR ownership by firm characteristic
4.2.1 IPR ownership by firm size
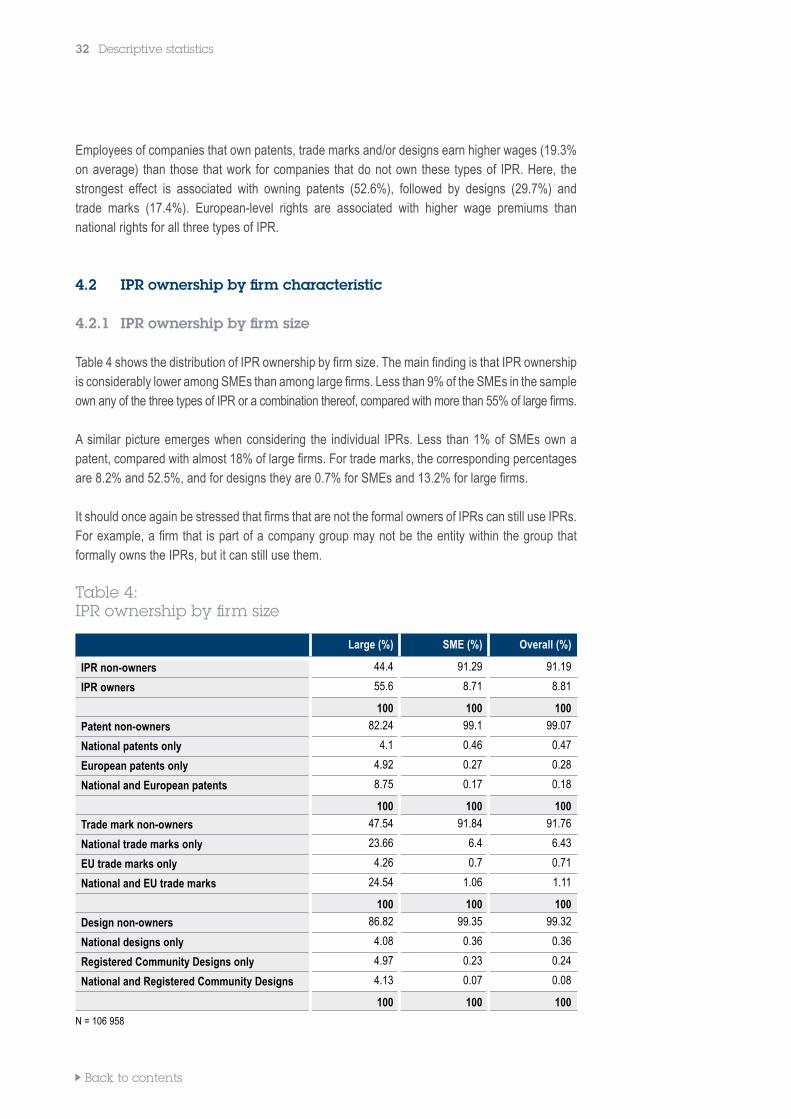
Table 4 shows the distribution of IPR ownership by firm size. The main finding is that IPR ownership is considerably lower among SMEs than among large firms. Less than 9% of the SMEs in the sample own any of the three types of IPR or a combination thereof, compared with more than 55% of large firms.
A similar picture emerges when considering the individual IPRs. Less than 1% of SMEs own a patent, compared with almost 18% of large firms. For trade marks, the corresponding percentages are 8.2% and 52.5%, and for designs they are 0.7% for SMEs and 13.2% for large firms.
It should once again be stressed that firms that are not the formal owners of IPRs can still use IPRs. For example, a firm that is part of a company group may not be the entity within the group that formally owns the IPRs, but it can still use them.
Table 4: IPR ownership by firm size
Large (%) SME (%) Overall (%)
IPR non-owners 44.4 91.29 91.19
IPR owners 55.6 8.71 8.81
100 100 100
Patent non-owners 82.24 99.1 99.07
National patents only 4.1 0.46 0.47
European patents only 4.92 0.27 0.28
National and European patents 8.75 0.17 0.18
100 100 100
Trade mark non-owners 47.54 91.84 91.76
National trade marks only 23.66 6.4 6.43
EU trade marks only 4.26 0.7 0.71
National and EU trade marks 24.54 1.06 1.11
100 100 100
Design non-owners 86.82 99.35 99.32
National designs only 4.08 0.36 0.36
Registered Community Designs only 4.97 0.23 0.24
National and Registered Community Designs 4.13 0.07 0.08
100 100 100
N = 106 958
Back to contents
Descriptive statistics 33
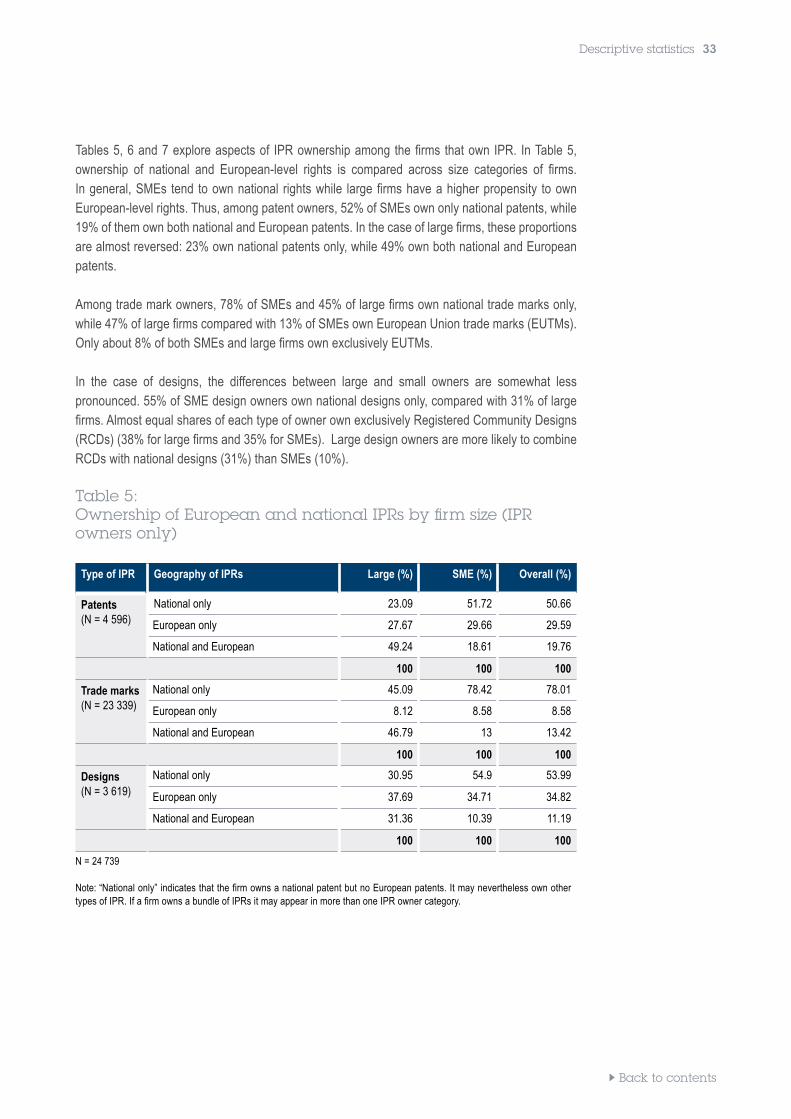
Tables 5, 6 and 7 explore aspects of IPR ownership among the firms that own IPR. In Table 5, ownership of national and European-level rights is compared across size categories of firms. In general, SMEs tend to own national rights while large firms have a higher propensity to own European-level rights. Thus, among patent owners, 52% of SMEs own only national patents, while 19% of them own both national and European patents. In the case of large firms, these proportions are almost reversed: 23% own national patents only, while 49% own both national and European patents.
Among trade mark owners, 78% of SMEs and 45% of large firms own national trade marks only, while 47% of large firms compared with 13% of SMEs own European Union trade marks (EUTMs). Only about 8% of both SMEs and large firms own exclusively EUTMs.
In the case of designs, the differences between large and small owners are somewhat less pronounced. 55% of SME design owners own national designs only, compared with 31% of large firms. Almost equal shares of each type of owner own exclusively Registered Community Designs (RCDs) (38% for large firms and 35% for SMEs). Large design owners are more likely to combine RCDs with national designs (31%) than SMEs (10%).
Table 5: Ownership of European and national IPRs by firm size (IPR owners only)
Type of IPR Geography of IPRs Large (%) SME (%) Overall (%)
Patents (N = 4 596)
National only 23.09 51.72 50.66
European only 27.67 29.66 29.59
National and European 49.24 18.61 19.76
100 100 100
Trade marks (N = 23 339)
National only 45.09 78.42 78.01
European only 8.12 8.58 8.58
National and European 46.79 13 13.42
100 100 100
Designs (N = 3 619)
National only 30.95 54.9 53.99
European only 37.69 34.71 34.82
National and European 31.36 10.39 11.19
100 100 100
N = 24 739
Note: “National only” indicates that the firm owns a national patent but no European patents. It may nevertheless own other types of IPR. If a firm owns a bundle of IPRs it may appear in more than one IPR owner category.
Back to contents
34 Descriptive statistics
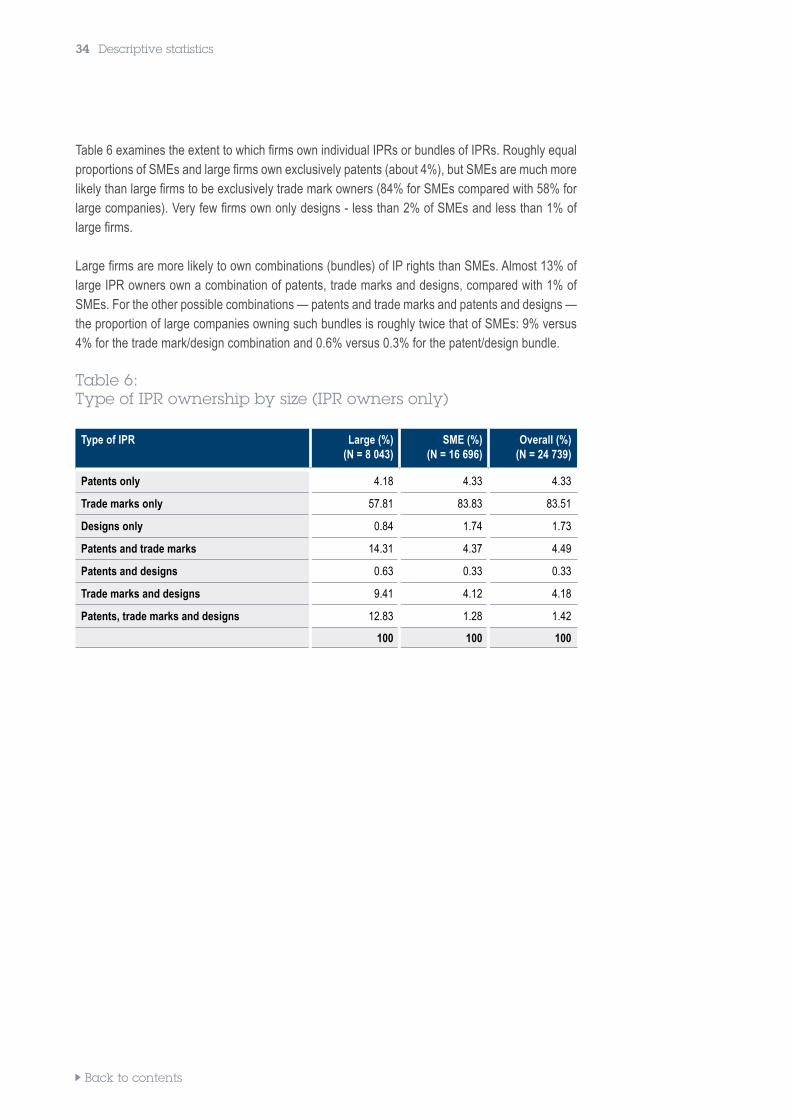
Table 6 examines the extent to which firms own individual IPRs or bundles of IPRs. Roughly equal proportions of SMEs and large firms own exclusively patents (about 4%), but SMEs are much more likely than large firms to be exclusively trade mark owners (84% for SMEs compared with 58% for large companies). Very few firms own only designs - less than 2% of SMEs and less than 1% of large firms.
Large firms are more likely to own combinations (bundles) of IP rights than SMEs. Almost 13% of large IPR owners own a combination of patents, trade marks and designs, compared with 1% of SMEs. For the other possible combinations — patents and trade marks and patents and designs — the proportion of large companies owning such bundles is roughly twice that of SMEs: 9% versus 4% for the trade mark/design combination and 0.6% versus 0.3% for the patent/design bundle.
Table 6: Type of IPR ownership by size (IPR owners only)
Type of IPR Large (%)(N = 8 043)
SME (%) (N = 16 696)
Overall (%) (N = 24 739)
Patents only 4.18 4.33 4.33
Trade marks only 57.81 83.83 83.51
Designs only 0.84 1.74 1.73
Patents and trade marks 14.31 4.37 4.49
Patents and designs 0.63 0.33 0.33
Trade marks and designs 9.41 4.12 4.18
Patents, trade marks and designs 12.83 1.28 1.42
100 100 100
Back to contents
Descriptive statistics 35
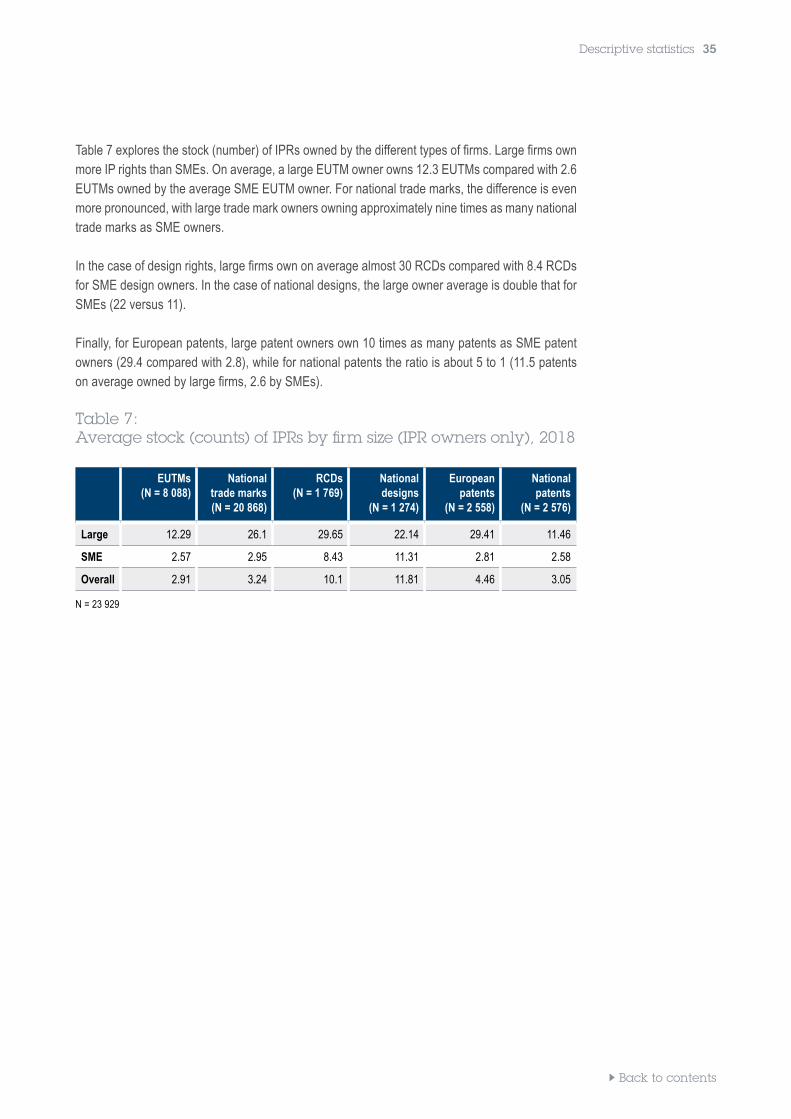
Table 7 explores the stock (number) of IPRs owned by the different types of firms. Large firms own more IP rights than SMEs. On average, a large EUTM owner owns 12.3 EUTMs compared with 2.6 EUTMs owned by the average SME EUTM owner. For national trade marks, the difference is even more pronounced, with large trade mark owners owning approximately nine times as many national trade marks as SME owners.
In the case of design rights, large firms own on average almost 30 RCDs compared with 8.4 RCDs for SME design owners. In the case of national designs, the large owner average is double that for SMEs (22 versus 11).
Finally, for European patents, large patent owners own 10 times as many patents as SME patent owners (29.4 compared with 2.8), while for national patents the ratio is about 5 to 1 (11.5 patents on average owned by large firms, 2.6 by SMEs).
Table 7: Average stock (counts) of IPRs by firm size (IPR owners only), 2018
EUTMs(N = 8 088)
National trade marks (N = 20 868)
RCDs (N = 1 769)
National designs
(N = 1 274)
European patents
(N = 2 558)
National patents
(N = 2 576)
Large 12.29 26.1 29.65 22.14 29.41 11.46
SME 2.57 2.95 8.43 11.31 2.81 2.58
Overall 2.91 3.24 10.1 11.81 4.46 3.05
N = 23 929
Back to contents
36 Descriptive statistics
4.2.2 IPR ownership by economic sector
Table 8 presents differences in the ownership of IPRs depending on the main activity of the firms concerned, as defined by the NACE section classification. 21 Table 8: IPR ownership by NACE category
NACE section Size N Any IPR (%) Patents (%) TMs (%) Designs (%)
B: Mining Large 130 42.59 20.55 39.61 6.31
SME 343 1.22 0.38 0.89 0
Overall 473 1.28 0.41 0.95 0.01
C: Manufacturing Large 4 760 68.79 36.33 63.01 24.96
SME 17 170 14.1 3.05 12.24 2.04
Overall 21 930 14.42 3.24 12.53 2.17
D: Electricity, gas, steam and air conditioning supply
Large 269 58.1 13.47 56.77 9.33
SME 516 5.44 0.58 4.89 0.06
Overall 785 5.9 0.69 5.34 0.14
E: Water supply; sewerage, waste management and remediation activities
Large 250 42.13 9.58 39.37 5.98
SME 859 9.36 1.55 8.28 0.06
Overall 1 109 9.6 1.61 8.51 0.1
F: Construction Large 813 47.27 14.23 42.65 5.65
SME 11 658 3.48 0.52 3.27 0.19
Overall 12 471 3.51 0.53 3.29 0.19
G: Wholesale and retail trade, repair of motor vehicles and motorcycles
Large 3 384 52.58 8.33 51.01 10.79
SME 24 186 8.89 0.63 8.35 0.57
Overall 27 570 8.95 0.64 8.42 0.59
H: Transporting and storage Large 971 45.39 4.18 44.05 4.73
SME 5 249 3.64 0.08 3.58 0.03
Overall 6 220 3.76 0.09 3.69 0.05
I: Accommodation and food service activities
Large 353 51.89 0.98 51.89 3.16
SME 5 113 5.48 0.06 5.42 0.07
Overall 5 466 5.51 0.06 5.45 0,.07
J: Information and communication Large 777 63.38 9.68 62.3 8.24
SME 4 742 17.58 0,.87 17.25 0.71
Overall 5 519 17.67 0.88 17.34 0.73
K: Financial and insurance activities Large 497 28.2 4 27 2.8
SME 215 0.38 0.02 0.37 0.01
Overall 712 0.4 0.02 0.4 0.01
L: Real estate activities Large 376 41.02 3.37 40.05 5.62
SME 5 416 5.74 0.27 5.54 0.27
Overall 5 792 5.75 0.27 5.56 0.27
M: Professional, scientific and technical activities
Large 1 420 51.38 14.48 48.07 7.78
SME 9 863 12.91 1.54 12.11 1.04
Overall 11 283 12.97 1.56 12.17 1.05
N: Administrative and support service activities
Large 1 376 38.6 3.48 37.95 3.41
SME 5 794 10.57 0.57 10.18 0.81
Overall 7 170 10.66 0.58 10.27 0.82
S: Other service activities Large 20 22.49 1.69 22.49 1.69
SME 307 14.39 0.01 14.39 0.01
Overall 327 14.4 0.01 14.4 0.01
Note: The table illustrates the share of specific IPR owners within the total population of firms representing each NACE section within a specific size bracket. Only NACE sections with 100 or more firms in the sample are shown.
21 Established in 1970, NACE (“Nomenclature statistique des activités économiques dans la Communauté européenne”) is the classification of economic activities used by the European Commission. Its current legal basis is Regulation (EC) No 1893/2006 of the European Parliament and of the Council of 20 December 2006 establishing the statistical classification of economic activities NACE Revision 2.
Back to contents
Descriptive statistics 37
The four largest sectors in the sample are manufacturing, construction, wholesale and retail, and professional, scientific and technical services. There are significant differences between the sectors in respect of IPR use. This is particularly visible when looking at large firms. The most IPR-intensive sectors are manufacturing, with 69% of large companies owning IPRs, and information and communication, with 63% of such companies being IPR owners.
The results show that manufacturing firms have the highest shares of patent owners (36% of large companies) and design owners (25% of large firms). Construction and the wholesale and retail trade sectors own a relatively large number of trade marks, with 43% and 51% of large firms in those sectors being trade mark owners. Professional services firms (“professional, scientific and technical activities”) are relatively patent-heavy (14.5% of large firms own patents) but they also own many trade marks (48% of large firms).
A similar pattern is seen among SMEs in the various sectors. For example, 3.2% of SMEs in manufacturing own patents, a far higher proportion than in any other sector.
Back to contents
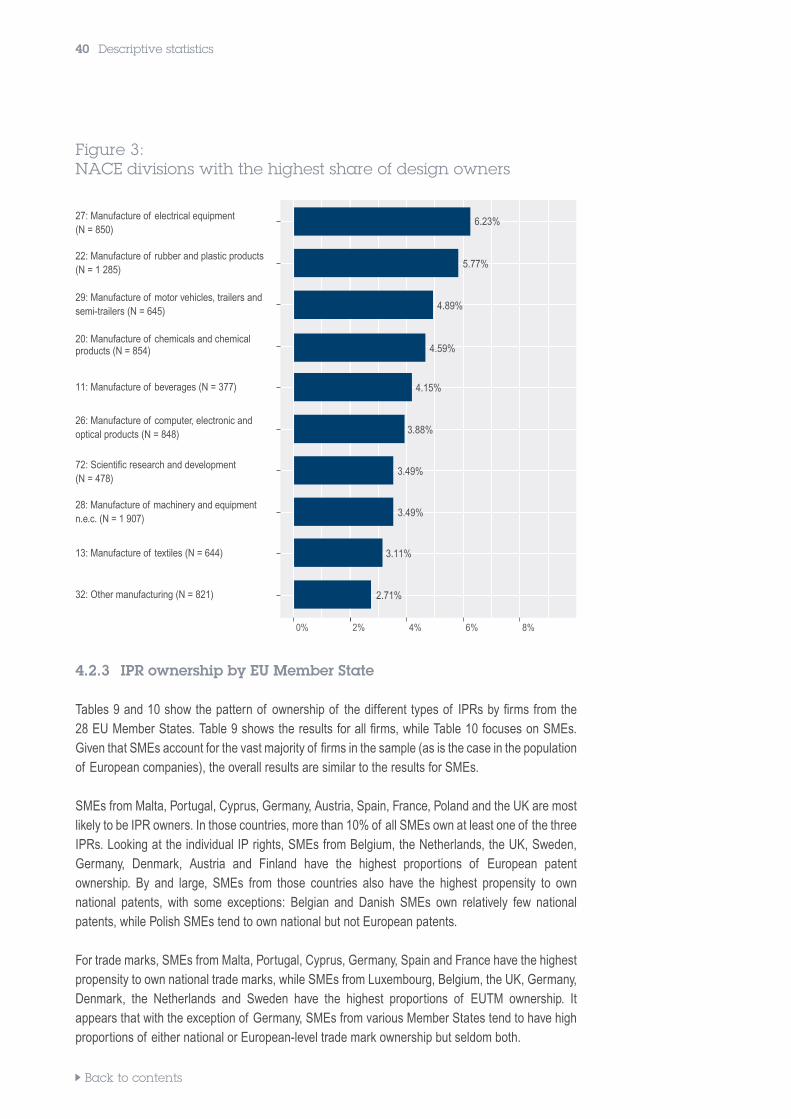
38 Descriptive statistics
Figures 1, 2 and 3 show the NACE divisions with the highest share of ownership of patents, trade marks and designs respectively. The figures next to each bar indicate the percentage of firms in the sector that own the IP right in question. Thus, 21% of firms in the sector Scientific research and development own patents, the highest share among the sectors by a large margin (in second place is Manufacture of machinery and equipment, with 12% of firms owning patents).
When it comes to trade mark ownership, the sector with the highest proportion of trade mark owners is the pharmaceutical industry (more than 39% of firms in that sector own trade marks), followed by Manufacture of beverages (38%) and Scientific research and development (33%).
In general, fewer firms own registered designs than is the case for patents and trade marks. Even in the most design-intensive sector, Manufacture of electrical equipment, the share of design-owning firms is only 6.2%. Other sectors with relatively high proportions of design ownership are Manufacture of rubber and plastic products (5.8%) and the automobile industry (4.9%).
Figure 1: NACE divisions with the highest share of patent owners
72: Scientific research and development (N=478)
28: Manufacture of machinery and equipment n.e.c. (N = 1 907)
29: Manufacture of motor vehicles, trailers andsemi-trailers (N = 645)
20: Manufacture of chemicals and chemical products (N = 854)
26: Manufacture of computer, electronic andoptical products (N = 848)
27: Manufacture of electrical equipment (N = 850)
22: Manufacture of rubber and plastic products (N = 1 285)
24: Manufacture of basic metals (N = 508)
21: Manufacture of basic pharmaceutical products and pharmaceutical preparations (N = 345)
30: Manufacture of other transport equipment (N = 246)
0% 5% 10% 15% 20%
8.48%
5.98%
7.24%
7.11%
7.97%
7.45%
11.96%
8.84%
4.96%
21.07%
Back to contents
Figure 2: NACE divisions with the highest share of trade mark owners
21: Manufacture of basic pharmaceutical products and pharmaceutical preparations (N = 345)
11: Manufacture of beverages (N = 377)
72: Scientific research and development (N = 478)
20: Manufacture of chemicals and chemical products (N = 854)
58: Publishing activities (N = 853)
29: Manufacture of motor vehicles, trailers andsemi-trailers (N = 645)
26: Manufacture of computer, electronic andoptical products (N = 848)
60: Programming and broadcasting activities (N = 172)
73: Advertising and market research (N = 1 222)
59: Motion picture, video and television programmeproduction, sound recording and music publishing
0% 10% 20% 30% 40%
activities (N = 453)
Descriptive statistics 39
38.09%
30.74%
39.51%
20.82%
22.92%
26.79%
17.43%
19.4%
32.69%
18.11%
Back to contents
40 Descriptive statistics
Figure 3: NACE divisions with the highest share of design owners
27: Manufacture of electrical equipment (N = 850)
22: Manufacture of rubber and plastic products (N = 1 285)
29: Manufacture of motor vehicles, trailers andsemi-trailers (N = 645)
20: Manufacture of chemicals and chemical products (N = 854)
11: Manufacture of beverages (N = 377)
26: Manufacture of computer, electronic andoptical products (N = 848)
72: Scientific research and development (N = 478)
28: Manufacture of machinery and equipment n.e.c. (N = 1 907)
13: Manufacture of textiles (N = 644)
32: Other manufacturing (N = 821)
0% 2% 4% 6% 8%
4.2.3 IPR ownership by EU Member State
Tables 9 and 10 show the pattern of ownership of the different types of IPRs by firms from the 28 EU Member States. Table 9 shows the results for all firms, while Table 10 focuses on SMEs. Given that SMEs account for the vast majority of firms in the sample (as is the case in the population of European companies), the overall results are similar to the results for SMEs.
SMEs from Malta, Portugal, Cyprus, Germany, Austria, Spain, France, Poland and the UK are most likely to be IPR owners. In those countries, more than 10% of all SMEs own at least one of the three IPRs. Looking at the individual IP rights, SMEs from Belgium, the Netherlands, the UK, Sweden, Germany, Denmark, Austria and Finland have the highest proportions of European patent ownership. By and large, SMEs from those countries also have the highest propensity to own national patents, with some exceptions: Belgian and Danish SMEs own relatively few national patents, while Polish SMEs tend to own national but not European patents.
For trade marks, SMEs from Malta, Portugal, Cyprus, Germany, Spain and France have the highest propensity to own national trade marks, while SMEs from Luxembourg, Belgium, the UK, Germany, Denmark, the Netherlands and Sweden have the highest proportions of EUTM ownership. It appears that with the exception of Germany, SMEs from various Member States tend to have high proportions of either national or European-level trade mark ownership but seldom both.
4.15%
3.11%
4.59%
5.77%
3.88%
6.23%
3.49%
4.89%
2.71%
3.49%
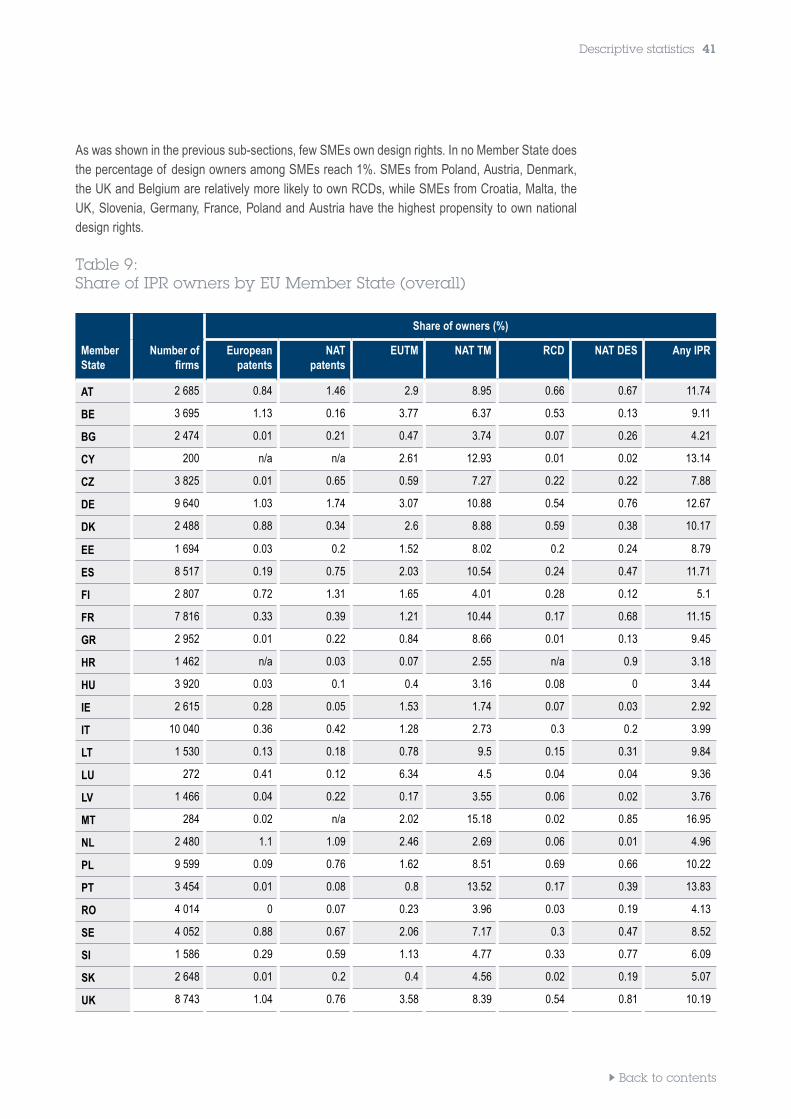
Back to contents
Descriptive statistics 41
As was shown in the previous sub-sections, few SMEs own design rights. In no Member State does the percentage of design owners among SMEs reach 1%. SMEs from Poland, Austria, Denmark, the UK and Belgium are relatively more likely to own RCDs, while SMEs from Croatia, Malta, the UK, Slovenia, Germany, France, Poland and Austria have the highest propensity to own national design rights.
Table 9: Share of IPR owners by EU Member State (overall)
Share of owners (%)
Member State
Number of firms
European patents
NAT patents
EUTM NAT TM RCD NAT DES Any IPR
AT 2 685 0.84 1.46 2.9 8.95 0.66 0.67 11.74
BE 3 695 1.13 0.16 3.77 6.37 0.53 0.13 9.11
BG 2 474 0.01 0.21 0.47 3.74 0.07 0.26 4.21
CY 200 n/a n/a 2.61 12.93 0.01 0.02 13.14
CZ 3 825 0.01 0.65 0.59 7.27 0.22 0.22 7.88
DE 9 640 1.03 1.74 3.07 10.88 0.54 0.76 12.67
DK 2 488 0.88 0.34 2.6 8.88 0.59 0.38 10.17
EE 1 694 0.03 0.2 1.52 8.02 0.2 0.24 8.79
ES 8 517 0.19 0.75 2.03 10.54 0.24 0.47 11.71
FI 2 807 0.72 1.31 1.65 4.01 0.28 0.12 5.1
FR 7 816 0.33 0.39 1.21 10.44 0.17 0.68 11.15
GR 2 952 0.01 0.22 0.84 8.66 0.01 0.13 9.45
HR 1 462 n/a 0.03 0.07 2.55 n/a 0.9 3.18
HU 3 920 0.03 0.1 0.4 3.16 0.08 0 3.44
IE 2 615 0.28 0.05 1.53 1.74 0.07 0.03 2.92
IT 10 040 0.36 0.42 1.28 2.73 0.3 0.2 3.99
LT 1 530 0.13 0.18 0.78 9.5 0.15 0.31 9.84
LU 272 0.41 0.12 6.34 4.5 0.04 0.04 9.36
LV 1 466 0.04 0.22 0.17 3.55 0.06 0.02 3.76
MT 284 0.02 n/a 2.02 15.18 0.02 0.85 16.95
NL 2 480 1.1 1.09 2.46 2.69 0.06 0.01 4.96
PL 9 599 0.09 0.76 1.62 8.51 0.69 0.66 10.22
PT 3 454 0.01 0.08 0.8 13.52 0.17 0.39 13.83
RO 4 014 0 0.07 0.23 3.96 0.03 0.19 4.13
SE 4 052 0.88 0.67 2.06 7.17 0.3 0.47 8.52
SI 1 586 0.29 0.59 1.13 4.77 0.33 0.77 6.09
SK 2 648 0.01 0.2 0.4 4.56 0.02 0.19 5.07
UK 8 743 1.04 0.76 3.58 8.39 0.54 0.81 10.19
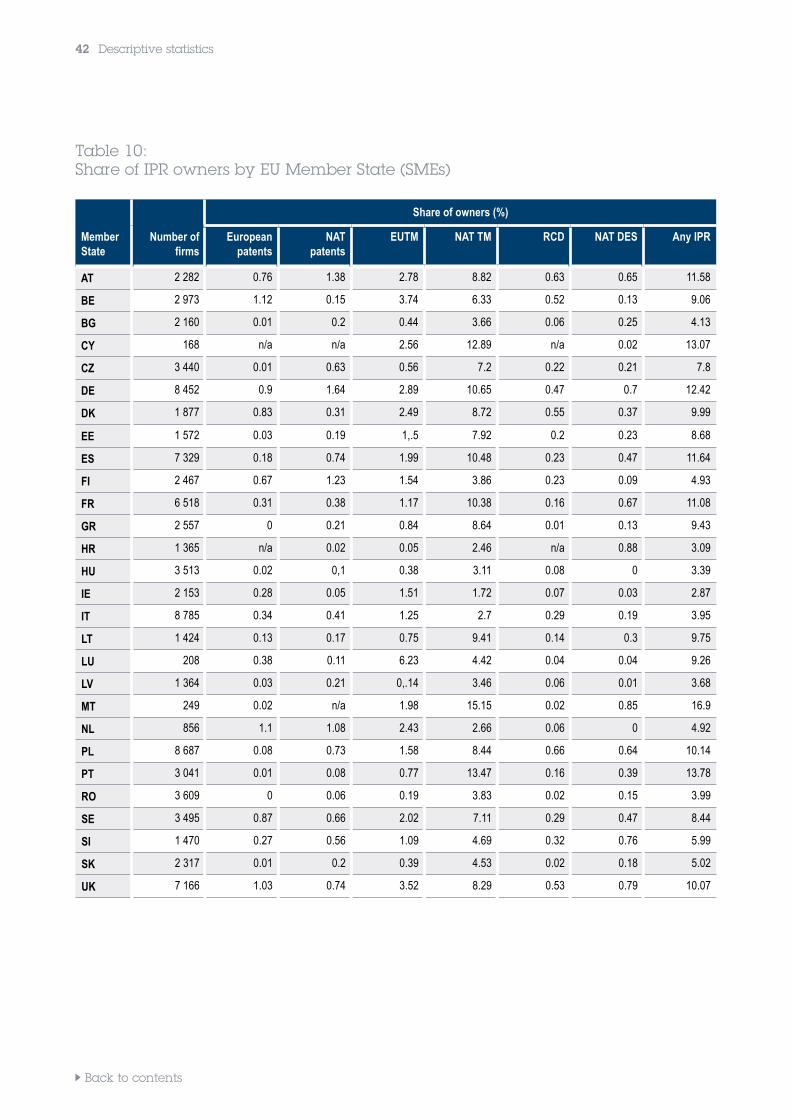
Back to contents
42 Descriptive statistics
Table 10: Share of IPR owners by EU Member State (SMEs)
Share of owners (%)
Member State
Number of firms
Europeanpatents
NAT patents
EUTM NAT TM RCD NAT DES Any IPR
AT 2 282 0.76 1.38 2.78 8.82 0.63 0.65 11.58
BE 2 973 1.12 0.15 3.74 6.33 0.52 0.13 9.06
BG 2 160 0.01 0.2 0.44 3.66 0.06 0.25 4.13
CY 168 n/a n/a 2.56 12.89 n/a 0.02 13.07
CZ 3 440 0.01 0.63 0.56 7.2 0.22 0.21 7.8
DE 8 452 0.9 1.64 2.89 10.65 0.47 0.7 12.42
DK 1 877 0.83 0.31 2.49 8.72 0.55 0.37 9.99
EE 1 572 0.03 0.19 1,.5 7.92 0.2 0.23 8.68
ES 7 329 0.18 0.74 1.99 10.48 0.23 0.47 11.64
FI 2 467 0.67 1.23 1.54 3.86 0.23 0.09 4.93
FR 6 518 0.31 0.38 1.17 10.38 0.16 0.67 11.08
GR 2 557 0 0.21 0.84 8.64 0.01 0.13 9.43
HR 1 365 n/a 0.02 0.05 2.46 n/a 0.88 3.09
HU 3 513 0.02 0,1 0.38 3.11 0.08 0 3.39
IE 2 153 0.28 0.05 1.51 1.72 0.07 0.03 2.87
IT 8 785 0.34 0.41 1.25 2.7 0.29 0.19 3.95
LT 1 424 0.13 0.17 0.75 9.41 0.14 0.3 9.75
LU 208 0.38 0.11 6.23 4.42 0.04 0.04 9.26
LV 1 364 0.03 0.21 0,.14 3.46 0.06 0.01 3.68
MT 249 0.02 n/a 1.98 15.15 0.02 0.85 16.9
NL 856 1.1 1.08 2.43 2.66 0.06 0 4.92
PL 8 687 0.08 0.73 1.58 8.44 0.66 0.64 10.14
PT 3 041 0.01 0.08 0.77 13.47 0.16 0.39 13.78
RO 3 609 0 0.06 0.19 3.83 0.02 0.15 3.99
SE 3 495 0.87 0.66 2.02 7.11 0.29 0.47 8.44
SI 1 470 0.27 0.56 1.09 4.69 0.32 0.76 5.99
SK 2 317 0.01 0.2 0.39 4.53 0.02 0.18 5.02
UK 7 166 1.03 0.74 3.52 8.29 0.53 0.79 10.07
Back to contents
5. IPRs and firm performance: econometric analysis 43
5. IPRs and firm performance: econometric analysis
This chapter examines the link between IPRs and firm performance in more depth. In particular, econometric modelling is applied to estimate the relationship between firms’ performance and ownership of IPRs overall, but also the ownership of patents, trade marks and registered designs separately.
Applying econometric techniques to the dataset makes it possible to control for external influences on firm performance to a great extent. Compared with previous studies, the data used in this study offers not only a wide geographical scope but also information on several registered IPR types and on the performance of a large number of firms over several years.
5.1 Selection of variables
Econometric analysis consists in using statistical techniques to examine the relationship between a variable whose movements the researcher seeks to explain (called the dependent variable) using a set of explanatory or independent variables.
This section describes the selection of the dependent variable and the independent variables.
5.1.1 Dependent variable
The purpose of this study is to analyse the relationship between IPR ownership and firm performance. Therefore, the dependent variable of the models needs to be an indicator of company performance. The ORBIS database described in chapter 3 contains several potential candidates, including various measures of revenue, sales and profit or loss. Given that this study relies on data from all the EU Member States, it is important that the basis on which the dependent variable is constructed is identical between countries over time as this will minimise the risk that weaknesses in the data lead to biased results. For this reason, various measures of profitability, which are often affected by accounting and tax considerations, were discarded in favour of revenue as the basis of the performance measure in the models. Given the substantial variation in revenue between firms of different sizes, the decision was made to transform the performance measure by dividing it by the number of the firm’s employees.
Thus, revenue per employee (operating revenue per employee in a given year) is the measure of performance in the econometric models.
Back to contents
44 IPRs and firm performance: econometric analysis
5.1.2 Explanatory variables
The differences between firms in their performance, as represented by revenue per employee, are then sought to be explained by a set of explanatory variables, which fall into two main categories. The first category consists of binary or dummy variables 22 that indicate whether the firm owns IPRs (or whether it owns a particular type of IPR): ➔ IPR owner: takes the value 1 if the firm owned any type of IPR in any of the years, and 0
otherwise.➔ A set of dummy variables which indicates whether or not a firm owned a specific combination of IPRs in any of the years and which divides the sample into eight corresponding groups:
– Patents only: takes the value 1 if the firm owned patents but no other type of IPR, and 0 otherwise. – Trade marks only: takes the value 1 if the firm owned trade marks but no other type of IPR, and 0 otherwise. – Designs only: takes the value 1 if the firm owned design rights but no other type of IPR, and 0 otherwise. – Patents and trade marks: takes the value 1 if the firm owned patents and trade marks but not designs, and 0 otherwise. – Patents and designs: takes the value 1 if the firm owned patents and designs but not trade marks, and 0 otherwise. – Trade marks and designs: takes the value 1 if the firm owned trade marks and designs but not patents, and 0 otherwise. – Patents, trade marks and designs: takes the value 1 if the firm owned all three types of IPR, and 0 otherwise. – No IPRs: takes the value 1 if the firm did not own any type of IPR, and 0 otherwise.
In addition, so-called control variables were also used. These are variables which indicate, or control for, non-IPR factors which might affect company performance and which therefore need to be taken into account when analysing the relationship between performance and IPR ownership: ➔ Country dummies: the country in which the firm is domiciled.➔ Sector dummies: the sector in which the firm is active (NACE sections).➔ Year dummies: the year (to control for the effects of the economic cycle).➔ SME: a dummy variable which takes the value 1 if the firm is an SME, and 0 if the firm is large (in cases where the company moved between categories during the panel period, it is assigned to the larger size category).➔ Age of company: a variable that indicates the age of the firm.➔ Employment: a variable indicating the number of employees in the firm.23
22 Dummy or binary variables are variables which take a value of either zero or one. For example, a dummy variable indicating whether or not a firm is domiciled in Spain would take a value of one for all Spanish firms and zero for all other firms.23 While the SME dummy is already an indication of the size of the firm, the category ranges from firms with one employee to firms with 249 employees. It can thus be expected that companies of different sizes within the SME category behave differently in respect of their IPR and business strategy. This is even more true of large firms, which can range in size from 250 employees to tens of thousands.
Back to contents
IPRs and firm performance: econometric analysis 45
5.2 Econometric methodology
5.2.1 Panel data
The dataset used for this study consists of data for 127 199 firms, with up to 13 (annual) observations per firm (2007-2019). However, not all firms have data for the entire period. On average, there are data for 7.4 years per firm, yielding more than 940 000 observations in total. However, in practice the number of observations is somewhat lower, around 890 000, because outlier observations 24 were eliminated from the analysis. The dataset has a so-called panel format as it contains both a cross-sectional and a time-series dimension. Panel data makes it possible to exploit not only cross-sectional variation (differences between firms at one point in time) but also time-series variation (changes for one firm over time). Since both dimensions of variation within the data can be exploited simultaneously, panel data estimates are based on a larger sample size, and are thus potentially more accurate than those obtained through simple cross-section or time-series regressions.
Furthermore, a particular type of econometric modelling can be applied, namely panel regression techniques. This method is able to control for unobserved heterogeneity (i.e. the effect of variables that are not observable in the data but which might have an impact on the dependent variable of interest). This feature is particularly important since it minimises the risk of obtaining spurious results driven primarily by firms characteristics that have an effect on their performance but which are not observed and are not related to the ownership of IPRs. For instance, a company’s specific organisational structure, its business model, and its management quality are all factors which may have a significant impact on the relationship between IPR ownership and performance but for which data is lacking. Failure to deal with unobserved characteristics could produce biased results. However, unobserved heterogeneity in a panel framework can be dealt with through the use of particular panel estimation techniques, which are designed with the precise goal of controlling for specific company features that are not directly observable in the data.
This study focuses on systematic differences in performance between the group of IPR active firms and firms that do not use IPR protection over a period of 13 years. The main variable of interest - IPR activity - has been defined as a binary and time-invariant variable In this context, a fixed-effects estimator would ignore all the variations in the explanatory variables across individual firms, such as their sector and country of activity. Therefore, the so-called random effects model has been selected as the panel regression method best suited to this research design. Random effects models combine the cross sectional (between firms) and time series (within firms) features of the data for model estimation. This allows for estimation of time-invariant variables (Wooldridge 2013). This technique relies, however, on the assumption that firm-specific unobservable characteristics have a non-systematic (i.e. random) influence on performance and are uncorrelated with the explanatory variables.
24 Those observations for which the value of revenue per employee exceeded the range of 1.5* IQR (interquartile range). The exclusion of extreme observations from an analysis is standard practice in econometrics.
Back to contents
46 IPRs and firm performance: econometric analysis
5.2.2 Logarithmic transformation
In regression analysis, it is common to logarithmically transform variables where a non-linear relationship exists between the independent and dependent variables. This approach allows for inclusion of non-linear focal relationship, while still preserving the linear regression model. Logarithmic transformations are also a convenient means of transforming a highly skewed variable into one that is more approximately normal. In this study, the distributions of the performance variable as well as of the stock variables are highly skewed. Finally, it is appropriate to make a logarithmic transformation when it is suspected that a given percentage change in an explanatory variable will lead to a constant percentage change in the dependent variable.
Consequently, in the regressions presented below, the dependent variable (revenue per employee) and the continuous explanatory variable (employment) are expressed in logarithms.
5.3 Results
5.3.1 Interpreting regression results
To interpret the regression results presented in the tables below, a little background knowledge of econometrics and statistics is required. In this section, the necessary knowledge to understand the discussion that follows is provided.
The tables containing the regression results consist of the following columns:
Variable Coef
The “Variable” column contains the explanatory variables of the regression model. Explanatory variables are those factors that are believed to have an impact on firm performance.
The “Coef” column shows the impact of each explanatory variable on firm performance. A positive value for the coefficient means that an increase in the value of the focal variable is associated with better performance, whilst a negative coefficient means that an increase in the value of the variable is related to weaker performance. The greater the magnitude of the coefficient (either positive or negative), the greater the association between the control variable and the performance of the firm.
It is important to note that not all variables have a statistically significant influence on the dependent variable. Statisticians and econometricians use significance tests to determine whether or not a particular explanatory variable has a statistically significant relationship to the dependent variable. The significance level indicates the probability of a false rejection of the null hypothesis, for example that the coefficient is different from zero, in a statistical test. In other words, it indicates the probability that the coefficient appears to be non-zero solely as a result of chance. In the tables of results, a single asterisk next to an entry in the “Coef ” column indicates that the coefficient is significantly different from zero at the 10% significance level, whilst a double asterisk indicates that it is significant at the 5% level and a triple asterisk indicates that it is significant at the 1% level. The
Back to contents
IPRs and firm performance: econometric analysis 47
confidence that the independent variable truly has an impact on the dependent variable is greater if the coefficient is significant at the 1% level than if it is significant at the 5% or even 10% level.
Some of the variables included in the regressions are “dummy variables”, which take a value of either zero or one. For example, some of the models include a dummy variable that takes a value of one if the company owns IPRs (or, in some models, a specific type of IPR), and zero otherwise.
Interpreting the coefficients on dummy variables is slightly more complex than interpreting the coefficients on standard logarithmic variables. The coefficient on a dummy variable indicates the change in firm performance, given a change in the value of the dummy variable from zero to one. For example, a positive and significant coefficient on the “IPR owner” dummy variable in a regression examining whether IPR owners exhibit superior performance to non-owners would be interpreted as follows: IPR owners have higher revenue per employee compared with non-owners of IPRs, all else being equal.
It is also important to note that the dummy variables enter into the models without a logarithmic transformation. All the models with IPR dummies have the log-linear form. In such models, for a small change in log (y), the coefficients, when multiplied by 100, approximate well the percentage change in the dependent variable. However, as the change in log (y) becomes larger, the approximation % ∆ y ≈ 100 * ∆log(y) becomes inaccurate. To calculate the exact percentage difference in the revenue per employee between IPR owners and non-owners, the coefficients must be transformed using the following formula:
%change = 100 * (exp(coef) – 1)
In the results tables below, the entry in the “Coef ” column for all dummy variables presents the estimated coefficient. The calculated marginal effects,25 according to the formula above, are shown graphically immediately following the regression results.
5.3.2 IPR ownership and firm performance
The purpose of this first set of models is to analyse whether those firms that own IPRs exhibit superior economic performance to those that do not. The variables of interest in these models are dummy variables which take a value of either zero or one, indicating: ➔ whether or not a firm owns any form of IPR (“IPR owner”), and➔ whether or not a firm owns a specific combination of IPRs (“patents only”, “trade marks only”, “designs only”, “patents and trade marks”, “patents and designs”, “trade marks and designs”, “patents, trade marks and designs”).
All the models include controls for country, sector, year, age of firm, SME dummy (in model 1), and a proxy for firm size based on the number of employees.
25 Predicted change in a dependent variable when a specific independent variable changes, while all the other control variables remain constant.
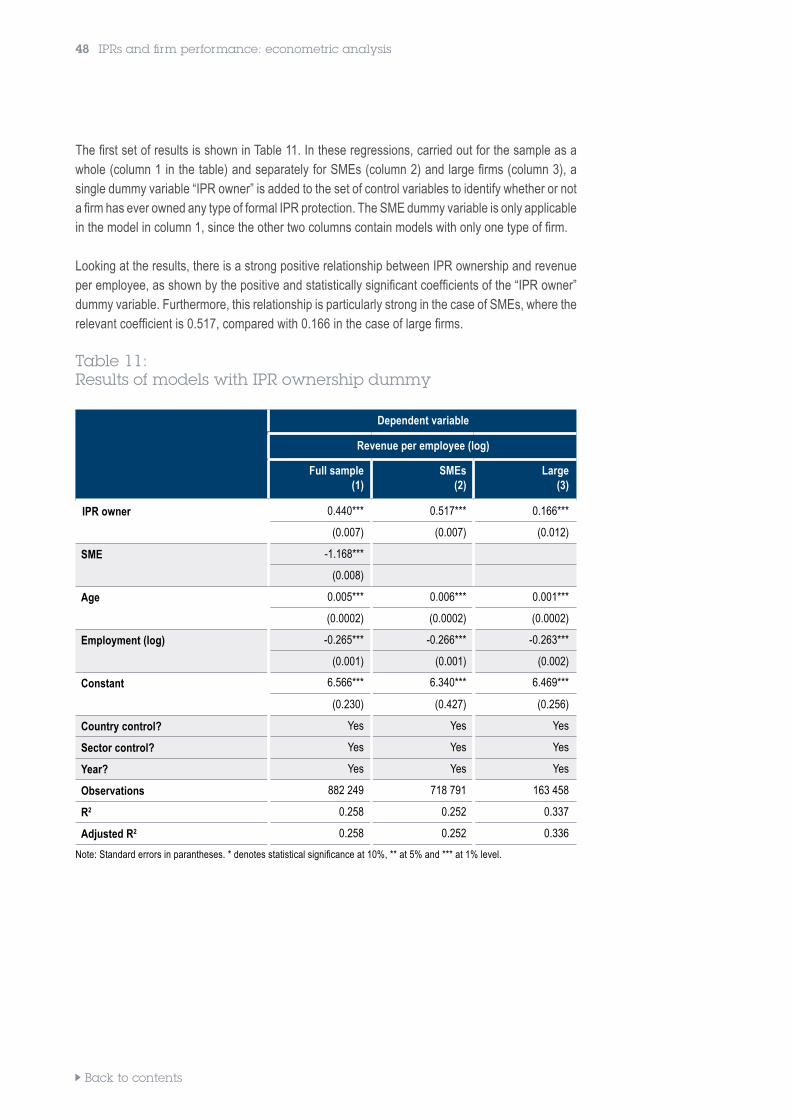
Back to contents
48 IPRs and firm performance: econometric analysis
The first set of results is shown in Table 11. In these regressions, carried out for the sample as a whole (column 1 in the table) and separately for SMEs (column 2) and large firms (column 3), a single dummy variable “IPR owner” is added to the set of control variables to identify whether or not a firm has ever owned any type of formal IPR protection. The SME dummy variable is only applicable in the model in column 1, since the other two columns contain models with only one type of firm.
Looking at the results, there is a strong positive relationship between IPR ownership and revenue per employee, as shown by the positive and statistically significant coefficients of the “IPR owner” dummy variable. Furthermore, this relationship is particularly strong in the case of SMEs, where the relevant coefficient is 0.517, compared with 0.166 in the case of large firms.
Table 11: Results of models with IPR ownership dummy
Dependent variable
Revenue per employee (log)
Full sample(1)
SMEs(2)
Large(3)
IPR owner 0.440*** 0.517*** 0.166***
(0.007) (0.007) (0.012)
SME -1.168***
(0.008)
Age 0.005*** 0.006*** 0.001***
(0.0002) (0.0002) (0.0002)
Employment (log) -0.265*** -0.266*** -0.263***
(0.001) (0.001) (0.002)
Constant 6.566*** 6.340*** 6.469***
(0.230) (0.427) (0.256)
Country control? Yes Yes Yes
Sector control? Yes Yes Yes
Year? Yes Yes Yes
Observations 882 249 718 791 163 458
R2 0.258 0.252 0.337
Adjusted R2 0.258 0.252 0.336
Note: Standard errors in parantheses. * denotes statistical significance at 10%, ** at 5% and *** at 1% level.
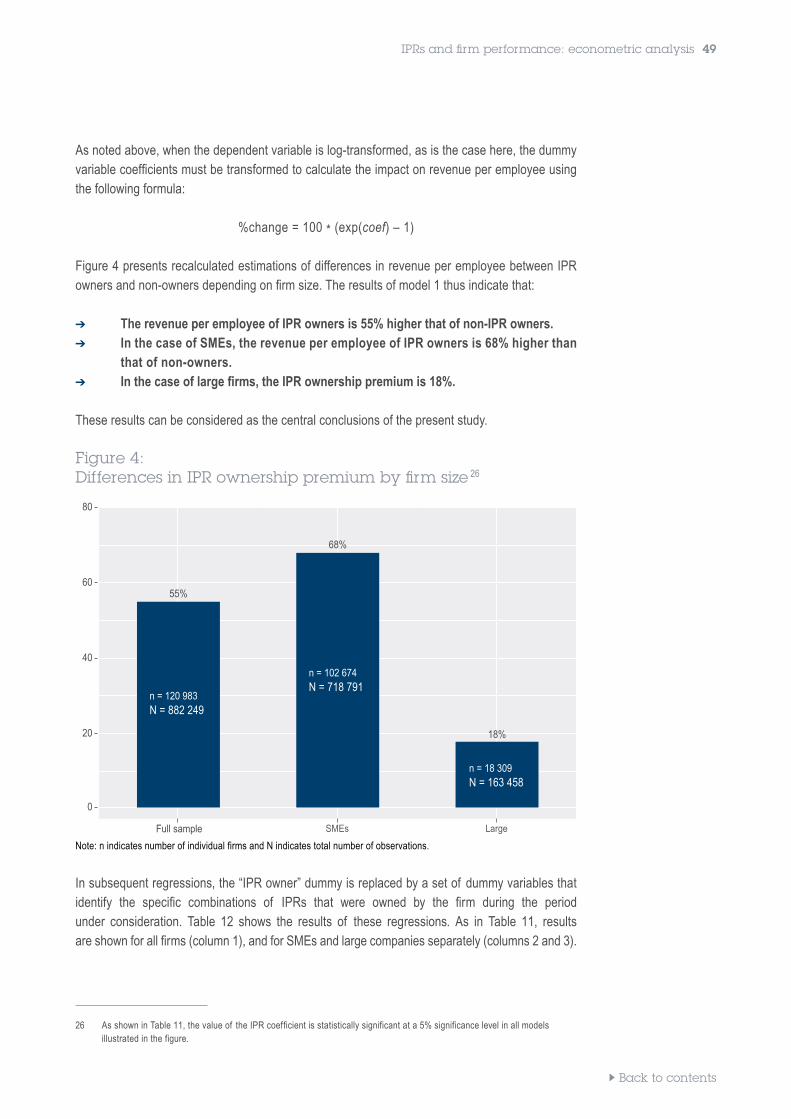
Back to contents
IPRs and firm performance: econometric analysis 49
As noted above, when the dependent variable is log-transformed, as is the case here, the dummy variable coefficients must be transformed to calculate the impact on revenue per employee using the following formula:
%change = 100 * (exp(coef) – 1)
Figure 4 presents recalculated estimations of differences in revenue per employee between IPR owners and non-owners depending on firm size. The results of model 1 thus indicate that: ➔ The revenue per employee of IPR owners is 55% higher that of non-IPR owners.➔ In the case of SMEs, the revenue per employee of IPR owners is 68% higher than that of non-owners.➔ In the case of large firms, the IPR ownership premium is 18%.
These results can be considered as the central conclusions of the present study.
Figure 4: Differences in IPR ownership premium by firm size 26
80
60
40
20
0
Full sample SMEs Large
Note: n indicates number of individual firms and N indicates total number of observations.
In subsequent regressions, the “IPR owner” dummy is replaced by a set of dummy variables that identify the specific combinations of IPRs that were owned by the firm during the period under consideration. Table 12 shows the results of these regressions. As in Table 11, results are shown for all firms (column 1), and for SMEs and large companies separately (columns 2 and 3).
26 As shown in Table 11, the value of the IPR coefficient is statistically significant at a 5% significance level in all models illustrated in the figure.
55%
n = 120 983N = 882 249
68%
n = 102 674 N = 718 791
18%
n = 18 309 N = 163 458
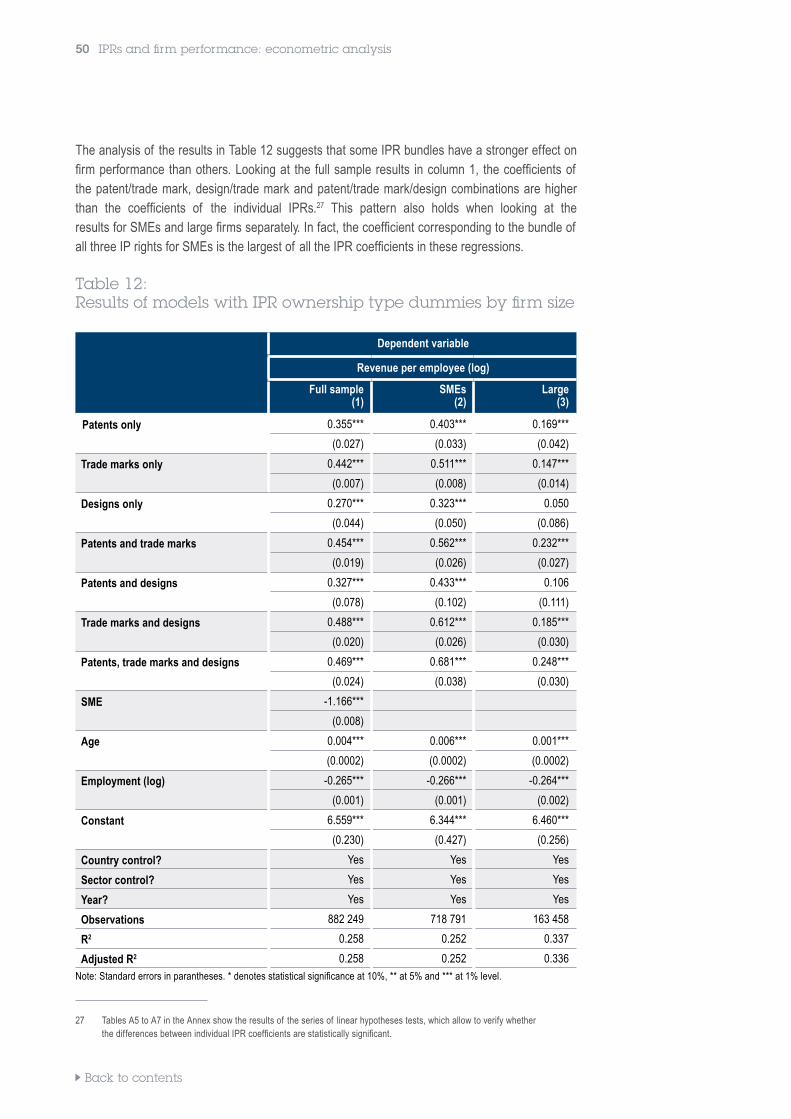
Back to contents
50 IPRs and firm performance: econometric analysis
The analysis of the results in Table 12 suggests that some IPR bundles have a stronger effect on firm performance than others. Looking at the full sample results in column 1, the coefficients of the patent/trade mark, design/trade mark and patent/trade mark/design combinations are higher than the coefficients of the individual IPRs.27 This pattern also holds when looking at the results for SMEs and large firms separately. In fact, the coefficient corresponding to the bundle of all three IP rights for SMEs is the largest of all the IPR coefficients in these regressions.
Table 12: Results of models with IPR ownership type dummies by firm size
Dependent variable
Revenue per employee (log)
Full sample(1)
SMEs(2)
Large(3)
Patents only 0.355*** 0.403*** 0.169***
(0.027) (0.033) (0.042)
Trade marks only 0.442*** 0.511*** 0.147***
(0.007) (0.008) (0.014)
Designs only 0.270*** 0.323*** 0.050
(0.044) (0.050) (0.086)
Patents and trade marks 0.454*** 0.562*** 0.232***
(0.019) (0.026) (0.027)
Patents and designs 0.327*** 0.433*** 0.106
(0.078) (0.102) (0.111)
Trade marks and designs 0.488*** 0.612*** 0.185***
(0.020) (0.026) (0.030)
Patents, trade marks and designs 0.469*** 0.681*** 0.248***
(0.024) (0.038) (0.030)
SME -1.166***
(0.008)
Age 0.004*** 0.006*** 0.001***
(0.0002) (0.0002) (0.0002)
Employment (log) -0.265*** -0.266*** -0.264***
(0.001) (0.001) (0.002)
Constant 6.559*** 6.344*** 6.460***
(0.230) (0.427) (0.256)
Country control? Yes Yes Yes
Sector control? Yes Yes Yes
Year? Yes Yes Yes
Observations 882 249 718 791 163 458
R2 0.258 0.252 0.337
Adjusted R2 0.258 0.252 0.336
Note: Standard errors in parantheses. * denotes statistical significance at 10%, ** at 5% and *** at 1% level.
27 Tables A5 to A7 in the Annex show the results of the series of linear hypotheses tests, which allow to verify whether the differences between individual IPR coefficients are statistically significant.
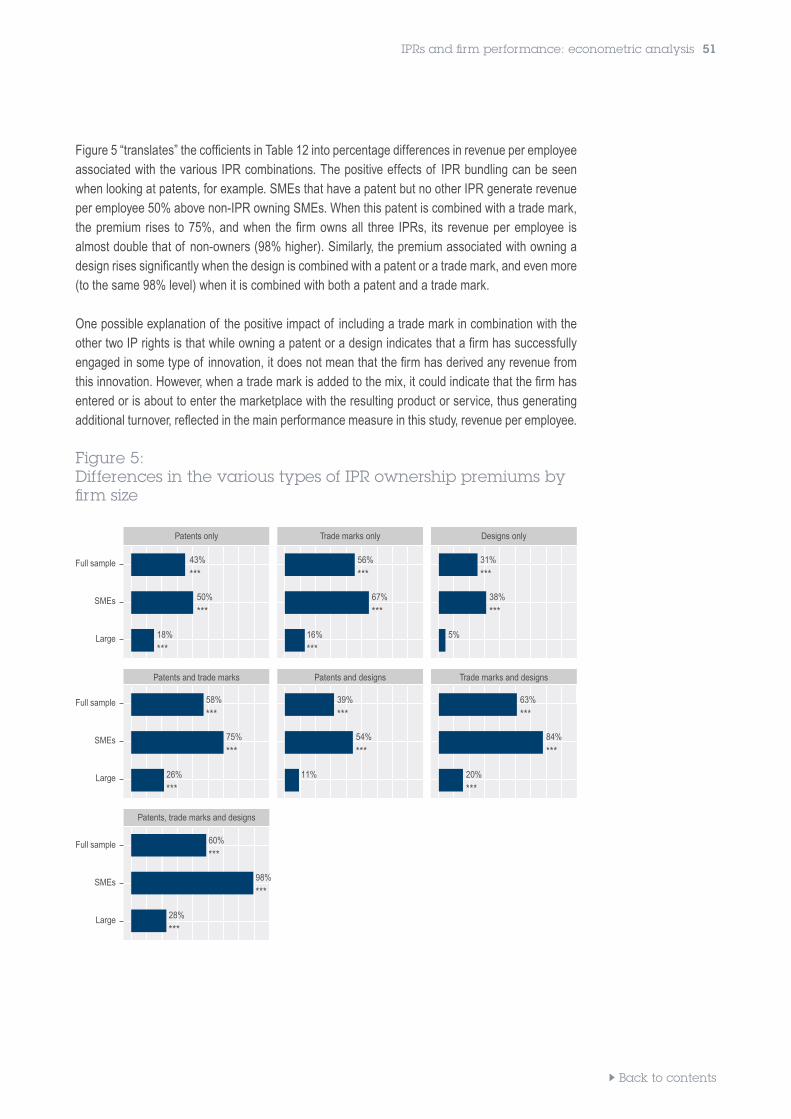
Back to contents
IPRs and firm performance: econometric analysis 51
Figure 5 “translates” the cofficients in Table 12 into percentage differences in revenue per employee associated with the various IPR combinations. The positive effects of IPR bundling can be seen when looking at patents, for example. SMEs that have a patent but no other IPR generate revenue per employee 50% above non-IPR owning SMEs. When this patent is combined with a trade mark, the premium rises to 75%, and when the firm owns all three IPRs, its revenue per employee is almost double that of non-owners (98% higher). Similarly, the premium associated with owning a design rises significantly when the design is combined with a patent or a trade mark, and even more (to the same 98% level) when it is combined with both a patent and a trade mark.
One possible explanation of the positive impact of including a trade mark in combination with the other two IP rights is that while owning a patent or a design indicates that a firm has successfully engaged in some type of innovation, it does not mean that the firm has derived any revenue from this innovation. However, when a trade mark is added to the mix, it could indicate that the firm has entered or is about to enter the marketplace with the resulting product or service, thus generating additional turnover, reflected in the main performance measure in this study, revenue per employee.
Figure 5: Differences in the various types of IPR ownership premiums by firm size
Patents only Trade marks only Designs only
Full sample
SMEs
Large
Patents and trade marks Patents and designs Trade marks and designs
Full sample
SMEs
Large
Patents, trade marks and designs
Full sample
SMEs
Large
43%
***56%
***31%
***
50%
***67%
***38%
***
18%
***16%
***5%
58%
***
60%
***
39%
***63%
***
75%
***
98%
***
54%
***84%
***
26%
***
28%
***
11% 20%
***
Back to contents
52 IPRs and firm performance: econometric analysis
5.4 Discussion of the results
Overall, the econometric analysis has led to the following key findings:
➔ IPR owners perform better than non-owners. Overall, revenue per employee is approximately 55% higher for IPR owners than for firms that do not own IPRs. This relationship is particularly pronounced for SMEs. SMEs that own IPRs have 68% higher revenue per employee than SMEs that do not own any IPRs at all. In the case of large firms, revenue per employee is 18% higher for IPR owners than for non-owners.
➔ Increases in firm performance depend on the type and combination of IPRs. The highest revenue-per-employee increases are linked to combined trade mark/design and combined patent/trade mark/design owners: 63% and 60% respectively. Trade mark-only owners have 56% higher revenue per employee, patent-only owners 43%, and design-only owners 31%.
Although due care was applied in all phases of the research, some methodological choices, necessary in all applied research, may potentially bias the econometric results, as noted above.
Furthermore, it is important to note that although the econometric analysis was able to show a strong and significant correlation between the variables of interest, given the available data a causal link between IPR ownership and firm performance cannot be established. Previous studies (O’Mahony and Vecchi, 2009; Marrocu et al., 2011) have shown that there is a positive influence of intangible assets on firm performance. Intangible assets can be protected by formal, registered IPRs or by other informal forms of protection that did not manifest themselves in the IPR registries. It is likely that firms that use formal IPR protection also invest more in intangible assets and innovate more than firms that do not use formal IPR protection.
In addition, it cannot be ruled out that the IPR measures in the models are correlated with some omitted variable representing the propensity to invest in intangible assets, which cannot be observed in the data. As a result of this possible omitted variable bias, IPR coefficients estimated in econometric models capture not only the effect of the use of formal IPRs for intangible assets protection, but also the positive effect of those intangible assets themselves. The result that the relationship is found to be stronger for SMEs than for large firms is consistent with this hypothesis. Most large firms rely in some way or another on intangible assets, whereas many smaller firms often build their business on tangible assets alone. Trade marks, designs and patents provide legal protection for specific, but not all, types of intangible asset. Hence, the group of large firms that do not own these particular forms of IPR may consist of firms that generate other types of intangible asset (e.g. copyright or trade secrets) and therefore exhibit high economic performance. In contrast, the group of SMEs that do not own trade marks, patents or designs is likely to consist of a large number of firms that do not own any intangible assets at all.
Back to contents
IPRs and firm performance: econometric analysis 53
An alternative reasoning suggesting a different causal relationship cannot be ruled out. The positive relationship between IPR ownership and performance could also stem from a possible impact of higher revenue per employee on the ownership of registered IPRs. Firms that already enjoy high revenue without using formal IPRs could decide to start using trade marks, patents or designs to protect their future returns and to secure income with enforceable and tradable rights.
Nonetheless, economic theory provides a number of arguments that can support the claim of the positive impact of IPRs on firm performance. IPRs provide incentives that increase a firm’s propensity to engage in innovative activity. By providing legal certainty, IPRs promote licensing activity and enable firms to increase their revenue without having to expand their production capabilities. Patents, trade marks and designs provide exclusive rights and thus reduce competi-tive pressure on their owners, potentially leading to higher revenue and profits. These hypotheses cannot, however, be exhaustively tested with the data at hand.
In addition to the models presented in this section, the Annex presents two additional sets of regressions that have been used to test the robustness of the results across different time periods and geographical areas. The first set divides the sample of firms according to the status of the country in which they have their principal place of business in the European Commission’s Innovation Scoreboard, in order to examine the influence of the home country’s innovation performance on the economic performance of its firms. It finds that the IPR ownership premium is particularly pronounced in countries which are classified as modest or moderate innovators, suggesting that firms which do innovate and protect their innovation with IPR have a particularly strong competitive advantage in such countries.
The second set of supplementary regressions attempts to disentangle the impact of macroeconomic conditions on the relationship between IPR ownership and company performance. This analysis finds that while the IPR ownership premium is somewhat affected by recessions, the effect is modest and does not change the main conclusions.
Back to contents
54 Conclusions
6. Conclusions
The main contribution of this study lies in the construction and subsequent analysis of a unique and very large dataset with financial information and IPR data at firm level.
The overarching result of this analysis is that ownership of IPRs, specifically patents, trade marks and designs, is strongly associated with improved economic performance at individual firm level. This association is especially strong in the case of SMEs.
In particular, the descriptive statistics in chapter 4 show that:
➔ First, revenue per employee for owners of IPRs (patents, trade marks and/or designs, national and/or European) is on average 20% higher than for non-owners of IPRs. This IPR ownership “revenue premium” is largest for patent owners at 36.3%, followed by design owners at 32.2%, and trade mark owners at 20.9% All the differences found are statistically significant, meaning that they are very unlikely to have come about purely by chance.
➔ Second, wages paid by IPR owners are on average 19.3% higher than those paid by firms that do not own IPRs. In this case, the “wage premium” is highest for patents (52.6%), followed by designs (29.7%) and trade marks (17.4%). Again, these differences are statistically significant.
➔ Third, a considerable number of firms (91.2%) do not own any of the three IPRs. Moreover, a greater proportion of SMEs than large firms are non-owners (91.3% of SMEs versus 44.4% of large firms). In other words, only 8.7% of SMEs own any of the three IPRs included in this study, but 55.6% of large firms do. This does not imply that 44.4% of large firms do not use IPRs in their commercial activities. They may use IPRs, but not be the formal owners. If they are part of a larger group structure, IPR ownership may be with other entities within the group.
➔ Fourth, there are noticeable differences among IPR-owning firms. On average, large firms own more rights than SMEs, independent of the type of right. Compared with large firms, SMEs tend to use national rights more often than European rights, and they have a relatively greater reliance on trade marks.
The econometric analysis in chapter 5 confirms and indeed strengthens the link between ownership of IPRs and the economic performance of firms. In particular, companies that own IPRs were found to have 55% higher revenue per employee than firms that do not own IPRs, supporting the indicative result from the descriptive statistics. Thus, while a cause-and-effect relationship has not been proven, there is a strong indication that such a relationship might exist.
Back to contents
Conclusions 55
Furthermore, this positive relationship between IPR ownership and revenue per employee is particularly strong for SMEs. As shown by the results reported in Figure 4, SMEs that own IPRs have 68% higher revenue per employee than SMEs that do not. In addition, these results hold for all three IPRs under study and for combinations of those IPRs. Across all individual IPRs and all combinations of IPRs, these performance premiums are larger in the case of SMEs than in the case of all firms (see Figure 5). Moreover, the fact that firms that own a combination of IPRs often perform even better than those that own just one of these rights is an indication that IPRs complement each other. This “combination bonus” is again particularly large for SMEs.
These results confirm the evidence concerning the importance of IP rights for economic performance found in previous studies published by the EPO and the EUIPO. The 2013, 2016 and 2019 studies (EPO/OHIM, 2013; EPO/EUIPO, 2016; EPO/EUIPO, 2019) consistently showed that IPR-intensive industries make a substantial contribution to the economy of the EU, while the first firm-level study published by the EUIPO (OHIM) in 2015 (OHIM, 2015) indicated the positive relationship between firm performance and ownership of IPRs, based on a sample from 12 EU Member States. The EPO/EUIPO study of high-growth firms published in 2019 showed that SMEs that apply for a trade mark, patent or registered design are more likely than other SMEs to experience high growth in subsequent years.
The present study improves on the 2015 study by including data from all the EU Member States and by revising the econometric methodology to take into account additional relevant factors. The findings that emerge make an even stronger case for the positive relationship between IPR activity and the performance of firms, particularly the smaller firms that are the backbone of Europe’s economy.
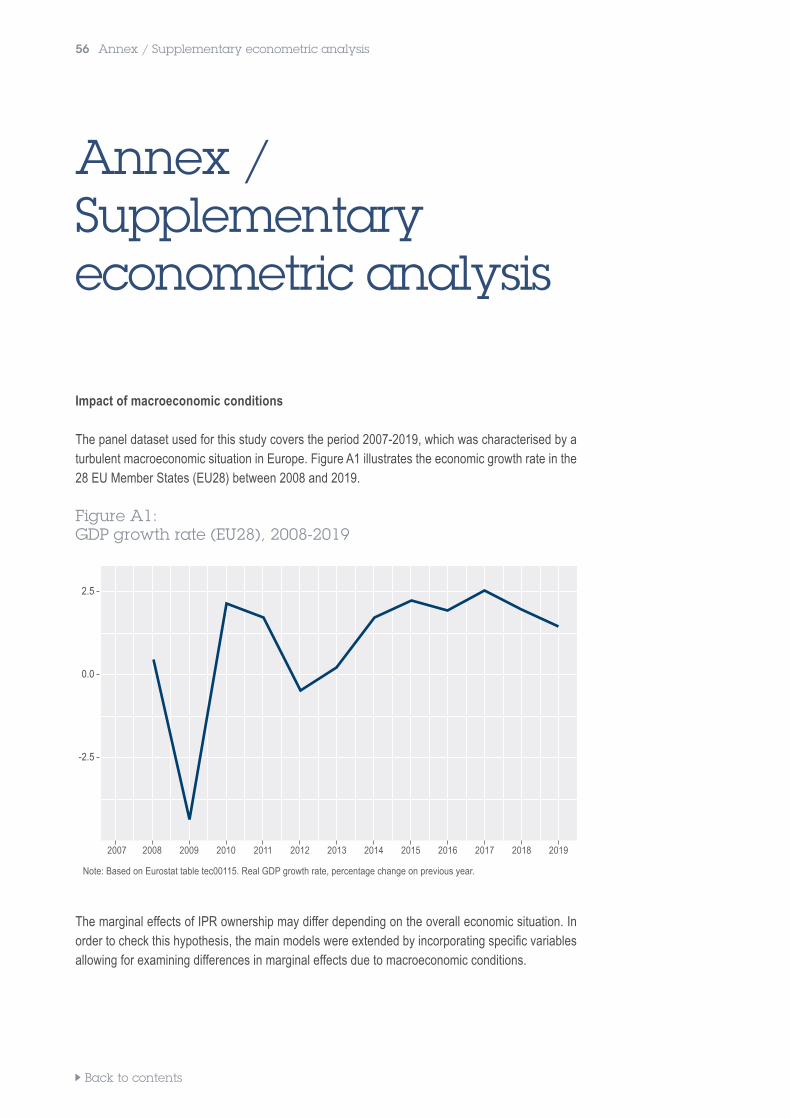
Back to contents
56 Annex / Supplementary econometric analysis
Annex / Supplementary econometric analysis
Impact of macroeconomic conditions
The panel dataset used for this study covers the period 2007-2019, which was characterised by a turbulent macroeconomic situation in Europe. Figure A1 illustrates the economic growth rate in the 28 EU Member States (EU28) between 2008 and 2019.
Figure A1: GDP growth rate (EU28), 2008-2019
2.5
0.0
-2.5
2007 2008 2009 2010 2011 2012 2013 2014 2015 2016 2017 2018 2019
Note: Based on Eurostat table tec00115. Real GDP growth rate, percentage change on previous year.
The marginal effects of IPR ownership may differ depending on the overall economic situation. In order to check this hypothesis, the main models were extended by incorporating specific variables allowing for examining differences in marginal effects due to macroeconomic conditions.
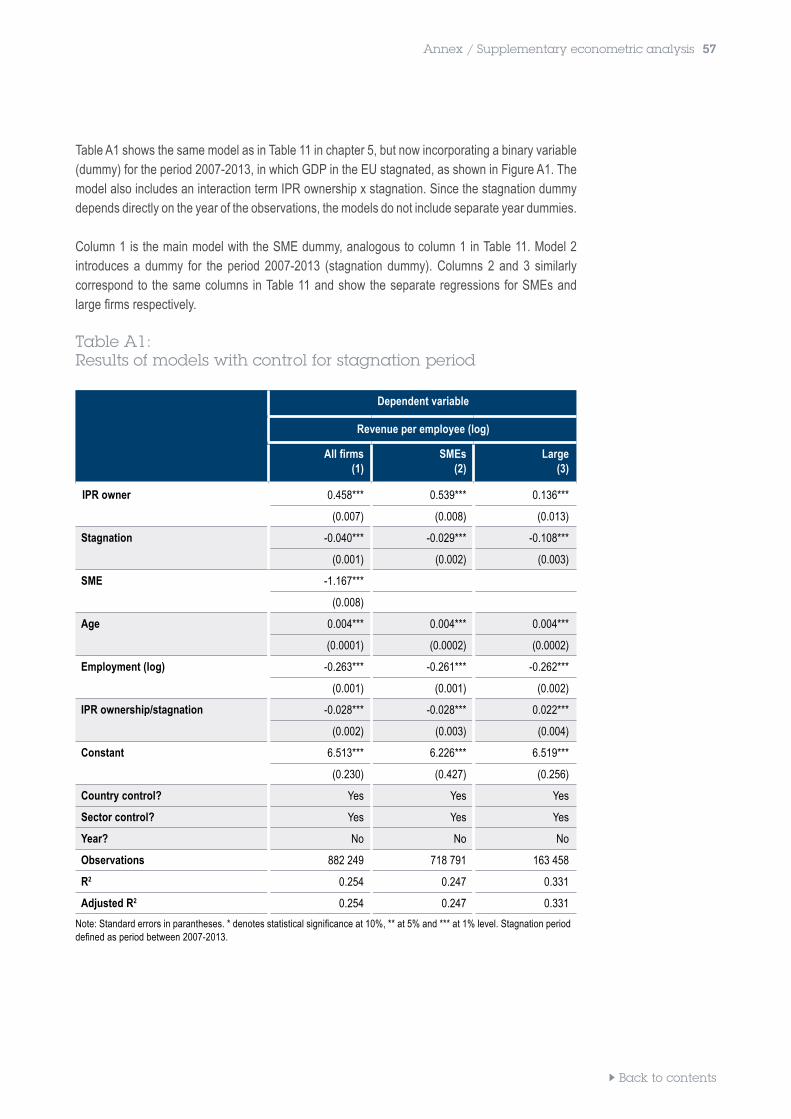
Back to contents
Annex / Supplementary econometric analysis 57
Table A1 shows the same model as in Table 11 in chapter 5, but now incorporating a binary variable (dummy) for the period 2007-2013, in which GDP in the EU stagnated, as shown in Figure A1. The model also includes an interaction term IPR ownership x stagnation. Since the stagnation dummy depends directly on the year of the observations, the models do not include separate year dummies.
Column 1 is the main model with the SME dummy, analogous to column 1 in Table 11. Model 2 introduces a dummy for the period 2007-2013 (stagnation dummy). Columns 2 and 3 similarly correspond to the same columns in Table 11 and show the separate regressions for SMEs and large firms respectively.
Table A1: Results of models with control for stagnation period
Dependent variable
Revenue per employee (log)
All firms(1)
SMEs(2)
Large(3)
IPR owner 0.458*** 0.539*** 0.136***
(0.007) (0.008) (0.013)
Stagnation -0.040*** -0.029*** -0.108***
(0.001) (0.002) (0.003)
SME -1.167***
(0.008)
Age 0.004*** 0.004*** 0.004***
(0.0001) (0.0002) (0.0002)
Employment (log) -0.263*** -0.261*** -0.262***
(0.001) (0.001) (0.002)
IPR ownership/stagnation -0.028*** -0.028*** 0.022***
(0.002) (0.003) (0.004)
Constant 6.513*** 6.226*** 6.519***
(0.230) (0.427) (0.256)
Country control? Yes Yes Yes
Sector control? Yes Yes Yes
Year? No No No
Observations 882 249 718 791 163 458
R2 0.254 0.247 0.331
Adjusted R2 0.254 0.247 0.331
Note: Standard errors in parantheses. * denotes statistical significance at 10%, ** at 5% and *** at 1% level. Stagnation period defined as period between 2007-2013.
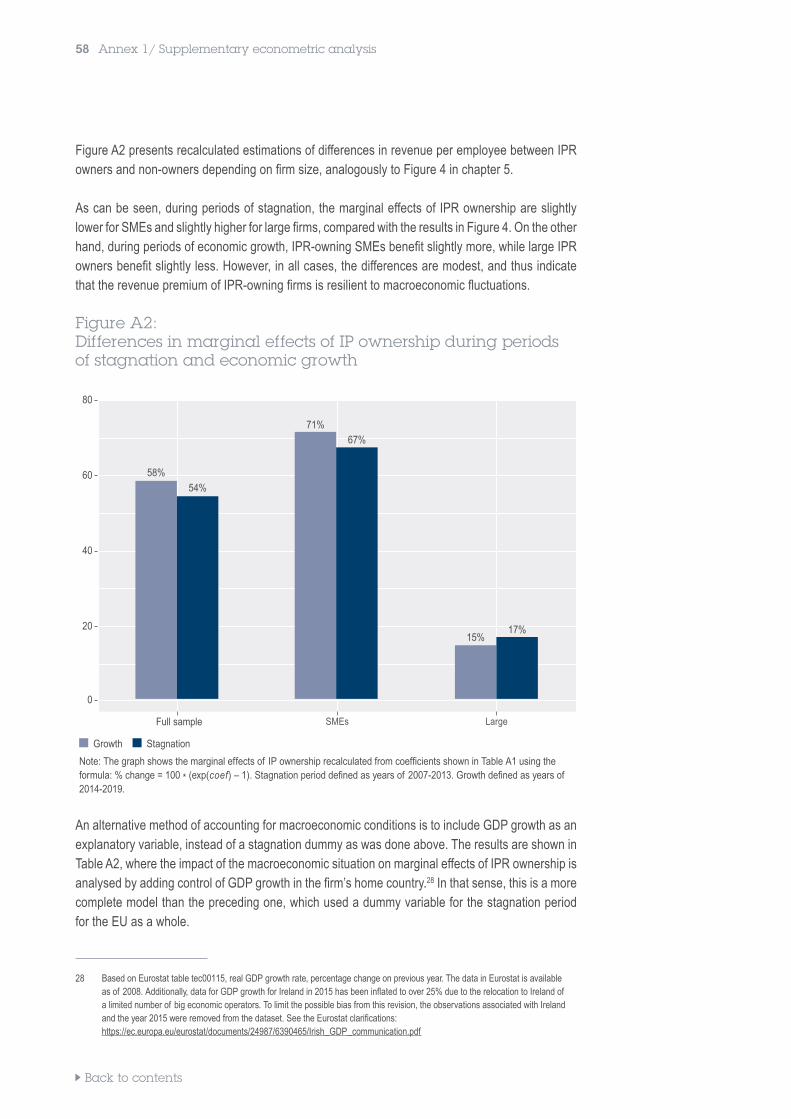
Back to contents
58 Annex 1 / Supplementary econometric analysis
Figure A2 presents recalculated estimations of differences in revenue per employee between IPR owners and non-owners depending on firm size, analogously to Figure 4 in chapter 5.
As can be seen, during periods of stagnation, the marginal effects of IPR ownership are slightly lower for SMEs and slightly higher for large firms, compared with the results in Figure 4. On the other hand, during periods of economic growth, IPR-owning SMEs benefit slightly more, while large IPR owners benefit slightly less. However, in all cases, the differences are modest, and thus indicate that the revenue premium of IPR-owning firms is resilient to macroeconomic fluctuations.
Figure A2: Differences in marginal effects of IP ownership during periods of stagnation and economic growth
80
60
40
20
0
Full sample SMEs Large
Growth Stagnation
Note: The graph shows the marginal effects of IP ownership recalculated from coefficients shown in Table A1 using the formula: % change = 100 * (exp(coef) – 1). Stagnation period defined as years of 2007-2013. Growth defined as years of 2014-2019.
An alternative method of accounting for macroeconomic conditions is to include GDP growth as an explanatory variable, instead of a stagnation dummy as was done above. The results are shown in Table A2, where the impact of the macroeconomic situation on marginal effects of IPR ownership is analysed by adding control of GDP growth in the firm’s home country.28 In that sense, this is a more complete model than the preceding one, which used a dummy variable for the stagnation period for the EU as a whole.
28 Based on Eurostat table tec00115, real GDP growth rate, percentage change on previous year. The data in Eurostat is available as of 2008. Additionally, data for GDP growth for Ireland in 2015 has been inflated to over 25% due to the relocation to Ireland of a limited number of big economic operators. To limit the possible bias from this revision, the observations associated with Ireland and the year 2015 were removed from the dataset. See the Eurostat clarifications: https://ec.europa.eu/eurostat/documents/24987/6390465/Irish_GDP_communication.pdf
58%54%
71%67%
15%17%
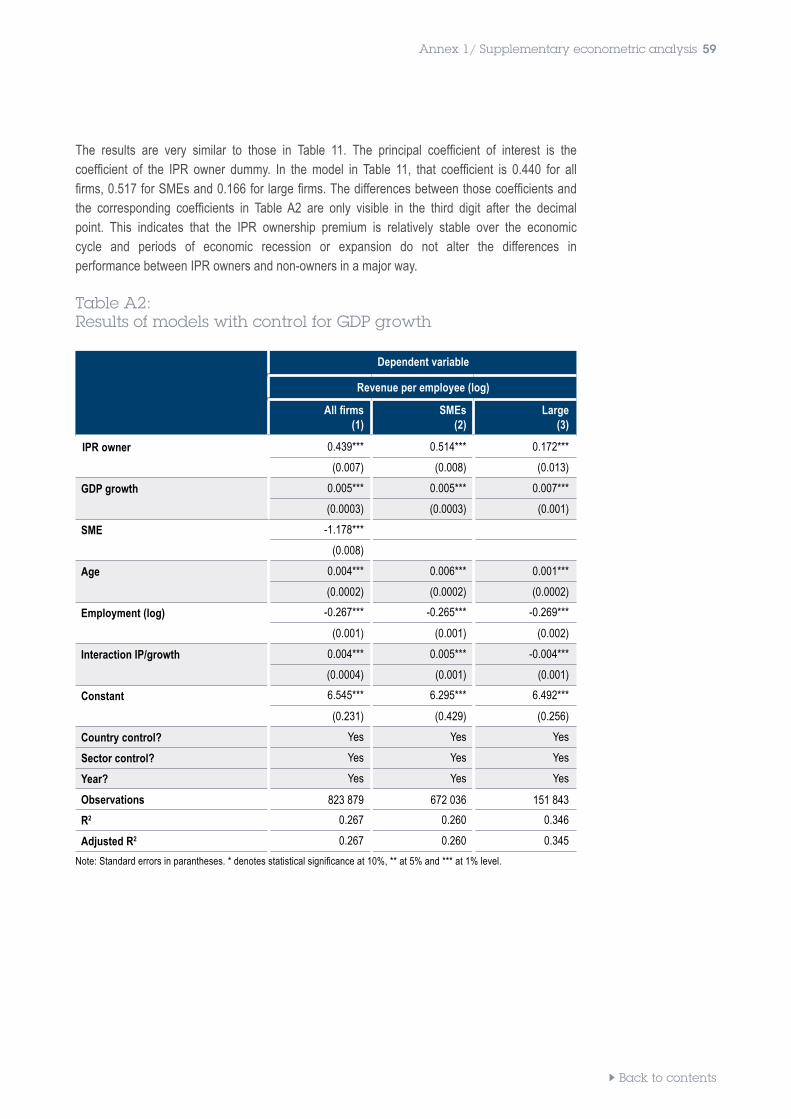
Back to contents
Annex 1/ Supplementary econometric analysis 59
The results are very similar to those in Table 11. The principal coefficient of interest is the coefficient of the IPR owner dummy. In the model in Table 11, that coefficient is 0.440 for all firms, 0.517 for SMEs and 0.166 for large firms. The differences between those coefficients and the corresponding coefficients in Table A2 are only visible in the third digit after the decimal point. This indicates that the IPR ownership premium is relatively stable over the economic cycle and periods of economic recession or expansion do not alter the differences in performance between IPR owners and non-owners in a major way.
Table A2: Results of models with control for GDP growth
Dependent variable
Revenue per employee (log)
All firms(1)
SMEs(2)
Large(3)
IPR owner 0.439*** 0.514*** 0.172***
(0.007) (0.008) (0.013)
GDP growth 0.005*** 0.005*** 0.007***
(0.0003) (0.0003) (0.001)
SME -1.178***
(0.008)
Age 0.004*** 0.006*** 0.001***
(0.0002) (0.0002) (0.0002)
Employment (log) -0.267*** -0.265*** -0.269***
(0.001) (0.001) (0.002)
Interaction IP/growth 0.004*** 0.005*** -0.004***
(0.0004) (0.001) (0.001)
Constant 6.545*** 6.295*** 6.492***
(0.231) (0.429) (0.256)
Country control? Yes Yes Yes
Sector control? Yes Yes Yes
Year? Yes Yes Yes
Observations 823 879 672 036 151 843
R2 0.267 0.260 0.346
Adjusted R2 0.267 0.260 0.345
Note: Standard errors in parantheses. * denotes statistical significance at 10%, ** at 5% and *** at 1% level.
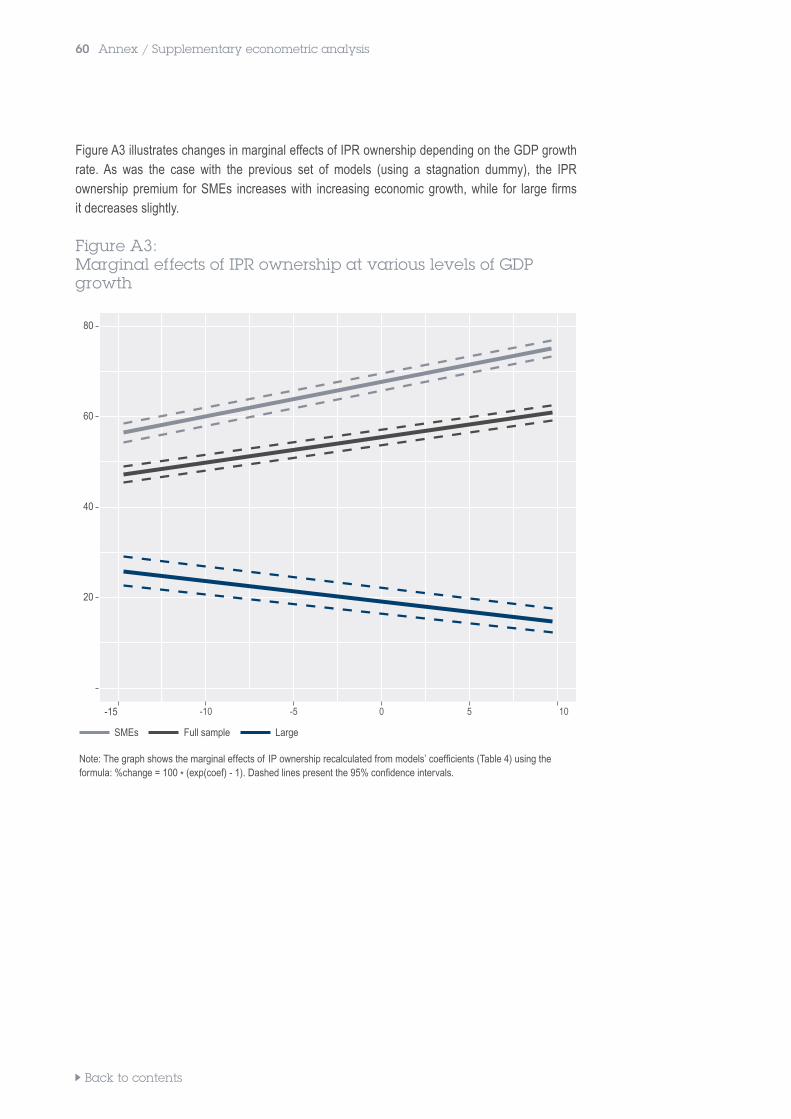
Back to contents
60 Annex / Supplementary econometric analysis
Figure A3 illustrates changes in marginal effects of IPR ownership depending on the GDP growth rate. As was the case with the previous set of models (using a stagnation dummy), the IPR ownership premium for SMEs increases with increasing economic growth, while for large firms it decreases slightly.
Figure A3: Marginal effects of IPR ownership at various levels of GDP growth
80
60
40
20
-15 -10 -5 0 5 10
SMEs Full sample Large
Note: The graph shows the marginal effects of IP ownership recalculated from models’ coefficients (Table 4) using the formula: %change = 100 * (exp(coef) - 1). Dashed lines present the 95% confidence intervals.
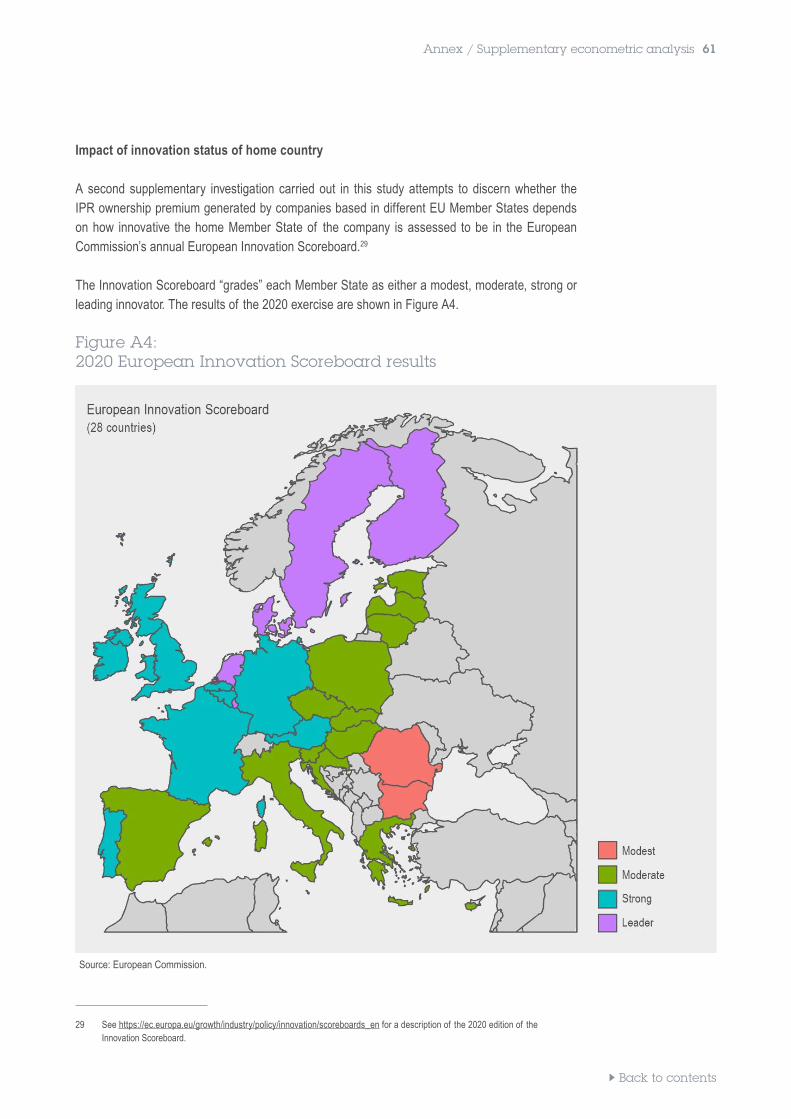
Back to contents
Annex / Supplementary econometric analysis 61
Impact of innovation status of home country
A second supplementary investigation carried out in this study attempts to discern whether the IPR ownership premium generated by companies based in different EU Member States depends on how innovative the home Member State of the company is assessed to be in the European Commission’s annual European Innovation Scoreboard.29
The Innovation Scoreboard “grades” each Member State as either a modest, moderate, strong or leading innovator. The results of the 2020 exercise are shown in Figure A4.
Figure A4: 2020 European Innovation Scoreboard results
Source: European Commission.
29 See https://ec.europa.eu/growth/industry/policy/innovation/scoreboards_en for a description of the 2020 edition of the Innovation Scoreboard.
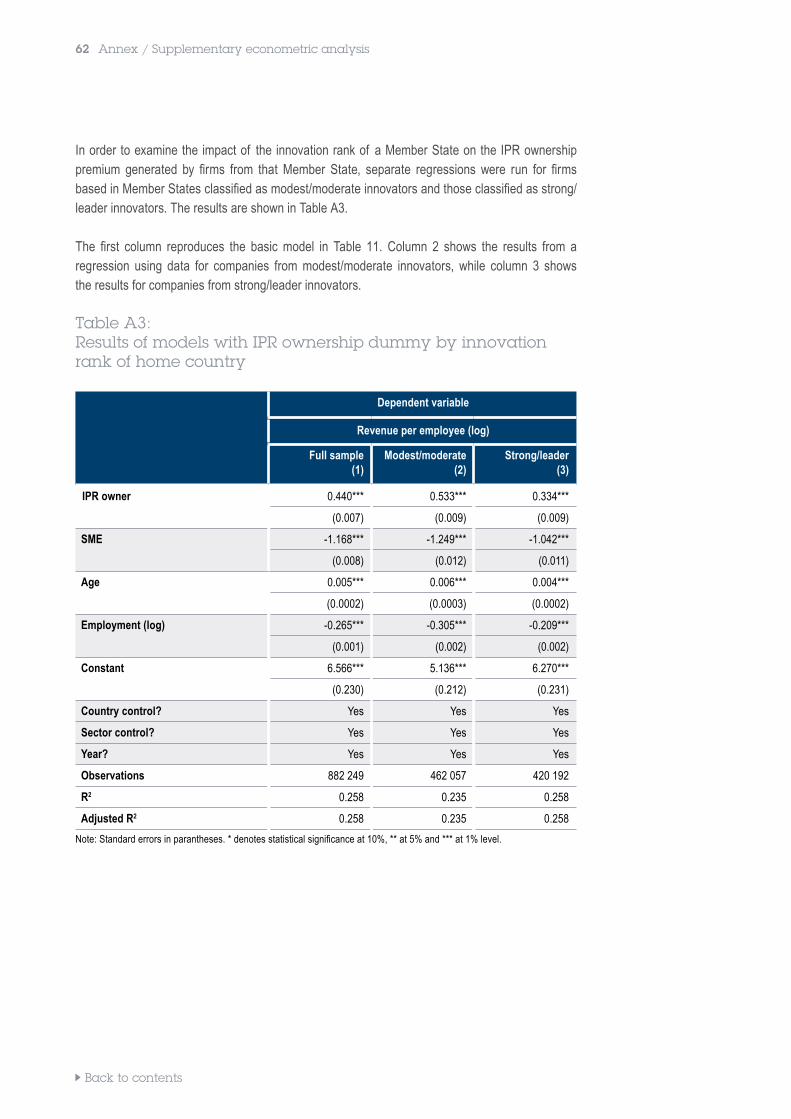
Back to contents
62 Annex / Supplementary econometric analysis
In order to examine the impact of the innovation rank of a Member State on the IPR ownership premium generated by firms from that Member State, separate regressions were run for firms based in Member States classified as modest/moderate innovators and those classified as strong/leader innovators. The results are shown in Table A3.
The first column reproduces the basic model in Table 11. Column 2 shows the results from a regression using data for companies from modest/moderate innovators, while column 3 shows the results for companies from strong/leader innovators.
Table A3: Results of models with IPR ownership dummy by innovation rank of home country
Dependent variable
Revenue per employee (log)
Full sample(1)
Modest/moderate(2)
Strong/leader(3)
IPR owner 0.440*** 0.533*** 0.334***
(0.007) (0.009) (0.009)
SME -1.168*** -1.249*** -1.042***
(0.008) (0.012) (0.011)
Age 0.005*** 0.006*** 0.004***
(0.0002) (0.0003) (0.0002)
Employment (log) -0.265*** -0.305*** -0.209***
(0.001) (0.002) (0.002)
Constant 6.566*** 5.136*** 6.270***
(0.230) (0.212) (0.231)
Country control? Yes Yes Yes
Sector control? Yes Yes Yes
Year? Yes Yes Yes
Observations 882 249 462 057 420 192
R2 0.258 0.235 0.258
Adjusted R2 0.258 0.235 0.258
Note: Standard errors in parantheses. * denotes statistical significance at 10%, ** at 5% and *** at 1% level.
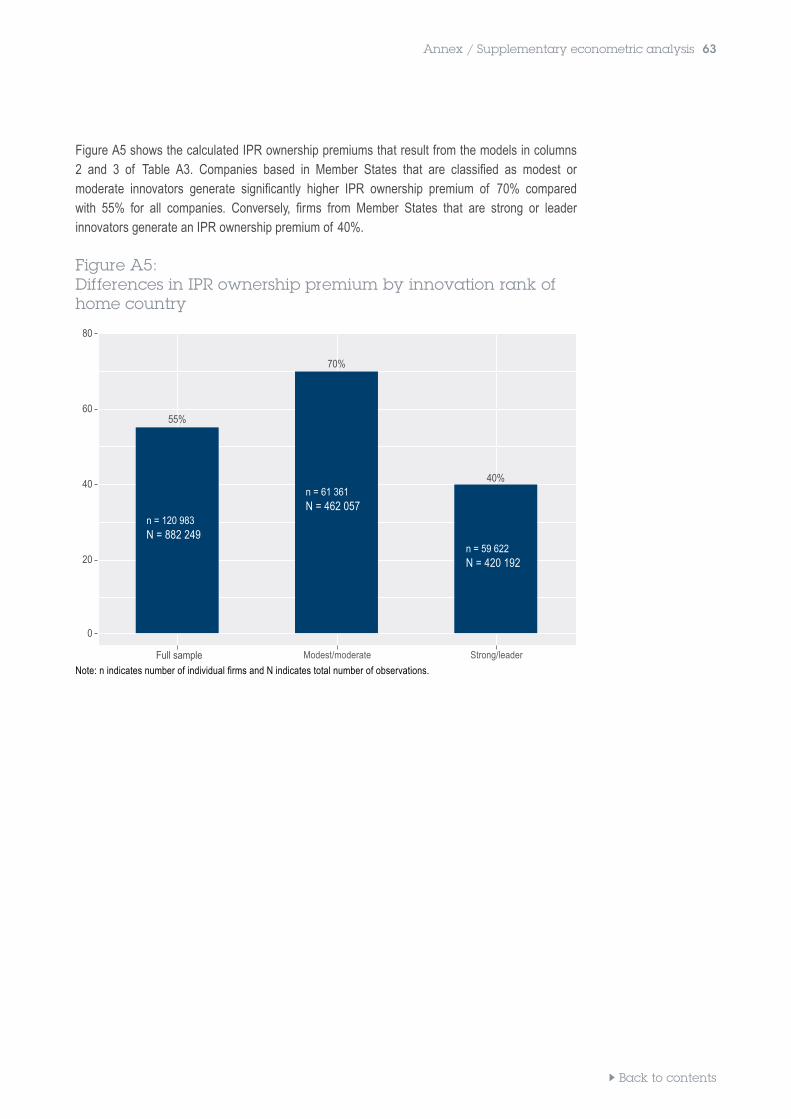
Back to contents
Annex / Supplementary econometric analysis 63
Figure A5 shows the calculated IPR ownership premiums that result from the models in columns 2 and 3 of Table A3. Companies based in Member States that are classified as modest or moderate innovators generate significantly higher IPR ownership premium of 70% compared with 55% for all companies. Conversely, firms from Member States that are strong or leader innovators generate an IPR ownership premium of 40%.
Figure A5: Differences in IPR ownership premium by innovation rank of home country
80
60
40
20
0
Full sample Modest/moderate Strong/leader
Note: n indicates number of individual firms and N indicates total number of observations.
55%
n = 120 983N = 882 249
70%
n = 61 361 N = 462 057
40%
n = 59 622 N = 420 192
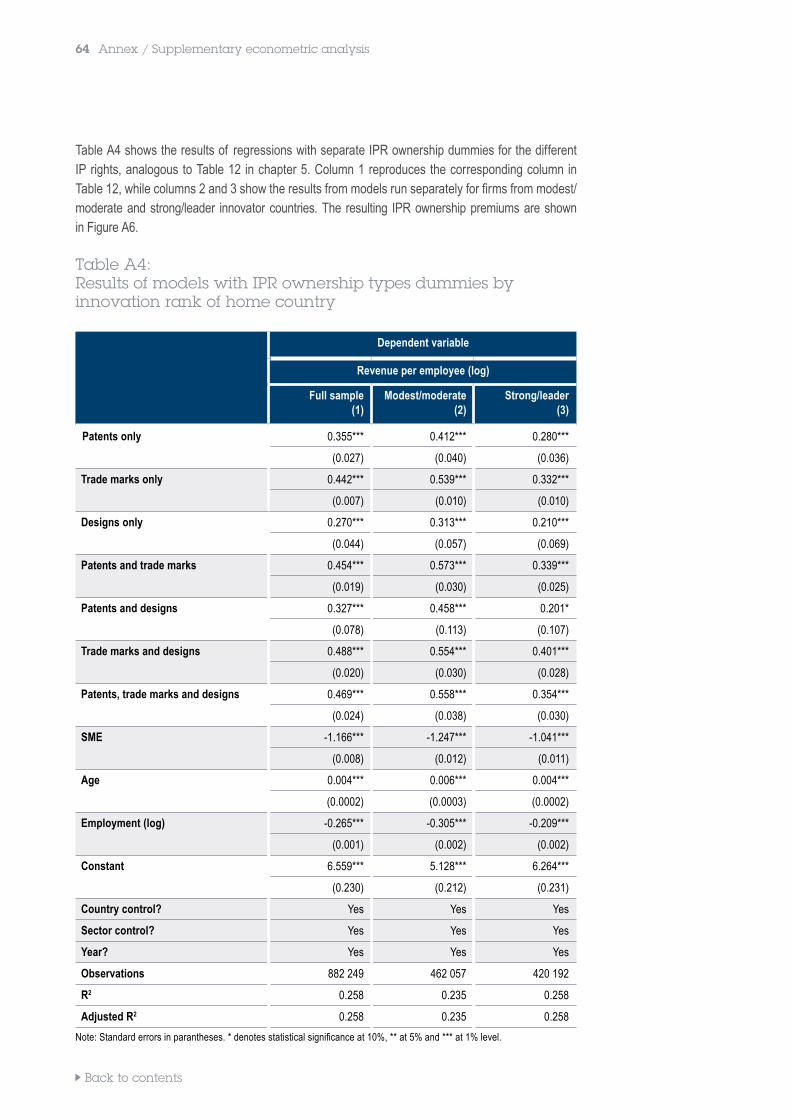
Back to contents
64 Annex / Supplementary econometric analysis
Table A4 shows the results of regressions with separate IPR ownership dummies for the different IP rights, analogous to Table 12 in chapter 5. Column 1 reproduces the corresponding column in Table 12, while columns 2 and 3 show the results from models run separately for firms from modest/moderate and strong/leader innovator countries. The resulting IPR ownership premiums are shown in Figure A6.
Table A4: Results of models with IPR ownership types dummies by innovation rank of home country
Dependent variable
Revenue per employee (log)
Full sample(1)
Modest/moderate(2)
Strong/leader(3)
Patents only 0.355*** 0.412*** 0.280***
(0.027) (0.040) (0.036)
Trade marks only 0.442*** 0.539*** 0.332***
(0.007) (0.010) (0.010)
Designs only 0.270*** 0.313*** 0.210***
(0.044) (0.057) (0.069)
Patents and trade marks 0.454*** 0.573*** 0.339***
(0.019) (0.030) (0.025)
Patents and designs 0.327*** 0.458*** 0.201*
(0.078) (0.113) (0.107)
Trade marks and designs 0.488*** 0.554*** 0.401***
(0.020) (0.030) (0.028)
Patents, trade marks and designs 0.469*** 0.558*** 0.354***
(0.024) (0.038) (0.030)
SME -1.166*** -1.247*** -1.041***
(0.008) (0.012) (0.011)
Age 0.004*** 0.006*** 0.004***
(0.0002) (0.0003) (0.0002)
Employment (log) -0.265*** -0.305*** -0.209***
(0.001) (0.002) (0.002)
Constant 6.559*** 5.128*** 6.264***
(0.230) (0.212) (0.231)
Country control? Yes Yes Yes
Sector control? Yes Yes Yes
Year? Yes Yes Yes
Observations 882 249 462 057 420 192
R2 0.258 0.235 0.258
Adjusted R2 0.258 0.235 0.258
Note: Standard errors in parantheses. * denotes statistical significance at 10%, ** at 5% and *** at 1% level.
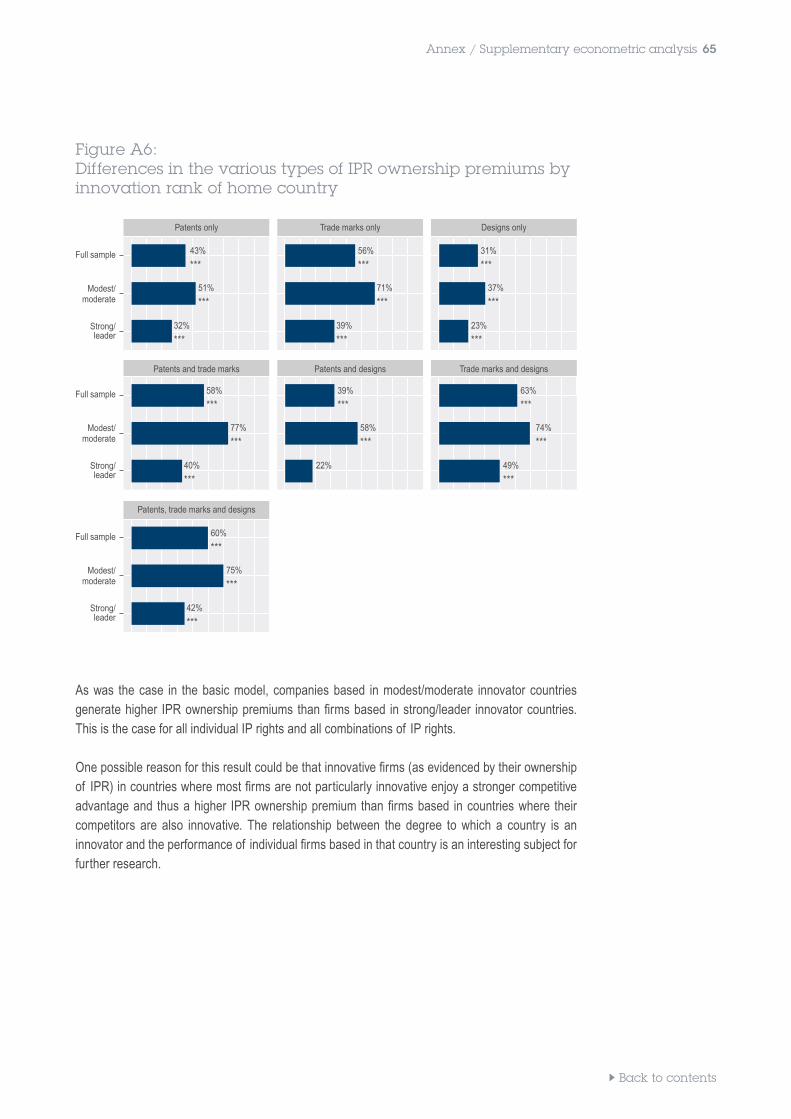
Back to contents
Annex / Supplementary econometric analysis 65
Figure A6: Differences in the various types of IPR ownership premiums by innovation rank of home country
Patents only Trade marks only Designs only
Full sample
Modest/moderate
Strong/ leader
Patents and trade marks Patents and designs Trade marks and designs
Full sample
Modest/moderate
Strong/ leader
As was the case in the basic model, companies based in modest/moderate innovator countries generate higher IPR ownership premiums than firms based in strong/leader innovator countries. This is the case for all individual IP rights and all combinations of IP rights.
One possible reason for this result could be that innovative firms (as evidenced by their ownership of IPR) in countries where most firms are not particularly innovative enjoy a stronger competitive advantage and thus a higher IPR ownership premium than firms based in countries where their competitors are also innovative. The relationship between the degree to which a country is an innovator and the performance of individual firms based in that country is an interesting subject for further research.
Patents, trade marks and designs
Full sample
Modest/moderate
Strong/ leader
43%
***56%
***31%
***
51%
***71%
***37%
***
32%
***39%
***23%
***
58%
***
60%
***
39%
***63%
***
77%
***
75%
***
58%
***74%
***
40%
***
42%
***
22% 49%
***
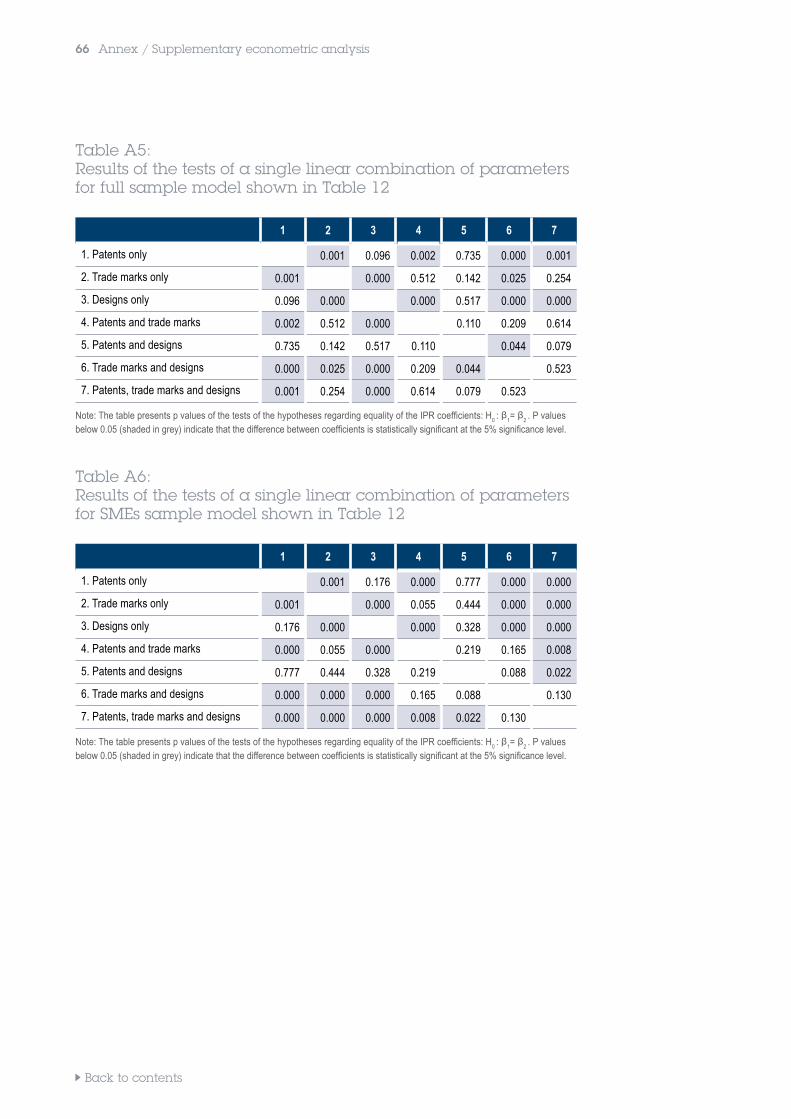
66 Imprint
Back to contents
66 Annex / Supplementary econometric analysis
Table A5: Results of the tests of a single linear combination of parameters for full sample model shown in Table 12
1 2 3 4 5 6 7
1. Patents only 0.001 0.096 0.002 0.735 0.000 0.001
2. Trade marks only 0.001 0.000 0.512 0.142 0.025 0.254
3. Designs only 0.096 0.000 0.000 0.517 0.000 0.000
4. Patents and trade marks 0.002 0.512 0.000 0.110 0.209 0.614
5. Patents and designs 0.735 0.142 0.517 0.110 0.044 0.079
6. Trade marks and designs 0.000 0.025 0.000 0.209 0.044 0.523
7. Patents, trade marks and designs 0.001 0.254 0.000 0.614 0.079 0.523
Note: The table presents p values of the tests of the hypotheses regarding equality of the IPR coefficients: H0 : ᵝ1
= ᵝ2 . P values
below 0.05 (shaded in grey) indicate that the difference between coefficients is statistically significant at the 5% significance level.
Table A6: Results of the tests of a single linear combination of parameters for SMEs sample model shown in Table 12
1 2 3 4 5 6 7
1. Patents only 0.001 0.176 0.000 0.777 0.000 0.000
2. Trade marks only 0.001 0.000 0.055 0.444 0.000 0.000
3. Designs only 0.176 0.000 0.000 0.328 0.000 0.000
4. Patents and trade marks 0.000 0.055 0.000 0.219 0.165 0.008
5. Patents and designs 0.777 0.444 0.328 0.219 0.088 0.022
6. Trade marks and designs 0.000 0.000 0.000 0.165 0.088 0.130
7. Patents, trade marks and designs 0.000 0.000 0.000 0.008 0.022 0.130
Note: The table presents p values of the tests of the hypotheses regarding equality of the IPR coefficients: H0 : ᵝ1
= ᵝ2 . P values
below 0.05 (shaded in grey) indicate that the difference between coefficients is statistically significant at the 5% significance level.
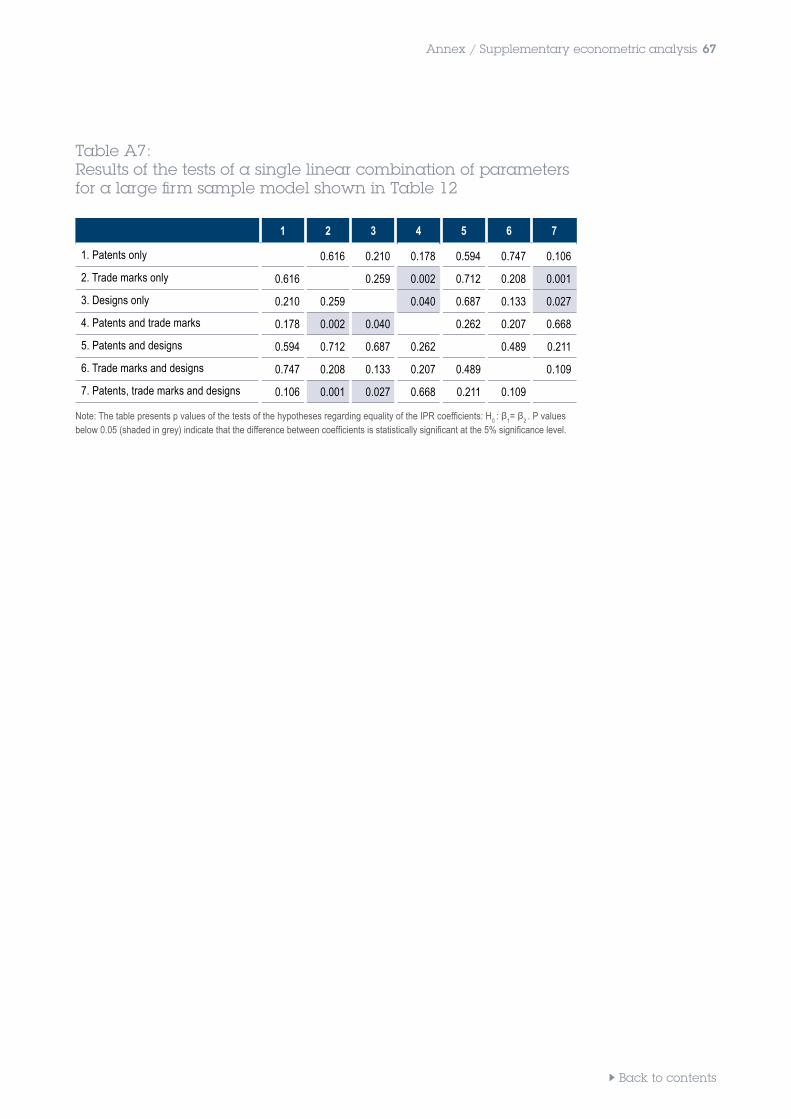
Foreword 67
Back to contents
Annex / Supplementary econometric analysis 67
Table A7: Results of the tests of a single linear combination of parameters for a large firm sample model shown in Table 12
1 2 3 4 5 6 7
1. Patents only 0.616 0.210 0.178 0.594 0.747 0.106
2. Trade marks only 0.616 0.259 0.002 0.712 0.208 0.001
3. Designs only 0.210 0.259 0.040 0.687 0.133 0.027
4. Patents and trade marks 0.178 0.002 0.040 0.262 0.207 0.668
5. Patents and designs 0.594 0.712 0.687 0.262 0.489 0.211
6. Trade marks and designs 0.747 0.208 0.133 0.207 0.489 0.109
7. Patents, trade marks and designs 0.106 0.001 0.027 0.668 0.211 0.109
Note: The table presents p values of the tests of the hypotheses regarding equality of the IPR coefficients: H0 : ᵝ1
= ᵝ2 . P values
below 0.05 (shaded in grey) indicate that the difference between coefficients is statistically significant at the 5% significance level.
68 Imprint
Back to contents
References
Arora, A., Ceccagnoli, M. and Cohen, W. M. (2008). R&D and the patent premium. International journal of industrial organization, 26(5), 1153-1179.
Blind, K., Edler, J., Frietsch, R. and Schmoch, U. (2006). Motives to patent: Empirical evidence from Germany. Research Policy, 35, 655–672.
Brand Finance (2019), “The Global Intangible Finance Tracker (GIFT)”.
Crass, D. and Peters, B. (2014). Intangible assets and firm-level productivity. ZEW-Centre for European Economic Research Discussion Paper (14-120).
Crass, D. (2014). The impact of brand use on innovation performance–Empirical results for Germany. ZEW-Centre for European Economic Research Discussion Paper (14-119).
Czarnitzki, D., Hussinger K. and Leten, B. (2020). How Valuable are Patent Blocking Strategies? Review of Industrial Organization 56(3): 409-434.
European Commission. (2020). An SME Strategy for a sustainable and digital Europe. Communication from the Commission to the European Parliament, The Council, The European Economic and Social Committee and the Committee of the Regions. COM(2020) 103 final. European Commission (2020). European Innovation Scoreboard 2020.
European Patent Office (EPO) and Office for Harmonization in the Internal Market (OHIM) (2013). Intellectual property rights intensive industries: contribution to economic performance and employment in the European Union.
European Patent Office (EPO) and European Union Intellectual Property Office (EUIPO) (2016). Intellectual property rights intensive industries: contribution to economic performance and employment in the European Union.
European Patent Office (EPO) and European Union Intellectual Property Office (EUIPO) (2019a). High-growth firms and intellectual property rights.
European Patent Office (EPO) and European Union Intellectual Property Office (EUIPO) (2019b). Intellectual property rights intensive industries: contribution to economic performance and employment in the European Union.
European Union Intellectual Property Office (EUIPO) (2017a). Private Costs of Enforcement of IPR.
68 References
Foreword 69
Back to contents
European Union Intellectual Property Office (EUIPO) (2017b). Protecting Innovation through Trade Secrets and Patents — Determinants for European Union Firms.
European Union Intellectual Property Office (EUIPO) (2019). 2019 Intellectual Property SME Scoreboard.
European Union Intellectual Property Office (EUIPO) (2020). Use of IPR bundles by EU firms 2014-2015.
Greenhalgh, C. and Rogers, M. (2012). Trade marks and performance in services and manufacturing firms: Evidence of Schumpeterian competition through innovation. Australian Economic Review, 45(1), 50-76.
Guellec, D., Martinez, C. and Zuniga, P. (2012). Pre-emptive patenting: securing market exclusion and freedom of operation. Economics of Innovation and New Technology, 21(1), 1-29.
Hall, B., Helmers, C., Rogers, M. and Sena, V. (2014). The choice between formal and informal intellectual property: a review. Journal of Economic Literature, 52(2), 375-423.
Llerena, P. and Millot, V. (2020). Are two better than one? Modelling the complementarity between patents and trademarks across industries. Industry and Innovation, 27(1-2), 52-79.
Magerman, T., Van Looy, B. and Song, X. (2006). Data production methods for harmonized patent statistics : Patentee name harmonization. K.U.Leuven - Faculty of Economics and Applied Economics.
Munari, F. (2012). Review of the Literature on the Use and Impact of IPRs at the Firm Level: Patents, Trade Marks, and Designs”, Working Paper commissioned by OHIM.
Office for Harmonization in the Internal Market (OHIM) (2015), Intellectual property rights and firm performance in Europe, June 2015.
Romer, P. M. (1990). Endogenous technological change. Journal of political Economy, 98(5, Part 2), S71-S102.
Schautschick, P.and Greenhalgh, C. (2016). Empirical studies of trade marks–the existing economic literature. Economics of innovation and new technology, 25(4), 358-390.
Schilling, M. A. and Shankar, R. (2019). Strategic management of technological innovation. McGraw-Hill Education.
Scotchmer, S. (2004). Innovation and Incentives. MIT
Thoma, G. (2020). The valuation of patent-trademark pairing as IP strategy: evidence from the USPTO, Industry and Innovation, 27:1-2, 80-104
Wooldridge, J. (2013). Introductory Econometrics. A modern approach. 5th edition, South-Western Cengage Learning.
References 69
Published and edited by the EPO and the EUIPOMunich, Germany, and Alicante, Spain© EPO and EUIPO, 2021www.epo.orgwww.euipo.europa.eu
The full report can be downloaded at:www.epo.org/ipr-performancewww.euipo.europa.eu/ipr-performance
ISBN: 978-3-89605-263-6