Embed Size (px)
Citation preview
Intelligence and the Wealth and Poverty of NationsRICHARD LYNN
University of Ulster, Coleraine, Northern Ireland
TATU VANHANENUniversity of Helsinki, Finland
SUMMARY.
National IQs assessed by the Progressive Matrices were calculated for 60 nations andexamined in relation to per capita incomes in the late 1990s and to post World War Two rates ofeconomic growth. It was found that national IQs are correlated at 0.757 with real GDP (GrossDomestic Product) per capita 1998 and 0.706 with per capita GNP (Gross National Product)1998; and at 0.605 with the growth of per capita GDP 195090 and 0.643 with growth of percapita GNP 197698. The results are interpreted in terms of a causal model in which populationIQs are the major determinant of the wealth and poverty of nations in the contemporary world.
INTRODUCTION
The causes of the inequalities in income and wealth between nations have been discussed forsome two and a half centuries. In 1748 Montesquieu published De l'Esprit des Lois in which heproposed that temperate climates were more favorable to economic development than tropicalclimates. In 1776 this problem was discussed by Adam Smith in his Wealth of Nations, in whichhe proposed that the skills of the population are the principal factor responsible for nationaldifferences in incomes and wealth.Since these early attempts to analyse this problem, numerous other theories have beenadvanced. These theories fall into four principal categories. First, climatic theories are stillproposed. Their leading exponent in recent times is Kamarck (1976) who argues that tropicalclimates are unfavorable for economic development because the heat and humidity reduce theefficiency of working capacities, impair the productivity of the land and provide a favorableenvironment for debilitating diseases. This explains the difference between what is sometimescalled "the rich north" with its temperate climate and "the poor south" with its predominantlytropical climate.Diamond (1998) presents similar arguments on the crucial significance of climatic andgeographical factors.The second major contemporary explanation is "dependency theory". This proposes that theeconomically developed capitalist nations are responsible for the poverty of the underdevelopednations because they dominate the world economy, force the rest of the world into economicdependency, and pay low prices for Third World agricultural products and natural resources.Some of the leading exponents of this theory are Frank (1969, 1996), dos Santos (1993, 1996),Wallerstein (1998) and Valenzuela and Valenzuela (1998); see also Seligson and PassŽSmith(1998).Third, there is the neoliberal theory. This proposes that the major factor responsible for nationaldifferences in economic development consists of the presence of free markets as opposed tocommand, socialist and communist economies. Bates (1993) and Weede (1993) are leadingrecent exponents of this theory.Fourth, there are a variety of psychological theories which argue for the importance ofdifferences in attitudes, values and motivations. The first major theory of this kind was Weber's(1904) theory that the Protestant work ethic explained the more rapid economic development ofnorthern Europe as compared with the Catholic south from the sixteenth century onwards. Latertheorists in this tradition include McClelland (1976) who advanced the similar concept of
achievement motivation. Several economists, while not endorsing the theories of Weber orMcClelland, are sympathetic to this kind of explanation and propose what are generally termed"cultural" factors as major contributors to national differences in economic development. Landeswrites of the importance of culture "in the sense of inner values and attitudes that guide apopulation" (1998, p. 516). Many economists have taken eclectic positions in which they arguethat several of these factors contribute to national differences in incomes and wealth.We believe it has never been suggested that national differences in intelligence might playsome role in national differences in economic development. It is widely assumed that thepeoples of all nations have the same average level of intelligence. For instance, Kofi Annan, theUnited Nations Secretary General, asserted in April 2000 that intelligence "is one commodityequally distributed among the world's people" (Hoyos and Littlejohns, 2000). It is known inpsychology that this is incorrect and that there are large differences in average levels ofintelligence between different nations. Reviews of the literature have shown that in relation toaverage IQs of 100 in Britain and the United States, the peoples of north east Asia haveaverage IQs of around 105 and the peoples of subSaharan Africa have average IQs of around70 (Lynn, 1991).In view of these differences, it seems a reasonable hypothesis that national differences inintelligence may be a factor contributing to national differences in wealth. This is a promisinghypothesis for two reasons. First, it is well established that intelligence is a determinant ofearnings among individuals; and second, several studies have shown that the intelligence ofgroups is related to their average earnings. The earlier American research literature, up to 1970,on the relationship of intelligence to earnings among individuals was summarized by Jencks(1972) who concluded that the best estimate was expressed by a correlation of .35. Laterstudies have confirmed this conclusion. Brown and Reynolds (1995) examined the relationbetween IQ measured in early adulthood and earnings approximately 12 years later for samplesof 24,819 whites and 4,008 blacks and reported correlations of .327 and .126, respectively.Hunter and Hunter (1984) report correlations between .25 and .60 for different types ofoccupations. Murray (1998) has examined the National Longitudinal Study of Youth sample forthe relation between IQ measured in adolescence and income in the late twenties to midthirtiesand found a correlation of .37. Most students of this question have concluded that IQ is a causeof income because IQs are established quite early in childhood and predict incomes achieved inadulthood (Duncan, Featherman and Duncan, 1972; Jensen, 1998). It is estimated by Li (1975)that childhood IQ is correlated .83 with adult IQ. The relation between childhood IQ and adultincome is present when parental socioeconomic status is controlled (Duncan, Featherman andDuncan, 1972; Jencks, 1979).The positive association between IQ and income among individuals led to the expectation thatthere would be positive associations between the average IQs of groups and their averageearnings. We believe that the existence of such an association was first reported by Davenportand Remmers (1950) in a study in which the population units were the states of the UnitedStates. They obtained IQ scores from tests administered in 1943 to more than 300,000 youngmen in high schools and colleges as part of selection for placement in training programs for thearmed services. The test was composed of verbal, mathematical and scientific items and wasdescribed as "a combination of a group intelligence test and a general educational achievementtest" (p. 110). They calculated the average score for each state, examined this in relation to thestate's per capita income and found a correlation of .81.The positive relationship between the average IQs of groups and their average incomes hasalso been found in studies carried out in Europe. A study of the British Isles examined therelation between average IQs in thirteen regions obtained in the 1940s and 1950s and percapita incomes in 1965. The average IQs fell within the relatively narrow range between 102.1in London and 96.0 in Ireland. The correlation between average IQs and incomes was .73(Lynn, 1979). A similar study for France examined the relation between average IQs in 90"departments" (regions) obtained from testing approximately 257,000 young men conscripted

into the armed services in the mid1950s and per capita incomes in 1974. The correlationbetween IQs and earnings was .61 (Lynn, 1980). The same relationship has been found inSpain in a study in which average IQs for 48 regions were calculated from approximately130,000 military conscripts for the mid1960s. The correlation between these and averageregional incomes was .65 (Lynn, 1981). In view of these relationships it seems a promisinghypothesis that a positive relationship would be present between the average IQs of thepopulations of nations and their average earnings. It is this hypothesis that we are now about toinvestigate.
METHOD
This study presents data for 60 countries for national IQs, per capita incomes in 1998, andeconomic growth 19501998 and examines their relationships by the statistical techniques ofcorrelation and regression analyses.
National IQs
National IQs have been calculated from normative data obtained in 60 countries for the Coloredand Standard Progressive Matrices. The reasons for using these data are that the ProgressiveMatrices is the most widely used test in crosscultural research, is nonverbal and hence is likelyto yield more valid cross cultural data than verbal tests which require translation, is among thebest measures of g, and the rate of secular increase is well established. The data have beenobtained from the bibliographies of Progressive Matrices studies compiled by Court (1980) andCourt and Raven (1995), from the data given by Raven in a series of manuals and researchsupplements for the Progressive Matrices, and from the Raven archive.The Standard Progressive Matrices was constructed in Britain in the 1930s and was firstpublished in 1938 with norms for 615 year olds and adults. This was followed by the publicationin 1947 of the Colored Progressive Matrices, a simpler test suitable for 511 year olds. TheStandard Progressive Matrices was renormed for 6 to 15 year olds in Britain 1979. A norm tableis provided by Raven (1981) giving percentile equivalents of raw scores for half year agegroups. The procedure for calculating the IQ of a country in which norms have been obtainedfor the Standard Progressive Matrices is to read off the raw scores of the 50th percentile fromthe norm table and obtain the British 1979 percentile. This is then converted to the British IQequivalent using a conversion table. The raw score of the 50th percentile is the median IQrather than the mean. Several studies have provided mean raw scores in addition to themedians and these show that means and medians are virtually identical. In most countries inwhich Progressive Matrices data have been collected norms have been given for a number ofage groups. IQs are calculated for each of these and averaged to give a single national IQ. ThisIQ is then adjusted for the secular rise of the IQ which has been 2 IQ points per decade for theStandard Progressive Matrices in Britain over the period 19381979 (Lynn and Hampson,1986). All national IQs are therefore expressed in relation to a British IQ of 100.Norms for the Standard Progressive were collected for adults for Britain in 1992 and for theUnited States for 1993. The norm table for the United States provided by Raven, Court andRaven (1996) gives the most detailed information consisting of the percentile equivalents of rawscores. Less information is provided for the British standardization which gives only the rawscore equivalents of the 5th, 10th, 25th, 50th, 75th, 90th and 95th percentiles. The Britishmedians have been converted to American IQs by the use of the American norm table. Theresult of this calculation is that the British IQ is 102 on the American norms. Data for adults fromother countries are converted to American IQs and then adjusted to British IQs by thesubtraction of 2 IQ points.There are no norms giving detailed percentiles for the Colored Progressive Matrices for Britain,the United States or elsewhere. To deal with data for the Colored Progressive Matrices, rawscores are converted to those of the Standard Progressive Matrices using the conversion tableprovided by Raven, Court and Raven (1995) and the IQs calculated in the way set out above.In a few instances median raw scores fall below the 1st percenti le of the British and Americannorm tables. The 1st percentile is equivalent to an IQ of 65. In these cases the countries areassigned an IQ of 64. For a number of countries Progressive Matrices data have been collectedfor two or more samples. These have been averaged to provide a single mean given to thenearest whole number.
The IQ for South Africa has been calculated as follows. The study by Owen (1992) gives thefollowing IQs for the four racial groups. Whites: 94; blacks: 66; coloureds: 82; Indians: 83. Thepercentages of the four groups in the population are whites: 14%; blacks: 75%; coloreds: 9%;Indians: 2% (Ramsay, 1999, p. 158). Weighting the IQs of the four groups by their percentagesin the population gives an IQ for South Africa of 72. The IQ of Singapore has been calculated inthe same way by weighting the IQs of the ethnic groups (Malays, Chinese and Indians inSingapore) by their numbers in the population. The data on national IQs are shown in Appendix1 which gives the IQ, the sample size, the test used (Colored or Standard Progressive Matrices)and the reference. For some countries there are two or more studies of the national IQ. Thesehave been averaged to give mean IQs for these countries.Because the concept of national IQ is new, it will be useful to examine its reliability and validity.To examine its reliability we have taken the sixteen countries for which there are two or moremeasures of IQ and calculated the correlation between the two measures. For the countries forwhich there are more than two measures (Brazil, Hong Kong, India and Mexico) we have usedthe two extreme values. The correlation between the two measures of national IQ is 0.937. Thisestablishes that the measure of national IQ has high reliability.To examine the validity of the national IQs we have examined their relation with nationalmeasures of educational attainment. This follows the long established methodology of thevalidation of intelligence tests among individuals by showing that they are positively correlatedwith test of educational attainment. The measures of education attainment are taken from thesecond and third international studies of educational achievement in mathematics and science.These data are shown in Table 1 for the countries for which we have IQ measures. Thecorrelations between educational attainment and IQ are shown in the bottom two rows of thetable. Five of the six correlations are statistically significant and establish the validity of themeasures of national IQ.
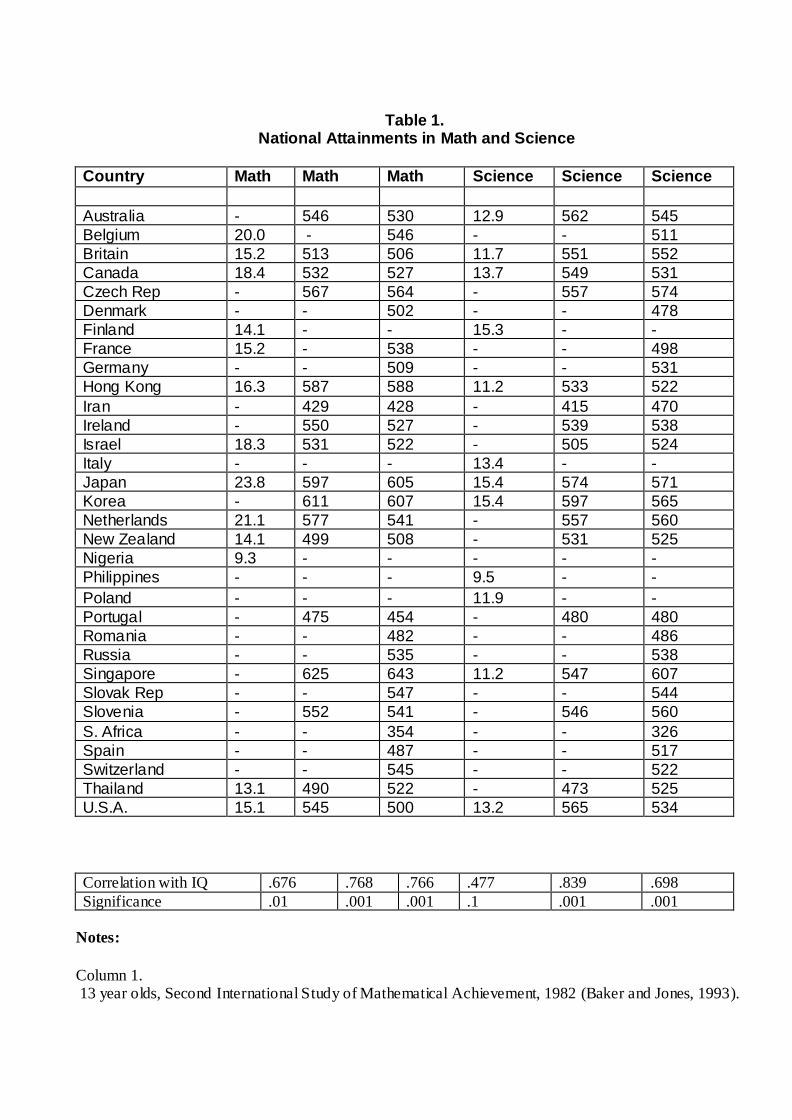
Table 1. National Attainments in Math and Science
Country Math Math Math Science Science Science
Australia 546 530 12.9 562 545Belgium 20.0 546 511Britain 15.2 513 506 11.7 551 552Canada 18.4 532 527 13.7 549 531Czech Rep 567 564 557 574Denmark 502 478Finland 14.1 15.3 France 15.2 538 498Germany 509 531Hong Kong 16.3 587 588 11.2 533 522Iran 429 428 415 470Ireland 550 527 539 538Israel 18.3 531 522 505 524Italy 13.4 Japan 23.8 597 605 15.4 574 571Korea 611 607 15.4 597 565Netherlands 21.1 577 541 557 560New Zealand 14.1 499 508 531 525Nigeria 9.3 Philippines 9.5 Poland 11.9 Portugal 475 454 480 480Romania 482 486Russia 535 538Singapore 625 643 11.2 547 607Slovak Rep 547 544Slovenia 552 541 546 560S. Africa 354 326Spain 487 517Switzerland 545 522Thailand 13.1 490 522 473 525U.S.A. 15.1 545 500 13.2 565 534
Correlation with IQ .676 .768 .766 .477 .839 .698Significance .01 .001 .001 .1 .001 .001
Notes:
Column 1. 13 year olds, Second International Study of Mathematical Achievement, 1982 (Baker and Jones, 1993).

Column 2. 10 year olds, Third International Mathematics and Science Study, 19945 (Mullis, 1997).
Column 3. 14 year olds, Third International Mathematics and Science Study, 19945, (Benton et al., 1996a).
Column 4. 10 year olds, Second International Study of Science Achievement, 1985 (IEA, 1988).
Column 5. 10 year olds. Third International Mathematics and Science Study, 19945 (Martin et al., 1997).
Column 6. 14 year olds, Third International Mathematics and Science Study, 19945 (Benton et al., 1996b).
National Wealth and Rates of Economic Growth
National wealth is measured by per capita national income. Strictly speaking, national wealthand national per capita income are different concepts because national wealth consists of thevalue of capital stock, whereas income is income, so we use the term national wealth in thegeneral sense in which people speak of rich countries and poor countries. We use twoalternative measures of national income: per capita GNP in US dollars and real GDP per capitain US dollars. The second measure is calculated on the basis of the purchasing power parity ofthe country's currency. It is intended "to make more accurate international comparisons of GDPand its components than those based on official exchange rates, which can be subject toconsiderable fluctuation" (Human Development Report, 1997, p. 239). For some countries dataon per capita GNP and real GDP per capita can differ considerably from each other. The basicdifference between GNP and GDP is that GDP comprises the total output of goods and servicesfor final use produced by an economy by both residents and nonresidents within thegeographical boundaries of a nation, whereas GNP comprises GDP plus income from abroad,which is the income residents receive from abroad, less similar payments made to nonresidents who contribute to the domestic economy. The difference between GNP and GDP isrelatively small for most countries much smaller than difference between GNP and real GDP but in some cases it can be quite substantial (see Gardner, 1998, pp. 2223; HumanDevelopment Report 1999, p. 254; World Development Report 1999/2000, p. 274).Most data on per capita GNP are taken from the World Bank's World Development Report1999/2000 and all data on real GDP per capita from the United Nations Development Program's(UNDP) Human Development Report 2000. Sources of supplementary data are given at the footof Appendix 2. Data for per capita GNP and real GDP per capita used in this paper are for theyear 1998. These are the latest data available to us at the time of writing. These data for percapita incomes are shown in Appendix 2 for the same countries as in Appendix 1. However, inAppendix 2 the United Kingdom replaces Britain in Appendix 1.Economic growth rates are measured as percentage increases in per capita GNP and percapita GDP. Consistent national differences in economic growth rates over many decades areresponsible for contemporary national differences in GNP and GDP. Our hypothesis thatnational differences in IQ are a cause of contemporary national differences in GNP and GDPentails the prediction that national IQs should be positively correlated with long term rates ofeconomic growth. We present two tests of this prediction. First, we examine the correlationbetween national IQs and economic growth rates of per capita GDP over the period 19501990using the per capita GDP data given by Maddison (1995) for 54 of the countries in our sample.Second, we examine the correlation between national IQs and economic growth rates of percapita GNP over the period 19761998 using per capita GNP data given in the World Bank'sWorld Development Reports. From these data we have calculated the percentage changes ofper capita GDP over the period 195090 and per capita GNP over the period 197698.
These figures are given in Appendix 2.
RESULTS
We examine first the correlations between national IQs and the two measures of national percapita income. These are presented in Table 2. It shows that the two measures of per capitanational income are highly intercorrelated (.945). It also shows that the correlations betweennational IQs and the two measures of per capita national income are strongly positive ashypothesized. The national IQs are correlated .706 with per capita GNP and .757 with percapita real GDP. Both correlations are statistically significant at p<.001. We examine next the
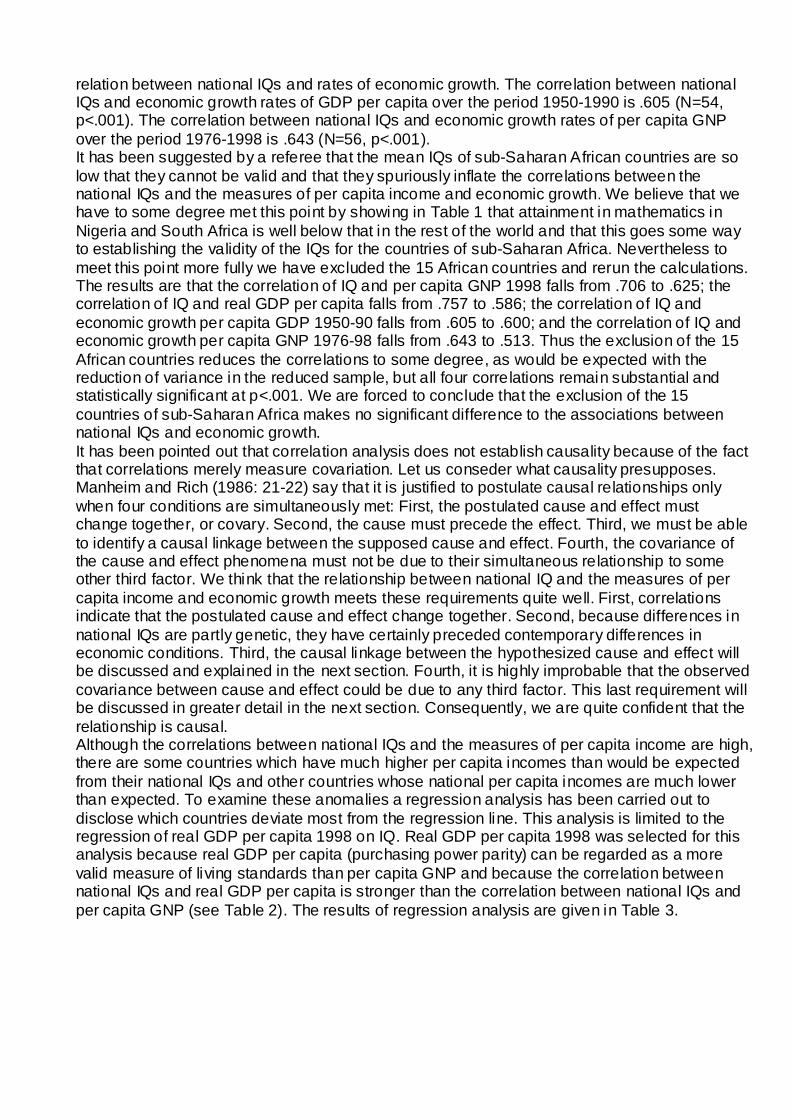
relation between national IQs and rates of economic growth. The correlation between nationalIQs and economic growth rates of GDP per capita over the period 19501990 is .605 (N=54,p<.001). The correlation between national IQs and economic growth rates of per capita GNPover the period 19761998 is .643 (N=56, p<.001).It has been suggested by a referee that the mean IQs of subSaharan African countries are solow that they cannot be valid and that they spuriously inflate the correlations between thenational IQs and the measures of per capita income and economic growth. We believe that wehave to some degree met this point by showing in Table 1 that attainment in mathematics inNigeria and South Africa is well below that in the rest of the world and that this goes some wayto establishing the validity of the IQs for the countries of subSaharan Africa. Nevertheless tomeet this point more fully we have excluded the 15 African countries and rerun the calculations.The results are that the correlation of IQ and per capita GNP 1998 falls from .706 to .625; thecorrelation of IQ and real GDP per capita falls from .757 to .586; the correlation of IQ andeconomic growth per capita GDP 195090 falls from .605 to .600; and the correlation of IQ andeconomic growth per capita GNP 197698 falls from .643 to .513. Thus the exclusion of the 15African countries reduces the correlations to some degree, as would be expected with thereduction of variance in the reduced sample, but all four correlations remain substantial andstatistically significant at p<.001. We are forced to conclude that the exclusion of the 15countries of subSaharan Africa makes no significant difference to the associations betweennational IQs and economic growth.It has been pointed out that correlation analysis does not establish causality because of the factthat correlations merely measure covariation. Let us conseder what causality presupposes.Manheim and Rich (1986: 2122) say that it is justified to postulate causal relationships onlywhen four conditions are simultaneously met: First, the postulated cause and effect mustchange together, or covary. Second, the cause must precede the effect. Third, we must be ableto identify a causal linkage between the supposed cause and effect. Fourth, the covariance ofthe cause and effect phenomena must not be due to their simultaneous relationship to someother third factor. We think that the relationship between national IQ and the measures of percapita income and economic growth meets these requirements quite well. First, correlationsindicate that the postulated cause and effect change together. Second, because differences innational IQs are partly genetic, they have certainly preceded contemporary differences ineconomic conditions. Third, the causal linkage between the hypothesized cause and effect willbe discussed and explained in the next section. Fourth, it is highly improbable that the observedcovariance between cause and effect could be due to any third factor. This last requirement willbe discussed in greater detail in the next section. Consequently, we are quite confident that therelationship is causal.Although the correlations between national IQs and the measures of per capita income are high,there are some countries which have much higher per capita incomes than would be expectedfrom their national IQs and other countries whose national per capita incomes are much lowerthan expected. To examine these anomalies a regression analysis has been carried out todisclose which countries deviate most from the regression line. This analysis is limited to theregression of real GDP per capita 1998 on IQ. Real GDP per capita 1998 was selected for thisanalysis because real GDP per capita (purchasing power parity) can be regarded as a morevalid measure of living standards than per capita GNP and because the correlation betweennational IQs and real GDP per capita is stronger than the correlation between national IQs andper capita GNP (see Table 2). The results of regression analysis are given in Table 3.
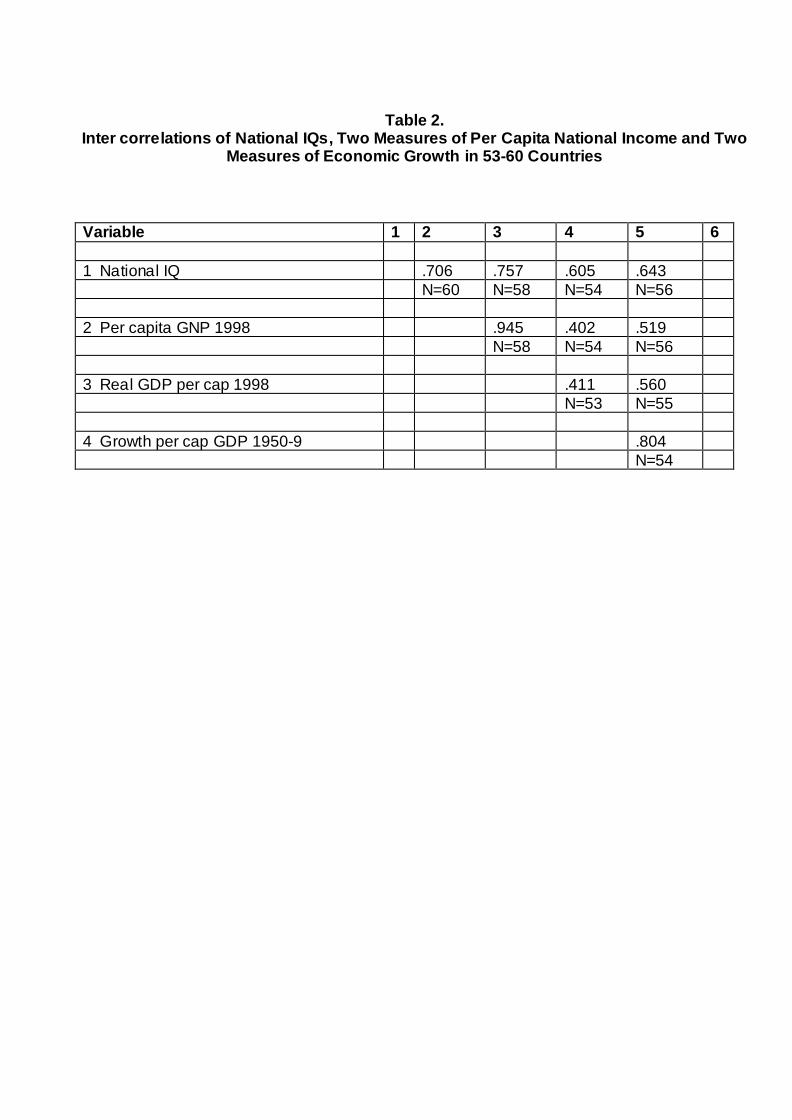
Table 2.Inter correlations of National IQs, Two Measures of Per Capita National Income and Two
Measures of Economic Growth in 5360 Countries
Variable 1 2 3 4 5 6
1 National IQ .706 .757 .605 .643 N=60 N=58 N=54 N=56
2 Per capita GNP 1998 .945 .402 .519N=58 N=54 N=56
3 Real GDP per cap 1998 .411 .560N=53 N=55
4 Growth per cap GDP 19509 .804N=54
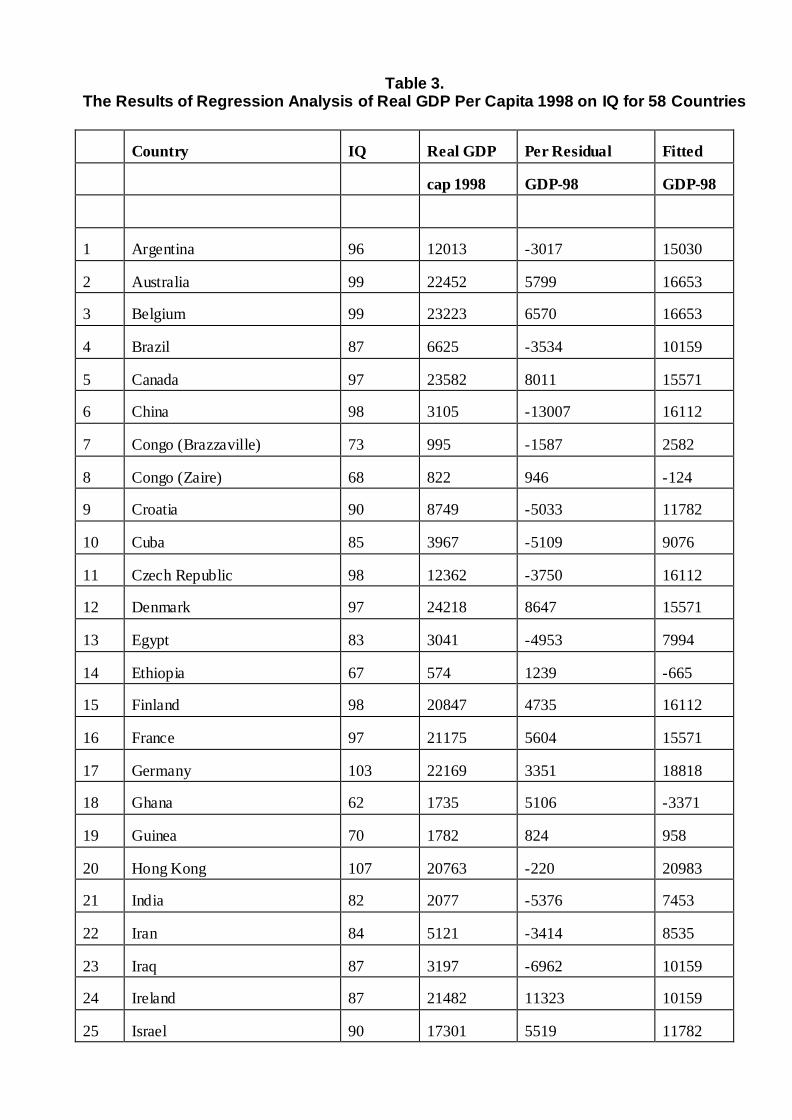
Table 3.The Results of Regression Analysis of Real GDP Per Capita 1998 on IQ for 58 Countries
Country IQ Real GDP Per Residual Fitted
cap 1998 GDP98 GDP98
1 Argentina 96 12013 3017 15030
2 Australia 99 22452 5799 16653
3 Belgium 99 23223 6570 16653
4 Brazil 87 6625 3534 10159
5 Canada 97 23582 8011 15571
6 China 98 3105 13007 16112
7 Congo (Brazzaville) 73 995 1587 2582
8 Congo (Zaire) 68 822 946 124
9 Croatia 90 8749 5033 11782
10 Cuba 85 3967 5109 9076
11 Czech Republic 98 12362 3750 16112
12 Denmark 97 24218 8647 15571
13 Egypt 83 3041 4953 7994
14 Ethiopia 67 574 1239 665
15 Finland 98 20847 4735 16112
16 France 97 21175 5604 15571
17 Germany 103 22169 3351 18818
18 Ghana 62 1735 5106 3371
19 Guinea 70 1782 824 958
20 Hong Kong 107 20763 220 20983
21 India 82 2077 5376 7453
22 Iran 84 5121 3414 8535
23 Iraq 87 3197 6962 10159
24 Ireland 87 21482 11323 10159
25 Israel 90 17301 5519 11782
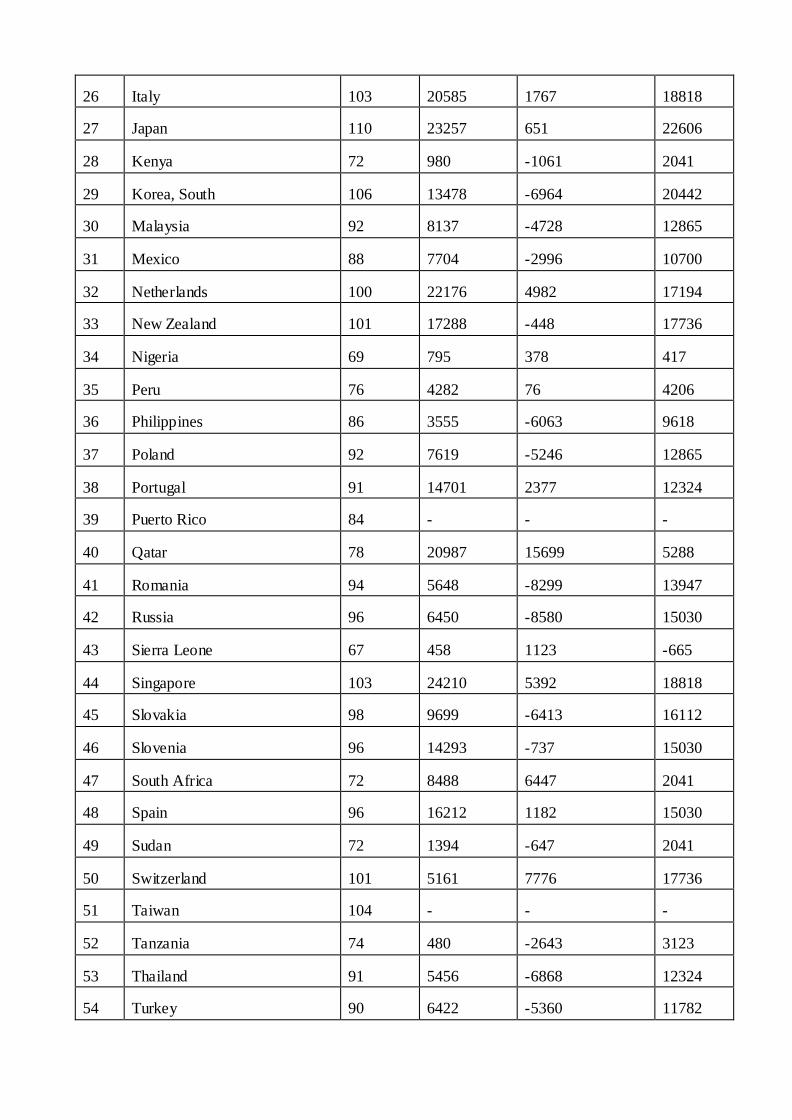
26 Italy 103 20585 1767 18818
27 Japan 110 23257 651 22606
28 Kenya 72 980 1061 2041
29 Korea, South 106 13478 6964 20442
30 Malaysia 92 8137 4728 12865
31 Mexico 88 7704 2996 10700
32 Netherlands 100 22176 4982 17194
33 New Zealand 101 17288 448 17736
34 Nigeria 69 795 378 417
35 Peru 76 4282 76 4206
36 Philippines 86 3555 6063 9618
37 Poland 92 7619 5246 12865
38 Portugal 91 14701 2377 12324
39 Puerto Rico 84
40 Qatar 78 20987 15699 5288
41 Romania 94 5648 8299 13947
42 Russia 96 6450 8580 15030
43 Sierra Leone 67 458 1123 665
44 Singapore 103 24210 5392 18818
45 Slovakia 98 9699 6413 16112
46 Slovenia 96 14293 737 15030
47 South Africa 72 8488 6447 2041
48 Spain 96 16212 1182 15030
49 Sudan 72 1394 647 2041
50 Switzerland 101 5161 7776 17736
51 Taiwan 104
52 Tanzania 74 480 2643 3123
53 Thailand 91 5456 6868 12324
54 Turkey 90 6422 5360 11782
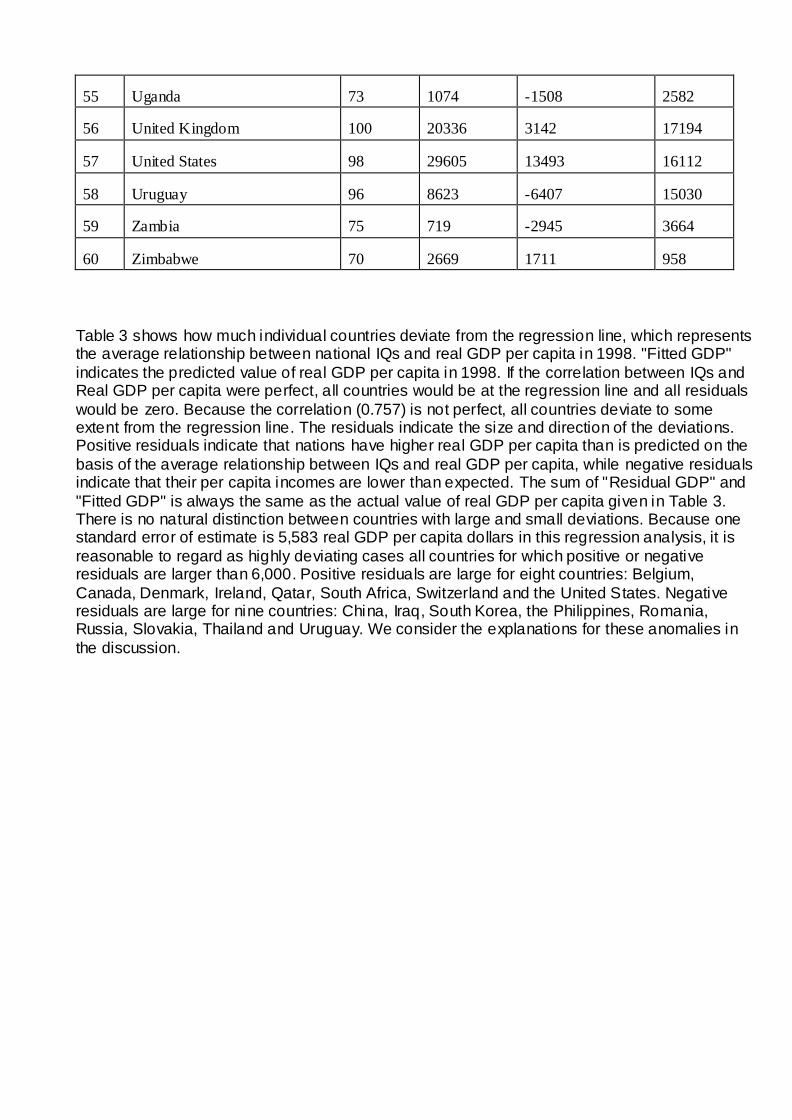
55 Uganda 73 1074 1508 2582
56 United Kingdom 100 20336 3142 17194
57 United States 98 29605 13493 16112
58 Uruguay 96 8623 6407 15030
59 Zambia 75 719 2945 3664
60 Zimbabwe 70 2669 1711 958
Table 3 shows how much individual countries deviate from the regression line, which representsthe average relationship between national IQs and real GDP per capita in 1998. "Fitted GDP"indicates the predicted value of real GDP per capita in 1998. If the correlation between IQs andReal GDP per capita were perfect, all countries would be at the regression line and all residualswould be zero. Because the correlation (0.757) is not perfect, all countries deviate to someextent from the regression line. The residuals indicate the size and direction of the deviations.Positive residuals indicate that nations have higher real GDP per capita than is predicted on thebasis of the average relationship between IQs and real GDP per capita, while negative residualsindicate that their per capita incomes are lower than expected. The sum of "Residual GDP" and"Fitted GDP" is always the same as the actual value of real GDP per capita given in Table 3.There is no natural distinction between countries with large and small deviations. Because onestandard error of estimate is 5,583 real GDP per capita dollars in this regression analysis, it isreasonable to regard as highly deviating cases all countries for which positive or negativeresiduals are larger than 6,000. Positive residuals are large for eight countries: Belgium,Canada, Denmark, Ireland, Qatar, South Africa, Switzerland and the United States. Negativeresiduals are large for nine countries: China, Iraq, South Korea, the Philippines, Romania,Russia, Slovakia, Thailand and Uruguay. We consider the explanations for these anomalies inthe discussion.
DISCUSSION
The hypotheses examined in this study have been that national per capita incomes and rates ofeconomic growth would be positively correlated with national IQs. These hypotheses have beenconfirmed by strong correlations that are at a high level of statistical significance for both GNPand GDP. If we adopt a one way causal model that national IQs are a determinant of nationalper capita incomes and rates of economic growth, the results show that national IQ explains 57percent of the variance of real GDP per capita 1998 and 50 percent of the variance of GNP percapita 1998. National IQ also explains 37 percent of the variance in economic growth of percapita GDP 195090 and 41 percent of the variance in economic growth of per capita GNP197698.There are two reasons why we consider that a causal effect of national IQ on per capitaincomes and rates of economic growth is the most reasonable theory to explain the correlations.First, this theory is a corollary of an already established body of theory and data showing that IQis a determinant of income among individuals, the evidence for which has been reviewed in theintroduction. IQs measured in chi ldhood are strong predictors of IQs in adolescence and theseare predictors of earnings in adulthood. The most reasonable interpretation of theseassociations is that IQ is a determinant of earnings. From this it follows that groups with highIQs would have higher average incomes than groups with low IQs because groups areaggregates of individuals. This prediction has already been confirmed in the studies of thepositive relationship between IQs and per capita incomes among the American states andamong the regions of the British Isles, France and Spain, as noted in the introduction. Thepositive relation between IQ and income is so well established that it can be designated a law,of which the finding that national IQs are positively related to national per capita incomes is afurther instance.Second, there is a straightforward explanation for the positive association between IQ andincomes at both the individual and population level. The major reason for this association is thatpeople with high IQs can acquire complex skills that command high earnings and that cannot beacquired by those with low IQs. Nations whose populations have high IQs tend to have efficienteconomies at all levels from top and middle management through skilled and semiskilledworkers. These nations are able to produce competitively goods and services for which there isa strong international demand and for which there is therefore a high value, and that cannot beproduced by nations whose populations have low IQs. In addition, nations whose populationshave high IQs will have intelligent and efficient personnel in services and public sectoremployment that contributes indirectly to the strength of the economy such as teachers,doctors, scientists and a variety of public servants responsible for the running of telephones,railroads, electricity supplies and other public utilities. Finally, nations whose populations havehigh IQs are likely to have intelligent political leaders who manage their economies effectively.Skilled economic management is required to produce the right conditions for economic growth,such as keeping interest rates at the optimum level to produce full employment with minimuminflation, maintaining competition, preventing the growth of monopolies, controlling crime andcorruption, and promoting education, literacy and numeracy and vocational training.While we consider that a causal effect of national intelligence on per capita income and rates ofeconomic growth is the most reasonable model for an explanation of the data, there are twoother possible explanations that deserve consideration. The first of these is that there is nodirect causal relation between national IQs and per capita incomes and growth rates and thecorrelation between them is due to some third factor affecting all three. Although this is atheoretical possibility and needs to be mentioned, we do not think it is possible to formulate aplausible theory of this kind.Second, it might be argued that national per capita incomes are a cause of national differencesin IQs. This argument would state that rich nations provide advantageous environments tonurture the intelligence of their children in so far as they are able to provide their children with
better nutrition, health care, education and whatever other environmental factors have animpact on intelligence, the nature of which is discussed in Neisser (1998). Intelligence hasincreased considerably in many nations during the twentieth century and there is little doubt thatthese increases have been brought about by environmental improvements, which havethemselves occurred largely as a result of increases in per capita incomes that have enabledpeople to give their children better nutrition, health care, education and the like. Such a theoryhas some plausibility but it cannot explain the totality of the data. Countries like Japan, SouthKorea, Taiwan and Singapore had high IQs in the 1960s when they had quite low per capitaincomes and the same is true of China today. Nevertheless, the model of national differences inIQ as a major determinant of economic growth and per capita incomes should probably besupplemented by the postulation of a small positive feedback in which national per capitaincome has some impact on the population's IQ.Our results are based on a sample of 60 nations out of approximately 185 nations of significantsize in the world. We believe that the sample can be regarded as relatively well representativeof the totality of nations because all categories of nations are well represented including theeconomically developed "First World" market economies of North America, Western Europe,Australia and New Zealand; the "Second World" former communist nations of Russia andEastern Europe; the "Third World" economically developing but impoverished nations of SouthAsia, subSaharan Africa and the Caribbean; and the residual categories of Latin America andEast Asia. If the representativeness of our sample is accepted, our results indicate that slightlyover half the variance in national per capita income in the contemporary world is attributable tonational differences in IQ. However, it should be noted that correlations are somewhat lower inthe total group of 185 countries (see Lynn and Vanhanen, 2002). The difference in correlationsimplies that this sample of 60 nations is probably slightly biased.The regression analysis suggests that a major additional factor is the economic form oforganisation consisting of whether countries have market or socialist economies. The countriesthat have the largest positive residuals and therefore have higher per capita income than wouldbe predicted from their IQs are Australia, Belgium, Canada, Denmark, France, Ireland, Israel,Qatar, Singapore, South Africa, Switzerland and the United States. With the exception of Qatarand South Africa, all of these are technologically highly developed market economy countriesand their higher than predicted per capita incomes can be attributed principally to this form ofeconomic organisation. Qatar's exceptionally high level of per capita national income isprincipally due to its oil production industries. South Africa's much higher than expected level ofper capita income should probably be attributed principally to the cognitive skills of its Europeanminority who comprise 14 per cent of the population.The countries that have the largest negative residuals are China, Iraq, South Korea, thePhilippines, Romania, Russia, Slovakia, Thailand and Uruguay. Four of these countries (China,Romania, Russia and Slovakia) are present or former socialist countries whose economicdevelopment has been hampered by their socialist economic and political systems. After thecollapse of the Soviet communist systems in 1991 and the introduction of market economies inthese countries and in China, the prospects for rapid economic development for these countriesare good, although it takes time to establish effective market economies. Of the remaining fivecountries with large negative residuals, Iraq's low level of per capita national income is dueprincipally to the destruction inflicted in 1990 war and the UN sanctions imposed in 1990. SouthKorea's Real GDP per capita is also considerably lower than expected on the basis of thecountry's exceptionally high level of national IQ (106). The principal explanation for this isprobably that South Korea had a very low per capita income at the end of World War Two as aresult of military defeat and occupation by the Japanese and that it has not yet had sufficienttime to achieve the predicted level of per capita income, although economic growth in SouthKorea since 1950 has been extremely high (see Appendix 2). The Asian economic crisis in1998 may have increased the negative residuals of the Philippines and Thailand temporarily.Economic growth in Uruguay has been strong since the 1970s, although the country has not yet

achieved the per capita income level expected on the basis of its relatively high national IQ.Thus our general conclusion is that national differences in the wealth and poverty of nations inthe contemporary world can be explained first in terms of the intelligence levels of thepopulations; secondly, to some extent, in terms of whether they operate market or socialisteconomies; and thirdly by unique circumstances such as the possession of valuable naturalresources like oil in the case of Qatar and trade sanctions imposed on Iraq.
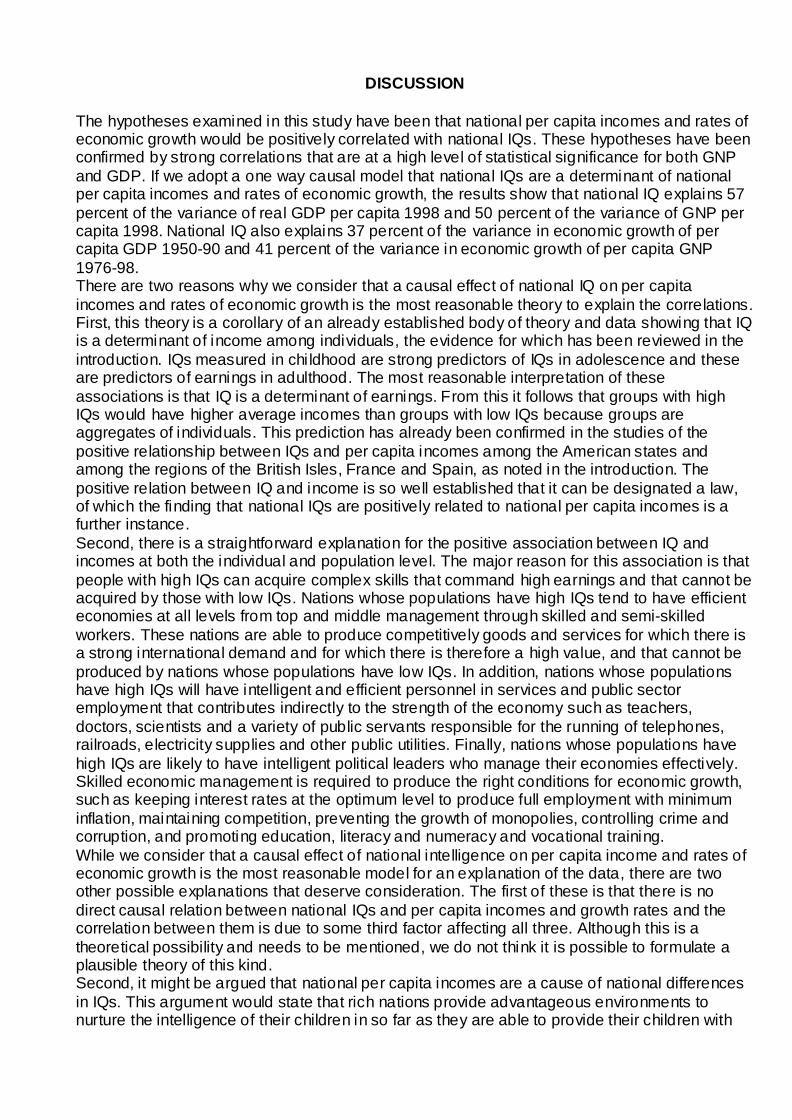
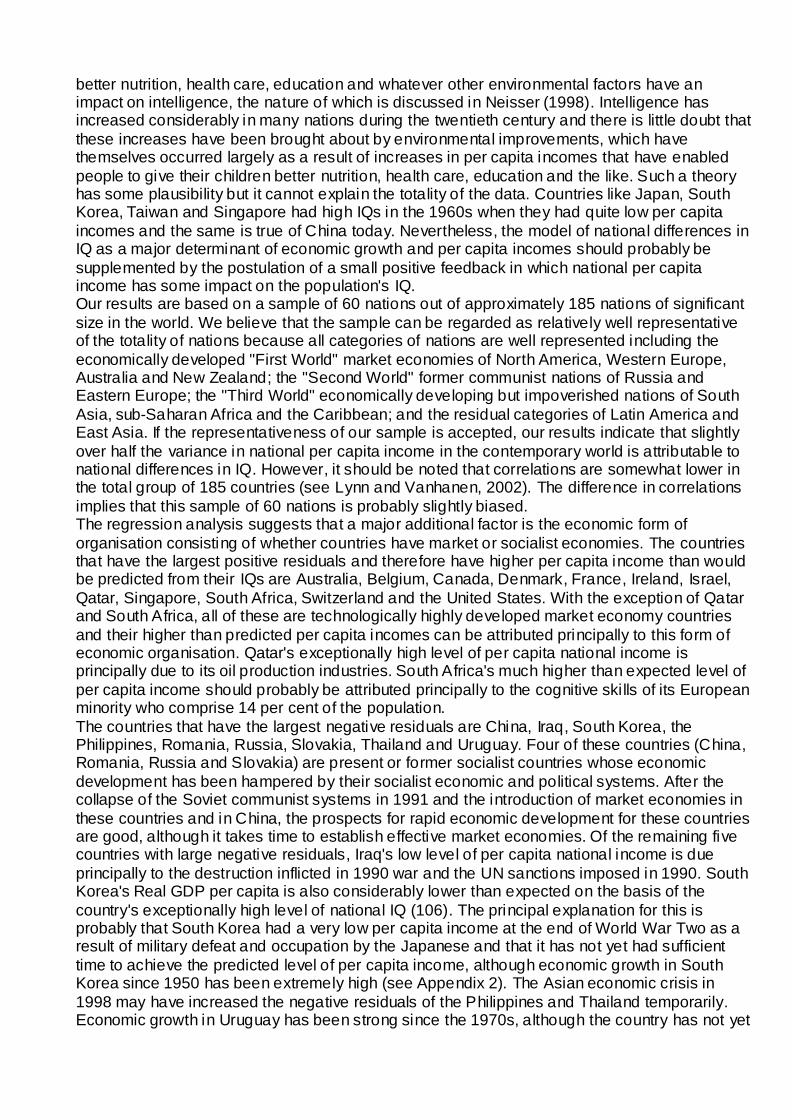
Table 4IQs for 185 countries
National IQs Based on the Results of Intelligence Tests and Estimated National IQs(marked by *) Based on the IQs of Neighbouring or Other Comparable Countries.
Country National IQ based on Comparison countriesarithmetic means.
1 Afghanistan 83* Iran 84, India 81
2 Albania 90* Croatia 90, Turkey 90
3 Algeria 84* Morocco 85, Egypt 83
4 Angola 69* Zambia 77, Zimbabwe 66, Congo (Z) 65
5 Antigua & Barbuda 75* Barbados 78, Jamaica 72
6 Argentina 96
7 Armenia 93* Turkey 90, Russia 96
8 Australia 98
9 Austria 102
10 Azerbaijan 87* Turkey 90, Iran 84
11 Bahamas 78* Barbados 78
12 Bahrain 83* Iraq 87, Qatar 78
13 Bangladesh 81* India 81
14 Barbados 78
15 Belarus 96* Russia 96
16 Belgium 100
17 Belize 83* Guatemala 79, Mexico 87
18 Benin 69* Ghana 71, Nigeria 67
19 Bhutan 78* Nepal 78
20 Bolivia 85* Ecuador 80, Peru 90
21 Botswana 72* Zambia 77, Zimbabwe 66
22 Brazil 87
23 Brunei 92* Malaysia 92
24 Bulgaria 93
25 Burkina Faso 66* Guinea 63, Sierra Leone 64, Ghana 71
26 Burma (Myanmar) 86* India 81, Thailand 91
27 Burundi 70* Congo (Z) 65, Tanzania 72, Uganda 73
28 Cambodia 89* Thailand 91, Philippines 86
29 Cameroon 70* Nigeria 67, Congo (Braz) 73
30 Canada 97
31 Cape Verde 78* Mixed populationsee notes
32 Central African Rep. 68* Congo (B) 73, Congo (Z) 65, Nigeria 67
33 Chad 72* Sudan 72
34 Chile 93* Argentina 96, Peru 90
35 China 100
36 Colombia 88
37 Comoros 79* Mixed NegroidArabMalay population see notes
38 Congo (Braz) 73
39 Congo (Zaire) 65
40 Costa Rica 91* Argentina 96, Uruguay 96, Colombia 88, Puerto Rico 84
41 Côte d'Ivoire 71* Ghana 71
42 Croatia 90
43 Cuba 85
44 Cyprus 92* Greece 92
45 Czech Republic 97
46 Denmark 98
47 Djibouti 68* Sudan 72, Ethiopia 63
48 Dominica 75* Barbados 78, Jamaica 72
49 Dominican Republic 84* Mixed population, Puerto Rico 84
50 Ecuador 80
51 Egypt 83
52 El Salvador 84* Guatemala 79, Colombia 88
53 Equatorial Guinea 59
54 Eritrea 68* Sudan 72, Ethiopia 63
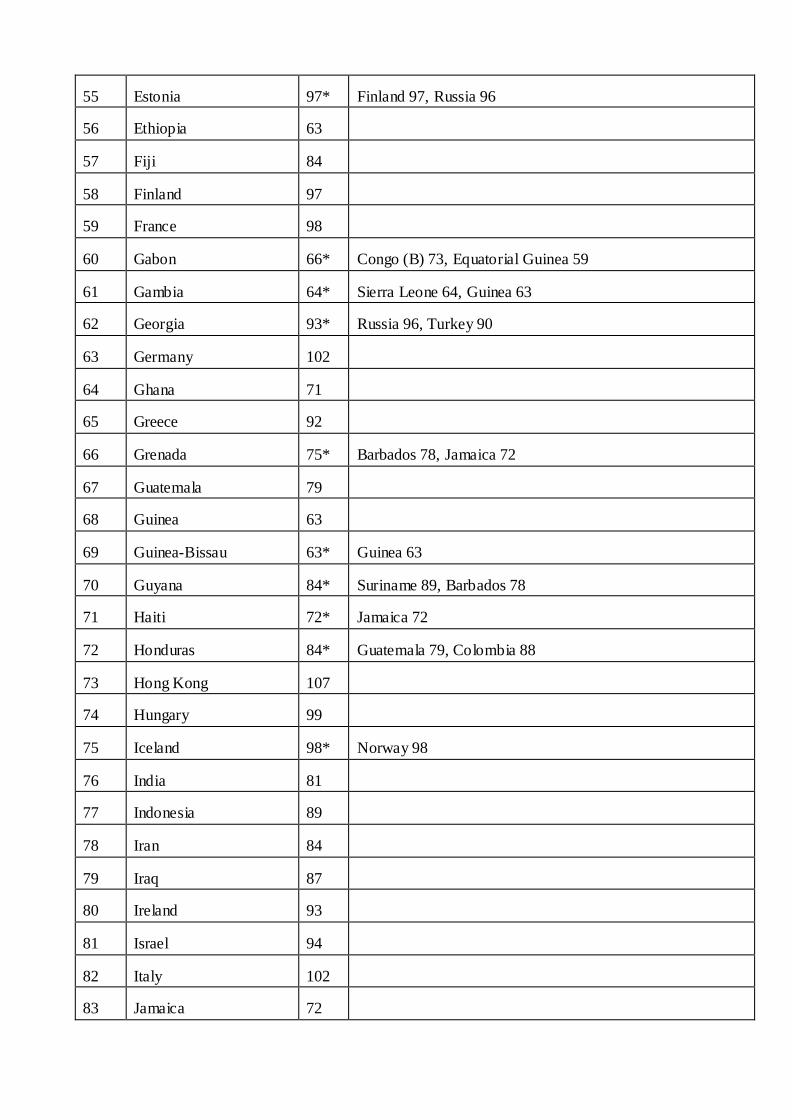
55 Estonia 97* Finland 97, Russia 96
56 Ethiopia 63
57 Fiji 84
58 Finland 97
59 France 98
60 Gabon 66* Congo (B) 73, Equatorial Guinea 59
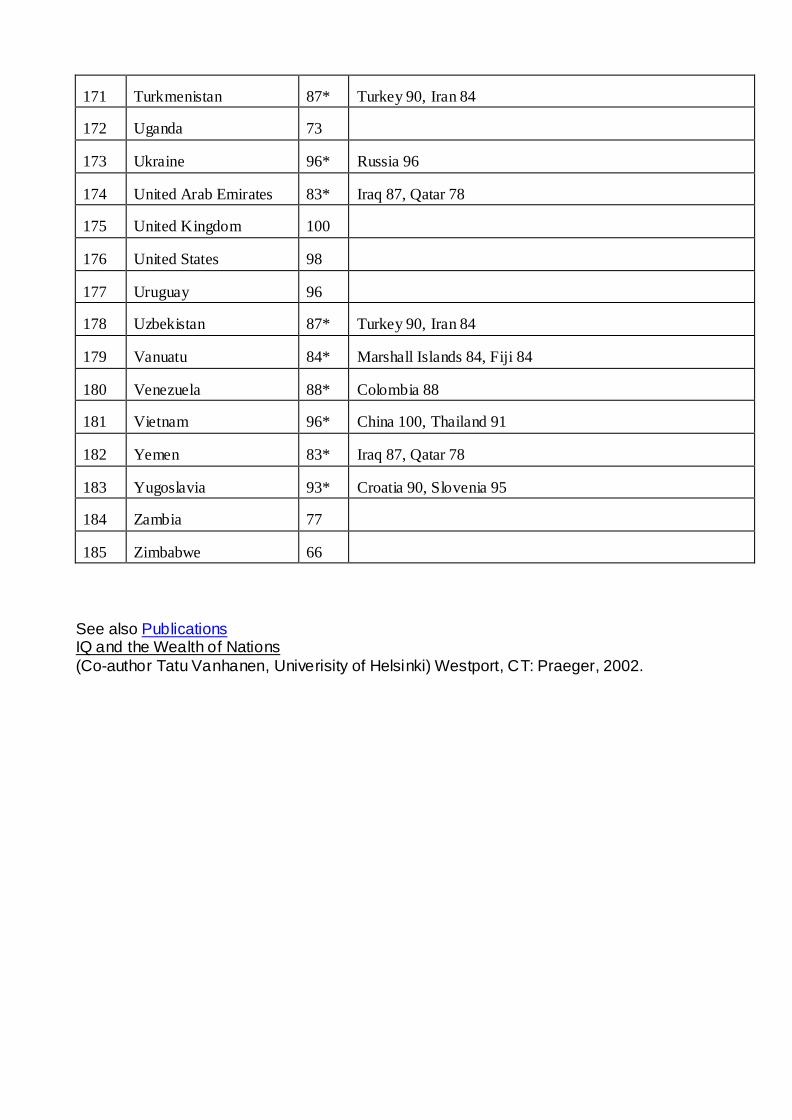
61 Gambia 64* Sierra Leone 64, Guinea 63
62 Georgia 93* Russia 96, Turkey 90
63 Germany 102
64 Ghana 71
65 Greece 92
66 Grenada 75* Barbados 78, Jamaica 72
67 Guatemala 79
68 Guinea 63
69 GuineaBissau 63* Guinea 63
70 Guyana 84* Suriname 89, Barbados 78
71 Haiti 72* Jamaica 72
72 Honduras 84* Guatemala 79, Colombia 88
73 Hong Kong 107
74 Hungary 99
75 Iceland 98* Norway 98
76 India 81
77 Indonesia 89
78 Iran 84
79 Iraq 87
80 Ireland 93
81 Israel 94
82 Italy 102
83 Jamaica 72
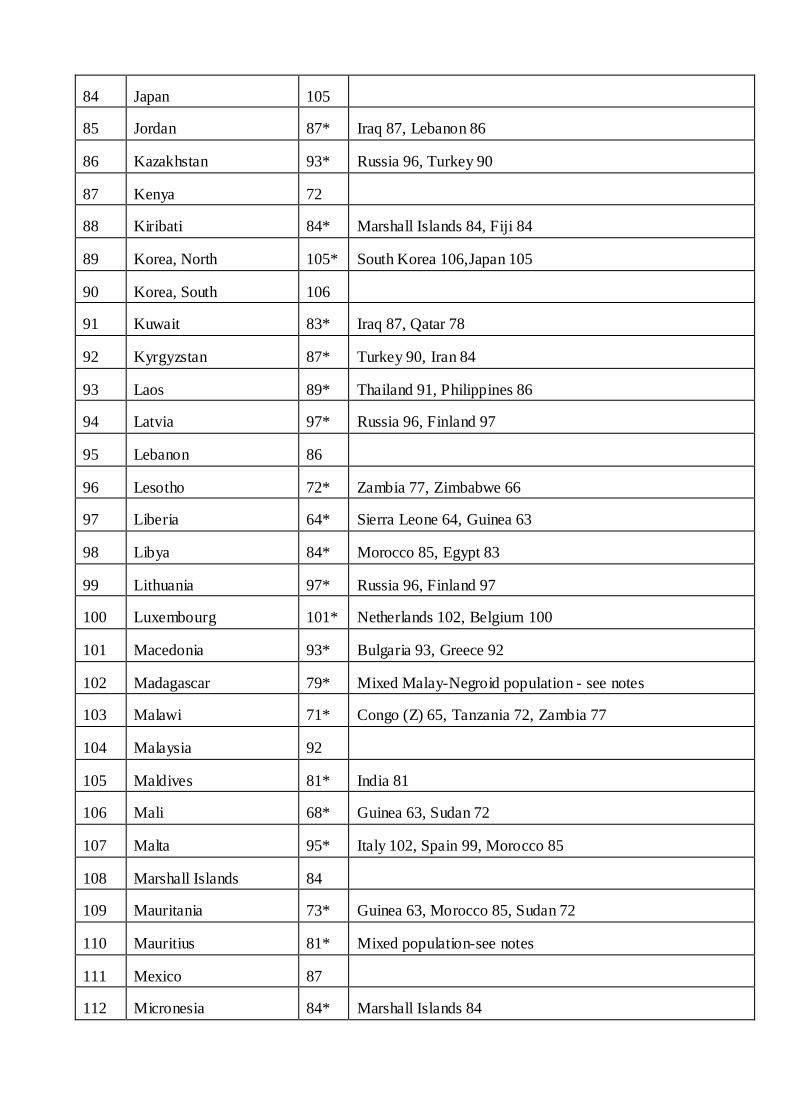
84 Japan 105
85 Jordan 87* Iraq 87, Lebanon 86
86 Kazakhstan 93* Russia 96, Turkey 90
87 Kenya 72
88 Kiribati 84* Marshall Islands 84, Fiji 84
89 Korea, North 105* South Korea 106,Japan 105
90 Korea, South 106
91 Kuwait 83* Iraq 87, Qatar 78
92 Kyrgyzstan 87* Turkey 90, Iran 84
93 Laos 89* Thailand 91, Philippines 86
94 Latvia 97* Russia 96, Finland 97
95 Lebanon 86
96 Lesotho 72* Zambia 77, Zimbabwe 66
97 Liberia 64* Sierra Leone 64, Guinea 63
98 Libya 84* Morocco 85, Egypt 83
99 Lithuania 97* Russia 96, Finland 97
100 Luxembourg 101* Netherlands 102, Belgium 100
101 Macedonia 93* Bulgaria 93, Greece 92
102 Madagascar 79* Mixed MalayNegroid population see notes
103 Malawi 71* Congo (Z) 65, Tanzania 72, Zambia 77
104 Malaysia 92
105 Maldives 81* India 81
106 Mali 68* Guinea 63, Sudan 72
107 Malta 95* Italy 102, Spain 99, Morocco 85
108 Marshall Islands 84
109 Mauritania 73* Guinea 63, Morocco 85, Sudan 72
110 Mauritius 81* Mixed populationsee notes
111 Mexico 87
112 Micronesia 84* Marshall Islands 84
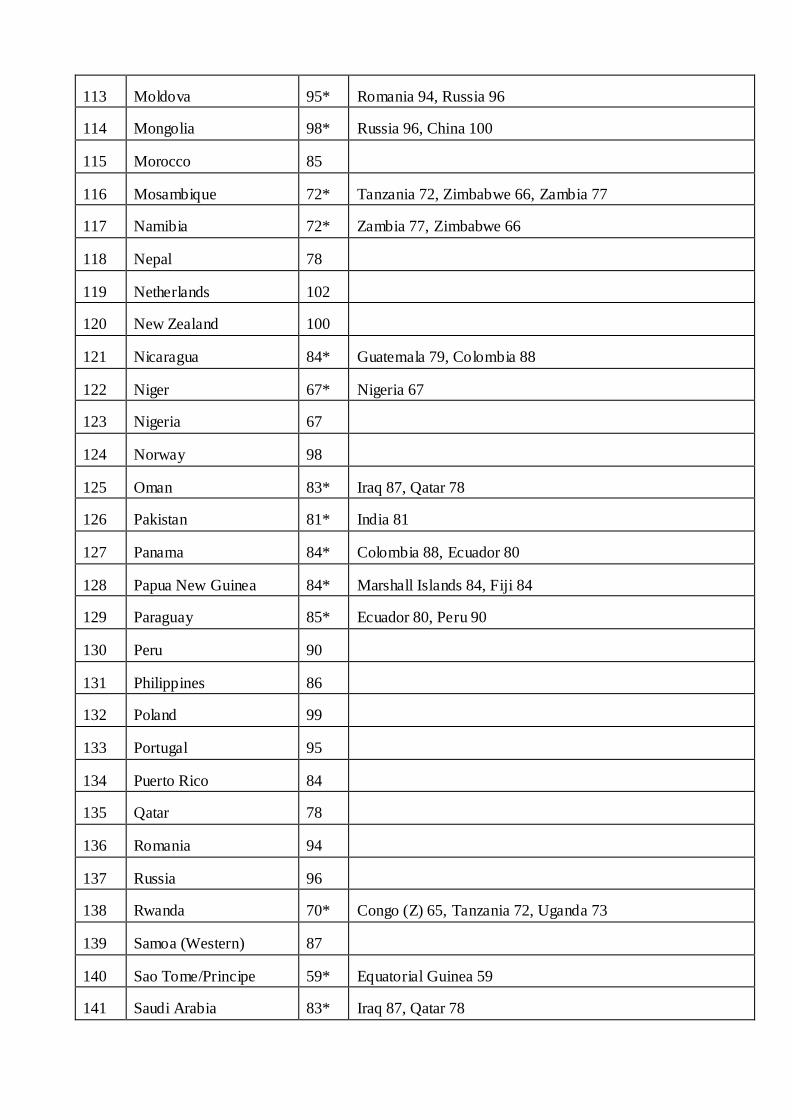
113 Moldova 95* Romania 94, Russia 96
114 Mongolia 98* Russia 96, China 100
115 Morocco 85
116 Mosambique 72* Tanzania 72, Zimbabwe 66, Zambia 77
117 Namibia 72* Zambia 77, Zimbabwe 66
118 Nepal 78
119 Netherlands 102
120 New Zealand 100
121 Nicaragua 84* Guatemala 79, Colombia 88
122 Niger 67* Nigeria 67
123 Nigeria 67
124 Norway 98
125 Oman 83* Iraq 87, Qatar 78
126 Pakistan 81* India 81
127 Panama 84* Colombia 88, Ecuador 80
128 Papua New Guinea 84* Marshall Islands 84, Fiji 84
129 Paraguay 85* Ecuador 80, Peru 90
130 Peru 90
131 Philippines 86
132 Poland 99
133 Portugal 95
134 Puerto Rico 84
135 Qatar 78
136 Romania 94
137 Russia 96
138 Rwanda 70* Congo (Z) 65, Tanzania 72, Uganda 73
139 Samoa (Western) 87
140 Sao Tome/Principe 59* Equatorial Guinea 59
141 Saudi Arabia 83* Iraq 87, Qatar 78
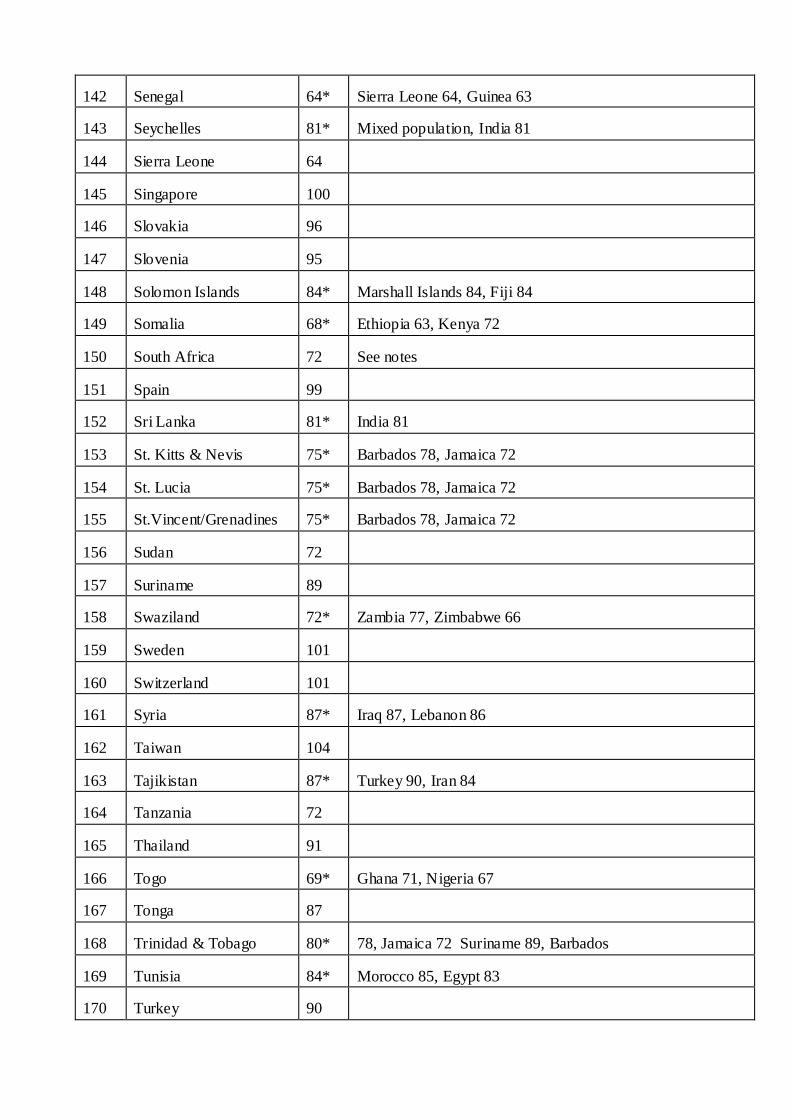
142 Senegal 64* Sierra Leone 64, Guinea 63
143 Seychelles 81* Mixed population, India 81
144 Sierra Leone 64
145 Singapore 100
146 Slovakia 96
147 Slovenia 95
148 Solomon Islands 84* Marshall Islands 84, Fiji 84
149 Somalia 68* Ethiopia 63, Kenya 72
150 South Africa 72 See notes
151 Spain 99
152 Sri Lanka 81* India 81
153 St. Kitts & Nevis 75* Barbados 78, Jamaica 72
154 St. Lucia 75* Barbados 78, Jamaica 72
155 St.Vincent/Grenadines 75* Barbados 78, Jamaica 72
156 Sudan 72
157 Suriname 89
158 Swaziland 72* Zambia 77, Zimbabwe 66
159 Sweden 101
160 Switzerland 101
161 Syria 87* Iraq 87, Lebanon 86
162 Taiwan 104
163 Tajikistan 87* Turkey 90, Iran 84
164 Tanzania 72
165 Thailand 91
166 Togo 69* Ghana 71, Nigeria 67
167 Tonga 87
168 Trinidad & Tobago 80* 78, Jamaica 72 Suriname 89, Barbados
169 Tunisia 84* Morocco 85, Egypt 83
170 Turkey 90
171 Turkmenistan 87* Turkey 90, Iran 84
172 Uganda 73
173 Ukraine 96* Russia 96
174 United Arab Emirates 83* Iraq 87, Qatar 78
175 United Kingdom 100
176 United States 98
177 Uruguay 96
178 Uzbekistan 87* Turkey 90, Iran 84
179 Vanuatu 84* Marshall Islands 84, Fiji 84
180 Venezuela 88* Colombia 88
181 Vietnam 96* China 100, Thailand 91
182 Yemen 83* Iraq 87, Qatar 78
183 Yugoslavia 93* Croatia 90, Slovenia 95
184 Zambia 77
185 Zimbabwe 66
See also PublicationsIQ and the Wealth of Nations(Coauthor Tatu Vanhanen, Univerisity of Helsinki) Westport, CT: Praeger, 2002.
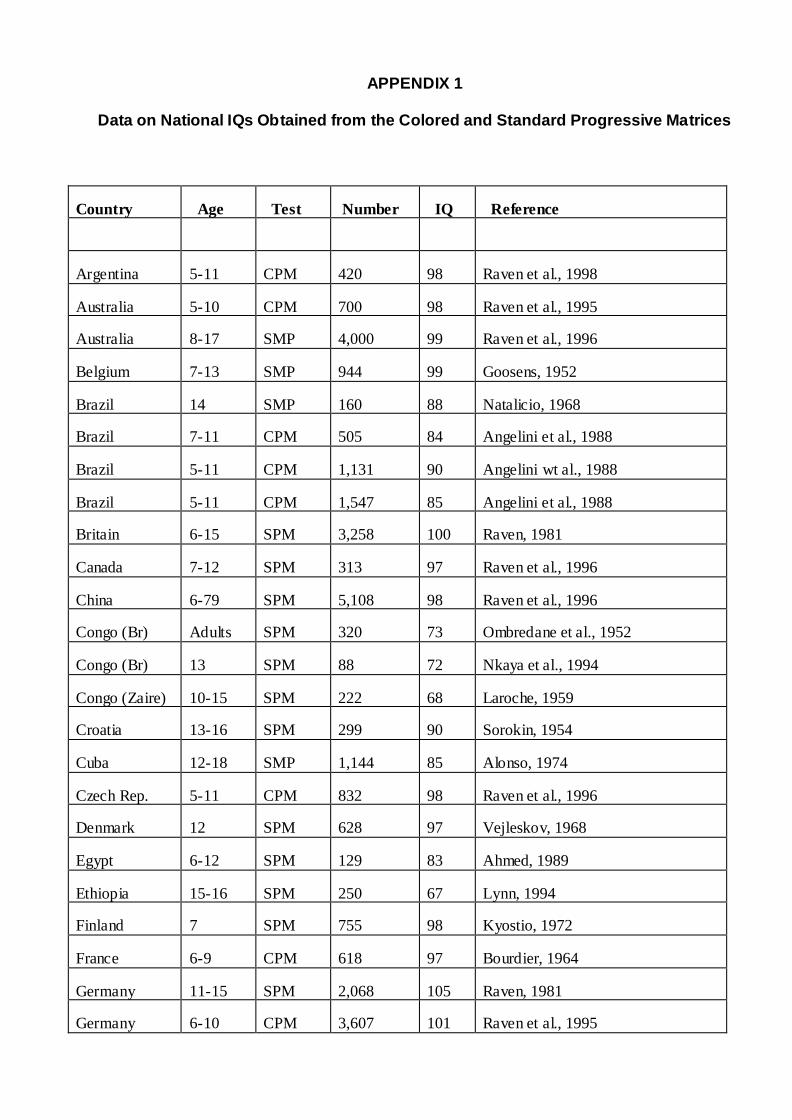
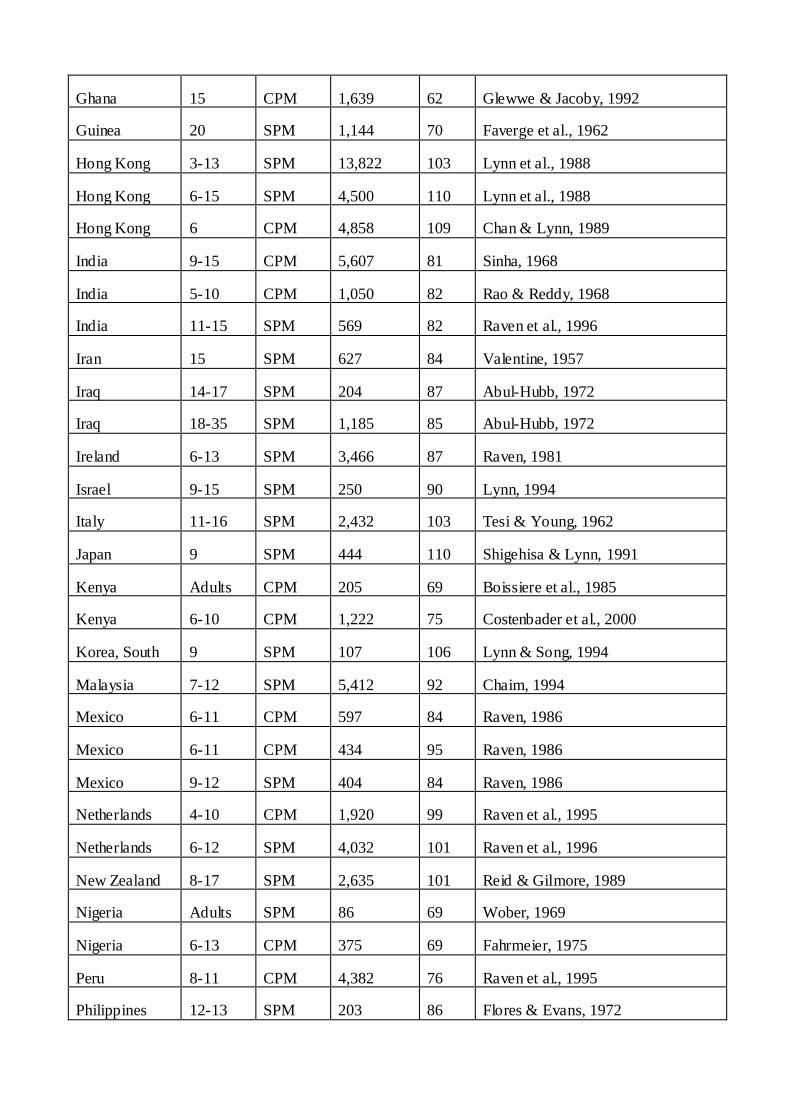
APPENDIX 1
Data on National IQs Obtained from the Colored and Standard Progressive Matrices
Country Age Test Number IQ Reference
Argentina 511 CPM 420 98 Raven et al., 1998
Australia 510 CPM 700 98 Raven et al., 1995
Australia 817 SMP 4,000 99 Raven et al., 1996
Belgium 713 SMP 944 99 Goosens, 1952
Brazil 14 SMP 160 88 Natalicio, 1968
Brazil 711 CPM 505 84 Angelini et al., 1988
Brazil 511 CPM 1,131 90 Angelini wt al., 1988
Brazil 511 CPM 1,547 85 Angelini et al., 1988
Britain 615 SPM 3,258 100 Raven, 1981
Canada 712 SPM 313 97 Raven et al., 1996
China 679 SPM 5,108 98 Raven et al., 1996
Congo (Br) Adults SPM 320 73 Ombredane et al., 1952
Congo (Br) 13 SPM 88 72 Nkaya et al., 1994
Congo (Zaire) 1015 SPM 222 68 Laroche, 1959
Croatia 1316 SPM 299 90 Sorokin, 1954
Cuba 1218 SMP 1,144 85 Alonso, 1974
Czech Rep. 511 CPM 832 98 Raven et al., 1996
Denmark 12 SPM 628 97 Vejleskov, 1968
Egypt 612 SPM 129 83 Ahmed, 1989
Ethiopia 1516 SPM 250 67 Lynn, 1994
Finland 7 SPM 755 98 Kyostio, 1972
France 69 CPM 618 97 Bourdier, 1964
Germany 1115 SPM 2,068 105 Raven, 1981
Germany 610 CPM 3,607 101 Raven et al., 1995
Ghana 15 CPM 1,639 62 Glewwe & Jacoby, 1992
Guinea 20 SPM 1,144 70 Faverge et al., 1962
Hong Kong 313 SPM 13,822 103 Lynn et al., 1988
Hong Kong 615 SPM 4,500 110 Lynn et al., 1988
Hong Kong 6 CPM 4,858 109 Chan & Lynn, 1989
India 915 CPM 5,607 81 Sinha, 1968
India 510 CPM 1,050 82 Rao & Reddy, 1968
India 1115 SPM 569 82 Raven et al., 1996
Iran 15 SPM 627 84 Valentine, 1957
Iraq 1417 SPM 204 87 AbulHubb, 1972
Iraq 1835 SPM 1,185 85 AbulHubb, 1972
Ireland 613 SPM 3,466 87 Raven, 1981
Israel 915 SPM 250 90 Lynn, 1994
Italy 1116 SPM 2,432 103 Tesi & Young, 1962
Japan 9 SPM 444 110 Shigehisa & Lynn, 1991
Kenya Adults CPM 205 69 Boissiere et al., 1985
Kenya 610 CPM 1,222 75 Costenbader et al., 2000
Korea, South 9 SPM 107 106 Lynn & Song, 1994
Malaysia 712 SPM 5,412 92 Chaim, 1994
Mexico 611 CPM 597 84 Raven, 1986
Mexico 611 CPM 434 95 Raven, 1986
Mexico 912 SPM 404 84 Raven, 1986
Netherlands 410 CPM 1,920 99 Raven et al., 1995
Netherlands 612 SPM 4,032 101 Raven et al., 1996
New Zealand 817 SPM 2,635 101 Reid & Gilmore, 1989
Nigeria Adults SPM 86 69 Wober, 1969
Nigeria 613 CPM 375 69 Fahrmeier, 1975
Peru 811 CPM 4,382 76 Raven et al., 1995
Philippines 1213 SPM 203 86 Flores & Evans, 1972
Poland 615 SPM 4,006 92 Jarorowska et al., 1991
Portugal 612 CPM 807 91 Simoes, 1989
Puerto Rico 511 CPM 2,400 83 Raven et al., 1995
Puerto Rico 815 SPM 2,911 84 Raven & Court, 1989
Qatar 12 SPM 273 78 Bart et al., 1987
Romania 610 CPM 300 94 Zahirnic et al., 1974
Russia 14 SPM 432 96 Raven, 1988
Sierra Leone Adults CPM 60 67 Berry, 1966
Singapore 13 SPM 147 103 Lynn, 1977
Slovak Rep. 511 CPM 832 98 Raven et al., 1995
Slovenia 818 SPM 1,556 95 Roben, 1999
South Africa 16 SPM 3,993 72 Owen, 1992
Spain 49 CPM 1,189 96 Raven et al., 1995
Switzerland 610 CPM 408 99 Raven et al., 1995
Switzerland 610 CPM 167 102 Raven et al., 1995
Sudan 812 SPM 148 72 Ahmed, 1989
Taiwan 67 CPM 43,825 103 Hsu, 1976
Thailand 810 CPM 1,358 91 Pollitt et al., 1989
Taiwan 912 SPM 2,496 105 Lynn, 1997
Tanzania 17 SPM 2,959 78 Klingelhofer, 1967
Tanzania Adults CPM 179 69 Boissiere et al., 1985
Turkey 615 SPM 2,277 90 Sahin & Duzen, 1994
United States 1870 SPM 625 98 Raven et al., 1996
Uganda 11 CPM 2,019 73 Heyneman et al., 1980
Uruguay 1244 SPM 1,634 96 Risso, 1961
Zambia 13 SPM 894 75 MacArthur et al., 1964
Zimbabwe 1214 SPM 204 70 Zindi, 1994
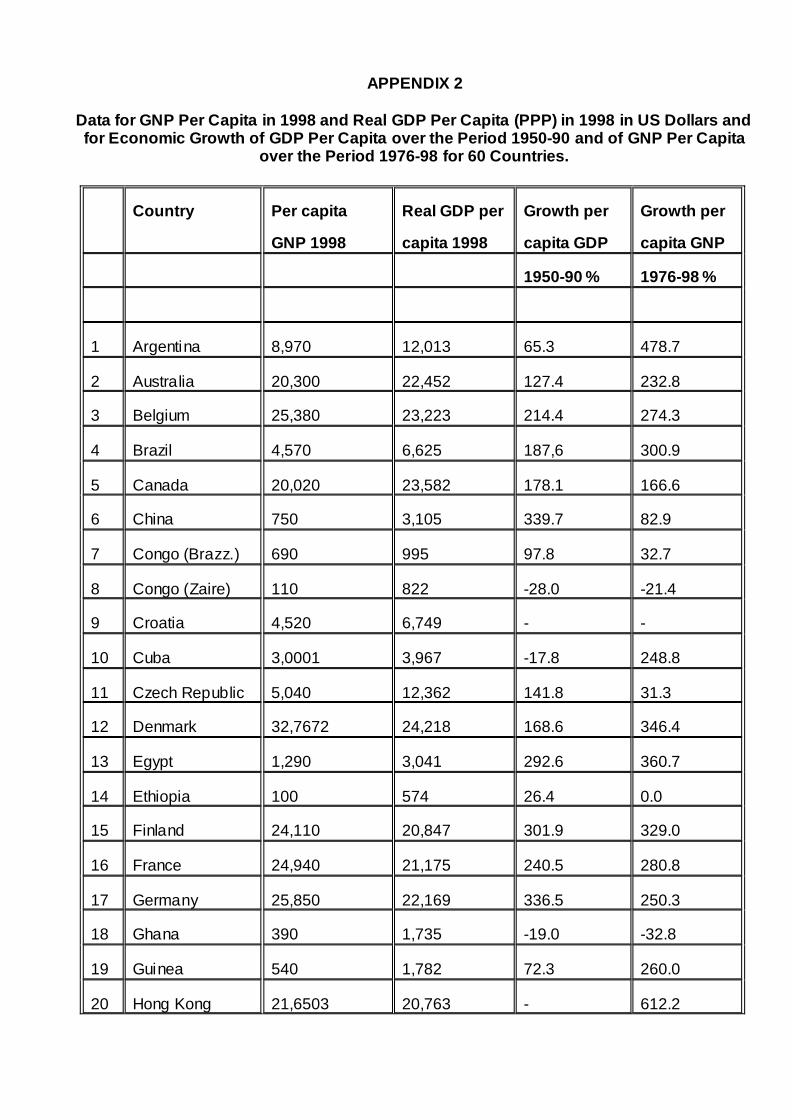
APPENDIX 2
Data for GNP Per Capita in 1998 and Real GDP Per Capita (PPP) in 1998 in US Dollars andfor Economic Growth of GDP Per Capita over the Period 195090 and of GNP Per Capita
over the Period 197698 for 60 Countries.
Country Per capita
GNP 1998
Real GDP per
capita 1998
Growth per
capita GDP
Growth per
capita GNP
195090 % 197698 %
1 Argentina 8,970 12,013 65.3 478.7
2 Australia 20,300 22,452 127.4 232.8
3 Belgium 25,380 23,223 214.4 274.3
4 Brazil 4,570 6,625 187,6 300.9
5 Canada 20,020 23,582 178.1 166.6
6 China 750 3,105 339.7 82.9
7 Congo (Brazz.) 690 995 97.8 32.7
8 Congo (Zaire) 110 822 28.0 21.4
9 Croatia 4,520 6,749
10 Cuba 3,0001 3,967 17.8 248.8
11 Czech Republic 5,040 12,362 141.8 31.3
12 Denmark 32,7672 24,218 168.6 346.4
13 Egypt 1,290 3,041 292.6 360.7
14 Ethiopia 100 574 26.4 0.0
15 Finland 24,110 20,847 301.9 329.0
16 France 24,940 21,175 240.5 280.8
17 Germany 25,850 22,169 336.5 250.3
18 Ghana 390 1,735 19.0 32.8
19 Guinea 540 1,782 72.3 260.0
20 Hong Kong 21,6503 20,763 612.2
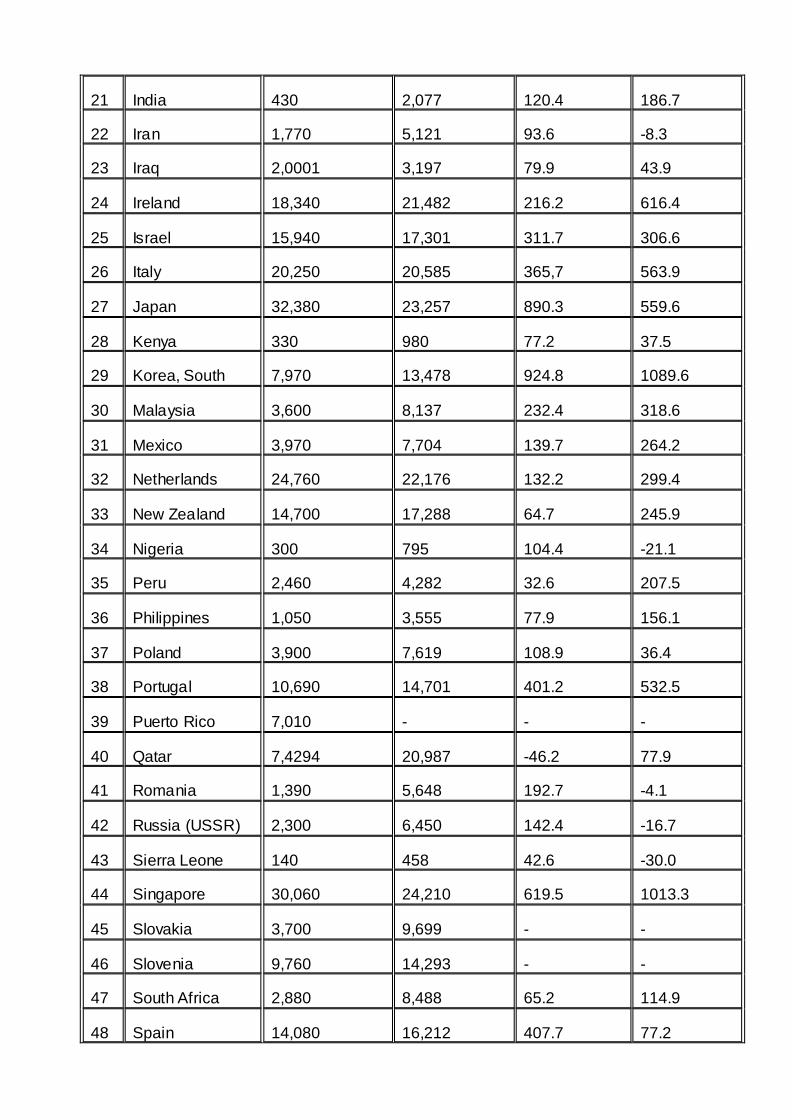
21 India 430 2,077 120.4 186.7
22 Iran 1,770 5,121 93.6 8.3
23 Iraq 2,0001 3,197 79.9 43.9
24 Ireland 18,340 21,482 216.2 616.4
25 Israel 15,940 17,301 311.7 306.6
26 Italy 20,250 20,585 365,7 563.9
27 Japan 32,380 23,257 890.3 559.6
28 Kenya 330 980 77.2 37.5
29 Korea, South 7,970 13,478 924.8 1089.6
30 Malaysia 3,600 8,137 232.4 318.6
31 Mexico 3,970 7,704 139.7 264.2
32 Netherlands 24,760 22,176 132.2 299.4
33 New Zealand 14,700 17,288 64.7 245.9
34 Nigeria 300 795 104.4 21.1
35 Peru 2,460 4,282 32.6 207.5
36 Philippines 1,050 3,555 77.9 156.1
37 Poland 3,900 7,619 108.9 36.4
38 Portugal 10,690 14,701 401.2 532.5
39 Puerto Rico 7,010
40 Qatar 7,4294 20,987 46.2 77.9
41 Romania 1,390 5,648 192.7 4.1
42 Russia (USSR) 2,300 6,450 142.4 16.7
43 Sierra Leone 140 458 42.6 30.0
44 Singapore 30,060 24,210 619.5 1013.3
45 Slovakia 3,700 9,699
46 Slovenia 9,760 14,293
47 South Africa 2,880 8,488 65.2 114.9
48 Spain 14,080 16,212 407.7 77.2
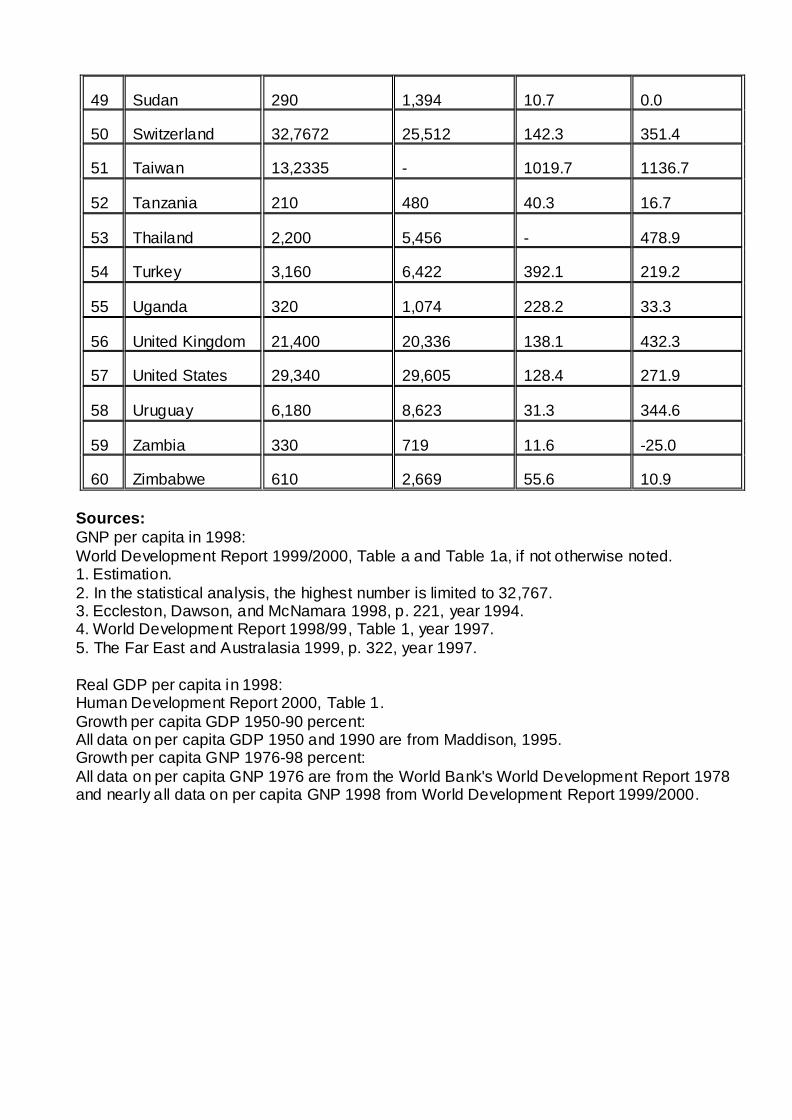
49 Sudan 290 1,394 10.7 0.0
50 Switzerland 32,7672 25,512 142.3 351.4
51 Taiwan 13,2335 1019.7 1136.7
52 Tanzania 210 480 40.3 16.7
53 Thailand 2,200 5,456 478.9
54 Turkey 3,160 6,422 392.1 219.2
55 Uganda 320 1,074 228.2 33.3
56 United Kingdom 21,400 20,336 138.1 432.3
57 United States 29,340 29,605 128.4 271.9
58 Uruguay 6,180 8,623 31.3 344.6
59 Zambia 330 719 11.6 25.0
60 Zimbabwe 610 2,669 55.6 10.9
Sources:GNP per capita in 1998:World Development Report 1999/2000, Table a and Table 1a, if not otherwise noted.1. Estimation.2. In the statistical analysis, the highest number is limited to 32,767.3. Eccleston, Dawson, and McNamara 1998, p. 221, year 1994.4. World Development Report 1998/99, Table 1, year 1997.5. The Far East and Australasia 1999, p. 322, year 1997.
Real GDP per capita in 1998:Human Development Report 2000, Table 1.Growth per capita GDP 195090 percent:All data on per capita GDP 1950 and 1990 are from Maddison, 1995.Growth per capita GNP 197698 percent:All data on per capita GNP 1976 are from the World Bank's World Development Report 1978and nearly all data on per capita GNP 1998 from World Development Report 1999/2000.
REFERENCES
AbulHubb, D. (1972) Application of Progressive Matrices in Iraq. In L.J. Cronbach and P.J. Drenth (eds)
Mental Tests and Cultural Adaptation. The Hague: Mouton.
Ahmed, R.A. (1989) The development of number, space, quantity and reasoning concepts in Sudanese
schoolchildren. In L.L. Adler (ed.) Cross Cultural Research in Human Development. Westport, CT:
Praeger.
Alonso, O.S. (1974) Raven, g factor, age and school level. Havana Hospital Psiquiatrico Revista, 14, 60
77.
Angelini, A.L., Alves, I.C., Custodio, E.M. and Duarte, W.F. (1988) Manual Matrizes Progressivas
Coloridas. Sao Paulo: Casa do Psicologo.
Baker, D.P. and Jones, D.P. (1993) Creating gender equality; cross national gender stratification and
mathematical performance. Sociology of Education, 66, 91103.
Bart, W., Kamal, A. and Lane, J.F. (1987) The development of proportional reasoning in Qatar. Journal
of Genetic Psychology, 148, 95103.
Bates, R.H. (1998) Governments and Agricultural Markets in Africa. In M.A. Seligson and J.T. PassŽ
Smith (eds) Development and Underdevelopment: The Political Economy of Global Inequality.
Boulder and London: Lynne Rienner Publishers.
Benton, A.E., Mullis, I.V., Martin, M.O., Gonzalez, E.J., Kelly, D.L. and Smith, T.A. (1996a)
Mathematical Achievement in the Middle School Years. Boston College, Chestnut Hill, MA:
TIMSS.
Benton, A.E., Mullis, I.V., Martin, M.O., Gonzalez, E.J., Kelly, D.L. and Smith, T.A. (1996b) Science
Achievement in the Middle School Years. Boston College, Chestnut Hill, MA: TIMSS.
Berry, J.W. (1966) Temne and Eskimo perceptual skills. International Journal of Psychology, 1, 207229.
Boben, D. (1999) Slovene Standardization of Raven's Progressive Matrices. Ljubljana: Center za
Psihodiagnostica.
Boissiere, M, Knight, J.B. and Sabot, R.H. (1985) Earnings, schooling, ability and cognitive skills.
American Economic Review, 75, 10161030.
Bourdier, G.(1964) Utilisation et nouvel etalonnage du P.M. 47. Bulletin de Psychologie, 235, 3941.
Brown, W.W. and Reynolds, M.O. (1975) A model of IQ, occupation and earnings. American Economic
Review, 65, 10021007.
Chaim, H.H. (1994) Is the Raven Progressive Matrices valid for Malaysians? Unpublished.
Chan, J. and Lynn, R. (1989) The intelligence of six year olds in Hong Kong. Journal of Biosocial
Science, 21, 461464.
Costenbader, V. and Ngari, S.M. (2000) A Kenya standardisation of the Coloured Progressive Matrices.
Unpublished.
Court, J.H. (1980) ResearchersÕ Bibliography for RavenÕs Progressive Matrices and Mill Hill
Vocabulary Scales. Adelaide: Flinders University.
Court, J.H. and Raven, J (1995) Normative, Reliability and Validity Studies: References. Oxford: Oxford
Psychologists Press.
Davenport, K.S. and Remmers, H.H. (1950) Factors in state characteristics related to average A12 V12
test scores. Journal of Educational Psychology, 41, 110115.
Diamond, J. (1998) Guns, Germs and Steel: A Short History of Everybody for the Last 13,000 Years.
London: Vintage.
Duncan, O.D., Featherman, D.L. and Duncan, B. (1972) Socioeconomic Background and Achievement.
New York: Seminar Press.
Eccleston, B., Dawson, M. and McNamara, D. (eds) 1998) The AsiaPacific Profile. London and New
York: Routledge.
Fahrmeier, E.D. (1975) The effect of school attendance on intellectual development in Northern Nigeria.
Child Development, 46, 281285.
The Far East and Australasia 1999 (1999) London: Europa Publications Limited.
Faverge, J.M. and Falmagne, J.C. (1962) On the interpretation of data in intercultural psychology.
Psychologia Africana, 9, 2296.
Flores, M.B. and Evans, G.T. (1972) Some differences in cognitive abilities between selected Canadian
and Filipino students. Multivariate Behavioral Research, 7, 175191.
Frank, A.G. (1996) The Underdevelopment of Development. In Singh C. Chew and R. A. Denemark
(eds) The Underdevlopment of Development. Essays in Honor of Andre Gunder Frank. Thousands
Oaks: Sage Publications.
Frank, A.G. (2000) The Development of Underdevelopment (1969). In T. Roberts and A. Hite (eds) From
Modernization to Globalization. Malden, Massachusetts: Blackwell Publishers.
Gardner, H.S. (1998) Comparative Economic Systems. Second Edition. Forth Worth Philadelphia: The
Dryden Press.
Glewwe, P and Jaccoby, H. (1992) Estimating the Determinants of Cognitive Achievement in Low
Income Countries. Washington, DC: World Bank.
Goosens, G. (1952) Etalonnage du Matrix 1947 de J.C.Raven. Revue Belge de Psychologie et de
Pedagogie, 14, 7480.
Heyneman, S.P. and Jamison, D.T. (1980) Student learning in Uganda. Comparative Education Review,
24, 207220.
Hoyos, C. and Littlejohns, M. (2000) Annan draws up road map to guide UN. Financial Times, 4 April,
16.
Hsu, C. (1976) The learning potential of first graders in Taipei city as measured by RavenÕs Coloured
Progressive Matrices. Acta Pediatrica Sinica, 17, 262274.
Human Development Report 1997 (1997) Published for the United Nations Development Programme
(UNDP). New York: Oxford University Press.
Human Development Report 1999 (1999) Published for the United Nations Development Programme
(UNDP). New York: Oxford University Press.
Human Development Report 2000 (2000) Published for the United Nations Development Programme
(UNDP). New York: Oxford University Press.
Hunter, J.E. and Hunter, R.F. (1984) Validity and utility of alternative predictors of job performance.
Psychological Bulletin, 96, 7298.
IEA (1998) Science achievement in Seventeen Countries. Oxford: Pergamon.
Jaworowska, A. and Szustrowa, T. (1991) Podrecznik Do Testu Matryc Ravena. Warsaw: Pracownia
Testow Psychologicznych.
Jencks, S. (1972) Inequality. London: Penguin.
Jencks, C. (1979) Who Gets Ahead? The Determinants of Economic Success in America. New York:
Basic Books.
Jensen, A.R. (1998) The g Factor. Westport, CT: Praeger.
Kamarck, Andrew M. (1976) The Tropics and Economic Dvelopment: A Provocative Inquiry into the
Poverty of Nations. Baltimore and London: The Johns Hopkins University Press.
Klingelhofer, E.L. (1967) Performance of Tanzanian secondary school pupils on the Raven Standard
Progressive Matrices test. Journal of Social Psychology, 72, 205215.
Kyostio, O.K. (1972) Divergence among school beginners caused by different cultural influences. In L.J.
Cronbach and P.J. Drenth (eds) Mental Tests and Cultural Adaptation. The Hague: Mouton.
Landes, D.S. (1998) The Wealth and Poverty of Nations: Why Some Are So Rich and Some So Poor.
New York: W.W. Norton & Company.
Laroche, J.L. (1959) Effets de repetition du Matrix 38 sur les resultats dIenfants Katangais. Bulletin du
Centre dIEtudes et Recherches Psychotechniques, 1, 8599.
Li, C.C. (1975) Path Analysis: A Primer. Pacific Grove, CA: Boxwood Press.
Lynn, R. (1977) The intelligence of the Chinese and Malays in Singapore. Mankind Quarterly, 18, 125
128.
Lynn, R. (1979) The social ecology of intelligence in the British Isles. British Journal of Social and
Clinical Psychology, 18, 112.
Lynn, R. (1980) The social ecology of intelligence in France. British Journal of Social and Clinical
Psychology, 19, 325331.
Lynn, R. (1981) The social ecology of intelligence in the British Isles, France and Spain. In
M.P.Friedman, J.P.Das and N. O'Connor (eds) Intelligence and Learning. New York: Plenum.
Lynn, R. (1991) Race differences in intelligence: a global perspective. Mankind Quarterly, 31, 255294.
Lynn, R. (1994) The intelligence of Ethiopian immigrant and Israeli adolescents. International Journal of
Psychology, 29, 5556.
Lynn, R. (1997) Intelligence in Taiwan. Personality and Individual Differences, 22, 585586.
Lynn, R and Hampson, S.L. (1986) The rise of national intelligence: evidence from Britain, Japan and the
USA. Personality and Individual Differences, 7, 23332.
Lynn, R., Pagliari, C. and Chan, J. (1988) Intelligence in Hong Kong measured for SpearmanÕs g and the
visuospatial and verbal primaries. Intelligence, 12, 423433.
Lynn, R. and Song, M.J. (1994) General intelligence, visuospatial and verbal abilities of Korean children.
Personality and Individual Differences, 16, 363364.
Lynn, R., and Vanhanen, T. (2002) IQ and the Wealth of Nations. Westport, Connecticut: Praeger.
MacArthur, R.S., Irvine, S.H. and Brimble, A.R. (1964) The Northern Rhodesia Mental Ability Survey.
Lusaka: Rhodes Livingstone Institute.
McClelland, D.C. (1976) The Achieving Society. Princeton: Van Nostrand.
Maddison, A. (1995) Monitoring the World Economy 18201992. Paris: Development Centre of the
Organisation for Economic Cooperation and Development.
Mannheim, J. B., Rich, R. C. (1986) Empirical Political Analysis: Research Methods in Political Science.
Second edition. New York and London: Longman.
Martin, M.O. (1997) Science Achievement in the Primary School Years. Boston College, Chestnut Hill,
MA: TIMSS.
Mullis, I.V.S. (1997) Mathematics Achievement in the Primary School Years. Boston College, Chestnut
Hill, MA: TIMSS.
The Middle East and North Africa 1998 (1998). London: Europa Publications Limited.
Montesquieu (1961[1748]) De l'Esprit des Lois. Paris: Editions Garnier FrŽres.
Murray, C. (1998) Income Inequality and IQ. Washington, DC: AEI Press.
Natalicio, L. (1968) Aptidatao general, status social e sexo: um estudio de adolescentes Brasilieros e
norteAmericanos. Revista Interamericana de Psicologia, 2, 2534.
Neisser, U. (1998) The Rising Curve. Washington, DC: American Psychological Association.
Nkaya, H.N., Huteau, M and Bonnet, JP. (1994) Retest effect on cognitive performance on the Raven
Matrices in France and in the Congo. Perceptual and Motor Skills, 78, 503510.

Ombredane, A., Robaye, F. and Robaye, E. (1952) Analyse des resultats d'une application experimentale
du matrix 38 a 485 noirs Baluba. Bulletin Centre dIEtudes et Researches Psychotechniques, 7, 235
255.
Owen, K. (1992) The suitability of Raven's Progressive Matrices for various groups in South Africa.
Personality and Individual Differences, 13, 149159.
Pollitt, E., Hathirat, P., Kotchabhakdi, N., Missell, L. and Valyasevi, A. (1989) Iron deficiency and
educational achievement in Thailand. American Journal of Clinical Nutrition, 50, 687697.
Ramsay, F.J. (1999) Global Studies: Africa. Eight Edition. Sluice Dock, Guilford, Connecticut:
Dushkin/McGrawHill.
Rao, S.N. and Reddy, I.K. (1968) Development of norms for RavenÕs Coloured Progressive Matrices on
elementary school children. Psychological Studies, 13, 105107.
Raven, J. (1981) Irish and British Standardisations. Oxford: Oxford Psychologists Press.
Raven, J (1986) Manual for RavenÕs Progressive Matrices and Vocabulary Scales. London: Lewis.
Raven, J. (1998) Manual for RavenÕs Progressive Matrices. Oxford: Oxford Psychologists Press.
Raven, J. and Court, J.H. (1989) Manual for RavenÕs Progressive Matrices and Vocabulary Scales.
London: Lewis.
Raven, J.C., Court, J.H. and Raven, J. (1995) Coloured Progressive Matrices. Oxford: Oxford
Psychologists Press.
Raven, J.C., Court, J.H. and Raven, J. (1996) Standard Progressive Matrices. Oxford: Oxford
Psychologists Press.
Raven, J.C., Court, J.H. and Raven, J. (1999) Standard Progressive Matrices. Oxford: Oxford
Pychologists Press.
Raven, J., Raven, J.C. and Court, J.H. (1998) Coloured Progressive Matrices. Oxford: Oxford
Psychologists Press.
Rimoldi, H.J. (1948) A note on RavenÕs Progressive Matrices Test. Educational and Psychological
Measurement, 8, 347352.
Reid, N. and Gilmore, A. (1989) The RavenÕs Standard Progressive Matrices in New Zealand.
Psychological Test Bulletin, 2, 2535.
Risso, W.L. (1961) El test de Matrice Progressivas y el test Domino. Proceedings of the 1961 Conference
of the Psychological Society of Uruguay.
Sahin, N. and Duzen, E. (1994) Turkish standardisation of Raven's SPM. Proceedings of the 23rd
International Congress of Applied Psychology, Madrid.
Santos, T. dos (1993) The Structure of Dependence. In M. A. Seligson and J. T. PassŽSmith (eds)
Development and Underdevelopment. Boulder: Lynne Rienner Publishers.
Santos, T. dos (1996) Latin American Underdevelopment: Past, Present, and Future. In Singh C. Chew
and R. A. Denemark (eds) The Underdevelopment of Development. Essays in Honor of Andre
Gunder Frank. Thousands Oaks: Sage Publications.
Seligson, M.A. and PassŽSmith, J.T. (eds) (1998) Development and Underdevelopment. The Political
Economy of Global Inequality. Boulder: Lynne Rienner Publishers.
Shigehisa, T. and Lynn, R. (1991) Reaction times and intelligence in Japanese children. International
Journal of Psychology, 26, 195202.
Simoes, M.M.R. (1989) Un estudo exploratorio com o teste das matrizes progressivas de Raven para
criancas. Proceedings of the Congress of Psychology, Lisbon.
Sinha, U.(1968) The use of RavenÕs Progressive Matrices in India. Indian Educational Review, 3, 7588.
Smith, A. (1976[1776]) An Inquiry into the Nature and Causes of The Wealth of Nations. Edited by
Edwin Cannan. Chicago: The University of Chicago Press.
Sorokin, B. (1954) Standardisation of the Progressive Matrices test. Unpublished Report.
Tesi, G. and Bourtourline Young, H. (1962) A standardisation of RavenÕs Progressive Matrices. Archive
de Psicologia Neurologia e Pscichologia, 5, 455464.
Valentine, M. (1959) Psychometric testing in Iran. Journal of Mental Science, 105, 93107.
Valenzuela, J.S. and Valenzuelas, A. (1998) Modernization and dependency: Alternataive Perspectives in
the Study of Latin American Underdevelopment. In M.A. Seligson and J.T. PassŽSmith (eds)
Development and Underdevelopment. The Political Economy of Global Inequality. Boulder: Lynne
Rienner Publishers.
Vejleskov, H. (1968) An analysis of Raven Matrix responses in fifth grade children. Scandinavian
Journal of Psychology, 9, 177186.
Wallerstein, I. (1998) The Present State of the Debate on World Inequality. In M.A. Seligson and J.T.
PassŽSmith (eds) Development and Underdevelopment. The Political Economy of Global
Inequality. Boulder: Lynne Rienner Publishers.
Weber, M. (1970[1930]) The Protestant Ethic and the Spirit of Capitalism (1904). Translated by T.
Parsons. New York: Schriber.
Weede, E. (1998) Why People Stay Poor Elsewhere, in M.A. Seligson and J.T. PassŽSmith (eds)
Development and Underdevelopment: The Political Economy of Global Inequality. Boulder and
London: Lynne Rienner Publishers.
Wober, M. (1969) The meaning and stability of RavenÕs matrices test among Africans. International
Journal of Psychology, 4, 229235.
World Bank (1978) World Development Report 1978. Published for the World Bank. New York: Oxford
University Press.
World Bank (1999) World Development Report 1998/1999. Published for the World Bank. New York:
Oxford University Press.
World Bank (2000) World Development Report 1999/2000: Entering the 21st Century. Published for the
World Bank. New York: Oxford University Press.
Zahirnic, C., Girboveanu, M., Onofrei, A., Turcu, A., Voicu, C. Voicu, M and Visan, O.M. (1974)
Etolonarea matricelor progressive colorate Raven. Revista de Psihologie, 20, 313321.
Zindi, F. (1994) Differences in psychometric performance. The Psychologist, 7, 549552.
Estimation of Missing National IQs
We want to extend the analysis to the further 104 countries with populations of more than 50,000 forwhich we have not been able to find IQ data. For these 104 countries we have estimated the IQs. Twoprinciples have been adopted for making the estimates of national IQs for those countries for which dataare lacking. First, it is assumed that national IQs which are unknown will be closely similar to those inneighboring countries whose IQs are known. It can be seen from the results set out in Table 6.1 thatneighboring countries normally have closely similar IQs. Thus, for instance, the IQ in both Germany andthe Netherlands is 102; the IQ in Japan is 105 and the IQ in South Korea is 106; the IQ in Argentina andin Uruguay is 96; the IQ in Uganda is 73 and in Kenya 72; and so forth. It is therefore assumed that wherenational IQs are unknown, they will be closely similar to those in neighboring countries. We havetherefore taken the most appropriate neighboring countries and used their IQs to assign IQs to countrieswhose IQs are unknown. Where there are two or more appropriate neighboring countries, the IQs of theseare averaged to obtain an estimated IQ for the country whose IQ is unknown. Thus, for example, toestimate an IQ for Afghanistan, we have averaged the IQs of neighboring India (81) and Iran (84) to givean IQ of 83. Averages with decimal points have been rounded towards 100.A second principle for the estimation of national IQs has been used for several countries which areracially mixed and for which there is no similar neighboring country. In these cases we have assigned IQsto the racial groups on the basis of the known IQs of these groups in neighboring countries. For example,Cape Verde, the archipelago off the coast of Senegal, has a population which is 1 percent white, 28percent black and 71 percent mixed blackwhite (Philip's, 1996). On the basis of the IQs of these groupsin South Africa, it is assumed that the whites have an IQ of 94, the blacks of 66 and the mixed of 82, theIQ of South African coloreds (see Appendix 1). Weighting these figures by the percentages in thepopulation gives an IQ of 78.The racially mixed population of the Comoros consists of African (black), Arab and Malagasy elements.It is not any longer possible to separate clearly different racial groups. Because the racial composition ofthe population is comparable with Madagascar's population, we estimate its national IQ to be 79, the sameas in Madagascar. The MalayoPolynesians and Negroids constitute the principal elements in the raciallymixed population of Madagascar. The contribution of each of them may be approximately equal.Therefore, it is reasonable to estimate the national IQ for Madagascar on the basis of the Philippines (86)and Tanzania (72), which gives an IQ of 79 for Madagascar. For Mauritius, the population consists of 68percent Indians, 27 percent Creole (blackwhite hybrids), 3 percent Chinese and 1 percent whites. It isassumed that the IQs are 81 for the Indians (as in India), 82 for the Creoles (as for South Africancoloreds), 100 for the Chinese (as in China) and 94 for the whites (as for the whites in South Africa).Weighting these figures by the percentages in the population gives an IQ of 81.Table 4 shows these estimated IQs and the comparison countries on which they are based, together withmeasured IQs. We should emphasize that these data on national IQs are estimates and that they certainlycontain errors, but we assume that the margin of error is relatively small in nearly all cases.