Embed Size (px)
Citation preview

H E A L T H L E A D E R S M E D I A . C O M / I N T E L L I G E N C E
PERSPECTIVE . . . . . . . . . . . . 2
ANALYSIS . . . . . . . . . . . . . . . . 4
SURVEY RESULTS . . . . . . . . . 8
METHODOLOGY . . . . . . . . . 22
RESPONDENT PROFILE . . . 23
SPO
NSO
RED
BY:
A P R I L 2 0 1 9
An Independent HealthLeaders Report Powered by:
NAVIGATING THE M&A LANDSCAPE: ACHIEVING CLINICAL AND FINANCIAL OBJECTIVES
INTELLIGENCE REPORT68%of respondents say they expect the CVS-Aetna merger to have
major impact on the competitive landscape among U.S.
healthcare providers within the next three years

H E A L T H L E A D E R S M E D I A . C O M / I N T E L L I G E N C E • A P R I L 2 0 1 9 2
PERSPECTIVE
TOC
Mission, Vision and Values. An orga-nization’s Mission and Vision state-ments should outline an achievable yet ambitious future that resonates with the clinicians, staff, management, board and other relevant stakehold-ers (“Stakeholders”). The statements should not create skepticism but be sincere guardrails for future strategic plans and decision-making, used rou-tinely by executives and easily articu-lated by all key Stakeholders.
Governance. The system-wide and local governing boards that govern the system should be proactively educated about the New Healthcare Order. Endemic macro and micro
issues facing their organization and health-care facilities should not be a surprise but, rather, they should be transparently engaged and aligned in the curative steps, whether or not difficult or previously inconceivable, that may be necessary to ensure sustainabil-ity. Too often, governing bodies are naive or uninformed about the relative strengths and weaknesses of their organization or broad-er demographics. In my experience, such a lack of “education” may be fatal or signifi-cantly disruptive to an ongoing collaboration or merger negotiation. As mentioned in the 2019 HealthLeaders Mergers, Acquisitions,
It is hard to dispute the notion that the mission of today’s health systems, predominantly hospital-centric over the last 50+ years, is undergoing a significant transformation. Some might even refer to the transformation as happening at warp speed compared to the historically modest rates of change seen over the last few decades. Are we witnessing the advent of healthcare’s own version of Moore’s Law, which described the disruptive, exponential increase in micropro-cessor size, speed and capacity advancements?
The rapid transformation of our system has clearly induced stressors, the symptoms of which are evidenced by rating agency warnings and weakening financial performance due to a plethora of factors. The factors impacting our legacy health systems include: 1) the significant shift from fee for service to value-based care that is disrupting mar-kets and geographies at an uneven pace; 2) the decrease of inpatient utilization due to technology and increase of other lower-cost and more convenient ambulatory/outpatient care settings; 3) the macroeconomic factors resulting in increased cost of capital and the failure of overall reimbursement to keep up with health expense inflation and the costs of unfunded governmental man-dates; and 4) the reaction of competitors (both horizontal and vertical) that impact market share and attributable lives.
The above level setting should cause healthcare leaders and boards to ask: ‘Will your organization enter the New Healthcare Order proactive, self-guided and agile or more like a rudderless vessel being towed to harbor?’ The answer to this question may not be binary and certainly will be influenced by vision, leadership and proactive stewardship. Healthcare leaders may want to consider the following areas:
WILL YOUR ORGANIZATION ENTER THE NEW HEALTHCARE ORDER PROACTIVE, SELF-GUIDED AND AGILE OR MORE LIKE A RUDDERLESS VESSEL BEING TOWED TO HARBOR?
Brent McDonald Head of Healthcare
Strategic Advisory Services, Managing DirectorBank of America
Merrill Lynch

H E A L T H L E A D E R S M E D I A . C O M / I N T E L L I G E N C E • A P R I L 2 0 1 9 3
PERSPECTIVE
TOC
and Partnerships Survey, the top three non-financial reasons respon-dents say that an M&A was abandoned before or during the due diligence phase are mistrust between parties (30%), concern about governance (27%) and incompatible cultures (21%).
Culture of Learning/Effective Lines of Communication to Key Stakeholders. The culture of the organization should embrace collaborative learning, best practices and process/performance improvement. Key medical staff and clinical leadership should be able to effectively model and communicate an aligned culture around organizational improvement. The same weaknesses and opportuni-ties known to the governing bodies should not be a mystery to clinical stakeholders so that agenda-laden or uninformed objections to executing on the long-term strategic plan should be lessened. Communications to Stakeholders should reinforce the culture.
Organizational Emphasis on Sustainability. Sustainability will in large part be influenced by the operations and organization meeting the Triple Aim, achieving relevance/attractiveness with employers and payers and the convenience and connectivity with actual patients, both in terms of the digital ease of patient encounters and conve-nience of care delivery access points. While responses to the 2019 HealthLeaders Mergers, Acquisitions, and Partnerships Survey indi-cate that no single financial objective is responsible for driving M&A activity, respondents state four tightly clustered reasons: improve
“Bank of America Merrill Lynch” is the marketing name for the global banking and global markets businesses of Bank of America Corporation. Lending, derivatives, and other commercial banking activities are performed globally by banking affiliates of Bank of America Corporation, including Bank of America, N.A., Member FDIC. Securities, strategic advisory, and other investment banking activities are performed globally by investment banking affiliates of Bank of America Corporation (“Investment Banking Affiliates”), including, in the United States, Merrill Lynch, Pierce, Fenner & Smith Incorporated and Merrill Lynch Professional Clearing Corp., both of which are registered broker-dealers and Members of SIPC, and, in other jurisdictions, by locally registered entities. Merrill Lynch, Pierce, Fenner & Smith Incorporated and Merrill Lynch Professional Clearing Corp. are registered as futures commission merchants with the CFTC and are members of the NFA. Investment products offered by Investment Banking Affiliates: Are Not FDIC Insured • May Lose Value • Are Not Bank Guaranteed. ©2019 Bank of America Corporation. ARN5JXVH
financial stability (60%), increase market share within geography (55%), improve operational cost efficiencies (54%), and expand geographic coverage (53%). And survey respondents say the top care delivery objective for M&A activity is to improve their position for care delivery effi-ciencies (60%). Sustainability will likely require that the organization collaborate with other third parties to meet community needs and address competencies not possessed (e.g., population health, capitation management, post-acute care, etc.).
The non-exhaustive list of categories above will hopefully confirm your existing progress on the journey or serve as a challenge for areas that need to be addressed. I trust your answer to the opening question is that your healthcare system is committed to preparing both the organization and all Stakeholders for a non-linear journey towards the New Healthcare Order that will likely require col-laboration, course corrections and discipline.

H E A L T H L E A D E R S M E D I A . C O M / I N T E L L I G E N C E • A P R I L 2 0 1 9 4
ANALYSIS
TOC
MEGAMERGERS ADD SPICE TO M&A ACTIVITY
deals and completing deals underway (Figure 10). This means that nearly three-quarters (73%) of respondents will be exploring poten-tial deals during this period.
Megamergers take center stage. While steady healthcare industry M&A activity has been with us for some time, a series of new and rumored megamergers and part-nerships is capturing the headlines these days. This recent M&A move-ment toward vertical integration involving nontraditional partners suggests that the healthcare indus-try is undergoing a major transfor-mation, one that will likely alter the landscape in unanticipated ways.
The majority of respondents in our sur-vey say that they expect significant industry impact from these megamergers (Figure 1), led by CVS Health’s merger with Aetna (68%), Walmart’s potential deal with Humana (57%), and Amazon’s partnership with JPMorgan Chase and Berkshire Hathaway (49%). While information regarding the latter two develop-ments is in short supply, respondents see the potential for large-scale impact.
Faced with such far-reaching and transfor-mative new relationships, what are health-care providers to do? As things currently stand, even the largest health systems lack the scale to negotiate on equal footing with most insurers, and these new hybrid
Despite continued and sometimes unsettling M&A activity in the industry, the fundamental mission of healthcare has not changed. Merger, acquisition, and partnership (M&A) activity within the healthcare industry shows no sign of diminishing, with nearly all indicators pointing to continued consolidation. The fundamental need for greater scale, geographic cover-age, and increased integration remains unchanged for pro-viders, and this will sustain M&A activity for years to come.
Evidence of the M&A trend’s resiliency is found through-out our 2019 HealthLeaders Mergers, Acquisitions, and Partnerships Survey. For example, 91% of respondents expect their organizations’ M&A activity to increase (68%) or remain the same (23%) within the next three years (Figure 12), an indication of the trend’s depth. Note that only 1% of respondents expect this activity to decrease.
Likewise, 38% of respon-dents say that their orga-nization’s M&A plans for the next 12–18 months consist of exploring potential deals, up six percentage points over last year’s survey, and another 35% say that their M&A plans consist of both exploring potential
Jonathan Bees Research Analyst
of respondents say (in a tie) that incompatible cultures and disagree-
ment about organizational mission are why their most recent M&A
activity fell short of expectations
43%

H E A L T H L E A D E R S M E D I A . C O M / I N T E L L I G E N C E • A P R I L 2 0 1 9 5
ANALYSISorganizations combine scale, technology, and innovative structures.
However, there is no need for providers to panic—these megamergers are still in the early stages of implementation, and the fundamental mission of healthcare has not changed.
“I don’t think people fully understand the real business purpose of this type of activity yet, or what these organizations are trying to get out of their connections,” says Kevin Brown, president and CEO of Piedmont Healthcare, a Georgia-based nonprofit health system with 11 hospitals and nearly 600 locations, and advisor for this Intelligence Report. “Time will tell regarding the impact they will have on the industry landscape and its different segments.
“I haven’t spent a lot of time thinking or worrying about these new developments. Generally, I spend my time thinking about what we are doing on a day-to-day basis as an organization to fulfill our mission and take care of the communities we serve. I’m certainly aware of these developments, but it’s important not to get distracted from our core purpose,” Brown says.
Financial and clinical impacts. From a practical standpoint, the healthcare industry will continue to function in some version of its current form for some years to come, regardless of megamerg-ers, and providers engaged in M&A activity must remain focused on achieving their core financial and clinical objectives.
In general, survey respondents indicate that M&A activity has had a positive financial impact on their organization, with 76% saying that net patient revenue either increased (57%) or remained the same (19%), and only 8% indicating that it decreased (Figure 6). Similarly, 66% say that operating margin either increased (32%) or remained the same (34%), and 17% say that it decreased.
However, survey respondents are less positive about the impact on the cost of providing care, with 59% saying that costs either increased (20%) or remained the same (39%). Viewed another
way, a nearly equal percentage say that costs increased (20%) as decreased (21%), which suggests that M&A activity has not always succeeded in the important mission of bringing down costs.
Brown points out that increasing scale through M&A activity doesn’t necessarily yield cost efficiencies in every aspect of a healthcare organization, and that the most attractive opportunities are not at the bedside.
“I don’t think you get a lot of efficiency from scale directly at the bedside, such as in terms of labor costs. You get efficiency from scale for things like drug costs and eliminating the duplication of expensive services, hardware, and software. The supporting cast for cap-turing efficiency from increased scale comes from costs that are away from the direct bedside, such as the electronic health record platform or from having a single payroll sys-tem that allows you to process payroll at the lowest possible cost,” he says.
The story for clinical impacts from M&A activ-ity is also promising, with respondents most-ly reporting positive views on the impacts their organization experienced after its most recent M&A activity (Figure 6). For example, a greater percentage say that patient readmis-sions decreased (18%) than increased (8%), although a large percentage (44%) report that this remained the same. And a greater percentage say HCAHPS scores increased (11%) than decreased (6%), although 48% say this remained the same. Lastly, a greater
TOC

H E A L T H L E A D E R S M E D I A . C O M / I N T E L L I G E N C E • A P R I L 2 0 1 9 6
ANALYSISpercentage say quality outcomes increased (23%) than decreased (8%). Forty-six percent indicate this remained the same.
For the 8% of respondents who experienced a decrease in quality outcomes and 46% that report this remained the same after an M&A, Brown questions the merit of making this sort of financial commitment. “Why would you do this if you can’t improve quality?”
“First and foremost, Piedmont Health’s M&A activities focus on care delivery and creating a more integrated product for the communi-ties that we serve. The goal is to have an integrated product where everything is coordinated and connected, and through that we deliver a higher-quality, lower-cost model for our patients,” he says.
Another somewhat troubling survey finding for clinical impacts are the high response rates for “don’t know.” The responses are 30% for patient readmissions, 36% for HCAHPS scores, and 23% for quality outcomes, indicating a disconcerting lack of respondent awareness of these important metrics.
“We look at the approximately 26 metrics associated with the Leapfrog Composite, which allows us to see performance in real time,” says Brown. “And we’ve been able to determine that every-body that has joined the Piedmont family demonstrates improve-ment in these metrics fairly quickly. And not only that, many of the organizations that join us do some things around quality that are actual-ly better, and we adopt those practices as well.”
M&A again? While it is clear that most respon-dent organizations expe-rienced positive impacts from their M&A activity, the high levels for “don’t know” responses and
mediocre results for increasing quality out-comes leaves the door open to an interest-ing question. Would respondents say their organization would choose to participate again in their most recent M&A activity?
Revealingly, two-thirds (66%) of respondents say that their organization would choose to participate again in its most recent M&A activity (Figure 8), a positive finding given the costs and complexity of such undertakings. Note, however, that this result is down seven percentage points over last year’s survey. In a similar vein, 16% of respondents—double last year’s percentage—indicate that they would not choose to participate again. These data points will be something to watch in subsequent surveys.
Case for softening growth. Note that these data points aren’t the only ones suggest-ing that healthcare organizations may be thinking about tapping the brakes. While the outlook for continued growth in M&A activity appears strong and the majority of survey data suggests several more years of growth, there are a handful of results that suggest that activity levels may be on the verge of easing.
One such example is the survey question that asks about the nature of respondents’ most recent M&A activity (Figure 4). While the results show slightly increased activity in acquiring another organization (31%)—up five percentage points over last year—and slightly decreased activity for a contractual
TOC
of respondents say their organization would choose to
participate again in its most recent M&A activity
66%

H E A L T H L E A D E R S M E D I A . C O M / I N T E L L I G E N C E • A P R I L 2 0 1 9 7
ANALYSISrelationship, but not M&A (23%)—down six points, the most interesting result is for no activity.
Nearly one-quarter (23%) of respondents say that their organiza-tion has had no activity recently, almost double last year’s result (12%). Whether this is an indication of some softening in the M&A trend is certainly subject to debate, particularly given the strong data from other survey questions related to M&A activity.
Another example of softening is the survey result for cumulative total dollar value of the M&A activity organizations will be exploring over the next three years (Figure 14). Respondents indicate that 55% of the cumulative total dollar value falls below $50 million, and 22% is $50 million and above. Compared with last year’s survey, there appears to be a shift toward lower cumulative total dollar value: the less-than-$50-million range is eight percentage points higher (55% versus 47%) than last year, and the $50 million and more range is eight points lower (22% versus 30%). Translation: respondent M&A budgets appear to be decreasing slightly.
It’s not you, it’s me. When providers begin the difficult task of performing due diligence, there are no guarantees that a formal agreement will be concluded. There are a number of ways that a potential deal can fall apart, both financially and operationally, and both sides must come to a consensus for a deal to move forward.
On the financial side of the slate (Figure 15), respondents say that the top three reasons that an M&A involving their organization was abandoned before or during the due diligence phase are concerns about assumption of liabilities (23%), regulatory issues (22%), and concerns about risk/revenue sharing (20%). Note that the response for regulatory issues is nine percentage points higher than in last year’s survey, suggesting that recent high M&A activity may be attracting government attention.
On the operational side (Figure 16), respondents indicate the top three reasons that an M&A involving their organization was
abandoned before or during the due dili-gence phase are mistrust between parties (30%), concern about governance (27%), and incompatible cultures (21%). This represents a change in sequence over last year’s survey where the order was incompatible cultures (30%), concern about governance (24%), and concern about operational transition plan (21%).
The importance of cultural compatibility is a common theme in any discussion of M&A success or failure, as is establishing a basis for trust between the two organizations. Brown says that it’s critical to do your homework up front on these key issues, and he says not to underestimate their importance or assume that differences can be easily overcome later.
“We do a lot of work on the front end to make sure that it’s going to be a success on the back end,” says Brown. “If we can’t get through the front end, we move on to other opportunities.”
TOC
Jonathan Bees is a research analyst for HealthLeaders.

H E A L T H L E A D E R S M E D I A . C O M / I N T E L L I G E N C E • A P R I L 2 0 1 9 8
SURVEY RESULTS
Figure 1
Which of these deals do you expect to have a major impact on the competitive landscape among U.S. healthcare providers within the next three years? > Healthcare industry impact. Respondents expect significant
industry impact from megamergers such as the CVS Health’s merger with Aetna (68%), Walmart’s potential deal with Humana (57%), and Amazon’s partnership with JPMorgan Chase and Berkshire Hathaway (49%). While details of the latter two devel-opments are still emerging, respondents see the potential for large-scale impact.
DEALS WITH MAJOR IMPACT ON COMPETITIVE LANDSCAPE
Base = 154, Multi-response
68%
57%
49%
30%26%
7%
Percent of respondents who expect major industry impact from megamergers such as CVS Health’s merger with Aetna.
> Correlation with organizational size. A greater share of respondents from large organizations (74%) than medium (64%) and small organizations (63%) say that they expect CVS Health’s merger with Aetna to have a major impact, and a greater share of respondents from medium (79%) and large (74%) organizations than small organi-zations (48%) say that they expect Walmart’s potential deal with Humana to have a major impact.
TOC
CVS Health’s merger with
AetnaWalmart’s
potential deal with Humana
Amazon’s partnership
with JPMorgan Chase and Berkshire Hathaway
Cigna’s merger with
Express Scripts
Walgreens’ collaboration with Microsoft
Other

H E A L T H L E A D E R S M E D I A . C O M / I N T E L L I G E N C E • A P R I L 2 0 1 9 9
Figure 2
What are the financial objectives of your merger, acquisition, and/or partnership (M&A) planning or activity?> Range of financial objectives. The range of financial objec-
tive responses indicates that no single objective is respon-sible for driving M&A planning or activity. The four highest responses are separated by only seven percentage points:
TOC
SURVEY RESULTS
Improve financial stability
Increase market share within our geography
Improve operational cost efficiencies
Expand geographic coverage
Improve position for payer negotiations
Expand position in care continuum
Improve access to capital
Improve access to operational expertise
Improve access to financial management
Other
60%
55%
54%
53%
47%
47%
32%
23%
17%
5 %
Base = 133, Multi-response
FINANCIAL OBJECTIVES
The range of financial objective responses indicates that no single objective is responsible for driving M&A planning or activity. The four highest responses are: improve financial stability, increase market share within geog-raphy, improve operational cost efficiencies, and expand geographic coverage.
improve financial stability (60%), increase market share within our geography (55%), improve operational cost efficiencies (54%), and expand geographic coverage (53%).
> Results comparable to last year. The top three responses in last year’s survey are comparable to this year’s results: improve financial stability (63%), improve operational cost efficiencies (61%), and increase market share within our geography (60%).
> Top objectives based on organizational size. The top response for large organizations is improve operational cost efficiencies (70%), while for small (65%) and medium (64%) organizations the top response is improve financial stability.

H E A L T H L E A D E R S M E D I A . C O M / I N T E L L I G E N C E • A P R I L 2 0 1 9 1 0
Figure 3
What are the care delivery objectives of your M&A planning or activity?> Top three care delivery objectives. Improve position for care
delivery efficiencies (60%), improve position for population health management (58%), and improve clinical integration (53%) are the top three responses for care delivery objectives of respondents’ M&A planning or activity.
> Health system and hospital focus. Respondents from health systems and hospitals have a strong interest in population health management and improving clinical integration. For example, the
TOC
SURVEY RESULTS
CARE DELIVERY OBJECTIVES
Percent of respondents who say improving their position for care delivery efficiencies is their top care delivery objective for M&A planning or activity.
top two care delivery objectives for health systems are improve position for popula-tion health management (67%) and improve clinical integration (67%), and for hospitals it’s improve clinical integration (62%) and improve position for population health man-agement (58%).
> Relatively few divesting. Only a small num-ber of respondents mention divest to sharpen strategic mission (14%), an indication that M&A activity hasn’t expanded organizational scope such that providers have strayed from their core strategic missions. On the other hand, a greater share of large organizations (17%) mention divesting than small (13%) and medium (7%) organizations, an indication that larger organizations may be slightly more susceptible to strategic drift.
Improve position for care delivery efficiencies
Improve position for population health management
Improve clinical integration
Expand position in care continuum
Gain care delivery cost efficiencies through scale
Expand into new care delivery areas
Improve or enhance clinical talent
Divest to sharpen strategic mission
Other
60%
58%
53%
44%
44%
40%
30%
14%
6%
Base = 124, Multi-response

H E A L T H L E A D E R S M E D I A . C O M / I N T E L L I G E N C E • A P R I L 2 0 1 9 1 1
Figure 4
Please describe the nature of your most recent M&A activity. > Acquiring vs. partnering with another organization. The response
“we acquired another organization” (31%) tops the list of respons-es, an increase of five percentage points over last year’s result. Note that the response for a contractual relationship, but not M&A (23%), while second highest, declined six points compared with last year.
> No activity response nearly doubles. Nearly one-quarter (23%) of respondents say that their organization has had no activity recent-ly, almost double last year’s result (12%). Whether this result is an
The response “we acquired another organization” tops the list for respondents describing the nature of their most recent M&A activity.
TOC
SURVEY RESULTS
31%
23%
23%
10%
9%
4%
We acquired another organization
A contractual relationship, but not M&A
We were acquired by another organization
A merger of two organizations into one
Other
No activity
Base = 121
indication of some softening in the M&A trend is open to debate, particularly given the robust data from other survey questions related to M&A activity.
> Correlations with industry setting. A greater share of health systems (50%) than hospitals (19%) say that they have acquired another organization, and a greater share of hospi-tals (35%) than health systems (10%) mention contractual relationships, but not M&As as their most recent M&A activity. Further, a greater share of hospitals (19%) than health systems (7%) say they have had no activity.
DESCRIPTION OF M&A ACTIVITY

H E A L T H L E A D E R S M E D I A . C O M / I N T E L L I G E N C E • A P R I L 2 0 1 9 1 2
SURVEY RESULTS
Figure 5
What kind of entity was involved in your most recent M&A activity? > Health systems and hospitals most active. The top two respons-
es for the kind of entity involved in survey respondents’ most recent M&A activity are health systems (37%) and hospitals (25%), which represent 62% of the total M&A activity. Compared with responses in last year’s survey, health systems increased four percentage points and hospitals increased six points.
TOC
ENTITY INVOLVED IN M&A ACTIVITY
The top two responses for the kind of entity involved in survey respondents’ most recent M&A activity are health systems (37%) and hospitals (25%), which represent 62% of the total M&A activity.
> M&A organizational preference. Note that some of the general preferences for health systems and hospitals can be explained by the fact that 30% of the respondent base for this survey is from health systems, and 26% is from hospitals (see Respondent Profile, p. 23), and respondents generally prefer M&A activity with a provider from the same or a similar setting.
For example, 57% of respondents from health systems say that a health system was involved in their most recent M&A activity, and 21% mention a hospital. For hospital respondents, 48% say that a health system was involved in their most recent M&A activity, and 43% mention a hospital. These responses suggest that providers favor increasing scale along similar lines of business, and that increasing infrastructure diversity throughout the care continuum is a secondary strategy.
Health system
Hospital
Physician organization
Physician practice
Ancillary, allied (e.g., home health, rehab, lab)
Health plan, insurer
Long-term care, SNF
Ancillary (e.g., diagnostic, therapeutic, custodial)
Ambulatory surgery center
Retail clinic/urgent care clinic
Other organization
37%
25%
10%
9%
4%
2%
2%
2%
0%
0%
9%
Base = 92, Of those involved in recent M&A activity

H E A L T H L E A D E R S M E D I A . C O M / I N T E L L I G E N C E • A P R I L 2 0 1 9 1 3
SURVEY RESULTS
Figures 6 and 7
Please describe the financial and clinical impacts your organization experienced after its most recent M&A activity.Financial Impacts> Positive financial reviews. Respondents generally report positive
financial impacts after their organization’s most recent M&A activity. Seventy-six percent say that their net patient revenue increased (57%) or remained the same (19%), and only 8% say that it decreased. Likewise, 66% say that operating margin increased (32%) or remained the same (34%), and 17% say it decreased (up six percentage points over last year’s result). The response for cost of providing care is somewhat less positive, with 59% saying that this increased (20%) or remained the same (39%). Note that a nearly equal percentage say that costs increased (20%) as decreased (21%).
TOC
Financial Impacts Increased Remained the same Decreased Don’t know
Net patient revenue 57% 19% 8% 17%
Operating margin 32% 34% 17% 17%
Cost of providing care 20% 39% 21% 20%
Base = 90, Of those involved in M&A activity
FINANCIAL AND CLINICAL IMPACTS
Clinical Impacts Increased Remained the same Decreased Don’t know
Patient readmissions 8% 44% 18% 30%
HCAHPS scores 11% 48% 6% 36%
Quality outcomes 23% 46% 8% 23%
Sixty-six percent say that operating margin increased (32%) or remained the same (34%). Also a greater percentage say quality out-comes increased (23%) than decreased (8%).
Clinical Impacts> Positive clinical impacts. Respondents
mostly indicate positive clinical impacts after their organization’s most recent M&A activ-ity. For example, a greater percentage say that patient readmissions decreased (18%) than increased (8%), although 44% report that this remained the same. And a greater percentage say HCAHPS scores increased (11%) than decreased (6%), although 48% say this remained the same. Encouragingly, a greater percentage say quality outcomes increased (23%) than decreased (8%). Forty-six percent indicate this remained the same.
> “Don’t know” responses troubling. While responses overall are positive, the high response rates for “don’t know” for clini-cal impacts are troubling. These responses come in at 30% for patient readmissions, 36% for HCAHPS scores, and 23% for quality outcomes, indicating a disconcerting lack of awareness for these critical metrics.
Base = 90, Of those involved in M&A activity

H E A L T H L E A D E R S M E D I A . C O M / I N T E L L I G E N C E • A P R I L 2 0 1 9 1 4
SURVEY RESULTS
Figure 8
Looking back, would your organization choose to participate again in its most recent M&A activity?> Majority would do M&A again. Two-thirds (66%) of respondents
say that their organization would choose to participate again in its most recent M&A activity, a positive finding given the costs and complexity of such undertakings. Sixteen percent of respon-dents—double last year’s percentage—indicate that they would not choose to participate again.
TOC
66%Yes
16%No
19%Don’t know
Base = 90, Of those involved in M&A activity
Percent of respondents who say that their organization would choose to participate again in its most recent M&A activity.
> Correlation with organizational size. A greater share of respondents from large (77%) and medium (75%) organizations say that their organization would choose to par-ticipate again in its most recent M&A activity than small organizations (62%).
PARTICIPATE AGAIN IN M&A

H E A L T H L E A D E R S M E D I A . C O M / I N T E L L I G E N C E • A P R I L 2 0 1 9 1 5
SURVEY RESULTS
Figure 9
What are some reasons why your organization’s most recent M&A activity fell short of expectations?> Top reasons M&A fell short. Respondents say that the top two
reasons their organizations’ most recent M&A activity fell short of expectations are incompatible cultures (43%) and disagreement about organizational mission (43%) in a tie. These are followed by responses for operational transition problems (36%) and costs to support the transaction too high (36%).
TOC
Respondents say that the top two reasons their organizations’ most recent M&A activity fell short of expectations are incompatible cultures (43%) and disagreement about organizational mission (43%), in a tie.
> Cultural compatibility critical. In Figure 16,
incompatible cultures (21%) is one of the top three operational reasons respondents men-tion for an M&A involving their organization being abandoned before or during the due diligence phase. Cultural incompatibility is best discovered before an M&A takes place; otherwise, the new relationship could be a difficult one.
Base = 14, Multi-response, Of those who say would not participate again in M&A activity
Incompatible cultures
Disagreement about organization’s mission
Operational transition problems
Costs to support the transaction too high
Financial goals not achieved
Lack of community support
Governance problems
Other
Don’t know
43%
43%
36%
36%
29%
29%
21%
29%
0%
REASONS WHY EXPECTATIONS NOT MET

H E A L T H L E A D E R S M E D I A . C O M / I N T E L L I G E N C E • A P R I L 2 0 1 9 1 6
SURVEY RESULTS
Figure 10
Please describe your organization’s M&A plans for the next 12–18 months.> M&A activity remains strong. Thirty-eight percent of respondents
say that their organization’s M&A plans for the next 12–18 months consist of exploring potential deals, up six percentage points over last year’s survey. Further, 35% of respondents say that their orga-nization’s M&A plans consist of both exploring potential deals and completing deals underway, producing a combined result of 73% for exploring potential deals. Only 19% of respondents say they have no plans for future M&A activity.
TOC
M&A ACTIVITY NEXT 12–18 MONTHS
Percent of respondents who say their organizations’ M&A plans for the next 12–18 months consist of a combination of exploring potential deals and completing deals underway.
> Correlation with organizational type. A greater share of respondents from hospitals (31%) say they have no M&A plans for the next 12–18 months than respondents from physician organizations (14%) and health systems (10%).
Base = 117
Exploring potential deals
Both exploring potential deals and completing deals underway
No M&A plans
Completing deals underway
38%
35%
19%
8%

H E A L T H L E A D E R S M E D I A . C O M / I N T E L L I G E N C E • A P R I L 2 0 1 9 1 7
SURVEY RESULTS
Figure 11
What entities does your organization have a high interest in pursuing through M&A activity within the next year?> Physician practices in demand. Forty percent of respondents
say that their organization has a high interest in pursuing a physician practice through M&A activity within the next year, down eight percentage points from 48% in last year’s survey. This response is followed by ancillary, allied (e.g., home health, rehab, lab) at 33%—up 10 points over last year’s survey—and physician organizations at 31%, up four points. The solid response for physician practices is likely because primary
care physicians are a key component of population health management and clinical integration initiatives.
> Health system and hospital response declines. Responses for health systems (29%)and hospitals (27%) declined eight points and two points, respectively. It is still too early to tell whether respondent appetite for health systems and hospitals is beginning to fade.
> Preference for similar entity. A correlation exists between industry setting and the type of entity respondents say their organization has a high interest in pursuing through M&A activ-ity, with respondent organizations generally pursuing like or similar entities. For example, the top two entities for hospitals are hospitals (60%) and physician practices (53%), and the top three entities for health systems are physi-cian organizations (50%), health systems (46%), and physician practices (46%). For physician organizations, it’s physician practices (56%) and physician organizations (44%).
Percent of respondents who say their orga-nization has a high interest in pursuing a physician practice through M&A activity within the next year.
TOC
TYPE OF ORGANIZATION INTERESTED IN PURSUING
Base = 85, Multi-response, Of respondents exploring potential deals
Physician practice
Ancillary, allied (e.g., home health, rehab, lab)
Physician organization
Health system
Hospital
Ambulatory surgery center
Long-term care, SNF
Ancillary (e.g., diagnostic, therapeutic, custodial)
Retail clinic/urgent care clinic
Health plan, insurer
Other organization
40%
33%
31%
29%
27%
25%
19%
16%
14%
13%
8%

H E A L T H L E A D E R S M E D I A . C O M / I N T E L L I G E N C E • A P R I L 2 0 1 9 1 8
SURVEY RESULTS
Figures 12 and 13
Within the next three years, do you expect your organization’s M&A activity and/or the dollar value to increase, remain the same, or decrease?Level of MAP Activity> Activity levels remain strong. Sixty-eight percent of respondents
expect their organizations’ M&A activity to increase within the next three years, a solid indication that M&A activity levels will remain strong for some time. Approximately one-quarter (23%) say they expect M&A activity to remain the same, and only 1% expect this to decrease.
> Activity level and profit status. A greater share of respondents from for-profit organizations (81%) expect their organizations’ M&A activity to increase within the next three years than nonprofit organizations (65%).
Dollar Value of MAP Activity > M&A dollar value increases. Seventy-one percent of respon-
dents expect the dollar value of their organization’s M&A activity to increase within the next three years, and 16% expect the M&A dollar value to remain the same. Only 7% expect this to decrease. These results indicate a continued interest by respondents in M&A activity with higher-dollar value organizations.
> Dollar value and profit status. As with the level of M&A activity, a greater share of respondents from for-profit organizations (84%) expect the dollar value of their organizations’ M&A activity to increase within the next three years than nonprofit organizations (60%).
TOC
71%
16%
7% 6%
Increase Decrease Don’t knowRemain the same
Value
LEVEL AND VALUE OF M&A ACTIVITY
Base = 82, Of respondents exploring potential deals
Base = 82, Of respondents exploring potential deals
68%
Increase
23%
1%7%
Decrease Don’t knowRemain the same
Activity
Sixty-eight percent of respondents expect their organizations’ M&A activity to increase within the next three years, and 71% of respondents expect the dollar value of their organization’s M&A activity to increase during that same time period.

H E A L T H L E A D E R S M E D I A . C O M / I N T E L L I G E N C E • A P R I L 2 0 1 9 1 9
SURVEY RESULTS
Figure 14
Please estimate the cumulative total dollar value of the M&A activity your organization will be exploring over the next three years. > Budget cuts? Respondent estimates for cumulative total dollar
value of the M&A activity their organizations will be exploring over the next three years indicate that 55% of the total dollar value falls below $50 million, and 22% is $50 million and above. Compared with last year’s survey, there appears to be a shift toward lower cumulative total dollar value: the less-than-$50-million range is eight percentage points higher (55% versus 47%) than last year, and the $50 million and more range is eight points lower (22% versus 30%).
Respondent estimates for cumulative total dollar value of the M&A activity their organizations will be exploring over the next three years indicate that 55% of the total dollar value falls below $50 million, and 22% is $50 million and above.
TOC
CUMULATIVE TOTAL DOLLAR VALUE
Less than $5 million
$5 million – $9.9 million
$10 million – $49.9 million
$50 million – $99.9 million
$100 million – $499.9 million
$500 million or more
Don’t know
22%
17%16%
9%6% 7%
23%
> Softening total spend. Although respondent expectations for M&A activity levels remains strong (Figure 12), the survey results for cumulative total dollar value may suggest a slowing in the number of transactions per provider organization over the next three years.
Base = 82, Of respondents exploring potential deals
H E A L T H L E A D E R S M E D I A . C O M / I N T E L L I G E N C E • A P R I L 2 0 1 9 2 0
SURVEY RESULTS
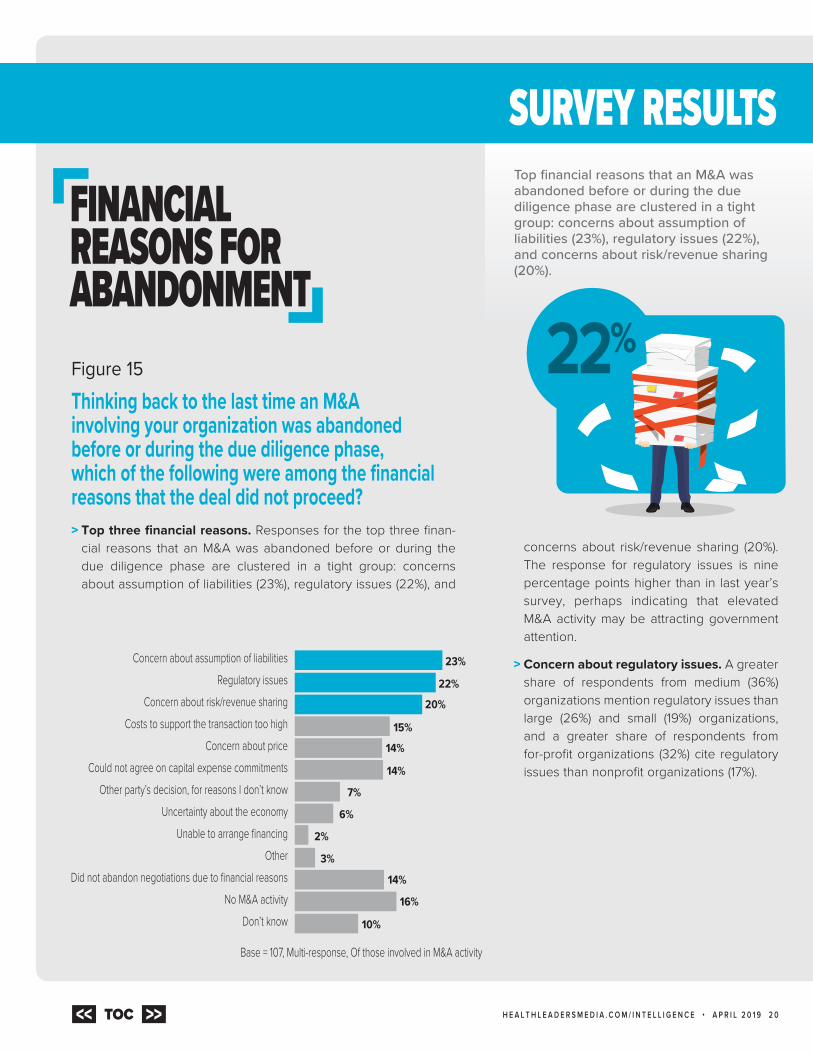
Figure 15
Thinking back to the last time an M&A involving your organization was abandoned before or during the due diligence phase, which of the following were among the financial reasons that the deal did not proceed?> Top three financial reasons. Responses for the top three finan-
cial reasons that an M&A was abandoned before or during the due diligence phase are clustered in a tight group: concerns about assumption of liabilities (23%), regulatory issues (22%), and
concerns about risk/revenue sharing (20%). The response for regulatory issues is nine percentage points higher than in last year’s survey, perhaps indicating that elevated M&A activity may be attracting government attention.
> Concern about regulatory issues. A greater share of respondents from medium (36%) organizations mention regulatory issues than large (26%) and small (19%) organizations, and a greater share of respondents from for-profit organizations (32%) cite regulatory issues than nonprofit organizations (17%).
Top financial reasons that an M&A was abandoned before or during the due diligence phase are clustered in a tight group: concerns about assumption of liabilities (23%), regulatory issues (22%), and concerns about risk/revenue sharing (20%).
TOC
FINANCIAL REASONS FOR ABANDONMENT
Base = 107, Multi-response, Of those involved in M&A activity
Concern about assumption of liabilitiesRegulatory issues
Concern about risk/revenue sharingCosts to support the transaction too high
Concern about priceCould not agree on capital expense commitments
Other party’s decision, for reasons I don’t knowUncertainty about the economy
Unable to arrange financingOther
Did not abandon negotiations due to financial reasonsNo M&A activity
Don’t know
23%
2%
22%
20%
16%
15%
14%
14%
7%
6%
3%
14%
10%

H E A L T H L E A D E R S M E D I A . C O M / I N T E L L I G E N C E • A P R I L 2 0 1 9 2 1
SURVEY RESULTS
Figure 16
Thinking back to the last time an M&A involving your organization was abandoned before or during the due diligence phase, which of the following were among the operational reasons that the deal did not proceed? > Top three operational reasons. The top three operational rea-
sons respondents say that an M&A involving their organization was abandoned before or during the due diligence phase are mistrust between parties (30%), concern about governance (27%),
TOC
OPERATIONAL REASONS FOR ABANDONMENT
Mistrust between parties
Concern about governance
Incompatible cultures
Concern about fate of organization’s mission
Concern about operational transition plan
Other party’s decision, for reasons I don’t know
Lack of community support
OtherDid not abandon negotiations due to
operational reasonsNo activity
Don’t know
30%
27%
21%
13%
13%
11%
6%
2%
0%
20%
13%
Percent of respondents who say the top operational reason an M&A involving their organization was abandoned before or during the due diligence phase is mistrust between parties.
and incompatible cultures (21%). This represents a change in sequence over last year’s sur-vey where the order was incompatible cul-tures (30%), concern about governance (24%), and concern about the operational transition plan (21%).
Base = 90, Multi-response, Of those involved in M&A activity

H E A L T H L E A D E R S M E D I A . C O M / I N T E L L I G E N C E • A P R I L 2 0 1 9 2 2
METHODOLOGYThe 2019 HealthLeaders Mergers, Acquisitions, and Partnerships Survey was conducted by the HealthLeaders Intelligence Unit, pow-ered by the HealthLeaders Council. It is part of a series of thought leadership studies. In January 2019, an online survey was sent to the HealthLeaders Council and select members of the HealthLeaders audience at healthcare provider organizations. A total of 154 completed surveys are included in the analysis. Base size varies between 14 and 154 according to respondents’ knowledge of the question. The margin of error for a base of 154 is +/- 7.9% at the 95% confidence interval. Survey results do not always add to 100% due to rounding.
Opinions expressed are not necessarily those of HealthLeaders. Mention of products and services does not constitute endorsement. Advice given is general, and readers should consult professional counsel for specific, legal, ethical, or clinical questions.
What Healthcare Leaders Are SayingHere are selected comments from leaders regarding the advice they would give an executive at an organization considering a potential M&A.
Copyright ©2019 HealthLeaders, a Simplify Compliance brand 100 Winners Circle, Suite 300, Brentwood, TN 37027
CLICK HERE TO JOIN THE COUNCIL TODAY!
“Make sure that the parties are aligned and have committed in writing to the goals and rationale for the merger and that there has been enough due diligence to ensure that the deal makes financial sense.”
—Chief strategy officer at a large health system
“Pay attention to the nontraditional deals and the disruption that is occurring (and will occur).”
—CNO at a large health system
“Understand the difference of how care is delivered in an urban versus rural setting. Understand the impact of geography and population density.”
—CEO at a small hospital
“It’s all about effectively merging cultures.”—VP of strategy at a medium health system
“Take your time and always ensure transparent communication throughout your organization.”
—VP/director of operations/administration at a large health system
“Make sure all of your current operations are running smoothly and are financially solid.”
—CIO at a small physician organization
About the HealthLeaders Intelligence Unit The HealthLeaders Intelligence Unit, a divi-sion of HealthLeaders, is the premier source for executive healthcare business research. It provides analysis and forecasts through digital platforms, print publications, custom reports, white papers, conferences, roundtables, peer networking opportunities, and presentations for senior management.
Research Analyst JONATHAN BEES
Senior Manager, Product & Content ADRIENNE TRIVERS [email protected]
Content Manager ERIKA RANDALL [email protected]
Client Services Manager JEFF KONYK [email protected]
Contributing Editor STEVEN PORTER [email protected]
Contributing Editor JACK O’BRIEN [email protected]
Art Director DOUG PONTE [email protected]
TOC

H E A L T H L E A D E R S M E D I A . C O M / I N T E L L I G E N C E • A P R I L 2 0 1 9 2 3
RESPONDENT PROFILE
CEO, PRESIDENT> CEO, President > Chief Executive
Administrator > Chief Administrative
Officer > Board Member > Executive Director > Managing Director > Partner
OPERATIONS LEADERSHIP> Chief Operations Officer > Chief Strategy Officer > Chief Compliance Officer > Chief Purchasing Officer > VP/Director Operations
Administration > VP/Director of Compliance > Chief Human Resources
Officer > VP/Director HR/People > VP/Director
Supply Chain/Purchasing
FINANCIAL LEADERSHIP> Chief Financial Officer > VP/Director Finance > VP/Director Patient
Financial Services > VP/Director Revenue
Cycle > VP/Director
Managed Care > VP/Director
Reimbursement > VP/Director HIM
CLINICAL LEADERSHIP> Chief Medical Officer> Chief Nursing Officer > Chief of Medical Specialty
or Service Line > VP/Director of Medical
Specialty or Service Line > VP/Director of Nursing > Chief Population Health
Officer> Chief Quality Officer > Medical Director > VP/Director Ambulatory
Services > VP/Director
Clinical Services > VP/Director Quality > VP/Director Patient Safety> VP/Director
Postacute Services > VP/Director
Behavioral Services > VP/Director
Medical Affairs/ Physician Management
> VP/Director Population Health
> VP/Director Case Management
> VP/Director Patient Engagement, Experience
MARKETING LEADERSHIP> Chief Marketing Officer > VP/Director Marketing > VP/Director Business
Development/Sales
IT LEADERSHIP> Chief Information
Technology Officer > Chief Information Officer > Chief Technology Officer > Chief Medical
Information Officer > Chief Nursing
Information Officer > VP/Director IT/Technology > VP/Director
Informatics/Analytics > VP/Director Data Security
24%
32%26%
18%
RESPONDENT REGIONS
TITLE
Clinicalleadership
Financial leadership
CEO, President
IT leadership
Other
Operations leadership
Marketingleadership
South
Midwest
Northeast
West
TYPE OF ORGANIZATION Base = 100Health System (IDN/IDS) 30%
Hospital 26%
Physician Organization (MSO/IPA/PHO/Clinic) 22%
Home Health Agency 5%
Ancillary Services Provider (Diagnostic/Therapeutic/Custodial) 5%
Assisted Living Facilities 4%
Skilled Nursing Facility/Nursing Homes 4%
Ambulatory Surgical Center 2%
Payer/Health Plan/Insurer (HMO/PPO/MCO/PBM) 2%
NUMBER OF PHYSICIANS Base = 1001–9 10%
10–49 17%
50+ 71%
N/A 2%
NUMBER OF BEDS Base = 1001–199 22%
200–499 20%
500+ 22%
Do not have a standard number of beds 36%
PROFIT STATUS Base = 100For-profit 41%
Nonprofit 59%
NET PATIENT REVENUE Base = 100$1 billion or more (large) 23%
$250 million-$999.99 million (medium) 14%
$249.9 million or less (small) 63%
RURAL STATUS Base = 100Yes 29%
No 71%
43% 22% 16% 9% 3% 2% 5%
Base = 100
TOC