Embed Size (px)
Citation preview
U.S. Department of TransportationFederal Highway AdministrationITS Joint Program Office
IntelligentTransportation Systems
Benefits:1999 Update
28 May 1999

1. Report No. FHWA-OP-99-012
2. Government Accession No. 3. Recipient’s Catalog No.
4. Title and Subtitle ITS Benefits: 1999 Update
5. Report Date 28 May 19996. Performing Organization Code
7. Author(s)
Allen T. Proper
8.Performing Organization Report No.
9. Performing Organization Name and AddressMitretek Systems, Inc.Intelligent Transportation Systems600 Maryland Ave, SW, Suite 755Washington, D.C. 20025
10. Work Unit No. (TRAIS)
11. Contract or Grant No.DTFH61-95-C00040
12. Sponsoring Agency Name and AddressDepartment of TransportationFHWA Intelligent Transportation Systems Joint Program Office400 Seventh Street, SW - Room 3422Washington, D.C. 20590
13. Type of Report and Period Covered
14. Sponsoring Agency CodeHVH-1
15. Supplementary NotesJoe Peters
16. Abstract
This report continues the emphasis in documenting evaluation results of ITS user services and the benefits these servicesprovide to the surface transportation system. The organization of this report differs from that of the previous ITS Benefitsreports. Referenced data are classified into a structure that reflects individual ITS program areas. These program areasinclude the metropolitan and rural infrastructure, ITS for Commercial Vehicle Operations (ITS/CVO) and Intelligent Vehicleuser services. Data within the report reflect empirical results from field operations of deployed systems, supplemented withbenefits information based upon modeling studies and statistical studies.
This report is intended to be a reference report. It highlights benefits identified by other authors and refers the reader toinformation sources. The interested reader is encourages to obtain source documents to appreciate the assumptions andconstraints placed upon interpretation of results. It is the intent of the ITS Joint Program Office to update this reportperiodically.
Key WordsIntelligent Transportation Systems (ITS), ITS Benefits, Benefits to Cost Analysis
18. Distribution Statement No restrictions. This document is available to the public
19. Security Classif. (of this report) Unclassified
20. Security Classif. (of this page) Unclassified
21. No of Pages 84
22. Price
Form DOT F 1700.7 (8-72) Reproduction of completed page authorized

2
Notice
This document is disseminated under the sponsorshipof the Department of Transportation in the interest of
information exchange. The United States Governmentassumes no liability for its contents or use thereof.
SCenter for Telecommunications and Advanced TechnologyMcLean, Virginia
Intelligent Transportation Systems Benefits:1999 Update
Prepared byMitretek Systems Inc.
600 Maryland Avenue SW, Suite 755Washington, D.C., 20024
Under Contract to the Federal Highway AdministrationUnited States Department of Transportation
Washington, D.C.
28 May 1999

3
PREFACE
The Federal Intelligent Transportation Systems (ITS) program came into being as a result of theIntermodal Surface Transportation Efficiency Act of 1991. In the years since, the ITS field hasdeveloped from a collection of ideas and isolated applications of technology into an interrelatedprogram with initial projects yielding benefits for the nation’s surface transportation system. On 9 June 1998, the Transportation Equity Act for the 21st Century was signed into law. Known asTEA-21, this new legislation succeeded the 1991 act and authorized $1.3 billion, enabling thecontinued investment in ITS.
Since December of 1994, the United States Department of Transportation’s (U.S. DOT’s) ITSJoint Program Office (JPO) has been actively collecting information regarding the impact of ITSprojects on the operation of the surface transportation network. This report is a compendium ofreported impacts of ITS collected for this effort. Its purpose is to provide the JPO with a tool totransmit existing knowledge of ITS benefits to the transportation professional who may not be wellversed in ITS products and services. Also, this report is intended to provide the researchcommunity with information on ITS areas where further analysis is required.
This report is intended to be a reference report. It highlights benefits identified by other authors andrefers the reader to information sources. The interested reader is encouraged to obtain sourcedocuments to appreciate the assumptions and constraints placed upon interpretation of results.
To aid the distribution of the information in this report, this document will be placed in the U.S.DOT’s ITS Electronic Document Library at www.its.dot.gov/cyberdocs/welcome.htm as documentnumber 8323.
Many ITS efforts initiated by states, local governments, and private enterprise do not have theirbenefits or cost documented in this report. Readers who are aware of important ITS benefits andcost information from these and other sources are encouraged to send reference documents to:
Joseph I. Peters, Ph.D.ITS Program Assessment CoordinatorITS Joint Program OfficeFederal Highway Administration (HOIT-1)400 7th Street, SWWashington, D.C. 20590

4
TABLE OF CONTENTS
PREFACE . . . . . . . . . . . . . . . . . . . . . . . . . . . . . . . . . . . . . . . . . . . . . . . . . . . . . . . . . . . . . . . . . . 3TABLE OF CONTENTS . . . . . . . . . . . . . . . . . . . . . . . . . . . . . . . . . . . . . . . . . . . . . . . . . . . . . . 4EXECUTIVE SUMMARY . . . . . . . . . . . . . . . . . . . . . . . . . . . . . . . . . . . . . . . . . . . . . . . . . . . . . 7
1.0 INTRODUCTION . . . . . . . . . . . . . . . . . . . . . . . . . . . . . . . . . . . . . . . . . . . . . . . . . . . . . . . . 131.1 GOALS OF THE ITS BENEFITS REPORT . . . . . . . . . . . . . . . . . . . . . . . . . . . . . . 131.2 ORGANIZATION OF THIS REPORT . . . . . . . . . . . . . . . . . . . . . . . . . . . . . . . . . . 141.3 A FEW GOOD MEASURES . . . . . . . . . . . . . . . . . . . . . . . . . . . . . . . . . . . . . . . . . . 161.4 POSITIVE AND NEGATIVE IMPACTS OF ITS . . . . . . . . . . . . . . . . . . . . . . . . . . 17
2.0 BENEFITS OF METROPOLITAN ITS INFRASTRUCTURE . . . . . . . . . . . . . . . . . . . . . . 182.1 ARTERIAL MANAGEMENT SYSTEMS . . . . . . . . . . . . . . . . . . . . . . . . . . . . . . . 20
2.1.1 Summary of Arterial Management Systems Data . . . . . . . . . . . . . . . . . . . . 252.2 FREEWAY MANAGEMENT SYSTEMS . . . . . . . . . . . . . . . . . . . . . . . . . . . . . . . . 27
2.2.1 Summary of Freeway Management Systems . . . . . . . . . . . . . . . . . . . . . . . . 312.3 TRANSIT MANAGEMENT SYSTEMS . . . . . . . . . . . . . . . . . . . . . . . . . . . . . . . . . 32
2.3.1 Summary of Transit Management Systems . . . . . . . . . . . . . . . . . . . . . . . . . 342.4 INCIDENT MANAGEMENT SYSTEMS . . . . . . . . . . . . . . . . . . . . . . . . . . . . . . . . 35
2.4.1 Summary of Incident Management . . . . . . . . . . . . . . . . . . . . . . . . . . . . . . . 382.5 EMERGENCY MANAGEMENT . . . . . . . . . . . . . . . . . . . . . . . . . . . . . . . . . . . . . . 392.6 ELECTRONIC TOLL COLLECTION . . . . . . . . . . . . . . . . . . . . . . . . . . . . . . . . . . 41
2.6.1 Summary of Electronic Toll Collection . . . . . . . . . . . . . . . . . . . . . . . . . . . 422.7 ELECTRONIC FARE PAYMENT PROGRAMS . . . . . . . . . . . . . . . . . . . . . . . . . . 432.8 HIGHWAY-RAIL INTERSECTIONS . . . . . . . . . . . . . . . . . . . . . . . . . . . . . . . . . . . 442.9 REGIONAL MULTI-MODAL TRAVELER INFORMATION . . . . . . . . . . . . . . . . 452.10 BENEFITS OF INTEGRATED METROPOLITAN ITS . . . . . . . . . . . . . . . . . . . . 49
3.0 BENEFITS OF RURAL ITS INFRASTRUCTURE . . . . . . . . . . . . . . . . . . . . . . . . . . . . . . 513.1 TRAVELER SAFETY AND SECURITY . . . . . . . . . . . . . . . . . . . . . . . . . . . . . . . . 523.2 EMERGENCY SERVICES . . . . . . . . . . . . . . . . . . . . . . . . . . . . . . . . . . . . . . . . . . . 533.3 TOURISM AND TRAVEL INFORMATION . . . . . . . . . . . . . . . . . . . . . . . . . . . . . 543.4 PUBLIC TRAVEL AND MOBILITY SERVICES . . . . . . . . . . . . . . . . . . . . . . . . . 543.5 INFRASTRUCTURE OPERATION AND MAINTENANCE . . . . . . . . . . . . . . . . . 563.6 FLEET OPERATION AND MAINTENANCE . . . . . . . . . . . . . . . . . . . . . . . . . . . . 57

5
4.0 BENEFITS OF ITS FOR COMMERCIAL VEHICLE OPERATIONS . . . . . . . . . . . . . . . . 584.1 SAFETY ASSURANCE . . . . . . . . . . . . . . . . . . . . . . . . . . . . . . . . . . . . . . . . . . . . . 594.2 CREDENTIALS ADMINISTRATION . . . . . . . . . . . . . . . . . . . . . . . . . . . . . . . . . . 604.3 ELECTRONIC SCREENING . . . . . . . . . . . . . . . . . . . . . . . . . . . . . . . . . . . . . . . . . 604.4 CARRIER OPERATIONS . . . . . . . . . . . . . . . . . . . . . . . . . . . . . . . . . . . . . . . . . . . . 62
5.0 BENEFITS OF INTELLIGENT VEHICLES . . . . . . . . . . . . . . . . . . . . . . . . . . . . . . . . . . . 655.1 DRIVER ASSISTANCE . . . . . . . . . . . . . . . . . . . . . . . . . . . . . . . . . . . . . . . . . . . . . 655.2 COLLISION AVOIDANCE / WARNING . . . . . . . . . . . . . . . . . . . . . . . . . . . . . . . . 68
6.0 SUMMARY . . . . . . . . . . . . . . . . . . . . . . . . . . . . . . . . . . . . . . . . . . . . . . . . . . . . . . . . . . . . 70
APPENDIX 1: REFERENCE LIST . . . . . . . . . . . . . . . . . . . . . . . . . . . . . . . . . . . . . . . . . . . . . 74
APPENDIX 2: LISTING OF ACRONYMS . . . . . . . . . . . . . . . . . . . . . . . . . . . . . . . . . . . . . . . 82
LISTING OF TABLES
Table ES-1: Summary of References Discussed in This Report. . . . . . . . . . . . . . . . . . . . . . . . . . . . 8Table ES-2: Summary of Available Data by Benefit Measure . . . . . . . . . . . . . . . . . . . . . . . . . . . . . 9Table 2-1: Summary of Incident Management Results . . . . . . . . . . . . . . . . . . . . . . . . . . . . . . . . . . 39Table 6-1: Number of Point Data Summarized in This Report . . . . . . . . . . . . . . . . . . . . . . . . . . . . 72Table 6-2: Summary of Available Data by Benefit Measure . . . . . . . . . . . . . . . . . . . . . . . . . . . . . . 73
LISTING OF FIGURES
Figure ES-1: Summary of Reported ITS Benefits Data From Traffic Signal Control. . . . . . . . . . . 11Figure ES-2: Summary of Ramp Metering Impacts . . . . . . . . . . . . . . . . . . . . . . . . . . . . . . . . . . . . 12Figure ES-3: Operational Cost Savings for Electronic Toll Collection . . . . . . . . . . . . . . . . . . . . . . 12Figure 1a: Intelligent Infrastructure Taxonomy for Reporting ITS Benefits . . . . . . . . . . . . . . . . . .15Figure 1b: Intelligent Vehicles Taxonomy for Reporting ITS Benefits . . . . . . . . . . . . . . . . . . . . 15Figure 2-0: Metropolitan ITS Program Areas . . . . . . . . . . . . . . . . . . . . . . . . . . . . . . . . . . . . . . . . 19Figure 2-1: A Possible Set of Integration Links . . . . . . . . . . . . . . . . . . . . . . . . . . . . . . . . . . . . . . 19Figure 2-2: Taxonomy of Arterial Management Systems. . . . . . . . . . . . . . .. . . . . . . . . . . . . . . . . . 21Percent Reduction In Stops Due To Adaptive Traffic Control . . . . . . . . . . . . . . . . . . . . . . . . . . . 25Percent Reduction In Travel Time Due To Adaptive Traffic Control . . . . . . . . . . . . . . . . . . . . . . 26Percent Delay Reduction Due To Adaptive Traffic Control . . . . . . . . . . . . . . . . . . . . . . . . . . . . . 26Figure 2-3: Taxonomy of Freeway Management Systems . . . . . . . . . . . . . . . . . . . . . . . . . . . . . . . 27Percent Accident Reduction Due To Ramp Metering . . . . . . . . . . . . . . . . . . . . . . . . . . . . . . . . . . . 31Increase in Speed Due To Ramp Metering . . . . . . . . . . . . . . . . . . . . . . . . . . . . . . . . . . . . . . . . . . . 31

6
Figure 2-4: Taxonomy of Transit Management Systems . . . . . . . . . . . . . . . . . . . . . . . . . . . . . . . 32Figure 2-5: Taxonomy for Incident Management Systems. . . . . . . . . . . . . . . . . . . . . . . . . . . . . . . 35Figure 2-6: Taxonomy of Emergency Response . . . . . . . . . . . . . . . . . . . . . . . . . . . . . . . . . . . . . . .39Figure 2-7: Taxonomy of Electronic Toll Collection . . . . . . . . . . . . . . . . . . . . . . . . . . . . . . . . . . . 41Estimated Annual Operating Cost for Electronic Toll Collection . . . . . . . . . . . . . . . . . . . . . . . . . 42Figure 2-8: Taxonomy of Electronic Far Payment . . . . . . . . . . . . . . . . . . . . . . . . . . . . . . . . . . . . . 43Figure 2-9: Taxonomy for Highway Railroad Interfaces . . . . . . . . . . . . . . . . . . . . . . . . . . . . . . . . .45Figure 2-10: Taxonomy for Regional Multimodal Traveler Information . . . . . . . . . . . . . . . . . . . . . .45Figure 3-0: Rural ITS Program Areas . . . . . . . . . . . . . . . . . . . . . . . . . . . . . . . . . . . . . . . . . . . . . . . .51Figure 3-1: Taxonomy for Traveler Safety and Security . . . . . . . . . . . . . . . . . . . . . . . . . . . . . . . . . 52Figure 3-2: Taxonomy for Emergency Services . . . . . . . . . . . . . . . . . . . . . . . . . . . . . . . . . . . . . . . 53Figure 3-3: Taxonomy of Tourism and Travel Information . . . . . . . . . . . . . . . . . . . . . . . . . . . . . . 54Figure 3-4: Taxonomy of Public Travel and Mobility Services . . . . . . . . . . . . . . . . . . . . . . . . . . . 55Figure 3-5: Taxonomy for Infrastructure Operation and Maintenance . . . . . . . . . . . . . . . . . . . . . . 56Figure 3-6: Taxonomy for Fleet Operation and Maintenance . . . . . . . . . . . . . . . . . . . . . . . . . . . . . 57Figure 4-0: ITS/CVO Program Areas . . . . . . . . . . . . . . . . . . . . . . . . . . . . . . . . . . . . . . . . . . . . . . 58Figure 4-1: Taxonomy for Safety Assurance . . . . . . . . . . . . . . . . . . . . . . . . . . . . . . . . . . . . . . . . . . 59Figure 4-2: Taxonomy for Credentials Administration . . . . . . . . . . . . . . . . . . . . . . . . . . . . . . . . . . 60Figure 4-3: Taxonomy for Electronic Screening . . . . . . . . . . . . . . . . . . . . . . . . . . . . . . . . . . . . . . . .61Figure 4-4: Taxonomy for Carrier Operations . . . . . . . . . . . . . . . . . . . . . . . . . . . . . . . . . . . . . . . . .62Figure 5-1: Taxonomy for Driver Assistance . . . . . . . . . . . . . . . . . . . . . . . . . . . . . . . . . . . . . . . . . 65Figure 5-2: Taxonomy for Collision Avoidance / Warning . . . . . . . . . . . . . . . . . . . . . . . . . . . . . . .68

7
EXECUTIVE SUMMARY
Since December of 1994, the United States Department of Transportation’s (U.S. DOT) ITS JointProgram Office (JPO) has been actively collecting information on the impacts that ITS and relatedprojects have on the operation and management of the nation’s surface transportation system. Theevaluation of ITS and precursor systems is an ongoing process. Significant knowledge is availablefor many ITS services, but gaps in knowledge also exist.
The purpose of this report is to provide the JPO with a tool to transmit existing knowledge of ITSbenefits to the transportation professional who may not be well versed in ITS products and services. Also, this report is intended to provide the research community with information about wherefurther analysis is required in the ITS program. Intended to be a reference report, it highlightsbenefits identified by other authors and refers the reader to information sources. This reportsummarizes much of the available quantifiable data and benefits of ITS impacts collected by theJPO. It demonstrates that in general all ITS services have shown some positive benefit and thatnegative impacts are usually outweighed by other positive results. For example, higher speeds andimproved traffic flow result in increases in Nitrous Oxides, while other emission measures, fuelconsumption, travel time, and delay, are reduced.
Table ES-1 presents the number of references that contain information about measured andpredicted impacts of ITS services. These references represent data sources that are discussed in thisreport. Table ES-2 presents these data for each ITS service by measure of effectiveness. Eachsource may contain data for more than one measure or ITS user service. The authors acknowledgethat this is not an exhaustive report of ITS impacts and continue to seek available impacts data. Using these two tables, conclusions can then be drawn as to where gaps in knowledge of ITSbenefits are located.
Most of the data collected to date are concentrated within the metropolitan areas, while ruralapplications have few data points available. This may be due to the fact that the metropolitanprogram has been in existence longer and is much more developed than rural or CVO. The heaviestconcentrations of data in the metropolitan area are for safety and delay savings in traffic signalcontrol, freeway management, and incident management. Although there are several operationaltests currently underway for the program area of highway/rail intersections, it is the newest programarea of metropolitan infrastructure and no data have been reported as of this date.
Currently, few benefits data have been collected regarding rural ITS. Several state and nationalparks are now examining the possibilities of providing improved tourism and travel information, andseveral rural areas are implementing public travel services. Also, many states are now examining thebenefits of incorporating ITS, specifically weather information, into the operation and maintenanceof facilities and equipment. Over the next several years and as this program matures, more data willbecome available.

8
BenefitInfrastructure User Service Area Measured PredictedMetropolitan Arterial Management Systems Safety 9
Time 12 3Throughput 1Customer Satisfaction 2Emissions/Fuel Savings 5Other 4
Freeway Management Systems Safety 5Time 2Throughput 4Other 2
Transit Management Systems Time 3Cost 2Customer Satisfaction 1
Incident Management Systems Safety 4Time 10 1Cost 6Emissions/Fuel Savings 2 1
Emergency Management Time 1Customer Satisfaction 1Other 1
Electronic Toll Collection Time 1Throughput 1Cost 1Emissions/Fuel Savings 1
Electronic Fare Payment Time 1Cost 5
Regional Muti modal information Cost 1Customer Satisfaction 6Emissions/Fuel Savings 1Other 5
Integrated systems Time 4Cost 3Customer Satisfaction 2
Rural Traveler Safety and Security Safety 1
Emergency Services Safety 1Time 1
Public Travel and Mobility Cost 2Other 1
Infrastructure Operation Cost 2ITS/CVO Safety Assurance Cost 1
Credentials Administration Time 1Electronic Screening Time 1
Cost 4
Carrier Operations Time 5Cost 7Other 4
Intelligent Veh. Driver Assistance Safety 4Time 3Throughput 1Cost 1Customer Satisfaction 2
Platform Specific Safety 1Throughput 1
Total 144 14
Number of References
Table ES-1 Summary of References Discussed in This Report

9
0 :
1 to 3 :
4 to 6 :
7 to 10 :
> 10 :
Key:
Number of References
Saf
ety
Tim
e &
Del
ay
Effe
ctiv
e C
apac
ity
Cos
t
Cus
tom
er S
atis
fact
ion
Em
issi
ons/
Fue
l Sav
ings
Oth
er
Arterial Management Systems
Freeway Management
Transit Management
Incident Management
Emergency Management
Electronic Toll Collection
Electronic Fare Payment
Highway/Rail Intersection
Regional Mutimodal Travel Information
Integrated Systems
Traveler Safety and Security
Emergency Services
Tourism and Travel Information
Public Travel and Mobility Services
Infrastructure Operation and Maintenance
Fleet Operation and Maintenance
Safety Assurance
Credentials Administration
Electronic Screening
Carrier Operations
Driver Assistance
Platform Specific
ITS
/CV
OI.V
.M
etro
po
litan
Ru
ral
Table ES-2: Summary of Available Data by Benefit Measure

10
ITS for Commercial Vehicle Operations (ITS/CVO) continues to provide benefits to both carriersand state agencies. ITS/CVO program areas usually report benefits data from directly measurableeffects. Therefore, it might be expected that these data are accurate and only a few data pointswould be necessary to convince carriers, states, and local authorities of the possible benefits ofimplementing these systems. To date, most of the data collected for ITS/CVO are for cost, traveltime, and delay savings for carrier operations.
ITS program areas and user services associated with driver assistance and specific vehicle classesare still being developed and planned. Although a few of these services are available in themarketplace, much of the data currently associated with these services are predicted or projectedbased on how systems are expected to perform. As market penetrations increase and improvedsystems are developed, there will be ample opportunity to measure and report more accurate data.
As shown in Table ES-2, ITS benefits data are available across all measures of effectivenesscategories. The heaviest concentration of data available for particular measures is for time/delayand cost savings. Much less data are available on effective capacity, emissions, and customersatisfaction at this point in time.
General conclusions and results are developed throughout the main body of the report. It should bementioned that due to the nature of the data, it is often difficult to compare data from one project toanother. This is due to the fact that there are several different variables involved between differentimplementations of ITS user services. Thus, statistical analysis of the data is not done across datapoints. In several cases, ranges of reported impacts are presented and general trends can bediscussed. These cases include traffic signal systems, ramp metering, and electronic toll collection.
Traffic Signal Systems
The charts in figure ES-1 contain the reported values for traffic signal system data presented in thisreport, arranged from the lowest to the highest values. As a general observation, one might assumethat for adaptive control signal systems, the number of stops could be reduced a minimum of 20%. Likewise, the reduction in travel times range between 8% and 20%, and delay reductions can beexpected to be around 15% or better. Video enforcement of traffic signal compliance has shownthe potential to reduce between 20 and 43% of crashes occurring at intersections. Impacts ofemission reductions appear to be favorable, with the exception of emissions of Nitrous-oxides. Thisis expected because improved flows and increases in speed lead to increased production of Nitrous-oxides while decreasing other emission measures.

11
22%30% 33%
41%
0%
20%
40%
60%
80%
100%
1 2 3 4
Percent Reduction in Stops
Due to Adaptive Control
4 Reported Values
15% 17%25%
37%44%
0%
20%
40%
60%
80%
100%
1 2 3 4 5
Percent Delay Reduct ion
Due to Adaptive Control
5 Reported Values
8%14%
18% 20%
0%
20%
40%
60%
80%
100%
1 2 3 4
Percent Reduct ion in Travel T ime
Due to Adaptive Control
4 Reported Values
20%
32% 35%43%
0%
20%
40%
60%
80%
100%
1 2 3 4
Percent Crash Reduction
Due to Enforcement
4 Reported Values
Figure ES-1: Summary of Reported ITS Benefits Data From Traffic Signal Control
Ramp Metering
Figure ES-2 summarizes the impacts on accidents and speed reported for ramp metering. Rampmetering can reduce crashes by reducing the probability of side swipes in merge areas. Alsoreduced are rear end collisions that occur as vehicles slow to allow others to merge, or because theycannot merge. These reductions occur on both mainline lanes as well as on ramps. The range ofaccident reduction due to ramp metering for the reported data is from 15% to 50%.
The range of speed increase due to ramp metering for the reported data is from 8% to 60%. The large range of values for ramp metering may be due to the differences in flow rates, geometric configurations of the freeway, number of meters, ramp spacing, or the length of freeway beingmeasured.

12
2% 2%10% 14%
43%
0%
20%
40%
60%
80%
100%
BuildingUtilities
BuildingMaintenance
MoneyHandling
Staff
RoadwayMaintenance
TollCollection
Staff
Estimated Annual Operating Cost Savings for ETC
15%24% 27%
43%50% 50%
0%
20%
40%
60%
80%
100%
1 2 3 4 5 6
Percent Accident Reduction
Due to Ramp Meter ing
6 Reported Values
8% 9%13% 16%
20%
35%
60% 60% 60%
0%
20%
40%
60%
80%
100%
1 2 3 4 5 6 7 8 9
Percent Increase in Speed
Due to Ramp Meter ing
9 Reported Values
Figure ES-2: Summary of Ramp Metering Impacts
Electronic Toll Collection
Electronic Toll Collection has been shown to reduce emissions, decrease delay, improvethroughput, and save on the operating costs at toll plazas. Figure ES-3 is a summary of estimateddata for reducing operational costs by using Electronic Toll Collection over conventional manuallanes. It is estimated that the number of people required to operate toll collection booths can bereduced 43%. Roadway and building maintenance cost can be reduced approximately 14% and 2%,respectively.
Figure ES-3: Operational Cost Savings for Electronic Toll Collection
Outlook
As market penetrations increase and improved systems are developed, there will be ampleopportunity to measure, analyze, and report more accurate data. As these data become available, itmay be possible to perform more detailed analyses for particular program areas or benefitsmeasures. These analyses are expected to assist in improving the estimated ranges of impacts, andthe level of confidence in those ranges.

1“Transportation: Driving a Thriving Economy,” American Association of State Highway andTransportation Officials and the National Governors’s Association, May 1997.
2Peters, J, McGurrin, M. F., Shank, D. E., and Cheslow, M., “An Estimate of Transportation CostSavings from Using Intelligent Transportation System (ITS) Infrastructure,” ITE Journal, November 1997.
13
1.0 INTRODUCTION
The transportation system of the United States consists of more than 6.3 million kilometers ofhighways and roads, and 503 public transit operators. More than 258 million people, 6 millionbusinesses, and 86 thousand federal, state, and local government agencies produce more than 6.3trillion kilometers of travel and 4.8 trillion ton kilometers of domestic freight each year. In 1995,Congress designated the near 260,000 kilometer National Highway System. Although this systemincludes all of the interstates and many other highways, and carries almost half the total highwaytraffic and most truck and tourist traffic, it consists of less then 4% of the roadway system in thenation. More than 30% of the roads on the interstate system are rated either “poor” or “mediocre,”and more than 125,000 bridges nationwide are near the end of their useful lives1.
Over the next decade, travel demand in the U.S. is expected to increase by about 30%. In order tosimply maintain congestion at current levels, the United States would need to add (in 50 majorurban areas) more than 7,100 new lane kilometers of roadway every year. Currently, roads arebeing built at about two-thirds this rate.
Another option is to develop alternatives that increase effective capacity by improving the efficiencyof the transportation system. This option focuses on building fewer lane-kilometers while investingin Intelligent Transportation Systems (ITS) infrastructure. A twenty-year life-cycle cost analysis for50 major urban areas for the two options, indicated that “Buying smarter by deploying ITS reducesthe need for new roads while saving taxpayers 35% of the required investment in urban highways2.” In addition to other effects, ITS can also positively impact environmental and societal concerns.This analysis demonstrates that ITS can be an important factor in addressing the needs of ourgrowing transportation system.
1.1 GOALS OF THE ITS BENEFITS REPORT
Since December of 1994, the United States Department of Transportation’s (USDOT) ITS JointProgram Office (JPO) has been actively collecting information regarding the impacts that ITS andrelated projects have on the operation and management of the nation’s transportation system.This periodically updated report is a compendium of reported impacts of ITS that have beencollected from a number of sources. Its purpose is to provide the JPO with a tool to transmitexisting knowledge of ITS benefits to the transportation professionals who may not be well versedin ITS products and services. Also, this report is intended to provide the research community withinformation about where further analysis is required in the ITS program. Although a concentratedeffort was made to include and highlight recent data, this report also contains data included inprevious versions and is considered to be cumulative. Intended to be a reference report, ithighlights benefits identified by other authors and refers the reader to information sources.

14
1.2 ORGANIZATION OF THIS REPORT
The previous benefit reports were organized according to measures of effectiveness such as safety,delay savings, and customer satisfaction. Although that format worked well for those interested inthe results of a particular benefit measure, it did not easily provide references to data related to aparticular ITS program area or service. Also, it did not represent a convenient way to expressinformation to decision makers or the research community in determining areas of ITS that needfurther investigation.
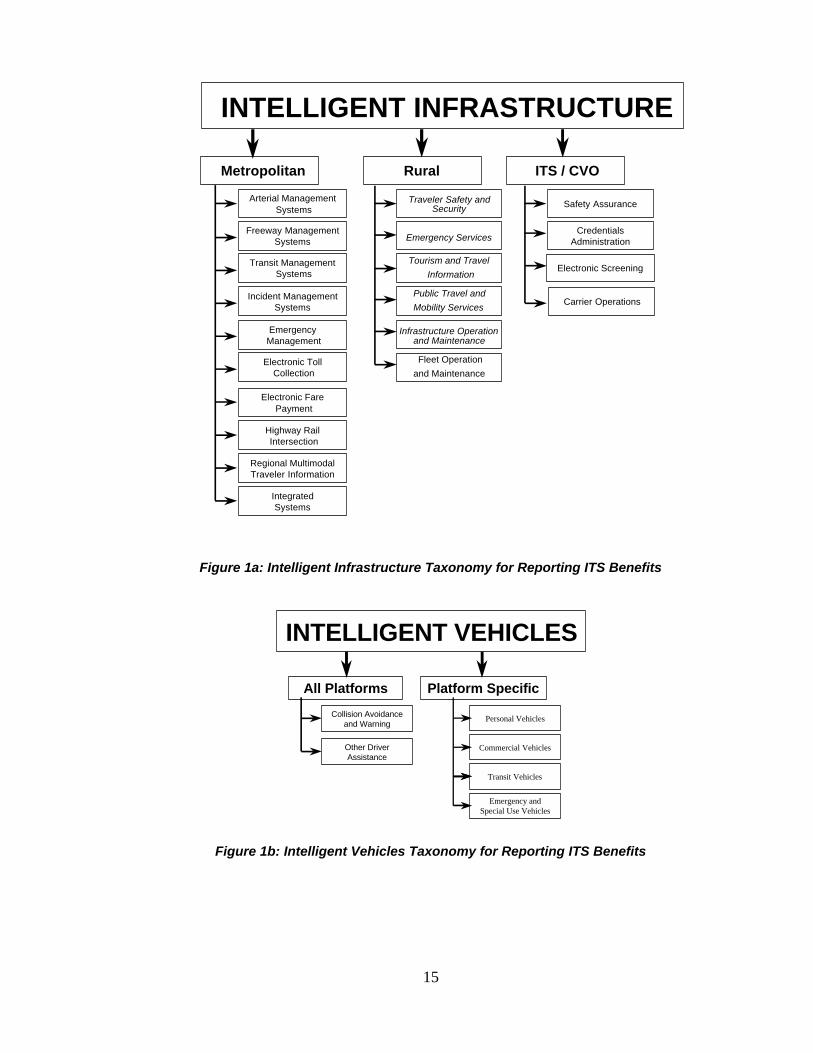
Therefore, a more useful taxonomy for classifying ITS benefits data has been developed for thisreport. This effort is based on the observation that there are several different view points inexamining the structure of ITS across the nation. The ITS taxonomy used in this report groupsbenefits data into two major components: Intelligent Infrastructure and Intelligent Vehicles. Thesecomponents are then divided into program areas and specific ITS application areas. While thistaxonomy was not intended to reflect the official structure of the ITS program, it has proven usefulin promoting discussion within the ITS community and has been used to demonstrate the breadth ofthe ITS program. An overview of this taxonomy is represented in Figure 1.
This report follows this taxonomy for reporting ITS benefits. Sections within chapters discuss eachprogram area for which benefit data are available. Each section begins with a brief description ofthe ITS application and the current state of knowledge. Following this are summaries of benefitsdata collected. Finally, when possible, an overview of the data is presented for those sections withenough data that may support some general conclusions.
It is realized that many of the program areas highlighted in the taxonomy can be dependent orheavily influenced by other areas. It is also understood that many ITS program areas shareinformation and operate in a cooperative fashion. For example, incident management systems candirectly influence emergency response by providing timely and accurate information on incidentlocation and severity. Additionally, in-vehicle systems, such as route guidance, require acooperative infrastructure that can provide routing and/or travel time information to the vehicle. This report attempts to account for these influences and cooperative aspects of ITS. Most data areclassified by the specific program area and infrastructure that the data most directly support. Thisclassification of data types was based on geographic setting (metropolitan, rural) or functionality(ITS/CVO) of the ITS services referenced in the source documentation. In some cases, sourcedocumentation did not provide enough detailed information to classify referenced data. When thisoccurred, the author used judgement to determine how these data should be classified.
15
INTELLIGENT VEHICLES
All Platforms
Collision Avoidanceand Warning
Other DriverAssistance
Platform Specific
Personal Vehicles
Commercial Vehicles
Transit Vehicles
Emergency andSpecial Use Vehicles
Metropolitan Rural
Traveler Safety andSecurity
Emergency Services
Tourism and Travel
Information
Public Travel and
Mobility Services
Infrastructure Operationand Maintenance
INTELLIGENT INFRASTRUCTURE
Fleet Operation
and Maintenance
ITS / CVO
Safety Assurance
CredentialsAdministration
Electronic Screening
Carrier Operations
Arterial Management Systems
Freeway ManagementSystems
Transit Management Systems
Incident ManagementSystems
Emergency Management
Electronic Toll Collection
Electronic Fare Payment
Highway Rail Intersection
Regional MultimodalTraveler Information
IntegratedSystems
Figure 1a: Intelligent Infrastructure Taxonomy for Reporting ITS Benefits
Figure 1b: Intelligent Vehicles Taxonomy for Reporting ITS Benefits

16
Delay
Cost
Safety
EffectiveCapacity
1.3 A FEW GOOD MEASURES
As mentioned in section 1.2, previous versions of this report were organized based on a fewmeasures of effectiveness. Termed “A Few Good Measures,” the JPO has identified these as themeasures that are used to track progress toward meeting ITS program goals. Because of thisemphasis, the collection of these measures is a standard in the reporting of much of the ITS benefitsdata currently available. Throughout the document, icons are placed next to each source to reflectthe measure that is reported. Benefits that are not included in the set of a few good measures arealso included; however, they are not referenced by icons. The Few Good Measures include safetyimprovements (crashes and fatalities), delay reduction, cost savings, effective capacityimprovements, customer satisfaction, and energy and other environmental impacts.
An explicit objective of the transportation system is to improve the safety of travel. Although undesirable, crashes and fatalities are an inevitable occurrence of thetransportation system. ITS helps to minimize the risk of accident occurrence. Thismeasure focuses on reducing the number of crashes, and lessening the probability of afatality should a crash occur.
Delay reduction and travel time savings is a major goal of many ITS services. In 1996,the Secretary of Transportation termed an ITS initiative of the US DOT, “OperationTimeSaver.” Benefits of this measure also include reducing the variability of time intransit and increasing the reliability of destination arrival time.
ITS implementation frequently reduces operating costs and allows productivityimprovements. In addition, ITS options may have lower acquisition costs compared totraditional transportation improvement options. While ITS services may have higherrecurring operational and maintenance cost, they may also have lower life-cycle costs. This measure examines the cost savings impacts of ITS services.
Many ITS services seek to optimize use of existing facilities and rights-of-way so thatmobility and commerce needs can be met while reducing the need to construct newfacilities or expand rights-of-way. This is accomplished by increasing the effectivecapacity of the transportation system. Effective capacity is the maximum potential rateat which persons or vehicles may traverse a network under a representative compositeof roadway conditions. Increases in throughput are sometimes realizations of increasesin effective capacity. Throughput is typically measured in terms of people or vehiclesper unit time traversing a segment of roadway. Throughput is more easily measurablethan effective capacity and therefore is used as a surrogate measure.

17
CustomerSatisfaction
Customer satisfaction indicates the degree to which transportation consumers areaccommodated by ITS service offerings. Although satisfaction is difficult to measuredirectly, measures related to satisfaction can be observed including the amount of travelin various modes, mode options, and the quality of service as well as the volume ofcomplaints and/or compliments. Customer satisfaction is often measured by usingsurveys, questionnaires, or focus groups.
In most cases, environmental benefits from a given project can only be estimated byanalysis and simulation. The problems related to regional measurement include thesmall impact of individual projects and large numbers of exogenous variables includingweather, contributions from non-mobile sources or other regions, and the time evolvingnature of ozone pollution. Small-scale studies, so far, generally show positive impactsfor ITS on the environment. These result from smoother and more efficient flows inthe traffic system. However, the environmental impact of travelers reacting to large-scale deployment in the long term are not well understood.
1.4 POSITIVE AND NEGATIVE IMPACTS OF ITS
The majority of available references demonstrate positive benefits for ITS. This is true both foractual deployments and for analytical studies predicting future benefits. The number of casesreporting negative results has been very small. However, most of the systems that produce negativeimpacts are carried out primarily to obtain broader societal benefits, or contain other benefits orintangible effects that may not be measurable. It is also recognized that negative impacts may beunder-reported in the literature. This report includes both the positive and negative impactsreported in the literature.
Energy andEnvironment

18
2.0 BENEFITS OF METROPOLITAN ITS INFRASTRUCTURE
Metropolitan ITS consist of those program areasthat are primarily implemented in urban andsuburban geographic locations. This does not implythat these systems are not implemented in or do notimpact other geographic settings. However, theyare more often associated with urban areas.
In 1996, the Secretary of Transportation announceda program called Operation TimeSaver. OperationTimeSaver included a metropolitan ITSinfrastructure deployment goal that focused on 75 ofthe nation’s largest metropolitan areas andestablished a commitment to track the progress
toward this goal at these sites. Four of the areas were selected to participate in the metropolitanmodel deployment initiative (MDI) program which includes the evaluation of several ITS userservices and their integration. When results from MDI evaluations are available, this section will beupdated to include impacts of ITS at these sites.
Metropolitan ITS infrastructure is made up of nine major components. These components include:Arterial Management Systems, Freeway Management Systems, Transit Management Systems,Incident Management Systems, Emergency Management, Electronic Toll Collection, ElectronicFare Payment, Highway-Rail Intersections, and Regional Multi-Modal Traveler InformationSystems. Figure 2-0 summarizes the components associated with Metropolitan ITS.
Also, several metropolitan areas are implementing ITS services that are very highly integrated. Because the interaction between services may affect the resulting system benefits, these “IntegratedSystems” are shown as a separate box under the metropolitan program areas. Integration isaccomplished by creating a number of “links” between services or program areas. These links areused to share operational information and allow for sharing of infrastructure between ITS servicesor components. Figure 2-1 demonstrates one possible set of links that may be used. Each link isreferenced by a number to refer to the specific linkage made. For example, link number 2represents the sharing of arterial traffic condition information originating from a traffic signal systemwith the freeway management system. Impacts from these types of deployments are captured insection 2.10 of this report.

19
Metropolitan
Arterial Management Systems
Freeway ManagementSystems
Transit Management Systems
Incident ManagementSystems
Emergency Management
Electronic Toll Collection
Electronic Fare Payment
Highway Rail Intersection
Regional MultimodalTraveler Information
IntegratedSystems
Regional Multimodal Traveler Information
Incident Management
Traffic SignalControl
ElectronicFare
Payment
ElectronicToll
CollectionEmergency
Management
HighwayRail
Intersections
FreewayManagement
TransitManagement
28
6 261
4
524
22
25
13
721b
21a
23
817 18
16b
19
27
20 9
29
2
3
11
30 10
15a
12
15b
14a
14b
16a
Figure 2-0: Metropolitan ITS Components
Figure 2-1: A possible set of Integration Linkages

3Meyer, M., ed., A Toolbox for Alleviating Traffic Congestion, Institute of Transportation Engineers,Publication No. IR-054B, Washington DC, 1997.
20
For a more complete understanding of these components and how they can be interpreted, thereader is referred to the following documents. Both documents are electronically available on theFHWA electronic document library at www.its.fhwa.dot.gov/cyberdocs/welcome.htm.
• “Tracking the Deployment of Integrated Metropolitan Intelligent TransportationSystems Infrastructure in the USA: FY 1997 Results,” Document Number 5883,September 1998.
• “Measuring ITS Deployment and Integration,” Document Number 4372, January1999.
2.1 ARTERIAL MANAGEMENT SYSTEMS
Arterial management systems are used to managetraffic and the control of arterial roadways. Included in this program area are arterial trafficmanagement systems that provide surveillance andsignal control, and systems that provide travelerswith information on arterial street travel conditionsthrough audio or visual displays.
Signal control systems are upgraded for a numberof reasons, primarily to improve traffic flow andsystem maintenance. Arterial traffic signal systemsprovide coordinated control across metropolitanareas. Traffic information may be shared between jurisdictional boundaries and withother metropolitan infrastructure components. Traffic signal control systems includeadaptive and transit or emergency priority control.
Figure 2-2 shows the format for the classification of benefits used in the taxonomy forarterial management systems. For this report, video enforcement of signal complianceis also included because of its potential to improve safety at intersections.
The Institute of Transportation Engineers (ITE) estimates that reduction in travel timefrom traffic signal improvements range from 8% to 25%3. Improvements in flow andreducing delays also have a generally positive environmental impact by reducingemissions and fuel consumption.

4Barbaresso, James C., “Preliminary Findings and Lessons Learned From The Fast-Trac IVHS Program,”Road Commission for Oakland County, Beverly Hills, MI, 1994.
5“Fast-Trac’s Signal System Clear Winner for County Commuters,” in ITS America News, May 1997.
21
Surveillance
Arterial Surveillance
Control
Adaptive
Priority
Display -Audio/Visual
VMS
HAR
Arterial Management Systems
IVS
Enforcement
Transit
Emergency
Figure 2-2: Taxonomy of Arterial Management Systems
Along with a neighboring county, Oakland County, Michigan shares the strain ofhaving the highest percentage of single-occupancy-vehicle use in the nation. Developedfor Oakland County, FAST-TRAC’s mission is to integrate an AdvancedTransportation Management System (ATMS) and an Advanced Traveler InformationSystem (ATIS) together and to provide synergistic benefits to travelers in the county. The program includes the Sydney Coordinated Adaptive Traffic System (SCATS) forsignal control, which became operational in Troy, Michigan on June 2, 1992. FAST-TRAC helps to relieve some of the problems experienced by the county,including improving safety, reducing delay, and improved operational efficiency. Bycontrolling traffic signals, the program has improved safety by reducing accidents(particularly those resulting in severe injuries). Preliminary floating car studies showeda decrease of 33% in the number of stops in system corridors, as well as increasedaverage speeds, particularly during off-peak periods4. Seventy two percent of thesurveyed drivers said they are better off for having FAST-TRAC5. Other benefitsappear to have been gained in the areas of governmental relations and public/privatecooperation.
An adaptive traffic signal control system developed by the British Columbia Ministry ofTransportation and Highways in Canada has cut traffic delays significantly. Since mid1995, urban corridor traffic signal systems on the provincial highways have producedan average savings of more than 25% in traffic delays. In April 1996, the first dynamicsystem was implemented on the Trans-Canada Highway in Duncan,

6Zhou, Wei-Wu, et al, “Fuzzy Flows,” ITS: intelligent transportation systems, May/June 1997.
7Beteille, J. and Briet, G., “Making Wave in Traffic Control,” Traffic Technology International, Annual1997.
8City of Los Angeles Department of Transportation, “Automated Traffic Surveillance and Control(ATSAC) Evaluation Study,” June 1994.
9“SCOOT in Toronto,” Siemens Automotive, USA, in Traffic Technology International, Spring 1995.
10Glassco, R, et al, “Studies of Potential Intelligent Transportation System Benefits Using TrafficSimulation Modeling,” Mitretek Systems, MP96W0000101, June 1996.
22
British Columbia, Canada. Initial analysis shows that an additional reduction of 15% intraffic delays has been achieved during the peak traffic periods over that of the previousstatic control6.
The SURF-2000 (Systeme Urbain de Regulation des Feux) traffic control system inParis France has brought extremely positive results. Among these include a 20%savings in travel times, a 30% reduction in number of stops, reduction of pollution, and10% reduction in fuel consumption7.
The Automated Traffic Surveillance and Control Program in Los Angeles, Californiaconsists of a computerized signal control system that has been in operation since 1984. As of 1994 it included 1,170 intersections and 4509 detectors for signal timingoptimization. It has reported a 13% decrease in fuel consumption, 14% decrease inemissions, 41% reduction in vehicle stops, 18% reduction in travel time, a 16%increase in average speed, and a 44% decrease in delay8.
Toronto, Canada evaluated the performance of the SCOOT adaptive traffic signalcontrol system on 75 signals withing the metropolitan area. When compared to a besteffort fixed timing plan the evaluation showed an 8% decrease in travel time, 22%decrease in vehicle stops and a 17% decrease in vehicle delay. Additional resultsincluded a 5.7% decrease in fuel consumption, 3.7% decrease hydrocarbons and 5.0%decrease carbon monoxide9.
Simulation and analysis have predicted that adaptive traffic signal controls could furtherreduce delays and emissions compared to the currently implemented systems undercertain conditions. In simulations performed for the National ITS ArchitectureProgram using non-proprietary adaptive algorithms, more than a 20% delay reductionwas observed when traffic patterns deviated from predicted levels10.
Simulation of a network based on the Detroit Commercial Business District indicatedthat adaptive signal control for detours around an incident reduced delay by 60% to70% for affected paths. Additionally, when simulating the effects of providing

11Glassco, R, et al., “Studies of Potential Intelligent Transportation System Benefits Using TrafficSimulation Modeling: Volume 2,” Mitretek Systems, MTR 1997-31, June 1997.
12“Traffic Control Systems Give Transit a Break,” Newsline, TRB, December 1995.
13Fors, Heather, “Transit Safety is Up Due to Timed Lights,” The Minnesota Daily, February 2, 1998.
14“ITS developed by Japanese Police,” Japan Traffic Management Technology Association, Institute ofUrban Traffic Research, Undated.
23
alternative routing information, 52% of vehicles that used an alternative rather than thedetour benefitted. Using the same network under non-incident conditions, it wasdemonstrated that a synchronized, actuated signal control system reduced travel timesbetween 25% and 41%. The highest savings occurred for high traffic volume paths. Over all paths, 91% had some benefit and 65% benefitted more than 20%11.
Delays at traffic signals can represent a significant proportion of transit travel time. European experience with transit priority control systems reveals average reductions insignal delay of 10 seconds per intersection, with a potential reduction in delays rangingfrom 40% to 80%. England and France have experienced reductions in transit traveltimes of 6% to 42%. Based on European experience, the impact of these traffic controlsystems on automobile travel time has been small, ranging from a 0.3 to 2.5% increase. The payback period for installation of transit priority systems is estimated to be 1 to 2years12.
The Transit Way at the University of Minnesota is a bus-only facility with intersectionswith other roadways. In response to an accident rate 30 percent higher than the stateaverage, a transit priority signal control system was installed at the intersections alongthe Transit Way. Since the Transit Way was first used in 1992, there had been 32accidents involving buses, other vehicles and one in-line skater. The system consists ofa series of fiberoptic loop detectors and cameras that send information to the trafficsignals. University buses traveling the route trigger the system that changes theintersection signal. Since the signals were put into use in the fall of 1997, there havebeen no accidents. Some drivers feel the new system makes drivers more aware of thestop lights and buses13.
In April 1996, Sapporo city, Japan started operation of a Public Transportation PrioritySystem along a 5.7 km section of Route 36. An evaluation on the effectiveness of thesystem on weekdays was conducted during the month of May 1996 for the time periodbetween 7:30 and 9:00. Bus travel times in the section were reduced by 6.1%, whileridership increased 9.9%. Also reported was a 7.1% reduction in the number of stopsbusses made at signals which resulted in a 20.8% reduction in stopped time14.

15Kloos, W., et al., “Bus Priority at Traffic Signals in Portland: The Powell Boulevard Pilot Project,” ITECompendium of Technical Papers, July 1994.
16“Battle Lines Drawn in California Legislature Over Red Light Running Cameras,” The UrbanTransportation Monitor, May 22, 1998.
17Melillo, Wendy, “Traffic Enforcement By Remote Camera Catching On in Area,” The Washington Post,March 16, 1998, p B08.
18“Battle Lines Drawn in California Legislature Over Red Light Running Cameras,” The UrbanTransportation Monitor, May 22, 1998.
19Harris, John & Sands, Mary, “Life-Saving Speed Camera Technology,” Traffic Technology, 1995.
24
Portland, Oregon has integrated a bus priority system with the traffic signal system on amajor arterial. By allowing buses to either extend green time or shorten red time byonly a few seconds, the bus travel time was reduced by between 5% and 8%. Inaddition to the travel time savings, this approach allows the use of fewer vehicles toserve that route15.
Using intersection-mounted cameras to reduce violations has been shown to improvesafety at intersections by reducing the number of crashes. Research has determined thatnoncompliance with intersection controls accounts for 22% of all urban crashes. Thecosts associated with these crashes are estimated to exceed $7 billion annually16.
Fairfax City, Virginia has been using automated cameras to record intersectionviolations and ticket violators. City police report that the program is responsible fordecreasing the number of accidents throughout the city. In November 1997, 28accidents occurred at intersections with traffic lights compared with 43 accidents inNovember of 1996 before the devices were installed (approximately a 35% accidentreduction)17.
A three-year federally-funded project to implement red-light running (RLR) camerashas shown to reduce red-light running crashes by as much as 43%. Completed reportsfor Howard County, MD and Los Angeles, CA show success with the technology andreduction of RLR crashes18.
Initial indications from London show that camera enforcement equipment has beeninstrumental in saving lives through speed reduction and by limiting red-light running. Reductions in injury accidents range between 20% and 80% when using the cameras. Also, the installations in London show19:
• Speed has been reduced by about 10%
• All casualties have been reduced by about 20%
• Fatal and serious casualties have been reduced by about 50%

20Coleman, Janet A. et al “FHWA Study tour for Speed Management and Enforcement Technology,”Federal Highway Administration, Publication No. FHWA-PL-96-006, February 1996.
25
22%30% 33%
41%
0%
20%
40%
60%
80%
100%
1 2 3 4
Percent Reduction in StopsDue to Adaptive Control
4 Reported Values
Australia and the Netherlands have also experimented with red light cameras. Theyhave reported that the technology can reduce right-angle accidents by 32 percent20.
2.1.1 Summary of Arterial Management Systems Data
Based on the results from referenced reports, it appears that, in general, advancedtraffic signal systems (i.e. those providing traffic adaptive control) provide a significantpositive benefit. However, it is difficult to generalize an expected benefit for theseservices. Benefits for an individual area depend on a number of operational variablesthat are unique in each implementation. These variables may include, the number ofintersections or signals in a corridor, spacing of intersections, size of study area,corridor lengths, vehicle demand patterns, etc. However, it is possible to make somegeneral conclusions based on reported results that may be useful to decision makers.
The chart at the left presents the measured valuesfor percent reduction in the number of stops due toadaptive signal control presented in this section. As one would expect, if the flow of green bands ina corridor can be maintained as traffic patternschange, the number of stops can be reduced. Although no statistical analysis was done given thesmall amount of data presented, one mightconclude that a reduction of at least 20% in thenumber of stops for corridors using adaptivecontrol could be expected. This assumes thatbenefit results are compared to fixed timing plansand that significant variations exist in trafficpatterns in the study corridors.

26
15% 17%25%
37%44%
0%
20%
40%
60%
80%
100%
1 2 3 4 5
Percent Delay ReductionDue to Adaptive Control
5 Reported Values
8%14% 18% 20%
0%
20%
40%
60%
80%
100%
1 2 3 4
Percent Reduction in Travel TimeDue to Adaptive Control
4 Reported Values
The figures at the right present themeasured values due to adaptive signalcontrol for the percent reduction intravel time and delay discussed in thissection. As expected, the reductions oftravel time appear to be far less thanthat reported for delay saved. Furthermore, there is an apparent largerange of possible values for eachmeasure. A likely contributing factor tothis range is that individual studies maydefine or measure travel time and delaydifferently. Travel time may be definedas the time required to complete anentire trip or the time required totraverse a corridor or fraction of the trip. Delay may be defined as stopped timedue to signals only or as the timeexceeding a predetermined base traveltime. Depending on the definitions used,and other operational conditions,estimated values of time saved appear torange between 8% and 20%. Likewise,reductions in delay due to adaptivecontrol may range between 15% and 44%.
The number of reports depicting emission reductions and benefits of transit prioritysignal control have been small. Therefore, no overall conclusions can yet bedetermined. However, their impact appears to be positive, with the exception ofemissions of Nitrous-oxides. This is expected because improved flows and increases inspeed lead to increased production of Nitrous-oxides while decreasing other emissionmeasures.

27
Freeway ManagementSystems
Surveillance
Incident Detection
Control
Lane Control
Freeway Entrance
Ramp Metering
Display -Audio/Visual
VMS
HAR
Speed Limits
Enforcement
Specialized Info.
Ramp Rollover
Downhill
IVS
Lane Use
2.2 FREEWAY MANAGEMENT SYSTEMS
There are three major ITS functions that make upFreeway Management Systems. Two of these arethe monitoring and control of freeway operations. Monitoring and surveillance can be used toimplement control and management strategies suchas ramp metering rates and variable speed limitsbased on observed freeway conditions. The thirdfunction consists of displaying or providing thatinformation to the motorist. Motorists may receivethis information in several ways, including VariableMessage Signs (VMS), Highway Advisory Radio(HAR), In-vehicle Signing (IVS), or specializedinformation can be transmitted to only a specific setof vehicles. Enforcement is also included when it can be shown to improve safety. Figure 2-3 shows the classification of benefits data for freeway management systems.
Figure 2-3: Taxonomy of Freeway Management Systems
21Henry, K. and Meyhan, O., “6 Year Flow Evaluation”, Washington State DOT, District 1, January1989.
22“Ramp up the Volume,” in ITS International, Nov/Dec 1997.
23“Partners in Motion, 494 Transportation Corridor: ICTM Project, Interim Report #1,” Prepared forICTM Evaluation Committee by HNTB Corporation, undated.
24Smith, S. and Perez, C., “Evaluation of INFORM - Lessons Learned and Application to Other Systems,”Conference Paper Presented at 71st TRB, January 1992.
28
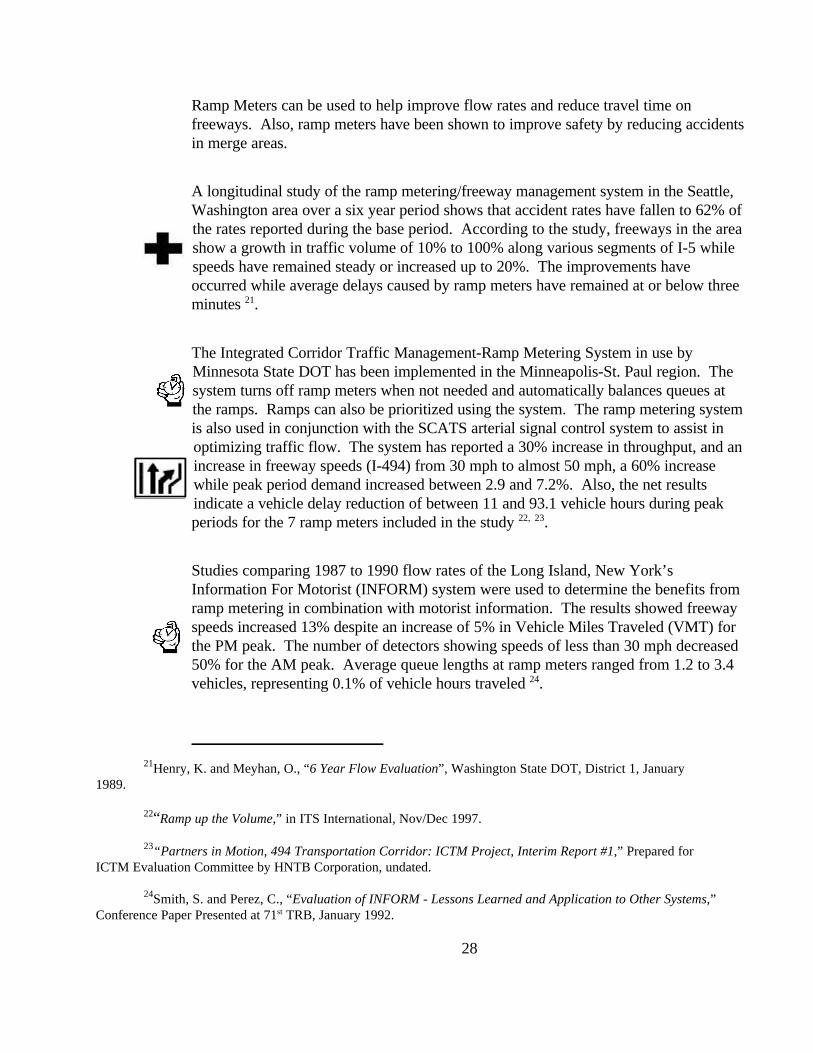
Ramp Meters can be used to help improve flow rates and reduce travel time onfreeways. Also, ramp meters have been shown to improve safety by reducing accidentsin merge areas.
A longitudinal study of the ramp metering/freeway management system in the Seattle,Washington area over a six year period shows that accident rates have fallen to 62% ofthe rates reported during the base period. According to the study, freeways in the areashow a growth in traffic volume of 10% to 100% along various segments of I-5 whilespeeds have remained steady or increased up to 20%. The improvements haveoccurred while average delays caused by ramp meters have remained at or below threeminutes 21.
The Integrated Corridor Traffic Management-Ramp Metering System in use byMinnesota State DOT has been implemented in the Minneapolis-St. Paul region. Thesystem turns off ramp meters when not needed and automatically balances queues atthe ramps. Ramps can also be prioritized using the system. The ramp metering systemis also used in conjunction with the SCATS arterial signal control system to assist inoptimizing traffic flow. The system has reported a 30% increase in throughput, and anincrease in freeway speeds (I-494) from 30 mph to almost 50 mph, a 60% increasewhile peak period demand increased between 2.9 and 7.2%. Also, the net resultsindicate a vehicle delay reduction of between 11 and 93.1 vehicle hours during peakperiods for the 7 ramp meters included in the study 22, 23.
Studies comparing 1987 to 1990 flow rates of the Long Island, New York’sInformation For Motorist (INFORM) system were used to determine the benefits fromramp metering in combination with motorist information. The results showed freewayspeeds increased 13% despite an increase of 5% in Vehicle Miles Traveled (VMT) forthe PM peak. The number of detectors showing speeds of less than 30 mph decreased50% for the AM peak. Average queue lengths at ramp meters ranged from 1.2 to 3.4vehicles, representing 0.1% of vehicle hours traveled 24.

25Robinson, J. and Piotrowicz, G., “Ramp Metering Status in North America, 1995 Update,” federalHighway Administration, June 1995.
29
A national survey of traffic management centers using ramp metering reported speedincreases between 16% and 62%, travel time improvements of up to 48%, andincreases in peak throughput between 8% and 22% while demand increased 17%–25%. Accidents were reduced between 15% and 50%. While some other freewayimprovements were implemented during the study periods, the combination ofgeometric, vehicle, and operational procedures resulted in significant reduction ofaccident rates25. The results from individual studies in the survey are summarizedbelow:
• Portland, Oregon: 58 ramp meters, 43% accident reduction, 39% traveltime reduction, 25% demand increase, 60% increase in speed.
• Minneapolis/St. Paul, MN: 6 ramp meters, 8 km of freeway, 24%accident reduction, 38% accident rate reduction, 16% increase in speed.
• Minneapolis, MN: 39 ramp meters, 27 km of freeway, 27% accidentreduction, 38% demand increase, 35% increase in speed, 32% increasein demand.
• Seattle, WA: 22 ramp meters, 52% decrease in travel time, 39%decrease in accident rate, 86% increase in demand.
• Denver, CO: 5 ramp meters, 50% accident reduction, 18.5% demandincrease
• Detroit, MI: 28 ramp meters, 50% accident reduction, 8% increase inspeed, 12.5% increase in demand.
• Austin, TX: 3 ramp meters, 4.2 km of freeway, 60% increase in speed,7.9% increase in demand.
• Long Island, NY: 70 ramp meters, 207 km of freeway, 15% accidentreduction, 9% increase in speed.

26Borrough, Peter, “Variable Speed Limits Reduce Accidents Significantly in the U.K.,” The UrbanTransportation Monitor, March 14, 1997.
27“Speed Modulation Experimentation,” SANEF, eastern and Norther Highways Concessionary Company- France, October, 1998.
28 Taylor, B. and Bergan, A.,“Words of Warning” in ITS: intelligent transport systems, Issue No 10,May/June 1997.
30
The Department of Transport in the United Kingdom has implemented variable speedlimits on the M25, one of the most congested freeways in England. Loop detectorsmeasuring traffic density and speed are used to lower speed limits as congestionincreases. Speed limits are then displayed on variable message signs, and are enforcedusing photographic cameras. During an 18 month study, results showed that trafficaccidents had decreased by 28%. Motorists were more inclined to keep to their lanewhen there no longer was a “faster lane.” They were also more inclined to keep to theinside lane and to keep proper distances between successive vehicles. This resulted insmoother traffic flow which actually increased average travel times of traffic26.
A 12 kilometer section of the A4 in Strasbourg, France is experimenting with anothervariable speed limit system. The system sets up an “advised speed” of 50, 70, 90, or110 kph depending on traffic density. The results to date indicate a 5% increase ineffective capacity during peak hours27.
The safety potential for a specialized roadside information systems that warn vehicles ofa potentially dangerous highway situation are currently being installed in severallocation across the U.S. Two of these systems have reported quantifiable benefits. Over the past decade, the Washington, DC, Capitol Beltway area has experiencedseveral accidents involving truck rollovers at exit and entry ramps. As a result, threesites around the capitol region were selected as ITS operational test sites for a RampRollover Warning System (RRWS). The sites are located at both the Maryland andVirginia Capitol Beltway (I-495) and I-95 Interchanges, and the interchange betweenthe Capitol Beltway and Virginia state route 123. The system consists of a weigh-in-motion scale, height detection, and a processor to calculate the rollover threshold speedfor trucks on the ramp. The critical safe threshold speed is based on the maximumcurvature of the ramp. The system is used to alert drivers to slow down by activating aVMS when the maximum safe speed is exceeded. Before the implementation of RRWSthere were ten reported rollover truck accidents at the three sites between 1985 and1990. Between implementation in 1993 and 1997, there were no rollover accidents atany of the sites and average truck speed has been reduced by 11kph28.
29Taylor, B. and Bergan, A.,“Words of Warning” in ITS: intelligent transport systems, Issue No 10,May/June 1997.
31
15%24% 27%
43%50% 50%
0%
20%
40%
60%
80%
100%
1 2 3 4 5 6
Percent Accident ReductionDue to Ramp Metering
6 Reported Values
8% 9% 13% 16% 20%
35%
60% 60% 60%
0%
20%
40%
60%
80%
100%
1 2 3 4 5 6 7 8 9
Percent Increase in SpeedDue to Ramp Metering
9 Reported Values
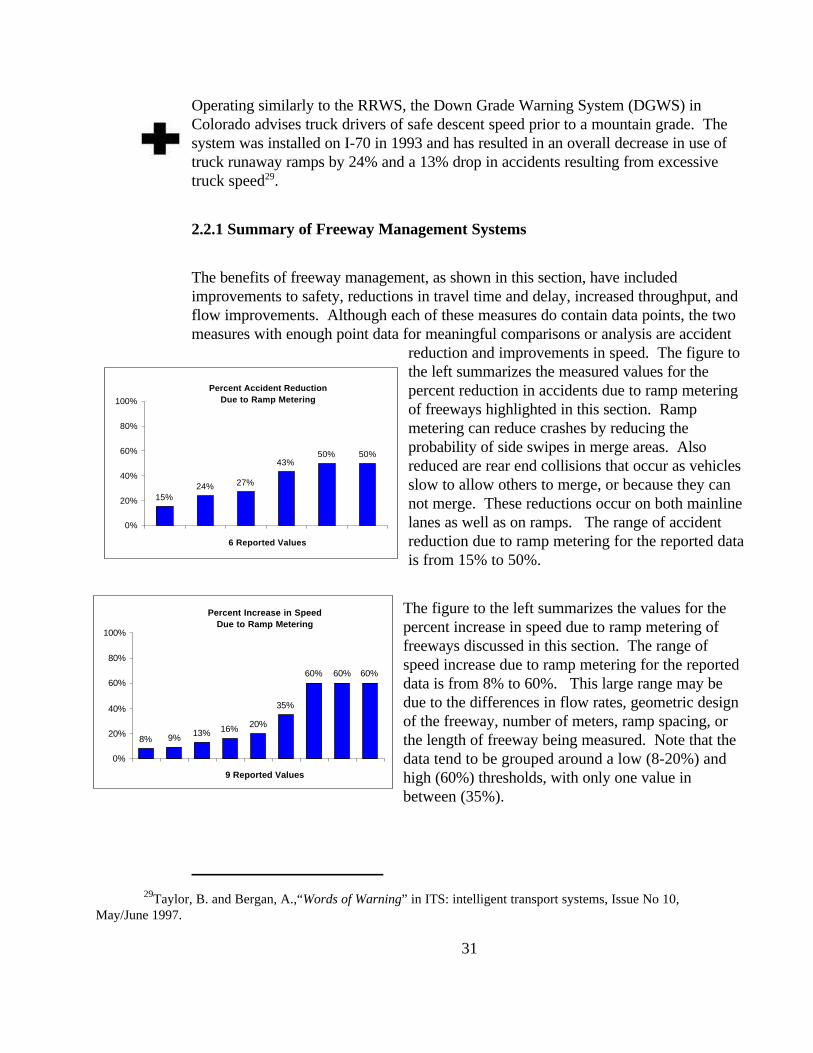
Operating similarly to the RRWS, the Down Grade Warning System (DGWS) inColorado advises truck drivers of safe descent speed prior to a mountain grade. Thesystem was installed on I-70 in 1993 and has resulted in an overall decrease in use oftruck runaway ramps by 24% and a 13% drop in accidents resulting from excessivetruck speed29.
2.2.1 Summary of Freeway Management Systems
The benefits of freeway management, as shown in this section, have includedimprovements to safety, reductions in travel time and delay, increased throughput, andflow improvements. Although each of these measures do contain data points, the twomeasures with enough point data for meaningful comparisons or analysis are accident
reduction and improvements in speed. The figure tothe left summarizes the measured values for thepercent reduction in accidents due to ramp meteringof freeways highlighted in this section. Rampmetering can reduce crashes by reducing theprobability of side swipes in merge areas. Alsoreduced are rear end collisions that occur as vehiclesslow to allow others to merge, or because they cannot merge. These reductions occur on both mainlinelanes as well as on ramps. The range of accidentreduction due to ramp metering for the reported datais from 15% to 50%.
The figure to the left summarizes the values for thepercent increase in speed due to ramp metering offreeways discussed in this section. The range ofspeed increase due to ramp metering for the reporteddata is from 8% to 60%. This large range may bedue to the differences in flow rates, geometric designof the freeway, number of meters, ramp spacing, orthe length of freeway being measured. Note that thedata tend to be grouped around a low (8-20%) andhigh (60%) thresholds, with only one value inbetween (35%).

30Goeddel, D., “Benefits Assessment of Advanced Public Transportation Systems (APTS)”, prepared forFederal Transit Administration by Volpe National Transportation Systems Center, July 1996.
32
Transit Information
Display - Audio/Visual
AVL
ParaTransit
CAD
Maintenance
Traveler Info.
Transit Management Systems
Transit Management
2.3 TRANSIT MANAGEMENT SYSTEMS
Advanced Public TransportationSystems (APTS) help to provideadditional safety and security topassengers by allowing remotemonitoring of transit vehicle status andpassenger activity. Transit ITS servicesalso assist operators in maintaining fleetsof vehicles. Vehicle self-diagnostics canalert mechanics of potential problems orwhen they are nearing scheduledmaintenance. Transit operators can also use automated vehicle location (AVL) andComputer Aided Dispatch (CAD) devices to improve scheduling activities and maintainschedule adherence. Figure 2-4 shows the taxonomy of Transit Management Systemsused for this section. Electronic Fare Payment, which is discussed in section 2.7, alsoprovides significant benefits to transit operations.
Analysis of benefits accruing to the transit industry from APTS technologies predictsthat current and planned deployments at US transit properties will yield benefitstotaling between $3.8 billion and $7.4 billion in discounted 1996 dollars over the nextseveral years. In approximate terms, 44% of the total results are from transitmanagement systems, 34% are from electronic fare payment systems, 21% are fromadvanced traveler information systems, and 1% of the total benefit is from computer-aided dispatching in demand-responsive transit applications30.
Figure 2-4: Taxonomy of Transit Management Systems

31 Jones, W., “ITS Technologies in Public Transit: Deployment and Benefits”, USDOT ITS Joint ProgramOffice, November 1995.
32Casey, R. et. al., “Advanced Public Transportation Systems: The State of the Art - Update ’96,” USDOTFederal Transit Administration, January 1996.
33 Stone, J., “Winston-Salem Mobility Management: An Example of APTS Benefits, “ NC State University,1995.
33
For nearly a decade, transit properties have been installing and using automatic vehiclelocation (AVL) systems based on signpost, triangulation, LORAN, and GPStechnologies31. Transit agencies have also utilized Computer Aided Dispatch (CAD)systems to improve efficiency and service. The most direct improvement enabled bytransit management systems relates to schedule adherence. Fleet management systemswith vehicle location capability are producing benefits in productivity, security, andtravel time. In addition, several operators have reported incidents where AVLinformation assisted in resolving disputes with employees and patrons. A 1996 studyfound 22 U.S. transit systems operating more than 7,000 vehicles under AVLsupervision and another 47 in various stages of procurement. The new procurementsrepresent a tripling of the number of deployed systems, with most new systems using aGPS-based location process. Five Canadian operators are using AVL on fleets totaling3700 buses, including a 2300-vehicle fleet in Toronto32.
The Transit Authority in Winston-Salem, North Carolina, evaluated the effects of acomputer-aided dispatch and scheduling system on the operation of a 17 bus fleet. During a 6-month period, the client list grew from 1,000 to 2,000 and vehicle miles perpassenger-trip grew 5%. At the same time, operating expenses dropped 2% perpassenger trip and 9% per vehicle mile. These productivity improvements occurred atthe same time that other service improvements were incorporated. As a result, it isdifficult to isolate the effects of the CAD system. These improvements included theinstitution of same day reservations, which grew to account for 10% of trips. Alsonoted was a decrease in passenger wait time of over 50%33 .
After an extended analysis of travel times, Kansas City, Missouri, was able to reduce upto 10% of the equipment required for some bus routes using an AVL/CAD system. The system allows fewer buses to serve those routes with no reduction in customerservice. The result is a savings in both operating expense and capital expense byactually removing these buses from service and not replacing them. The productivitygain of eliminating seven buses out of a 200 bus system allowed Kansas City to recovertheir investment in AVL in two years. Other transit systems have reported reductions

34 Jones, W., “ITS Technologies in Public Transit: Deployment and Benefits,” USDOT ITS Joint ProgramOffice, November 1995.
35Giugno, M., Milwaukee County Transit System, July 1995 Status Report.
36Ibid
34
in fleet size of 4% to 9% due to efficiencies of bus utilization34. The Kansas City AreaTransportation Authority in and around Kansas City, Missouri, improved on-timeperformance by 12% in the first year of operation using AVL, compared to a 7%improvement as the result of a coordinated effort to improve on-time performancebetween 1986 and 198935.
Preliminary results from Milwaukee, Wisconsin, indicate a 28% decrease in the numberof buses more than one minute behind schedule. The Mass Transit Administration inBaltimore, Maryland, reported a 23% improvement in on-time performance by AVL-equipped buses36.
2.3.1 Summary of Transit Management Systems
Transit management systems have demonstrated that they are capable of reducing traveltime both by improving the operation of the vehicles and the overall operation of thetransportation network. Transit management systems improve schedule adherenceresulting in a reduction in passenger wait time and improvement in transfercoordination. Also, the application of advanced transit systems reduce the cost ofoperations and improve staff productivity and the utilization of facilities and equipment.
Due to the wide range of measures of effectiveness and different conditions eachsystem is implemented under, impact measures of transit management systems reportedin this section appear to be uncomparable between implementations. Therefore, it isdifficult to predict the expected benefits from these systems. However, it does appearthat those systems utilizing AVL and CAD have significant benefits. There arecurrently several operational tests underway examining different methods andimplementations of transit management. Over the next few years, it is expected thatthese programs will mature and publish evaluation reports.

37“Incident Management: Detection, Verification, and Traffic Management,” Field Operational TestCross-Cutting Study, Boos Allen & Hamilton, September 1998.
35
Incident ManagementSystems
Surveillance
Detection
Response
Patrols
2.4 INCIDENT MANAGEMENT SYSTEMS
It is projected that by the year 2005,incident related congestion will cost theU.S. public over $75 billion in lostproductivity and will result in over 8.4billion gallons of wasted fuel37. Incidentmanagement systems can reduce theseeffects by decreasing the time to detectincidents, reducing the time forresponding vehicles to arrive and bydecreasing the time required to returnthe facility to normal conditions. Freeway service patrols, which began prior to theemergence of ITS technologies, but are being incorporated into traffic managementcenters, significantly reduce the time to clear incidents, especially minor incidents. It isgenerally understood that incident management systems are implemented concurrentlywith freeway management systems, but is important to keep in mind that arterials canbe included in incident management programs as well. The classification of benefitsdata for incident management systems is summarized in figure 2-5.
Figure 2-5: Taxonomy for Incident Management Systems
The Gowanus Expressway/Prospect Expressway rehabilitation project in Brooklyn,NY, has one of the most advanced incident detection systems presently deployed in theUS. The system consists of an automated incident detection system and 20 closed-circuit television (CCTV) cameras with pan, tilt, and zoom capabilities. Othertechnologies in place include highway advisory radio, variable message signs and aconstruction information hotline. Processors analyze the data from the CCTVs anddetermine speed, occupancy, and volume of the vehicles. An alarm sounds if anincident is detected, altering the traffic control center operators. Before the system wasintroduced, it took an average of 1.5 hours to clear any type of incident. Sinceimplementation of the system, the time it takes to aid a motorist whose vehicle has
38Samartin, Kevin, “Under Detection,” ITS: intelligent transport systems, May/June 1997.
39Taylor, Steven T., feature article, ITS World, Jan/Feb 1997.
40Henk, Russell H. et al, “Before-and-After analysis of the San Antonio TransGuide System,” TexasTransportation Institute, Third World Congress on Intelligent Transportation Systems, July 1996.
41Intelligent Transport Systems Handbook in Japan, Highway Industry Development Organization,Ministry of Construction.
36
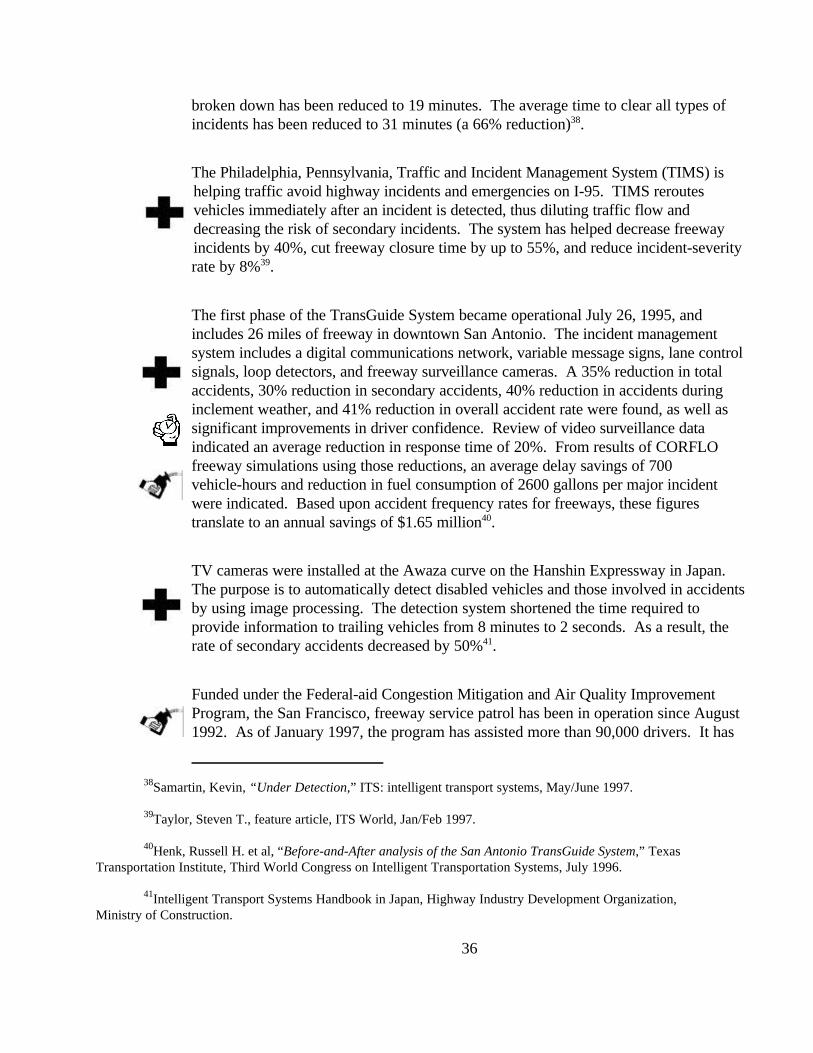
broken down has been reduced to 19 minutes. The average time to clear all types ofincidents has been reduced to 31 minutes (a 66% reduction)38.
The Philadelphia, Pennsylvania, Traffic and Incident Management System (TIMS) ishelping traffic avoid highway incidents and emergencies on I-95. TIMS reroutesvehicles immediately after an incident is detected, thus diluting traffic flow anddecreasing the risk of secondary incidents. The system has helped decrease freewayincidents by 40%, cut freeway closure time by up to 55%, and reduce incident-severityrate by 8%39.
The first phase of the TransGuide System became operational July 26, 1995, andincludes 26 miles of freeway in downtown San Antonio. The incident managementsystem includes a digital communications network, variable message signs, lane controlsignals, loop detectors, and freeway surveillance cameras. A 35% reduction in totalaccidents, 30% reduction in secondary accidents, 40% reduction in accidents duringinclement weather, and 41% reduction in overall accident rate were found, as well assignificant improvements in driver confidence. Review of video surveillance dataindicated an average reduction in response time of 20%. From results of CORFLOfreeway simulations using those reductions, an average delay savings of 700vehicle-hours and reduction in fuel consumption of 2600 gallons per major incidentwere indicated. Based upon accident frequency rates for freeways, these figurestranslate to an annual savings of $1.65 million40.
TV cameras were installed at the Awaza curve on the Hanshin Expressway in Japan. The purpose is to automatically detect disabled vehicles and those involved in accidentsby using image processing. The detection system shortened the time required toprovide information to trailing vehicles from 8 minutes to 2 seconds. As a result, therate of secondary accidents decreased by 50%41.
Funded under the Federal-aid Congestion Mitigation and Air Quality ImprovementProgram, the San Francisco, freeway service patrol has been in operation since August1992. As of January 1997, the program has assisted more than 90,000 drivers. It has

42“Innovations in Transportation and Air Quality: Twelve Exemplary Projects,” US department ofTransportation, Publication number FHWA-PD-96-016, 1996.
43“Estimation of Benefits of Houston TranStar,” Prepared by Parsons Transportation Group incooperation with the Texas Transportation Institute, February 7, 1997.
44“Innovations in Transportation and Air Quality: Twelve Exemplary Projects,” US department ofTransportation, Publication number FHWA-PD-96-016, 1996.
45Cuciti P., and B Janson., “Incident Management via Courtesy Patrol: Evaluation of a Pilot Program inColorado,” 74th annual Meeting of the Transportation Research Board, Washington DC, Transportation ResearchRecord, 1995.
37
decreased air pollution and reduced fuel consumption by helping to reduce the effectsof incident-caused congestion, start-and-stop travel and vehicle idling. Estimatesindicate a reduction in 32 kg/day of hydrocarbons, 322 kg/day of CO emissions, andNOx is reduced by 798 kg/day42.
The incident management program of the Houston TranStar system covers 127 miles ofthe Houston Texas freeway network. An analysis for freeway incidents within theTranStar system estimated an annual delay savings of 572,095 vehicle-hours with aneconomic value of $8.4 million. The ramp metering program on the I-10 Katy Freewayof the TranStar system reports daily savings of 2,875 vehicle hours resulting in a$37,030 benefit to Houston commuters. In 1996, there were seven occurrences wherevideo surveillance was used to determine if HOV restrictions could be lifted. It wasestimated that 12,910 vehicles were able to save between 13.5 to 27 minutes overthose vehicles remaining in the queue for a total estimated cost savings of $42,500 to$85,10043. As a result of reducing incident detection and response time, the TranStarManagement Center helps to reduce hydrocarbons by 91 kg/day44.
The six month pilot Courtesy Patrol Program in Denver, Colorado is estimated to havereduced the cost of traffic delay by $0.8–$1.0 million for the morning period, and by$0.90–$0.95 million in the evening. This assumes a time value of $10 per hour. Program costs varied between the tow truck operators from $29 to $38 per truck-hour,which results in a benefit to cost ratio of 10.5:1 to 16.9:145.
In preparation for the 1996 Olympic Games, Atlanta Georgia added several ITScapabilities to assist in moving visitors and vehicles in an extremely crowded area. Improved interagency coordination was developed based on the capabilities of aregional ATMS program. The mean time between the first report of an incident andincident verification was reduced from 4.2 minutes to 1.1 minutes, a reduction of 74%. Mean time between incident verification and automated generation of incident response

46Booz Allen & Hamilton,”1996 Olympic and Paraolympic Event Study,” Final Report, May 1997.
47COMSIS Corporation, “CHART Incident Response Evaluation Final Report,” Silver Spring, MD, May1996.
48Minnesota Department of Transportation, “Highway Helper Summary Report - Twin Cities MetroArea,” Report # TMC 07450-0394, July 1994.
38
was reduced from 9.5 minutes to 4.7 minutes (50%). The mean time between incidentverification and clearance of traffic lanes was reduced from 40.5 minutes to 24.9minutes (38%). The maximum time between incident verification and clearance oftraffic lanes was reduced from 6 hours 15 minutes to 1 hour 28 minutes, a 76%reduction46.
The Maryland CHART program is in the process of expanding to more automatedsurveillance with lane sensors and video cameras. The evaluation of the initialoperation of the program shows a benefit/cost ratio of 5.6:1, with most of the benefitsresulting from a 5% (2 million vehicle-hours per year) decrease in delay associated withnon-recurrent congestion47.
The Minnesota Highway Helper Program48 reduces the duration of a stall (the mostfrequent type of incident, representing 84% of service calls) by 8 minutes. Based uponrepresentative numbers, annual benefits through reduced delay total $1.4 million for aprogram that costs $600,000 to operate.
2.4.1 Summary of Incident Management
Table 2-1 summarizes the data presented in this section. Incident managementprograms have shown the potential to reduce both the number of accidents and the timerequired to detect and clear incidents. These programs show a significant savings in thecost of congestion and have been shown to be cost effective. In addition, the publicresponse to these programs has been positive.

39
Location
Reduced Incident
Clearance Time
Reduced Response
TimeAccident
Reduction
Secondary Accident
Reduction
Reduced Accident
Rates
Cost Savings/yr. ($ millions)
Delay Savings (hrs/yr.)
Brooklyn, NY 66.0%Philadelphia, PA 40.0%San Antonio, TX 20.0% 35.0% 30.0% 41.0% 1.65 255,500 Japan 50.0%Houston, TX 8.40 572,095 Denver, CO 0.95 95,000 Atlanta, GA 2,000,000 Minnesota 1.40
Emergency Management
Emergency Management
Dispatch
Emergency Vehicle
Guidance
Fleet Management
AVL
Table 2-1: Summary of Incident Management Data
2.5 EMERGENCY MANAGEMENT
The benefits of emergency management aresometimes highly dependent on the relatedimplementations of Incident Managementsystems. Benefits related to the notification,dispatch, and guidance of emergency orother response equipment are included in thisreport, as shown in figure 2-6.
Figure 2-6: Taxonomy of Emergency Management

49Taylor, Steven T.,”Helping Americans,” feature article in ITS World, Jan/Feb 1997.
50Shifrel, Scott, “Satellites Around Globe May Save Lives Right Here,” The Palm Beach Post, June 1,1997.
51Haselkorn, M., et al., “Evaluation of PuSHMe Mayday System,” Final Report, June 19, 1997.
40
Emergency Response Saves a Life:
Heading home for supper, ambulance 706 of the DallasFire Department had just left the hospital, when itsmobile data terminal alarm sounded. Two blocksaway, inside the jurisdiction of Ambulance 703, a majorauto accident had occurred. Arriving on scene in 43seconds Ambulance 706 found a patient with chesttrauma caused by hitting the steering wheel and washaving severe breathing difficulty. Paramedics rapidlyremoved the patient from the vehicle and transportedhim to the hospital. The patient survived the incidentwithout complications.
Patients with trauma to the chest usually only have afew minutes before the onset of traumatic asphyxia,which leads to brain damage and death. Without theAVL system , the dispatcher would have sentAmbulance 703 to the accident. It would have takenapproximately 5 minutes for 703 to reach the scene. Rescuers are convinced that the patient survivedbecause the AVL system identified the closest unit.
FROM: Steffy, Christina, “ITS to the Rescue,” ITS World, July/August1997.
Albuquerque, New Mexico uses amap-based computer-aided dispatchsystem in its ambulance fleet. Thesystem allows the dispatch center tosend ambulances to the exact locationof an emergency and provideguidance on how to get there. As aresult, the company’s efficiency hasincreased by 10 to 15 percent49.
Palm Beach County, Florida isinstalling the Priority One trafficsystem, connecting the GlobalPositioning System (GPS) to itsemergency vehicles, that could cut20% from the response time,depending on the intersection andtime of day (as found by two Illinoistowns currently using the system). Asthe vehicle approaches a traffic light,it transmits a signal interrupting thenormal cycle, which allows theemergency vehicle to go through itwithout stopping. The GPS systemwill also allow dispatchers to figureout who is closer to an emergency. The cost is about $4000 perintersection and $2000 per vehicle50.
The Puget Sound Help Me (PuSHMe) Mayday System allowed a driver to immediatelysend a response center a notification and location of incidents along with the need forany assistance. The system includes 2-way pagers and cellular telephones that transmitvehicle location, nature of the problem, and a priority level of the problem to a responsecenter. The devices may also send automated signals when the driver may be incapableof manually initiating a signal. Of those drivers equipped with voice communications,95% felt more secure while 70% of those with only data communications said that theywere more secure with the system installed51.

52“Intelligent Transport Systems Handbook in Japan,” Highway Industry Development Organization,Ministry of Construction, October 1997.
53Clean Air Action Corp., “Proposed General Protocol for Determination of Emission Reduction CreditsCreated by Implementing an Electronic Pike Pass System on a Tollway,” Study for the Northeast States forCoordinated Air Use management, December, 1993.
41
Toll AdministrationElectronic Toll Collection
Toll Collection
Vehicle
2.6 ELECTRONIC TOLL COLLECTION
Electronic Toll Collection (ETC) is one ofthe ITS program areas where little newbenefits information is required. Benefitsdue to impacts on the cost of tolladministration, management and collectionhave been demonstrated. Vehicle delayreduction and throughput at toll plazashave been proven to be very high. Therefore, many of the recent reports forapplications of ETC have concentrated on the accuracy and improvements in vehicleidentification. Technologies are now capable of identifying vehicles at mainline speedsand at a high rate of accuracy. As a result, throughput is maximized, and delay thatwould occur at toll plazas is substantially reduced.
Figure 2-7: Taxonomy of Electronic Toll Collection
Japan initiated a test operation of ETC at the Odawara Toll Gate on March 31, 1997 toconfirm that safe and smooth traffic operation can be secured at actual toll gates. Where conventional toll collection takes 14 seconds per car in Japan on average, ETCtakes only about 3 seconds per car52.
The Pike Pass ETC program on the Oklahoma Turnpike started operation on the firstof January 1991. As of June 1994, 250,000 passes had been issued, of which over 90%(226,000) were still active, accounting for 35% of the turnpike association’s revenue 53.
A protocol, prepared by the Northeast States for Coordinated Air Use Management, isused to estimate toll booth emissions at three locations. The locations are the

54Clean Air Action Corp., “Proposed General Protocol for Determination of Emission Reduction CreditsCreated by Implementing an Electronic Pike Pass System on a Tollway,” Study for the Northeast States forCoordinated Air Use management, December, 1993.
55Lennon L., “Tappan Zee Bridge E-Z Pass System Traffic and Environmental Studies,” Compendium ofTechnical Papers, 64th ITE Annual Meeting, Institute of Transportation Engineers, 1994.
56Philip, Davy & Walter Schramm, “Cashless tolls mean money saved,” Reprinted from TrafficTechnology International 1997 for Hughes Transportation Management Systems, Canada.
42
2% 2%10% 14%
43%
0%
20%
40%
60%
80%
100%
BuildingUtilities
BuildingMaintenance
MoneyHandling
Staff
RoadwayMaintenance
TollCollection
Staff
Estimated Annual Operating Cost Savings for ETC
Muskogee Turnpike in Oklahoma, the Asbury Plaza on the Garden State Parkway inNew Jersey, and the Western Plaza on the Massachusetts Turnpike. The protocol isbased on dynamometer tests and toll road observation. The Clean Air Action Corp.report uses the experiences gained with the Pike Pass project and applies them to theother two freeways. It projects significant reduction in tons of pollutants for the 260day commuter case. The overall percent change is dependent upon the frequency oftoll plazas. The average emissions reductions are 72% for carbon monoxide, 83% forhydrocarbons, and 45% for oxides of nitrogen per mile of impacted operation54.
As stated earlier, ETC can greatly improve throughput on a per-lane basis comparedwith manual toll collection techniques. On the Tappan Zee Bridge toll plaza, a manualtoll lane can accommodate 400–450 vehicles per hour while an electronic lane peaks at1000 vehicles per hour55.
2.6.1 Summary of Electronic Toll Collection
Deployment of ETC is occurring throughout theUnited States at a rapid pace and is being driven bycost savings to the operator. A recent study hasshown that ETC can reduce the cost of staffing tollbooths by 43.1%, money handling by 9.6%, androadway maintenance by 14.4%. The figure on theleft summaries these estimated savings56.

57Mathieu, J., “Multiservices/Multiproviders Remote Ticketing on the Marseille Metropolitan Area,”Proceedings of the Second World Congress on Intelligent Transport Systems, November 1995.
43
Administration/ManagementElectronic Fare Payment
Transit Vehicle
Non-Rail
Rail
2.7 ELECTRONIC FARE PAYMENT PROGRAMS
Electronic Fare Payment is another one of theITS program areas where little new benefitsinformation has been required to justifyimplementation. Electronic fare payment testsare ongoing in both bus and rail systems whichaddress customer convenience and security.
Figure 2-8: Taxonomy of Electronic Fare Payment
In California, tests comparing various card technologies have found RF proximity cardsto be high in reliability. A test in the Marseilles, France, metropolitan area is comparingRF and IR technologies that would allow each patron to use a card of his or her choice(credit card, debit card, monthly pass, etc.) for transportation payment, whileprocessing a transaction in less than a second57.
The Phoenix transit operators have used electronic fare payment techniques since 1991. Maricopa County, the county encompassing Phoenix, passed a travel reductionordinance that required each employer in the Phoenix area with over 100 employees toreduce single-occupancy commuting trips by 5% in two years. This ordinance waspassed to help the county comply with the Arizona state legislatures’ air quality billpassed in the late 1980's. To assist in the data collection needed for this program aswell as to reduce operational problems, the City of Phoenix Public Transport Systemled the development of the Bus Card Plus system to read magnetically encoded plasticpasses. Employers were then billed monthly for transit use by their employees. As of1996, 190 companies participate in the Arizona system with a total of 35,000 cards inuse. Express routes report 90% of fares are paid by bus pass cards. Since employers

58Schwenk, J., “Using Credit Cards To Pay Bus Fares in Phoenix,” The Volpe Center, DOT-TSC-FTA-96-01, 1996.
59Dinning, M., “Benefits of Smart Cards in Transit,” The Volpe Center September 1995.
60Jones, W., “ITS Technologies in Public Transit: Deployment and Benefits,” USDOT ITS Joint ProgramOffice, November 1995.
61Federal Railroad Administration, Office of Safety Analysis
44
are billed only for transit usage rather than purchasing monthly passes, costs to themare decreasing by up to one third. Starting in May of 1995, VISA and MasterCardhave also been accepted. During the four months between May and September 1995,processing fees totaled under 7% of revenue generated and there were no majorproblems58.
While much of the literature regarding electronic fare payment discusses technicalcapability and patron convenience, some indications of benefits to the transit propertyare accumulating. Reductions in data collection costs range from an estimated $1.5million in Manchester, UK to a predicted $5 million in Ventura, California, in additionto improved data accuracy59. New York estimates the increase in ridership due toelectronic fare payment to be worth $49 million. New Jersey Transit estimates annualcost reduction of $2.7 million in cash handling, while Atlanta estimates $2 million insavings60.
2.8 HIGHWAY-RAIL INTERSECTIONS
The need for improvements at highway-railway intersections (HRI) is indicated bythe number of accidents that occur on ayearly basis. Additionally, the occasionalspectacular accident including schoolchildren or hazardous materials attractsnational attention. However, the numberof accidents occurring at HRIs hascontinued to decline over the last severalyears. Statistics as of November, 1998show that from January to August 1998 2,297 HRI incidents were reported. Thisnumber is down 11.7% over that of the same period in 1997. The number of fatalitieswere also reduced 5.6% over the same period61. It should be noted that thesereductions are not related to ITS implementations.

45
Highway Rail Intersection
Surveillance
Display -Audio/Visual
Control
Signals
Enforcement
VMS
IVS
HAR
Regional MultimodalTraveler Information
Pretrip Information
Enroute Information
Several operational tests involving coordinating traffic signals and notifying vehicles ofapproaching trains at intersections are currently being developed and implemented. Afew pilot projects are now in progress to test new technologies but have yet to producequantitative data on benefits. Figure 2-9 illustrates the classification of benefits data forhighway-rail intersections.
Figure 2-9: Taxonomy for Highway-Rail Intersections
2.9 REGIONAL MULTI-MODAL TRAVELER INFORMATION
Providing traveler information over severalmodes of travel can be beneficial to both thetraveler and service providers. Several transitagencies have started using travelerinformation kiosks and web sites to provideschedules, expected arrival times, expected triptimes, and route planning services to patrons. Also, several traffic management centers areproviding current traffic conditions andexpected travel times using similar approaches. These services allow users to make a moreinformed decision for trip departures, routes,and mode of travel. They have been shown toincrease transit usage, and may help to reducecongestion when travelers choose to defer orpostpone trips, or to select alternate routes.
Figure 2-10: Taxonomy for Regional Multimodal Traveler Information

62“Survey Finds London Transit Info changes Behavior, Creates Revenue,” Inside ITS, March 9, 1998,p8.
63Tech Environmental, Inc., “Air Quality Benefit Study of the SmarTraveler Advanced TravelerInformation Service,” July 1993.
46
Rail, Omnibus, Underground Travel Enquiry System (ROUTES), is a computerizedroute planning system in use by London Transport. The system is used to providedcallers with information about the transit system and to assist in route selection, and tripplanning. Studies indicate that 80% of those using the system make the journey theyask for information about. It is also estimated that 38% of callers change their routebased on information received from the call. An additional 13% of callers decide totravel by transit for trips they would not normally use public transit for. The 13%increase is estimated to generate ‹1.3 million of revenue for bus companies, ‹1.2million for the underground, and ‹1 million for the railways. Furthermore, societalbenefits could be as much as ‹11 million62.
Surveys performed in the Seattle, Washington area and Boston, Massachusetts areasindicate that when provided with traveler information, 50% of travelers change route oftravel and 45% will change time of travel. Additionally 5%–10% of travelers willchange travel mode based on traveler information. Assuming that 30% of the 96,000daily callers projected for 1999 change travel plans according to this breakdown, theimpact of SmarTraveler in Boston on emissions has been estimated using theMOBILE5a model. On a daily basis, this adjustment of travel behavior nets anestimated reduction of 498 kg of volatile organic compounds, 25kg of NOx, and 5032
kg of CO representing reductions of 25%, 1.5%, and 33% respectively of thesepollutants from travelers changing travel plans. While this represents significantreductions for participating travelers, only 28,800 daily trips are expected to be affectedin a metropolitan area with 2.9 million registered drivers63.

64USDOT, Federal Transit Administration, APTS Benefits, November 1995.
65“NJ Transit’s Customer Information Speeded Up by New System,” Passenger Transport, January 24,1994.
66Kirkham, Rob, “Making the most of SCATS,” Traffic Technology International, Annual 1997, p 32-34.
67Giuliano, G., et al., “Los Angeles Smart Traveler Information Kiosks: A Preliminary Report,” 74th
Transportation Research Board Annual Meeting, Transportation Research Record 1516, January 1995.
68Remer, M., Atherton, T., and Gardner, W., “ITS Benefits, Evaluation and Costs: Results and Lessonsfrom the Minnesota Guidestar Travlink Operational Test, “Draft, November 1995.
47
An automated transit information system implemented by the Rochester-Genesee RegionalTransportation Authority resulted in an increase in calling volume of 80%64, while asystem installed by New Jersey Transit reduced caller wait time from an average of 85seconds to 27 seconds and reduced caller hang-up rate from 10% to 3% while increasingthe total number of callers65.
The Automated Network Travel Time System (ANTTS) collects travel time data fromvehicles traveling routes around the traffic network in Sydney, Australia. Used on theairport express bus service, travel time predictions are expressed as arrival times for bustravelers. Singapore’s land transport authority (LTA) is developing similar pilot busarrival and information systems. The predicted arrival time information is displayed at thebus stop. LTA studies indicate a high 85% accuracy in reporting travel time to within oneminute66.
Pre-trip traveler information is also popular for travelers. The Los Angeles Smart Travelerproject has deployed a small number of information kiosks in locations such as officelobbies and shopping plazas. The number of daily accesses range from 20 to 100 in a 20-hour day, with the lowest volume in offices and the greatest in busy pedestrian areas. Themost frequent request was for a freeway map with 83% of users requesting thisinformation. Over half of the accesses included requests for MTA bus and traininformation67.
The TravLink test in the Minneapolis area distributed PC and video text terminals to 315users and made available transit route and schedule information, including scheduleadherence information, as well as traffic incidents and construction information. For themonth of July 1995, users logged on to the system a total of 1660 times, an average ofslightly more than one access per participant per week. One third of the accesses to thesystem requested bus schedule adherence; another 31% examined bus schedules. Additionally, three downtown kiosks offering similar information averaged a total of 71accesses per weekday between January and July of 1995; real-time traffic data were morefrequently requested than bus schedule adherence information68.

69Wetherby, B., et al., “System Effectiveness Test,” final report, June 10, 1997.
70Pathfinder Evaluation Report, Prepared for California Department of Transportation, JHK & Associates,Pasadena, CA, February 1993.
71Inman, V., et. al., “ TravTek Evaluation: Rental and Local User Study,” FHWA-RD-96-028, FederalHighway Administration, March 1996.
48
The Genesis project in Minneapolis delivered incident information via alphanumericpagers. A majority of Genesis users (65%) reported using the service daily and 88%reported using the service once or more per week. Of users who participated in thetest, only 2% dropped out of the project during operation due to dissatisfaction withthe service. An additional indication that users found the service valuable is that usersdiscovered over half of the incidents affecting their travel via Genesis compared todiscovering 15% of incidents via radio and TV. When users became aware of incidentsvia Genesis, they chose alternate routes for travel in 42% of the situations69.
Completed in June of 1995, the Pathfinder operational test consisted of an in-vehiclenavigation system with real time traffic information. The test was implemented on theSanta Monica Freeway and neighboring arterials in the City of Los Angeles, California. The test was designed to examine the benefits of using vehicles to provide informationregarding traffic conditions and to evaluate a computer-assisted method of collectingand combining travel information from several different sources. In addition, the testevaluated drivers’ responses to the real time traffic information provided. Usersperceived that their trips were less stressful and that they were saving time, even insituations where the time savings were insignificant. Drivers were also morecomfortable in diverting with Pathfinder, as indicated by a 40% increase in diversion70.
The availability of navigational information may help to reduce travel stress, particularlyfor the unfamiliar driver. The TravTek test consisted of an in-vehicle navigation anddynamic route guidance system with real time traffic information. The test wasconducted in the Orlando Florida area between March 1992 and March 1993, in whichseveral rental car users were equipped with the system. Of rental users of TravTek,38% found the device helpful in finding specific destinations in unfamiliar territory asdid 63% of local drivers71.

72"Estimation of Benefits of Houston TranStar," Prepared by Parsons Transportation Group in cooperationwith the Texas Transportation Institute, February 7, 1997.
49
ElectronicToll
RR GradeCrossing Safety
FreewayManagement
ElectronicFare Payment
IncidentManagement
TrafficSignal
Control
TransitManagement
EmergencyResponse
Management
Multi-ModalRegional
Travel InformationCenters
2.10 BENEFITS OF INTEGRATED METROPOLITAN ITS
Due to institutional and technical problems,implementing integrated systems can be muchmore difficult then isolated ITS user services. It is most likely that integrated systems will beimplemented in stages that build upon or tietogether initial or isolated services. Thesestages may consist of the sharing of resources,the sharing of information, and thecoordination of control between ITS programareas, user services, and across other ITSgeographic or political boundaries.
Houston TranStar is responsible for the planning, design, operations, and maintenanceof transportation operations and emergency management operations in the HoustonTexas area. Along with other intelligent transportation systems programs, TranStarintegrated a freeway management system, a freeway and arterial street incidentmanagement program, a traffic signal control system, and an emergency managementprogram. A few of the components include ramp meters, closed circuit television,variable message signs, a HOV lane system, a regional computerized traffic signalsystem, emergency management operations, and a motorist assistance program. Aconservative estimate of average freeway incident time savings as a result of the systemis 5 minutes, but analysis has shown that a savings of 30 minutes is possible for majorfreeway incidents. Total annual delay savings is estimated at 572,095 vehicle-hours,resulting in about $8.4 million in savings per year. Integrating the HOV lanes withother ITS infrastructure can be used to help reduce congestion during incidentconditions. During 1996, there were 7 instances where the occupancy requirements forHOV lanes have been lifted due to an incident on the mainline. As a result of liftingrestrictions, Texas Transportation Institute estimated that 12,910 vehicles were able toavoid the incident delay and save 13.5 to 27 minutes. Annual vehicle delay savingswere estimated at $42,500 to $85,100 for the seven incidents. TranStar flow signal(i.e. ramp meter) benefits were an estimated travel time savings of 2,875 vehicle-hoursdaily, or $37,030 per day. Due to inclement weather, incidents and other events, thesesavings could be expected for about 150 days each year, for a yearly user delay savingsof over $5.5 million. The Motorist Assistance Program (in place since 1989) has abenefit-to-cost ratio as high as 23.3 to 1 with a positive impact on incident delayreduction. ATMS implemented in the Astrodome area is estimated to have resulted inreducing area street congestion time by 46%72.

73Henk, R. H. “Before-and-After Analysis of the San Antonio TransGuide System Phase I,” 76th AnnualMeeting, Transportation Research Board, Washington DC, January 1997.
74Smith, S. and Perez, C., “Evaluation of INFORM - Lessons Learned and Application to Other Systems,”Conference Paper Presented at 71st TRB, January 1992.
50
Before and after surveys of the San Antonio TransGuide system were used to capturethe effects of the system on travelers. Surveys taken before and after the installationindicated an improvement from 40% to 86% of travelers that believe methods fornotifying motorists and managing congestion are efficient. Surveys also showed animprovement from 45% to 71% of people using alternative routes during incidentconditions believed they saved time due to accurate information. There is also evidenceof improved driver confidence in the system. Before studies showed 33% of travelerswho received instructions followed them during incident conditions. After theimplementation of the system, 80% of travelers receiving instructions follow them. Also, 88% of travelers surveyed feel messages are “very easy” to understand73.
The Information for Motorists (INFORM) program is an integrated corridormanagement system on Long Island, New York. INFORM consists of an incident andfreeway management program, traffic signal controls, and some inter-jurisdictionalcoordination. It provides information via variable message signs (VMS), control usingramp meters serving parallel expressways, and some signal coordination on arterials. The program stretches back to concept studies in the early 1970’s and a majorfeasibility study performed from 1975 to 1977. The implementation progressed inphases starting with VMS’s, followed by ramp meters in 1986 and 1987 and completedimplementation by early 1990. Estimates of delay savings due to motorist information74
reach as high as 1900 vehicle-hours for a peak period incident and 300,000 vehicle-hours in incident-related delay annually.

51
Rural
Traveler Safety and
Security
Emergency Services
Tourism and TravelInformation
Public Travel andMobility Services
Infrastructure Operationand Maintenance
Fleet Operation
and Maintenance
3.0 BENEFITS OF RURAL ITS INFRASTRUCTURE
Although rural areas account for a small portion ofour nation’s population, they contain a major portionof the transportation system. Eighty percent of thetotal US road mileage is in rural areas generating40% of the vehicle miles traveled. Unlike urbanareas, the rural environment has a different set ofpriorities and needs that reflect longer distances,lower traffic volumes, drivers that are unfamiliar withthe surroundings, and longer emergency responsetimes. Many of the ITS services provided inmetropolitan areas can also be implemented in therural environment. However, these services aresometimes required to cover much broader areas, ormay become much more specialized in what theyprovide to the traveler.
The rural initiative is a relatively new program, with increasing activity and funding levels over the lastfew years. Many rural operational tests are currently underway. Some of these tests are starting toreport impacts and benefits, while most are still undergoing development, implementation, orevaluation.
Rural ITS infrastructure is classified into six major program areas. These areas include: TravelerSafety and Security, Emergency Services, Tourism and Travel Information, Public Travel and MobilityServices, Infrastructure Operation and Maintenance, and Fleet Operation and Maintenance. Figure 3-0summarizes these six major program areas for Rural ITS.
Figure 3-0: Rural ITS Program Areas

75Hogema, Jeroen H., and Richard van der Horst, “Evaluation of the A16 Motorway Fog-Signaling Systemwith Respect to Driving Behavior,” TNO Human Factors Research Institute.
52
Traveler Safety and
SecurityHazardous Conditions Info
Weather
Roadway
Surveillance
3.1 TRAVELER SAFETY AND SECURITY
One of the major goals of Rural ITS is to improvesafety and security. Many of these services arehighly related to emergency response while otherservices provide hazardous conditions or site-specific safety related information, as discussed inthis section. This type of information could assistin evacuation and disaster management plans,where timely information is critical. Also includedare services such as remote surveillance andmonitoring. These services could be implementedat park-and-ride lots, rest areas, etc. Information
from these services can be used to implement roadway control strategies, such asemergency road closings or variable speed limits. Figure 3-1 demonstrates theclassification of benefits related to traveler safety and security.
Figure 3-1: Taxonomy for Traveler Safety and Security
To promote safer driving behavior during fog conditions, an automatic fog-signalingsystem was implemented on the A16 Motorway in the Netherlands. The system uses20 sensors along the 12 km stretch to measure visibility. Based upon the visibilitydistance calculated, a speed limit is set for the roadway. With visibility grater than 140meters, no speed limit is displayed. When visibility is reduced to between 70 and 140meters, an 80 kph limit is posted. When less than 70 meters, the speed limit isdisplayed as 60 kph. The system was found to result in an additional decrease of speedof about 8 to 10 kph and a slight reduction in the standard deviation of the speed. However, in extremely low visibility conditions (< 35 m), the system is reported to havean adverse effect. Average speed under these conditions is around 60 kph, the postedlimit, while without the signs the average speed had been 29 kph75. Implementingspeed limits below 60kph under extremely low visibility may have reduced the adverseeffect.

76Meyer, Harvey, “Safer Cars Make Safer Roads,” GEICO Direct, Fall 1997, p 24-27.
53
Emergency Services Incident Notification
Mobilization and Response
3.2 EMERGENCY SERVICES
Emergency services address the response to incidents and widespread events such asnatural disasters. For rural areas, the longer response time for Emergency MedicalServices contributes to much more severe consequences than would occur with a rapidresponse. Data related to incident notification and the mobilization and response due toemergencies in rural areas are classified in the taxonomy as shown in figure 3-2.
Figure 3-2: Taxonomy for Emergency Services
Field tests conducted on the Ford Lincoln Continental RESCU (Remote EmergencySatellite Cellular Unit) security system showed that it took under one minute for adriver to make voice contact with a response center operator. On average, it tookunder 11 minutes from the punch of a button until emergency vehicles arrived76.
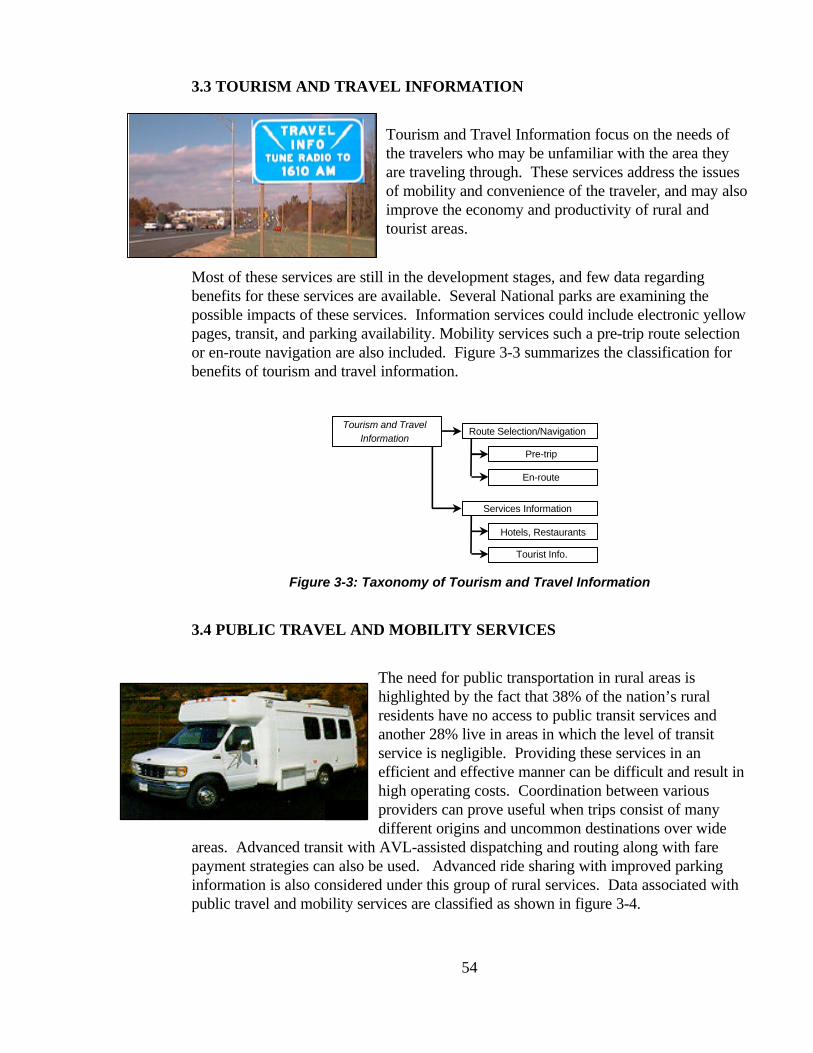
54
Tourism and TravelInformation
Route Selection/Navigation
Pre-trip
En-route
Services Information
Hotels, Restaurants
Tourist Info.
3.3 TOURISM AND TRAVEL INFORMATION
Tourism and Travel Information focus on the needs ofthe travelers who may be unfamiliar with the area theyare traveling through. These services address the issuesof mobility and convenience of the traveler, and may alsoimprove the economy and productivity of rural andtourist areas.
Most of these services are still in the development stages, and few data regardingbenefits for these services are available. Several National parks are examining thepossible impacts of these services. Information services could include electronic yellowpages, transit, and parking availability. Mobility services such a pre-trip route selectionor en-route navigation are also included. Figure 3-3 summarizes the classification forbenefits of tourism and travel information.
Figure 3-3: Taxonomy of Tourism and Travel Information
3.4 PUBLIC TRAVEL AND MOBILITY SERVICES
The need for public transportation in rural areas ishighlighted by the fact that 38% of the nation’s ruralresidents have no access to public transit services andanother 28% live in areas in which the level of transitservice is negligible. Providing these services in anefficient and effective manner can be difficult and result inhigh operating costs. Coordination between variousproviders can prove useful when trips consist of manydifferent origins and uncommon destinations over wide
areas. Advanced transit with AVL-assisted dispatching and routing along with farepayment strategies can also be used. Advanced ride sharing with improved parkinginformation is also considered under this group of rural services. Data associated withpublic travel and mobility services are classified as shown in figure 3-4.

77Farwell, R., “Evaluation of OmniLink Demand Driven Transit Operations: Flex-Route Services,” SGAssociates, Annandale, Virginia, presented at the European Transport Forum, 1996.
78Ride Solutions, “Operational Strategies for Rural Transportation,” Florida Coordinated TransportationSystem, undated
79Casey, R., “The Benefits of ITS Technologies for Rural Transit,” The Volpe Center, presented at theRural ITS Conference, September 1996.
55
Public Travel andMobility Services
Transit Accessibility
Dispatch and Routing
Ride Sharing and Matching
Fare Payment Systems
Figure 3-4: Taxonomy of Public Travel and Mobility Services
The Potomac and Rappahannock Transportation Commission operates demand-responsive transit to serve transit needs and commuter rail stations in the suburbanfringe of the Washington, DC, metropolitan area. The service also meets requirementsof the Americans with Disabilities Act. Compared to a fixed route service andcomplementary paratransit service, the demand-responsive system is estimated toproduce a 40% reduction in total cost77. Use of coordinated paratransit with a dispatchsystem including AVL, which can coordinate trips among up to five agencies, has thepotential to reduce fraud in Medicaid transportation by $11 million annually in the Stateof Florida78.
Public transportation providers in rural areas can produce cost efficiencies by increasingridership. The computer-assisted dispatching system in Sweetwater County, Wyoming,which allows same-day ride requests to be accepted, has contributed to an increase inridership from 5,000 passengers monthly to 9,000 monthly without increasing thedispatch staff and a reduction of operational expense of 50% over a 5-year period on aper passenger-mile basis79.

80Pilli-Sihvola, Yrjo, Kimmo Toivonen, and Jouko Kanton, “Road Weather Service System in Finland andSavings in Driving Costs,” Finnish National Road Administration.
56
Infrastructure Operationand Maintenance
Traffic Management
Failure Notification
Work Zone Safety
Infrastructure Maintenance
Weather Detection
Event Based/Seasonal
Urban Extensions
3.5 INFRASTRUCTURE OPERATION AND MAINTENANCE
Operating and maintaining rural transportationsystems can be costly. Managing traffic andmonitoring roadway conditions in rural areas is oftendifficult due to distance, isolation, and the numberroad miles. The safety of work zones andconstruction areas is often cited as requiringimprovement. Many state DOTs are implementingITS to optimize winter weather maintenance. Figure3-5 summarizes how benefits data are classified intoinfrastructure operation and maintenance.
Figure 3-5: Taxonomy for Infrastructure Operation and Maintenance
The Finnish National Road Administration has developed a road weather service systemto improve the monitoring of road weather conditions so that winter maintenance canbe carried out systematically and at the right time. The system is an automatedinformation system that sends both actual and predicted weather and road surfaceconditions to road maintenance personnel. The network of transmitters is made of up11 central stations, about 200 workstations, and approximately 150 observationstations. For de-icing activities, it is estimated that the system saves about 23 minutesper activity. Converting estimated benefits to monetary amounts results in an annual$900,000 savings due to accident reductions, $60,000 for time costs, and $20,000 forvehicle operations. The cost-to-benefits ratio of the program is estimated at 1 to 580.

81Deeter, D., and Bland, C.E. “Technology in Rural Transportation ‘Simple Solutions’,” Federal HighwayAdministration, Publication No. FHWA-RD-97-108, October 1997.
57
Fleet Operation
and MaintenanceFleet Efficiency
Equipment Monitoring
Coordinated Dispatching
Coordinated Maintenance
The Indiana state DOT has implemented the Computer Aided System for PlanningEfficient Routes (CASPER) for districts in the state. The software is used to assistwith the design of routes needed to service the roadway network. Developers claimthat the equipment and operating cost for winter maintenance has been reduced frombetween $11 and $14 million. Additionally, they have reported an increased servicelevel and an 8 to 10 percent reduction in the number of routes needed to service thenetwork81.
3.6 FLEET OPERATION AND MAINTENANCE
Similar to Transit Operations discussed in section 2.3, the operation and maintenance ofstate owned vehicles can be improved. Vehicle self-diagnostics can alert mechanics ofpotential problems. Fleet operators can also use automated vehicle location devices toimprove the scheduling of maintenance activities. Although a few of these serviceshave been deployed, benefits data are not yet available from these implementations. The taxonomy for classifying benefits data into fleet operation and maintenance issummarized in figure 3-6.
Figure 3-6: Taxonomy for Fleet Operation and Maintenance

58
ITS / CVO
Safety Assurance
CredentialsAdministration
Electronic Screening
Carrier Operations
4.0 BENEFITS OF ITS FOR COMMERCIAL VEHICLEOPERATIONS
Commercial vehicle regulators will alsoexperience financial benefits due toimplementation of ITS. Improvements inadministrative efficiency, avoidance ofinfrastructure investment, and improvements inhighway data collection will improve safetyand reduce operating costs. Also, ITS mayresult in benefits through operational andadministrative improvements. Currently, ITSfor Commercial Vehicle Operations(ITS/CVO) has three areas of state motorcarrier regulation: safety assurance, credentialsadministration, and electronic clearance. Also
included in ITS/CVO are those services that help to improve carrier operations. Currently, many individual companies are equipping their own fleets with customsystems that provide them with a competitive advantage, but may or may not fit witheventual standards.
ITS/CVO is made up of four major program areas. These areas include: SafetyAssurance, Credentials Administration, Electronic Screening, And Carrier Operations. Figure 4-0 summarizes the four ITS/CVO major program areas.
Figure 4-0: ITS/CVO Program areas
An extensive benefit/cost analysis of the effects of CVO user services on regulatorycompliance cost of motor carriers predicted a range of benefits. The study segmentedthe motor carrier industry into small firms (1–10 power units), medium-sized firms(11–99 power units), and large firms (100 or more power units) and analyzed each userservice from the perspective of each market segment. The benefit/cost ratio forcommercial vehicle administrative processes range from 19.8:1 to 1.0:1. For electronic

82“Assessment of Intelligent Transportation Systems/Commercial Vehicle Operations Users Services:ITS/CVO Qualitative Benefit/Cost Analysis - Executive Summary,” American Trucking Associations Foundation,Inc., Alexandria, VA, 1996.
59
Safety Information ExchangeSafety Assurance
Automated Inspections
Cargo Monitoring
Onboard Monitoring
Trip Monitoring
screening, the benefit/cost ratio ranges from 6.5:1 to 1.9:1. The benefit/cost ratio forautomated roadside safety inspection ranged from 1.3:1 to 1.4:1. The benefit/cost ratiofor on-board safety monitoring ranged from 0.49:1 to 0.02:1. For hazardous materialsincident response, the benefit/cost ratio ranged from 2.5:1 to 0.3:182.
4.1 SAFETY ASSURANCE
Improved safety information exchange programs will assist in improving the safeoperation of commercial vehicles. By providing inspectors with better access to safetyinformation, the number of unsafe commercial drivers and vehicles removed from thehighway can be increased. Onboard monitoring of cargo can alert drivers and carriersof potential unsafe load conditions. Many of these services are beginning to beimplemented in the CVO community. It is expected that as these services mature,benefits data will become available. Data associated with the benefits of safetyassurance is classified as shown in figure 4-1.
Figure 4-1: Taxonomy for Safety Assurance

83“Software System Eases Truck Permitting” in Civil Engineering, July 1998, p 30.
60
CredentialsAdministration Electronic Credentialing
Interagency Data Exchange
Interstate Data Exchange
4.2 CREDENTIALS ADMINISTRATION
Services that support in-house administrative functions can provide savings to state andadministrative agencies. Electronic credentialing can improve the time required forstates to approve operating permits. Data warehouses can facilitate the exchange ofcredentials data between agencies and states. The classification of these types of data issummarized in figure 4-2.
Figure 4-2: Taxonomy for Credentials Administration
Several State DOTs are now implementing automated oversize and overweightpermitting and routing systems. The systems allow permit officials to spend less timeon paperwork and more time examining routes in more detail. By filling outapplications using Internet connections to state DOTs rather than filling them out inperson, states have found that the turnaround time for permits has been reduced. Minnesota reports that it has been able to reduce its workforce from more than 20people across 16 districts and 5 people in a central office to nine personnel managingthe entire state83.
4.3 ELECTRONIC SCREENING
Congestion at weigh and inspectionsstations can be reduced by allowing safeand legal carriers to bypass withoutstopping. Roadside electronic screeningallows authorities to concentrate ongreater percentages of potential unsafevehicles. Benefits data related toelectronic screening is classified as shownin figure 4-3.

84‘The Crescent Project: An Evaluation of an Element of the HELP Program,” The Crescent EvaluationTeam, Executive Summary and Appendix A, February 1994.
85Study of Commercial Vehicle Operations and Institutional Barriers, Appendix F, Booz, Allen &Hamilton, McLean, VA, November 1994.
86Glassco, R., et al, “Studies of Potential Intelligent Transportation Systems Benefits Using TrafficSimulation Modeling: Volume 2,” Mitretek Systems, MTR 1997-31, June 1997.
61
Weight Screening
Credential Checking
Border Clearance
Electronic Screening Safety Screening
Figure 4-3: Taxonomy for Electronic Screening
The HELP/Crescent Project on the West Coast evaluated the applicability of fourtechnologies for screening transponder-equipped vehicles. The technologies includedautomatic vehicle identification, weigh-in-motion, automatic vehicle classification, andintegrated communications systems and databases. The benefits data are developed asa projection of experience from the project and from other databases rather than directmeasurement by the project. Impact of hazardous material incidents could be reducedby $1.7 million annually per state. Estimates of reductions in tax evasion range from$0.5 to $1.8 million annually per state. Overweight loads could be reduced by 5%leading to a savings of $5.6 million annually. Operating costs of a weigh station couldbe reduced up to $169,000, with credentials checking adding $4.3–$8.6 million andautomated safety inspections adding $156,000–$781,000 in savings due to avoidedaccidents annually per state. A full implementation of services examined in theCrescent project would yield a benefit/cost ratio of 4.8 for a typical state governmentover a 20-year period. Less complete implementations range in benefit/cost ratio fromno benefit up to 12:1 for the government84.
The COVE Study estimates a benefit/cost ratio to the government of 7.2 for electronicclearance, 7.9 for one-stop/no-stop shopping, and 5.4 for automated roadsideinspections85.
A simulation study demonstrated ITS capabilities that could be used to improve theeffectiveness of a hypothetical advanced truck weigh station86. The study examined thedelay effects of increased transponder usage of trucks as arrival rates to the stationvaried. Trucks equipped with transponders were permitted to bypass the stationthereby reducing delay by 100% compared with non-equipped trucks. As transponderusage increased, queue lengths behind the scales decreased, thus also decreasing the
87Bunting, Alan, “Tracking Trucks,” in ITS: intelligent transport systems, Man/June 1997.
88Regan, A., et al., “Improving Efficiency of Commercial Vehicle Operations Using Real-TimeInformation: Potential Uses and Assignment Strategies,” 74th Transportation Research Board Annual Meeting,
62
Fleet & Freight Management
Scheduling
Vehicle Tracking
Carrier Operations
Traveler Information
Hazmat Incident Response
Administrative Processes
Data Clearinghouses
OS/OW Permitting
delay experienced for non-equipped trucks. Savings for non-equipped trucks varied asa function of average inter-arrival time, time required at the scale, and percent of trucksequipped with transponders. For an average inter-arrival time of 20 seconds and aweigh time of 25 seconds, non-equipped vehicles saved approximately 30 seconds for a20% transponder equipage and an average 8 minutes saved at the station for a 60%transponder equipage.
4.4 CARRIER OPERATIONS
ITS/CVO can improve carrier operations by improving the scheduling of vehicles andreducing the number of empty loads. Administrative compliance costs can be reducedfor carriers by participating with automated state credentialing processes. Classificationof data related to carrier operations is shown in figure 4-4.
Figure 4-4: Taxonomy for Carrier Operations
To aid in optimization of routing vehicles, Bilspedition Transport & Logistics ofScandinavia is using GPS-based tracking of vehicles in combination with remotely-accessed on-board computers in southern and central Sweden. The company has beenusing the technology since 1994. Not only has the system reduced wasted mileage andemissions, it has brought a 15% increase in freight carried87.
Motor carriers are currently involved with development of additional fleet equipmentrelated to electronic tags, enhanced communications, and emerging CVO standards. Astudy of real-time diversion of truckload carriers predicted an additional productivityimprovement of 6%88.

Transportation Research Record 1493, January 1995.
89Maze, TH., et al,. “Automated Mileage and State line Crossing Operation Test Part 1 - EvaluationSummary,” May 1, 1996.
90Center for Transportation Research and Education, “Automated Mileage and State line CrossingOperational Test Evaluation Summary,” Final Report, Federal Highway Administration, May 1996.
91Hallowell, S., and Morlok, E., “Estimating Cost Savings From Advanced Vehicle Monitoring andTelecommunication Systems in Intercity Irregular Route Trucking.,” department of Systems, University ofPennsylvania, Philadelphia, PA, January 1992.
63
Anecdotal evidence that fleet management provides benefits is continuing toaccumulate. The Automated Mileage and State line Crossing Operational Test(AMASCOT) has generated significant interest from carriers, manufacturers, andregulators. Although the AMASCOT evaluation did not estimate cost savings duringthe operational phase, carriers involved in the test estimated a potential to reduce costsby 33% to 50% for International Fuel Tax Agreement (IFTA) and InternationalRegistration Plan (IRP) reporting89. State processing and audit staffs were receptive topotential changes in processing requirements. These staffs were also optimistic aboutthe ability of such a system to improve accuracy, productivity, and compliance for bothcarriers and states90.
Other benefits from carrier operations include the following91:
• Telesat Canada estimates use of its system will increase loaded mileage9% to 16% and reduce operating cost $.12 to $.20 per truck mile.
• Schneider of Green Bay, Wisconsin, reports that the elimination of drivercheck-in telephone calls saves approximately two hours per day resultingin a driver salary increase of $50 per week.
• Trans-Western Ltd. of Lerner, Colorado notes that drivers are able todrive 50 to 100 additional miles per day, and driver turn-over hasdecreased from 100% to 30%.
• Frederick Transport of Dundas, Ontario, Canada, estimates a reductionof $30 (from $150 per month) in telephone charges, a 0.7% greater loadfactor and a 9% increase in total miles.
• Best Line of Minneapolis, Minnesota, estimates a $10,000 per monthsavings since 300 drivers previously lost about 15 minutes each daywaiting to talk with dispatchers.
• Mets of Indianapolis, Indiana, performed tests that showed vehicleutilization increased by 13%.
• United Van Lines of Fenton, Missouri, claims that the ability to track andrecover stolen vehicles is expected to reduce theft insurance premiums.

92ATA Foundation, Inc., “A Survey of the Use of Six Computing and Communications Technologies inUrban Trucking Operations,” Alexandria, VA, 1992.
64
Additional results are provided in an ATA Foundation 1992 survey92 of 69 truckingcompanies operating in an urban area. More than half of the 69 companies surveyed useCAD systems. Productivity gains resulted from an increase in the number of pickupsand deliveries per truck per day, ranging from 5% to more than 25%, with most gainsbeing clustered in the 10 - 20% range. The use of two-way text communication systemsyielded driver time savings of 30 minutes per day because of the reduced time spentlocating and using telephones.

65
DriverAssistance
Vision Enhancement
Route Guidance
Navigation
Positioning/Location
5.0 BENEFITS OF INTELLIGENT VEHICLES
ITS services focusing on the vehicle include those functions that assist the driving taskor recommend control actions. Although many in-vehicle services are directly effectedby non-vehicle infrastructure systems, for purposes of classification this sectionconsiders those systems which directly influence the driving task as part of the IntelligentVehicle Program Area.
Most Intelligent Vehicle services are applicable across all platforms of vehicles. However, a few services have been developed for specific types of vehicles. Forexample, unlike other types of vehicles, commercial vehicles may have cargo monitoringsystems to alert drivers of possible load shifting or hazardous materials leakage. Because there has been little reported benefit data for individual platforms, this reportclassifies all data related to Intelligent Vehicles into driver assistance and collisionavoidance and warning systems.
5.1 DRIVER ASSISTANCE
ITS services that assist in the driving task arebeginning to make their way to the market place. In-vehicle vision enhancement may improvesafety for driving conditions involving reducedsite distance due to night driving, inadequatelighting, fog, snow, or other inclement weatherconditions. Navigational systems are alsoincluded here as they provide assistance to thedriver in unfamiliar surroundings. Figure 5-1summarizes how benefits data are classifiedunder driver assistance.
Figure 5-1: Taxonomy for Driver Assistance
The INTEGRATION simulation model was used to estimate the safety impact of theTravTek project. The simulation consisted of a representation of the Orlando roadwaynetwork, and performance parameters obtained during the field studies. Analyses wereperformed to estimate crash risk of motorists using navigation devices compared to

93Inman, V., et al, “TravTek Evaluation: Orlando Test Network Study,” Federal Highway Administration,FHWA-RD-95-162, January 1996.
94Inman, V., et. al.., “TravTek Evaluation: Rental and Local User Study,” FHWA-RD-96-028, FederalHighway Administration, March 1996.
95Inman, V. et al., “TravTek Evaluation Orlando Test Network Study,” FHWA-RD-95-162, FederalHighway Administration, January 1996.
96Inman, V., et al, “TravTek Evaluation Yoked Driver Study”, FHWA-RD-94-139, Federal HighwayAdministration, October 1995.
97Van Aerde, M., and Rakha, H., “TravTek Evaluation: Modeling Study,” FHWA-RD-95-090, FederalHighway Administration, March 1996.
66
motorists without them. In addition, the safety impacts on the entire traffic network(both equipped and unequipped vehicles) were analyzed. Results indicated an overallreduction in crash risk of up to 4% for motorists using navigation devices, due toimproved wrong turn performance and the tendency of the navigation system to routetravelers to higher class (normally safer) facilities. Increased safety risks of up to 10%were estimated for the equipped vehicles, while the overall network showed the safetyimpact to range from neutral to a slight improvement when diversion occurred. Thenetwork safety improvements were experienced when diversion from congestedroadway reduced the level of congestion for the remaining equipped and non-equippedvehicles and helped to smooth traffic flows on those roads93.
TravTek users perceived that their driving was safer. Based on survey data, users feltless nervous and confused and more confident, attentive, and safe, with local users beingsignificantly more positive than renters. Users also felt that the use of TravTek did notinterfere with their driving task. While users were no more likely to be involved in closecalls than were nonusers, users who were interacting with TravTek immediately before a“near accident” were more likely to feel that they had contributed to close calls94. In-vehicle navigation devices can benefit users in terms of travel time and route finding. Field operational test experience is producing data that suggest system benefits whenwider deployment appears. The TravTek test in Orlando found that for unfamiliardrivers, wrong turn probability decreased by about 33% and travel time decreased by20% relative to using paper maps, while travel planning time decreased by 80%95. TheTravTek yoked driver study demonstrated a travel time benefit from the use of thesystem for route planning and route guidance. A time savings of 80% was observed fortrip planning96. Simulations using data collected during the TravTek test predicted anincrease in throughput. Using constant average trip duration as a surrogate formaintaining level of service, a market penetration of 30% for dynamic route guidanceresults in the ability to handle 10% additional demand97.
The ADVANCE project in the Northwest suburbs of Chicago tested the time effects ofdynamic route guidance using a yoked vehicle study on an arterial network with limited

98Schofer, J. et al., “Formal Evaluation of the Targeted Deployment,” Vol. II, Appendix J, NorthwesternUniversity Transportation Center, July 1996.
99Pathfinder Evaluation Report, Prepared for California Department of Transportation, JHK & Associates,Pasadena, CA, February 1993.
100Stevens, W. et al., “Summary and Assessment of Findings From the Precursor Analysis of AutomatedHighway System,” The MITRE Corporation, WN95W0000124, October 1995.
101“VICS reduces travel time by 15%,” ERTICO News, January 1998, p10.
67
probe data. The aggregate data set demonstrated that motorists could reduce traveltime by 4% under normal or recurring conditions; however, a small sample size andrelatively high standard deviation formulated the basis for this result98. It did appear thatthe dynamic route guidance concept, as implemented in ADVANCE, can detect somelarger delays and help drivers to avoid them.
The Pathfinder project implemented an in-vehicle navigation and motorist informationsystem including access to real-time traffic information. The project was implemented inthe Los Angeles area. The evaluation99 stated that the Pathfinder navigation systemdelivered meaningful user benefits including fewer travelers failing to follow theirdesired route. Since in-vehicle systems operate in a complex environment, specificresults vary with the conditions and options selected.
In preliminary analyses performed for the Automated Highway System Program,throughput increases of 300% for platooned operation and 200% for non-platoonedautomated control compared to non-automated freeway segments have been predicted. Analysis based on the Long Island Expressway and the Capital Beltway nearWashington DC, predicted that capacity improvements could reduce travel time by 38%to 48%100.
Beginning operations in the spring of 1994, VICS is considered to be the forefront ofITS in Japan. The system is now covering 4 city areas: Tokyo, Aichi, Osaka and Kyoto,and provides drivers with road condition information and alternative route choices toavoid congestion. Drivers using the system report that they felt less stressed due to theprovided advice. They also indicated that they would like the area of service expanded. Road tests of the system have indicated that the dynamic route guidance provided savesabout 15% of travel time101.

102“Precursor Systems Analyses of Automated Highway Systems: Volume Four - Lateral and LongitudinalControl Final Report,” prepared by University of Southern California Center for Advanced TransportationTechnologies under subcontract to Raytheon Company for Federal Highway Administration, February 1995.
68
Intelligent Cruise ControlCollision Avoidanceand Warning
Rear End
Road Departure
Intersection
Longitudinal Control
Low Traction
Collision Notification
On-board Monitoring
5.2 COLLISION AVOIDANCE / WARNING
Collision avoidance andwarning systems are expectedto result in safety and effectivecapacity benefits by reducingthe number of incidents. Collision avoidance includesseveral user services such asIntelligent Cruise Control,Rear-end crash avoidance, and
Road Departure avoidance. Each of these user services may take on three differentlevels of control. The lowest level warns or suggests to the driver what action to take. The middle level responds to safety-compromising positions by taking limited control ofthe vehicle. For example, intelligent cruise control could slow a vehicle down ifapproaching a lead vehicle too quickly. The highest level of control would be when thesystem overrides the driver and takes complete control of the vehicle. User servicesassociated with collision avoidance and warning systems are classified as shown in figure5-2.
Figure 5-2: Taxonomy for Collision Avoidance / Warning
Less complete implementations, termed evolutionary representative systemconfigurations, with rear-end collision warning or collision avoidance, can show lessdramatic capacity increases. Analyses performed on hypothetical data indicateseffective capacity increases of 30% with collision warning in uniform vehicles to 60%with collision avoidance in vehicles differing in braking capacity102.

103Kanianthra, Dr. Joseph, and Mertig, A., “Opportunities for Collision Countermeasures UsingIntelligent Technologies,” National Highway Traffic Safety Administration, 1997.
69
A recent NHSTA study estimated the possible effectiveness of several collision avoidance technologies. The effectiveness for rear-end collisions with the lead vehicledecelerating is estimated to be 42%. For prevention of collisions with lead vehiclestopped, the estimate is 75%. The overall effectiveness of rear-end collision is predictedto be 51%. Lane Change or Lane Merge warning systems are estimated to decrease alllane change collisions by 37% or about 90,000 crashes annually. Road-departurecountermeasures are estimated to have an effectiveness of 24% resulting in about287,000 crashes avoided annually. The study also indicates that the economic benefitsof the three systems together would be approximately $25.6 billion (based on the 1994value of the dollar)103.

70
6.0 SUMMARY
The evaluation of implemented systems and emerging concepts of ITS has been an ongoing process. Significant knowledge is available for many ITS services, but gaps in knowledge also exist. This paperhas summarized much of the quantifiable data on ITS impacts collected by the JPO. In general, all ITSservices have shown some positive benefit. Negative benefits are usually outweighed by other positiveimpacts. For example, higher speeds and improved traffic flow result in increases in Nitrous Oxides,however other emission measures, fuel consumption, travel time, and delay, are reduced.
Due to the wide range of different technologies used to implement these services and the difference invariables between implementations, in many cases it is difficult to predict the potential impacts ofindividual ITS services planned for a particular area. Also, ITS services are beginning to beincorporated into the planning process and are included with the addition of traditional capacity orservice. When this occurs, it is very difficult to measure the separate impacts of the additional capacityand the individual ITS services. However, through simulation and comparison with similar servicesthat have been implemented elsewhere, planners and decision makers may be able to estimate thecontribution of the ITS services. Furthermore, where measured or predicted data are not available,perceived or anecdotal benefits may be available. This type of data can be determined throughinterviews or from case studies.
Although further evaluation of ITS services is an ongoing program, the remainder of this sectionsummarizes the availability and depth of known data and points to where gaps in knowledge exist. Table 6-1 presents the number of measured and predicted impacts of ITS services discussed in thisreport. The table is organized along the taxonomy presented in this report and reflects the variousmeasures that have been reported in each area. These data may be unrelated and referenced reportsmay contain more than one data point for a particular service. Also, the authors acknowledge thatother data may exist which could have been included but has yet to be uncovered in their literaturesearch.
Table 6-2 presents the data in a slightly different format. The table organizes the data by the measuresof effectiveness and reflects a scale of the available data. Circles within cells that are blank have noreported data for that particular service area and measure of effectiveness. The various levels ofshaded circles then indicate a progressing number of available data points for any given service areaand measure of effectiveness. In this table, the number of data points represent the sum of all availablemeasured and predicted data points from table 6-1. The reader who is interested in finding availablebenefits information on a particular measure of effectiveness can use this table as a cross reference intothe report.
It can be seen that most of the data collected to date is concentrated within the metropolitan areas,while rural has very few data points available. This is probably due to the fact that the metropolitanprogram has been in existence longer and is much more developed then rural or CVO. The heaviestconcentrations of data in the metropolitan area are in traffic signal systems, freeway management and

71
incident management. Most of the available data on traffic signal control systems is from adaptivetraffic control. For freeway management, most data is concentrated around benefits related to rampmetering. Although there are several operational test currently underway for the program area ofhighway/rail intersections, it is the newest area of metropolitan infrastructure and no data has beenreported as of this date.
Currently, little benefits data has been collected regarding rural ITS. Several state and national parksare now examining the possibilities of providing better tourism and travel information, and severalrural areas are implementing public transit services. Also many, states are now examining the benefitsof incorporating ITS into the operation and maintenance of facilities and equipment. Over the nextseveral years and as this program matures more data will become available.
ITS/CVO continues to provide benefits to both carriers and state agencies. Although it appears thatlittle data has been collected for ITS/CVO, the data that has been reported is from measures that areoften directly measurable. Therefore, it might be expected that this data is accurate and few datapoints would be necessary to convince carriers, states and local authorities of the possible benefits ofimplementing these user services. Also, it may be that few data points are needed to convince localjurisdictions that data sharing, and other integration measures between other jurisdictions couldprovide for significant cost savings and improved service. To date, the largest percentage of benefitdata related to ITS/CVO is from carrier operations and fleet management systems.
ITS programs areas and user services associated with driver assistance and specific vehicle classes arestill being developed and planned. Although a few of these services are available in the marketplace,much of the data currently associated with these services is predicted or projected based on howsystems are expected to perform. As market penetrations increase and improved systems aredeveloped, there will be ample opportunity to measure and report more accurate data.
Analysis of table 6-2 indicates that ITS benefits data is available across all measures of effectivenesscategories. The heaviest concentration of data available for particular measures is for time/delay andcost savings. Much less data is available on emissions and customer satisfaction at this point in time.
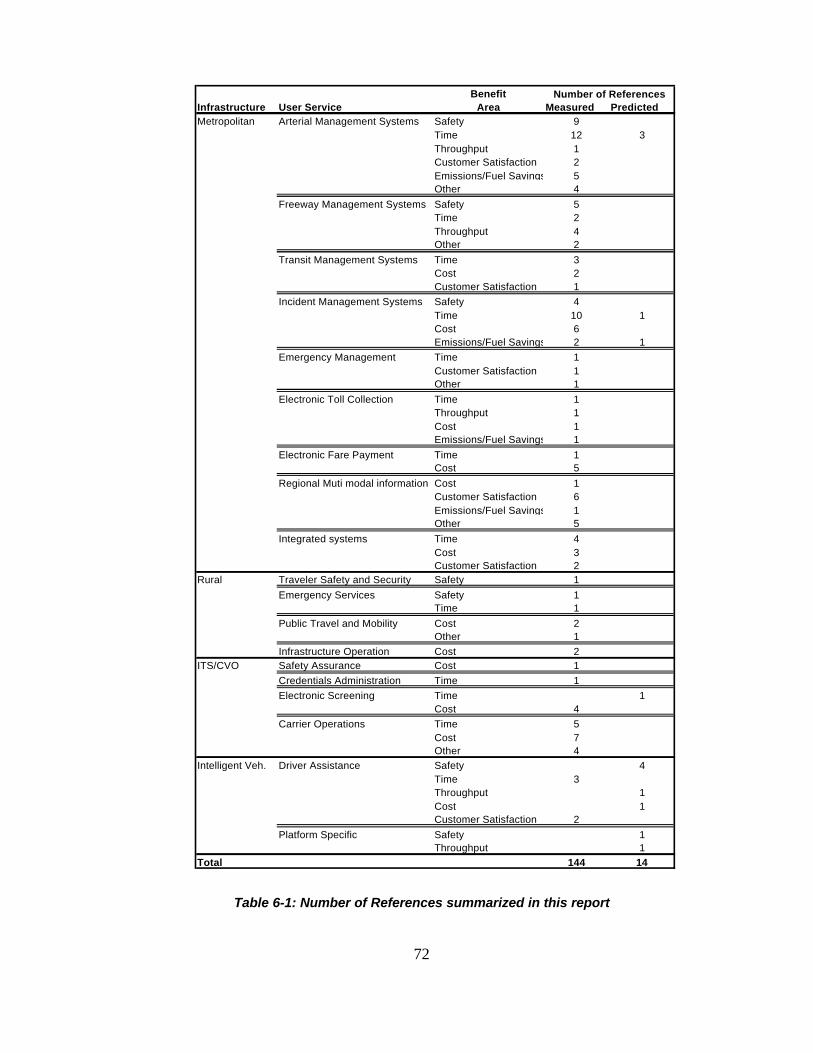
72
BenefitInfrastructure User Service Area Measured PredictedMetropolitan Arterial Management Systems Safety 9
Time 12 3Throughput 1Customer Satisfaction 2Emissions/Fuel Savings 5Other 4
Freeway Management Systems Safety 5Time 2Throughput 4Other 2
Transit Management Systems Time 3Cost 2Customer Satisfaction 1
Incident Management Systems Safety 4Time 10 1Cost 6Emissions/Fuel Savings 2 1
Emergency Management Time 1Customer Satisfaction 1Other 1
Electronic Toll Collection Time 1Throughput 1Cost 1Emissions/Fuel Savings 1
Electronic Fare Payment Time 1Cost 5
Regional Muti modal information Cost 1Customer Satisfaction 6Emissions/Fuel Savings 1Other 5
Integrated systems Time 4Cost 3Customer Satisfaction 2
Rural Traveler Safety and Security Safety 1
Emergency Services Safety 1Time 1
Public Travel and Mobility Cost 2Other 1
Infrastructure Operation Cost 2ITS/CVO Safety Assurance Cost 1
Credentials Administration Time 1
Electronic Screening Time 1Cost 4
Carrier Operations Time 5Cost 7Other 4
Intelligent Veh. Driver Assistance Safety 4Time 3Throughput 1Cost 1Customer Satisfaction 2
Platform Specific Safety 1Throughput 1
Total 144 14
Number of References
Table 6-1: Number of References summarized in this report

73
0 :
1 to 3 :
4 to 6 :
7 to 10 :
> 10 :
Key:
Number of References
Saf
ety
Tim
e &
Del
ay
Effe
ctiv
e C
apac
ity
Cos
t
Cus
tom
er S
atis
fact
ion
Em
issi
ons/
Fue
l Sav
ings
Oth
er
Arterial Management Systems
Freeway Management
Transit Management
Incident Management
Emergency Management
Electronic Toll Collection
Electronic Fare Payment
Highway/Rail Intersection
Regional Mutimodal Travel Information
Integrated Systems
Traveler Safety and Security
Emergency Services
Tourism and Travel Information
Public Travel and Mobility Services
Infrastructure Operation and Maintenance
Fleet Operation and Maintenance
Safety Assurance
Credentials Administration
Electronic Screening
Carrier Operations
Driver Assistance
Platform Specific
ITS
/CV
OI.V
.M
etro
po
litan
Ru
ral
Table 6-2: Summary of Available Data by Benefit Measure

74
APPENDIX 1: REFERENCE LIST
"Assessment of Intelligent Transportation Systems/Commercial Vehicle Operations Users Services:ITS/CVO Qualitative Benefit/Cost Analysis - Executive Summary," American Trucking AssociationsFoundation, Inc., Alexandria VA, 1996.
"Battle Lines Drawn in California Legislature Over Red Light Running Cameras," The UrbanTransportation Monitor, May 22, 1998.
"Estimation of Benefits of Houston TranStar," Prepared by Parsons Transportation Group incooperation with the Texas Transportation Institute, February 7, 1997.
"Fast-Trac's Signal System Clear Winner for County Commuters," in ITS America News, May 1997.
"Incident Management: Detection, Verification, and Traffic Management," Field Operational TestCross-Cutting Study, Boos Allen & Hamilton, September 1998.
"Innovations in Transportation and Air Quality: Twelve Exemplary Projects," US department ofTransportation, Publication number FHWA-PD-96-016, 1996.
"Intelligent Transport Systems Handbook in Japan," Highway Industry Development Organization,Ministry of Construction, October 1997.
"ITS developed by Japanese Police," Japan Traffic Management Technology Association, Institute ofUrban Traffic Research, Undated.
"NJ Transit's Customer Information Speeded Up by New System," Passenger Transport, January 24,1994.
"Partners in Motion, 494 Transportation Corridor: ICTM Project, Interim Report #1," Prepared forICTM Evaluation Committee by HNTB Corporation, undated.
"Precursor Systems Analyses of Automated Highway Systems: Volume Four - Lateral andLongitudinal Control Final Report," prepared by University of Southern California Center forAdvanced Transportation Technologies under subcontract to Raytheon Company for Federal HighwayAdministration, February 1995.
"Ramp up the Volume," in ITS International, Nov/Dec 1997.

75
"SCOOT in Toronto," Siemens Automotive, USA, in Traffic Technology International, Spring 1995.
"Software System Eases Truck Permitting" in Civil Engineering, July 1998, p 30.
"Speed Modulation Experimentation," SANEF, eastern and Norther Highways ConcessionaryCompany - France, October, 1998.
"Survey Finds London Transit Info changes Behavior, Creates Revenue," Inside ITS, March 9, 1998,p8.
"Traffic Control Systems Give Transit a Break," Newsline, TRB, December 1995.
"Transportation: Driving a Thriving Economy," American Association of State Highway andTransportation Officials and the National Governors's Association, May 1997.
"VICS reduces travel time by 15%," ERTICO News, January 1998, p10.
'The Crescent Project: An Evaluation of an Element of the HELP Program," the Crescent EvaluationTeam, Executive Summary and Appendix A, February 1994.
Advanced Rural Transportation Systems (ARTS): Strategic Plan, United States Department ofTransportation, August 1997.
ATA Foundation, Inc., "A Survey of the Use of Six Computing and Communications Technologies inUrban Trucking Operations," Alexandria, VA, 1992.
Barbaresso, James C., "Preliminary Findings and Lessons Learned From The Fast-Trac IVHSProgram," Road Commission for Oakland County, Beverly Hills, MI, 1994.
Beteille, J. and Briet, G., "Making Wave in Traffic Control," Traffic Technology International, Annual1997.
Booz Allen & Hamilton,"1996 Olympic and Paraolympic Event Study," Final Report, May 1997.
Borrough, Peter, "Variable Speed Limits Reduce Accidents Significantly in the U.K.," The UrbanTransportation Monitor, March 14, 1997.

76
Bunting, Alan, "Tracking Trucks," in ITS: intelligent transport systems, Man/June 1997.
Casey, R., "The Benefits of ITS Technologies for Rural Transit," The Volpe Center, presented at theRural ITS Conference, September 1996.
Casey, R. et. al., "Advanced Public Transportation Systems: The State of the Art - Update '96,"USDOT Federal Transit Administration, January 1996.
Center for Transportation Research and Education, "Automated Mileage and State line CrossingOperational Test Evaluation Summary," Final Report, Federal Highway Administration, May 1996.
City of Los Angeles Department of Transportation, "Automated Traffic Surveillance and Control(ATSAC) Evaluation Study," June 1994.
Clean Air Action Corp., "Proposed General Protocol for Determination of Emission Reduction CreditsCreated by Implementing an Electronic Pike Pass System on a Tollway," Study for the NortheastStates for Coordinated Air Use
management, December, 1993.
Coleman, Janet A. et al "FHWA Study tour for Speed Management and Enforcement Technology,"Federal Highway Administration, Publication No. FHWA-PL-96-006, February 1996.
COMSIS Corporation, "CHART Incident Response Evaluation Final Report," Silver Spring, MD,May 1996.
Cuciti P., and B Janson., "Incident Management via Courtesy Patrol: Evaluation of a Pilot Program inColorado," 74th annual Meeting of the Transportation Research Board, Washington DC,Transportation Research Record, 1995.
Deeter, D., and Bland, C.E. "Technology in Rural Transportation 'Simple Solutions'," FederalHighway Administration, Publication No. FHWA-RD-97-108, October 1997.
Dinning, M., "Benefits of Smart Cards in Transit," The Volpe Center September 1995.
Farwell, R., "Evaluation of OmniLink Demand Driven Transit Operations: Flex-Route Services," SGAssociates, Annandale, Virginia, presented at the European Transport Forum, 1996.
Federal Railroad Administration, Office of Safety Analysis

77
Fors, Heather, "Transit Safety is Up Due to Timed Lights," The Minnesota Daily, February 2, 1998.
Giugno, M., Milwaukee County Transit System, July 1995 Status Report.
Giuliano, G., et al., "Los Angeles Smart Traveler Information Kiosks: A Preliminary Report," 74thTransportation Research Board Annual Meeting, Transportation Research Record 1516, January1995.
Glassco, R, et al, "Studies of Potential Intelligent Transportation System Benefits Using TrafficSimulation Modeling," Mitretek Systems, MP96W0000101, June 1996.
Glassco, R, et al., "Studies of Potential Intelligent Transportation System Benefits Using TrafficSimulation Modeling: Volume 2," Mitretek Systems, MTR 1997-31, June 1997.
Goeddel, D., "Benefits Assessment of Advanced Public Transportation Systems (APTS)", prepared forFederal Transit Administration by Volpe National Transportation Systems Center, July 1996.
Hallowell, S., and Morlok, E., "Estimating Cost Savings From Advanced Vehicle Monitoring andTelecommunication Systems in Intercity Irregular Route Trucking.," department of Systems,University of Pennsylvania, Philadelphia, PA,
January 1992.
Harris, John & Sands, Mary, "Life-Saving Speed Camera Technology," Traffic Technology, 1995.
Haselkorn, M., et al., "Evaluation of PuSHMe Mayday System," Final Report, June 19, 1997.
Henk, Russell H. et al, "Before-and-After analysis of the San Antonio TransGuide System," TexasTransportation Institute, Third World Congress on Intelligent Transportation Systems, July 1996.
Henk, R. H. "Before-and-After Analysis of the San Antonio TransGuide System Phase I," 76th AnnualMeeting, Transportation Research Board, Washington DC, January 1997.
Henry, K. and Meyhan, O., "6 Year Flow Evaluation", Washington State DOT, District 1, January1989.

78
Hogema, Jeroen H., and Richard van der Horst, "Evaluation of the A16 Motorway Fog-SignalingSystem with Respect to Driving Behavior," TNO Human Factors Research Institute.
Inman, V., et al, "TravTek Evaluation: Orlando Test Network Study," Federal HighwayAdministration, FHWA-RD-95-162, January 1996.
Inman, V., et al, "TravTek Evaluation Yoked Driver Study", FHWA-RD-94-139, Federal HighwayAdministration, October 1995.
Inman, V., et. al.., "TravTek Evaluation: Rental and Local User Study," FHWA-RD-96-028, FederalHighway Administration, March 1996.
Intelligent Transport Systems Handbook in Japan, Highway Industry Development Organization,Ministry of Construction.
Jones, W., "ITS Technologies in Public Transit: Deployment and Benefits", USDOT ITS JointProgram Office, November 1995.
Kanianthra, Dr. Joseph, and Mertig, A., "Opportunities for Collision Countermeasures UsingIntelligent Technologies," National Highway Traffic Safety Administration, 1997.
Kirkham, Rob, "Making the most of SCATS," Traffic Technology International, Annual 1997, p32-34.
Kloos, W., et al., "Bus Priority at Traffic Signals in Portland: The Powell Boulevard Pilot Project,"ITE Compendium of Technical Papers, July 1994.
Lennon L., "Tappan Zee Bridge E-Z Pass System Traffic and Environmental Studies," Compendium ofTechnical Papers, 64th ITE Annual Meeting, Institute of Transportation Engineers, 1994.
Mathieu, J., "Multiservices/Multiproviders Remote Ticketing on the Marseille Metropolitan Area,"Proceedings of the Second World Congress on Intelligent Transport Systems, November 1995.
Maze, TH., et al,. "Automated Mileage and State line Crossing Operation Test Part 1 - EvaluationSummary," May 1, 1996.
Melillo, Wendy, "Traffic Enforcement By Remote Camera Catching On in Area," The WashingtonPost, March 16, 1998, p B08.

79
Meyer, Harvey, "Safer Cars Make Safer Roads," GEICO Direct, Fall 1997, p 24-27.
Meyer, M., ed., "A Toolbox for Alleviating Traffic Congestion", Institute of Transportation Engineers,Publication No. IR-054B, Washington DC, 1997.
Minnesota Department of Transportation, "Highway Helper Summary Report - Twin Cities MetroArea," Report # TMC 07450-0394, July 1994.
Orcutt Associates, "Evaluation Study, Buffalo Gap Road, Abilene Signal System," prepared for theCity of Abilene, Texas, 1994.
Pathfinder Evaluation Report, Prepared for California Department of Transportation, JHK &Associates, Pasadena, CA, February 1993.
Peters, J. McGurrin, M. J., Shank, D. E., and Cheslow, M., “An Estimate of Transportation CostSavings form Using Intelligent Transportation System (ITS) Infrastructure,” in ITE Journal,November 1997.
Philip, Davy & Walter Schramm, "Cashless tolls mean money saved," Reprinted from TrafficTechnology International 1997 for Hughes Transportation Management Systems, Canada.
Pilli-Sihvola, Yrjo, Kimmo Toivonen, and Jouko Kanton, "Road Weather Service System in Finlandand Savings in Driving Costs," Finnish National Road Administration.
Regan, A., et al., "Improving Efficiency of Commercial Vehicle Operations Using Real-TimeInformation: Potential Uses and Assignment Strategies," 74th Transportation Research Board AnnualMeeting, Transportation Research Record
1493, January 1995.
Remer, M., Atherton, T., and Gardner, W., "ITS Benefits, Evaluation and Costs: Results and Lessonsfrom the Minnesota Guidestar TravLink Operational Test, "Draft, November 1995.
Ride Solutions, "Operational Strategies for Rural Transportation," Florida Coordinated TransportationSystem, undated
Robinson, J. and Piotrowicz, G., "Ramp Metering Status in North America, 1995 Update," FederalHighway Administration, June 1995.

80
Samartin, Kevin, "Under Detection," ITS: intelligent transport systems, May/June 1997.
Schofer, J. et al., "Formal Evaluation of the Targeted Deployment," Vol. II, Appendix J, NorthwesternUniversity Transportation Center, July 1996.
Schwenk, J., "Using Credit Cards To Pay Bus Fares in Phoenix," The Volpe Center,DOT-TSC-FTA-96-01, 1996.
Shifrel, Scott, "Satellites Around Globe May Save Lives Right Here," The Palm Beach Post, June 1,1997.
Smith, S. and Perez, C., "Evaluation of INFORM - Lessons Learned and Application to OtherSystems," Conference Paper Presented at 71st TRB, January 1992.
Stevens, W. et al., "Summary and Assessment of Findings From the Precursor Analysis of AutomatedHighway System," The MITRE Corporation, WN95W0000124, October 1995.
Stone, J., "Winston-Salem Mobility Management: An Example of APTS Benefits, " NC StateUniversity, 1995.
Study of Commercial Vehicle Operations and Institutional Barriers, Appendix F, Booz, Allen &Hamilton, McLean, VA, November 1994.
Taylor, Steven T., “Helping Americans,”feature article, ITS World, Jan/Feb 1997.
Taylor, B. and Bergan, A.,"Words of Warning" in ITS: intelligent transport systems, Issue No 10,May/June 1997.
Tech Environmental, Inc., "Air Quality Benefit Study of the SmarTraveler Advanced TravelerInformation Service," July 1993.
USDOT, Federal Transit Administration, APTS Benefits, November 1995.
Van Aerde, M., and Rakha, H., "TravTek Evaluation: Modeling Study," FHWA-RD-95-090, FederalHighway Administration, March 1996.

81
Wetherby, B., et al., "System Effectiveness Test," final report, June 10, 1997.
Zhou, Wei-Wu, et al, "Fuzzy Flows," ITS: intelligent transportation systems, May/June 1997.
82
APPENDIX 2: LISTING OF ACRONYMS
AMASCOT: Automated Mileage and State line Crossing Operational Test
ANTTS: Automated Network Travel Time System
APTS: Advanced Public Transit Systems
ATA: American Trucking Association
ATIS: Advanced Traveler Information Systems
ATMS: Advanced Transportation Management Systems
AVL: Automated Vehicle Location
CAD: Computer Aided Dispatch
CASPER: Computer Aided System for Planning Efficient Routes
CCTV: Closed Circuit Television
CMAQ: Congestion Mitigation and Air Quality Improvement Program
CO: Carbon monoxide
CVO: Commercial Vehicle Operations
DGWS: Down Grade Warning System
DOT: Department of Transportation
ETC: Electronic Toll Collection
FHWA: Federal Highway Administration
GPS: Global Positioning System
HAR: Highway Advisory Radio
HC: Hydro carbons
HOV: High Occupancy Vehicle
HRI: Highway Rail Intersection
IFTA: International Fuel Tax Agreement
INFORM: Information for Motorist
IRP: International Registration Plan
ITE: Institute of Transportation Engineers
ITS: Intelligent Transportation Systems
JPO: ITS Joint Program Office of the U.S. DOT
LTA: Land Transport Authority
MDI: Model Deployment Initiative
NOx: Nitrous Oxide
OS/OW: Oversize and Overweight
PuSHMe: Puget Sound Help Me Mayday System

83
RESCU: Remote Emergency Satellite Cellular Unit
ROUTES: Rail, Omnibus, Underground Travel Enquiry System
RRWS: Ramp Rollover Warning System
SCATS: Sydney Coordinated Adaptive Traffic Control
SOV: Single Occupancy Vehicle
SURF-2000: Systeme Urbain de Regulation des Feux
TEA-21: Transportation Efficiency Act for the 21st Century
TIMS: Traffic and Incident Management System
U.S. DOT: United States Department of Transportation
VMS: Variable Message Sign
VMT: Vehicle Miles Traveled

84
To access an electronic version of this publication
and other ITS related publications visit the
ITS Electronic Document Library (EDL):
http://www.its.fhwa.dot.gov/cyberdocs/welcome.htm
EDL Document Number 8323
Visit Our ITS WEB Site
ITS Joint Program Office: http://www.its.dot.gov
Publication No. FHWA-OP-99-012
HVH-1/2-98 (200) QE