Embed Size (px)
Citation preview

1Sd2noss�itwplptQsQe
aPaisa0rp(opt
1660 J. Opt. Soc. Am. B/Vol. 22, No. 8 /August 2005 Savitski et al.
Intensity-dependent bleaching relaxationin lead salt quantum dots
Vasili G. Savitski, Alexander M. Malyarevich, Mikhail I. Demchuk, and Konstantin V. Yumashev
International Laser Center, Building 17, #65 F. Skaryna Ave., 220013 Minsk, Belarus
Helga Raaben and Alexander A. Zhilin
S. I. Vavilov State Optical Institute, St. Petersburg, Russia
Received July 16, 2004; revised manuscript received December 3, 2004; accepted March 11, 2005
Bleaching relaxation in lead salt (PbS) quantum dots (QDs) of various sizes and under different pump inten-sities has been studied. The observed bleaching relaxation features (particularly, shortening of the bleachingrelaxation times with a decrease in the QD size and an increase of the pump-light intensity) are explained inthe context of the proposed spectroscopic model. The model takes into account transitions of the excited-chargecarriers both within the system of quantum-confined energy levels and the defect states of the QDs. The char-acteristic times of the direct electron-hole recombination, carriers trapping to the defect states, and their sub-sequent relaxation from these states as well as the cross sections of the ground-state and excited-state absorp-tion of charge carriers can be evaluated from the experimental data for PbS QDs of different sizes and underdifferent pumping conditions using this model. © 2005 Optical Society of America
OCIS codes: 160.2750, 160.4760, 300.6500, 320.7130.
Pa4r
Qwsetw1Qbmtlfch
utkt
b�dsoQsd
. INTRODUCTIONemiconductor zero-dimensional structures (quantumots, or QDs) have been intensively studied for the past0 years,1–3 mainly because of their interesting physicalature—various effects caused by quantum confinementf charge carriers (electrons and–or holes) in structures ofmall sizes (comparable with exciton Bohr radius). Leadalt (PbS) has a relatively large exciton Bohr radius18 nm�, and a strong quantum confinement is expectedn such QDs in contrast with II–VI and I–VII semiconduc-ors. On the other hand, enhanced optical nonlinearitiesithin the range of the first excitonic resonance makeossible the application of QDs as passive shutters foraser-pulse generation. A rather narrow bandgap in PbSrovides a shifting of a spectral position of the first exci-onic resonance from 1 �m up to 3 �m by increasing theD size. A transient bleaching of the first excitonic ab-
orption band in PbS–QD-doped glasses was exploited toswitch and mode lock a number of solid-state lasers
mitting within the 1.06–1.55 �m spectral region.4–11
It has been shown previously that the bleaching relax-tion within the range of the first excitonic resonance forbS QDs demonstrates double-exponential type,5,7,12–14
nd the bleaching relaxation time depends on pump-lightntensity.5,12,14 For PbS QDs of 5.4 nm in diameter thehortening of the fast relaxation time from 17 to 5 ps withn increase in the 120-fs pump fluence from.5 to 4 mJ/cm2 was reported.12 The same tendency wasegistered for PbS QDs of 5.5 nm in diameter when theump intensity was changed from 0.3 to 2.5 GW/cm2
Ref. 14). However, no dependence on pump intensity wasbserved for QDs of 4.4 nm in diameter under picosecondump fluences of 4–70 mJ/cm2 (Ref. 13). It was shown7
hat the fast bleaching relaxation time � depends also on
f0740-3224/05/081660-7/$15.00 © 2
bS QDs size. A very strong dependence of the fast relax-tion time on mean dots radius ��f�R9� for PbS QDs of.7–5.8 nm in diameter dispersed in phosphate glass waseported.7
To describe the bleaching relaxation processes in PbSDs of 5.5 nm in size, a four-level spectroscopic modelas suggested.14 This model included excited-state ab-
orption (ESA) between excitonic states and consideredxcitation relaxation by direct electron-hole recombina-ion and recombination through defect states. This modelas successfully used to simulate the performance of a.3-�m Nd:YVO4 laser passively Q switched with PbS–D-doped glass saturable absorber.15 However, theleaching relaxation simulation within the frame of thisodel led to a conclusion that the characteristic time of
he direct electron-hole recombination depends on pump-ight intensity (i.e., the increasing of the light intensityrom 0.3 to 2.5 GW/cm2 leads to the shortening of theharacteristic time from 100 to 40 ps),14 which can beardly explained.As soon as saturable absorbers work in different lasers
nder various pump conditions, for the efficient applica-ion of PbS QDs as passive shutters it is necessary tonow how their bleaching characteristics depend on exci-ation light parameters.
In the present work we report the detailed study ofleaching relaxation for PbS QDs of various sizes4.2–6.3 nm� under different excitation intensities andurations. In particular, the same PbS–QD-doped glassample has been studied under picosecond and nanosec-nd pump-light excitation. It has been shown that PbSDs demonstrate remarkably different nonsaturable (re-
idual) absorption losses under the various pump–pulseurations. The observed features can be explained in the
005 Optical Society of America

citgetsiwss
2Ises(tstt
wssps
tlSew
gfppjt1ske
s1tsizptsTotu
Fw#t
Fdct(
Savitski et al. Vol. 22, No. 8 /August 2005 /J. Opt. Soc. Am. B 1661
ontext of the modified spectroscopic model, which takesnto account one more channel for ESA—within the sys-em of the QDs defect states (in addition to the one sug-ested in Ref. 14, within the system of size-quantized lev-ls). As a result, this model not only describes correctlyhe intensity-dependent transmission–absorption mea-urements but also allows the evaluation of the character-stic times of the direct electron-hole recombination,hich does not depend any more on the pump-light inten-
ity (in contrast to the model in Ref. 14) for PbS QDs of allizes studied.
. EXPERIMENTAL DETAILSn the present work we have studied four PbS–QD-dopedilicate glass samples. Their preparation was describedarlier.4 These samples demonstrate the first excitonic ab-orption maximum at 1085 (sample #1), 1370 (#2), 1470#3), and 1525 nm (#4) [Fig. 1(a)], which corresponds tohe mean dot diameters of 4.2, 5.5, 6.0, and 6.3 nm, re-pectively. The QD diameters have been determined fromhe dependence of the spectral position of the first exci-onic peak on the PbS dot’s diameter.16
The kinetics of bleaching relaxation was measuredith a standard picosecond pump–probe technique de-
cribed in detail in Ref. 17. A 15 ps pulse from the pas-ively mode-locked Nd:YAlO3 laser ��=1.08 �m� was em-loyed as a pump radiation. The pump intensity on theamples was varied from �0.04 up to �6 GW/cm2 by neu-
ig. 1. (a) Absorption spectra of PbS–QD-doped silicate glassesith a dot average diameter of 4.2, 5.5, 6.0 and 6.3 nm (samples1–#4, respectively). (b) Energy-level scheme of PbS QDs underhe isotropic approximation.16
ral filters. The fundamental emission wavelength of theaser �1.08 �m� and the second and the third Ramantokes (1.29 and 1.52 �m) from the KGd�WO4�2 crystal,xcited by a part of the pump pulse mentioned above,ere used as a probe.It should be noted that the 1.08 �m pump excites a
roup of the higher-energy excitonic transitions in QDsor samples #2, #3, and #4 [as seen in Fig. 1(b)]. Followingumping, the excited electrons and holes relax from theumped energy levels to the lowest energy states [with
e�h�=1/2; Fig. 1(b)] during 1–2 ps.12,18 The characteristicime of this relaxation process is much shorter than the5 ps duration of the pump pulses, and it has not been re-olved in our experiments. With the probe we register theinetics of bleaching relaxation from the lowest energyxcitonic state [Fig. 1(b)].
The absorption-saturation measurements in the nano-econd time scale have been performed at 1.06, 1.34, and.54 �m with passively Q-switched Nd:YAG (pulse dura-ion of 10 ns), Nd:YAlO3 �50 ns�, and Er:glass �65 ns� la-ers, respectively. The pump-light intensity has been var-ed by moving the sample along the focused beam (-scan-like technique; see Ref. 19 for more details). Theassively mode-locked Nd:YAlO3 laser ��=1.08 �m� men-ioned above has been applied for the absorption-aturation measurements in the picosecond time scale.he transmittance of the 15 ps probe pulses at 1.08, 1.29,r 1.52 �m has been measured after a 15 ps time delay ofhe pump pulse at 1.08 �m (i.e., measurements of the val-es of maximal optical density change �OD at the appro-
ig. 2. Intensity-dependent relative absorption for the PbS–QD-oped glass sample #3 (squares): (a) at �=1.525 �m under the pi-osecond pump; (b) at �=1.54 �m under the nanosecond excita-ion. Solid curves present the results of the best fit within Eqs.2) and (5), respectively.

pfi
mtt
3AFsuct1
lanlmmtt=p�eaci
Ocmcsj1Evs
BFm0(cc
waOtietaatlephrtaTpihdho
4Rtcchfinami→ttt
F10sp
1662 J. Opt. Soc. Am. B/Vol. 22, No. 8 /August 2005 Savitski et al.
riate pump intensities have been performed). Neutrallters have been used to vary the pump intensity.The damage threshold of the samples has been esti-ated to be �10 J/cm2 (for the nanosecond pulse dura-
ion) and �15 GW/cm2 (for the picosecond pulse dura-ion).
. EXPERIMENTAL RESULTS. Absorption Saturation Dataigure 2 presents the intensity-dependent relative ab-orption of PbS–QD-doped glass (sample #3) registerednder picosecond [Fig. 2(a)] and nanosecond [Fig. 2(b)] ex-itation. The picosecond measurements have been done athe wavelength of 1.52 �m and the nanosecond ones at.54 �m.One can see that a powerful picosecond pump leads to
ower residual absorption �ns/�0=0.09 [�0, small-signalbsorption coefficient; Fig. 2(a)]. On the other hand, theanosecond pump [Fig. 2(b)] leaves much higher residual
osses of �ns/�0=0.37. The ratios �ns/�0 have been esti-ated from the experimental data [Figs. 2(a) and 2(b)] ataximal pump intensities available. It should be men-
ioned that this difference in the �ns/�0 value is consis-ent with the earlier registered results. The value of �ns0.03 cm−1 ��ns/�0=0.02� was achieved under 33 psump pulse.6 For the nanosecond excitation, values ofns/�0�0.2–0.4 were obtained.4,9 This pronounced differ-nce in the residual absorption registered for the “short”nd “long” pump shows that these losses cannot be asso-iated with nonsaturable absorption owing to the scatter-ng processes and the imperfection of the glass sample.
ig. 3. Kinetics of bleaching relaxation for the sample #3 at.52 �m under the pump intensities of 5.6, 2.8, 2.2, 1.4, 0.9, and.25 GW/cm2 (a)–(f), respectively. Solid curves present the re-ults of the modeling using the rate equations [Eq. (2)] and thearameters of the spectroscopic model from Table 1.
ne possible explanation is the presence of two differenthannels for ESA in PbS QDs, which manifest themselvesainly under the nanosecond or picosecond pump. These
hannels are: ESA within the system of PbS QDs excitonictates from the lowest excitonic level to the higher (withe�h��5/2) electron and–or hole states, as proposed in Ref.4 (this ESA is revealed by the picosecond excitation); andSA within the system of energy levels related to thearious in nature defect states (including dot-surfacetates), as observed under the “long” nanosecond pump.
. Transient Bleaching Dataigure 3 presents the results of the bleaching relaxationeasurements under different pump intensities (from
.25 to 5.6 GW/cm2) for the PbS QDs of 6.0 nm in sizesample #3). The kinetics of the bleaching relaxation isharacterized with two components—fast and slow—andan be described by the equation
− �OD = Af exp�− t/�f� + As exp�− t/�s�, �1�
here Af, As, �f, and �s are the amplitudes and the relax-tion times of the fast and slow bleaching components.ne can see that within the time interval of 200–500 ps
he �OD signal decreases to a plateau �ODpl for all pumpntensities. The time delay in our experiments is not longnough to correctly measure �s values, so we estimatehese as lying in at least a nanosecond time scale, and welso evaluate As amplitudes as the values of �ODpl at theppropriate pump intensities. The fast component is at-ributed to the direct electron-hole recombination or re-axation through the shallow defect states. To explain themergence of the second (slow) bleaching relaxation com-onent, we postulated the carriers’ (electrons and–oroles) trapping to the deep defect (surface) states withather long (nanosecond) live time.13 The change in exci-ation intensity leads to the variation of the values of �fnd Af /As. The appropriate data are collected in Table 1.he tendency is the shortening of the time of the fast com-onent �f and the decreasing of the Af /As value with thencreasing of the pump intensity Ip (Fig. 4). The same be-avior was registered for PbS QDs of �5.5 nm iniameter.12,14 The time-delay interval in our experimentsas not been long enough to register definitely the changef the �s value with the change of Ip.
. DISCUSSIONelaxation processes in PbS QDs can be described within
he frame of the model presented in Fig. 5. This model in-ludes level �0�, a ground state, and two groups of the ex-ited state energy levels: �1�, the first excited state; �2�, aigher excited state within the system of quantum con-ned states in the QD; and DS, the defect states (we doot detail the nature of these defects; they are most prob-bly due to the dot-surface interface). If we compare thisodel with the energy structure of PbS QDs under the
sotropic approximation [Fig. 1(b)],16 the transition �0��1� corresponds to the electrons and holes excitation to
he levels �je=1/2,�e=−1�, and �jh=1/2,�h=1�, respec-ively. The higher excited state �2� corresponds to the elec-ron (hole) state with the quantum number j�5/2 [not

sppatotsomlteocnp�at→psnsstec
se
w�lcpN�A(a
→pa
�
�
wac
Fos
Fr
Savitski et al. Vol. 22, No. 8 /August 2005 /J. Opt. Soc. Am. B 1663
hown in Fig. 1(b)]. The depopulation of the level �1� takeslace during tens of picoseconds (time �f registered inump–probe experiments), so the ESA between levels �1�nd �2� is observed only within this time interval. Duringhis period a part of electrons and holes recombine, andther excited carriers are trapped to the defect states. Af-er this trapping, the ESA within the channel of the defecttates raises. This ESA is observed for several nanosec-nds (time �s). So, the intensity-dependent transmissioneasurement in the nanosecond time scale reveals this
ong-lived ESA. It is possible to observe separately thesewo ESA processes in the experiment. Using “short” (sev-ral units or several tens of picoseconds) pump pulses,ne registers only ESA within the channel �1�→ �2�, be-ause there are no carriers in the DS (or their amount isegligible). When the pump intensity of the picosecondulse is very high �Ip→��, the maximal bleaching signalODmax�Ip→�� is determined by the value of 1 /0 (0nd 1 are the ground-state and the excited-state absorp-ion cross sections of the transitions �0�→ �1� and �1�
�2�, respectively). At “long” (nanosecond and longer)umping, the DS are mostly populated (owing to the pico-econd relaxation time �f the population of the level �1� isegligible), the ESA due to the trapped carriers is only ob-erved. So, the value of 2 /0 determines the residual ab-orption [or saturated transmittance Tsat�Ip→��] underhe high intensive nanosecond excitation (2 is thexcited-state absorption cross-section due to the trappedarriers).
As a result, the processes of absorption and excited-tate relaxation can be described in accordance with thenergy-level scheme in Fig. 5 using the rate equations:
dN0/dt = − Ip�t�pN0�t� + N1�t�/�1 + N3�t�/�3,
dN1/dt = Ip�t�pN0�t� − N1�t�/�1 − N1�t�/�13,
dN /dt = N �t�/� − N �t�/� ,
ig. 4. Dependencies of the fast relaxation time �f and the ratiof fast to slow component amplitudes Af /As on the pump inten-ity. Solid curves are the guides for eyes.
3 1 13 3 3
�OD�td� �−�
+�
exp− 2�t − td�/�t2�− 2N1�t�
+ N3�t� +1
0N1�t� +
2
0N3�t��dt,
Ip�t� = Ip0 exp�− 2t/�t�2, �2�
here N0, N1, and N3 are the populations of the levels �0�,1� and the DS on which the excited carriers are accumu-ated, respectively; p is the ground-state absorptionross-section at the wavelength of the pump; �t is theump–pulse width �15 ps�. The population of the level �2�,2 is negligible because of the short relaxation time �2
1–2 ps�12 in comparison with the pump–pulse width �t.nalogously we neglect the population of the appropriate
in energy) higher defect level expecting its short relax-tion time.The experimental data provide five values: �ODmax�Ip��, Tsat�Ip→��, Af /As, �f and �s, which refer to the
hysical parameters from the spectroscopic model (Fig. 5)s following:
1 = 1 −1
20,
2 = 1
0
�
�3+
2
0�1 −
�
1��� 1 −
�
�1+ 2
�
�3� ,
a = �1 −�
�3��2 −
1
0�� �1 −
�
�1��1 −
2
0�� − 1,
�s = �3,
�f =�1�13
�1 + �13, �3�
here �1= ��ODmax�Ip→��� /D0, �2=ln Tsat�Ip→�� / ln T0,=Af /As, �= ��1�13� / ��1+�13���f, and D0 is the initial opti-al density of the sample. With the experimental data it is
ig. 5. Spectroscopic model for the description of the bleachingelaxation processes in PbS QDs.

pm
�
ttpttrsap
saiTtf=dpm=→T
ctl((wti
“wlti
st
ftac�Ht�aO
1664 J. Opt. Soc. Am. B/Vol. 22, No. 8 /August 2005 Savitski et al.
ossible to define the spectroscopic parameters of theodel from the following equations:
1
0= 2�1 − �1�,
2
0=
��f/�s��1 − �2��1 + a − �1� − a�1 − �1�2
��f/�s��1 − �2��1 + a� − a�1 − �1,
�1 = �f� �1 + 2�f
�s� −
2�1
�1 + a��1 − �2��1 + a
�f
�s�� ,
13 =�1�f
�1 − �f,
�3 = �s. �4�
So, having carried out three types of the experiments–he intensity-dependent absorption measurements underhe “short” (picosecond) and “long” (e.g., nanosecond)ump, and the bleaching relaxation measurements usinghe picosecond pump–probe technique–one can evaluatehe spectroscopic parameters (the characteristic times ofelaxation, �1, �13, and �3; and the ratios of the excited-tate to the ground-state absorption cross sections, 1 /0nd 2 /0) that describe the excitation and relaxationrocesses in PbS QDs.It is possible with experimental data to calculate the
pectroscopic parameters of the model based on Eqs. (4)nd then to simulate numerically the relaxation processesn QDs within the frame of the rate equations [Eqs. (2)].he intensity-dependent bleaching measurements underhe picosecond excitation provide the maximal �OD valueor the sample #3 as ��ODmax�Ip→���=0.52 at Ip5.6 GW/cm2 [see Fig. 2(a)]; as soon as the initial opticalensity D0=0.55, so the value of �1 equals to 0.95. The ex-eriment for the nanosecond intensity-dependent trans-ission measurements leads to Tsat�Ip→��=0.64 at Ip240 MW/cm2, which gives the value of �2=ln Tsat�Ip�� / ln T0=0.35 (T0 is a small-signal transmittance).
hese parameters, � and � , are used to calculate the
Table 1. Experimental and Calculated
Experiment
D(nm) �1 �2
Ip
�GW/cm2��f
(ps)
4.2 0.65 0.43 0.90 20±25.5 0.55 0.45 0.30 28±3
0.90 25±32.50 20±3
6.0 0.95 0.35 0.25 80±60.90 70±71.40 60±52.20 55±52.80 40±45.60 45±4
6.3 0.40 0.40 6.00 50±4
aD is the QD diameter; Ip is the pump intensity.
1 2
haracteristics of the spectroscopic model at all pump in-ensities. The calculated parameters �1, �13, �3, 1 /0 and2/0 are summarized in Table 1. The results of the simu-
ations of the bleaching relaxation processes in PbS QDssample #3) within the frame of the rate equations [Eqs.2)] at different pump intensities are presented in Fig. 3ith solid curves. One can see that agreement between
he calculated relaxation curve and the experimental datas quite good for all pump intensities.
The intensity-dependent transmittance under thelong” pump can be modeled by use of a simpler way thanith the Eqs. (2). If the pump–pulse duration is much
onger than the relaxation time �3, the Eqs. (2) can beransformed to the analytical expression describing thentensity-dependent transmittance T:
ln� T
T0� = � �3 + 2�13
�3
2
0+ �13
1
0
− 1��ln� 1 + I�11�2
1�3 + �13�� ��1 + �13�
1 + IT�11�2
1�3 + �13�� ��1 + �13�� .
�5�
The modeled curve is presented in Fig. 2(b) with theolid curve showing good agreement with the experimen-al data.
The values of the parameters of the model obtainedrom the fitting of the experimental data at different in-ensities are presented in Fig. 6. One can see that the2/0 value (for the sample #3) is changed between 0.38nd 0.47 [Fig. 6(a), solid squares; and Table 1]. This oc-urs, in our opinion, because the 2 /0 value depends onf and a=Af /As, which vary with the pump intensity.owever, taking into account the experimental uncer-
ainty of the picosecond pump–probe measurements �10% � it is possible to conclude that 2 /0 has the same
verage value of 2 /0�0.43 for all pump intensities Ip.n the other hand, it is reasonable that the ratio of the
on Bleaching Relaxation in PbS QDsa
Model
) Af /As 1 /0 2 /0
�1(ps)
�12(ps)
.02 2.0 0.7 0.49 63 302.3 0.9 0.45 71 461.9 0.45 77 371.8 0.45 69 28
39.0 0.1 0.47 88 90025.0 0.45 80 58016.0 0.41 73 3308.3 0.39 82 1644.7 0.38 87 745.7 0.43 86 942.5 1.2 0.36 86 120
Data
�s
(ns
0.1±0�1
�1
�1
attsA�ctpilcptp
1ecosi
ts�e tglwbi
5BAfb(e[tcptp
sdsqwdfiadsts
F�s
Fsd
Savitski et al. Vol. 22, No. 8 /August 2005 /J. Opt. Soc. Am. B 1665
bsorption cross sections does not vary with the pump in-ensity. The same type of dependence is observed for theime constant �1; it is changed from 73 to 88 ps for theample #3 [see Fig. 6(b), solid squares; and Table 1].nalogously, one can evaluate the constant value of �180 ps for all pump intensities. The parameter �1 is the
haracteristic time of the direct electron-hole recombina-ion, so obviously this constant has not to vary with theump intensity. (It should be mentioned that the model-ng based on the energy-level scheme suggested in Ref. 14eads to the shortening of time constant �1 with the in-reasing of the pump intensity, which could barely be ex-lained.) In contrast, the time constant �13 demonstrateshe remarkable shortening with the increasing of theump light intensity [Fig. 6(c), solid squares; and Table
ig. 6. Dependence of the parameters of the model (a) 2 /0, (b)1, and (c) �13 on the pump intensity for PbS QDs of 6.0 nm (solidquares) and 5.5 nm (open squares) in size.
]. Constant �13 characterizes the probability of the carri-rs trapping to the DS. The physical reason for the in-reased rate of this trapping process is not evident fromur experiments; however, this may illustrate thetrengthening of the dot-matrix interaction in a higher-ntensive electric field.
One more comment could be added, taking into accounthe possible usage of PbS–QDs-doped glasses as laseraturable absorbers. For such applications a low value ofns/�0 is preferable. For short (picosecond) pulses low-nough nonsaturable absorption can be achieved [�ns/�00.1; see Fig. 2(a)]. However, longer excitation leads to
he remarkable residual losses ��ns/�0�0.3�, which couldovern the pulse dynamics in Q-switched lasers. Theseosses are associated with the excited-state absorptionithin the system of the defect states in QDs, and theleaching contrast may be probably improved by optimiz-ng the PbS–QDs-doped glass preparation procedure.
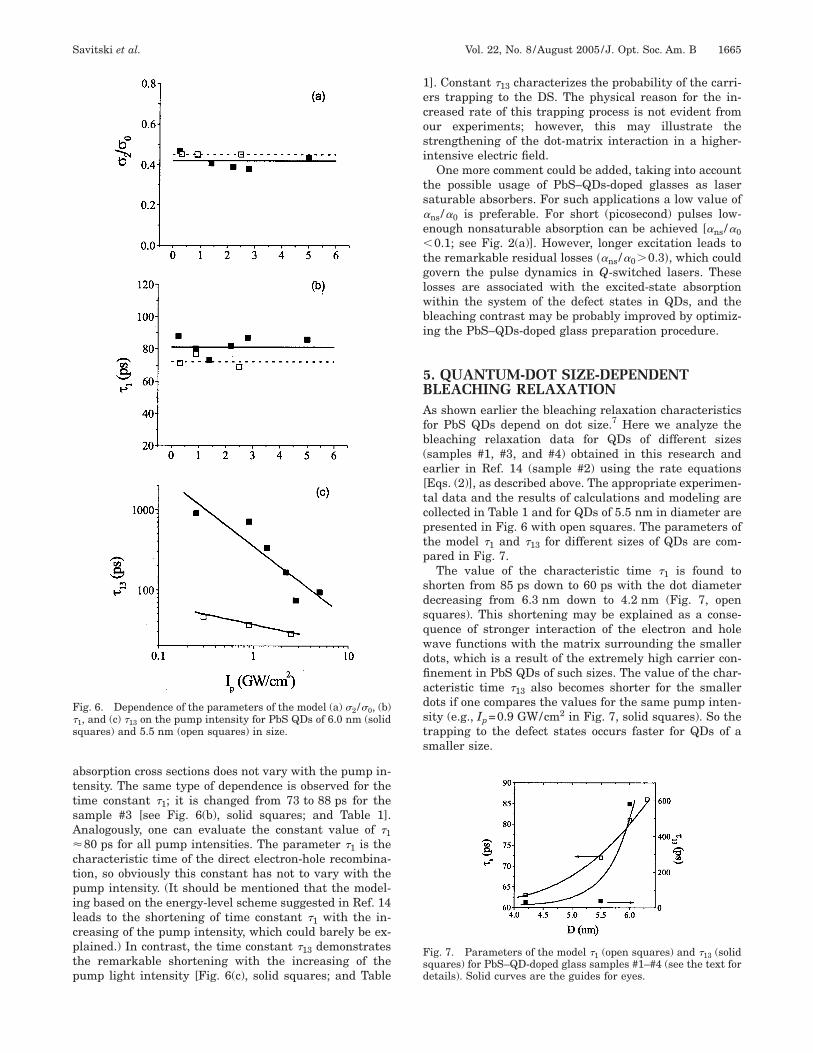
. QUANTUM-DOT SIZE-DEPENDENTLEACHING RELAXATIONs shown earlier the bleaching relaxation characteristics
or PbS QDs depend on dot size.7 Here we analyze theleaching relaxation data for QDs of different sizessamples #1, #3, and #4) obtained in this research andarlier in Ref. 14 (sample #2) using the rate equationsEqs. (2)], as described above. The appropriate experimen-al data and the results of calculations and modeling areollected in Table 1 and for QDs of 5.5 nm in diameter areresented in Fig. 6 with open squares. The parameters ofhe model �1 and �13 for different sizes of QDs are com-ared in Fig. 7.The value of the characteristic time �1 is found to
horten from 85 ps down to 60 ps with the dot diameterecreasing from 6.3 nm down to 4.2 nm (Fig. 7, openquares). This shortening may be explained as a conse-uence of stronger interaction of the electron and holeave functions with the matrix surrounding the smallerots, which is a result of the extremely high carrier con-nement in PbS QDs of such sizes. The value of the char-cteristic time �13 also becomes shorter for the smallerots if one compares the values for the same pump inten-ity (e.g., Ip=0.9 GW/cm2 in Fig. 7, solid squares). So therapping to the defect states occurs faster for QDs of amaller size.
ig. 7. Parameters of the model �1 (open squares) and �13 (solidquares) for PbS–QD-doped glass samples #1–#4 (see the text foretails). Solid curves are the guides for eyes.

6TfddsmsFttfc(dipdpstateossAs67
r�
R
1
1
1
1
1
1
1
1
1
1
1666 J. Opt. Soc. Am. B/Vol. 22, No. 8 /August 2005 Savitski et al.
. CONCLUSIONhe bleaching relaxation in PbS quantum dots for the dif-
erent pump intensities �0.25–6.0 GW/cm2�, pump–pulseurations (picosecond and nanosecond) and quantum dotsiameters �4.2–6.3 nm� has been studied. It has beenhown that the durable excitation (nanosecond) leads to auch higher residual absorption in PbS QDs then the
hort (picosecond) one (�ns/�0�0.4 and 0.1, respectively).or the QDs of 6 nm in size an increase in the pump in-ensity from 0.25 to 5.6 GW/cm2 (in �20 times) causeshe shortening of the fast relaxation characteristic time �from 80 to 45 ps and a decrease in the ratio of the fastomponent amplitude to the slow one Af /As in �1 orderfrom 40 to 5). The observed features of the intensity-ependent bleaching relaxation in PbS QDs are explainedn the context of the proposed spectroscopic model. Thearameters of the model (the characteristic times of theirect electron-hole recombination, excited carriers trap-ing to the defect states and their relaxation from thesetates to the ground state, and the ratios of excited-stateo ground-state absorption cross-sections) can be evalu-ted from the experimental data. The analysis shows thathe probability of carriers trapping to the defect states isnhanced with an increase of the pump intensity; for QDsf 6 nm in size the corresponding characteristic timehortens from 900 ps down to 90 ps with the pump inten-ity increasing from 0.25 GW/cm2 up to 5.6 GW/cm2.lso, this characteristic time becomes shorter for themaller dots (with decreasing of the dot size from.0 nm to 4.2 nm, the time constant shortens from00 ps to 30 ps) as taken at the fixed pump intensity.
V. G. Savitski is the corresponding author and can beeached by e-mail at [email protected] or by fax at375 17 232 6286.
EFERENCES1. A. D. Yoffe, “Semiconductor quantum dots and related
systems: electronic, optical, luminescence and relatedproperties of low-dimensional systems,” Adv. Phys. 50,1–208 (2001).
2. S. V. Gaponenko, Optical Properties of SemiconductorNanocrystals (Cambridge U. Press, 1998).
3. U. Woggon, Optical Properties of Semiconductor QuantumDots (Springer, 1997).
4. A. M. Malyarevich, V. G. Savitski, P. V. Prokoshin, N. N.Posnov, K. V. Yumashev, E. Raaben, and A. A. Zhilin,“Glass doped with PbS quantum dots as a saturableabsorber for 1-�m neodymium lasers,” J. Opt. Soc. Am. B19, 28–32 (2002).
5. A. Dementjev, V. Gulbinas, L. Valkunas, I. Motchalov, H.
Raaben, and A. Michailovas, “Mode-locking of neodymiumlasers by glasses doped with PbS nanocrystals,” Appl. Phys.B 77, 595–599 (2003).
6. P. T. Guerreiro, S. Ten, N. F. Borrelli, J. Butty, G. E.Jabbour, and N. Peyghambarian, “PbS quantum-dot dopedglasses as saturable absorbers for mode-locking of aCr:forsterite laser,” Appl. Phys. Lett. 71, 1595–1597 (1997).
7. V. G. Savitski, N. N. Posnov, P. V. Prokoshin, A. M.Malyarevich, K. V. Yumashev, M. I. Demchuk, and A. A.Lipovskii, “PbS-doped phosphate glasses saturableabsorbers for 1.3-�m neodymium lasers,” Appl. Phys. B 75,841–846 (2002).
8. V. G. Savitski, A. M. Malyarevich, K. V. Yumashev, B. D.Sinclair, A. A. Lipovskii, “Diode-pumped Nd:YVO4 andNd:KGd�WO4�2 1.3 �m lasers passively Q-switched withPbS-doped glass,” Appl. Phys. B 76, 253–256 (2003).
9. A. M. Malyarevich, I. A. Denisov, V. G. Savitsky, K. V.Yumashev, and A. A. Lipovskii, “Glass doped with PbSquantum dots as passive Q-switch for 1.54 �m laser,” Appl.Opt. 39, 4345–4347 (2000).
0. J. F. Philipps, T. Töpfer, H. Ebendorff-Heidepriem, D. Ehrt,R. Sauerbrey, and N. F. Borrelli, “Diode-pumped erbium-ytterbium-glass laser passively Q-switched with a PbSsemiconductor quantum-dot doped glass,” Appl. Phys. B 72,175–178 (2001).
1. A. A. Lagatsky, C. G. Leburn, C. T. A. Brown, W. Sibbett, A.M. Malyarevich, V. G. Savitski, K. V. Yumashev, E. L.Raaben, and A. A. Zhilin, “Passive mode locking of aCr4+:YAG laser by PbS quantum-dot-doped glass saturableabsorber,” Opt. Commun. 241, 449–454 (2004).
2. K. Wundke, S. Putting, J. Auxier, A. Schulzgen, N.Peyghambarian, and N. F. Borrelli, “PbS quantum-dot-doped glasses for ultrashort-pulse generation,” Appl. Phys.Lett. 76, 10–12 (2000).
3. G. Tamulaitis, V. Gulbinas, G. Kodis, A. Dementjev, L.Valkunas, I. Motchalov, and H. Raaben, “Opticalnonlinearities of glass doped with PbS nanocrystals,” J.Appl. Phys. 88, 178–182 (2000).
4. V. G. Savitski, N. N. Posnov, A. M. Malyarevich, K. V.Yumashev, E. Raaben, and A. A. Zhilin, “Relaxation ofbleaching in lead sulfide nanoparticles at different pumppowers,” J. Appl. Spectrosc. 71, 83–88 (2004).
5. V. G. Savitski, A. M. Malyarevich, K. V. Yumashev, V. L.Kalashnikov, B. D. Sinclair, H. Raaben, and A. A. Zhilin,“Experiment and modeling of a diode-pumped 1.3-�mNd:YVO4 laser passively Q-switched with PbS-dopedglass,” Appl. Phys. B 79, 315–319 (2004).
6. I. Kang and F. W. Wise, “Electronic structure and opticalproperties of PbS and PbSe quantum dots,” J. Opt. Soc. Am.B 14, 1632–1646 (1997).
7. A. Declemey and C. Rulliere, “Totally automatedpicosecond transient absorption spectrometer using twophotodiode arrays as detectors,” Rev. Sci. Instrum. 57,2733–2738 (1986).
8. J. L. Machol, F. W. Wise, R. C. Patel, and D. D. Tanner,“Vibronic quantum beats in PbS microcrystallites,” Phys.Rev. B 48, 2819–2822 (1993).
9. M. M. Sheik-bahae, A. A. Said, T.-H. Wei, D. J. Hagan, andE. W. Van Stryland, “Sensitive measurements of opticalnonlinearities using a single beam,” IEEE J. QuantumElectron. 26, 760–769 (1990).