Embed Size (px)
Citation preview

I N T E N S I T Y OF L I N E S F R O M L O W - L Y I N G L E V E L S IN
C II, N III, O IV, Ne Vl, Mg v i i i , Si x , A N D Si II
SURESH CHANDRA*
Lehrstuhl fiir Theoretische Astrophysik, Universitiit Tiibingen, D 7400 Ti~bingen 1, F.R.G.
(Received 23 September, 1980; in final form 17 February, 1981)
2 o 2 o Abstract. The intensities of the lines for the transition P3/2- P1/2 in C II, N In, O iv, Ne vI, Mg viii, Si x, and Si II in the chromosphere-corona transition region are investigated. The populations of the excited state 2P~/2 relative to the ground state 2P~ are obtained by considering all the radiative and collisional transition processes including the collisional transitions to the higher states which cascade to the upper level. It is found that in the transition region the intensity (which may be expressed as a function of temperature only) increases with the charge on the ion for a sequence.
Fol lowing Pot tasch (1963) the intensity of a line (in erg cm -2 s -1) observed at the
Ear th ' s distance is given by (Chandra, 1978, 1979; Chandra and Dularey, 1980):
= 1.74 x 10 -17 Wii I NiAii dh, I (1)
where the integrat ion is pe r fo rmed over the line forming region. Aii(s - I) is the spontaneous transit ion probabil i ty, Wii (eV) the energy difference be tween the levels
i and ], and N / i s the popula t ion density of the ion concerned in the upper level/ ' ,
which can be expressed as
Ni = Ni N1 NE NH N (2) N1 NE Nrl We e.
Here Ne (cm -3) is the electron density, Ne/NH the e lemental abundance relative to
hydrogen (reported by Dupree , 1972), N1/NE the ion abundances (calculated by
Jordan (1969) by considering all the ionization and recombina t ion processes), and
NH/Ne (=0.8) is the density of the pro tons relative to the electrons. The popula t ion
of the excited state relative to the g round state NffN1 (=Nz/N1) is de te rmined by the
s teady state equat ion:
NI(A 12 + C12 + PiE + C12c) = N2(Azl + C21), (3)
where A12, Ct2, PI2, and CI2~ are the rates of photoexci ta t ion, collisional excitation,
p ro ton excitation, and the excitation to the higher states which cascade to the upper
level, respectively. Cex and A21 are the collisional deexcitat ion rates and the
spontaneous transit ion probabili ty, respectively. The electrons in the level 2 has max imum probabil i ty of collisional excitation to the 2Ds/2 level because it is the closest al lowed level for excitation. Since the transit ion f rom this excited level to the level 1 is forb idden and hence the electrons f rom this excited level may deexcite to
* On leave from D.N. College, Gulaothi 245 408, India.
Solar Physics 75 (1982) 133-137. 0038-0938/82/0751-0133 $00.75. Copyright �9 1982 by D. Reidel Publishing Co., Dordrecht, Holland, and Boston, U.S.A.
134 S U R E S H C H A N D R A
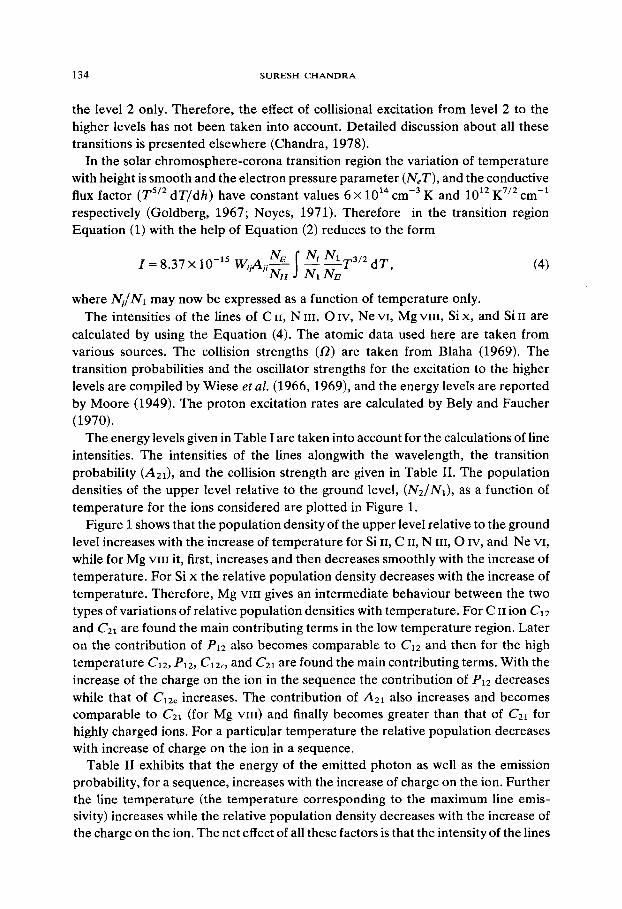
the level 2 only. Therefore, the effect of collisional excitation from level 2 to the higher levels has not been taken into account. Detailed discussion about all these transitions is presented elsewhere (Chandra, 1978).
In the solar chromosphere-corona transition region the variation of temperature with height is smooth and the electron pressure parameter (NET), and the conductive flux factor (T 5/2 dT/dh) have constant values 6 x 1014 cm -3 K and 1012 K 7/2 cm -1
respectively (Goldberg, 1967; Noyes, 1971). Therefore in the transition region Equation (1) with the help of Equation (2) reduces to the form
I = 8.37 x 10 -xs W N~ ~ Nj N1T3/2 v t A j i ~ J N1 N~ d T , (4)
where Ni/N1 may now be expressed as a function of temperature only. The intensities of the lines of C iI, N ni, O iv, Ne vi, Mg vni , Si x, and Si n are
calculated by using the Equation (4). The atomic data used here are taken from various sources. The collision strengths (/2) are taken from Blaha (1969). The transition probabilities and the oscillator strengths for the excitation to the higher levels are compiled by Wiese et al. (1966, 1969), and the energy levels are reported by Moore (1949). The proton excitation rates are calculated by Bely and Faucher (1970).
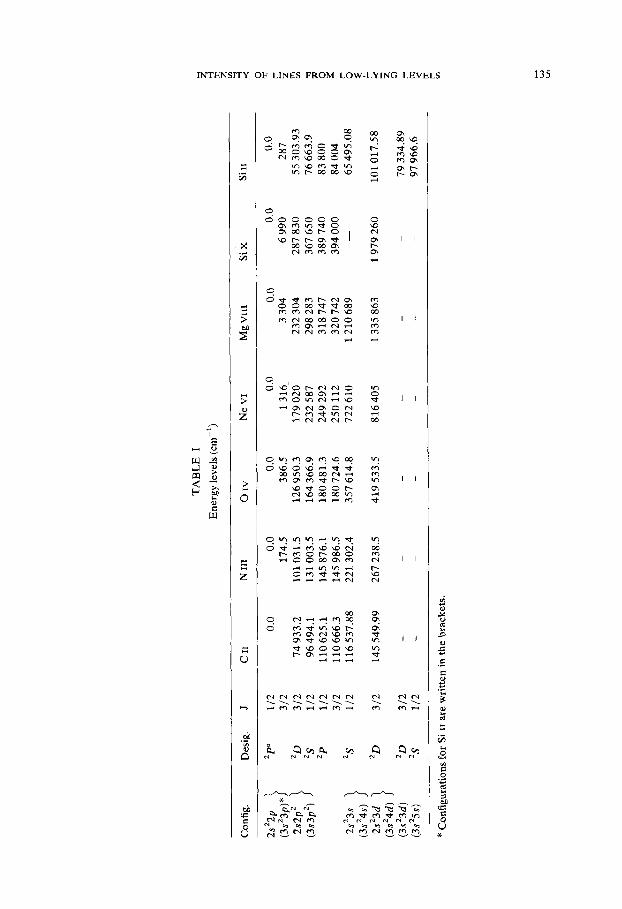
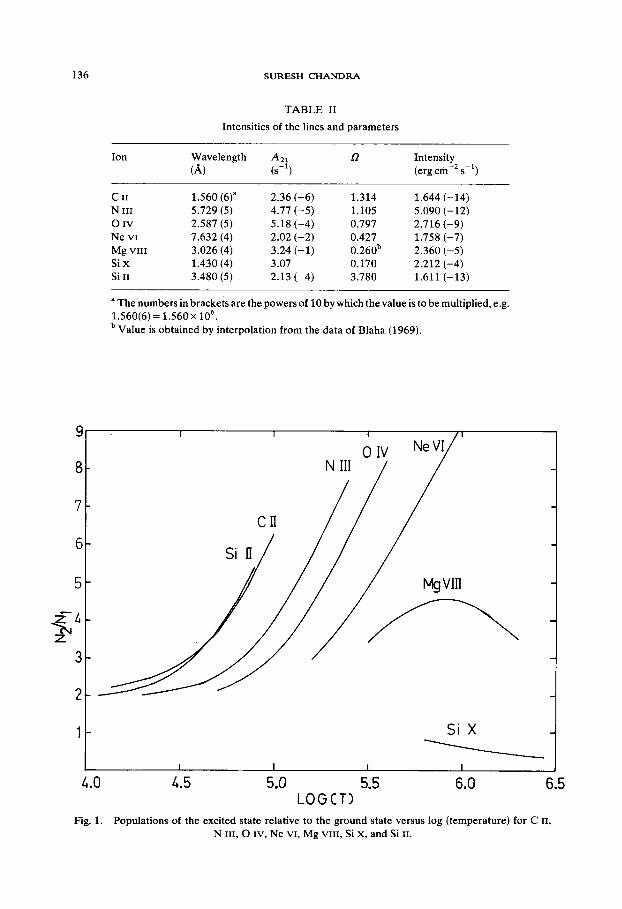
The energy levels given in Table I are taken into account for the calculations of line intensities. The intensities of the lines alongwith the wavelength, the transition probability (A21), and the collision strength are given in Table II. The population densities of the upper level relative to the ground level, (N2/N1), as a function of temperature for the ions considered are plotted in Figure 1.
Figure 1 shows that the population density of the upper level relative to the ground level increases with the increase of temperature for Si n, C II, N tlI, O IV, and Ne vI, while for Mg viii it, first, increases and then decreases smoothly with the increase of temperature. For S i x the relative population density decreases with the increase of temperature. Therefore, Mg viii gives an intermediate behaviour between the two types of variations of relative population densities with temperature. For C iI ion C12 and C2~ are found the main contributing terms in the low temperature region. Later on the contribution of P12 also becomes comparable to C~2 and then for the high temperature C12, P12, C12o and C21 are found the main contributing terms. With the increase of the charge on the ion in the sequence the contribution of P12 decreases while that of C12c increases. The contribution of A21 also increases and becomes comparable to C21 (for Mg viii) and finally becomes greater than that of C2~ for highly charged ions. For a particular temperature the relative population decreases with increase of charge on the ion in a sequence.
Table II exhibits that the energy of the emitted photon as well as the emission probability, for a sequence, increases with the increase of charge on the ion. Further the line temperature (the temperature corresponding to the maximum line emis- sivity) increases while the relative population density decreases with the increase of the charge on the ion. The net effect of all these factors is that the intensity of the lines
TA
BL
E
I
En
erg
yle
vel
s (c
m
x)
Con
fig.
D
esig
. J
C I
r N
III
O
Iv
N
e v
i M
g vH
t S
ix
Si ii
2s22
p \
2po
1/2
0.0
0.0
0.0
0.0
0.0
0.0
0.0
(3s2
3p)*
J 3
/2
174.
5 38
6.5
1 31
6 3
304
6 99
0 28
7 2
s2p
2
\ 2D
3
/2
74 9
33.2
10
1 03
1.5
126
950.
3 17
9 02
0 23
2 30
4 28
7 83
0 55
303
.93
(3s3
p 2)
J
2S
1/2
96 4
94.1
13
1 00
3.5
164
366.
9 23
2 58
7 29
8 28
3 36
7 65
0 76
663
.9
2p
1/2
11
0 62
5.1
145
876.
1 18
0 48
1.3
249
292
318
747
389
740
83 8
00
3/2
11
0 66
6.3
145
986.
5 18
0 72
4.6
250
112
320
742
394
000
84 0
04
2sZ3
s ),
~S
1/2
116
537.
88
221
302.
4 35
7 61
4.8
722
610
1 21
0 68
9 --
65
495
.08
(3s2
4s)
f 2s
23d
~ 2D
3
/2
145
549.
99
267
238.
5 41
9 53
3.5
816
405
1 33
5 86
3 1
979
260
101
017.
58
(3s2
4d)
f (3
s23d
) 2D
3
/2
..
..
79
334
.89
(3s2
5s)
26'
1/2
..
..
.
97 9
66.6
,-]
o 0 o m
* C
onfi
gura
tion
s ~o
r Si
II
are
wri
tten
in
the
brac
kets
.
136 S U R E S H CI - tANDRA
TABLE II
Intensities of the lines and parameters
Ion Wavelength A21 ~O Intensity (~) (s -1) (erg crn -2 s -1)
C n 1.560 (6) a 2.36 ( -6) 1.314 1.644 ( -14) N n I 5.729 (5) 4.77 ( -5) 1.105 5.090 ( -12) O IV 2.587 (5) 5.18 ( -4) 0.797 2.716 ( -9) Ne v i 7.632 (4) 2.02 ( -2) 0.427 1.758 ( -7) Mg vi i i 3.026 (4) 3.24 ( -1) 0.260 b 2.360 ( -5) S i x 1.430 (4) 3.07 0.170 2.212 ( -4) Si IX 3.480 (5) 2.13 ( -4) 3.780 1.611 ( -13)
a The numbers in brackets are the powers of 10 by which the value is to be multiplied, e.g. 1.560(6) = 1.560 x 10⁶. b Value is obtained by interpolation from the data of Blaha (1969).
9
8
7
6
5
4.0
Fig. 1.
I I I I
Si X
I 1 I I
4.5 5.0 5.5 6.0 6.5 LOGCT)
Populations of the excited state relative to the ground state versus log (temperature) for C II, N Ill, O IV, Ne vI, Mg vnI , Si x, and S i n .
INTENSITY OF LINES FROM LOW-LYING LEVELS 137
increases with the increase of charge on the ion. These intensities are independent of electron density as the electron pressure is taken to be constant.
Present intensities invalid my previous results for intensities only (Chandra, 1978) as those are found erroneous (due to computation) by the author himself.
Acknowledgements
I am grateful for the kind hospitality of Prof. Dr G. Elwert and his colleagues at Tiibingen University. I am thankful to Dr Udit Narain for his encouragements. Financial support by Alexander von Humboldt Foundation in the form of fellowship is thankfully acknowledged. I am also thankful to the learned referee for improving the manuscript.
References
Bely, O. and Faucher, P.: 1970, Astron. Astrophys. 6, 88. Blaha, M.: 1969, Astron. Astrophys. 1, 42. Chandra, S.: 1978, $olarPhys. 58, 291. Chandra, S.: 1979, Physica 98C, 146. Chandra, S. and Dularey, R.: 1980, J. Quant. Spectrosc. Radiat. Transfer 23, 585. Dupree, A. K.: 1972, Astrophys. J. 178, 527. Goldberg, L.: 1967, Ann. Rev. Astron. Astrophys. 5, 279. Jordan C.: 1969, Monthly Notices Roy, Astron. $oc. 142, 501. Moore, C. E.: 1949, Atomic Energy Levels, Vol. I, NBS 467, U.S. Government Printing Office,
Washington, D.C. Noyes, R. W.: 1971, Ann. Rev. Astron. Astrophys. 9, 209. Pottasch, S. R.: 1963, Astrophys. J. 137, 945. Wiese, W. L., Smith, M. W., and Glennon, B. M.: 1966, Atomic Transition Probabilities, Vol. I,
NSRDS-NBS 4, U.S. Government Printing Office, Washington, D.C. Wiese, W. L., Smith, M. W., and Miles, B. M.: 1969, Atomic Transition Probabilities, Vol. II, NSRDS-NBS
22, U.S. Government Printing Office, Washington, D.C.


![lying Inn]]](https://img.pdfslide.net/doc/110x75/577d2f881a28ab4e1eb1fb5b/lying-inn.jpg)