Embed Size (px)
Citation preview
1
Intent to purchase a plug-in electric vehicle:
A survey of early impressions in large U.S. cites
Sanya Carleya,*
, Rachel M. Krauseb, Bradley W. Lane
b, John D. Graham
a
a School of Public and Environmental Affairs, Indiana University, Bloomington, IN 47408
b Masters of Public Administration Program, The University of Texas at El Paso, El Paso, TX
79902
* Corresponding author: [email protected], 812-856-0920
Abstract
This paper examines consumer stated intent to purchase plug-in electric vehicles (PEVs) and
assesses the factors that increase or decrease interest. It utilizes a survey of 2,302 adult drivers in
21 large U.S. cities. The survey occurred in early fall 2011, before vehicle manufacturers and
dealers began information and marketing campaigns, and thus serves to document early
impressions of this emerging transport technology. The central finding of the analysis is that,
given current battery technology and public perceptions, overall stated intent to purchase or lease
PEVs is low. Interest in plug-in hybrid technology is somewhat greater than interest in all-
electric technology. Consumers who express early interest in adopting electric vehicles are
typically highly educated, previous owners of conventional hybrids, environmentally sensitive,
and concerned about dependence on foreign oil. Enhanced fuel economy, the primary tangible
advantage of plug-in technology, is recognized as favorable by respondents but fails to exert a

2
strong influence on purchasing intentions. Each of the known drawbacks of plug-in vehicles –
initial cost, recharging time, and limiting driving range – is associated with diminished interest.
In light of the formidable barriers to their commercialization, the paper concludes with a
discussion of some strategies that government and industry can pursue to advance market
penetration of first-generation PEVs.
Keywords
Electric vehicles; Transportation; Technological competition; Public policy; Policy incentives

3
1. Introduction
In 2009 the U.S. federal government highlighted electricity as a promising alternative to
petroleum in the transportation sector, and established a national goal of putting one million
plug-in vehicles on the road by 2015 (Kriz, 2009). Since then, electric vehicles and their
supporting industries have attracted significant policy support. Federal fleet-wide mileage
standards are scheduled to increase from 35.5 miles per gallon in 2016 to 54.5 miles per gallon in
2025, with specific compliance provisions that encourage manufacturers to offer plug-in vehicles
(US DOT, 2011). The modified Zero Emission Vehicle (ZEV) Program in California requires
that all major vehicle manufacturers that conduct business in California offer at least a limited
number of ZEVs for sale by 2016, and plug-in vehicles are a prominent compliance strategy
(Mitchell, 2011). Several other states, including New York, have also adopted these standards.
Additionally, $2.1 billion from the 2009 American Recovery and Reinvestment Act was
allocated as subsidies for battery manufacturing projects, vehicle component production,
construction of production facilities, and demonstration projects (US DOE, 2011). This is on top
of a 2005 Department of Energy (DOE) allocation of $9.1 billion in loan guarantees to support
green automotive technologies more generally.
Many European countries, as well as China, Japan, and South Korea, are pursuing similar
pro-plug-in vehicle policies. These initiatives are intended to help spur economic development
and gain early market shares in electric vehicle technologies, in addition to advancing
environmental goals, such as reducing urban air pollution and greenhouse gas emissions
(Transportation Electrification Panel, 2011).
As a result of regulation, government assistance, and private investments, a new electric
vehicle industry is emerging world-wide. In the U.S. market, the General Motors Corporation
4
and Nissan are pioneers with the introduction of the 2011 Volt and 2011 Leaf, respectively. The
Leaf is a plug-in electric vehicle (PEV), which runs entirely on electricity, while the Volt is a
plug-in hybrid electric (PHEV), which has both electric and gasoline propulsion systems. In
2012, Ford released the all-electric Focus and Toyota released the plug-in hybrid Prius. By 2013-
14, it is expected that all major vehicle manufacturers will offer some form of plug-in vehicle in
the U.S. market (Transport Electrification Panel, 2011). Although a small group of “early
adopters” have expressed interest in purchasing electric vehicles in the near future, it is not yet
clear whether mainstream consumers will switch from gasoline powered vehicles to those run
either entirely or partially on electricity.
This study assesses early consumer interest in plug-in electric vehicles, and is informed
by a rich literature on consumer vehicle preferences as well as a smaller but growing collection
of studies on preferences for alternative vehicles. It is important to point out that the electric
vehicle literature is still underdeveloped, as is expected given the nascence of the electric vehicle
market. Thus, this analysis draws from related literature while concurrently seeking to build a
foundation of theory and data that can inform future studies.
General vehicle purchase decisions are driven by familiarity with the product, financial
constraints or expected financial benefits, and the desire to reflect personal status, values, or self-
identity (Coad et al., 2009; Gjøen and Hård, 2002; Heffner et al., 2006; Heffner et al., 2007; Steg
et al., 2001). Consumers are also influenced by their perception of risk and preferences for
specific vehicle characteristics such as space, safety, or aesthetics. Consumers most likely to
engage in the early purchase of PEVs typically fall into one of two categories: early adopters and
niche consumers. Early adopters of alternative-fueled vehicles – including hybrids, plug-in
hybrids, and plug-in electric vehicles – have been found to be less concerned with day-to-day

5
functionality or saving money and more concerned about making environmentally beneficial
purchases or contributing to an effort to reduce dependence on foreign oil (Gallagher and
Muehlegger, 2007; Heffner et al., 2007; Kahn, 2007; Ozaki and Sevastyanova, 2011). Early
adopters of new vehicle technologies are also likely to already own another alternatively-fueled
vehicle, such as a hybrid (Gärling and Thøgersen, 2001), and enjoy the image associated with
owning state-of-the-art, advanced technologies (Heffner et al., 2007; Turrentine and Kurani,
2007). Niche consumers, on the other hand, tend to have very specific needs that drive their
consideration of vehicles. They may own and use more than one vehicle and thus a particular set
of trips could be well served by a plug-in vehicle. Together, the early adopters and niche
consumers, which are sometimes lumped into one category, may constitute up to 15% of the new
vehicle market (Rogers, 2003). The remainder is comprised of mainstream retail car buyers, who
are more reluctant to take technological risks when buying a car. They also tend to be more loyal
to a specific model, manufacturer, or vehicle characteristic, and are more sensitive to purchase
price.
The challenge for the electric vehicle industry is to build market presence and consumer
demand despite the dominance of the internal combustion engine for personal transport and over
a century of consumer use and technological, institutional, and infrastructural “lock-in” (Unruh,
2000). Mass commercialization, if it unfolds, will occur over a period of many years, with early
adopters followed by niche consumers, and then lastly the regular retail car buyer (Hawkins et
al., 1998; Rogers, 2003; Hoogma and Weber, 1998). The diffusion process may be obstructed at
any stage by technology limitations, affordability constraints, misunderstandings of consumer
demand, or mistakes in marketing practices. This process highlights the need to better understand

6
consumer attitudes, preferences, and concerns and to tailor marketing and public policies
accordingly.
This research examines early impressions of plug-in vehicles among consumers living in
large U.S. cities. It utilizes a survey of 2,302 residents from 21 of the largest cities in the U.S,
where automakers have indicated that they will target marketing efforts (Goldman Sachs, 2010;
IEA, 2009; Transport Electrification Panel, 2011). The instrument probes the degree of consumer
interest in electric vehicles and explores the factors that predict whether consumers will consider
them as their next vehicle to lease or purchase. The results provide a baseline measurement of
early consumer impressions of PEVs and can offer insights to address the marketing and policy
challenges faced by vehicle manufacturers, dealers, and proponents of plug-in vehicles as the
technology vies for market presence and maturity.
2. Methods
Data for this study were collected via an online survey administered to a random and
representative sample of 2,302 individuals over 18 years of age that have valid driver’s licenses.
Residents were sampled from 21 of the 23 largest urban areas in the U.S.; Columbus, Ohio and
Washington, DC were not included because of an insufficient number of accessible respondents.
Between 99 and 120 responses were obtained from each city. The survey instrument was
designed to elicit consumer perceptions of plug-in vehicles, as well as their general vehicle
preferences, car-purchasing behavior, travel behavior, and awareness of available public policies
that promote plug-in vehicle ownership or use. The survey underwent several rounds of pre-tests
and pilot testing to ensure that the questions were easy to understand and answer.
7
The survey was administered in September and October 20111 by Knowledge Networks,
which maintains a database of individuals recruited via random digit dialing and address-based
sampling to participate in online surveys. In exchange for their participation in various surveys,
respondents receive financial incentives that amount to approximately $2 to $6 per month.
To estimate the relationship between intent to purchase and factors that predict
consumer’s interest in PEVs, the log of interest in purchase or lease is regressed on variables
from the survey that measure personal traits, preferences about vehicle attributes, travel patterns,
familiarity with plug-in vehicles, and perceived disadvantages and advantages of plug-in
vehicles. A demographic post-stratification weight is applied to ensure that the sample is as
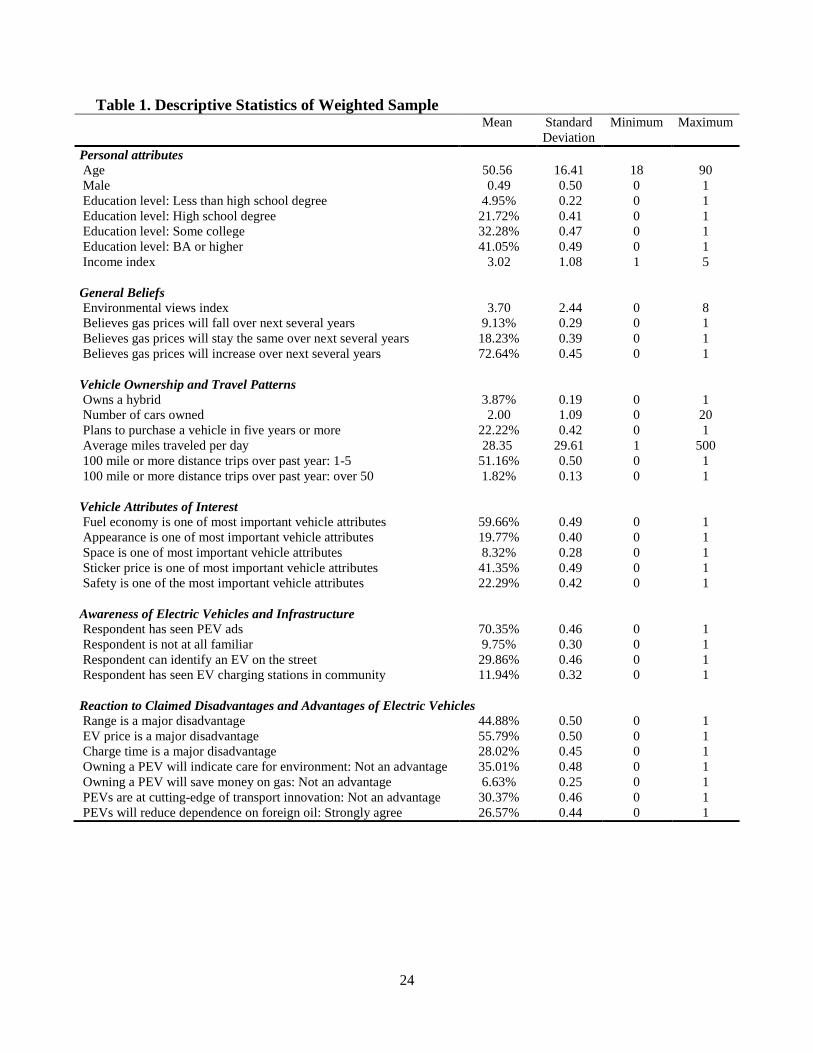
representative of the 21 cities as possible. Summary descriptive statistics are presented in Table
1.
[Insert Table 1 about here]
Survey respondents were asked to “think about their next vehicle purchase or lease” and
indicate how likely they are “to purchase or lease a plug-in electric vehicle (that does not have a
gasoline engine working with the electric motor).” Statements about intent to purchase a product
are rarely validated with data on actual purchasing decisions and, when done, the evidence for
validity is mixed (Holfmeyr, 2007). A positive response is thus better interpreted as an indication
of the consumer’s willingness to consider a new technology or product than as an indication of
future purchasing behavior. Therefore, the dependent variable reveals the extent of consumer
openness to purchasing a plug-in electric vehicle. It utilizes 10-point scale, where a rating of 10
indicates the respondent is confident that he or she is interested in a plug-in vehicle and a rating
1 Gas prices ranged between $3.24 and $3.92 per gallon across the country during this time.

8
of 1 indicates a complete lack of interest (Bemmaor, 1995). The ten point scale also allows for
the use of ordinary least squares (OLS) regression by providing sufficient variation in the
possible responses for the dependent variable.
Data for the independent variables included in the model and listed in Table 1 also come
from the survey. The income variable, the environmental index, and the importance of specific
vehicle characteristics require additional description. The income variable is an ordinal variable
for income category, ranging from 1 to 5. The categories include under $25,000, between
$25,000 and $39,999, between $40,000 and $84,999, between $85,000 and $174,999, and
$175,000 and over.
The environmental index is an additive construct comprised of four environmental
attitude statements, where respondents indicate how strongly they agreed or disagreed with the
statements. The statements include: “People need to change their lifestyles to protect the
environment”; “Climate change is a serious problem”; “Climate change is a result of human
actions”; and “Environmental problems facing humankind have been greatly exaggerated”. For
the first three statements, an answer of “strongly agree” was coded as a two and an answer of
“agree” was coded as a one. For the final statement, “strongly disagree” was coded as a two and
“disagree” was coded as a one. The index was created by adding the point values across the four
statements for each respondent.
To estimate the influence of vehicle features, respondents were provided a list of 16
typical features (e.g. fuel economy, appearance, sticker price) and asked to indicate the three
most important factors that influence their purchase or lease decision. The five most commonly
identified characteristics were included in the final model. If a respondent identified a

9
characteristic as one of his or her top three most important features, that variable was coded to
equal one and, if not, that variable was coded to equal zero.
3. Results
Plug-in electric vehicles are typically considered to include three primary disadvantages
to potential consumers: high purchase price, long recharging times, and limited driving range
(Graham-Rowe et al., 2012; Sperling, 1995). Figure 1 shows that all three of the disadvantages
are considered either a major barrier or somewhat of a barrier by a majority of our survey
respondents. More than 50% of the sample believes that the sticker price of a plug-in electric is a
major barrier to their decision to purchase or lease, whereas the length of recharging time is
viewed as the least problematic.
[Insert Figure 1 about here]
Survey respondents also considered three commonly cited advantages of plug-in vehicles:
high fuel economy and lower energy costs; a positive environmental image; and the ability to be
at the cutting edge of new vehicle technology. Figure 2 indicates that respondents consider fuel
economy as the primary advantage of plug-in vehicles: 42% of respondents believe it is a major
advantage and 36% believe it is somewhat advantageous. Respondents are less likely to view
environmental imaging and technological innovation as important advantages of plug-in
vehicles. The majority of respondents perceive that these two factors offer only a small or no
advantage at all.
10
[Insert Figure 2 about here]
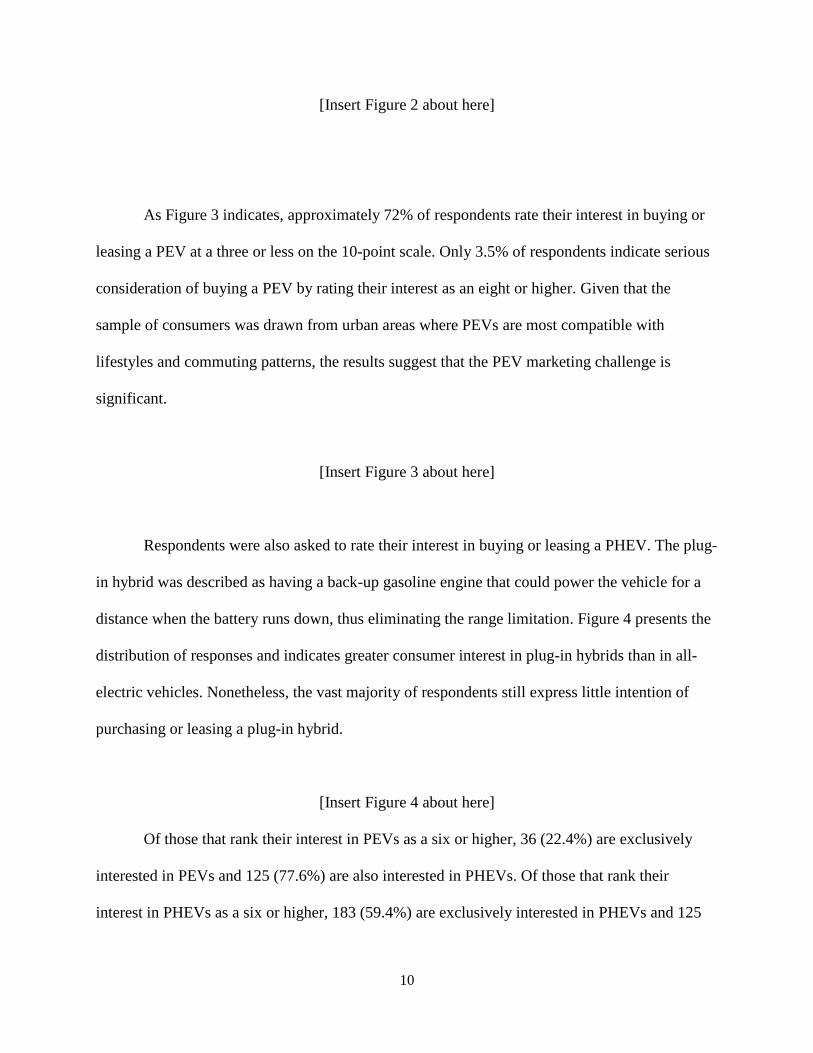
As Figure 3 indicates, approximately 72% of respondents rate their interest in buying or
leasing a PEV at a three or less on the 10-point scale. Only 3.5% of respondents indicate serious
consideration of buying a PEV by rating their interest as an eight or higher. Given that the
sample of consumers was drawn from urban areas where PEVs are most compatible with
lifestyles and commuting patterns, the results suggest that the PEV marketing challenge is
significant.
[Insert Figure 3 about here]
Respondents were also asked to rate their interest in buying or leasing a PHEV. The plug-
in hybrid was described as having a back-up gasoline engine that could power the vehicle for a
distance when the battery runs down, thus eliminating the range limitation. Figure 4 presents the
distribution of responses and indicates greater consumer interest in plug-in hybrids than in all-
electric vehicles. Nonetheless, the vast majority of respondents still express little intention of
purchasing or leasing a plug-in hybrid.
[Insert Figure 4 about here]
Of those that rank their interest in PEVs as a six or higher, 36 (22.4%) are exclusively
interested in PEVs and 125 (77.6%) are also interested in PHEVs. Of those that rank their
interest in PHEVs as a six or higher, 183 (59.4%) are exclusively interested in PHEVs and 125

11
(40.6%) are interested in both. The correlation between respondents’ rankings of intent to
purchase a plug-in and plug-in hybrid is 0.74.
Early impressions of the plug-in electric vehicle vary somewhat in cities around the
country, as demonstrated in Table 2. Cities with the highest ratings of intent to purchase include
San Jose/San Francisco, Chicago, Boston, and Seattle; cities with the lowest ratings include
Dallas/Fort Worth, San Antonio, Indianapolis, and Detroit.
[Insert Table 2 about here]
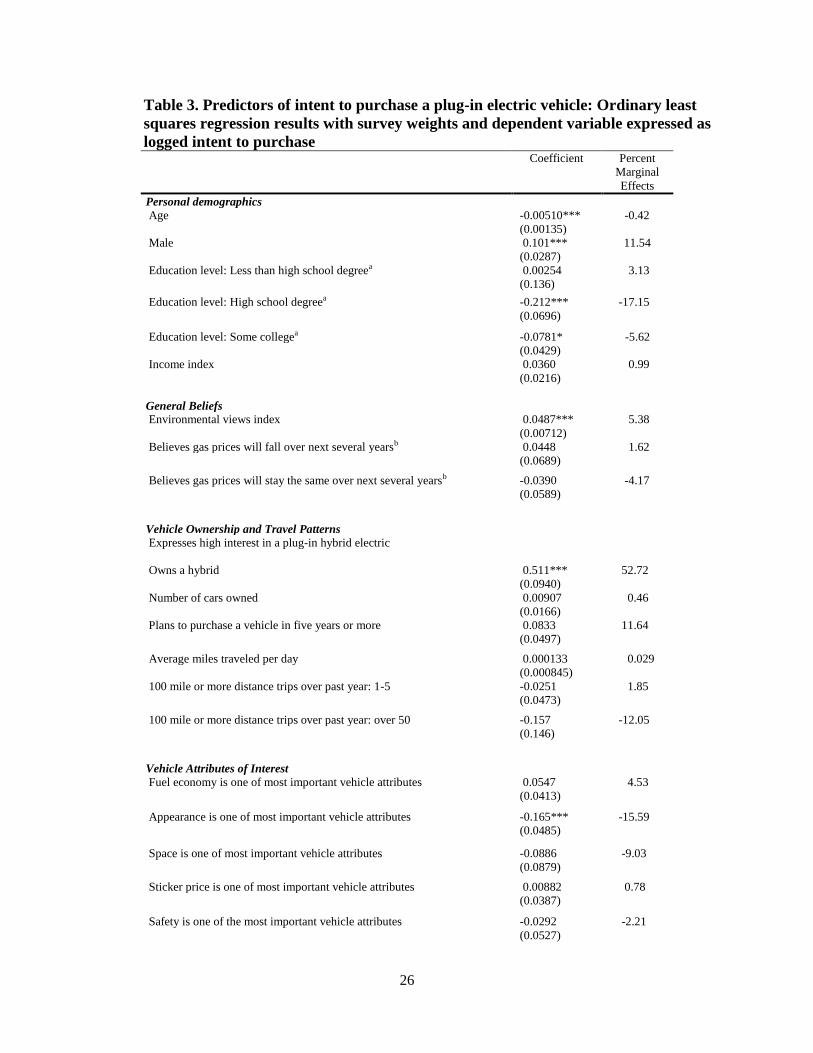
Table 3 presents model results, as well as marginal effects, which are reported as percent
change effects using the Kennedy Transformation.
[Insert Table 3 about here]
Several demographic variables are strong predictors of intent to purchase. All else equal,
for each additional year of age, respondents are 0.42% less interested in purchasing a plug-in
vehicle. On average, men are 11.5% more interested than women, holding all else constant.
Lower levels of education decrease interest in purchase. Those with a high school degree and
some college are 17.1% and 5.6% less interested, respectively, than those with a bachelor’s
degree or higher. Income is not significantly related to stated intent to purchase. Stronger
environmental attitudes are associated with greater interest in plug-in vehicles. Respondents’
personal forecasts of future fuel costs (i.e. whether prices will go up or down) does not help
predict their interest in a plug-in vehicle.

12
Those who currently own a hybrid vehicle are significantly more interested in plug-in
vehicles. Neither the number of cars the respondent owns nor the number of years until their next
vehicle purchase is associated with expressed interest levels. Respondents’ general preferences
for vehicle attributes are not associated with interest in a plug-in vehicle, except for vehicle
appearance, which has a negative effect. Respondents’ self-reported travel behavior and driving
patterns likewise do not predict intent to purchase. The only informational or awareness variable
that has a significant effect is if the respondent has seen recharging stations in their community.
The most influential predictors are the variables estimating respondent perception of the
advantages and disadvantages of plug-in vehicles. All perceived disadvantages and advantages of
plug-in vehicles are statistically significant at α = .05, with one exception: the advantages
associated with fuel economy. Despite the high proportion of respondents that rank fuel economy
as a major advantage of plug-in vehicles, this factor does not help predict interest. Strong
concerns about recharging time, driving range, and up-front cost decrease the stated intent to
purchase or lease a plug-in vehicle by 16.9%, 16.8%, and 10.6%, respectively. Beliefs that
purchasing a plug-in vehicle will reduce dependence on foreign oil, provide a benefit associated
with technological innovation, or have an environmental imaging effect increase a respondent’s
intent to purchase by 21.6%, 16.4%, and 9.2%, respectively.
4. Discussion
This analysis reveals that, as of late 2011, the stated intent of U.S. urban drivers to
purchase plug-in vehicles is low. Interest in PEVs is shaped primarily by consumers’ perceptions
of electric vehicle disadvantages. The cost premium, range limitations, and recharging time of
PEVs are all perceived as disadvantages and are significantly associated with decreased intent to

13
purchase. Individuals that express the greatest interest, the “early adopters,” are likely to be
highly educated, environmentally-sensitive individuals who believe it is important to reduce
dependence on foreign oil, and who already own a conventional hybrid. Interest may also be
encouraged by the visible presence of recharging stations in the community. These results are
generally consistent with previous findings from focus groups and previously conducted limited
surveys (e.g., Gallagher and Muehlegger, 2011; Gärling and Thøgersen, 2001; Heffner et al.,
2007; Kahn, 2007; Kurani and Turrentine, 2007; Ozaki and Sevastyanova, 2011).
The results indicate substantial overlap in consumer interest in the different types of plug-
in vehicles; only a small group of respondents are exclusively interested in all-electric plug-in
vehicles. At this early stage of commercialization, it appears that the early adopter community
for the plug-in hybrid is somewhat larger than for the all-electric vehicle. The overlap in
consumer interest also suggests that consumers are not yet thinking of these different vehicles as
substitutes for each other.
These results further demonstrate some notable variation in interest in electric vehicles
across major U.S. cities. The results suggests that it may be more cost-effective for government
and industry to concentrate marketing resources and recharging stations in cities where there are
more consumers that appear to be receptive to plug-in vehicles. Some cities may have higher
intent to purchase ratings, however, because their residents have already been exposed to more
detailed information and education on electric vehicles. Future research should examine this
finding further since there is not enough information available at this time to clearly identify the
causal mechanism between city-level electric vehicle support and urban dwellers’ intent to
purchase these vehicles.
14
The finding that fuel economy advantage does not elevate purchase probability is
consistent with some previous literature. Although the majority of consumers state that fuel
economy is a major factor in their vehicle purchasing decisions (Power, 2010; Synovate, 2010),
they infrequently make actual purchasing decisions based on fuel economy, perhaps due to their
tendency to incorrectly gauge the size of fuel economy benefits (Heffner et al., 2007; Kurani and
Turrentine, 2007), or due to a common perception that fuel economy connotes “cheap” or “light”
(Kurani and Turrentine, 2007). These factors may explain why respondents appeared to
significantly underestimate the magnitude of savings in energy costs.
One of the key tangible advantages of owning a plug-in vehicle is the energy cost savings
associated with running the vehicle on electricity rather than gasoline. Each mile of travel with
electricity will cost 60-80% less than a mile with gasoline, given current power and fuel prices,
and gasoline prices are expected to rise faster than electricity in the U.S. Our results indicate,
however, that respondents either do not value this benefit very highly or are unaware of these
potential cost savings. If the latter, the economic advantages of electric vehicles could be further
highlighted in marketing and policy campaigns. The Environmental Protection Agency is also
implementing new consumer labels for new cars that are designed to convey fuel economy and
fuel expenditures in a more compelling way (Meier and Woodyard, 2011; Roland, 2011), which
could advantage the electric vehicle industry.
The results indicate that the perceived disadvantages of plug-in electric vehicles are
significant deterrents to intent to purchase, while the advantages of the vehicles are not weighted
as heavily. Many of these deterrents can be addressed via public policy or private investment.
For example, range anxiety could be addressed by increasing the number and visibility of public
charging stations. Although the number of public electric charging stations has grown from less

15
than 1,000 in April 2011 to 4,153 in August, 2012, they still remain limited compared to the
160,000 gasoline stations in the United States (U.S. DOE, 2012). Concentrating recharging
stations in a limited number of communities may boost commercialization to a greater extent
than spreading a small number of stations in numerous communities. Recharging time can also
be addressed by subsidizing further the cost of high-voltage charging equipment and working to
make other technologies, such as superfast charging systems or battery pack swaps, more
economically efficient. Another way to address range anxiety is to provide full information about
the differences between PEVs and PHEVs, where the full driving range of a PHEV is equivalent
to gasoline-powered vehicles.
The substantial investment in electric vehicle research and development currently
underway will likely help lower the purchase cost and improve the performance of plug-in
vehicle technologies over time. Given that respondents demonstrated notable concern about the
purchase cost of these vehicles, additional subsidies may be needed beyond the existing federal
tax credit and other incentives available in some states to encourage faster rates of uptake. The
survey results also indicated, however, that respondents are often not aware of such incentives,
including both financial and other inducements such as the high occupancy vehicle (HOV) lane
access, and so it may be additionally important to provide full information about these programs
to potential electric car buyers.
5. Conclusion
While the federal government and countries across the world are making significant
investments in the emerging electric vehicle industry, consumer interest in plug-in vehicles thus
far remains quite low. The results of this analysis highlight that the significant drawbacks to

16
plug-in vehicles must be addressed in order for them to penetrate beyond the relatively small
early adopter market.
Although our findings may be discouraging to plug-in vehicle enthusiasts, they are not
entirely unexpected. To consumers, the plug-in electric is an unconventional and potentially
risky purchase (Gärling and Thøgersen, 2001), which primarily yields public rather than private
benefits. Active marketing and information campaigns by governments, vehicle manufacturers,
and vehicle dealers are likely necessary to counter the early negative impressions this analysis
has documented. Although consumer interest in electric vehicles is low, it should be noted that,
despite more than 20 years of marketing efforts, conventional hybrid vehicles account currently
for less than 3% of new passenger-vehicle sales in the United States. If plug-in vehicles could
capture 1 to 2% of the new-vehicle market in the United States, the result would be sales of
150,000-300,000 units per year, which is enough to begin the development of a new industry.
(Transport Electrification Panel, 2011).
Acknowledgements
The authors would like to acknowledge valuable research assistance support from Jon Sperl,
Natalie Messer, and Devin Hartman.
17
References
Allen, L., 2009. Better Place’s Plan: Sell Inexpensive Mid-Sized EV. Automotive News.
(December 21).
<http://www.autonews.com/apps/pbcs.dll/article?AID=/20091221/RETAIL03/31221998
2/1186> (accessed 20.03.12).
Bemmaor, A., 1995. Predicting Behavior from Intention-to-Buy Measures: The Parametric Case.
Journal of Marketing Research 32, 176-191.
Coad, A., de Haan, P., Woersdorfer, J.S., 2009. Consumer support for environmental policies:
An application to purchases of green cars. Ecological Economics 68, 2078-2086.
Deloitte Global Services Limited, 2011. Unplugged: Electric vehicle realities versus consumer
expectations. Industry research report. <http://www.deloitte.com/assets/Dcom-
Global/Local%20Assets/Documents/Manufacturing/dttl_Unplugged_Global%20EV_09_
21_11.pdf> (accessed 20.03.12).
Gallagher K.S., Muehlegger E., 2011. Giving green to get green? Incentives and consumer
adoption of hybrid vehicle technology. Journal of Environmental Economics and
Management 61, 1-15.
Gärling A., Thøgersen, J., 2001. Marketing of electric vehicles. Business Strategy and the
Environment 10, 53-65.
Gjøen, H., Hård, M., 2002. Cultural politics in action: developing user scripts in relation to the
electric vehicle. Science, Technology, and Human Values 27, 262-281.
Goldman Sachs, 2010. Americas: Clean Energy: Energy Storage. Industry research report.
Global Investment Research Division.
<http://www.eosenergystorage.com/articles/GSBatteryReport2010-06-29.pdf)> (accessed
20.03.12).
Graham-Rowe, E., Gardner, B., Abraham, C., Skippon, S., Dittmar, H., Hutchins, R., Stannard,
J., 2012. Mainstream consumers driving plug-in battery-electric and plug-in hybrid
electric cars: A qualitative analysis of responses and evaluations. Transportation
Research Part A 46, 140-153.
Hawkins, D.I., Best, R.J., Coney, K.A., 1998. Consumer behavior: Building market strategy.
McGraw-Hill, Boston.
Heffner R.R., Kurani, K., Turrentine, T.S., 2007. Symbolism in California’s early market for
hybrid electric vehicles. Transportation Research Part D 12: 396-413.
Heffner, R.R., Kurani, K., Turrentine, T.S., 2006. A Primer on Automobile Semiotics. White
paper. Institute of Transportation Studies, University of California, Davis.
<http://escholarship.org/uc/item/3577d04p)> (accessed 20.03.12).

18
Sovacool, B.K., Hirsh, R.F., 2009. Beyond batteries: An examination of the benefits and barriers
to plug-in hybrid electric (PHEVs) and vehicle-to-grid (V2G) transition. Energy Policy
37, 1095-1103.
Hofmeyr, J., 2007. Getting Real about Prediction in Marketing Research. White paper. Synovate
Marketing Research. <http://www.synovate.com/consumer-
insights/publications/whitepapers/20071207/doc/Synovate-White-Paper-Getting-Real-
About-Prediction-in-Marketing-Research-20071207.pdf)> (accessed 20.03.12).
Hoogma, R., Weber, M., 1998. Beyond national and technological styles of innovation diffusion:
a dynamic perspective on cases from the energy and transport sectors. Technology
Analysis and Strategic Management 10, 545-566.
International Energy Agency, 2009. Technology Roadmap: Electric and Plug-In Hybrid Electric
Vehicles. White paper. Directorate of Sustainable Energy Policy and Technology, Paris.
http://www.iea.org/papers/2011/EV_PHEV_Roadmap.pdf) (accessed 20.03.12).
Kahn, M.E., 2007. Do greens drive Hummers or hybrids? Environmental ideology as a
determinant of consumer choice. Journal of Environmental Economics and Management
54, 129-145.
Kriz, M., 2009 May 1. Is Obama’s Goal of Putting One Million Plug-In Hybrids on the Road by
2015 Achievable? National Journal. (May 1). < http://www.highbeam.com/doc/1G1-
199040966.html> (accessed 20.03.12).
Kurani, K.S., Turrentine, T.S., 2007. Car buyers and fuel economy? Energy Policy 35, 1213-
1223.
Menanteau, P., Lefebvre, H., 2000. Competing technologies and the diffusion of innovations: the
emergence of energy-efficient lamps in the residential sector. Research Policy 29, 375-
389.
Michalek, J.J., Chester, M., Jaramillo, P., Samaras, C., Shiau, C.N., Lave, L.B., 2011. Valuation
of plug-in vehicle life-cycle air emissions and oil displacement benefits. Proceedings of
the National Academy of Sciences 108, 16554-16558.
Mitchell, J., 2011. Emissions Plan Jolts Auto Firms. Wall Street Journal. (June 11), p. B3.
Ozaki, R., Sevastyanova, K., 2011. Going hybrid: An analysis of consumer purchase
motivations. Energy Policy 39, 2217-2227.
Power, J.D. and Associates, 2010. Drive Green 2020: More Hope Than Reality? McGraw-Hill
Companies, New York.
Rogers, E.M., 2003. Diffusion of Innovations (5th
ed.) Free Press, New York.

19
Roland, N., 2011. EVs and Hybrids Top Consumer Group’s List, Automotive News. (June 6).
<http://www.autonews.com/apps/pbcs.dll/article?AID=/20110606/OEM05/306069962/1
261&template=printart> (accessed 20.03.12).
Transport Electrification Panel Members, Faculty, and Staff, 2011. Plug-in Electric Vehicles: A
Practical Plan for Progress. Report of an expert panel, School of Public and
Environmental Affairs, Indiana University, Bloomington, Indiana.
<http://www.indiana.edu/~spea/pubs/TEP_combined.pdf>. (accessed 20.03.12).
Smith, R., 2010. California’s Costly Electric Car. Wall Street Journal. (June 16).
<http://online.wsj.com/article/SB20001424052748703513604575310702985839306.html
> (accessed 20.03.12).
Sperling, D., 1995. Future Drive: Electric Vehicles and Sustainable Transportation. Island Press,
Washington, D.C.
Steg, L., Vlek, C., Slotegraaf, G., 2001. Instrumental-reasoned and symbolic-affective motives
for using a motor car. Transportation Research F 4, 151-169.
Synovate Motoresearch, Ltd., 2010. From Nozzle to Plug: The Electrification of the Fleet.
Industry research report.
Unruh, G.C., 2000. Understanding carbon lock-in. Energy Policy 28, 817-830.
US Department of Energy (DOE), 2011. One Million Electric Vehicles by 2015. Status Report.
US DOE, Washington, D.C.
<http://www1.eere.energy.gov/vehiclesandfuels/pdfs/1_million_electric_vehicles_rpt.pdf
> (accessed 20.03.12).
US Department of Energy (DOE), 2012. Electric Vehicle Charging Station Locations.
Alternative Fuel Data Center.
<http://www.afdc.energy.gov/fuels/electricity_locations.html> (accessed 08.08.12).
US Department of Transportation (US DOT), 2011. Federal Register 76, 48758-48769. <
http://www.gpo.gov/fdsys/pkg/FR-2011-08-09/html/2011-19905.htm> (accessed
20.03.12).
Welsh, J., 2012. GM Will Stop Building Volt Plug-in to Cut Inventory. Wall Street Journal.
March 2, 2012. <http://blogs.wsj.com/drivers-seat/2012/03/02/gm-will-stop-building-
volt-plug-in-to-cut-inventory/> (accessed 20.03.12).
Woodyard, C., Meier, F., 2011. Car Fuel Economy Labels Are Changing. USA Today. (May 26),
p. 2B.

20
Tables and Figures
Figure 1. Degree to which respondents believe that claimed disadvantages of plug-in
electric vehicles are a barrier to their decision to purchase or lease
0%
10%
20%
30%
40%
50%
60%
Majordisadvantage
Somewhat adisadvantage
Smalldisadvantage
Not adisadvantage
Range
Price
Charge time
21
Figure 2. Degree to which respondents believe that the claimed benefits of plug-in electric
vehicles are an advantage
0%
5%
10%
15%
20%
25%
30%
35%
40%
45%
Majoradvantage
Somewhat anadvantage
Smalladvantage
Not anadvantage
Environmentalimage
Technologicalinnovation
Fuel economy
22
Figure 3. Likelihood of plug-in electric vehicle purchase, distribution of respondents, where
1 is not likely at all and 10 is highly likely
0
200
400
600
800
1000
1200
1 2 3 4 5 6 7 8 9 10
0%
20%
40%
60%
80%
100%
120%
Number ofrespondents
Cumulativepercent

23
Figure 4. Likelihood of plug-in hybrid electric vehicle purchase, distribution of
respondents, where 1 is not likely at all and 10 is highly likely
0%
20%
40%
60%
80%
100%
120%
0
100
200
300
400
500
600
700
800
1 2 3 4 5 6 7 8 9 10
Number ofrespondents
Cumulativepercent
24
Table 1. Descriptive Statistics of Weighted Sample Mean
Standard
Deviation
Minimum Maximum
Personal attributes
Age 50.56 16.41 18 90
Male 0.49 0.50 0 1
Education level: Less than high school degree 4.95% 0.22 0 1
Education level: High school degree 21.72% 0.41 0 1
Education level: Some college 32.28% 0.47 0 1
Education level: BA or higher 41.05% 0.49 0 1
Income index 3.02 1.08 1 5
General Beliefs
Environmental views index 3.70 2.44 0 8
Believes gas prices will fall over next several years 9.13% 0.29 0 1
Believes gas prices will stay the same over next several years 18.23% 0.39 0 1
Believes gas prices will increase over next several years 72.64% 0.45 0 1
Vehicle Ownership and Travel Patterns
Owns a hybrid 3.87% 0.19 0 1
Number of cars owned 2.00 1.09 0 20
Plans to purchase a vehicle in five years or more 22.22% 0.42 0 1
Average miles traveled per day 28.35 29.61 1 500
100 mile or more distance trips over past year: 1-5 51.16% 0.50 0 1
100 mile or more distance trips over past year: over 50 1.82% 0.13 0 1
Vehicle Attributes of Interest
Fuel economy is one of most important vehicle attributes 59.66% 0.49 0 1
Appearance is one of most important vehicle attributes 19.77% 0.40 0 1
Space is one of most important vehicle attributes 8.32% 0.28 0 1
Sticker price is one of most important vehicle attributes 41.35% 0.49 0 1
Safety is one of the most important vehicle attributes 22.29% 0.42 0 1
Awareness of Electric Vehicles and Infrastructure
Respondent has seen PEV ads 70.35% 0.46 0 1
Respondent is not at all familiar 9.75% 0.30 0 1
Respondent can identify an EV on the street 29.86% 0.46 0 1
Respondent has seen EV charging stations in community 11.94% 0.32 0 1
Reaction to Claimed Disadvantages and Advantages of Electric Vehicles
Range is a major disadvantage 44.88% 0.50 0 1
EV price is a major disadvantage 55.79% 0.50 0 1
Charge time is a major disadvantage 28.02% 0.45 0 1
Owning a PEV will indicate care for environment: Not an advantage 35.01% 0.48 0 1
Owning a PEV will save money on gas: Not an advantage 6.63% 0.25 0 1
PEVs are at cutting-edge of transport innovation: Not an advantage 30.37% 0.46 0 1
PEVs will reduce dependence on foreign oil: Strongly agree 26.57% 0.44 0 1

25
Table 2. Intent to purchase a plug-in electric vehicle, city averages on a 10-point scale City Average Intent to Purchase
Rating
Observations
San Jose/San Francisco, CA 3.72 110
Chicago, IL 3.25 103
Boston, MA 3.03 114
Seattle, WA 3.02 106
Los Angeles, CA 3.01 102
Austin, TX 2.95 113
San Diego, CA 2.93 103
El Paso, TX 2.75 99
Houston, TX 2.70 100
Phoenix, AZ 2.66 103
Charlotte, NC 2.63 109
Philadelphia, PA 2.54 106
New York, NY 2.52 116
Baltimore, MD 2.42 103
Jacksonville, FL 2.42 114
Memphis, TN 2.37 103
Nashville, TN 2.36 118
Detroit, MI 2.24 111
Indianapolis, IN 2.21 111
San Antonio, TX 2.21 100
Dallas/Fort Worth, TX 2.17 120
Average across all cities 2.67 108
26
Table 3. Predictors of intent to purchase a plug-in electric vehicle: Ordinary least
squares regression results with survey weights and dependent variable expressed as
logged intent to purchase Coefficient Percent
Marginal
Effects
Personal demographics
Age -0.00510*** -0.42
(0.00135)
Male 0.101*** 11.54
(0.0287)
Education level: Less than high school degreea 0.00254 3.13
(0.136)
Education level: High school degreea -0.212*** -17.15
(0.0696)
Education level: Some collegea -0.0781* -5.62
(0.0429)
Income index 0.0360 0.99
(0.0216)
General Beliefs
Environmental views index 0.0487*** 5.38
(0.00712)
Believes gas prices will fall over next several yearsb 0.0448 1.62
(0.0689)
Believes gas prices will stay the same over next several yearsb -0.0390 -4.17
(0.0589)
Vehicle Ownership and Travel Patterns
Expresses high interest in a plug-in hybrid electric
Owns a hybrid 0.511*** 52.72
(0.0940)
Number of cars owned 0.00907 0.46
(0.0166)
Plans to purchase a vehicle in five years or more 0.0833 11.64
(0.0497)
Average miles traveled per day 0.000133 0.029
(0.000845)
100 mile or more distance trips over past year: 1-5 -0.0251 1.85
(0.0473)
100 mile or more distance trips over past year: over 50 -0.157 -12.05
(0.146)
Vehicle Attributes of Interest
Fuel economy is one of most important vehicle attributes 0.0547 4.53
(0.0413)
Appearance is one of most important vehicle attributes -0.165*** -15.59
(0.0485)
Space is one of most important vehicle attributes -0.0886 -9.03
(0.0879)
Sticker price is one of most important vehicle attributes 0.00882 0.78
(0.0387)
Safety is one of the most important vehicle attributes -0.0292 -2.21
(0.0527)
27
Awareness of Electric Vehicles and Infrastructure
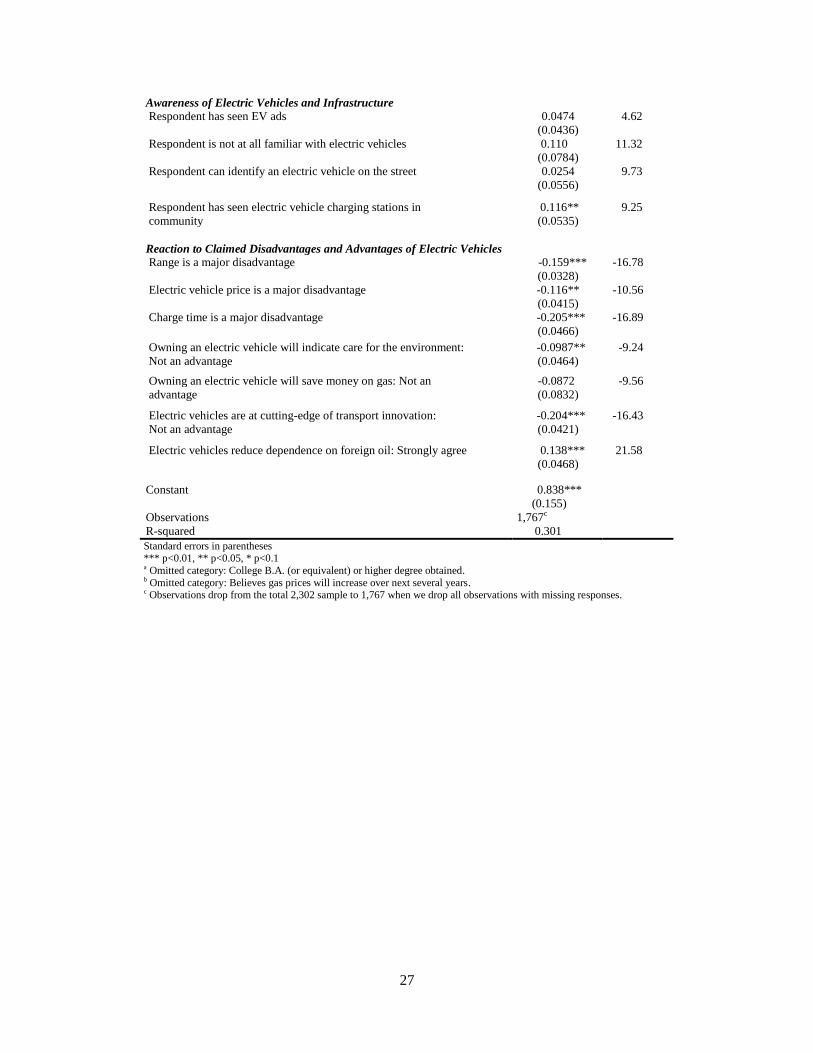
Respondent has seen EV ads 0.0474 4.62
(0.0436)
Respondent is not at all familiar with electric vehicles 0.110 11.32
(0.0784)
Respondent can identify an electric vehicle on the street 0.0254 9.73
(0.0556)
Respondent has seen electric vehicle charging stations in 0.116** 9.25
community (0.0535)
Reaction to Claimed Disadvantages and Advantages of Electric Vehicles
Range is a major disadvantage -0.159*** -16.78
(0.0328)
Electric vehicle price is a major disadvantage -0.116** -10.56
(0.0415)
Charge time is a major disadvantage -0.205*** -16.89
(0.0466)
Owning an electric vehicle will indicate care for the environment: -0.0987** -9.24
Not an advantage (0.0464)
Owning an electric vehicle will save money on gas: Not an -0.0872 -9.56
advantage (0.0832)
Electric vehicles are at cutting-edge of transport innovation: -0.204*** -16.43
Not an advantage (0.0421)
Electric vehicles reduce dependence on foreign oil: Strongly agree 0.138*** 21.58
(0.0468)
Constant 0.838***
(0.155)
Observations 1,767c
R-squared 0.301
Standard errors in parentheses
*** p<0.01, ** p<0.05, * p<0.1 a Omitted category: College B.A. (or equivalent) or higher degree obtained. b Omitted category: Believes gas prices will increase over next several years. c Observations drop from the total 2,302 sample to 1,767 when we drop all observations with missing responses.