Embed Size (px)
Citation preview
PEHRPP Geneva, 3-5 December 2007
Inter-comparison of precipitation products over Europe:
experiences, results and recommendations
Dr Chris Kidd School of Geography, Earth and Environmental Sciences,
The University of Birmingham
PEHRPP Geneva, 3-5 December 2007
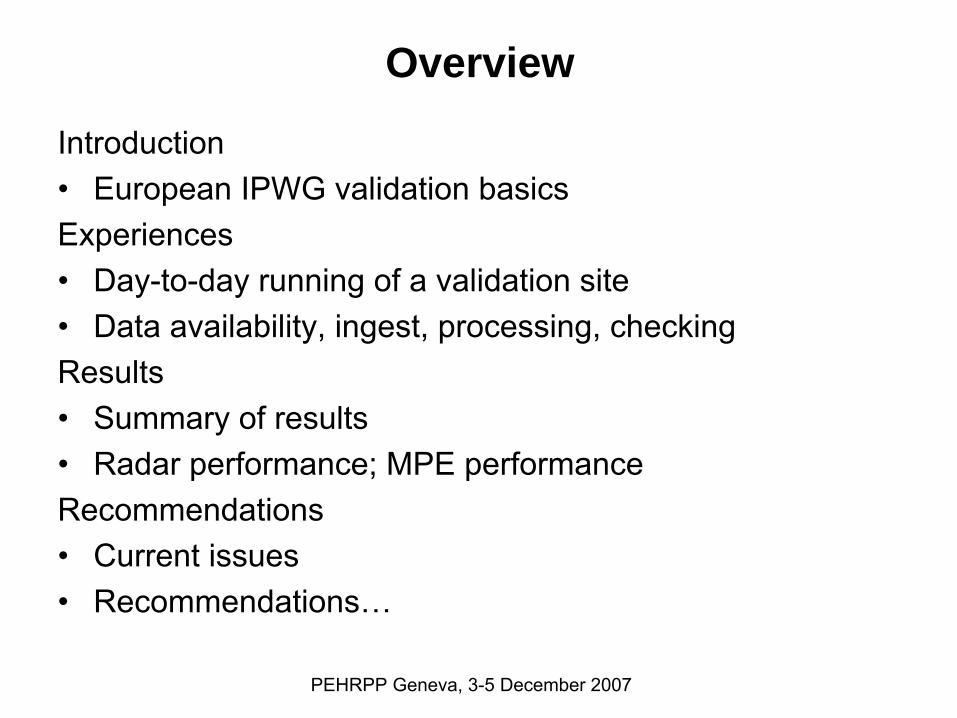
Overview
Introduction•
European IPWG validation basics
Experiences•
Day-to-day running of a validation site
•
Data availability, ingest, processing, checkingResults•
Summary of results
•
Radar performance; MPE performanceRecommendations•
Current issues
•
Recommendations…
PEHRPP Geneva, 3-5 December 2007
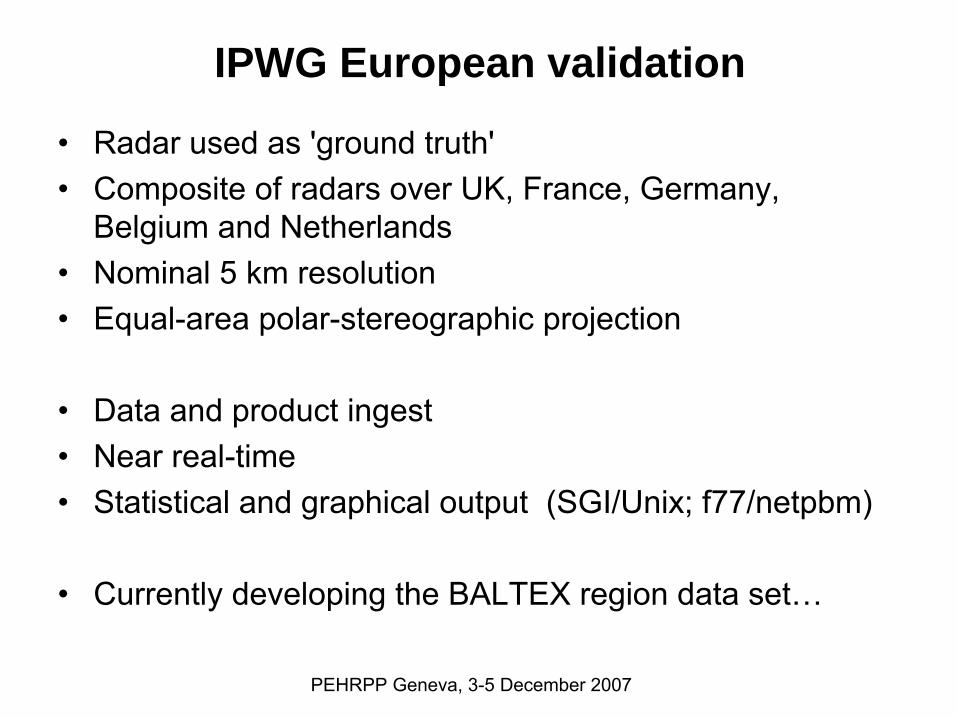
IPWG European validation
•
Radar used as 'ground truth'•
Composite of radars over UK, France, Germany, Belgium and Netherlands
•
Nominal 5 km resolution•
Equal-area polar-stereographic projection
•
Data and product ingest•
Near real-time
•
Statistical and graphical output (SGI/Unix; f77/netpbm)
•
Currently developing the BALTEX region data set…

PEHRPP Geneva, 3-5 December 2007
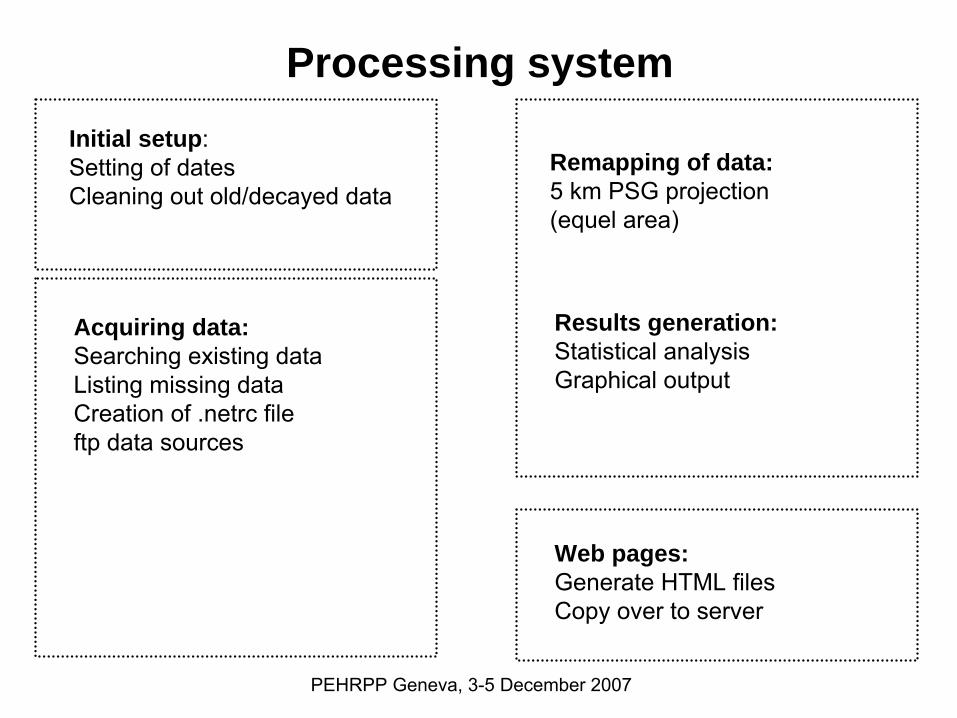
Processing setup
Perceived requirements:
•
Daily inter-comparison → 00Z-24Z (also -06, -09, -12Z)
•
0.25 degree resolution → 25 km resolution
•
Real-time → near real-time dependent upon product
•
Validation data → radar data (gauge being added later)
•
Automatic → quasi-automatic (not ‘operational’)
•
Many products → limited number of products

PEHRPP Geneva, 3-5 December 2007
Processing Schedule
Statistics at 20km
01Z
02Z
03Z
04Z
05Z
22Z EUMETSAT MPE
Global IR
SSM/I data
Europeanradar data
3B4x
GPIFDA
PMIR
Web pages
ECMWF
cics data
PEHRPP Geneva, 3-5 December 2007
Processing systemInitial setup:Setting of datesCleaning out old/decayed data
Acquiring data:Searching existing dataListing missing dataCreation of .netrc
fileftp data sources
Remapping of data:5 km PSG projection(equel
area)
Results generation:Statistical analysisGraphical output
Web pages:Generate HTML filesCopy over to server

PEHRPP Geneva, 3-5 December 2007
Processing checksforeach
day (d0
-d0-31
)
dn
=dn+1
set d0
=today
foreach
day (d0
-d0-31
)
foreach
product (p1
-pn
)
if (product for day) !exist
add to .netrc
file
foreach
datasource
(s0
-sn
)
ftp datasource
(4k)
Y
N
foreach
product & day
remap to PSG using LUTs& standardise format
standardise filename
foreach
product & day
Generate statistics
Generate plots
foreach
product & day
generate HTML files

PEHRPP Geneva, 3-5 December 2007
Processing checksforeach
day (d0
-d0-31
)
dn
=dn+1
set d0
=today
foreach
day (d0
-d0-31
)
foreach
product (p1
-pn
)
if (product for day) !exist
add to .netrc
file
foreach
datasource
(s0
-sn
)
ftp datasource
(4k)
YN
foreach
product & day
remap to PSG using LUTs& standardise format
standardise filename
foreach
product & day
Generate statistics
Generate plots
foreach
product & day
generate HTML files
Set up list of past dates/days
Usually okay: sometimes needs
tweaking
Checks for a products results:
Okay if no results, but not if bad data
Prepares products into
common formatUsually okay…
Generates outputs:
Okay if there is rain…
Generates raw HTML:
Occassional
issues with server
FTP runs several times:
4K buffer limit on macros

PEHRPP Geneva, 3-5 December 2007
IPWG-EU Results
•
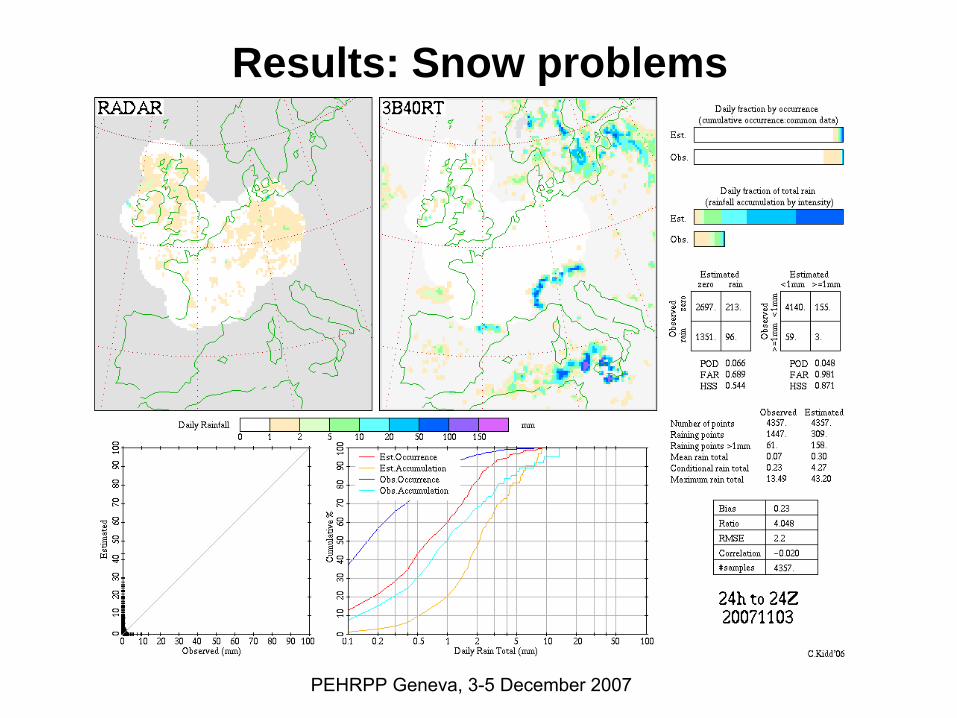
Similar to other regions: seasonal dependence of satellite techniques (poorer in winter)
•
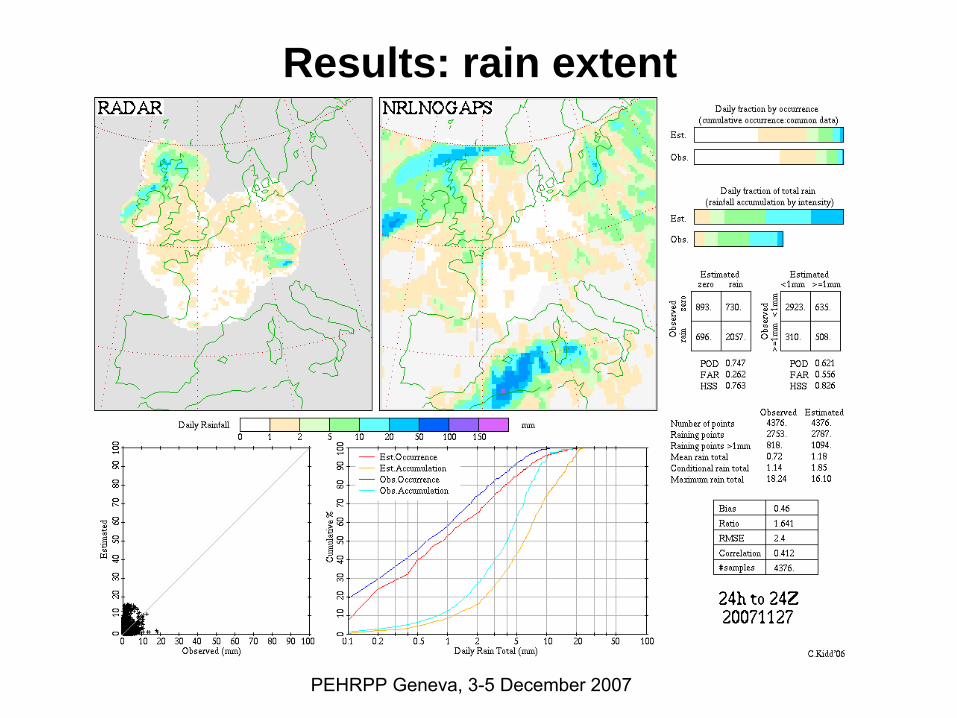
Models tend to overestimate rain area/extent
•
Satellite products underestimate rain area/extent
•
Significant day-to-day variations: rainfall patterns, extent, intensity affect statistics
•
Surface contamination noticeable in winter
PEHRPP Geneva, 3-5 December 2007
Results: Snow problems
PEHRPP Geneva, 3-5 December 2007
Results: rain extent

PEHRPP Geneva, 3-5 December 2007

PEHRPP Geneva, 3-5 December 2007
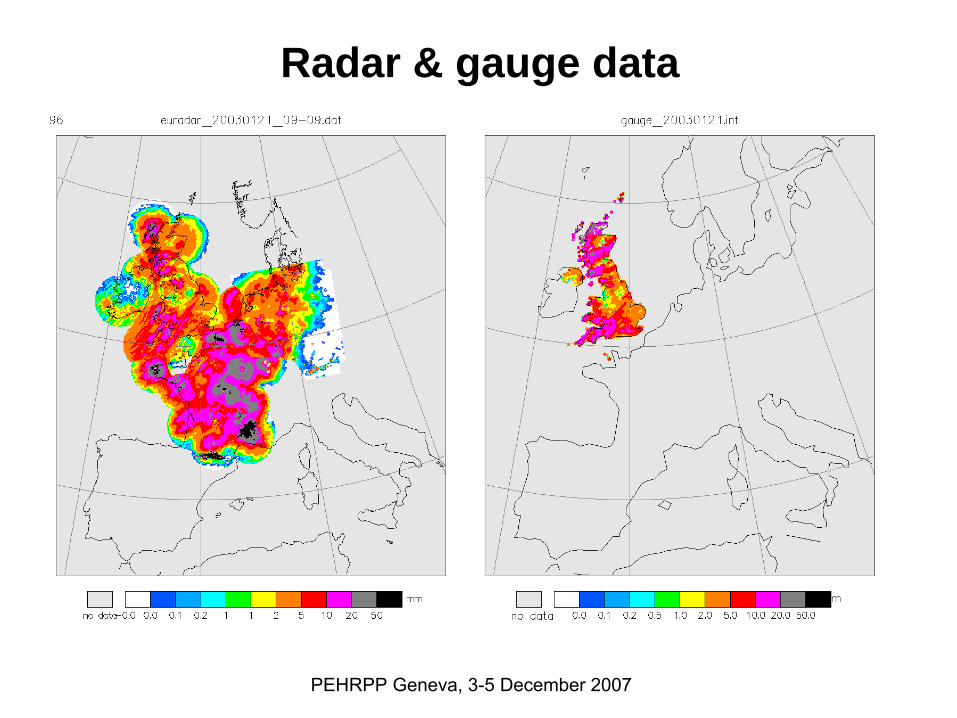
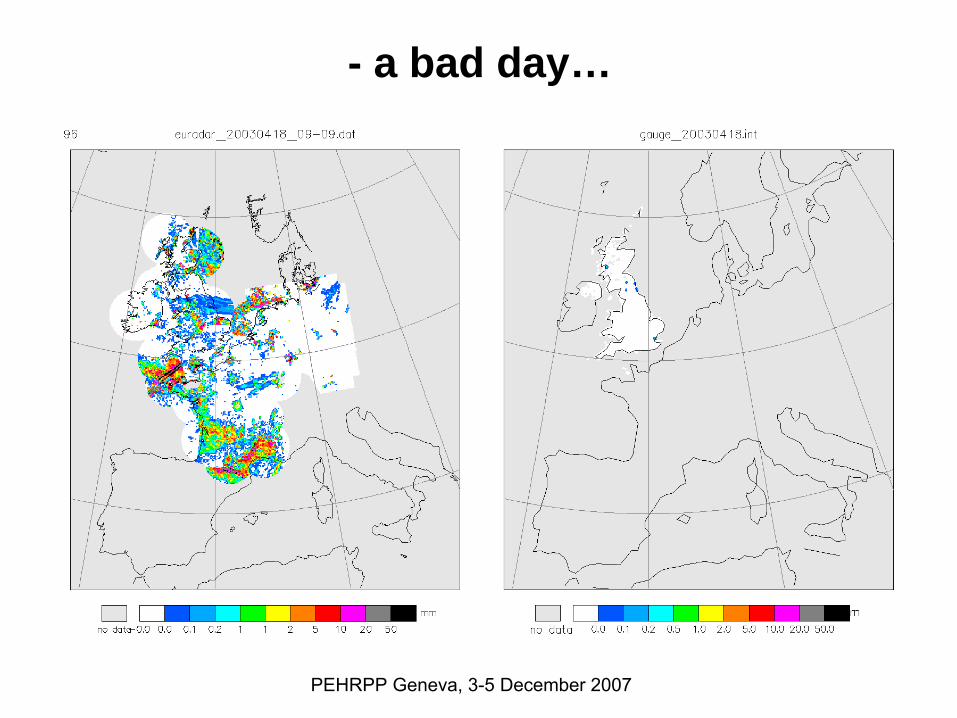
Performance of radar data
Radar data:•
European composite –
different radar systems,
difference calibration strategies, different QC.•
Nominally 5km 15-minute data product; available within ~ 1 hour; 2002-present
•
Known errors include range effects and anaprop (including shipping!)
Gauge data:•
09-09Z data (dated at end of period)
•
~6000 daily gauges with mean 10km spacing•
available 1 month in arrears
PEHRPP Geneva, 3-5 December 2007
Radar & gauge data
PEHRPP Geneva, 3-5 December 2007
- a bad day…

PEHRPP Geneva, 3-5 December 2007
Radar vs Gauge correlations
Radar is calibrated using gauge data – even so, cc's rarely exceed 0.9
CCs essentially
independent of month

PEHRPP Geneva, 3-5 December 2007
Radar vs Gauge correlations – by rain extent
Correlations (and other statistics) are dependent upon rain extent

PEHRPP Geneva, 3-5 December 2007
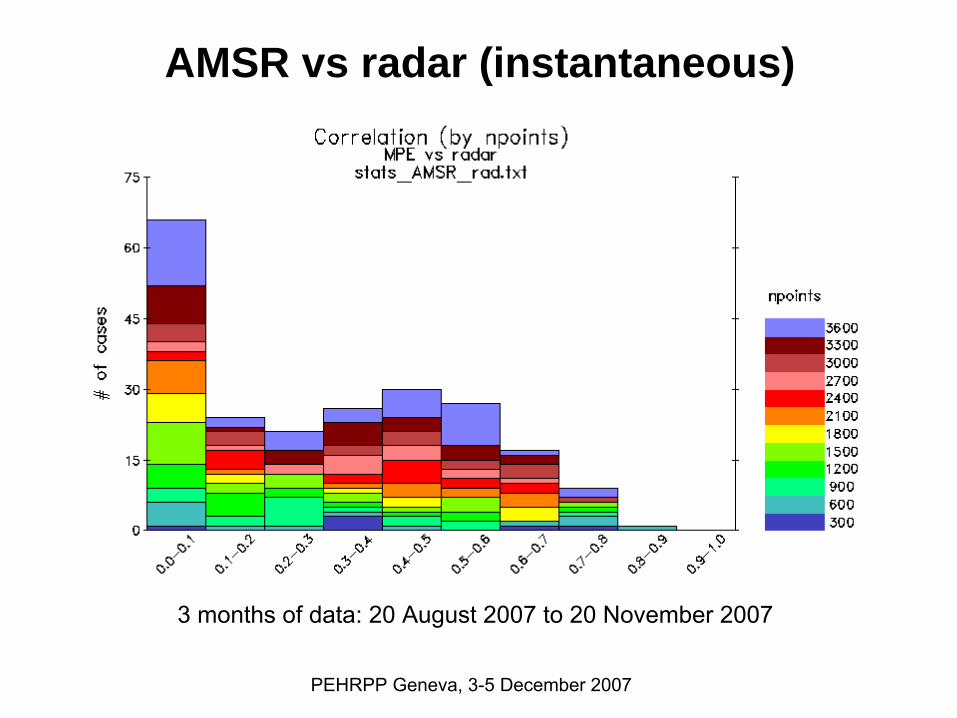
High-temporal resolution study
EUMETSAT Multi-spectral Precipitation Estimate•
Nominal 15 minute estimates
•
Utilises multi-spectral capabilities of SEVIRI sensor•
Remapped to 0.25 degree resolution
AMSR L2 Rain product (for comparison)•
Nominal 25km (ave'd
5km) instantaneous estimates

PEHRPP Geneva, 3-5 December 2007
AMSR instantaneous: very variableC
orre
latio
n
Date (mmdd)
PEHRPP Geneva, 3-5 December 2007
AMSR vs radar (instantaneous)
3 months of data: 20 August 2007 to 20 November 2007

PEHRPP Geneva, 3-5 December 2007
Vis/IR MPE vs radar: 15 minute

PEHRPP Geneva, 3-5 December 2007
Vis/IR MPE vs radar: 30 minute

PEHRPP Geneva, 3-5 December 2007
Vis/IR MPE vs radar: 1 hour

PEHRPP Geneva, 3-5 December 2007
Vis/IR MPE vs radar: 3 hour

PEHRPP Geneva, 3-5 December 2007
Vis/IR MPE vs radar: 6 hour
PEHRPP Geneva, 3-5 December 2007
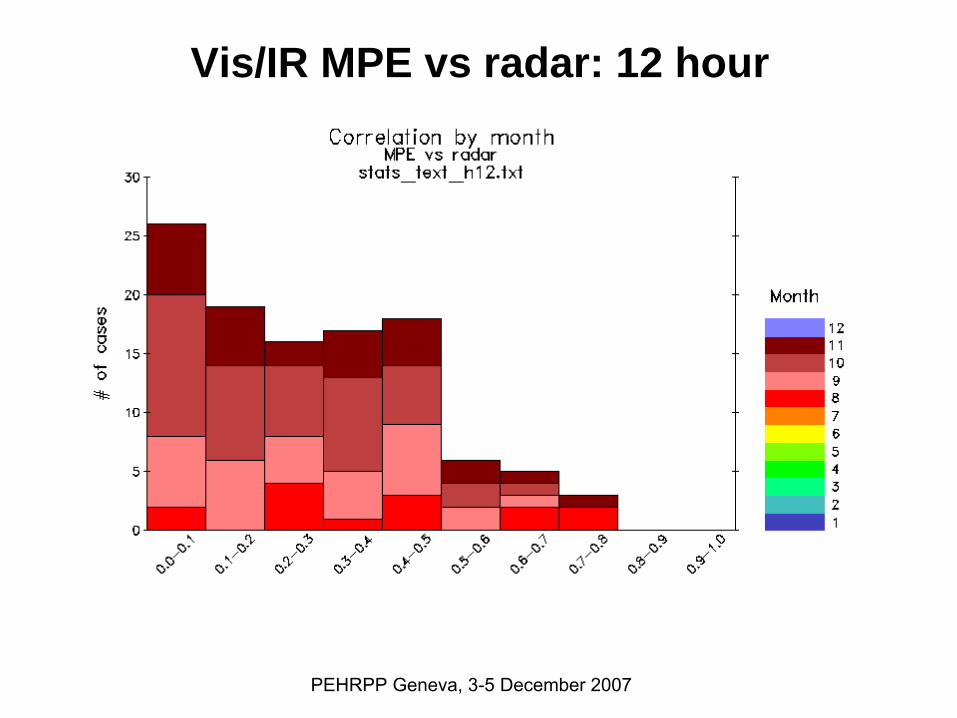
Vis/IR MPE vs radar: 12 hour

PEHRPP Geneva, 3-5 December 2007
Vis/IR MPE vs radar: 24 hour
The critical temporal gap is ~3-6 hour accumulations
PEHRPP Geneva, 3-5 December 2007
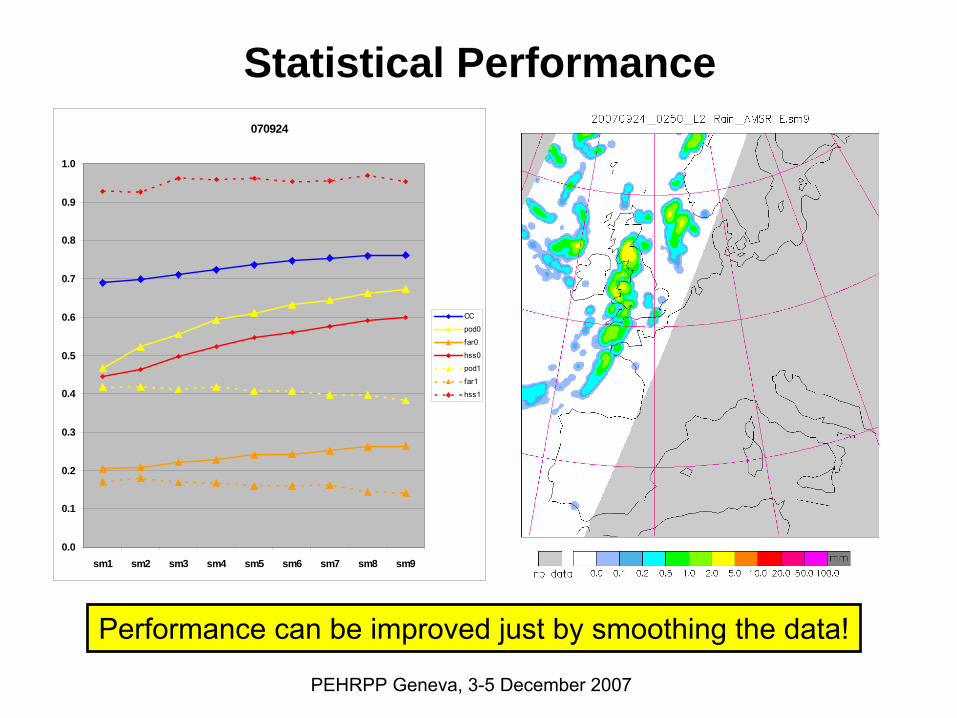
Statistical Performance
Performance can be improved just by smoothing the data!
070924
0.0
0.1
0.2
0.3
0.4
0.5
0.6
0.7
0.8
0.9
1.0
sm1 sm2 sm3 sm4 sm5 sm6 sm7 sm8 sm9
CC
pod0
far0
hss0
pod1
far1
hss1

PEHRPP Geneva, 3-5 December 2007
Issues I
Standardisation of data sets – Why?•
Easier/better processing (& fewer errors)•
More coherent long-term data sets
Problems:•
Grid box vs
grid point•
Instantaneous vs
accumulation (i.e. ±1.5 hours or 00-03)•
Data resolutions (temporal & spatial)•
Data units (storage resolution vs
retrieval resolution)•
Formats (I*2; I*4; R*4) (& units: mmh-1 ;mmd-1
; kgd-1)•
Filename and date/time conventions (end, start, period)•
W-E (180°E/0°E & E-W) and N-S (or S-N) layout

PEHRPP Geneva, 3-5 December 2007
Issues II
Statistical results are dependent upon the rainfall:•
intensity, extent and patterns
•
temporal resolution•
spatial resolution
All these are inter-related and pose a multi-dimensional problem that cannot currently be adequately resolved
PEHRPP Geneva, 3-5 December 2007
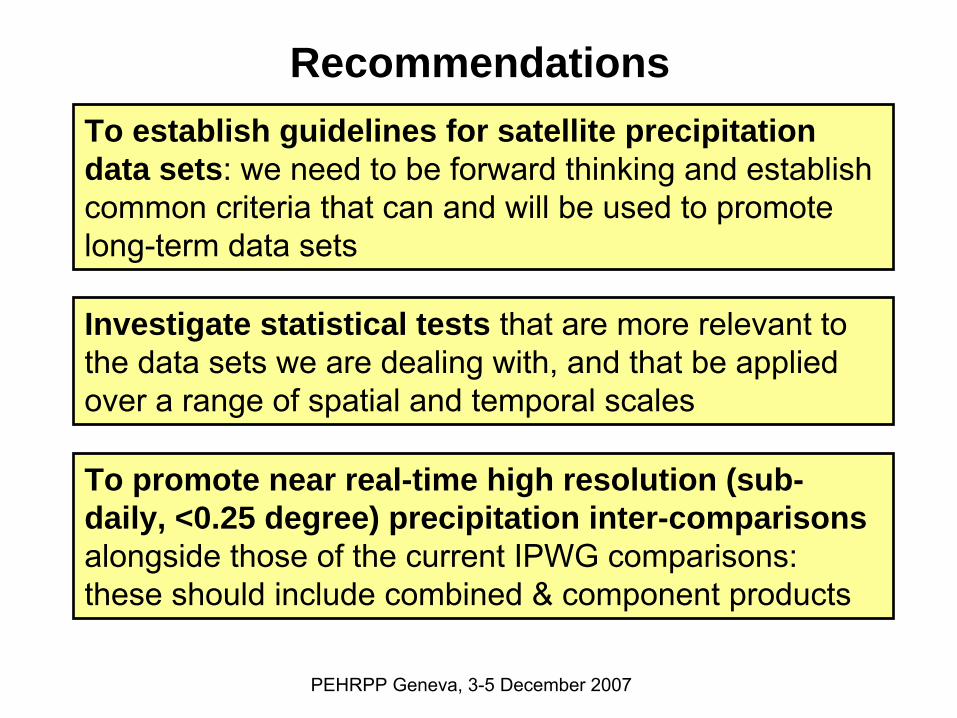
RecommendationsTo establish guidelines for satellite precipitation data sets: we need to be forward thinking and establish common criteria that can and will be used to promote long-term data sets
Investigate statistical tests that are more relevant to the data sets we are dealing with, and that be applied over a range of spatial and temporal scales
To promote near real-time high resolution (sub- daily, <0.25 degree) precipitation inter-comparisons alongside those of the current IPWG comparisons: these should include combined & component products