Embed Size (px)
Citation preview
291
Inter-Rater Reliability and Criterion Validity of Scatter Diagrams as
an Input Method for Marksmanship Analysis Computerised
Notational Analysis for Archery
Andrew J Callaway and Shelley A Broomfield
Centre for Event amp Sport Research Bournemouth University Talbot Campus
Bournemouth BH12 5BB UK
Abstract
Basic notational systems exist in many sports but may not always be
formally named as such This paper outlines the validity and reliability of
using a computerised scatter diagram as an input method for the analysis
of marksmanship in target sports with Archery used as an example sport
Software was created to represent a standard FITA 122cm target face An
Archer shot 72 arrows these were measured to create coordinates of each
arrow Twelve images (6 arrows per image) were shown to 10 operators
Operators input each arrow position into the software to produce a
coordinate for each arrow The coordinates where additionally processed
using marksmanship statistics Accuracy Constant Error (ACE) Accuracy
Variable Error (AVE) and Precision (Mean Radius- MR) ICC was used to
test validity and PPMC to test inter-rater reliability of the raw data and
error analysis on the processed data Raw results showed strong positive
correlations for validity against the measured coordinates (gt977) and
high levels of inter-rater reliability(gt969) Processed results show less
than 2 error to that of measured results Systems such as this allow
coachathleteresearcher to track varying equipment setups changes to
biomechanics physiology and psychology allowing for continued
development of athlete sport and equipment
Keywords Notational Analysis Reliability Validity Shooting Marksmanship
1 Introduction
Notational analysis has been used in sports to characterise factors which determine
success of teams and individuals be these tactical technical or technique aspects or to
record performances over time for comparison (Hughes and Franks 2004) Methods of
recording this information varies between manually tallying occurrences to noting
where an event occurs on a schematic layout of the playing surface (or schematic of an
athlete) whichever is appropriate to task (Hughes and Franks 2004) through to
computerised systems such as Prozone where players can be tracked (Di Salvo et al
2006)
Notational systems can exist in many sports but may not always be formally named as
such where Archery is one such example Competitions from local events to the
International Journal of Performance Analysis in Sport
2012 12 291-310
292
Olympics all rely on the accumulation of points and this therefore is the most popular
criterion to analyse the performance of an archer in studies (Hay and Reid 1988
Leroyer et al 1993 Lin and Hwang 2005) Archers shoot rounds (a combination of
distances shot target face size and scoring zones) which can vary depending on the age
group gender and bow discipline (World Archery 2010a 2010b)
Typically research in archery uses FITA rounds (Keast and Elliot 1990 Ertan et al
2005) using a 10 zone scoring system where scores range from 10 to 1 with a miss
scored as ldquoMrdquo The centre 10 ring is separated into two sections which are recorded as
10 for the outer section and X for the inner however for addition purposes both score
10 points The rationale is to determine the ranking position for archers on the same
score same score with a higher number of Xrsquos wins the higher place These scores will
then be used to rank the archers for medals or in events such as the Olympics for the
elimination rounds (Head to Head matches)
The recorded scores are typically written on a sheet of paper with some high level
competitions using a computerised score entry pad where each end (set) of arrows shot
are recorded in order of highest to lowest value and added for a cumulative total
effectively a form of frequency table This level of data input has limitations in the
degree of analysis that can be performed on that data as the arrows are only scored from
highest to lowest not even in the order shot Scatter diagrams are a development from
this and appear in previous research to locate setting zones in volleyball (Koch amp Tilp
2009) actions in Netball (Bruce et al 2009) representing a goal in football (Bar-Eli and
Azar 2009 Van der Kamp 2011) and additional examples demonstrated by Hughes
and Franks (2004) A scatter diagram approach in archery allows arrow positions to be
plotted onto a target face allowing the archer to see personal best records for each
tournament showing average groupings individual arrow performance and grouping by
distance Systems for personal use tend to appear as scatter diagram based software for
PDAs (Personal Digital Assistants) such as BowBuddy (Bowbuddy 34) with
alternatives starting to appear for the smart phone market on varying operating systems
Software such as this can be used by the archercoach to record a more detailed
performance over score
Feedback and information from these systems in Archery can be limited to a visual
representation of arrows in a target showing a group which allows athletes to make
immediate changes to equipment
Using a computerised system utilising arrow locations (coordinates) based on real
measurements also allows for a greater level of analysis such as marksmanship statistics
for Accuracy Constant Error shown in equation (1) Accuracy Variable Error in
equation (2) and Precision shown in equation (3) (Johnson 2001) This can then allow
coaches researchers and archers investigating aspects such as the effect of
biomechanical changes on outcome equipment changes as well as physiological and
psychological factors require a method to gauge in changes in real terms such as
centimetres and more developed than just score
= + 13 (1)
293
=sum (2)
= sum (3)
These statistical measures would be questionable without a valid input by the user
(Wilson and Barnes 1998) The aim of this study was to determine the criterion validity
and inter-operator reliability of inputting ldquoarrowsrdquo into a computerized system to allow
coaches researchers and maybe some archers to better understand the outcome of the
arrows on a target As this system has the potential to be used for more than just
recording scores the marksmanship statistics were also tested as the equations each sum
distances (coordinates) and therefore sum any input error
2 Method
21 Study design
With institutional ethical approval an archer shot 72 arrows (FITA 70m) at 70m on a
standard 122cm target face Each end of 6 arrows was photographed and on pulling
each arrow from the target the coordinate of each arrow was measured (x and y) to the
centre of each hole left by the arrow to the nearest millimetre This produced master
coordinates of each arrow in the order shot by the archer
The photographs were taken with the centre of the lens of the camera standing 130cm
90 degrees to the target and 80cm from the target The camera used was a Nikon
Coolpix S3000X 12MP Camera No zoom was used to ensure repeatability The
photographs were not manipulated apart from to add labels to show the order in which
they were shot 1-6 (Figure 1 a)
A Matlab script was developed which superimposed a blank target face over a set of
axis (MatLab 2007) (Figure 1b) The centre of the target was set to (00) and the sizes
of each colour band were in accordance to the limits set by World Archery (2010b) for a
122cm target The software can be altered to replicate other target sizes and with a zoom
control available changing this target size in the software would not affect the visual
representation to the user only the internal calculations would be affected An arrow
position was recorded in the software by a click which generated a coordinate (xy)
recorded in centimetres to an accuracy of 4dp The software then took the 6 arrows
entered and calculated the Accuracy Constant Error (ACE) (1) Accuracy Variable Error
(AVE) (2) and Precision Mean Radius (MR) (3) The same statistics were also used for
the full 72 arrows once all were entered The master coordinates were also processed in
this manner to allow a comparison to operatorsrsquo raw input error as well as the error after
these calculations
294
Figure 1 Computer system set up a) Photograph of the target face with labelled arrows
b) Computerised target face for input from user
22 Participants
Ten participants provided informed consent to take part in this experiment Knowledge
of Archery was not deemed necessary for this research Seven male and three female
participants took part (295yrs plusmn76yrs)
23 Procedure
The objective was for the operator to input the arrow locations from the photograph into
the software to the best of their ability The software was fully demonstrated to each
user separately Zoom controls on both the photograph and the software were made
clear to allow for personal preference With a blank target shown on the software they
were instructed to click to the best of their ability the location of each arrow in
numerical order on the photograph Once all 6 arrows from the photograph were input
the target on the software was cleared and the next photograph was shown and process
was repeated for 12 photographs (72 arrows in total) Each operator had 4 minutes to
complete each set of 6 arrows to represent the same timings as in a qualification round
at an event Each operator completed each end well within these time limits
24 Statistical analysis
241 Scores
Score is the primary function of the notational system errors in scores are analysed as a
difference from the actual score of from the archer (649) using equation (4)
= 100 $amp()$+-++)$+$amp()$+ 4
295
242 Validity and Reliability of Raw Data Entry
Typically within validity and reliability studies the actual results are not known so are
often compared to a previous gold standard This studys gold standard is the
measured coordinates themselves allowing measurement of criterion validity as a
subdivision of concurrent validity (Wilkinson et al 2009 Bannigan and Watson 2009
ODonoghue 2010) This can be measured using Pearson Product Moment Correlations
(PPMC) of each operators input against the master coordinates This was repeated for
the abscissa (X) and ordinate (Y) inputs separately
Inter-rater reliability was assessed using Intra-class Correlation Coefficient (ICC) where
each operator was compared and repeated for the abscissa (X) and ordinate (Y) inputs
separately (Shrout and Fleiss 1979 Weir 2005)
The difference between each operatorsrsquo input and the master input were also analysed
using Mean Error (plusmnSD) Mean Absolute Error (MAE) Root Mean Square Error
(RMSE) for each (Hughes et al 2002 OrsquoDonoghue 2010 2012) Systematic and
random bias are also reported for each axis
The marksmanship statistics ACE AVE MR all rely upon the straight line distances
from the centre point Therefore error at this stage of the process is of great importance
as significant error in the input of the data would filter through to the output Hughes
Cooper and Nevill (2002) and OrsquoDonoghue (2010) state it is important to explain the
method of percentage error used There are 2 forms in which this straight line error can
be realised (Figure 2) Firstly by the error on either axis (Figure 2 a and b) or the
straight line distance from the centre (Figure 2 c) Angular deviation was not considered
here as the marksmanship statistics are more concerned with the straight line distance to
represent group centres The mean error for the abscissa (x) and ordinate (y) can be
calculated using the modulus of the master coordinate (X) less the operators input (x)
divided by the targets radius shown in equation (5) This can be summed for each
coordinate in the system and multiplied by 100 to return a mean error for the abscissa
and ordinate
12 = 100 sum |4|5+6789amp9lt= (5)
Developing this the error of the straight line distance from the origin of these inputs
can be tested (Figure 2 c) This will be named Straight Line Mean Percentage error
(SLM error) Pythagoras theorem was used to calculate the straight line distance of
the Master Coordinates (X Y) and the operators input (x y) Taking the modulus of the
master coordinates less the operators and dividing by the radius of the target will result
in a SLM error This process can also be summed to give a SLM error for all the
inputs shown in equation (6) ICC and PPMC were calculated using SPSS version 19
(IBM 2010) all other calculations were calculated using Excel (Microsoft 2007)
296
Figure 2 A quadrant of the target demonstrating the ways in which error can be seen on
arrow placement a and b show error between X (actual) and (operator placement) on
each axis c shows error as a measure of straight line distance from the centre of the
target (Pythagorean distance) The outer circle represents the circumference of the target
face with the axis being the diameter of the target face
gt = 100sum AB4CDABD5+6789amp9lt= E (6)
243 Validity and Reliability of Processed Data
The raw input as discussed can be used with ACE (1) AVE (2) MR (3) The equations
use sums of locations and therefore can sum error this needs to be addressed in order
to ascertain its validity and reliability The measured and operator input coordinates
were processed using ACE AVE MR Validity was then assessed using PPMC against
each operator Inter-rater reliability was assessed using ICC
The difference between each operatorrsquos results and the master results will be shown
using Mean Error (plusmnSD) Mean Absolute Error (MAE) Root Mean Square Error
(RMSE) and error for each
Percentage error for ACE and AVE was calculated using the same process as (6)
replacing the distance term (X) with the master ACE less the operators ACE (x) (or AVE
as appropriate) The mean error is reported for ACE and AVE
297
Percentage error of the Mean Radius (MR) was calculated as the difference in the area
of the circle produced by the master coordinates (MR) and the radius produced from
each operator (mr) and divided by the target area and multiply by 100 in equation (7)
1FG1H = 100 sum IJKL7MJKN+MIK5+6789amp9lt= (7)
Finally a visual representation of the output from the system is also demonstrated on a
target face of the first end (first 6 arrows) and all 72 arrows This was calculated using
the coordinates from any operator with the minimum and maximum error The AVE
calculation determined the centre of the group and the MR determined the size of the
group
3 Results
31 Scores
All operators scored 100 accuracy (0 score error) in the score value except for
operators 3 and 8 Operator 3 made 3 errors in the scoring (+1 -1 -1) and Operator 8
made a single mistake (+1 point) Whilst the primary goal of shooting sports is score
from a total score of 649 these two errors report as 03 and 015 error respectively
It is felt that experienced operators would further limit this error
29
8
32
Raw
Data
Res
ult
s
Tab
le 1
V
alid
ity o
f ea
ch u
ser
corr
elat
ed a
gai
nst
the
mea
sure
d r
esult
s usi
ng P
PC
M (
p =
00
0)
U
1
U2
U3
U4
U5
U6
U7
U8
U9
U10
Y A
xis
09
95
09
96
09
93
09
95
09
93
09
93
09
86
09
88
09
86
09
77
X A
xis
09
94
09
95
09
87
09
95
09
96
09
94
09
92
09
85
09
91
09
84
Tab
le 2
In
ter-
Rat
er R
elia
bil
ity u
sing I
CC
(p =
00
0)
U1
U
2
U3
U
4
U5
U
6
U7
U
8
U9
X
Y
X
Y
X
Y
X
Y
X
Y
X
Y
X
Y
X
Y
X
Y
U2
0
99
5
09
96
U3
0
98
9
09
90
09
86
09
93
U4
0
99
6
09
94
09
96
09
96
09
89
09
90
U5
0
99
5
09
94
09
96
09
95
09
88
09
88
09
96
09
94
U6
0
99
5
09
92
09
96
09
95
09
87
09
84
09
97
09
95
09
95
09
93
U7
0
99
5
09
88
09
94
09
87
09
82
09
78
09
96
09
90
09
93
09
89
09
96
09
90
U8
0
98
6
09
90
09
86
09
91
09
77
09
82
09
90
09
93
09
86
09
89
09
90
09
94
09
89
09
88
U9
0
99
3
09
85
09
93
09
88
09
78
09
81
09
93
09
89
09
94
09
88
09
92
09
88
09
92
09
80
09
85
09
82
U1
0
09
86
09
80
09
86
09
81
09
74
09
69
09
87
09
86
09
88
09
86
09
89
09
85
09
89
09
82
09
79
09
82
09
85
09
76
29
9
Tab
le 3
A
tab
le s
how
ing t
he
Mea
n
MA
E
RM
SE
M
ean
erro
r an
d S
LM
er
ror
(6)
of
the
raw
dat
a en
try f
rom
eac
h o
per
ator
over
all
72
arro
ws
Op
era
tor
X A
xis
Y A
xis
SL
M
Err
or
()
Mea
n
(plusmn
SD
)
(cm
) M
AE
(cm
) R
MS
E
(cm
)
Mea
n
Err
or
()
M
ean
(plusmn
S
D)
(cm
) M
AE
(cm
) R
MS
E
(cm
)
Mea
n
Err
or
()
1
0
89
(plusmn
78
3)
60
0
60
0
09
8
17
2 (
plusmn7
16
) 5
60
56
0
09
2
06
9
2
-11
5 (
plusmn50
1)
53
4
53
4
08
7
07
9 (
plusmn4
15
) 5
16
51
6
08
5
06
9
3
04
7 (
plusmn9
51
) 7
88
78
8
12
9
09
5 (
plusmn5
34
) 6
53
65
3
10
7
08
8
4
-07
5 (
plusmn48
1)
55
8
55
8
09
1
16
8 (
plusmn4
89
) 5
45
54
5
08
9
05
4
5
-09
3 (
plusmn42
7)
52
9
52
9
08
7
14
6 (
plusmn6
72
) 6
20
62
0
10
2
07
1
6
-18
2 (
plusmn54
0)
58
7
58
7
09
6
-05
5 (
plusmn54
5)
66
1
66
1
10
8
07
6
7
-04
3 (
plusmn68
5)
64
3
64
3
10
5
20
8 (
plusmn8
63
) 7
89
78
9
12
9
06
0
8
15
4 (
plusmn9
83
) 8
43
84
3
13
8
12
1 (
plusmn6
98
) 7
54
75
4
12
4
09
1
9
39
6 (plusmn
65
8)
83
6
83
6
13
7
-24
4 (
plusmn90
1)
95
6
95
6
15
7
08
3
10
-29
9
(plusmn1
00
8)
10
01
10
01
16
4
13
4 (
plusmn1
26
5)
11
14
11
14
18
3
08
2
Mea
n
-01
2 (
plusmn70
2)
69
2
69
2
11
3
0
82
(plusmn
71
2)
71
7
71
7
11
7
07
4
30
0
Fig
ure
3 P
erce
nta
ge
erro
r fo
r ea
ch a
rrow
show
n f
or
X a
nd Y
ax
is s
epar
atel
y
Red
dots
(
) re
pre
sent
the
mea
n f
or
all
10 o
per
ators
W
hit
e
dots
(
) re
pre
sent
the
each
oper
ators
input
301
The validity of the system is shown in Table 1 Here we can see that the operators input
all produce high significant correlations for each axis when compared to the measured
results Operators 7 8 9 and 10 produce weaker results although still significantly
high under the 099 level This could hint towards a weakness with their ability to judge
vertical distances although the correlation is still very high
Reliability of the system was tested using Inter-Rater reliability using ICC shown in
Table 2 This again shows very high levels of internal correlations Compared to the
results in Table 1 we see some additional drops towards the 097 mark however these
are still significant and not detrimental to the nature of the system This demonstrates
that the system is reliable between users
Table 3 shows the mean results for each user As shown in Table 1 Operators 7 8 9 10
showed lower correlations when compared to the measured results This is highlighted
in Table 3 where operators 8 9 and 10 show the highest error with Operator 3 Operator
3 shows a large MAE in the X and Y axis this is not replicated in Table 1 but could be
hinted at in Table 2 showing the lower ICC than some of the other operators However
their standard deviation (SD) about the mean is amongst the highest The small mean
and large SD shows that their positive and negative error could be cancelling itself out
in terms of the calculations used Operator 7 shown to have lower correlations in Table
1 does not show high errors in the X axis but does in the Y axis Overall we see that
operators tend to under estimate in the horizontal plane (X) placing arrows closer to the
centre yet over estimate in the vertical plane (Y) In spite of this the results (Table 3)
also show that all Operators over all 72 arrows have a mean error of less than 1 in
the straight line distance from the centre point of the target So whilst there is more error
in the Y axis on average when combined the overall resultant error is actually
minimised The RMSE is equal to MAE demonstrating no significant variation in the
error The systematic error for the system is shown to be -012 082 for X and Y
respectively with the random error being plusmn702 and plusmn712
Figure 3 shows the error for each of the 72 arrows This shows that Arrow 17 and 29
show the largest errors Arrow 17 shows large errors in both X and Y axis Arrow 29
shows a large error in the Y axis but comparable in the X axis
30
2
33
Pro
cess
ed R
esu
lts
Tab
le 4
sh
ow
s a
sum
mar
y o
f th
e er
ror
bet
wee
n e
ach o
per
ato
r an
d t
he
mas
ter
calc
ula
tions
for
AC
E A
VE a
nd M
R
Op
era
tor
AC
E
A
VE
MR
Mea
n (
plusmn S
D)
(cm
)
MA
E
(cm
)
RM
SE
(cm
)
SL
M
E
rro
r
M
ean
(plusmn
S
D)
(cm
)
MA
E
(cm
)
RM
SE
(cm
)
SL
M
E
rro
r
M
ean
(plusmn
S
D)
(cm
)
MA
E
(cm
)
RM
SE
(cm
)
Ra
dia
l
E
rro
r
1
0
78
(plusmn
28
8)
28
2
39
5
04
6
2
28
(plusmn
46
2)
27
5
52
2
04
5
2
37
(plusmn
38
6)
30
2
47
8
12
8
2
12
4 (
plusmn 3
49
) 3
08
45
5
05
0
2
13
(plusmn
43
6)
28
0
50
3
04
6
2
09
(plusmn
35
) 2
40
41
7
10
3
3
24
0 (
plusmn 4
92
) 2
94
55
5
04
8
4
42
(plusmn
72
8)
44
9
82
9
07
4
4
32
(plusmn
64
6)
44
1
76
0
19
8
4
14
4 (
plusmn 3
01
) 3
23
43
3
05
3
2
48
(plusmn
48
5)
28
7
54
7
04
7
2
44
(plusmn
38
8)
27
8
46
5
11
9
5
25
8 (
plusmn 4
78
) 4
16
61
9
06
8
3
88
(plusmn
48
7)
38
8
60
7
06
4
3
26
(plusmn
33
2)
32
6
45
5
14
7
6
40
3 (
plusmn 2
99
) 4
03
49
5
06
6
2
53
(plusmn
51
5)
37
7
62
1
06
2
2
11
(plusmn
43
7)
33
1
53
4
14
7
7
16
7 (
plusmn 3
46
) 4
40
55
1
07
2
3
13
(plusmn
48
4)
35
6
58
5
05
8
2
48
(plusmn
41
0)
27
6
48
1
12
9
8
23
4 (
plusmn 2
68
) 3
50
43
5
05
7
2
29
(plusmn
46
7)
43
1
62
1
07
1
2
28
(plusmn
43
8)
42
2
59
5
18
7
9
-06
7 (
plusmn 2
78)
45
1
52
3
07
4
2
79
(plusmn
49
0)
34
5
58
2
05
6
3
98
(plusmn
46
8)
45
8
64
1
19
3
10
21
7 (
plusmn 4
52
) 5
74
72
0
03
6
3
20
(plusmn
52
7)
36
5
62
3
05
3
3
17
(plusmn
41
3)
40
2
56
4
17
7
Mea
n
15
2
38
4
51
8
05
7
2
92
35
5
60
4
05
8
2
85
34
8
53
9
15
3
30
3
Fig
ure
4 P
erce
nta
ge
erro
r plo
t fo
r A
CE A
VE a
nd M
R o
ver
eac
h e
nd (
each
set
of
6 a
rro
ws)
and a
ll 7
2 a
rrow
s T
he
red l
ine
(-)
show
the
mea
n
resu
lt f
or
the
Op
erat
ors
E
ach g
rey d
ot
( )
repre
sents
the
Oper
ators
res
ult
s
304
Whilst in the raw data (Table 3) there was no difference between MAE and RMSE the
processed data (Table 4) shows variance in the error The greater the difference between
them the greater the variance in the individual errors in the sample this shows the
accumulation of the error from the individuals inputs Compared to the raw results
(Table 3) Operators 7 8 9 10 (Table 4) were not the worst recorded here although still
amongst the top of the group Operator 6 shows the largest Mean error but MAE and
RMSE are fairly similar showing that the error from this Operator is fairly consistent
when compared to for example Operator 10 who has a far larger discrepancy showing
a more varied deviation from the input data
There is a varied mean result in ACE for the first 4 ends (Figure 4) This does seem to
settle over time so could be due to the novice operators getting acquainted with the
system This variation is not replicated in the AVE or MR results suggesting that these
calculations would not be as susceptible to potential erratic errors
As a demonstration of the effect of the error in a users input to the system Figure 5
shows the calculation of the Accuracy (AVE) and Mean Radius (the outer coloured circle
about the AVE marker) using the minimum value (a and e) and the maximum value (b
and f) entered by any of the 10 operators in comparison to the actual measured values
(c and g) This was produced to show how little visual difference is created from the
range of the inputs recorded The image is cropped to the 9 ring of the target measuring
24cm in diameter
Figure 5 Representation of error using Minimum
and Maximum AVE (o) with Minimum Mean Radius (
measured Mean Radius (green
305
Representation of error using Minimum AVE (x) with Minimum Mean Radius (
with Minimum Mean Radius (blue) and measured
green) from all 10 Operators (X 10 9 indicate the scoring zone
indicates the target centre)
with Minimum Mean Radius (red)
and measured AVE () with
10 9 indicate the scoring zone
4 Discussion
The results demonstrate the system to be reliable and valid between users and when
compared to the measured coordinated
(Y axis) to the system This
and Bird (1981) when using a vertical 10cm scale
horizontal scale This perception
environments by Vishton
overestimation in the virtual environment compared to
system this error could be incorporated into as a calibration routine for each user where
they input X arrows into the system to generate a X and Y bias to remo
remaining data input in the same way that users calibrate touch screen computers
(Vidales 2002)
Perception error in general notations systems warrants further investigation to see if
procedures or designs of systems can be altered to help reduce this error
include shapes colours shading and reference points
within existing systems primarily courtpitch based games are likely to
lines When entering the data into a notational system Hughes and Franks
that by dividing up the space into a smaller area allows for a more detailed analysis but
choosing the correct box to put a position in then becomes harder and a potential
source of error This all links to the perception errors within notational
could be investigated further Within Archery and other shooting sports the targets are
typically banded colours which limits the use of reference points other than the target
centre so previous arrow positions could be used as a
Error identified within the present system shows
The images show an overlap
the point of entry resulting in a large error from the operators
arrow 29 has no occlusion of the arrow (Figure
sequence of the two preceding arrows may have influenced the result
Figure 6 a) Arrow 17 (arrow 5 on image) b) Arrow 29 (arrow 5 on image) (Cropped
306
The results demonstrate the system to be reliable and valid between users and when
compared to the measured coordinated We do see an over estimation in a vertical
(Y axis) to the system This has also been shown to be the case with research
and Bird (1981) when using a vertical 10cm scale to measure pain
perception error as has also been shown in more complex virtual
Vishton et al (1999) and Plumert et al (2005)
overestimation in the virtual environment compared to real world Within the current
system this error could be incorporated into as a calibration routine for each user where
they input X arrows into the system to generate a X and Y bias to remo
remaining data input in the same way that users calibrate touch screen computers
error in general notations systems warrants further investigation to see if
procedures or designs of systems can be altered to help reduce this error
include shapes colours shading and reference points An example of r
xisting systems primarily courtpitch based games are likely to
When entering the data into a notational system Hughes and Franks
that by dividing up the space into a smaller area allows for a more detailed analysis but
choosing the correct box to put a position in then becomes harder and a potential
source of error This all links to the perception errors within notational
could be investigated further Within Archery and other shooting sports the targets are
typically banded colours which limits the use of reference points other than the target
centre so previous arrow positions could be used as a reference
Error identified within the present system shows arrow 17 and 29 to be problematic
an overlap between arrows 5 and 6 (Figure 6a Arrow 5)
the point of entry resulting in a large error from the operators The image containing
arrow 29 has no occlusion of the arrow (Figure 6b Arrow 5) however the entry
sequence of the two preceding arrows may have influenced the result
a) Arrow 17 (arrow 5 on image) b) Arrow 29 (arrow 5 on image) (Cropped
image)
The results demonstrate the system to be reliable and valid between users and when
ver estimation in a vertical input
has also been shown to be the case with research by Dixon
compared to a
been shown in more complex virtual
(2005) showing
Within the current
system this error could be incorporated into as a calibration routine for each user where
they input X arrows into the system to generate a X and Y bias to removeadd to their
remaining data input in the same way that users calibrate touch screen computers
error in general notations systems warrants further investigation to see if
procedures or designs of systems can be altered to help reduce this error This could
An example of reference points
xisting systems primarily courtpitch based games are likely to be the court
When entering the data into a notational system Hughes and Franks (2004) show
that by dividing up the space into a smaller area allows for a more detailed analysis but
choosing the correct box to put a position in then becomes harder and a potential
source of error This all links to the perception errors within notational analysis which
could be investigated further Within Archery and other shooting sports the targets are
typically banded colours which limits the use of reference points other than the target
and 29 to be problematic
a Arrow 5) occluding
The image containing
owever the entry
a) Arrow 17 (arrow 5 on image) b) Arrow 29 (arrow 5 on image) (Cropped
307
The two previous arrows were outer red (Figure 6b Arrow 3) and inner gold (Figure 6b
Arrow 4) If an error was made with the placement of Arrow 3 then the Operator may
have used this as a reference point magnifying the error Errors such as this are
unavoidable using the present system as is occlusion of any arrows entry point into the
target An archer using this system on a PDATablet at the target could have an
advantage over a coach at the side line The archer could move around close to the
target to get the best view possible before entering the data into this type of system
Hughes et al (2002) demonstrate errors in entering the wrong information showing that
nearly 3 of their errors were due to inputting the wrong cell number This shows
favourable results where only 2 operators had these errors arrows input into the wrong
scoring band totalling error of 41 (Operator 3) and 13 (Operator 8) Hand
notation systems will inevitably have a degree of error due to the humans entering the
data Hughes Cooper and Nevill (2002) analysed the number of shots in live Squash
games using two analysts Their results demonstrated less than 1 error when recording
number of shots and was then developed into location ball-wall contact with the wall
divided into 16 cells With this progression the researchers predicted a higher level of
error from counting shots and demonstrated error of over 30 Choi et al (2007)
showed inter-operator reliability between 4 analysts recording variables in basketball
their results demonstrated errors between analysts from 148 to 338 Any issues
with previous hand-entry systems are most likely due to the speed of the games
analysed The longer period of 4 minutes to analyse the arrow locations may explain the
lower error seen in this study compared to others
Maslovat and Franks (2007) discuss that the use of video and computer based
technologies can allow for comprehensive post-event analysis where information can
be slowed to review Within archery slowing videos would be necessary for
biomechanical analysis yet for recording arrow scores this would not be necessary as
the scoring process is currently fairly slow
Arrows are currently scored when all archers have finished shooting and everyone will
approach the targets There is scope for a camera based system or laser based system to
record these arrow positions either as they happen or after completion of the set (end)
of arrows however there are potential cost implications which might only be useable at
top level competitions limiting the analysis potential for up and coming athletes
Danage (2012) produce a scoring system where the archers when at the targets enter
the scores of the arrows in order of highest to lowest Whist entering arrow scores
electronically like this offers a simple solution for summation and the ranking of
individuals in competition or at the club in practice there are limitations in the degree of
analysis that can be performed on that data due to a lack of information gathered when
entering the data Other implications for computerised systems are when multiple
archers are shooting at the same time with typically 3-4 people per target all with
different colour combinations of fletching arrow wraps and nocks these could induce
further occlusion of the arrows Where a person can quickly see the difference and entry
point a computer could have difficulty with some of the occlusions especially with top
archers shooting very tight groups at a short distance
308
Computerised systems that appear for personal use tend to appear as scatter diagram
based software for PDAs (Personal Digital Assistants) such as BowBuddy (Bowbuddy
34) with alternatives starting to appear for the smart phone market on varying operating
systems where the input method can vary between a touch screen or stylus input Touch
screens are becoming a part of everyday life such as point of sales terminals and mobile
devices where the applications may not need high resolution displays with a critical
input due to the size of the soft buttons (Sears and Shneiderman 1991) However some
notational systems may require this critical input The system presented here used a
mouse allowing a far greater level of input when compared to a finger which would take
up a larger percentage of the screen this is where a stylus may offer a better alternative
to a finger (Sears and Shneiderman 1991 Forlines et al 2007) For these reasons
when notational systems transfer over to a portabletouch screen solution they may
need to be re-tested due to this input change
6 Conclusion
To measure marksmanship statistics a valid and reliable system needs to be used The
computerised example shown here allows the input of arrow locations with results
showing X and Y raw data coordinates are acceptable and could be improved with
experience of the system Errors are identified mainly when arrows overlap each other
in other target sports such as pistol shooting where a single hole is left this issue would
likely be overlooked or minimised
Using various statistics to analyse marksmanship allows the coachathleteresearcher to
track varying equipment setups and changes to biomechanics physiology and
psychology allowing for continued athlete sport and equipment development Previous
works in archery could use systems such as this to re-evaluate their results in greater
detail than pure score
7 References
Bannigan K Watson R (2009) Reliability and validity in a nutshell Journal of
Clinical Nursing 18 3237ndash3243
Bar-Eli M and Azar OH (2009) Penalty kicks in soccer an empirical analysis of
shooting strategies and goalkeepersrsquo preferences Soccer and Society 10(2)
183-191
Bowbuddy (Version 34) [Computer Software] UK TBS Software Retrieved from
httpbowbuddycom [Accessed January 2012]
Bruce L Farrow D Raynor A and May E (2009) Notation analysis of skill
expertise differences in netball International Journal of Performance
Analysis of Sport 9 245-254
Choi H OrsquoDonoghue PG and Hughes MD (2007) An investigation of inter-
operator reliability tests for real-time analysis system International Journal
of Performance Analysis of Sport 7(1) 49-61
309
Danage (2012) Scoring Systems Available from
httpwwwdanagetargetscoukscoringsystemsphp [Accessed November 2012]
Di Salvo V Collins A McNeill B Cardinale M (2006) Validation of Prozone reg
A new video-based performance analysis system International Journal of
Performance Analysis in Sport 6(1) 108-119
Dixon JS and Bird HA (1981) Reproducibility along a 10 cm vertical visual
analogue scale Annals of Rheumatic Diseases 40 87-89
Ertan H Soylu A R and Korkusuz F (2005) Quantification the relationship
between FITA scores and EMG skill indexes in archery Journal of
Electromyography and Kinesiology 15 222ndash227
Forlines C and Wigdor D and Shen C and Balakrishnan R (2007) Direct-touch vs
mouse input for tabletop displays Proceedings of the SIGCHI Conference on
Human Factors in Computing Systems 647-656
Hay J amp Reid J (1988) Anatomy Mechanics and Human Motion (2nd Ed)
New Jersey Prentice Hall
Hughes M and Franks IM (2004) Notational analysis - a review of the literature In
Hughes M and Franks IM (Eds) Notational Analysis of Sport Systems for
Better Coaching and Performance in Sport (pp 59-106) London Routledge
Hughes M Cooper S-M and Nevill A (2002) Analysis procedures for non-
parametric data from performance analysis International Journal of
Performance Analysis of Sport 2 6ndash20
IBM (2010) SPSS (Version 19) [Statistics Software]
Johnson RF (2001) Statistical Measures of Marksmanship (Publication No TN-012)
Retrieved from Military Performance Division website httpwwwdticmil
[Accessed January 2012]
Keast D and Elliot B (1990) Fine body movements and the cardiac cycle in
archery Journal of Sports Sciences 8(3) 203-213
Koch C and Tilp M (2009) Analysis of beach volleyball action sequences of
female top athletes Journal of Human Sport and Exercise 4(3) 272-283
Leroyer P Van Hoecke J and Helal JN (1993) Biomechanical study of the final
push-pull in archery Journal of Sports Sciences 11 63-69
Lin K and Hwang C (2005) Analyses of the relationship between the aiming time
and the shot points in archery Journal of Physical Education in Higher
Education 7(4) 161-173
MathWorks The (2007) Matlab (Version 750342) [Programming Software]
Maslovat D and Franks IM (2007) The need for feedback In M Hughes and IM
Franks (Eds) The essentials of performance analysis An introduction (pp
1-7) Abingdon Oxon Routledge
Microsoft (2007) Excel (Version 2007) [Spreadsheet Software]
OrsquoDonoghue P (2010) Research methods for sports performance analysis
Abingdon Oxon Routledge
OrsquoDonoghue P (2012) Statistics for Sport and Exercise Studies Abingdon Oxon
Routledge
Plumert JM and Kearney JK and Cremer JF and Recker K(2005) Distance
perception in real and virtual environments ACM Transactions on
Applied Perception (TAP) 2(3) 216-233
310
Sears A and Shneiderman B (1991) High precision touchscreens design strategies
and comparisons with a mouse International Journal of Man-Machine
Studies 34(4) 593-613
Shrout PE and Fleiss JL (1979) Intraclass Correlations Uses in Assessing Rater
Reliability Psychological Bulletin 86(2) 420-428
Van der Kamp J (2011) Exploring the merits of perceptual anticipation in the soccer
penalty kick Motor Control 15(3) 342-358
Vidales CE (2002) How to calibrate touch screens Embedded Systems
Programming 15(6) 32-40
Vishton PM Rea JG Cutting JE and Nuntildeez LN (1999) Comparing effects of the
horizontal-vertical illusion on grip scaling and judgment Relative versus
absolute not perception versus action Journal of Experimental Psychology
Human Perception and Performance 25(6) 1659-1672
Weir JP (2005) Quantifying test-retest reliability using the intraclass correlation
coefficient and the sem Journal of Strength and Conditioning Research
19(1) 231-240
Wilkinson M Leedale-Brown D and Winter EM (2009) Validity of a Squash-
Specific Fitness Test International Journal of Sports Physiology and
Performance 4 29-40
Wilson K and Barnes CA (1998) Reliability and validity of a computer based
notational analysis system for competitive table tennis In Lees A Maynard I
Hughes M and Reily T (Eds) Science and Racket Sports II (pp 265-268)
London Routledge
World Archery (2010a) FITA Rules and Constitution BOOK 1 Constitution and
Administrative Rules Retrieved from httpwwwarcheryorg [Accessed
November 2011]
World Archery (2010b) FITA Rules and Constitution BOOK 2 Outdoor Archery
Rules Retrieved from httpwwwarcheryorg [Accessed November 2011]
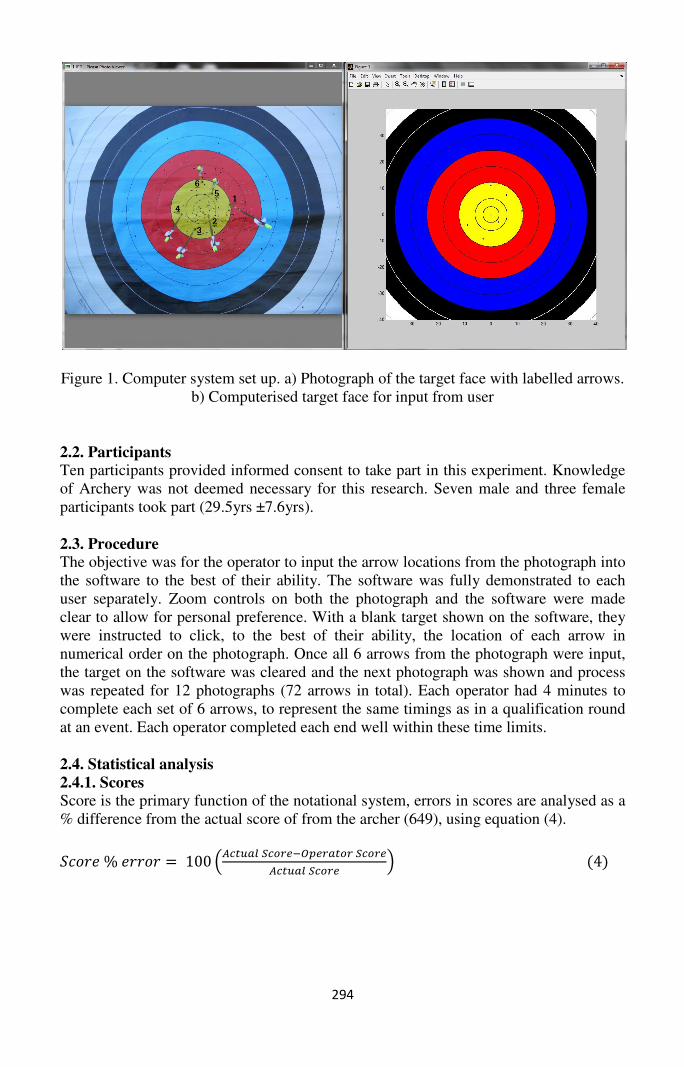
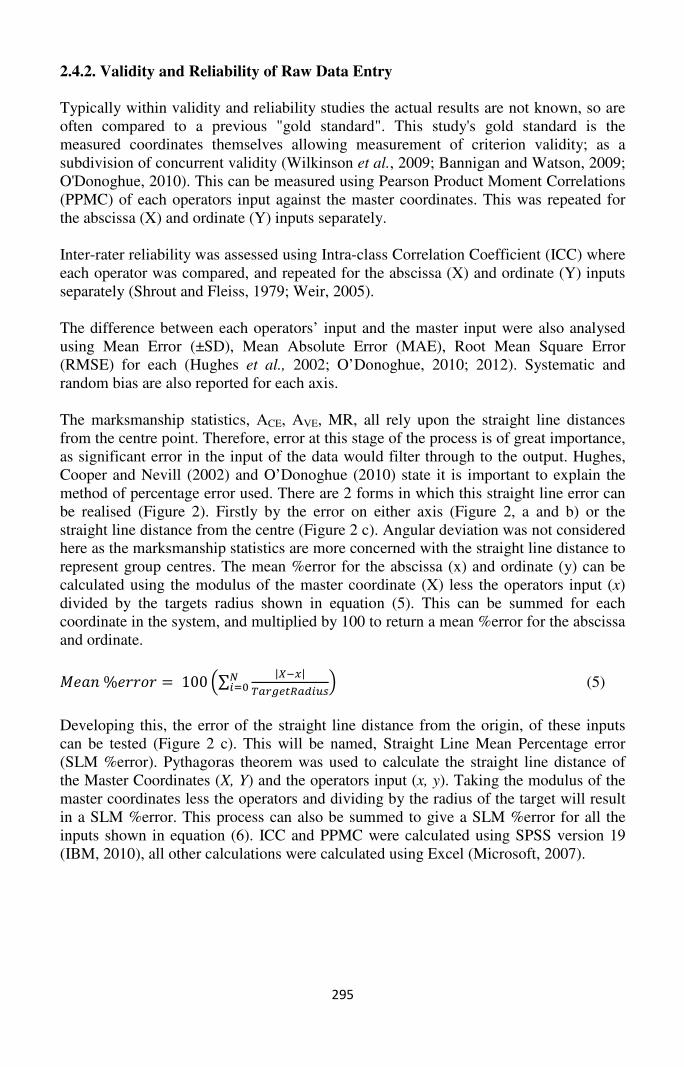
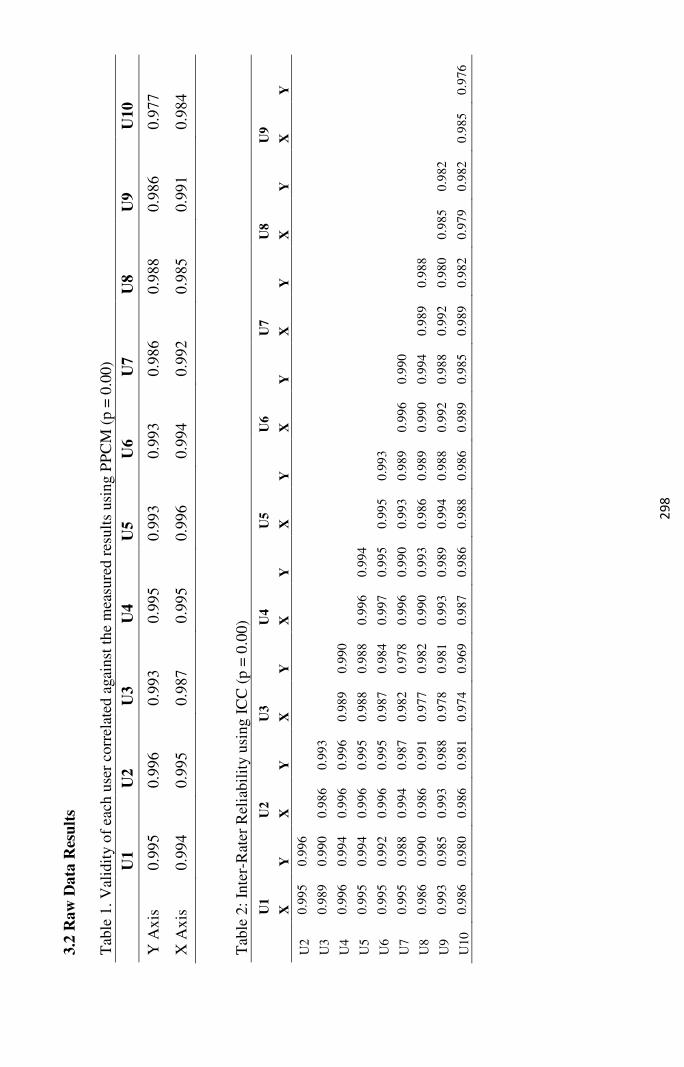
29
8
32
Raw
Data
Res
ult
s
Tab
le 1
V
alid
ity o
f ea
ch u
ser
corr
elat
ed a
gai
nst
the
mea
sure
d r
esult
s usi
ng P
PC
M (
p =
00
0)
U
1
U2
U3
U4
U5
U6
U7
U8
U9
U10
Y A
xis
09
95
09
96
09
93
09
95
09
93
09
93
09
86
09
88
09
86
09
77
X A
xis
09
94
09
95
09
87
09
95
09
96
09
94
09
92
09
85
09
91
09
84
Tab
le 2
In
ter-
Rat
er R
elia
bil
ity u
sing I
CC
(p =
00
0)
U1
U
2
U3
U
4
U5
U
6
U7
U
8
U9
X
Y
X
Y
X
Y
X
Y
X
Y
X
Y
X
Y
X
Y
X
Y
U2
0
99
5
09
96
U3
0
98
9
09
90
09
86
09
93
U4
0
99
6
09
94
09
96
09
96
09
89
09
90
U5
0
99
5
09
94
09
96
09
95
09
88
09
88
09
96
09
94
U6
0
99
5
09
92
09
96
09
95
09
87
09
84
09
97
09
95
09
95
09
93
U7
0
99
5
09
88
09
94
09
87
09
82
09
78
09
96
09
90
09
93
09
89
09
96
09
90
U8
0
98
6
09
90
09
86
09
91
09
77
09
82
09
90
09
93
09
86
09
89
09
90
09
94
09
89
09
88
U9
0
99
3
09
85
09
93
09
88
09
78
09
81
09
93
09
89
09
94
09
88
09
92
09
88
09
92
09
80
09
85
09
82
U1
0
09
86
09
80
09
86
09
81
09
74
09
69
09
87
09
86
09
88
09
86
09
89
09
85
09
89
09
82
09
79
09
82
09
85
09
76
29
9
Tab
le 3
A
tab
le s
how
ing t
he
Mea
n
MA
E
RM
SE
M
ean
erro
r an
d S
LM
er
ror
(6)
of
the
raw
dat
a en
try f
rom
eac
h o
per
ator
over
all
72
arro
ws
Op
era
tor
X A
xis
Y A
xis
SL
M
Err
or
()
Mea
n
(plusmn
SD
)
(cm
) M
AE
(cm
) R
MS
E
(cm
)
Mea
n
Err
or
()
M
ean
(plusmn
S
D)
(cm
) M
AE
(cm
) R
MS
E
(cm
)
Mea
n
Err
or
()
1
0
89
(plusmn
78
3)
60
0
60
0
09
8
17
2 (
plusmn7
16
) 5
60
56
0
09
2
06
9
2
-11
5 (
plusmn50
1)
53
4
53
4
08
7
07
9 (
plusmn4
15
) 5
16
51
6
08
5
06
9
3
04
7 (
plusmn9
51
) 7
88
78
8
12
9
09
5 (
plusmn5
34
) 6
53
65
3
10
7
08
8
4
-07
5 (
plusmn48
1)
55
8
55
8
09
1
16
8 (
plusmn4
89
) 5
45
54
5
08
9
05
4
5
-09
3 (
plusmn42
7)
52
9
52
9
08
7
14
6 (
plusmn6
72
) 6
20
62
0
10
2
07
1
6
-18
2 (
plusmn54
0)
58
7
58
7
09
6
-05
5 (
plusmn54
5)
66
1
66
1
10
8
07
6
7
-04
3 (
plusmn68
5)
64
3
64
3
10
5
20
8 (
plusmn8
63
) 7
89
78
9
12
9
06
0
8
15
4 (
plusmn9
83
) 8
43
84
3
13
8
12
1 (
plusmn6
98
) 7
54
75
4
12
4
09
1
9
39
6 (plusmn
65
8)
83
6
83
6
13
7
-24
4 (
plusmn90
1)
95
6
95
6
15
7
08
3
10
-29
9
(plusmn1
00
8)
10
01
10
01
16
4
13
4 (
plusmn1
26
5)
11
14
11
14
18
3
08
2
Mea
n
-01
2 (
plusmn70
2)
69
2
69
2
11
3
0
82
(plusmn
71
2)
71
7
71
7
11
7
07
4
30
0
Fig
ure
3 P
erce
nta
ge
erro
r fo
r ea
ch a
rrow
show
n f
or
X a
nd Y
ax
is s
epar
atel
y
Red
dots
(
) re
pre
sent
the
mea
n f
or
all
10 o
per
ators
W
hit
e
dots
(
) re
pre
sent
the
each
oper
ators
input
301
The validity of the system is shown in Table 1 Here we can see that the operators input
all produce high significant correlations for each axis when compared to the measured
results Operators 7 8 9 and 10 produce weaker results although still significantly
high under the 099 level This could hint towards a weakness with their ability to judge
vertical distances although the correlation is still very high
Reliability of the system was tested using Inter-Rater reliability using ICC shown in
Table 2 This again shows very high levels of internal correlations Compared to the
results in Table 1 we see some additional drops towards the 097 mark however these
are still significant and not detrimental to the nature of the system This demonstrates
that the system is reliable between users
Table 3 shows the mean results for each user As shown in Table 1 Operators 7 8 9 10
showed lower correlations when compared to the measured results This is highlighted
in Table 3 where operators 8 9 and 10 show the highest error with Operator 3 Operator
3 shows a large MAE in the X and Y axis this is not replicated in Table 1 but could be
hinted at in Table 2 showing the lower ICC than some of the other operators However
their standard deviation (SD) about the mean is amongst the highest The small mean
and large SD shows that their positive and negative error could be cancelling itself out
in terms of the calculations used Operator 7 shown to have lower correlations in Table
1 does not show high errors in the X axis but does in the Y axis Overall we see that
operators tend to under estimate in the horizontal plane (X) placing arrows closer to the
centre yet over estimate in the vertical plane (Y) In spite of this the results (Table 3)
also show that all Operators over all 72 arrows have a mean error of less than 1 in
the straight line distance from the centre point of the target So whilst there is more error
in the Y axis on average when combined the overall resultant error is actually
minimised The RMSE is equal to MAE demonstrating no significant variation in the
error The systematic error for the system is shown to be -012 082 for X and Y
respectively with the random error being plusmn702 and plusmn712
Figure 3 shows the error for each of the 72 arrows This shows that Arrow 17 and 29
show the largest errors Arrow 17 shows large errors in both X and Y axis Arrow 29
shows a large error in the Y axis but comparable in the X axis
30
2
33
Pro
cess
ed R
esu
lts
Tab
le 4
sh
ow
s a
sum
mar
y o
f th
e er
ror
bet
wee
n e
ach o
per
ato
r an
d t
he
mas
ter
calc
ula
tions
for
AC
E A
VE a
nd M
R
Op
era
tor
AC
E
A
VE
MR
Mea
n (
plusmn S
D)
(cm
)
MA
E
(cm
)
RM
SE
(cm
)
SL
M
E
rro
r
M
ean
(plusmn
S
D)
(cm
)
MA
E
(cm
)
RM
SE
(cm
)
SL
M
E
rro
r
M
ean
(plusmn
S
D)
(cm
)
MA
E
(cm
)
RM
SE
(cm
)
Ra
dia
l
E
rro
r
1
0
78
(plusmn
28
8)
28
2
39
5
04
6
2
28
(plusmn
46
2)
27
5
52
2
04
5
2
37
(plusmn
38
6)
30
2
47
8
12
8
2
12
4 (
plusmn 3
49
) 3
08
45
5
05
0
2
13
(plusmn
43
6)
28
0
50
3
04
6
2
09
(plusmn
35
) 2
40
41
7
10
3
3
24
0 (
plusmn 4
92
) 2
94
55
5
04
8
4
42
(plusmn
72
8)
44
9
82
9
07
4
4
32
(plusmn
64
6)
44
1
76
0
19
8
4
14
4 (
plusmn 3
01
) 3
23
43
3
05
3
2
48
(plusmn
48
5)
28
7
54
7
04
7
2
44
(plusmn
38
8)
27
8
46
5
11
9
5
25
8 (
plusmn 4
78
) 4
16
61
9
06
8
3
88
(plusmn
48
7)
38
8
60
7
06
4
3
26
(plusmn
33
2)
32
6
45
5
14
7
6
40
3 (
plusmn 2
99
) 4
03
49
5
06
6
2
53
(plusmn
51
5)
37
7
62
1
06
2
2
11
(plusmn
43
7)
33
1
53
4
14
7
7
16
7 (
plusmn 3
46
) 4
40
55
1
07
2
3
13
(plusmn
48
4)
35
6
58
5
05
8
2
48
(plusmn
41
0)
27
6
48
1
12
9
8
23
4 (
plusmn 2
68
) 3
50
43
5
05
7
2
29
(plusmn
46
7)
43
1
62
1
07
1
2
28
(plusmn
43
8)
42
2
59
5
18
7
9
-06
7 (
plusmn 2
78)
45
1
52
3
07
4
2
79
(plusmn
49
0)
34
5
58
2
05
6
3
98
(plusmn
46
8)
45
8
64
1
19
3
10
21
7 (
plusmn 4
52
) 5
74
72
0
03
6
3
20
(plusmn
52
7)
36
5
62
3
05
3
3
17
(plusmn
41
3)
40
2
56
4
17
7
Mea
n
15
2
38
4
51
8
05
7
2
92
35
5
60
4
05
8
2
85
34
8
53
9
15
3
30
3
Fig
ure
4 P
erce
nta
ge
erro
r plo
t fo
r A
CE A
VE a
nd M
R o
ver
eac
h e
nd (
each
set
of
6 a
rro
ws)
and a
ll 7
2 a
rrow
s T
he
red l
ine
(-)
show
the
mea
n
resu
lt f
or
the
Op
erat
ors
E
ach g
rey d
ot
( )
repre
sents
the
Oper
ators
res
ult
s
304
Whilst in the raw data (Table 3) there was no difference between MAE and RMSE the
processed data (Table 4) shows variance in the error The greater the difference between
them the greater the variance in the individual errors in the sample this shows the
accumulation of the error from the individuals inputs Compared to the raw results
(Table 3) Operators 7 8 9 10 (Table 4) were not the worst recorded here although still
amongst the top of the group Operator 6 shows the largest Mean error but MAE and
RMSE are fairly similar showing that the error from this Operator is fairly consistent
when compared to for example Operator 10 who has a far larger discrepancy showing
a more varied deviation from the input data
There is a varied mean result in ACE for the first 4 ends (Figure 4) This does seem to
settle over time so could be due to the novice operators getting acquainted with the
system This variation is not replicated in the AVE or MR results suggesting that these
calculations would not be as susceptible to potential erratic errors
As a demonstration of the effect of the error in a users input to the system Figure 5
shows the calculation of the Accuracy (AVE) and Mean Radius (the outer coloured circle
about the AVE marker) using the minimum value (a and e) and the maximum value (b
and f) entered by any of the 10 operators in comparison to the actual measured values
(c and g) This was produced to show how little visual difference is created from the
range of the inputs recorded The image is cropped to the 9 ring of the target measuring
24cm in diameter
Figure 5 Representation of error using Minimum
and Maximum AVE (o) with Minimum Mean Radius (
measured Mean Radius (green
305
Representation of error using Minimum AVE (x) with Minimum Mean Radius (
with Minimum Mean Radius (blue) and measured
green) from all 10 Operators (X 10 9 indicate the scoring zone
indicates the target centre)
with Minimum Mean Radius (red)
and measured AVE () with
10 9 indicate the scoring zone
4 Discussion
The results demonstrate the system to be reliable and valid between users and when
compared to the measured coordinated
(Y axis) to the system This
and Bird (1981) when using a vertical 10cm scale
horizontal scale This perception
environments by Vishton
overestimation in the virtual environment compared to
system this error could be incorporated into as a calibration routine for each user where
they input X arrows into the system to generate a X and Y bias to remo
remaining data input in the same way that users calibrate touch screen computers
(Vidales 2002)
Perception error in general notations systems warrants further investigation to see if
procedures or designs of systems can be altered to help reduce this error
include shapes colours shading and reference points
within existing systems primarily courtpitch based games are likely to
lines When entering the data into a notational system Hughes and Franks
that by dividing up the space into a smaller area allows for a more detailed analysis but
choosing the correct box to put a position in then becomes harder and a potential
source of error This all links to the perception errors within notational
could be investigated further Within Archery and other shooting sports the targets are
typically banded colours which limits the use of reference points other than the target
centre so previous arrow positions could be used as a
Error identified within the present system shows
The images show an overlap
the point of entry resulting in a large error from the operators
arrow 29 has no occlusion of the arrow (Figure
sequence of the two preceding arrows may have influenced the result
Figure 6 a) Arrow 17 (arrow 5 on image) b) Arrow 29 (arrow 5 on image) (Cropped
306
The results demonstrate the system to be reliable and valid between users and when
compared to the measured coordinated We do see an over estimation in a vertical
(Y axis) to the system This has also been shown to be the case with research
and Bird (1981) when using a vertical 10cm scale to measure pain
perception error as has also been shown in more complex virtual
Vishton et al (1999) and Plumert et al (2005)
overestimation in the virtual environment compared to real world Within the current
system this error could be incorporated into as a calibration routine for each user where
they input X arrows into the system to generate a X and Y bias to remo
remaining data input in the same way that users calibrate touch screen computers
error in general notations systems warrants further investigation to see if
procedures or designs of systems can be altered to help reduce this error
include shapes colours shading and reference points An example of r
xisting systems primarily courtpitch based games are likely to
When entering the data into a notational system Hughes and Franks
that by dividing up the space into a smaller area allows for a more detailed analysis but
choosing the correct box to put a position in then becomes harder and a potential
source of error This all links to the perception errors within notational
could be investigated further Within Archery and other shooting sports the targets are
typically banded colours which limits the use of reference points other than the target
centre so previous arrow positions could be used as a reference
Error identified within the present system shows arrow 17 and 29 to be problematic
an overlap between arrows 5 and 6 (Figure 6a Arrow 5)
the point of entry resulting in a large error from the operators The image containing
arrow 29 has no occlusion of the arrow (Figure 6b Arrow 5) however the entry
sequence of the two preceding arrows may have influenced the result
a) Arrow 17 (arrow 5 on image) b) Arrow 29 (arrow 5 on image) (Cropped
image)
The results demonstrate the system to be reliable and valid between users and when
ver estimation in a vertical input
has also been shown to be the case with research by Dixon
compared to a
been shown in more complex virtual
(2005) showing
Within the current
system this error could be incorporated into as a calibration routine for each user where
they input X arrows into the system to generate a X and Y bias to removeadd to their
remaining data input in the same way that users calibrate touch screen computers
error in general notations systems warrants further investigation to see if
procedures or designs of systems can be altered to help reduce this error This could
An example of reference points
xisting systems primarily courtpitch based games are likely to be the court
When entering the data into a notational system Hughes and Franks (2004) show
that by dividing up the space into a smaller area allows for a more detailed analysis but
choosing the correct box to put a position in then becomes harder and a potential
source of error This all links to the perception errors within notational analysis which
could be investigated further Within Archery and other shooting sports the targets are
typically banded colours which limits the use of reference points other than the target
and 29 to be problematic
a Arrow 5) occluding
The image containing
owever the entry
a) Arrow 17 (arrow 5 on image) b) Arrow 29 (arrow 5 on image) (Cropped
307
The two previous arrows were outer red (Figure 6b Arrow 3) and inner gold (Figure 6b
Arrow 4) If an error was made with the placement of Arrow 3 then the Operator may
have used this as a reference point magnifying the error Errors such as this are
unavoidable using the present system as is occlusion of any arrows entry point into the
target An archer using this system on a PDATablet at the target could have an
advantage over a coach at the side line The archer could move around close to the
target to get the best view possible before entering the data into this type of system
Hughes et al (2002) demonstrate errors in entering the wrong information showing that
nearly 3 of their errors were due to inputting the wrong cell number This shows
favourable results where only 2 operators had these errors arrows input into the wrong
scoring band totalling error of 41 (Operator 3) and 13 (Operator 8) Hand
notation systems will inevitably have a degree of error due to the humans entering the
data Hughes Cooper and Nevill (2002) analysed the number of shots in live Squash
games using two analysts Their results demonstrated less than 1 error when recording
number of shots and was then developed into location ball-wall contact with the wall
divided into 16 cells With this progression the researchers predicted a higher level of
error from counting shots and demonstrated error of over 30 Choi et al (2007)
showed inter-operator reliability between 4 analysts recording variables in basketball
their results demonstrated errors between analysts from 148 to 338 Any issues
with previous hand-entry systems are most likely due to the speed of the games
analysed The longer period of 4 minutes to analyse the arrow locations may explain the
lower error seen in this study compared to others
Maslovat and Franks (2007) discuss that the use of video and computer based
technologies can allow for comprehensive post-event analysis where information can
be slowed to review Within archery slowing videos would be necessary for
biomechanical analysis yet for recording arrow scores this would not be necessary as
the scoring process is currently fairly slow
Arrows are currently scored when all archers have finished shooting and everyone will
approach the targets There is scope for a camera based system or laser based system to
record these arrow positions either as they happen or after completion of the set (end)
of arrows however there are potential cost implications which might only be useable at
top level competitions limiting the analysis potential for up and coming athletes
Danage (2012) produce a scoring system where the archers when at the targets enter
the scores of the arrows in order of highest to lowest Whist entering arrow scores
electronically like this offers a simple solution for summation and the ranking of
individuals in competition or at the club in practice there are limitations in the degree of
analysis that can be performed on that data due to a lack of information gathered when
entering the data Other implications for computerised systems are when multiple
archers are shooting at the same time with typically 3-4 people per target all with
different colour combinations of fletching arrow wraps and nocks these could induce
further occlusion of the arrows Where a person can quickly see the difference and entry
point a computer could have difficulty with some of the occlusions especially with top
archers shooting very tight groups at a short distance
308
Computerised systems that appear for personal use tend to appear as scatter diagram
based software for PDAs (Personal Digital Assistants) such as BowBuddy (Bowbuddy
34) with alternatives starting to appear for the smart phone market on varying operating
systems where the input method can vary between a touch screen or stylus input Touch
screens are becoming a part of everyday life such as point of sales terminals and mobile
devices where the applications may not need high resolution displays with a critical
input due to the size of the soft buttons (Sears and Shneiderman 1991) However some
notational systems may require this critical input The system presented here used a
mouse allowing a far greater level of input when compared to a finger which would take
up a larger percentage of the screen this is where a stylus may offer a better alternative
to a finger (Sears and Shneiderman 1991 Forlines et al 2007) For these reasons
when notational systems transfer over to a portabletouch screen solution they may
need to be re-tested due to this input change
6 Conclusion
To measure marksmanship statistics a valid and reliable system needs to be used The
computerised example shown here allows the input of arrow locations with results
showing X and Y raw data coordinates are acceptable and could be improved with
experience of the system Errors are identified mainly when arrows overlap each other
in other target sports such as pistol shooting where a single hole is left this issue would
likely be overlooked or minimised
Using various statistics to analyse marksmanship allows the coachathleteresearcher to
track varying equipment setups and changes to biomechanics physiology and
psychology allowing for continued athlete sport and equipment development Previous
works in archery could use systems such as this to re-evaluate their results in greater
detail than pure score
7 References
Bannigan K Watson R (2009) Reliability and validity in a nutshell Journal of
Clinical Nursing 18 3237ndash3243
Bar-Eli M and Azar OH (2009) Penalty kicks in soccer an empirical analysis of
shooting strategies and goalkeepersrsquo preferences Soccer and Society 10(2)
183-191
Bowbuddy (Version 34) [Computer Software] UK TBS Software Retrieved from
httpbowbuddycom [Accessed January 2012]
Bruce L Farrow D Raynor A and May E (2009) Notation analysis of skill
expertise differences in netball International Journal of Performance
Analysis of Sport 9 245-254
Choi H OrsquoDonoghue PG and Hughes MD (2007) An investigation of inter-
operator reliability tests for real-time analysis system International Journal
of Performance Analysis of Sport 7(1) 49-61
309
Danage (2012) Scoring Systems Available from
httpwwwdanagetargetscoukscoringsystemsphp [Accessed November 2012]
Di Salvo V Collins A McNeill B Cardinale M (2006) Validation of Prozone reg
A new video-based performance analysis system International Journal of
Performance Analysis in Sport 6(1) 108-119
Dixon JS and Bird HA (1981) Reproducibility along a 10 cm vertical visual
analogue scale Annals of Rheumatic Diseases 40 87-89
Ertan H Soylu A R and Korkusuz F (2005) Quantification the relationship
between FITA scores and EMG skill indexes in archery Journal of
Electromyography and Kinesiology 15 222ndash227
Forlines C and Wigdor D and Shen C and Balakrishnan R (2007) Direct-touch vs
mouse input for tabletop displays Proceedings of the SIGCHI Conference on
Human Factors in Computing Systems 647-656
Hay J amp Reid J (1988) Anatomy Mechanics and Human Motion (2nd Ed)
New Jersey Prentice Hall
Hughes M and Franks IM (2004) Notational analysis - a review of the literature In
Hughes M and Franks IM (Eds) Notational Analysis of Sport Systems for
Better Coaching and Performance in Sport (pp 59-106) London Routledge
Hughes M Cooper S-M and Nevill A (2002) Analysis procedures for non-
parametric data from performance analysis International Journal of
Performance Analysis of Sport 2 6ndash20
IBM (2010) SPSS (Version 19) [Statistics Software]
Johnson RF (2001) Statistical Measures of Marksmanship (Publication No TN-012)
Retrieved from Military Performance Division website httpwwwdticmil
[Accessed January 2012]
Keast D and Elliot B (1990) Fine body movements and the cardiac cycle in
archery Journal of Sports Sciences 8(3) 203-213
Koch C and Tilp M (2009) Analysis of beach volleyball action sequences of
female top athletes Journal of Human Sport and Exercise 4(3) 272-283
Leroyer P Van Hoecke J and Helal JN (1993) Biomechanical study of the final
push-pull in archery Journal of Sports Sciences 11 63-69
Lin K and Hwang C (2005) Analyses of the relationship between the aiming time
and the shot points in archery Journal of Physical Education in Higher
Education 7(4) 161-173
MathWorks The (2007) Matlab (Version 750342) [Programming Software]
Maslovat D and Franks IM (2007) The need for feedback In M Hughes and IM
Franks (Eds) The essentials of performance analysis An introduction (pp
1-7) Abingdon Oxon Routledge
Microsoft (2007) Excel (Version 2007) [Spreadsheet Software]
OrsquoDonoghue P (2010) Research methods for sports performance analysis
Abingdon Oxon Routledge
OrsquoDonoghue P (2012) Statistics for Sport and Exercise Studies Abingdon Oxon
Routledge
Plumert JM and Kearney JK and Cremer JF and Recker K(2005) Distance
perception in real and virtual environments ACM Transactions on
Applied Perception (TAP) 2(3) 216-233
310
Sears A and Shneiderman B (1991) High precision touchscreens design strategies
and comparisons with a mouse International Journal of Man-Machine
Studies 34(4) 593-613
Shrout PE and Fleiss JL (1979) Intraclass Correlations Uses in Assessing Rater
Reliability Psychological Bulletin 86(2) 420-428
Van der Kamp J (2011) Exploring the merits of perceptual anticipation in the soccer
penalty kick Motor Control 15(3) 342-358
Vidales CE (2002) How to calibrate touch screens Embedded Systems
Programming 15(6) 32-40
Vishton PM Rea JG Cutting JE and Nuntildeez LN (1999) Comparing effects of the
horizontal-vertical illusion on grip scaling and judgment Relative versus
absolute not perception versus action Journal of Experimental Psychology
Human Perception and Performance 25(6) 1659-1672
Weir JP (2005) Quantifying test-retest reliability using the intraclass correlation
coefficient and the sem Journal of Strength and Conditioning Research
19(1) 231-240
Wilkinson M Leedale-Brown D and Winter EM (2009) Validity of a Squash-
Specific Fitness Test International Journal of Sports Physiology and
Performance 4 29-40
Wilson K and Barnes CA (1998) Reliability and validity of a computer based
notational analysis system for competitive table tennis In Lees A Maynard I
Hughes M and Reily T (Eds) Science and Racket Sports II (pp 265-268)
London Routledge
World Archery (2010a) FITA Rules and Constitution BOOK 1 Constitution and
Administrative Rules Retrieved from httpwwwarcheryorg [Accessed
November 2011]
World Archery (2010b) FITA Rules and Constitution BOOK 2 Outdoor Archery
Rules Retrieved from httpwwwarcheryorg [Accessed November 2011]
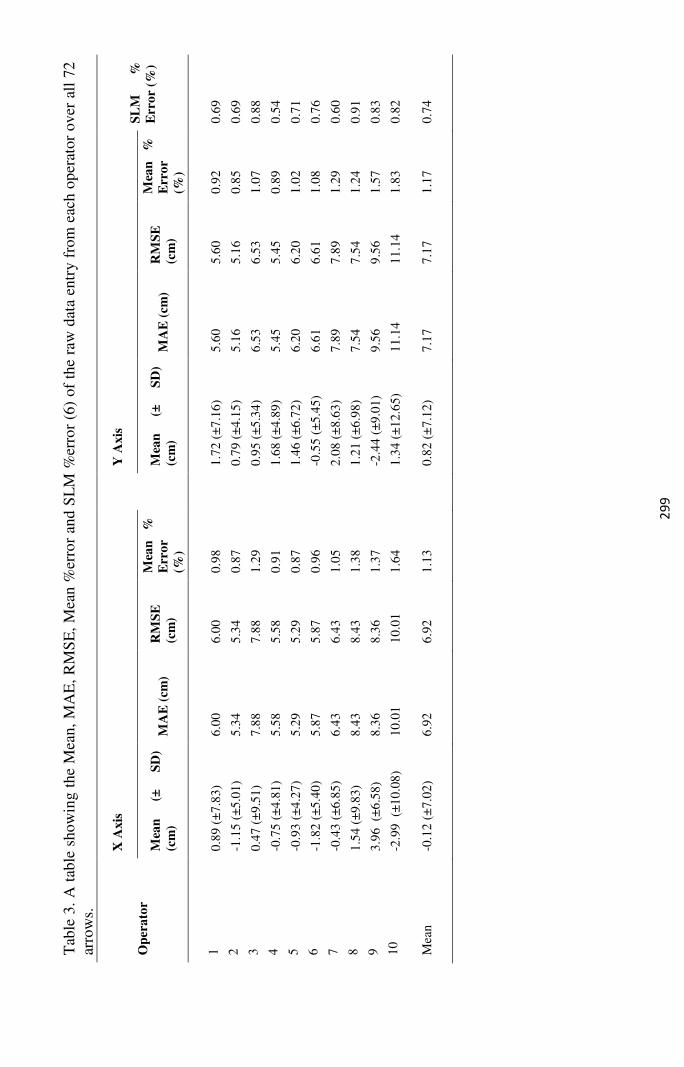
29
9
Tab
le 3
A
tab
le s
how
ing t
he
Mea
n
MA
E
RM
SE
M
ean
erro
r an
d S
LM
er
ror
(6)
of
the
raw
dat
a en
try f
rom
eac
h o
per
ator
over
all
72
arro
ws
Op
era
tor
X A
xis
Y A
xis
SL
M
Err
or
()
Mea
n
(plusmn
SD
)
(cm
) M
AE
(cm
) R
MS
E
(cm
)
Mea
n
Err
or
()
M
ean
(plusmn
S
D)
(cm
) M
AE
(cm
) R
MS
E
(cm
)
Mea
n
Err
or
()
1
0
89
(plusmn
78
3)
60
0
60
0
09
8
17
2 (
plusmn7
16
) 5
60
56
0
09
2
06
9
2
-11
5 (
plusmn50
1)
53
4
53
4
08
7
07
9 (
plusmn4
15
) 5
16
51
6
08
5
06
9
3
04
7 (
plusmn9
51
) 7
88
78
8
12
9
09
5 (
plusmn5
34
) 6
53
65
3
10
7
08
8
4
-07
5 (
plusmn48
1)
55
8
55
8
09
1
16
8 (
plusmn4
89
) 5
45
54
5
08
9
05
4
5
-09
3 (
plusmn42
7)
52
9
52
9
08
7
14
6 (
plusmn6
72
) 6
20
62
0
10
2
07
1
6
-18
2 (
plusmn54
0)
58
7
58
7
09
6
-05
5 (
plusmn54
5)
66
1
66
1
10
8
07
6
7
-04
3 (
plusmn68
5)
64
3
64
3
10
5
20
8 (
plusmn8
63
) 7
89
78
9
12
9
06
0
8
15
4 (
plusmn9
83
) 8
43
84
3
13
8
12
1 (
plusmn6
98
) 7
54
75
4
12
4
09
1
9
39
6 (plusmn
65
8)
83
6
83
6
13
7
-24
4 (
plusmn90
1)
95
6
95
6
15
7
08
3
10
-29
9
(plusmn1
00
8)
10
01
10
01
16
4
13
4 (
plusmn1
26
5)
11
14
11
14
18
3
08
2
Mea
n
-01
2 (
plusmn70
2)
69
2
69
2
11
3
0
82
(plusmn
71
2)
71
7
71
7
11
7
07
4
30
0
Fig
ure
3 P
erce
nta
ge
erro
r fo
r ea
ch a
rrow
show
n f
or
X a
nd Y
ax
is s
epar
atel
y
Red
dots
(
) re
pre
sent
the
mea
n f
or
all
10 o
per
ators
W
hit
e
dots
(
) re
pre
sent
the
each
oper
ators
input
301
The validity of the system is shown in Table 1 Here we can see that the operators input
all produce high significant correlations for each axis when compared to the measured
results Operators 7 8 9 and 10 produce weaker results although still significantly
high under the 099 level This could hint towards a weakness with their ability to judge
vertical distances although the correlation is still very high
Reliability of the system was tested using Inter-Rater reliability using ICC shown in
Table 2 This again shows very high levels of internal correlations Compared to the
results in Table 1 we see some additional drops towards the 097 mark however these
are still significant and not detrimental to the nature of the system This demonstrates
that the system is reliable between users
Table 3 shows the mean results for each user As shown in Table 1 Operators 7 8 9 10
showed lower correlations when compared to the measured results This is highlighted
in Table 3 where operators 8 9 and 10 show the highest error with Operator 3 Operator
3 shows a large MAE in the X and Y axis this is not replicated in Table 1 but could be
hinted at in Table 2 showing the lower ICC than some of the other operators However
their standard deviation (SD) about the mean is amongst the highest The small mean
and large SD shows that their positive and negative error could be cancelling itself out
in terms of the calculations used Operator 7 shown to have lower correlations in Table
1 does not show high errors in the X axis but does in the Y axis Overall we see that
operators tend to under estimate in the horizontal plane (X) placing arrows closer to the
centre yet over estimate in the vertical plane (Y) In spite of this the results (Table 3)
also show that all Operators over all 72 arrows have a mean error of less than 1 in
the straight line distance from the centre point of the target So whilst there is more error
in the Y axis on average when combined the overall resultant error is actually
minimised The RMSE is equal to MAE demonstrating no significant variation in the
error The systematic error for the system is shown to be -012 082 for X and Y
respectively with the random error being plusmn702 and plusmn712
Figure 3 shows the error for each of the 72 arrows This shows that Arrow 17 and 29
show the largest errors Arrow 17 shows large errors in both X and Y axis Arrow 29
shows a large error in the Y axis but comparable in the X axis
30
2
33
Pro
cess
ed R
esu
lts
Tab
le 4
sh
ow
s a
sum
mar
y o
f th
e er
ror
bet
wee
n e
ach o
per
ato
r an
d t
he
mas
ter
calc
ula
tions
for
AC
E A
VE a
nd M
R
Op
era
tor
AC
E
A
VE
MR
Mea
n (
plusmn S
D)
(cm
)
MA
E
(cm
)
RM
SE
(cm
)
SL
M
E
rro
r
M
ean
(plusmn
S
D)
(cm
)
MA
E
(cm
)
RM
SE
(cm
)
SL
M
E
rro
r
M
ean
(plusmn
S
D)
(cm
)
MA
E
(cm
)
RM
SE
(cm
)
Ra
dia
l
E
rro
r
1
0
78
(plusmn
28
8)
28
2
39
5
04
6
2
28
(plusmn
46
2)
27
5
52
2
04
5
2
37
(plusmn
38
6)
30
2
47
8
12
8
2
12
4 (
plusmn 3
49
) 3
08
45
5
05
0
2
13
(plusmn
43
6)
28
0
50
3
04
6
2
09
(plusmn
35
) 2
40
41
7
10
3
3
24
0 (
plusmn 4
92
) 2
94
55
5
04
8
4
42
(plusmn
72
8)
44
9
82
9
07
4
4
32
(plusmn
64
6)
44
1
76
0
19
8
4
14
4 (
plusmn 3
01
) 3
23
43
3
05
3
2
48
(plusmn
48
5)
28
7
54
7
04
7
2
44
(plusmn
38
8)
27
8
46
5
11
9
5
25
8 (
plusmn 4
78
) 4
16
61
9
06
8
3
88
(plusmn
48
7)
38
8
60
7
06
4
3
26
(plusmn
33
2)
32
6
45
5
14
7
6
40
3 (
plusmn 2
99
) 4
03
49
5
06
6
2
53
(plusmn
51
5)
37
7
62
1
06
2
2
11
(plusmn
43
7)
33
1
53
4
14
7
7
16
7 (
plusmn 3
46
) 4
40
55
1
07
2
3
13
(plusmn
48
4)
35
6
58
5
05
8
2
48
(plusmn
41
0)
27
6
48
1
12
9
8
23
4 (
plusmn 2
68
) 3
50
43
5
05
7
2
29
(plusmn
46
7)
43
1
62
1
07
1
2
28
(plusmn
43
8)
42
2
59
5
18
7
9
-06
7 (
plusmn 2
78)
45
1
52
3
07
4
2
79
(plusmn
49
0)
34
5
58
2
05
6
3
98
(plusmn
46
8)
45
8
64
1
19
3
10
21
7 (
plusmn 4
52
) 5
74
72
0
03
6
3
20
(plusmn
52
7)
36
5
62
3
05
3
3
17
(plusmn
41
3)
40
2
56
4
17
7
Mea
n
15
2
38
4
51
8
05
7
2
92
35
5
60
4
05
8
2
85
34
8
53
9
15
3
30
3
Fig
ure
4 P
erce
nta
ge
erro
r plo
t fo
r A
CE A
VE a
nd M
R o
ver
eac
h e
nd (
each
set
of
6 a
rro
ws)
and a
ll 7
2 a
rrow
s T
he
red l
ine
(-)
show
the
mea
n
resu
lt f
or
the
Op
erat
ors
E
ach g
rey d
ot
( )
repre
sents
the
Oper
ators
res
ult
s
304
Whilst in the raw data (Table 3) there was no difference between MAE and RMSE the
processed data (Table 4) shows variance in the error The greater the difference between
them the greater the variance in the individual errors in the sample this shows the
accumulation of the error from the individuals inputs Compared to the raw results
(Table 3) Operators 7 8 9 10 (Table 4) were not the worst recorded here although still
amongst the top of the group Operator 6 shows the largest Mean error but MAE and
RMSE are fairly similar showing that the error from this Operator is fairly consistent
when compared to for example Operator 10 who has a far larger discrepancy showing
a more varied deviation from the input data
There is a varied mean result in ACE for the first 4 ends (Figure 4) This does seem to
settle over time so could be due to the novice operators getting acquainted with the
system This variation is not replicated in the AVE or MR results suggesting that these
calculations would not be as susceptible to potential erratic errors
As a demonstration of the effect of the error in a users input to the system Figure 5
shows the calculation of the Accuracy (AVE) and Mean Radius (the outer coloured circle
about the AVE marker) using the minimum value (a and e) and the maximum value (b
and f) entered by any of the 10 operators in comparison to the actual measured values
(c and g) This was produced to show how little visual difference is created from the
range of the inputs recorded The image is cropped to the 9 ring of the target measuring
24cm in diameter
Figure 5 Representation of error using Minimum
and Maximum AVE (o) with Minimum Mean Radius (
measured Mean Radius (green
305
Representation of error using Minimum AVE (x) with Minimum Mean Radius (
with Minimum Mean Radius (blue) and measured
green) from all 10 Operators (X 10 9 indicate the scoring zone
indicates the target centre)
with Minimum Mean Radius (red)
and measured AVE () with
10 9 indicate the scoring zone
4 Discussion
The results demonstrate the system to be reliable and valid between users and when
compared to the measured coordinated
(Y axis) to the system This
and Bird (1981) when using a vertical 10cm scale
horizontal scale This perception
environments by Vishton
overestimation in the virtual environment compared to
system this error could be incorporated into as a calibration routine for each user where
they input X arrows into the system to generate a X and Y bias to remo
remaining data input in the same way that users calibrate touch screen computers
(Vidales 2002)
Perception error in general notations systems warrants further investigation to see if
procedures or designs of systems can be altered to help reduce this error
include shapes colours shading and reference points
within existing systems primarily courtpitch based games are likely to
lines When entering the data into a notational system Hughes and Franks
that by dividing up the space into a smaller area allows for a more detailed analysis but
choosing the correct box to put a position in then becomes harder and a potential
source of error This all links to the perception errors within notational
could be investigated further Within Archery and other shooting sports the targets are
typically banded colours which limits the use of reference points other than the target
centre so previous arrow positions could be used as a
Error identified within the present system shows
The images show an overlap
the point of entry resulting in a large error from the operators
arrow 29 has no occlusion of the arrow (Figure
sequence of the two preceding arrows may have influenced the result
Figure 6 a) Arrow 17 (arrow 5 on image) b) Arrow 29 (arrow 5 on image) (Cropped
306
The results demonstrate the system to be reliable and valid between users and when
compared to the measured coordinated We do see an over estimation in a vertical
(Y axis) to the system This has also been shown to be the case with research
and Bird (1981) when using a vertical 10cm scale to measure pain
perception error as has also been shown in more complex virtual
Vishton et al (1999) and Plumert et al (2005)
overestimation in the virtual environment compared to real world Within the current
system this error could be incorporated into as a calibration routine for each user where
they input X arrows into the system to generate a X and Y bias to remo
remaining data input in the same way that users calibrate touch screen computers
error in general notations systems warrants further investigation to see if
procedures or designs of systems can be altered to help reduce this error
include shapes colours shading and reference points An example of r
xisting systems primarily courtpitch based games are likely to
When entering the data into a notational system Hughes and Franks
that by dividing up the space into a smaller area allows for a more detailed analysis but
choosing the correct box to put a position in then becomes harder and a potential
source of error This all links to the perception errors within notational
could be investigated further Within Archery and other shooting sports the targets are
typically banded colours which limits the use of reference points other than the target
centre so previous arrow positions could be used as a reference
Error identified within the present system shows arrow 17 and 29 to be problematic
an overlap between arrows 5 and 6 (Figure 6a Arrow 5)
the point of entry resulting in a large error from the operators The image containing
arrow 29 has no occlusion of the arrow (Figure 6b Arrow 5) however the entry
sequence of the two preceding arrows may have influenced the result
a) Arrow 17 (arrow 5 on image) b) Arrow 29 (arrow 5 on image) (Cropped
image)
The results demonstrate the system to be reliable and valid between users and when
ver estimation in a vertical input
has also been shown to be the case with research by Dixon
compared to a
been shown in more complex virtual
(2005) showing
Within the current
system this error could be incorporated into as a calibration routine for each user where
they input X arrows into the system to generate a X and Y bias to removeadd to their
remaining data input in the same way that users calibrate touch screen computers
error in general notations systems warrants further investigation to see if
procedures or designs of systems can be altered to help reduce this error This could
An example of reference points
xisting systems primarily courtpitch based games are likely to be the court
When entering the data into a notational system Hughes and Franks (2004) show
that by dividing up the space into a smaller area allows for a more detailed analysis but
choosing the correct box to put a position in then becomes harder and a potential
source of error This all links to the perception errors within notational analysis which
could be investigated further Within Archery and other shooting sports the targets are
typically banded colours which limits the use of reference points other than the target
and 29 to be problematic
a Arrow 5) occluding
The image containing
owever the entry
a) Arrow 17 (arrow 5 on image) b) Arrow 29 (arrow 5 on image) (Cropped
307
The two previous arrows were outer red (Figure 6b Arrow 3) and inner gold (Figure 6b
Arrow 4) If an error was made with the placement of Arrow 3 then the Operator may
have used this as a reference point magnifying the error Errors such as this are
unavoidable using the present system as is occlusion of any arrows entry point into the
target An archer using this system on a PDATablet at the target could have an
advantage over a coach at the side line The archer could move around close to the
target to get the best view possible before entering the data into this type of system
Hughes et al (2002) demonstrate errors in entering the wrong information showing that
nearly 3 of their errors were due to inputting the wrong cell number This shows
favourable results where only 2 operators had these errors arrows input into the wrong
scoring band totalling error of 41 (Operator 3) and 13 (Operator 8) Hand
notation systems will inevitably have a degree of error due to the humans entering the
data Hughes Cooper and Nevill (2002) analysed the number of shots in live Squash
games using two analysts Their results demonstrated less than 1 error when recording
number of shots and was then developed into location ball-wall contact with the wall
divided into 16 cells With this progression the researchers predicted a higher level of
error from counting shots and demonstrated error of over 30 Choi et al (2007)
showed inter-operator reliability between 4 analysts recording variables in basketball
their results demonstrated errors between analysts from 148 to 338 Any issues
with previous hand-entry systems are most likely due to the speed of the games
analysed The longer period of 4 minutes to analyse the arrow locations may explain the
lower error seen in this study compared to others
Maslovat and Franks (2007) discuss that the use of video and computer based
technologies can allow for comprehensive post-event analysis where information can
be slowed to review Within archery slowing videos would be necessary for
biomechanical analysis yet for recording arrow scores this would not be necessary as
the scoring process is currently fairly slow
Arrows are currently scored when all archers have finished shooting and everyone will
approach the targets There is scope for a camera based system or laser based system to
record these arrow positions either as they happen or after completion of the set (end)
of arrows however there are potential cost implications which might only be useable at
top level competitions limiting the analysis potential for up and coming athletes
Danage (2012) produce a scoring system where the archers when at the targets enter
the scores of the arrows in order of highest to lowest Whist entering arrow scores
electronically like this offers a simple solution for summation and the ranking of
individuals in competition or at the club in practice there are limitations in the degree of
analysis that can be performed on that data due to a lack of information gathered when
entering the data Other implications for computerised systems are when multiple
archers are shooting at the same time with typically 3-4 people per target all with
different colour combinations of fletching arrow wraps and nocks these could induce
further occlusion of the arrows Where a person can quickly see the difference and entry
point a computer could have difficulty with some of the occlusions especially with top
archers shooting very tight groups at a short distance
308
Computerised systems that appear for personal use tend to appear as scatter diagram
based software for PDAs (Personal Digital Assistants) such as BowBuddy (Bowbuddy
34) with alternatives starting to appear for the smart phone market on varying operating
systems where the input method can vary between a touch screen or stylus input Touch
screens are becoming a part of everyday life such as point of sales terminals and mobile
devices where the applications may not need high resolution displays with a critical
input due to the size of the soft buttons (Sears and Shneiderman 1991) However some
notational systems may require this critical input The system presented here used a
mouse allowing a far greater level of input when compared to a finger which would take
up a larger percentage of the screen this is where a stylus may offer a better alternative
to a finger (Sears and Shneiderman 1991 Forlines et al 2007) For these reasons
when notational systems transfer over to a portabletouch screen solution they may
need to be re-tested due to this input change
6 Conclusion
To measure marksmanship statistics a valid and reliable system needs to be used The
computerised example shown here allows the input of arrow locations with results
showing X and Y raw data coordinates are acceptable and could be improved with
experience of the system Errors are identified mainly when arrows overlap each other
in other target sports such as pistol shooting where a single hole is left this issue would
likely be overlooked or minimised
Using various statistics to analyse marksmanship allows the coachathleteresearcher to
track varying equipment setups and changes to biomechanics physiology and
psychology allowing for continued athlete sport and equipment development Previous
works in archery could use systems such as this to re-evaluate their results in greater
detail than pure score
7 References
Bannigan K Watson R (2009) Reliability and validity in a nutshell Journal of
Clinical Nursing 18 3237ndash3243
Bar-Eli M and Azar OH (2009) Penalty kicks in soccer an empirical analysis of
shooting strategies and goalkeepersrsquo preferences Soccer and Society 10(2)
183-191
Bowbuddy (Version 34) [Computer Software] UK TBS Software Retrieved from
httpbowbuddycom [Accessed January 2012]
Bruce L Farrow D Raynor A and May E (2009) Notation analysis of skill
expertise differences in netball International Journal of Performance
Analysis of Sport 9 245-254
Choi H OrsquoDonoghue PG and Hughes MD (2007) An investigation of inter-
operator reliability tests for real-time analysis system International Journal
of Performance Analysis of Sport 7(1) 49-61
309
Danage (2012) Scoring Systems Available from
httpwwwdanagetargetscoukscoringsystemsphp [Accessed November 2012]
Di Salvo V Collins A McNeill B Cardinale M (2006) Validation of Prozone reg
A new video-based performance analysis system International Journal of
Performance Analysis in Sport 6(1) 108-119
Dixon JS and Bird HA (1981) Reproducibility along a 10 cm vertical visual
analogue scale Annals of Rheumatic Diseases 40 87-89
Ertan H Soylu A R and Korkusuz F (2005) Quantification the relationship
between FITA scores and EMG skill indexes in archery Journal of
Electromyography and Kinesiology 15 222ndash227
Forlines C and Wigdor D and Shen C and Balakrishnan R (2007) Direct-touch vs
mouse input for tabletop displays Proceedings of the SIGCHI Conference on
Human Factors in Computing Systems 647-656
Hay J amp Reid J (1988) Anatomy Mechanics and Human Motion (2nd Ed)
New Jersey Prentice Hall
Hughes M and Franks IM (2004) Notational analysis - a review of the literature In
Hughes M and Franks IM (Eds) Notational Analysis of Sport Systems for
Better Coaching and Performance in Sport (pp 59-106) London Routledge
Hughes M Cooper S-M and Nevill A (2002) Analysis procedures for non-
parametric data from performance analysis International Journal of
Performance Analysis of Sport 2 6ndash20
IBM (2010) SPSS (Version 19) [Statistics Software]
Johnson RF (2001) Statistical Measures of Marksmanship (Publication No TN-012)
Retrieved from Military Performance Division website httpwwwdticmil
[Accessed January 2012]
Keast D and Elliot B (1990) Fine body movements and the cardiac cycle in
archery Journal of Sports Sciences 8(3) 203-213
Koch C and Tilp M (2009) Analysis of beach volleyball action sequences of
female top athletes Journal of Human Sport and Exercise 4(3) 272-283
Leroyer P Van Hoecke J and Helal JN (1993) Biomechanical study of the final
push-pull in archery Journal of Sports Sciences 11 63-69
Lin K and Hwang C (2005) Analyses of the relationship between the aiming time
and the shot points in archery Journal of Physical Education in Higher
Education 7(4) 161-173
MathWorks The (2007) Matlab (Version 750342) [Programming Software]
Maslovat D and Franks IM (2007) The need for feedback In M Hughes and IM
Franks (Eds) The essentials of performance analysis An introduction (pp
1-7) Abingdon Oxon Routledge
Microsoft (2007) Excel (Version 2007) [Spreadsheet Software]
OrsquoDonoghue P (2010) Research methods for sports performance analysis
Abingdon Oxon Routledge
OrsquoDonoghue P (2012) Statistics for Sport and Exercise Studies Abingdon Oxon
Routledge
Plumert JM and Kearney JK and Cremer JF and Recker K(2005) Distance
perception in real and virtual environments ACM Transactions on
Applied Perception (TAP) 2(3) 216-233
310
Sears A and Shneiderman B (1991) High precision touchscreens design strategies
and comparisons with a mouse International Journal of Man-Machine
Studies 34(4) 593-613
Shrout PE and Fleiss JL (1979) Intraclass Correlations Uses in Assessing Rater
Reliability Psychological Bulletin 86(2) 420-428
Van der Kamp J (2011) Exploring the merits of perceptual anticipation in the soccer
penalty kick Motor Control 15(3) 342-358
Vidales CE (2002) How to calibrate touch screens Embedded Systems
Programming 15(6) 32-40
Vishton PM Rea JG Cutting JE and Nuntildeez LN (1999) Comparing effects of the
horizontal-vertical illusion on grip scaling and judgment Relative versus
absolute not perception versus action Journal of Experimental Psychology
Human Perception and Performance 25(6) 1659-1672
Weir JP (2005) Quantifying test-retest reliability using the intraclass correlation
coefficient and the sem Journal of Strength and Conditioning Research
19(1) 231-240
Wilkinson M Leedale-Brown D and Winter EM (2009) Validity of a Squash-
Specific Fitness Test International Journal of Sports Physiology and
Performance 4 29-40
Wilson K and Barnes CA (1998) Reliability and validity of a computer based
notational analysis system for competitive table tennis In Lees A Maynard I
Hughes M and Reily T (Eds) Science and Racket Sports II (pp 265-268)
London Routledge
World Archery (2010a) FITA Rules and Constitution BOOK 1 Constitution and
Administrative Rules Retrieved from httpwwwarcheryorg [Accessed
November 2011]
World Archery (2010b) FITA Rules and Constitution BOOK 2 Outdoor Archery
Rules Retrieved from httpwwwarcheryorg [Accessed November 2011]
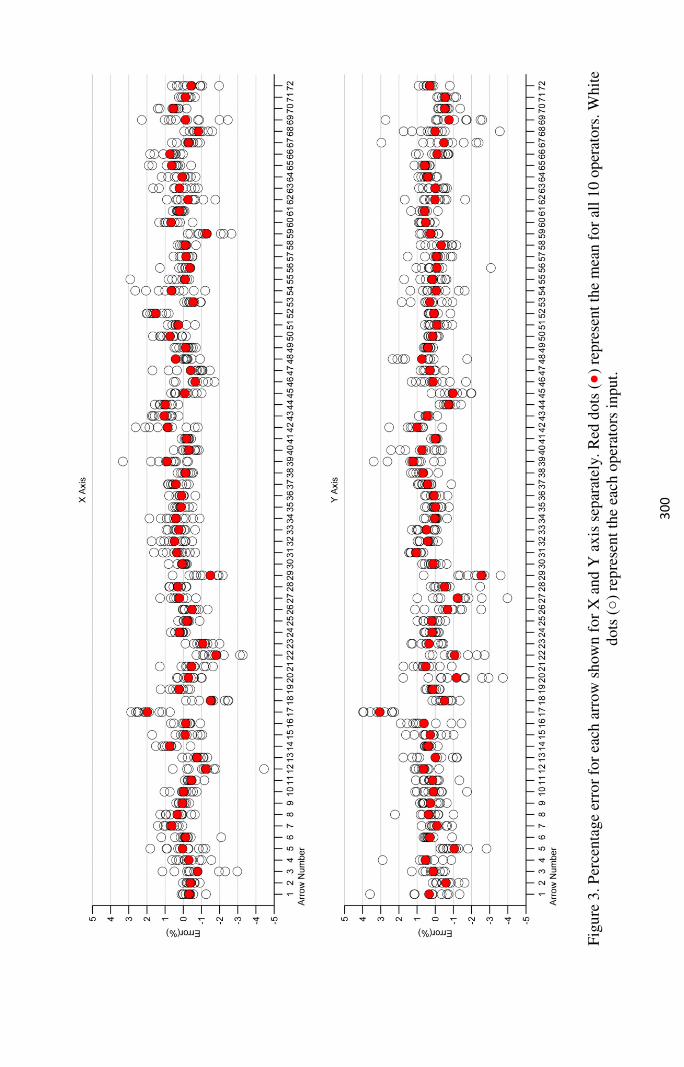
30
0
Fig
ure
3 P
erce
nta
ge
erro
r fo
r ea
ch a
rrow
show
n f
or
X a
nd Y
ax
is s
epar
atel
y
Red
dots
(
) re
pre
sent
the
mea
n f
or
all
10 o
per
ators
W
hit
e
dots
(
) re
pre
sent
the
each
oper
ators
input
301
The validity of the system is shown in Table 1 Here we can see that the operators input
all produce high significant correlations for each axis when compared to the measured
results Operators 7 8 9 and 10 produce weaker results although still significantly
high under the 099 level This could hint towards a weakness with their ability to judge
vertical distances although the correlation is still very high
Reliability of the system was tested using Inter-Rater reliability using ICC shown in
Table 2 This again shows very high levels of internal correlations Compared to the
results in Table 1 we see some additional drops towards the 097 mark however these
are still significant and not detrimental to the nature of the system This demonstrates
that the system is reliable between users
Table 3 shows the mean results for each user As shown in Table 1 Operators 7 8 9 10
showed lower correlations when compared to the measured results This is highlighted
in Table 3 where operators 8 9 and 10 show the highest error with Operator 3 Operator
3 shows a large MAE in the X and Y axis this is not replicated in Table 1 but could be
hinted at in Table 2 showing the lower ICC than some of the other operators However
their standard deviation (SD) about the mean is amongst the highest The small mean
and large SD shows that their positive and negative error could be cancelling itself out
in terms of the calculations used Operator 7 shown to have lower correlations in Table
1 does not show high errors in the X axis but does in the Y axis Overall we see that
operators tend to under estimate in the horizontal plane (X) placing arrows closer to the
centre yet over estimate in the vertical plane (Y) In spite of this the results (Table 3)
also show that all Operators over all 72 arrows have a mean error of less than 1 in
the straight line distance from the centre point of the target So whilst there is more error
in the Y axis on average when combined the overall resultant error is actually
minimised The RMSE is equal to MAE demonstrating no significant variation in the
error The systematic error for the system is shown to be -012 082 for X and Y
respectively with the random error being plusmn702 and plusmn712
Figure 3 shows the error for each of the 72 arrows This shows that Arrow 17 and 29
show the largest errors Arrow 17 shows large errors in both X and Y axis Arrow 29
shows a large error in the Y axis but comparable in the X axis
30
2
33
Pro
cess
ed R
esu
lts
Tab
le 4
sh
ow
s a
sum
mar
y o
f th
e er
ror
bet
wee
n e
ach o
per
ato
r an
d t
he
mas
ter
calc
ula
tions
for
AC
E A
VE a
nd M
R
Op
era
tor
AC
E
A
VE
MR
Mea
n (
plusmn S
D)
(cm
)
MA
E
(cm
)
RM
SE
(cm
)
SL
M
E
rro
r
M
ean
(plusmn
S
D)
(cm
)
MA
E
(cm
)
RM
SE
(cm
)
SL
M
E
rro
r
M
ean
(plusmn
S
D)
(cm
)
MA
E
(cm
)
RM
SE
(cm
)
Ra
dia
l
E
rro
r
1
0
78
(plusmn
28
8)
28
2
39
5
04
6
2
28
(plusmn
46
2)
27
5
52
2
04
5
2
37
(plusmn
38
6)
30
2
47
8
12
8
2
12
4 (
plusmn 3
49
) 3
08
45
5
05
0
2
13
(plusmn
43
6)
28
0
50
3
04
6
2
09
(plusmn
35
) 2
40
41
7
10
3
3
24
0 (
plusmn 4
92
) 2
94
55
5
04
8
4
42
(plusmn
72
8)
44
9
82
9
07
4
4
32
(plusmn
64
6)
44
1
76
0
19
8
4
14
4 (
plusmn 3
01
) 3
23
43
3
05
3
2
48
(plusmn
48
5)
28
7
54
7
04
7
2
44
(plusmn
38
8)
27
8
46
5
11
9
5
25
8 (
plusmn 4
78
) 4
16
61
9
06
8
3
88
(plusmn
48
7)
38
8
60
7
06
4
3
26
(plusmn
33
2)
32
6
45
5
14
7
6
40
3 (
plusmn 2
99
) 4
03
49
5
06
6
2
53
(plusmn
51
5)
37
7
62
1
06
2
2
11
(plusmn
43
7)
33
1
53
4
14
7
7
16
7 (
plusmn 3
46
) 4
40
55
1
07
2
3
13
(plusmn
48
4)
35
6
58
5
05
8
2
48
(plusmn
41
0)
27
6
48
1
12
9
8
23
4 (
plusmn 2
68
) 3
50
43
5
05
7
2
29
(plusmn
46
7)
43
1
62
1
07
1
2
28
(plusmn
43
8)
42
2
59
5
18
7
9
-06
7 (
plusmn 2
78)
45
1
52
3
07
4
2
79
(plusmn
49
0)
34
5
58
2
05
6
3
98
(plusmn
46
8)
45
8
64
1
19
3
10
21
7 (
plusmn 4
52
) 5
74
72
0
03
6
3
20
(plusmn
52
7)
36
5
62
3
05
3
3
17
(plusmn
41
3)
40
2
56
4
17
7
Mea
n
15
2
38
4
51
8
05
7
2
92
35
5
60
4
05
8
2
85
34
8
53
9
15
3
30
3
Fig
ure
4 P
erce
nta
ge
erro
r plo
t fo
r A
CE A
VE a
nd M
R o
ver
eac
h e
nd (
each
set
of
6 a
rro
ws)
and a
ll 7
2 a
rrow
s T
he
red l
ine
(-)
show
the
mea
n
resu
lt f
or
the
Op
erat
ors
E
ach g
rey d
ot
( )
repre
sents
the
Oper
ators
res
ult
s
304
Whilst in the raw data (Table 3) there was no difference between MAE and RMSE the
processed data (Table 4) shows variance in the error The greater the difference between
them the greater the variance in the individual errors in the sample this shows the
accumulation of the error from the individuals inputs Compared to the raw results
(Table 3) Operators 7 8 9 10 (Table 4) were not the worst recorded here although still
amongst the top of the group Operator 6 shows the largest Mean error but MAE and
RMSE are fairly similar showing that the error from this Operator is fairly consistent
when compared to for example Operator 10 who has a far larger discrepancy showing
a more varied deviation from the input data
There is a varied mean result in ACE for the first 4 ends (Figure 4) This does seem to
settle over time so could be due to the novice operators getting acquainted with the
system This variation is not replicated in the AVE or MR results suggesting that these
calculations would not be as susceptible to potential erratic errors
As a demonstration of the effect of the error in a users input to the system Figure 5
shows the calculation of the Accuracy (AVE) and Mean Radius (the outer coloured circle
about the AVE marker) using the minimum value (a and e) and the maximum value (b
and f) entered by any of the 10 operators in comparison to the actual measured values
(c and g) This was produced to show how little visual difference is created from the
range of the inputs recorded The image is cropped to the 9 ring of the target measuring
24cm in diameter
Figure 5 Representation of error using Minimum
and Maximum AVE (o) with Minimum Mean Radius (
measured Mean Radius (green
305
Representation of error using Minimum AVE (x) with Minimum Mean Radius (
with Minimum Mean Radius (blue) and measured
green) from all 10 Operators (X 10 9 indicate the scoring zone
indicates the target centre)
with Minimum Mean Radius (red)
and measured AVE () with
10 9 indicate the scoring zone
4 Discussion
The results demonstrate the system to be reliable and valid between users and when
compared to the measured coordinated
(Y axis) to the system This
and Bird (1981) when using a vertical 10cm scale
horizontal scale This perception
environments by Vishton
overestimation in the virtual environment compared to
system this error could be incorporated into as a calibration routine for each user where
they input X arrows into the system to generate a X and Y bias to remo
remaining data input in the same way that users calibrate touch screen computers
(Vidales 2002)
Perception error in general notations systems warrants further investigation to see if
procedures or designs of systems can be altered to help reduce this error
include shapes colours shading and reference points
within existing systems primarily courtpitch based games are likely to
lines When entering the data into a notational system Hughes and Franks
that by dividing up the space into a smaller area allows for a more detailed analysis but
choosing the correct box to put a position in then becomes harder and a potential
source of error This all links to the perception errors within notational
could be investigated further Within Archery and other shooting sports the targets are
typically banded colours which limits the use of reference points other than the target
centre so previous arrow positions could be used as a
Error identified within the present system shows
The images show an overlap
the point of entry resulting in a large error from the operators
arrow 29 has no occlusion of the arrow (Figure
sequence of the two preceding arrows may have influenced the result
Figure 6 a) Arrow 17 (arrow 5 on image) b) Arrow 29 (arrow 5 on image) (Cropped
306
The results demonstrate the system to be reliable and valid between users and when
compared to the measured coordinated We do see an over estimation in a vertical
(Y axis) to the system This has also been shown to be the case with research
and Bird (1981) when using a vertical 10cm scale to measure pain
perception error as has also been shown in more complex virtual
Vishton et al (1999) and Plumert et al (2005)
overestimation in the virtual environment compared to real world Within the current
system this error could be incorporated into as a calibration routine for each user where
they input X arrows into the system to generate a X and Y bias to remo
remaining data input in the same way that users calibrate touch screen computers
error in general notations systems warrants further investigation to see if
procedures or designs of systems can be altered to help reduce this error
include shapes colours shading and reference points An example of r
xisting systems primarily courtpitch based games are likely to
When entering the data into a notational system Hughes and Franks
that by dividing up the space into a smaller area allows for a more detailed analysis but
choosing the correct box to put a position in then becomes harder and a potential
source of error This all links to the perception errors within notational
could be investigated further Within Archery and other shooting sports the targets are
typically banded colours which limits the use of reference points other than the target
centre so previous arrow positions could be used as a reference
Error identified within the present system shows arrow 17 and 29 to be problematic
an overlap between arrows 5 and 6 (Figure 6a Arrow 5)
the point of entry resulting in a large error from the operators The image containing
arrow 29 has no occlusion of the arrow (Figure 6b Arrow 5) however the entry
sequence of the two preceding arrows may have influenced the result
a) Arrow 17 (arrow 5 on image) b) Arrow 29 (arrow 5 on image) (Cropped
image)
The results demonstrate the system to be reliable and valid between users and when
ver estimation in a vertical input
has also been shown to be the case with research by Dixon
compared to a
been shown in more complex virtual
(2005) showing
Within the current
system this error could be incorporated into as a calibration routine for each user where
they input X arrows into the system to generate a X and Y bias to removeadd to their
remaining data input in the same way that users calibrate touch screen computers
error in general notations systems warrants further investigation to see if
procedures or designs of systems can be altered to help reduce this error This could
An example of reference points
xisting systems primarily courtpitch based games are likely to be the court
When entering the data into a notational system Hughes and Franks (2004) show
that by dividing up the space into a smaller area allows for a more detailed analysis but
choosing the correct box to put a position in then becomes harder and a potential
source of error This all links to the perception errors within notational analysis which
could be investigated further Within Archery and other shooting sports the targets are
typically banded colours which limits the use of reference points other than the target
and 29 to be problematic
a Arrow 5) occluding
The image containing
owever the entry
a) Arrow 17 (arrow 5 on image) b) Arrow 29 (arrow 5 on image) (Cropped
307
The two previous arrows were outer red (Figure 6b Arrow 3) and inner gold (Figure 6b
Arrow 4) If an error was made with the placement of Arrow 3 then the Operator may
have used this as a reference point magnifying the error Errors such as this are
unavoidable using the present system as is occlusion of any arrows entry point into the
target An archer using this system on a PDATablet at the target could have an
advantage over a coach at the side line The archer could move around close to the
target to get the best view possible before entering the data into this type of system
Hughes et al (2002) demonstrate errors in entering the wrong information showing that
nearly 3 of their errors were due to inputting the wrong cell number This shows
favourable results where only 2 operators had these errors arrows input into the wrong
scoring band totalling error of 41 (Operator 3) and 13 (Operator 8) Hand
notation systems will inevitably have a degree of error due to the humans entering the
data Hughes Cooper and Nevill (2002) analysed the number of shots in live Squash
games using two analysts Their results demonstrated less than 1 error when recording
number of shots and was then developed into location ball-wall contact with the wall
divided into 16 cells With this progression the researchers predicted a higher level of
error from counting shots and demonstrated error of over 30 Choi et al (2007)
showed inter-operator reliability between 4 analysts recording variables in basketball
their results demonstrated errors between analysts from 148 to 338 Any issues
with previous hand-entry systems are most likely due to the speed of the games
analysed The longer period of 4 minutes to analyse the arrow locations may explain the
lower error seen in this study compared to others
Maslovat and Franks (2007) discuss that the use of video and computer based
technologies can allow for comprehensive post-event analysis where information can
be slowed to review Within archery slowing videos would be necessary for
biomechanical analysis yet for recording arrow scores this would not be necessary as
the scoring process is currently fairly slow
Arrows are currently scored when all archers have finished shooting and everyone will
approach the targets There is scope for a camera based system or laser based system to
record these arrow positions either as they happen or after completion of the set (end)
of arrows however there are potential cost implications which might only be useable at
top level competitions limiting the analysis potential for up and coming athletes
Danage (2012) produce a scoring system where the archers when at the targets enter
the scores of the arrows in order of highest to lowest Whist entering arrow scores
electronically like this offers a simple solution for summation and the ranking of
individuals in competition or at the club in practice there are limitations in the degree of
analysis that can be performed on that data due to a lack of information gathered when
entering the data Other implications for computerised systems are when multiple
archers are shooting at the same time with typically 3-4 people per target all with
different colour combinations of fletching arrow wraps and nocks these could induce
further occlusion of the arrows Where a person can quickly see the difference and entry
point a computer could have difficulty with some of the occlusions especially with top
archers shooting very tight groups at a short distance
308
Computerised systems that appear for personal use tend to appear as scatter diagram
based software for PDAs (Personal Digital Assistants) such as BowBuddy (Bowbuddy
34) with alternatives starting to appear for the smart phone market on varying operating
systems where the input method can vary between a touch screen or stylus input Touch
screens are becoming a part of everyday life such as point of sales terminals and mobile
devices where the applications may not need high resolution displays with a critical
input due to the size of the soft buttons (Sears and Shneiderman 1991) However some
notational systems may require this critical input The system presented here used a
mouse allowing a far greater level of input when compared to a finger which would take
up a larger percentage of the screen this is where a stylus may offer a better alternative
to a finger (Sears and Shneiderman 1991 Forlines et al 2007) For these reasons
when notational systems transfer over to a portabletouch screen solution they may
need to be re-tested due to this input change
6 Conclusion
To measure marksmanship statistics a valid and reliable system needs to be used The
computerised example shown here allows the input of arrow locations with results
showing X and Y raw data coordinates are acceptable and could be improved with
experience of the system Errors are identified mainly when arrows overlap each other
in other target sports such as pistol shooting where a single hole is left this issue would
likely be overlooked or minimised
Using various statistics to analyse marksmanship allows the coachathleteresearcher to
track varying equipment setups and changes to biomechanics physiology and
psychology allowing for continued athlete sport and equipment development Previous
works in archery could use systems such as this to re-evaluate their results in greater
detail than pure score
7 References
Bannigan K Watson R (2009) Reliability and validity in a nutshell Journal of
Clinical Nursing 18 3237ndash3243
Bar-Eli M and Azar OH (2009) Penalty kicks in soccer an empirical analysis of
shooting strategies and goalkeepersrsquo preferences Soccer and Society 10(2)
183-191
Bowbuddy (Version 34) [Computer Software] UK TBS Software Retrieved from
httpbowbuddycom [Accessed January 2012]
Bruce L Farrow D Raynor A and May E (2009) Notation analysis of skill
expertise differences in netball International Journal of Performance
Analysis of Sport 9 245-254
Choi H OrsquoDonoghue PG and Hughes MD (2007) An investigation of inter-
operator reliability tests for real-time analysis system International Journal
of Performance Analysis of Sport 7(1) 49-61
309
Danage (2012) Scoring Systems Available from
httpwwwdanagetargetscoukscoringsystemsphp [Accessed November 2012]
Di Salvo V Collins A McNeill B Cardinale M (2006) Validation of Prozone reg
A new video-based performance analysis system International Journal of
Performance Analysis in Sport 6(1) 108-119
Dixon JS and Bird HA (1981) Reproducibility along a 10 cm vertical visual
analogue scale Annals of Rheumatic Diseases 40 87-89
Ertan H Soylu A R and Korkusuz F (2005) Quantification the relationship
between FITA scores and EMG skill indexes in archery Journal of
Electromyography and Kinesiology 15 222ndash227
Forlines C and Wigdor D and Shen C and Balakrishnan R (2007) Direct-touch vs
mouse input for tabletop displays Proceedings of the SIGCHI Conference on
Human Factors in Computing Systems 647-656
Hay J amp Reid J (1988) Anatomy Mechanics and Human Motion (2nd Ed)
New Jersey Prentice Hall
Hughes M and Franks IM (2004) Notational analysis - a review of the literature In
Hughes M and Franks IM (Eds) Notational Analysis of Sport Systems for
Better Coaching and Performance in Sport (pp 59-106) London Routledge
Hughes M Cooper S-M and Nevill A (2002) Analysis procedures for non-
parametric data from performance analysis International Journal of
Performance Analysis of Sport 2 6ndash20
IBM (2010) SPSS (Version 19) [Statistics Software]
Johnson RF (2001) Statistical Measures of Marksmanship (Publication No TN-012)
Retrieved from Military Performance Division website httpwwwdticmil
[Accessed January 2012]
Keast D and Elliot B (1990) Fine body movements and the cardiac cycle in
archery Journal of Sports Sciences 8(3) 203-213
Koch C and Tilp M (2009) Analysis of beach volleyball action sequences of
female top athletes Journal of Human Sport and Exercise 4(3) 272-283
Leroyer P Van Hoecke J and Helal JN (1993) Biomechanical study of the final
push-pull in archery Journal of Sports Sciences 11 63-69
Lin K and Hwang C (2005) Analyses of the relationship between the aiming time
and the shot points in archery Journal of Physical Education in Higher
Education 7(4) 161-173
MathWorks The (2007) Matlab (Version 750342) [Programming Software]
Maslovat D and Franks IM (2007) The need for feedback In M Hughes and IM
Franks (Eds) The essentials of performance analysis An introduction (pp
1-7) Abingdon Oxon Routledge
Microsoft (2007) Excel (Version 2007) [Spreadsheet Software]
OrsquoDonoghue P (2010) Research methods for sports performance analysis
Abingdon Oxon Routledge
OrsquoDonoghue P (2012) Statistics for Sport and Exercise Studies Abingdon Oxon
Routledge
Plumert JM and Kearney JK and Cremer JF and Recker K(2005) Distance
perception in real and virtual environments ACM Transactions on
Applied Perception (TAP) 2(3) 216-233
310
Sears A and Shneiderman B (1991) High precision touchscreens design strategies
and comparisons with a mouse International Journal of Man-Machine
Studies 34(4) 593-613
Shrout PE and Fleiss JL (1979) Intraclass Correlations Uses in Assessing Rater
Reliability Psychological Bulletin 86(2) 420-428
Van der Kamp J (2011) Exploring the merits of perceptual anticipation in the soccer
penalty kick Motor Control 15(3) 342-358
Vidales CE (2002) How to calibrate touch screens Embedded Systems
Programming 15(6) 32-40
Vishton PM Rea JG Cutting JE and Nuntildeez LN (1999) Comparing effects of the
horizontal-vertical illusion on grip scaling and judgment Relative versus
absolute not perception versus action Journal of Experimental Psychology
Human Perception and Performance 25(6) 1659-1672
Weir JP (2005) Quantifying test-retest reliability using the intraclass correlation
coefficient and the sem Journal of Strength and Conditioning Research
19(1) 231-240
Wilkinson M Leedale-Brown D and Winter EM (2009) Validity of a Squash-
Specific Fitness Test International Journal of Sports Physiology and
Performance 4 29-40
Wilson K and Barnes CA (1998) Reliability and validity of a computer based
notational analysis system for competitive table tennis In Lees A Maynard I
Hughes M and Reily T (Eds) Science and Racket Sports II (pp 265-268)
London Routledge
World Archery (2010a) FITA Rules and Constitution BOOK 1 Constitution and
Administrative Rules Retrieved from httpwwwarcheryorg [Accessed
November 2011]
World Archery (2010b) FITA Rules and Constitution BOOK 2 Outdoor Archery
Rules Retrieved from httpwwwarcheryorg [Accessed November 2011]

30
2
33
Pro
cess
ed R
esu
lts
Tab
le 4
sh
ow
s a
sum
mar
y o
f th
e er
ror
bet
wee
n e
ach o
per
ato
r an
d t
he
mas
ter
calc
ula
tions
for
AC
E A
VE a
nd M
R
Op
era
tor
AC
E
A
VE
MR
Mea
n (
plusmn S
D)
(cm
)
MA
E
(cm
)
RM
SE
(cm
)
SL
M
E
rro
r
M
ean
(plusmn
S
D)
(cm
)
MA
E
(cm
)
RM
SE
(cm
)
SL
M
E
rro
r
M
ean
(plusmn
S
D)
(cm
)
MA
E
(cm
)
RM
SE
(cm
)
Ra
dia
l
E
rro
r
1
0
78
(plusmn
28
8)
28
2
39
5
04
6
2
28
(plusmn
46
2)
27
5
52
2
04
5
2
37
(plusmn
38
6)
30
2
47
8
12
8
2
12
4 (
plusmn 3
49
) 3
08
45
5
05
0
2
13
(plusmn
43
6)
28
0
50
3
04
6
2
09
(plusmn
35
) 2
40
41
7
10
3
3
24
0 (
plusmn 4
92
) 2
94
55
5
04
8
4
42
(plusmn
72
8)
44
9
82
9
07
4
4
32
(plusmn
64
6)
44
1
76
0
19
8
4
14
4 (
plusmn 3
01
) 3
23
43
3
05
3
2
48
(plusmn
48
5)
28
7
54
7
04
7
2
44
(plusmn
38
8)
27
8
46
5
11
9
5
25
8 (
plusmn 4
78
) 4
16
61
9
06
8
3
88
(plusmn
48
7)
38
8
60
7
06
4
3
26
(plusmn
33
2)
32
6
45
5
14
7
6
40
3 (
plusmn 2
99
) 4
03
49
5
06
6
2
53
(plusmn
51
5)
37
7
62
1
06
2
2
11
(plusmn
43
7)
33
1
53
4
14
7
7
16
7 (
plusmn 3
46
) 4
40
55
1
07
2
3
13
(plusmn
48
4)
35
6
58
5
05
8
2
48
(plusmn
41
0)
27
6
48
1
12
9
8
23
4 (
plusmn 2
68
) 3
50
43
5
05
7
2
29
(plusmn
46
7)
43
1
62
1
07
1
2
28
(plusmn
43
8)
42
2
59
5
18
7
9
-06
7 (
plusmn 2
78)
45
1
52
3
07
4
2
79
(plusmn
49
0)
34
5
58
2
05
6
3
98
(plusmn
46
8)
45
8
64
1
19
3
10
21
7 (
plusmn 4
52
) 5
74
72
0
03
6
3
20
(plusmn
52
7)
36
5
62
3
05
3
3
17
(plusmn
41
3)
40
2
56
4
17
7
Mea
n
15
2
38
4
51
8
05
7
2
92
35
5
60
4
05
8
2
85
34
8
53
9
15
3
30
3
Fig
ure
4 P
erce
nta
ge
erro
r plo
t fo
r A
CE A
VE a
nd M
R o
ver
eac
h e
nd (
each
set
of
6 a
rro
ws)
and a
ll 7
2 a
rrow
s T
he
red l
ine
(-)
show
the
mea
n
resu
lt f
or
the
Op
erat
ors
E
ach g
rey d
ot
( )
repre
sents
the
Oper
ators
res
ult
s
304
Whilst in the raw data (Table 3) there was no difference between MAE and RMSE the
processed data (Table 4) shows variance in the error The greater the difference between
them the greater the variance in the individual errors in the sample this shows the
accumulation of the error from the individuals inputs Compared to the raw results
(Table 3) Operators 7 8 9 10 (Table 4) were not the worst recorded here although still
amongst the top of the group Operator 6 shows the largest Mean error but MAE and
RMSE are fairly similar showing that the error from this Operator is fairly consistent
when compared to for example Operator 10 who has a far larger discrepancy showing
a more varied deviation from the input data
There is a varied mean result in ACE for the first 4 ends (Figure 4) This does seem to
settle over time so could be due to the novice operators getting acquainted with the
system This variation is not replicated in the AVE or MR results suggesting that these
calculations would not be as susceptible to potential erratic errors
As a demonstration of the effect of the error in a users input to the system Figure 5
shows the calculation of the Accuracy (AVE) and Mean Radius (the outer coloured circle
about the AVE marker) using the minimum value (a and e) and the maximum value (b
and f) entered by any of the 10 operators in comparison to the actual measured values
(c and g) This was produced to show how little visual difference is created from the
range of the inputs recorded The image is cropped to the 9 ring of the target measuring
24cm in diameter
Figure 5 Representation of error using Minimum
and Maximum AVE (o) with Minimum Mean Radius (
measured Mean Radius (green
305
Representation of error using Minimum AVE (x) with Minimum Mean Radius (
with Minimum Mean Radius (blue) and measured
green) from all 10 Operators (X 10 9 indicate the scoring zone
indicates the target centre)
with Minimum Mean Radius (red)
and measured AVE () with
10 9 indicate the scoring zone
4 Discussion
The results demonstrate the system to be reliable and valid between users and when
compared to the measured coordinated
(Y axis) to the system This
and Bird (1981) when using a vertical 10cm scale
horizontal scale This perception
environments by Vishton
overestimation in the virtual environment compared to
system this error could be incorporated into as a calibration routine for each user where
they input X arrows into the system to generate a X and Y bias to remo
remaining data input in the same way that users calibrate touch screen computers
(Vidales 2002)
Perception error in general notations systems warrants further investigation to see if
procedures or designs of systems can be altered to help reduce this error
include shapes colours shading and reference points
within existing systems primarily courtpitch based games are likely to
lines When entering the data into a notational system Hughes and Franks
that by dividing up the space into a smaller area allows for a more detailed analysis but
choosing the correct box to put a position in then becomes harder and a potential
source of error This all links to the perception errors within notational
could be investigated further Within Archery and other shooting sports the targets are
typically banded colours which limits the use of reference points other than the target
centre so previous arrow positions could be used as a
Error identified within the present system shows
The images show an overlap
the point of entry resulting in a large error from the operators
arrow 29 has no occlusion of the arrow (Figure
sequence of the two preceding arrows may have influenced the result
Figure 6 a) Arrow 17 (arrow 5 on image) b) Arrow 29 (arrow 5 on image) (Cropped
306
The results demonstrate the system to be reliable and valid between users and when
compared to the measured coordinated We do see an over estimation in a vertical
(Y axis) to the system This has also been shown to be the case with research
and Bird (1981) when using a vertical 10cm scale to measure pain
perception error as has also been shown in more complex virtual
Vishton et al (1999) and Plumert et al (2005)
overestimation in the virtual environment compared to real world Within the current
system this error could be incorporated into as a calibration routine for each user where
they input X arrows into the system to generate a X and Y bias to remo
remaining data input in the same way that users calibrate touch screen computers
error in general notations systems warrants further investigation to see if
procedures or designs of systems can be altered to help reduce this error
include shapes colours shading and reference points An example of r
xisting systems primarily courtpitch based games are likely to
When entering the data into a notational system Hughes and Franks
that by dividing up the space into a smaller area allows for a more detailed analysis but
choosing the correct box to put a position in then becomes harder and a potential
source of error This all links to the perception errors within notational
could be investigated further Within Archery and other shooting sports the targets are
typically banded colours which limits the use of reference points other than the target
centre so previous arrow positions could be used as a reference
Error identified within the present system shows arrow 17 and 29 to be problematic
an overlap between arrows 5 and 6 (Figure 6a Arrow 5)
the point of entry resulting in a large error from the operators The image containing
arrow 29 has no occlusion of the arrow (Figure 6b Arrow 5) however the entry
sequence of the two preceding arrows may have influenced the result
a) Arrow 17 (arrow 5 on image) b) Arrow 29 (arrow 5 on image) (Cropped
image)
The results demonstrate the system to be reliable and valid between users and when
ver estimation in a vertical input
has also been shown to be the case with research by Dixon
compared to a
been shown in more complex virtual
(2005) showing
Within the current
system this error could be incorporated into as a calibration routine for each user where
they input X arrows into the system to generate a X and Y bias to removeadd to their
remaining data input in the same way that users calibrate touch screen computers
error in general notations systems warrants further investigation to see if
procedures or designs of systems can be altered to help reduce this error This could
An example of reference points
xisting systems primarily courtpitch based games are likely to be the court
When entering the data into a notational system Hughes and Franks (2004) show
that by dividing up the space into a smaller area allows for a more detailed analysis but
choosing the correct box to put a position in then becomes harder and a potential
source of error This all links to the perception errors within notational analysis which
could be investigated further Within Archery and other shooting sports the targets are
typically banded colours which limits the use of reference points other than the target
and 29 to be problematic
a Arrow 5) occluding
The image containing
owever the entry
a) Arrow 17 (arrow 5 on image) b) Arrow 29 (arrow 5 on image) (Cropped
307
The two previous arrows were outer red (Figure 6b Arrow 3) and inner gold (Figure 6b
Arrow 4) If an error was made with the placement of Arrow 3 then the Operator may
have used this as a reference point magnifying the error Errors such as this are
unavoidable using the present system as is occlusion of any arrows entry point into the
target An archer using this system on a PDATablet at the target could have an
advantage over a coach at the side line The archer could move around close to the
target to get the best view possible before entering the data into this type of system
Hughes et al (2002) demonstrate errors in entering the wrong information showing that
nearly 3 of their errors were due to inputting the wrong cell number This shows
favourable results where only 2 operators had these errors arrows input into the wrong
scoring band totalling error of 41 (Operator 3) and 13 (Operator 8) Hand
notation systems will inevitably have a degree of error due to the humans entering the
data Hughes Cooper and Nevill (2002) analysed the number of shots in live Squash
games using two analysts Their results demonstrated less than 1 error when recording
number of shots and was then developed into location ball-wall contact with the wall
divided into 16 cells With this progression the researchers predicted a higher level of
error from counting shots and demonstrated error of over 30 Choi et al (2007)
showed inter-operator reliability between 4 analysts recording variables in basketball
their results demonstrated errors between analysts from 148 to 338 Any issues
with previous hand-entry systems are most likely due to the speed of the games
analysed The longer period of 4 minutes to analyse the arrow locations may explain the
lower error seen in this study compared to others
Maslovat and Franks (2007) discuss that the use of video and computer based
technologies can allow for comprehensive post-event analysis where information can
be slowed to review Within archery slowing videos would be necessary for
biomechanical analysis yet for recording arrow scores this would not be necessary as
the scoring process is currently fairly slow
Arrows are currently scored when all archers have finished shooting and everyone will
approach the targets There is scope for a camera based system or laser based system to
record these arrow positions either as they happen or after completion of the set (end)
of arrows however there are potential cost implications which might only be useable at
top level competitions limiting the analysis potential for up and coming athletes
Danage (2012) produce a scoring system where the archers when at the targets enter
the scores of the arrows in order of highest to lowest Whist entering arrow scores
electronically like this offers a simple solution for summation and the ranking of
individuals in competition or at the club in practice there are limitations in the degree of
analysis that can be performed on that data due to a lack of information gathered when
entering the data Other implications for computerised systems are when multiple
archers are shooting at the same time with typically 3-4 people per target all with
different colour combinations of fletching arrow wraps and nocks these could induce
further occlusion of the arrows Where a person can quickly see the difference and entry
point a computer could have difficulty with some of the occlusions especially with top
archers shooting very tight groups at a short distance
308
Computerised systems that appear for personal use tend to appear as scatter diagram
based software for PDAs (Personal Digital Assistants) such as BowBuddy (Bowbuddy
34) with alternatives starting to appear for the smart phone market on varying operating
systems where the input method can vary between a touch screen or stylus input Touch
screens are becoming a part of everyday life such as point of sales terminals and mobile
devices where the applications may not need high resolution displays with a critical
input due to the size of the soft buttons (Sears and Shneiderman 1991) However some
notational systems may require this critical input The system presented here used a
mouse allowing a far greater level of input when compared to a finger which would take
up a larger percentage of the screen this is where a stylus may offer a better alternative
to a finger (Sears and Shneiderman 1991 Forlines et al 2007) For these reasons
when notational systems transfer over to a portabletouch screen solution they may
need to be re-tested due to this input change
6 Conclusion
To measure marksmanship statistics a valid and reliable system needs to be used The
computerised example shown here allows the input of arrow locations with results
showing X and Y raw data coordinates are acceptable and could be improved with
experience of the system Errors are identified mainly when arrows overlap each other
in other target sports such as pistol shooting where a single hole is left this issue would
likely be overlooked or minimised
Using various statistics to analyse marksmanship allows the coachathleteresearcher to
track varying equipment setups and changes to biomechanics physiology and
psychology allowing for continued athlete sport and equipment development Previous
works in archery could use systems such as this to re-evaluate their results in greater
detail than pure score
7 References
Bannigan K Watson R (2009) Reliability and validity in a nutshell Journal of
Clinical Nursing 18 3237ndash3243
Bar-Eli M and Azar OH (2009) Penalty kicks in soccer an empirical analysis of
shooting strategies and goalkeepersrsquo preferences Soccer and Society 10(2)
183-191
Bowbuddy (Version 34) [Computer Software] UK TBS Software Retrieved from
httpbowbuddycom [Accessed January 2012]
Bruce L Farrow D Raynor A and May E (2009) Notation analysis of skill
expertise differences in netball International Journal of Performance
Analysis of Sport 9 245-254
Choi H OrsquoDonoghue PG and Hughes MD (2007) An investigation of inter-
operator reliability tests for real-time analysis system International Journal
of Performance Analysis of Sport 7(1) 49-61
309
Danage (2012) Scoring Systems Available from
httpwwwdanagetargetscoukscoringsystemsphp [Accessed November 2012]
Di Salvo V Collins A McNeill B Cardinale M (2006) Validation of Prozone reg
A new video-based performance analysis system International Journal of
Performance Analysis in Sport 6(1) 108-119
Dixon JS and Bird HA (1981) Reproducibility along a 10 cm vertical visual
analogue scale Annals of Rheumatic Diseases 40 87-89
Ertan H Soylu A R and Korkusuz F (2005) Quantification the relationship
between FITA scores and EMG skill indexes in archery Journal of
Electromyography and Kinesiology 15 222ndash227
Forlines C and Wigdor D and Shen C and Balakrishnan R (2007) Direct-touch vs
mouse input for tabletop displays Proceedings of the SIGCHI Conference on
Human Factors in Computing Systems 647-656
Hay J amp Reid J (1988) Anatomy Mechanics and Human Motion (2nd Ed)
New Jersey Prentice Hall
Hughes M and Franks IM (2004) Notational analysis - a review of the literature In
Hughes M and Franks IM (Eds) Notational Analysis of Sport Systems for
Better Coaching and Performance in Sport (pp 59-106) London Routledge
Hughes M Cooper S-M and Nevill A (2002) Analysis procedures for non-
parametric data from performance analysis International Journal of
Performance Analysis of Sport 2 6ndash20
IBM (2010) SPSS (Version 19) [Statistics Software]
Johnson RF (2001) Statistical Measures of Marksmanship (Publication No TN-012)
Retrieved from Military Performance Division website httpwwwdticmil
[Accessed January 2012]
Keast D and Elliot B (1990) Fine body movements and the cardiac cycle in
archery Journal of Sports Sciences 8(3) 203-213
Koch C and Tilp M (2009) Analysis of beach volleyball action sequences of
female top athletes Journal of Human Sport and Exercise 4(3) 272-283
Leroyer P Van Hoecke J and Helal JN (1993) Biomechanical study of the final
push-pull in archery Journal of Sports Sciences 11 63-69
Lin K and Hwang C (2005) Analyses of the relationship between the aiming time
and the shot points in archery Journal of Physical Education in Higher
Education 7(4) 161-173
MathWorks The (2007) Matlab (Version 750342) [Programming Software]
Maslovat D and Franks IM (2007) The need for feedback In M Hughes and IM
Franks (Eds) The essentials of performance analysis An introduction (pp
1-7) Abingdon Oxon Routledge
Microsoft (2007) Excel (Version 2007) [Spreadsheet Software]
OrsquoDonoghue P (2010) Research methods for sports performance analysis
Abingdon Oxon Routledge
OrsquoDonoghue P (2012) Statistics for Sport and Exercise Studies Abingdon Oxon
Routledge
Plumert JM and Kearney JK and Cremer JF and Recker K(2005) Distance
perception in real and virtual environments ACM Transactions on
Applied Perception (TAP) 2(3) 216-233
310
Sears A and Shneiderman B (1991) High precision touchscreens design strategies
and comparisons with a mouse International Journal of Man-Machine
Studies 34(4) 593-613
Shrout PE and Fleiss JL (1979) Intraclass Correlations Uses in Assessing Rater
Reliability Psychological Bulletin 86(2) 420-428
Van der Kamp J (2011) Exploring the merits of perceptual anticipation in the soccer
penalty kick Motor Control 15(3) 342-358
Vidales CE (2002) How to calibrate touch screens Embedded Systems
Programming 15(6) 32-40
Vishton PM Rea JG Cutting JE and Nuntildeez LN (1999) Comparing effects of the
horizontal-vertical illusion on grip scaling and judgment Relative versus
absolute not perception versus action Journal of Experimental Psychology
Human Perception and Performance 25(6) 1659-1672
Weir JP (2005) Quantifying test-retest reliability using the intraclass correlation
coefficient and the sem Journal of Strength and Conditioning Research
19(1) 231-240
Wilkinson M Leedale-Brown D and Winter EM (2009) Validity of a Squash-
Specific Fitness Test International Journal of Sports Physiology and
Performance 4 29-40
Wilson K and Barnes CA (1998) Reliability and validity of a computer based
notational analysis system for competitive table tennis In Lees A Maynard I
Hughes M and Reily T (Eds) Science and Racket Sports II (pp 265-268)
London Routledge
World Archery (2010a) FITA Rules and Constitution BOOK 1 Constitution and
Administrative Rules Retrieved from httpwwwarcheryorg [Accessed
November 2011]
World Archery (2010b) FITA Rules and Constitution BOOK 2 Outdoor Archery
Rules Retrieved from httpwwwarcheryorg [Accessed November 2011]
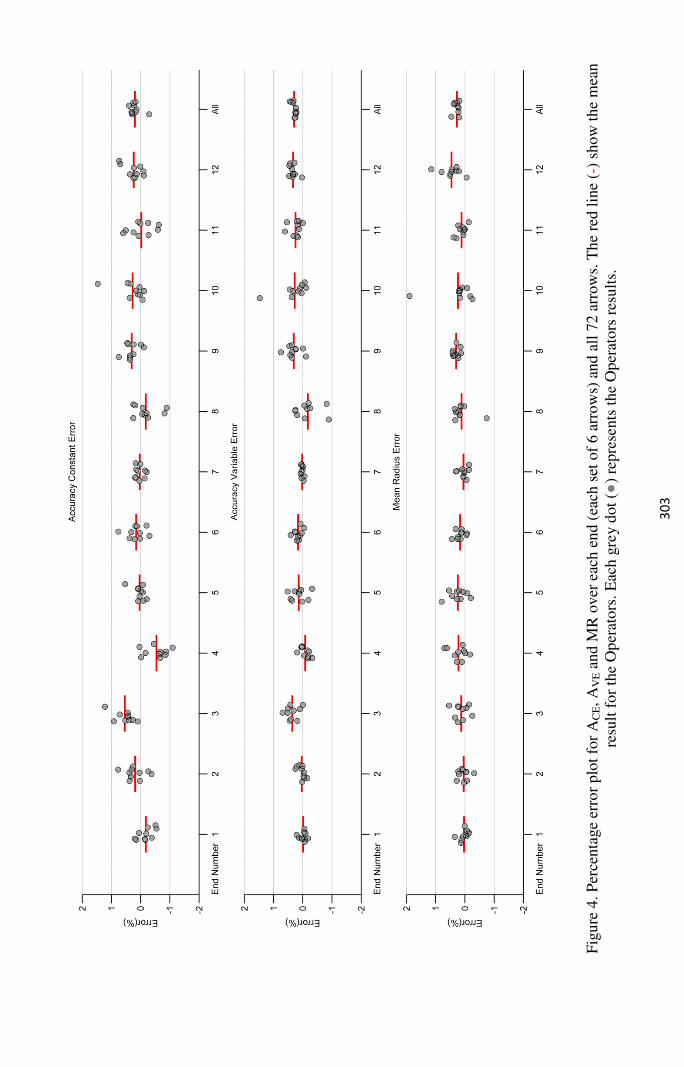
30
3
Fig
ure
4 P
erce
nta
ge
erro
r plo
t fo
r A
CE A
VE a
nd M
R o
ver
eac
h e
nd (
each
set
of
6 a
rro
ws)
and a
ll 7
2 a
rrow
s T
he
red l
ine
(-)
show
the
mea
n
resu
lt f
or
the
Op
erat
ors
E
ach g
rey d
ot
( )
repre
sents
the
Oper
ators
res
ult
s
304
Whilst in the raw data (Table 3) there was no difference between MAE and RMSE the
processed data (Table 4) shows variance in the error The greater the difference between
them the greater the variance in the individual errors in the sample this shows the
accumulation of the error from the individuals inputs Compared to the raw results
(Table 3) Operators 7 8 9 10 (Table 4) were not the worst recorded here although still
amongst the top of the group Operator 6 shows the largest Mean error but MAE and
RMSE are fairly similar showing that the error from this Operator is fairly consistent
when compared to for example Operator 10 who has a far larger discrepancy showing
a more varied deviation from the input data
There is a varied mean result in ACE for the first 4 ends (Figure 4) This does seem to
settle over time so could be due to the novice operators getting acquainted with the
system This variation is not replicated in the AVE or MR results suggesting that these
calculations would not be as susceptible to potential erratic errors
As a demonstration of the effect of the error in a users input to the system Figure 5
shows the calculation of the Accuracy (AVE) and Mean Radius (the outer coloured circle
about the AVE marker) using the minimum value (a and e) and the maximum value (b
and f) entered by any of the 10 operators in comparison to the actual measured values
(c and g) This was produced to show how little visual difference is created from the
range of the inputs recorded The image is cropped to the 9 ring of the target measuring
24cm in diameter
Figure 5 Representation of error using Minimum
and Maximum AVE (o) with Minimum Mean Radius (
measured Mean Radius (green
305
Representation of error using Minimum AVE (x) with Minimum Mean Radius (
with Minimum Mean Radius (blue) and measured
green) from all 10 Operators (X 10 9 indicate the scoring zone
indicates the target centre)
with Minimum Mean Radius (red)
and measured AVE () with
10 9 indicate the scoring zone
4 Discussion
The results demonstrate the system to be reliable and valid between users and when
compared to the measured coordinated
(Y axis) to the system This
and Bird (1981) when using a vertical 10cm scale
horizontal scale This perception
environments by Vishton
overestimation in the virtual environment compared to
system this error could be incorporated into as a calibration routine for each user where
they input X arrows into the system to generate a X and Y bias to remo
remaining data input in the same way that users calibrate touch screen computers
(Vidales 2002)
Perception error in general notations systems warrants further investigation to see if
procedures or designs of systems can be altered to help reduce this error
include shapes colours shading and reference points
within existing systems primarily courtpitch based games are likely to
lines When entering the data into a notational system Hughes and Franks
that by dividing up the space into a smaller area allows for a more detailed analysis but
choosing the correct box to put a position in then becomes harder and a potential
source of error This all links to the perception errors within notational
could be investigated further Within Archery and other shooting sports the targets are
typically banded colours which limits the use of reference points other than the target
centre so previous arrow positions could be used as a
Error identified within the present system shows
The images show an overlap
the point of entry resulting in a large error from the operators
arrow 29 has no occlusion of the arrow (Figure
sequence of the two preceding arrows may have influenced the result
Figure 6 a) Arrow 17 (arrow 5 on image) b) Arrow 29 (arrow 5 on image) (Cropped
306
The results demonstrate the system to be reliable and valid between users and when
compared to the measured coordinated We do see an over estimation in a vertical
(Y axis) to the system This has also been shown to be the case with research
and Bird (1981) when using a vertical 10cm scale to measure pain
perception error as has also been shown in more complex virtual
Vishton et al (1999) and Plumert et al (2005)
overestimation in the virtual environment compared to real world Within the current
system this error could be incorporated into as a calibration routine for each user where
they input X arrows into the system to generate a X and Y bias to remo
remaining data input in the same way that users calibrate touch screen computers
error in general notations systems warrants further investigation to see if
procedures or designs of systems can be altered to help reduce this error
include shapes colours shading and reference points An example of r
xisting systems primarily courtpitch based games are likely to
When entering the data into a notational system Hughes and Franks
that by dividing up the space into a smaller area allows for a more detailed analysis but
choosing the correct box to put a position in then becomes harder and a potential
source of error This all links to the perception errors within notational
could be investigated further Within Archery and other shooting sports the targets are
typically banded colours which limits the use of reference points other than the target
centre so previous arrow positions could be used as a reference
Error identified within the present system shows arrow 17 and 29 to be problematic
an overlap between arrows 5 and 6 (Figure 6a Arrow 5)
the point of entry resulting in a large error from the operators The image containing
arrow 29 has no occlusion of the arrow (Figure 6b Arrow 5) however the entry
sequence of the two preceding arrows may have influenced the result
a) Arrow 17 (arrow 5 on image) b) Arrow 29 (arrow 5 on image) (Cropped
image)
The results demonstrate the system to be reliable and valid between users and when
ver estimation in a vertical input
has also been shown to be the case with research by Dixon
compared to a
been shown in more complex virtual
(2005) showing
Within the current
system this error could be incorporated into as a calibration routine for each user where
they input X arrows into the system to generate a X and Y bias to removeadd to their
remaining data input in the same way that users calibrate touch screen computers
error in general notations systems warrants further investigation to see if
procedures or designs of systems can be altered to help reduce this error This could
An example of reference points
xisting systems primarily courtpitch based games are likely to be the court
When entering the data into a notational system Hughes and Franks (2004) show
that by dividing up the space into a smaller area allows for a more detailed analysis but
choosing the correct box to put a position in then becomes harder and a potential
source of error This all links to the perception errors within notational analysis which
could be investigated further Within Archery and other shooting sports the targets are
typically banded colours which limits the use of reference points other than the target
and 29 to be problematic
a Arrow 5) occluding
The image containing
owever the entry
a) Arrow 17 (arrow 5 on image) b) Arrow 29 (arrow 5 on image) (Cropped
307
The two previous arrows were outer red (Figure 6b Arrow 3) and inner gold (Figure 6b
Arrow 4) If an error was made with the placement of Arrow 3 then the Operator may
have used this as a reference point magnifying the error Errors such as this are
unavoidable using the present system as is occlusion of any arrows entry point into the
target An archer using this system on a PDATablet at the target could have an
advantage over a coach at the side line The archer could move around close to the
target to get the best view possible before entering the data into this type of system
Hughes et al (2002) demonstrate errors in entering the wrong information showing that
nearly 3 of their errors were due to inputting the wrong cell number This shows
favourable results where only 2 operators had these errors arrows input into the wrong
scoring band totalling error of 41 (Operator 3) and 13 (Operator 8) Hand
notation systems will inevitably have a degree of error due to the humans entering the
data Hughes Cooper and Nevill (2002) analysed the number of shots in live Squash
games using two analysts Their results demonstrated less than 1 error when recording
number of shots and was then developed into location ball-wall contact with the wall
divided into 16 cells With this progression the researchers predicted a higher level of
error from counting shots and demonstrated error of over 30 Choi et al (2007)
showed inter-operator reliability between 4 analysts recording variables in basketball
their results demonstrated errors between analysts from 148 to 338 Any issues
with previous hand-entry systems are most likely due to the speed of the games
analysed The longer period of 4 minutes to analyse the arrow locations may explain the
lower error seen in this study compared to others
Maslovat and Franks (2007) discuss that the use of video and computer based
technologies can allow for comprehensive post-event analysis where information can
be slowed to review Within archery slowing videos would be necessary for
biomechanical analysis yet for recording arrow scores this would not be necessary as
the scoring process is currently fairly slow
Arrows are currently scored when all archers have finished shooting and everyone will
approach the targets There is scope for a camera based system or laser based system to
record these arrow positions either as they happen or after completion of the set (end)
of arrows however there are potential cost implications which might only be useable at
top level competitions limiting the analysis potential for up and coming athletes
Danage (2012) produce a scoring system where the archers when at the targets enter
the scores of the arrows in order of highest to lowest Whist entering arrow scores
electronically like this offers a simple solution for summation and the ranking of
individuals in competition or at the club in practice there are limitations in the degree of
analysis that can be performed on that data due to a lack of information gathered when
entering the data Other implications for computerised systems are when multiple
archers are shooting at the same time with typically 3-4 people per target all with
different colour combinations of fletching arrow wraps and nocks these could induce
further occlusion of the arrows Where a person can quickly see the difference and entry
point a computer could have difficulty with some of the occlusions especially with top
archers shooting very tight groups at a short distance
308
Computerised systems that appear for personal use tend to appear as scatter diagram
based software for PDAs (Personal Digital Assistants) such as BowBuddy (Bowbuddy
34) with alternatives starting to appear for the smart phone market on varying operating
systems where the input method can vary between a touch screen or stylus input Touch
screens are becoming a part of everyday life such as point of sales terminals and mobile
devices where the applications may not need high resolution displays with a critical
input due to the size of the soft buttons (Sears and Shneiderman 1991) However some
notational systems may require this critical input The system presented here used a
mouse allowing a far greater level of input when compared to a finger which would take
up a larger percentage of the screen this is where a stylus may offer a better alternative
to a finger (Sears and Shneiderman 1991 Forlines et al 2007) For these reasons
when notational systems transfer over to a portabletouch screen solution they may
need to be re-tested due to this input change
6 Conclusion
To measure marksmanship statistics a valid and reliable system needs to be used The
computerised example shown here allows the input of arrow locations with results
showing X and Y raw data coordinates are acceptable and could be improved with
experience of the system Errors are identified mainly when arrows overlap each other
in other target sports such as pistol shooting where a single hole is left this issue would
likely be overlooked or minimised
Using various statistics to analyse marksmanship allows the coachathleteresearcher to
track varying equipment setups and changes to biomechanics physiology and
psychology allowing for continued athlete sport and equipment development Previous
works in archery could use systems such as this to re-evaluate their results in greater
detail than pure score
7 References
Bannigan K Watson R (2009) Reliability and validity in a nutshell Journal of
Clinical Nursing 18 3237ndash3243
Bar-Eli M and Azar OH (2009) Penalty kicks in soccer an empirical analysis of
shooting strategies and goalkeepersrsquo preferences Soccer and Society 10(2)
183-191
Bowbuddy (Version 34) [Computer Software] UK TBS Software Retrieved from
httpbowbuddycom [Accessed January 2012]
Bruce L Farrow D Raynor A and May E (2009) Notation analysis of skill
expertise differences in netball International Journal of Performance
Analysis of Sport 9 245-254
Choi H OrsquoDonoghue PG and Hughes MD (2007) An investigation of inter-
operator reliability tests for real-time analysis system International Journal
of Performance Analysis of Sport 7(1) 49-61
309
Danage (2012) Scoring Systems Available from
httpwwwdanagetargetscoukscoringsystemsphp [Accessed November 2012]
Di Salvo V Collins A McNeill B Cardinale M (2006) Validation of Prozone reg
A new video-based performance analysis system International Journal of
Performance Analysis in Sport 6(1) 108-119
Dixon JS and Bird HA (1981) Reproducibility along a 10 cm vertical visual
analogue scale Annals of Rheumatic Diseases 40 87-89
Ertan H Soylu A R and Korkusuz F (2005) Quantification the relationship
between FITA scores and EMG skill indexes in archery Journal of
Electromyography and Kinesiology 15 222ndash227
Forlines C and Wigdor D and Shen C and Balakrishnan R (2007) Direct-touch vs
mouse input for tabletop displays Proceedings of the SIGCHI Conference on
Human Factors in Computing Systems 647-656
Hay J amp Reid J (1988) Anatomy Mechanics and Human Motion (2nd Ed)
New Jersey Prentice Hall
Hughes M and Franks IM (2004) Notational analysis - a review of the literature In
Hughes M and Franks IM (Eds) Notational Analysis of Sport Systems for
Better Coaching and Performance in Sport (pp 59-106) London Routledge
Hughes M Cooper S-M and Nevill A (2002) Analysis procedures for non-
parametric data from performance analysis International Journal of
Performance Analysis of Sport 2 6ndash20
IBM (2010) SPSS (Version 19) [Statistics Software]
Johnson RF (2001) Statistical Measures of Marksmanship (Publication No TN-012)
Retrieved from Military Performance Division website httpwwwdticmil
[Accessed January 2012]
Keast D and Elliot B (1990) Fine body movements and the cardiac cycle in
archery Journal of Sports Sciences 8(3) 203-213
Koch C and Tilp M (2009) Analysis of beach volleyball action sequences of
female top athletes Journal of Human Sport and Exercise 4(3) 272-283
Leroyer P Van Hoecke J and Helal JN (1993) Biomechanical study of the final
push-pull in archery Journal of Sports Sciences 11 63-69
Lin K and Hwang C (2005) Analyses of the relationship between the aiming time
and the shot points in archery Journal of Physical Education in Higher
Education 7(4) 161-173
MathWorks The (2007) Matlab (Version 750342) [Programming Software]
Maslovat D and Franks IM (2007) The need for feedback In M Hughes and IM
Franks (Eds) The essentials of performance analysis An introduction (pp
1-7) Abingdon Oxon Routledge
Microsoft (2007) Excel (Version 2007) [Spreadsheet Software]
OrsquoDonoghue P (2010) Research methods for sports performance analysis
Abingdon Oxon Routledge
OrsquoDonoghue P (2012) Statistics for Sport and Exercise Studies Abingdon Oxon
Routledge
Plumert JM and Kearney JK and Cremer JF and Recker K(2005) Distance
perception in real and virtual environments ACM Transactions on
Applied Perception (TAP) 2(3) 216-233
310
Sears A and Shneiderman B (1991) High precision touchscreens design strategies
and comparisons with a mouse International Journal of Man-Machine
Studies 34(4) 593-613
Shrout PE and Fleiss JL (1979) Intraclass Correlations Uses in Assessing Rater
Reliability Psychological Bulletin 86(2) 420-428
Van der Kamp J (2011) Exploring the merits of perceptual anticipation in the soccer
penalty kick Motor Control 15(3) 342-358
Vidales CE (2002) How to calibrate touch screens Embedded Systems
Programming 15(6) 32-40
Vishton PM Rea JG Cutting JE and Nuntildeez LN (1999) Comparing effects of the
horizontal-vertical illusion on grip scaling and judgment Relative versus
absolute not perception versus action Journal of Experimental Psychology
Human Perception and Performance 25(6) 1659-1672
Weir JP (2005) Quantifying test-retest reliability using the intraclass correlation
coefficient and the sem Journal of Strength and Conditioning Research
19(1) 231-240
Wilkinson M Leedale-Brown D and Winter EM (2009) Validity of a Squash-
Specific Fitness Test International Journal of Sports Physiology and
Performance 4 29-40
Wilson K and Barnes CA (1998) Reliability and validity of a computer based
notational analysis system for competitive table tennis In Lees A Maynard I
Hughes M and Reily T (Eds) Science and Racket Sports II (pp 265-268)
London Routledge
World Archery (2010a) FITA Rules and Constitution BOOK 1 Constitution and
Administrative Rules Retrieved from httpwwwarcheryorg [Accessed
November 2011]
World Archery (2010b) FITA Rules and Constitution BOOK 2 Outdoor Archery
Rules Retrieved from httpwwwarcheryorg [Accessed November 2011]
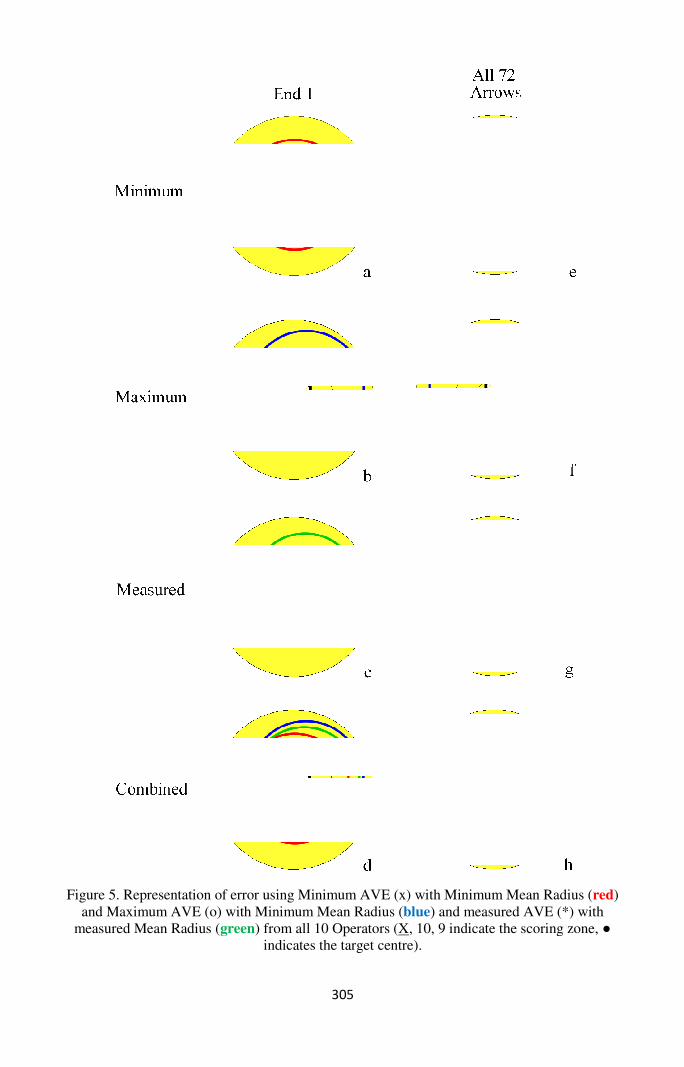
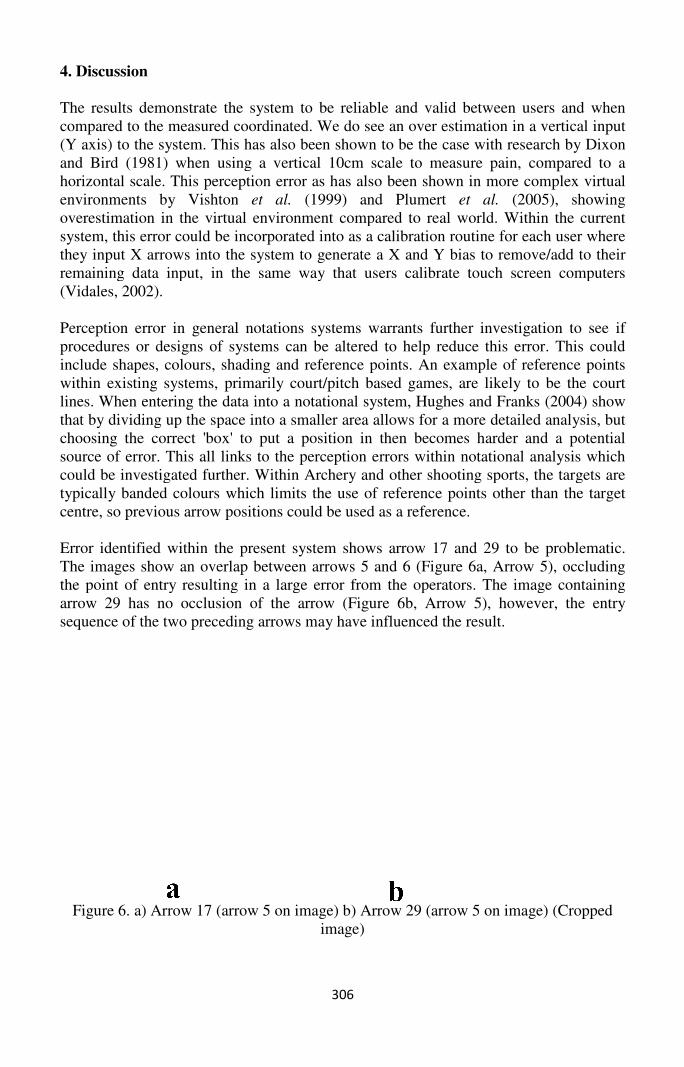