Embed Size (px)
Citation preview
九州大学学術情報リポジトリKyushu University Institutional Repository
Interaction of reactive astrocytes with type Icollagen induces astrocytic scar formationthrough the integrin-N-cadherin pathway afterspinal cord injury
原, 正光
http://hdl.handle.net/2324/1931776
出版情報:九州大学, 2017, 博士(医学), 課程博士バージョン:権利関係:やむを得ない事由により本文ファイル非公開 (2)
1
1
Interaction of reactive astrocytes with collagen type I induces astrocytic scar formation 2
through the integrin/N-cadherin pathway after spinal cord injury 3
4
5
6
7
8
Authors: 9
Masamitsu Hara1,2, Kazu Kobayakawa2, Yasuyuki Ohkawa3, Hiromi Kumamaru2, Kazuya 10
Yokota2, Takeyuki Saito1,2, Ken Kijima1,2, Shingo Yoshizaki1,2, Katsumi Harimaya2, Yasuharu 11
Nakashima2 and Seiji Okada1,2 12
13
Affiliations: 14
1Department of Advanced Medical Initiatives, Graduate School of Medical Sciences, Kyushu 15
University, Fukuoka, Japan 16
2Department of Orthopaedic Surgery, Graduate School of Medical Sciences, Kyushu University, 17
Fukuoka, Japan 18
3Division of Transcriptomics, Medical Institute of Bioregulation, Kyushu University, Fukuoka, 19
Japan 20
Correspondence should be addressed to S.O. ([email protected]) 21
2
Abstract 1
Central nervous system (CNS) injury activates naïve astrocytes into reactive astrocytes, which 2
eventually transform into scar-forming astrocytes that can impair axonal regeneration and 3
functional recovery. This sequential phenotypic change, known as reactive astrogliosis, has 4
long been considered unidirectional and irreversible. However, we report here that reactive 5
astrocytes isolated from injured spinal cords retrogradely reverted to naïve astrocytes when 6
transplanted into a naïve spinal cord, whereas they formed astrocytic scars when transplanted 7
into an injured spinal cord, indicating the environment-dependent reversibility of reactive 8
astrogliosis. We also found that collagen type I was highly expressed during the scar-forming 9
phase and induced astrocytic scar formation via the integrin/N-cadherin pathway. 10
Pharmacological blockade of reactive astrocyte-collagen type I interaction prevented astrocytic 11
scar formation, thereby leading to improved axonal regrowth and better functional outcomes 12
in a mouse model of spinal cord injury. Our findings reveal environmental cues regulating 13
astrocytic fate decisions, thereby providing a potential therapeutic target for CNS injury. 14
3
Introduction 1
Spinal cord injury (SCI) is a devastating trauma that causes persistent severe motor/sensory 2
dysfunction1,2. After SCI, astrocytes, the most abundant resident cells in the central nervous 3
system (CNS), play a crucial role in the SCI pathology through a phenotypic change known as 4
reactive astrogliosis. In this process, naïve astrocytes (NAs) sequentially exhibit opposite 5
phenotypes: first as reactive astrocytes (RAs) and then as scar-forming astrocytes (SAs). In the 6
subacute phase of SCI (4-14 days post-injury (dpi) in the mouse), RAs migrate to the lesion 7
epicenter and seclude inflammatory cells, leading to tissue repair and functional improvement 8
after SCI2. However, RAs gradually transform into SAs that form astrocytic scars, the main 9
impediment for CNS axonal regeneration, resulting in a limited functional recovery in the 10
chronic phase of SCI3,4 (more than 14 dpi in the mouse). Astrocytic scars have been shown to 11
be irreversible and permanently inhibit axonal regrowth in both rodents and humans with SCI4-12
6, although there is a different opinion that attenuating astrocytic scar formation failed to 13
promote axonal regeneration after SCI7,8. As such, clarifying the mechanism of astrocytic scar 14
formation and regulating this scar formation may be a potential therapeutic strategy for SCI. 15
Astrocytic scars have been studied for more than half a century9,10, and their formation has 16
been suggested to be regulated by complex and combinatorial inter- and intra-cellular signaling 17
mechanisms3,5,11. However, despite the large number of studies examining these astrocytic 18
changes5,11,12, the mechanism underlying astrocytic scar formation remains unclear. One factor 19
limiting basic research in this area is the lack of clear definitions of NAs, RAs, and SAs. A 20
conventional method for distinguishing between these cells is a histological analysis, but this 21
method is neither objective nor quantitative. 22
In this study, we established a clear distinction between NAs, RAs, and SAs based on marker 23
gene expression and investigated the regulatory mechanism underlying astrocytic scar 24
4
formation after SCI. 1
5
Results 1
In situ isolation of astrocytes after SCI enables the discovery of RA- and SA-specific 2
marker genes 3
We employed the contusion SCI model in female C57BL/6J mice (8-10 weeks old). This 4
approach is reported to resemble human SCI more closely than transection models, because 5
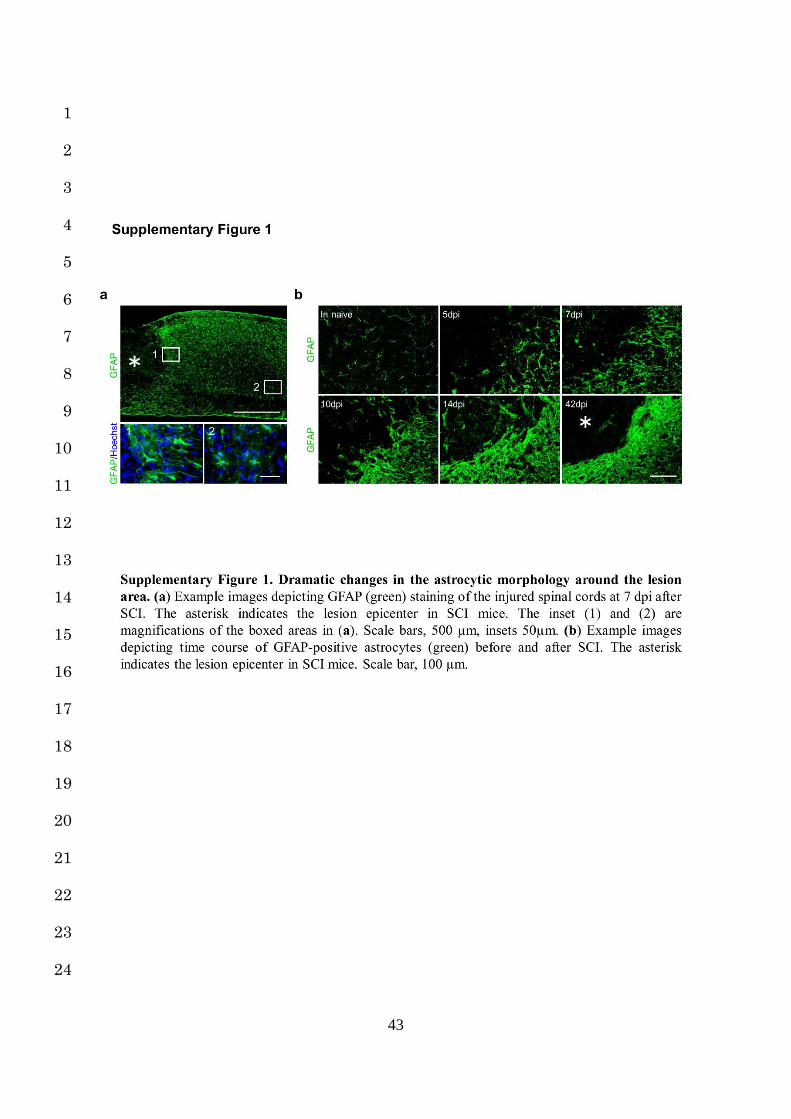
most human SCI are due to blunt trauma13. After SCI, NAs exhibited drastic changes around 6
the lesion area (Supplementary Fig. 1a). They underwent a typical change of hypertrophy, 7
process extension and increased GFAP expression within several dpi, characteristic of RAs 8
(Supplementary Fig. 1b)2. Thereafter, at 14 dpi, the RAs overlapped and transformed into 9
SAs, resulting in astrocytic scar formation (Supplementary Fig. 1b)3,12. Although this 10
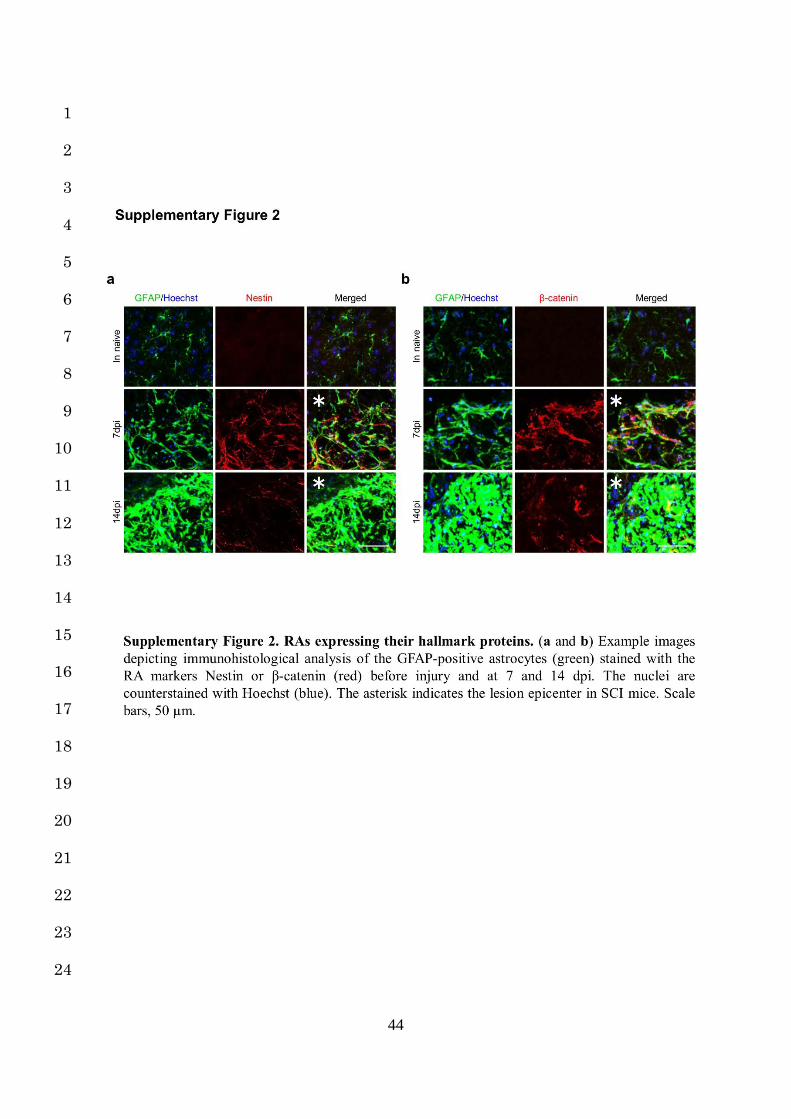
sequential astrocytic transformation is roughly referred to as “reactive astrogliosis”, identifying 11
the point at which the astrocytes are situated in this process is difficult: RAs and SAs both 12
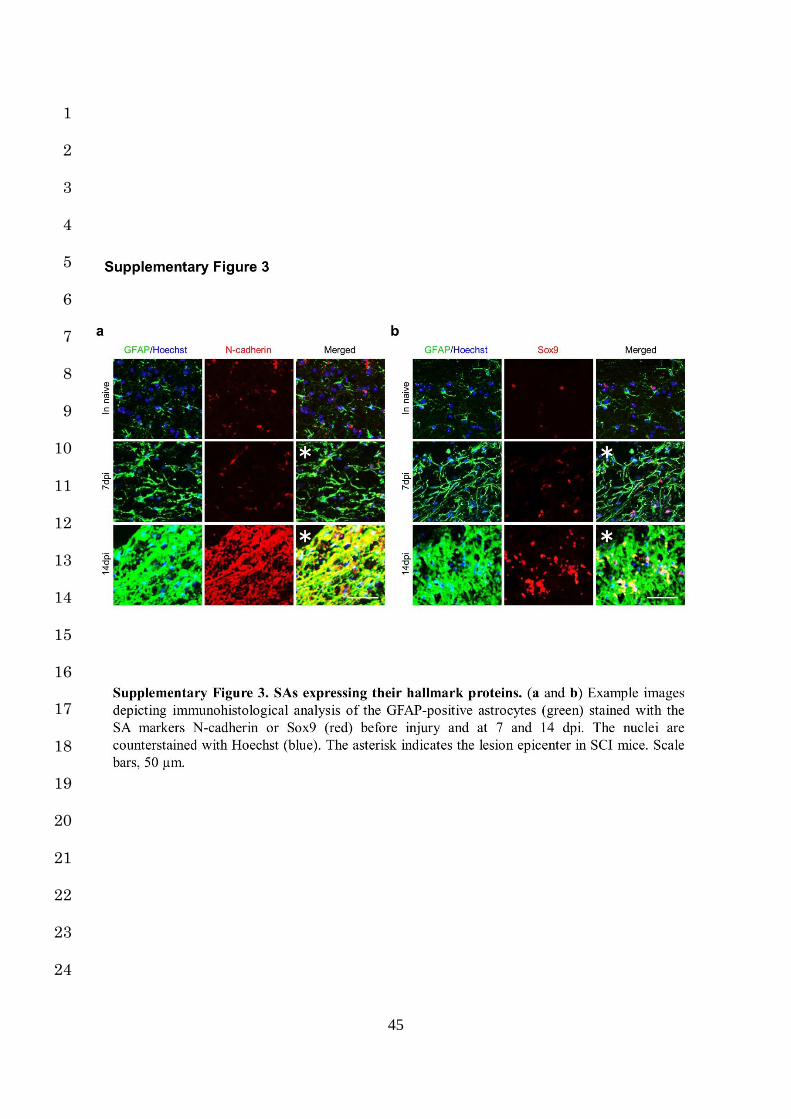
highly express their hallmark protein (GFAP, Nestin, β-catenin, N-cadherin and Sox9), but 13
clearly distinguishing between each form of astrocytes (NAs, RAs, and SAs) based solely on 14
their hallmark expression is difficult with a histological analysis (Supplementary Fig. 2a,b, 15
Supplementary Fig. 3a,b)12,14-16. 16
Therefore, we selectively isolated each astrocyte type by laser microdissection (LMD) 17
combined with immunohistochemistry: NAs, morphologically identical to resident astrocytes 18
in the naïve spinal cord; RAs, with the morphological characteristics described above (observed 19
in the injured spinal cord at 7 dpi); and SAs, scar-forming GFAP-positive cells observed in the 20
injured spinal cord at 14 dpi in a mouse model of contusion SCI (Fig. 1a-g). Excellent RNA 21
qualities as well as no contamination of other cell type were confirmed with a bioanalyzer and 22
a PCR analysis in the collected samples of astrocytes (Fig. 1h, i). We investigated the 23
expression levels of RA- and SA-characteristic genes that were reported previously, and 24
6
defined the specific genes both significantly and selectively upregulated in LMD-isolated NAs, 1
RAs and SAs as their respective marker genes. 2
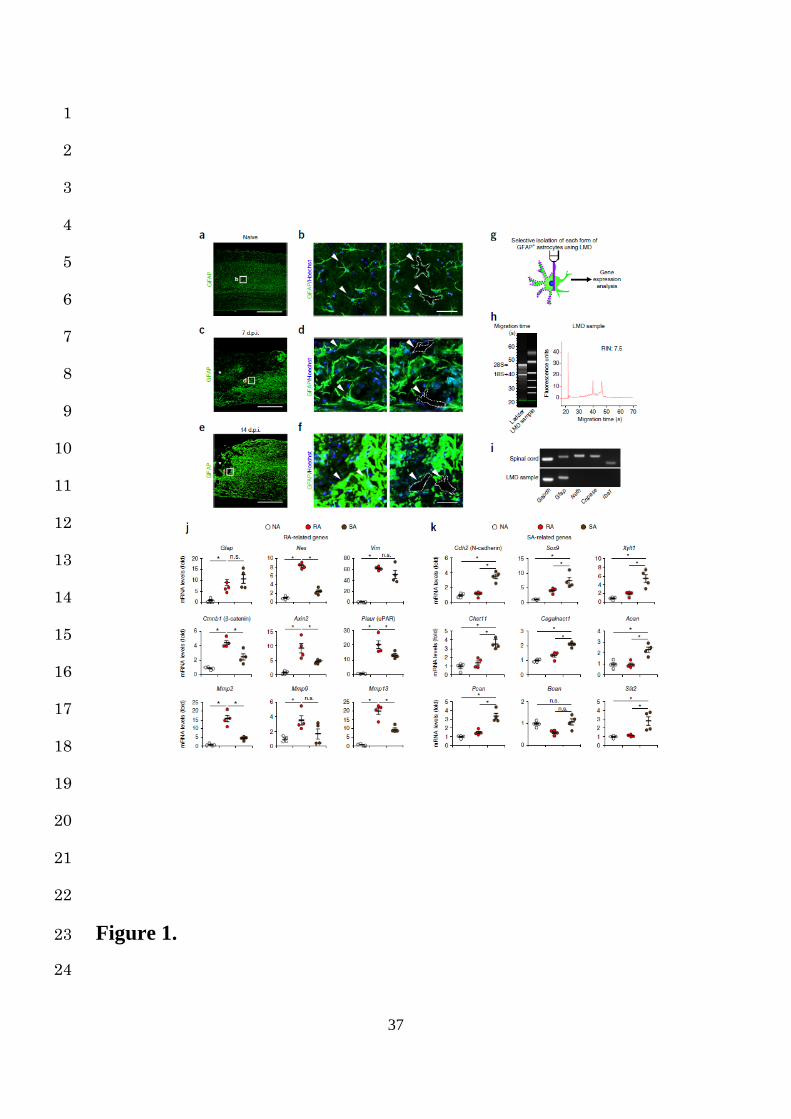
Regarding RAs, we confirmed elevated gene expressions of Gfap, Nes, Vim, and Ctnnb1 3
(encoding β-catenin) compared with NAs. However, increased expressions of Gfap and Vim 4
were also observed in SAs, indicating that only Nes and Ctnnb1 were suitable as RA marker 5
genes (Fig. 1j). In addition, we found the β-catenin-related genes suitable as RA markers from 6
a functional aspect. In SCI, RA migration is crucial for both functional and tissue repair2, and 7
recent reports have suggested a possible molecular link between β-catenin and cell movement 8
via MMPs17,18. After β-catenin nuclear translocation, the β-catenin-LEF/TCF complex binds 9
the enhancer of urokinase-type plasminogen activator receptor (uPAR) gene, resulting in the 10
activation of MMPs and cell migration. We demonstrated selectively elevated expression of 11
Plaur (encoding uPAR), Mmp2, and Mmp13 in RAs compared with NAs and SAs (Fig. 1j). 12
Furthermore, the expression of Axin2, a negative feedback regulator of β-catenin, was 13
significantly higher in RAs than in NAs or SAs (Fig. 1j). These results show that Plaur, Mmp2, 14
Mmp13, and Axin2 as well as Nes and Ctnnb1 are suitable as RA marker genes, providing 15
further insight into the mechanism of RA migration through β-catenin/MMPs signaling. 16
Regarding SAs, we confirmed significantly elevated expression of Cdh2 (encoding N-17
cadherin) and Sox9 compared with NAs and RAs (Fig. 1k). We also detected significantly 18
higher expression of chondroitin sulfate proteoglycan (CSPG)-related genes, such as Xylt1, 19
Chst11, Csgalnact1, Acan, and Pcan, in SAs than in NAs and RAs (Fig. 1k). These results 20
were biologically plausible, because CSPGs are the most abundant extracellular inhibitor of 21
axonal regeneration, and their expression has been selectively observed in the astrocytic scar 22
area after SCI3,12,16,19. In addition, the strong repulsive axon guidance gene slit23,20 was also 23
found to be suitable as a SA marker gene (Fig. 1k). These marker gene profiles combined with 24
7
the morphological definitions are useful for identifying the astrocyte phenotypes present, as 1
reactive astrogliosis is a graded continuum of changes in gene expression and forms. 2
3
Dependence of reactive astrogliosis on the surrounding environment 4
The phenotypic changes in mammalian cells are roughly driven in a cell-autonomous or a non-5
cell-autonomous manner21,22; however, the mechanism of reactive astrogliosis remains unclear. 6
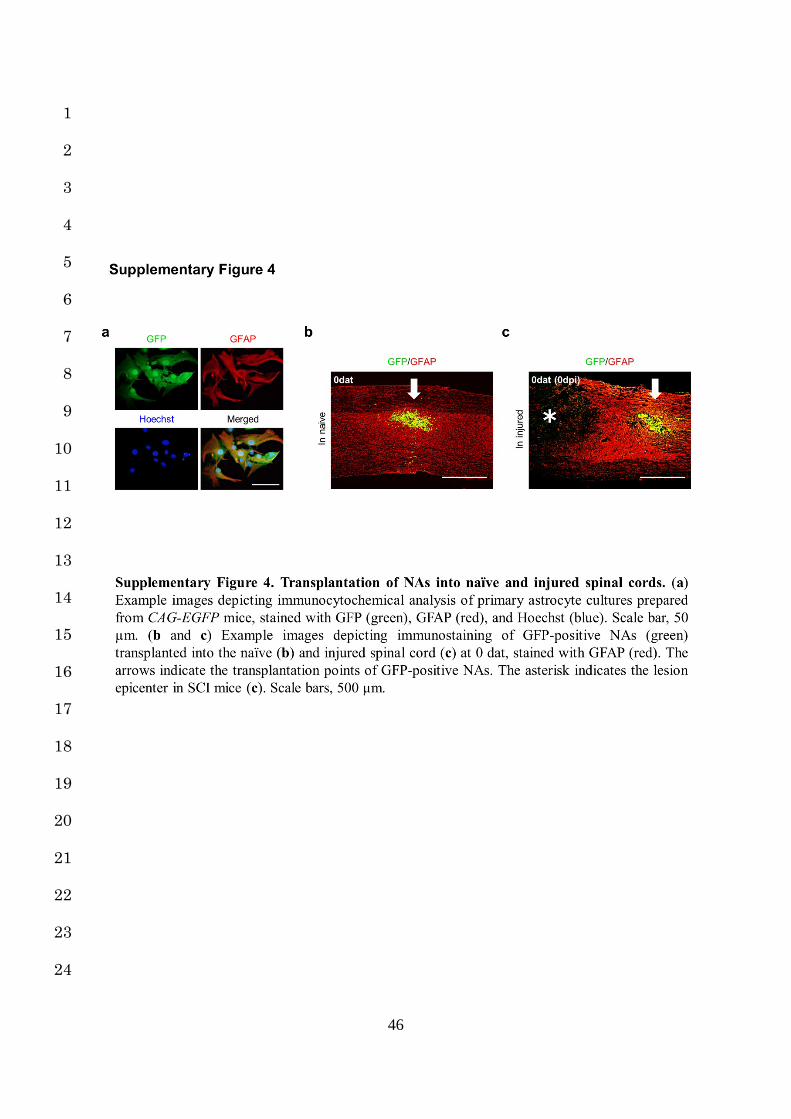
To clarify the mechanism, we prepared GFP-positive NAs from primary astrocyte cultures of 7
CAG-EGFP mice and transplanted them into the spinal cord of either naïve mice or 8
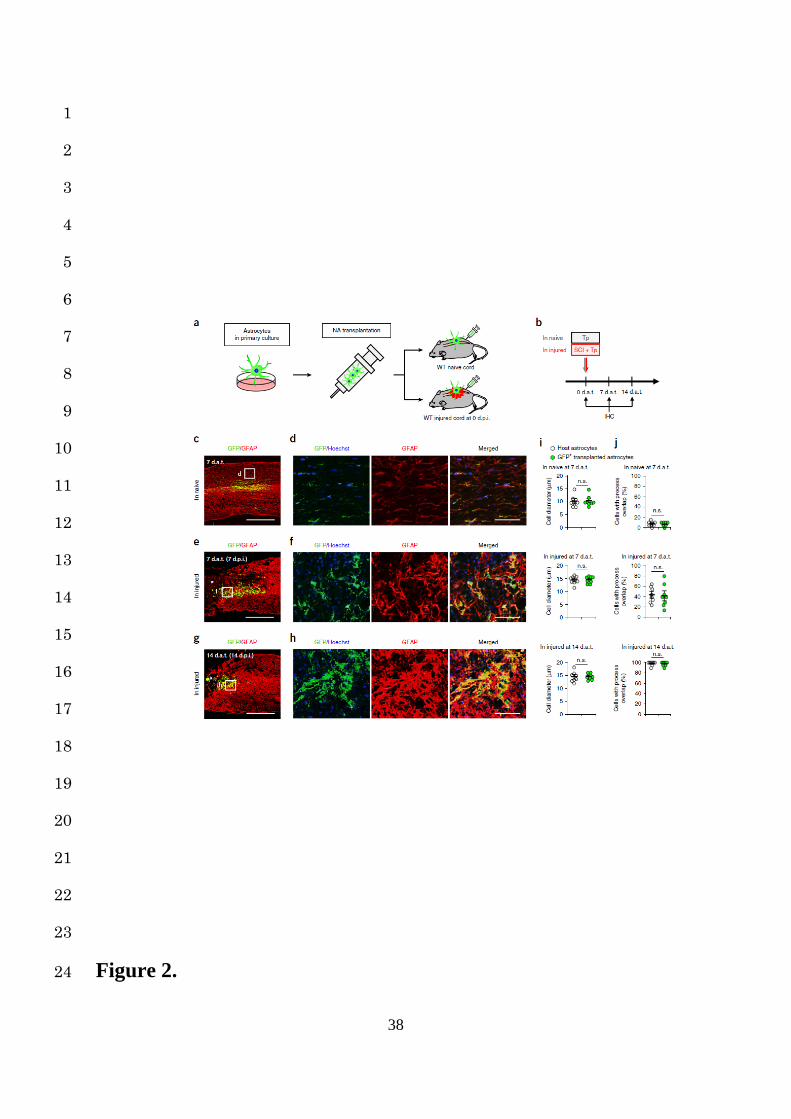
immediately after spinal contusion in SCI mice (Fig. 2a, Supplementary Fig. 4a-c). At 7 and 9
14 days after transplantation (dat), we examined morphological transformations of the grafted 10
NAs in response to the environment (Fig. 2b). The morphology of transplanted NAs, such as 11
the cell diameter and ratio of cells with overlapping of neighboring astrocytic processes, was 12
unchanged in the naïve spinal cord, whereas they had transformed along with the host astrocytic 13
changes and were integrated into reactive astrogliosis when transplanted into the injured spinal 14
cord (Fig. 2c-j). 15
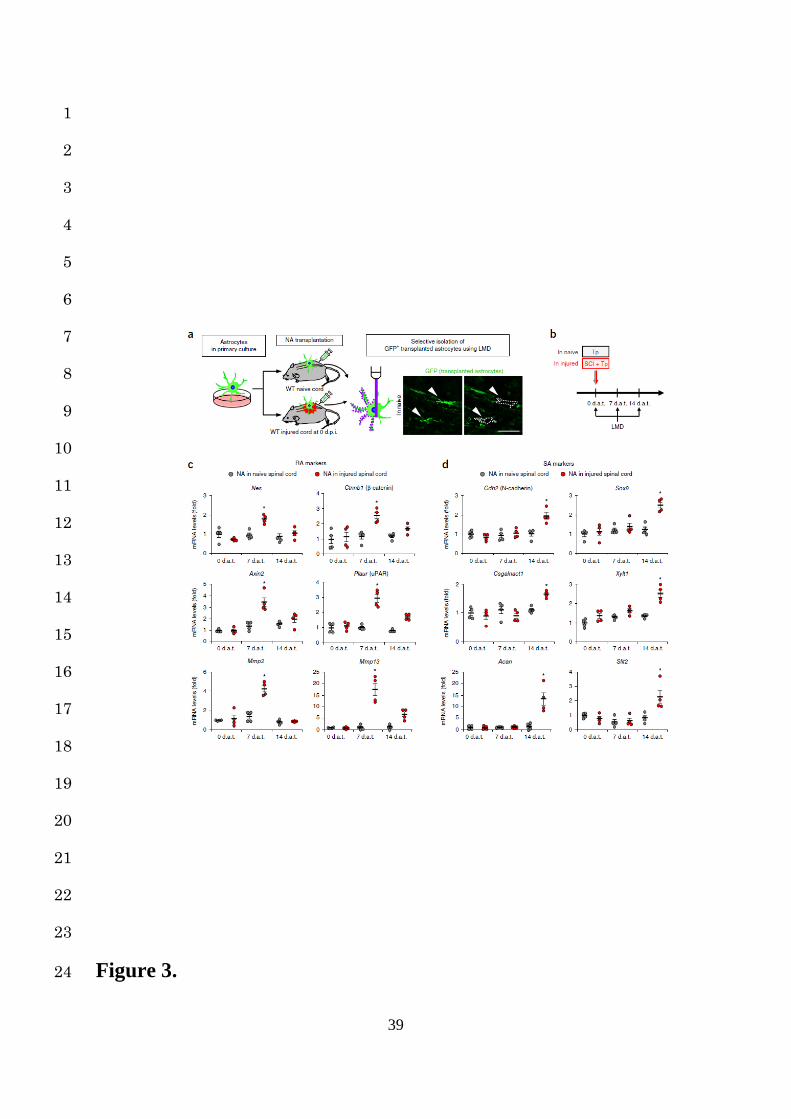
In addition to these morphological changes, we examined the sequential changes in the gene 16
expression by a cell-selective analysis of grafted NAs using LMD (Fig. 3a,b). Consistent with 17
the morphological transition, gene expression of the grafted NAs remained unchanged when 18
transplanted into the naïve spinal cord, whereas the expression of the RA marker genes at 7 dat 19
and SA marker genes at 14 dat were significantly increased compared to those at other time 20
points when transplanted into the injured spinal cord (Fig. 3c,d). These findings indicate that 21
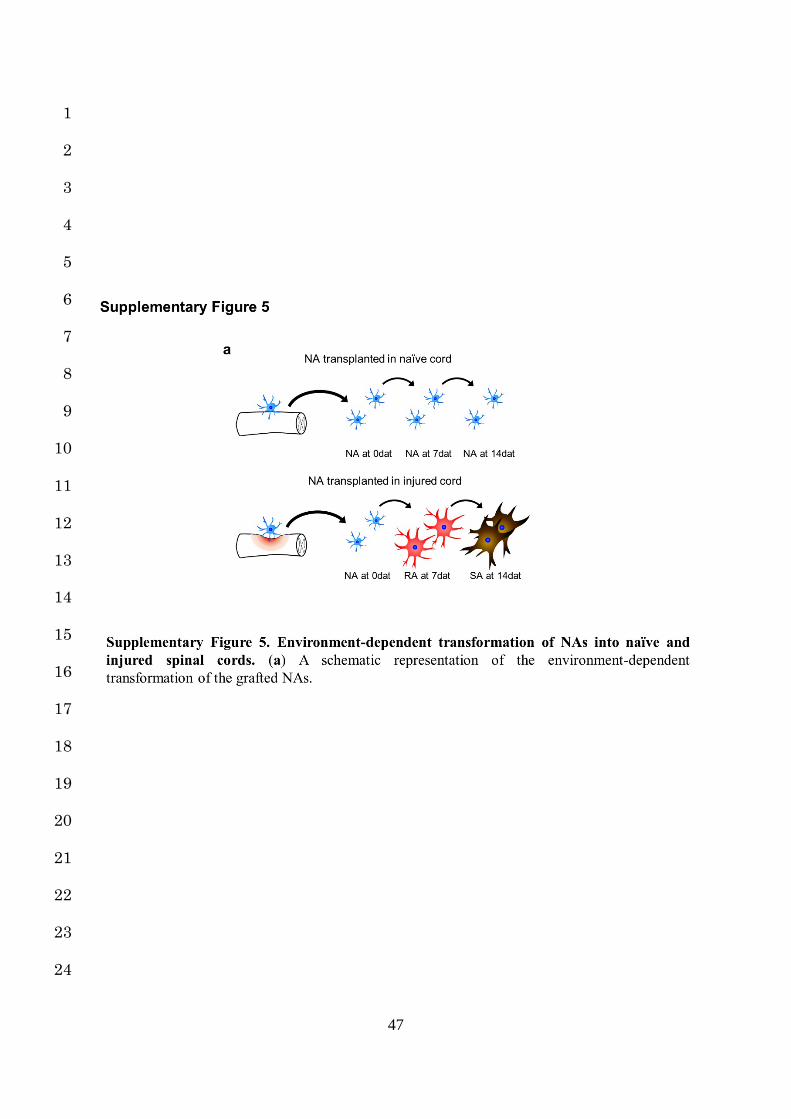
astrocytes change their phenotypes in an environment-dependent manner (Supplementary Fig. 22
5a). 23
24
8
Reversibility of reactive astrogliosis 1
After confirming the environment-dependent properties of reactive astrogliosis after SCI, we 2
examined the reversibility of the sequential astrocytic changes and whether or not RAs could 3
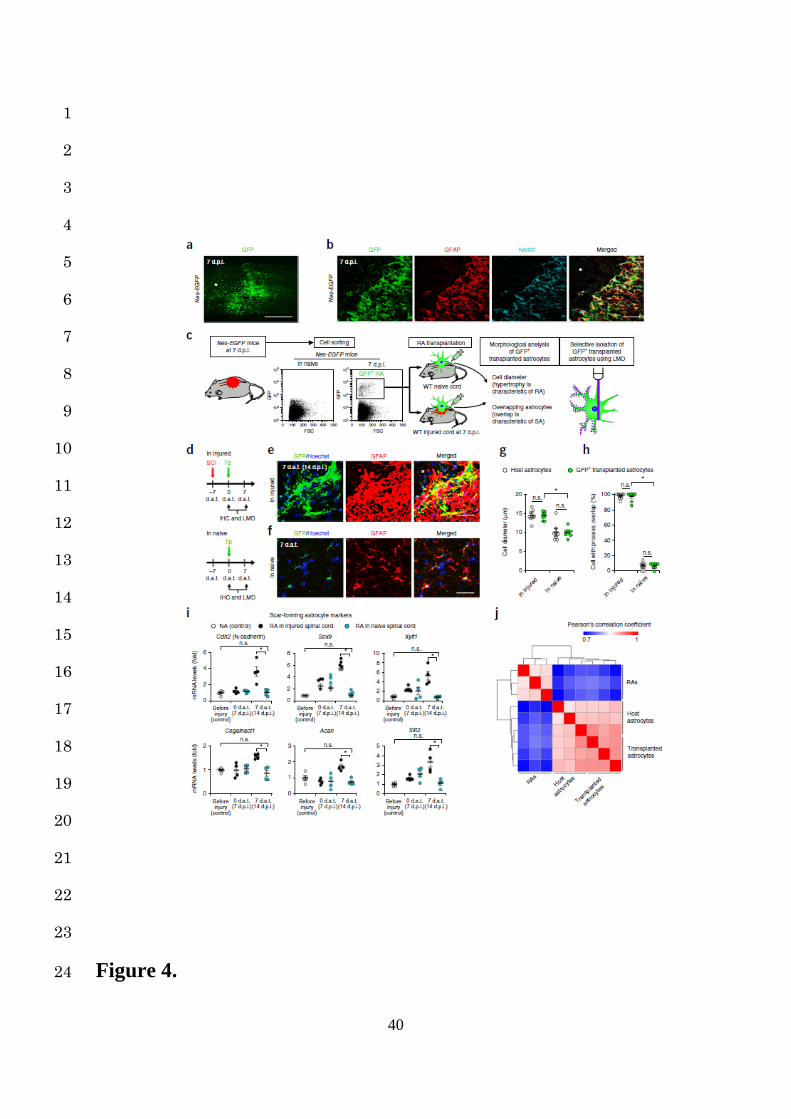
retrogradely revert to NAs after transplantation into naïve spinal cord. To selectively isolate 4
RAs, we developed Nes-Cre; CAG-CATloxP/loxP-EGFP (Nes-EGFP) mice, which show selective 5
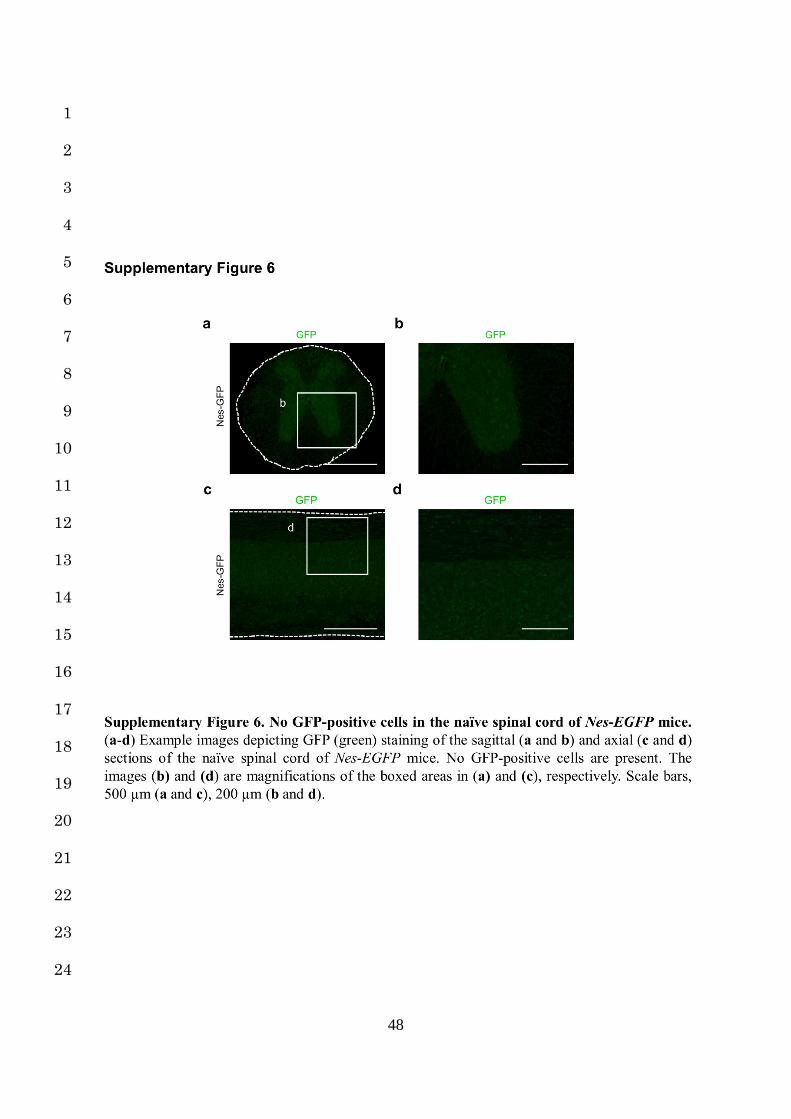
EGFP expression in RAs upon Cre-mediated recombination2. We confirmed that these mice 6
showed no GFP-positive cells in the naïve spinal cord, but had high Cre-mediated EGFP 7
expression in RAs around the lesion area at 7 dpi in SCI mice (Supplementary Fig. 6a-d, Fig. 8
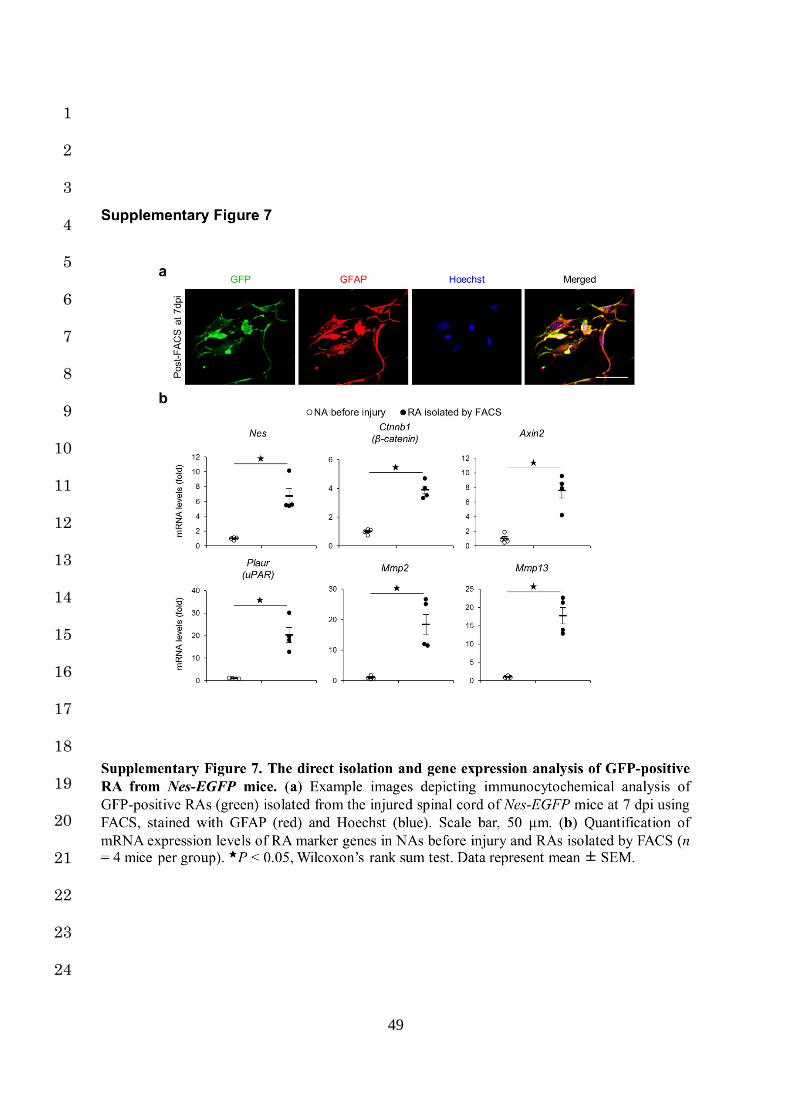
4a,b). After dissociating the injured spinal cords of Nes-EGFP mice at 7 dpi, we selectively 9
isolated the GFP-positive RAs by fluorescence-activated cell sorting (FACS) and confirmed 10
significantly increased expressions of the RA marker genes in the isolated RAs 11
(Supplementary Fig. 7a,b). We then transplanted these GFP-positive RAs into either naïve or 12
injured spinal cord models and performed immunohistological and cell-selective gene 13
expression analyses with LMD at 7 dat (Fig. 4c,d). The grafted RAs formed astrocytic scars 14
when transplanted into the injured spinal cord but histologically reverted to NAs when 15
transplanted into the naïve spinal cord at 7 dat. (Fig. 4e-h). Consistent with this morphological 16
conversion, a selective gene expression analysis of the grafted cells demonstrated that the SA 17
marker gene expressions were upregulated when transplanted into the injured spinal cord, while 18
the original expression patterns of SA marker genes were significantly suppressed when 19
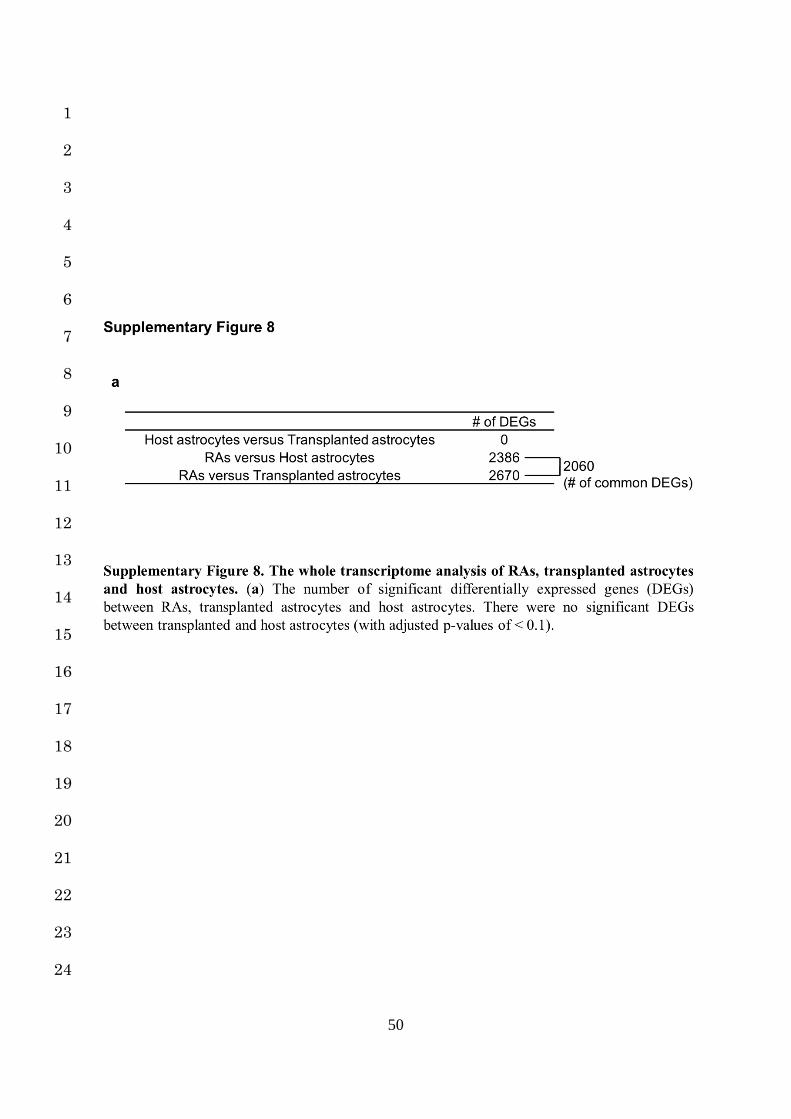
transplanted into the naïve spinal cord (Fig. 4i). Moreover, the whole transcriptome analysis of 20
isolated RAs, transplanted RAs in the naïve spinal cord at 7 dat, and host astrocytes in the naïve 21
spinal cord, revealed that the global gene expression profile of transplanted and host astrocytes 22
was comparable, while it was markedly different from isolated RAs (Fig. 4j, Supplementary 23
Fig. 8a), suggesting that the in situ phenotype reprogramming of astrocytes depended on the 24
9
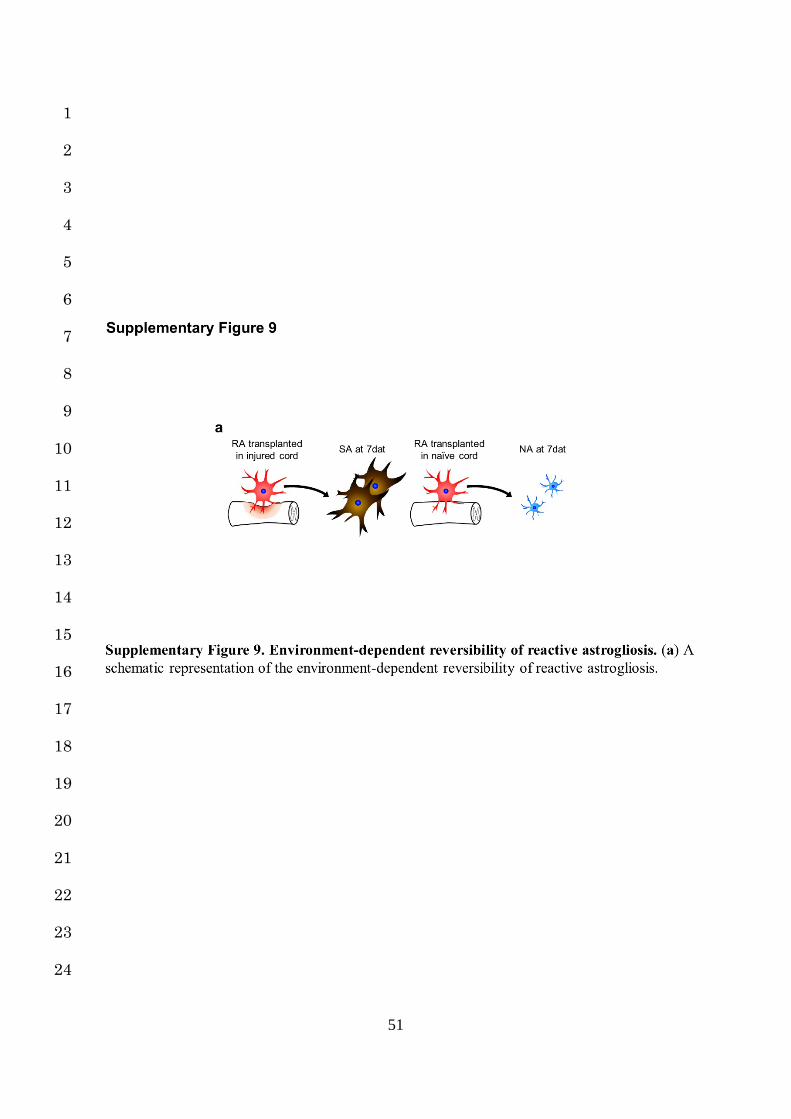
environment. These results clearly indicate that the process of reactive astrogliosis is reversible 1
under certain conditions (Supplementary Fig. 9a). 2
3
Upregulation of collagen type I genes in the lesion area after SCI 4
RAs are beneficial, while SAs are harmful for the repair process after SCI; as such, preventing 5
the transformation of RAs to SAs through environmental regulation may be a new therapeutic 6
strategy for SCI. Given that grafted RAs reverted to NAs in the naïve spinal cord but 7
transformed into SAs in the injured spinal cord, the fate of RAs seems to be determined by 8
environmental differences between the naïve and injured spinal cord. 9
We therefore performed a time-course genome-wide expression analysis in naïve and injured 10
spinal cord models after SCI, as described in our previous studies23,24. The scatter plots showed 11
both the upregulation and downregulation of all genes between the naïve and injured groups 12
(Fig. 5a). The expressions of nearly 5% of the genes were considerably increased in the injured 13
spinal cord at 14 dpi compared to those in the naïve spinal cord (>5-fold change; Fig. 5a). We 14
originally expected that the genes involved in intracellular signaling or cytokines guiding cell 15
transformation would be enriched in the scar-forming phase of SCI. However, interestingly, a 16
GO term analysis showed that the genes associated with the extracellular matrix (ECM) were 17
highly enriched at 14 dpi, indicating the involvement of the ECM in scar formation after SCI 18
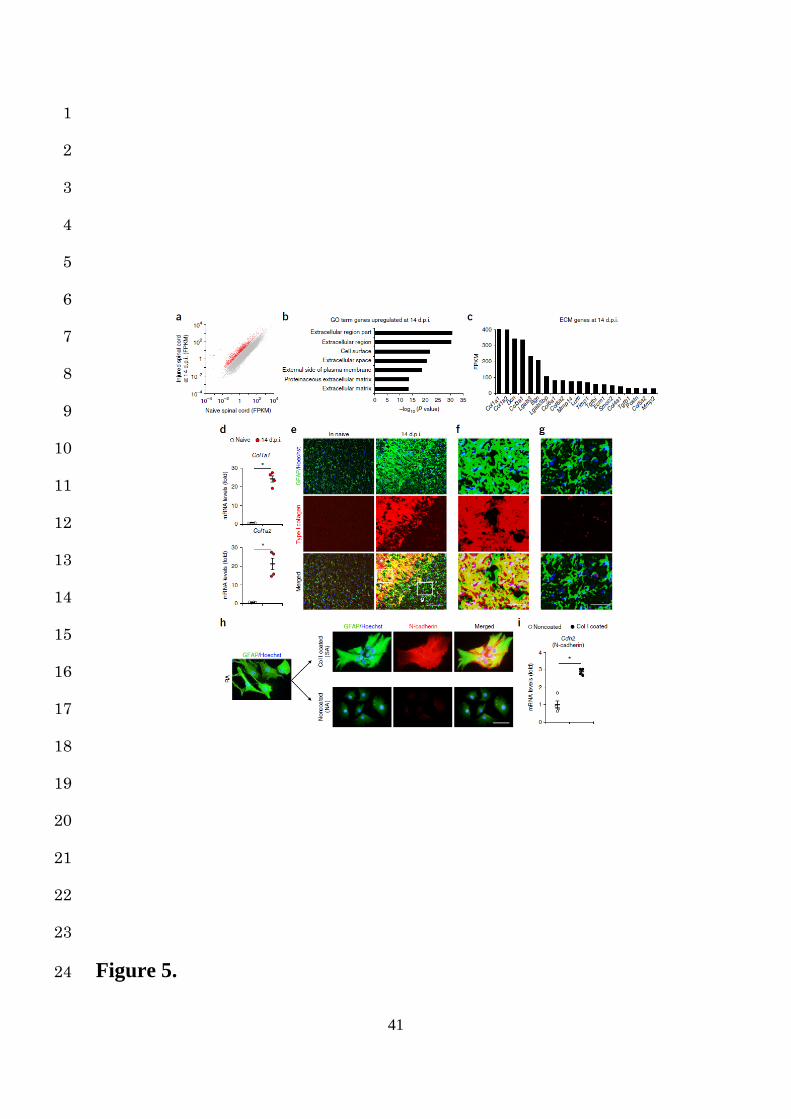
(Fig. 5b). Among the ECM genes, the collagen type I (Col I) genes (Col1a1 and Col1a2) were 19
the most highly expressed in the injured spinal cord at 14 dpi (Fig. 5c). In addition, the mRNA 20
expressions of Col I genes were significantly greater in the injured spinal cord than in the naïve 21
spinal cord (Fig. 5d). Furthermore, in immunohistochemistry, the Col I expression was 22
abundantly observed at the lesion area at 14 dpi in the injured spinal cord but not in the naïve 23
spinal cord (Fig. 5e). Interestingly, astrocytic scars were formed by SAs colocalizing with Col 24
10
I; however, the RAs retained their phenotypes in the Col I-absent area at 14 dpi (Fig. 5e-g). 1
These findings suggest that Col I is directly involved in the transformation of RAs into SAs as 2
well as astrocytic scar formation after SCI. 3
4
Induction of N-cadherin-mediated adhesion by collagen type I in astrocytes 5
To clarify the influence of Col I on RA fate determination, we cultured RAs in vitro on Col I-6
coated dishes (Col I-coated group) or non-coated dishes (non-coated group) and performed an 7
immunocytological analysis. While the RAs of the non-coated group showed process retraction 8
and decreased GFAP expression, the RAs of the Col I-coated group adhered closely to the 9
adjacent cells and showed increased GFAP expression, exhibiting a phenotype similar to that 10
of SAs (Fig. 5h). In addition, we found significantly increased expression of N-cadherin, 11
characteristic of SA, in only the Col I-coated group (Fig. 5h,i). Given that astrocytes form N-12
cadherin-mediated adhesion25,26 and that N-cadherin upregulation had been observed at 13
astrocytic scars (Supplementary Fig. 3a)15, these results suggest that Col I enhances N-14
cadherin-mediated contacts in RAs and induces their transformation into SAs. 15
16
Induction of astrocytic transformation by the collagen type I-integrin axis 17
For ECM proteins, including Col I, their counterpart receptors are necessary in order to interact 18
with cells27. Among ECM receptors, α1β1, α2β1, α10β1, and α11β1 integrin are reported to be 19
a major class of collagen-binding integrins that play an important role in cell-Col I interaction27. 20
Since these collagen-binding integrins are expressed on astrocytes28,29, we speculated that they 21
directly mediated the RA-Col I interaction and induced the transformation into SAs. We 22
therefore analyzed the morphological and gene expression changes in RAs of the Col I-coated 23
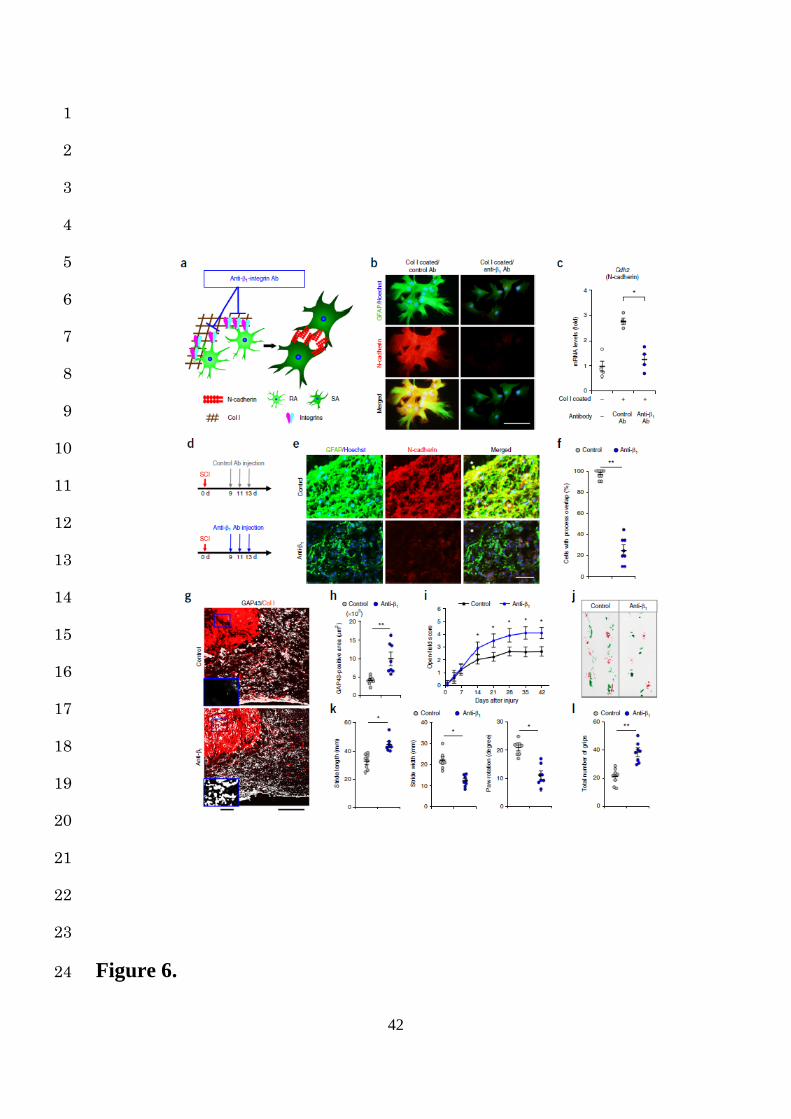
group treated with or without anti-collagen-binding integrin antibody (anti-β1 Ab) (Fig. 6a). 24
11
Notably, the RAs treated with control Ab showed cell adhesion and the increased expression 1
of N-cadherin and GFAP, while those treated with anti-β1 Ab remained scattered with no 2
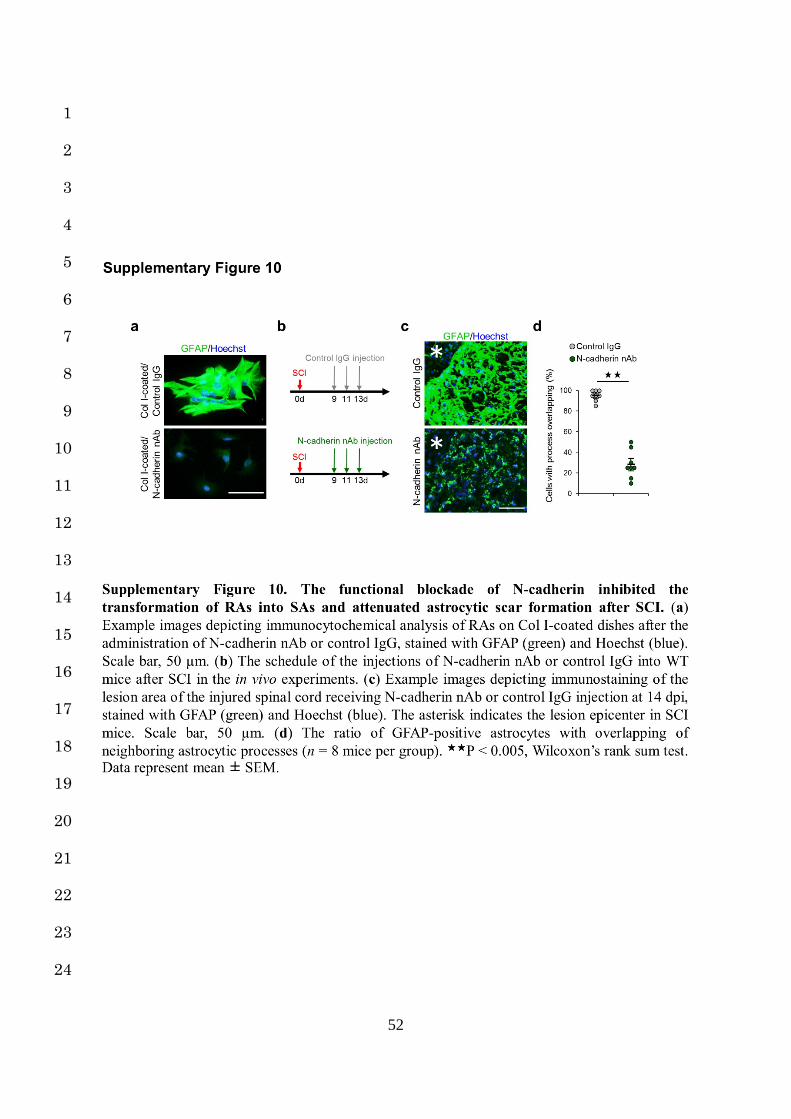
change in the expression of N-cadherin or GFAP (Fig. 6b,c). Similarly, N-cadherin 3
neutralizing antibody (N-cadherin nAb) inhibited the transformation of RAs into SAs under 4
the same conditions (Supplementary Fig. 10a). These results suggest that Col I induces the 5
transformation of RAs into SAs via the integrin/N-cadherin pathway, indicating a potential 6
therapeutic target. 7
8
Prevention of astrocytic scar formation and amelioration of functional recovery after SCI 9
via the blockade of RA-collagen type I interaction 10
Therapeutically, whether or not preventing the transformation of RAs into SAs can indeed 11
attenuate astrocytic scar formation after SCI is particularly important, because axons cannot 12
regenerate beyond astrocytic scars, thereby limiting the functional recovery3,4,6,12. We 13
investigated the effects of inhibition of integrin-mediated RA-Col I interaction on in vivo 14
astrocytic scar formation and functional recovery after SCI (Fig. 6a). 15
Anti-β1 Ab was administered from 9 to 13 dpi after SCI in order to selectively attenuate the 16
transformation of RAs to SAs (Fig. 6d). At 14 dpi in the anti-β1 Ab injection group, we 17
observed significantly lower expression of both N-cadherin and GFAP at the lesion area, 18
resulting in reduced cell adhesion and astrocytic scar formation compared to the control group 19
(Fig. 6e,f). We also confirmed that the injection of N-cadherin nAb attenuated astrocytic scar 20
formation similarly to the administration of anti-β1 Ab (Supplementary Fig. 10b-d). 21
Regarding the axonal regrowth, immunostaining using an antibody against GAP43, a marker 22
for regenerating axons, showed that the number of GAP43-positive axons was significantly 23
increased at both the lesion epicenter and the caudal area of the lesion in mice treated with anti-24
12
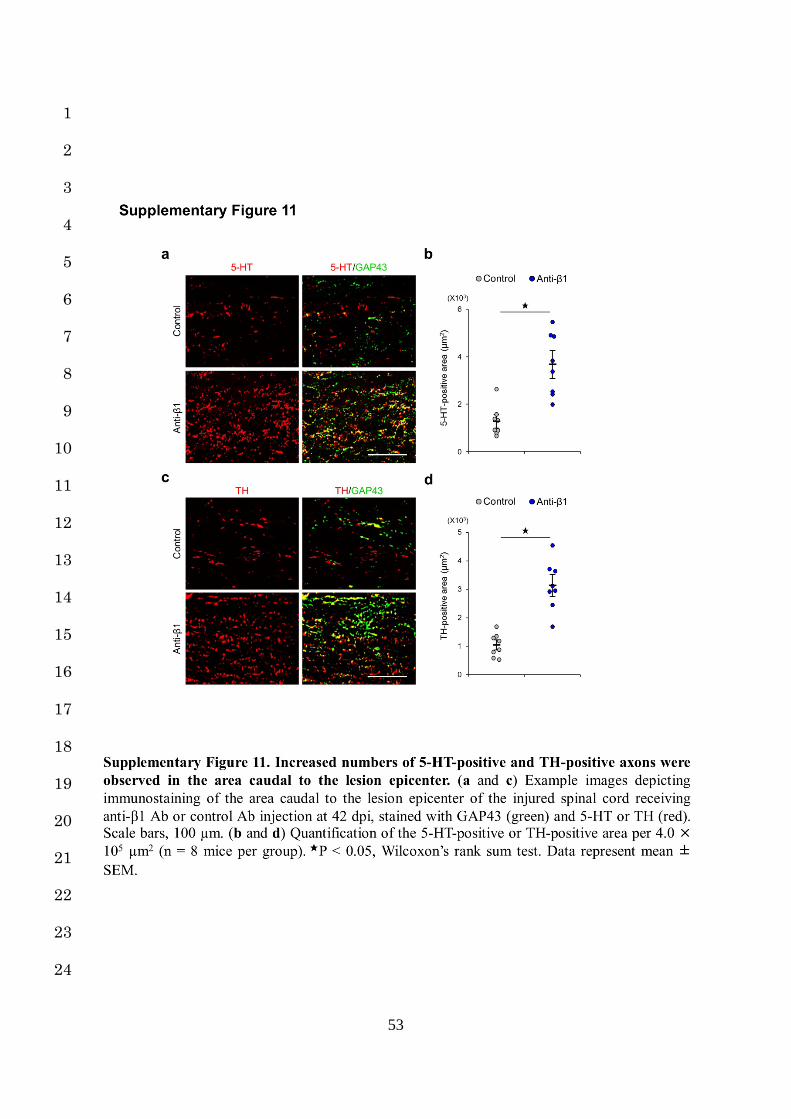
β1 Ab compared with those treated with control Ab (Fig. 6g,h). The numbers of serotonin (5-1
HT)-positive and tyrosine hydroxylase (TH)-positive fibers in mice treated with anti-β1 Ab 2
were also larger in comparison to mice treated with control Ab, and most of these fibers in mice 3
with anti-β1 Ab expressed GAP43 (Supplementary Fig. 11a-d). These results indicate that 4
the number of regenerative fibers passing through the lesion epicenter was significantly 5
increased by the attenuation of astrocytic scar formation. To investigate whether or not these 6
regenerating axons contribute to the behavioral improvements, we performed an open-field 7
locomotor test and a footprint analysis, and demonstrated that the motor functional recovery 8
with anti-β1 Ab injection was significantly greater than that achieved with control Ab injection 9
(Fig. 6i-l). These results indicate that the inhibition of integrin-mediated RA-Col I interaction 10
prevents astrocytic scar formation via N-cadherin downregulation and promotes the axonal 11
regeneration and functional recovery after SCI. 12
13
Discussion 1
Astrocytic scars, the final form of reactive astrogliosis, are widely regarded as a principal cause 2
for axonal regrowth failure and a poor functional outcome3,12. Reactive astrogliosis has long 3
been considered unidirectional and irreversible in the SCI pathology2,4,5. However, our findings 4
conversely showed the environment-dependent reversibility of reactive astrogliosis, 5
highlighting the therapeutic potential of regulating this astrocytic change through 6
environmental intervention. In particular, a time-course RNA-seq analysis identified Col I as a 7
prominent factor for the scar-forming phase of SCI, and Col I was crucial for astrocytic scar 8
formation via the integrin/N-cadherin pathway. Furthermore, the blockade of RA-Col I 9
interaction attenuated astrocytic scar formation and promoted functional improvement after 10
SCI, providing a novel therapeutic target for the treatment of SCI. 11
Using LMD, we demonstrated for the first time the in vivo transcriptional profiles of NAs, 12
RAs, and SAs and defined their marker genes. FACS or translating ribosomal affinity 13
purification (TRAP) have thus far been mainly used for cell-specific analyses23,30; however, 14
LMD had an advantage over these methods in our study. While FACS and TRAP require the 15
separation of solid organ tissues into single cells31, LMD makes it possible to capture cells 16
while maintaining and observing cell-specific structures32. Therefore, LMD combined with 17
immunohistochemistry was indispensable for selectively isolating each form of astrocyte based 18
on the recognition of their antigens and morphologies, because the astrocytes exhibited 19
phenotypic heterogeneity around the SCI lesion (Supplementary Fig. 1a, Fig. 5f-h). 20
Although the completed astrocytic scars strongly inhibit the regenerative response after CNS 21
injury, RAs, transitional form of reactive astrogliosis, play beneficial roles in the subacute 22
phase of SCI, in processes such as local immune regulation, neuroprotection, and tissue 23
repair33-36. In addition to the definition of astrocytic marker genes, a cell-selective analysis with 24
14
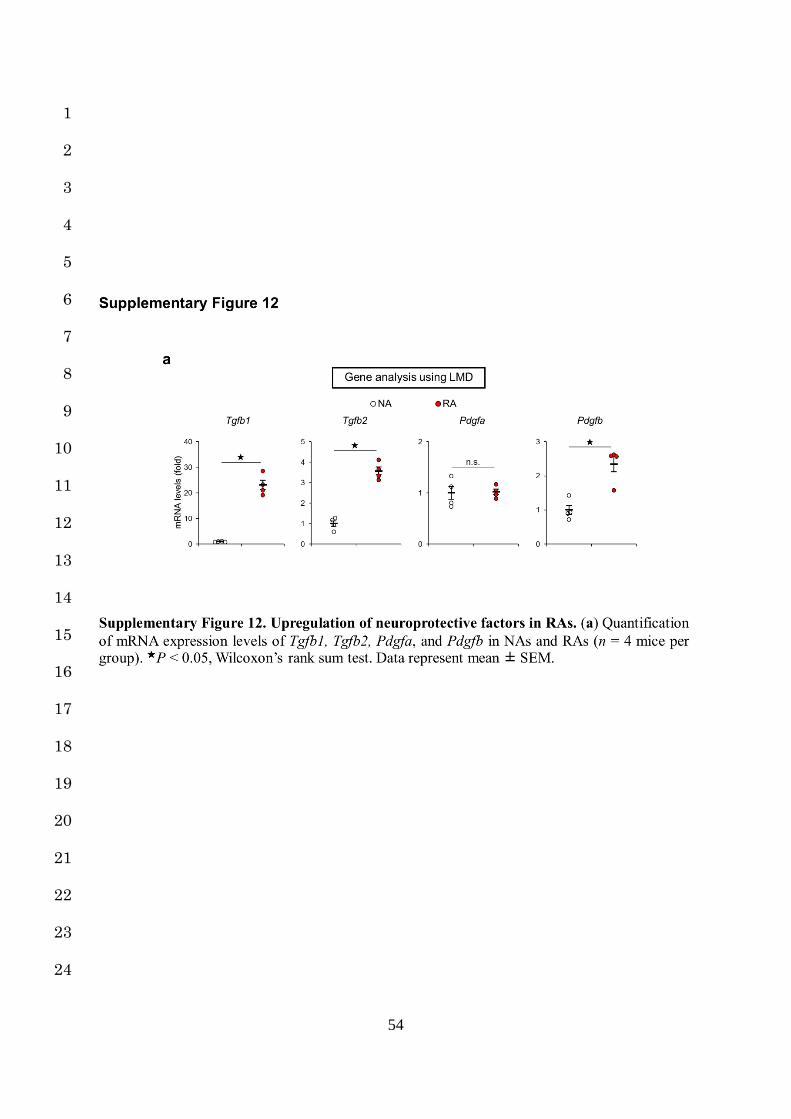
LMD demonstrated that the signaling pathways related to these beneficial functions were 1
activated in RAs (Fig. 1j, Supplementary Fig. 12a). For example, the β-catenin/MMPs 2
pathway was reported to be involved in astrocytic migratory activity as well as tissue repair 3
after SCI. TGF-β signaling contributes to both the neuronal survival and axonal 4
regeneration37,38. PDGF reduces the inflammatory response by enhancing the phagocytic 5
activity of microglia/macrophages after SCI39. We found that these pathways were significantly 6
and selectively activated in RAs, providing deeper insight into the beneficial influence of RAs 7
on tissue repair and functional recovery after SCI. 8
As shown in Figs. 5 and 6, we demonstrated that Col I was involved in the N-cadherin-9
mediated cell-cell adhesion in astrocytes through integrin signaling and astrocytic scar 10
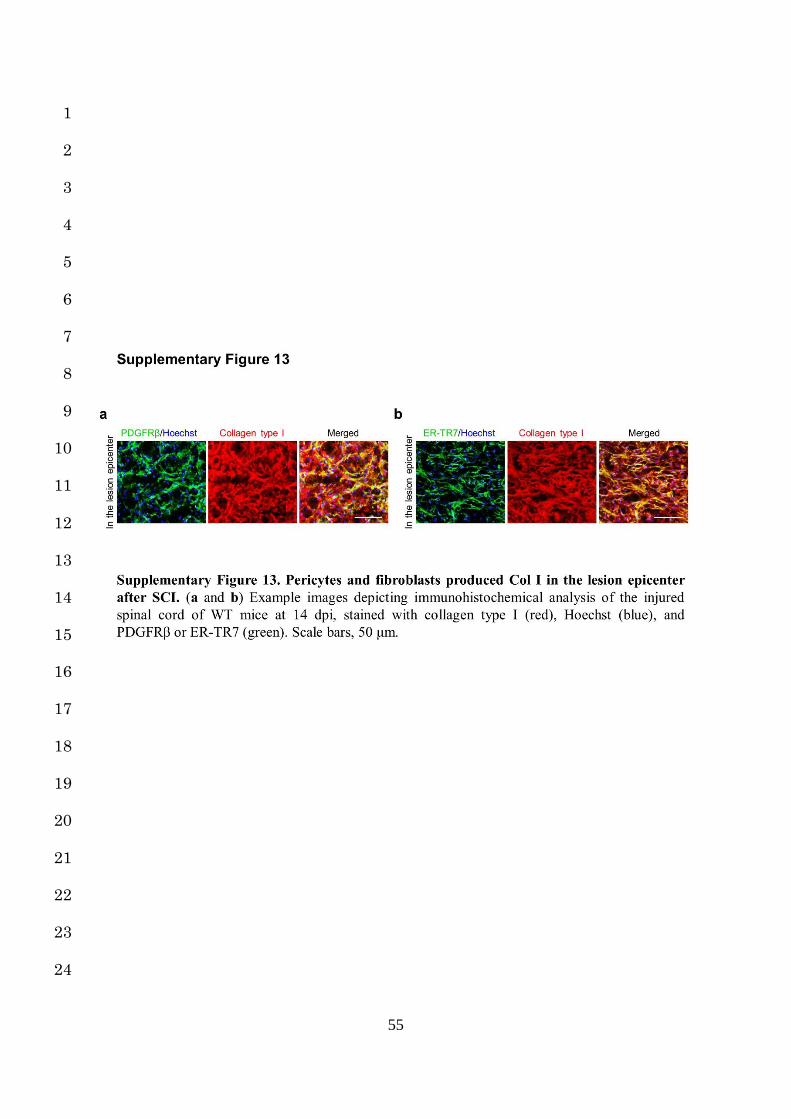
formation. To date, pericytes and fibroblasts have been reported to be the cell types that 11
produce Col I after SCI12,40,41, and we actually confirmed that these cells were clearly merged 12
with Col I in the lesion epicenter (Supplementary Fig. 13a,b). Regarding a possible molecular 13
link between the Col I-integrin axis and increased N-cadherin-dependent contact in astrocytes, 14
c-Jun-N-terminal kinase (JNK) may play a role. In previous studies of epithelial and cancer 15
cells, the Col I-integrin axis was reported to activate the downstream JNK pathway, which 16
influenced the N-cadherin-dependent intercellular adhesion42,43. Similarly, in astrocytes, Col I-17
integrin axis stimulation was recently reported to induce JNK activation44, and upregulation of 18
both JNK and N-cadherin has been observed in astrocytes after CNS injury (Supplementary 19
Fig. 3a)15,45,46. Given that JNK inhibitor attenuates astrocytic scar formation in the injured 20
spinal cord47, the integrin/JNK/N-cadherin pathway is crucial for astrocytic scar formation after 21
SCI. In this study, we also confirmed both attenuated astrocytic scar formation via Col I-22
integrin axis inhibition by anti-β1 Ab as well as an improved functional outcome (Fig. 6d-l), 23
providing a novel potential therapeutic target for SCI. 24
15
N-cadherin regulated reactive astrogliosis by increasing the astrocytic cell-cell adhesion. N-1
cadherin belongs to the classic cadherins that are calcium-dependent intercellular adhesion 2
molecules25,26 and has many functions in the CNS, such as differentiation, migration, and cell 3
polarization25,26,48. In addition to cell adhesion, N-cadherin in astrocytes has also been reported 4
to be involved in the migratory activity and cellular morphology. For example, both a lack of 5
and the overexpression of N-cadherin result in the impairment of astrocytic migration48,49. 6
Kanemura et al. also reported that astrocyte-specific knockout of N-cadherin results in 7
insufficient morphological changes in both RAs and SAs after CNS injury48. These results 8
indicate that the N-cadherin expression in astrocytes is finely tuned through the process of 9
reactive astrogliosis. Indeed, we confirmed the time-phase-dependent expression of N-cadherin 10
concomitant with cellular hypertrophy and process extension in RAs and SAs (Fig. 1k, Fig. 11
5h, Fig. 6b,e, Supplementary Fig. 3a). Although both anti-β1 Ab and N-cadherin nAb 12
prevented the transformation of RAs into SAs and attenuated astrocytic scar formation in this 13
study, there is a possibility that N-cadherin nAb impairs the beneficial function of RA more 14
severely than anti-β1 Ab, since N-cadherin has significant influence on the cellular morphology 15
and migration of RA as described above. We therefore used anti-β1 Ab. In the present study, 16
anti-β1 was administered during only the scar-forming phase to attenuate scar formation 17
without influencing the morphological changes or migratory activity of RAs. Our results have 18
important implications for the optimization of therapeutic intervention from the time-phase-19
dependent view of reactive astrogliosis. 20
Regarding the role of astrocytic scars after SCI, Anderson et al. recently reported that the 21
attenuation of astrocytic scar formation failed to result in spontaneous axonal regrowth after 22
SCI7,8, suggesting that astrocytic scar formation aids axonal regeneration. However, the 23
impairment of “the whole process of reactive astrogliosis” has already been reported to cause 24
16
the deterioration of axonal regrowth and functional recovery after SCI in several previous 1
studies3,50,51, and there has been no study demonstrating that astrocytic “scars” directly promote 2
axonal regeneration after SCI. In contrast, Silver and many other investigators demonstrated 3
that astrocytic “scars” directly impede axonal regeneration3-6,12,51, and our results supported 4
this finding. In this study, we therefore prevented only the transformation of RAs into SAs 5
without affecting RAs, leading to axonal elongation and functional improvement after SCI. 6
These findings suggest the significance of the time-phase-dependent regulation of reactive 7
astrogliosis for the SCI treatment. 8
In conclusion, we demonstrated the reversibility of reactive astrogliosis by a selective gene 9
expression analysis with LMD and transplantation experiments. We also clarified a mechanism 10
of astrocytic scar formation through RA-Col I interaction, supporting a novel therapeutic 11
strategy for attenuating astrocytic scar formation and improving the functional outcomes after 12
SCI. 13
17
Acknowledgements 1
We thank T. Tachibana for the gift of anti-Nestin antibody. This study was supported by a Grant-2
in-Aid for Young Scientist (A) (25713053) (S.O.); Challenging Exploratory Research from the 3
Ministry of Education, Science, Sports (16K15668) (S.O.); a Grant-in-Aid for Young Scientist 4
(B) (16K20059) (K.Kobayakawa); Scientific Research on Innovative Areas (Comprehensive 5
Brain Science Network and Foundation of Synapse Neurocircuit Pathology) (K.Kobayakawa); 6
and research foundations from the general insurance association of Japan (M.H.),. 7
8
Author contributions 9
M.H. designed and performed most of the experiments with technical help from H.K., T.S., and 10
S.Y. Y.O. performed the RNA-Seq analysis. K.Y. and K. Kijima analyzed the data of LMD. K. 11
Kobayakawa, K.H. and Y.N. designed the studies and supervised the overall project. S.O. 12
designed the studies, supervised the overall project, and performed the final manuscript 13
preparation. 14
15
Competing financial interests 16
The authors declare no competing financial interests. 17
18
19
18
References 1
1. McDonald, J. W. & Sadowsky, C. Spinal-cord injury. Lancet 359, 417–425 (2002). 2
2. Okada, S. et al. Conditional ablation of Stat3 or Socs3 discloses a dual role for reactive 3
astrocytes after spinal cord injury. Nat. Med. 12, 829–834 (2006). 4
3. Silver, J. & Miller, J. H. Regeneration beyond the glial scar. Nat. Rev. Neurosci. 5, 5
146–156 (2004). 6
4. Karimi-Abdolrezaee, S. & Billakanti, R. Reactive astrogliosis after spinal cord injury-7
beneficial and detrimental effects. Mol. Neurobiol. 46, 251–264 (2012). 8
5. Ridet, J. L., Malhotra, S. K., Privat, A. & Gage, F. H. Reactive astrocytes: cellular and 9
molecular cues to biological function. Trends Neurosci. 20, 570–577 (1997). 10
6. Buss, A. et al. Gradual loss of myelin and formation of an astrocytic scar during 11
Wallerian degeneration in the human spinal cord. Brain 127, 34–44 (2004). 12
7. Anderson, M. A. et al. Astrocyte scar formation aids central nervous system axon 13
regeneration. Nature 532, 195–200 (2016). 14
8. Liddelow, S. A. & Barres, B. A. Regeneration: Not everything is scary about a glial 15
scar. Nature 532, 182–183 (2016). 16
9. Windle, W. F., Clemente, C. D. & Chambers, W. W. Inhibition of formation of a glial 17
barrier as a means of permitting a peripheral nerve to grow into the brain. J. Comp. 18
Neurol. 96, 359–369 (1952). 19
10. Freeman, L. W. Return of Spinal Cord Function in Mammals After Transecting 20
Lesions. Ann. N. Y. Acad. Sci. 58, 564–569 (1954). 21
11. Sofroniew, M. V. Molecular dissection of reactive astrogliosis and glial scar formation. 22
Trends Neurosci. 32, 638–647 (2009). 23
12. Cregg, J. M. et al. Functional regeneration beyond the glial scar. Exp. Neurol. 253, 24
19
197–207 (2014). 1
13. Courtine, G. et al. Can experiments in nonhuman primates expedite the translation of 2
treatments for spinal cord injury in humans? Nat. Med. 13, 561–566 (2007). 3
14. Renault-Mihara, F. et al. Beneficial compaction of spinal cord lesion by migrating 4
astrocytes through glycogen synthase kinase-3 inhibition. EMBO Mol. Med. 3, 682–5
696 (2011). 6
15. Vázquez-Chona, F. & Geisert, E. E., J. N-cadherin at the glial scar in the rat. Brain 7
Res. 838, 45–50 (1999). 8
16. McKillop, W. M., Dragan, M., Schedl, A. & Brown, A. Conditional Sox9 ablation 9
reduces chondroitin sulfate proteoglycan levels and improves motor function 10
following spinal cord injury. Glia 61, 164–177 (2013). 11
17. Mann, B. et al. Target genes of beta-catenin-T cell-factor/lymphoid-enhancer-factor 12
signaling in human colorectal carcinomas. Proc. Natl. Acad. Sci. U. S. A. 96, 1603–13
1608 (1999). 14
18. Blasi, F. & Carmeliet, P. uPAR: a versatile signalling orchestrator. Nat. Rev. Mol. Cell 15
Biol. 3, 932–943 (2002). 16
19. Takeuchi, K. et al. Chondroitin sulphate N-acetylgalactosaminyl-transferase-1 inhibits 17
recovery from neural injury. Nat. Commun. 4, 2740 (2013). 18
20. Hagino, S. et al. Slit and glypican-1 mRNAs are coexpressed in the reactive astrocytes 19
of the injured adult brain. Glia 42, 130–138 (2003). 20
21. Ilieva, H., Polymenidou, M. & Cleveland, D. W. Non-cell autonomous toxicity in 21
neurodegenerative disorders: ALS and beyond. J. Cell Biol. 187, 761–772 (2009). 22
22. von Karstedt, S. et al. Cancer cell-autonomous TRAIL-R signaling promotes KRAS-23
Driven cancer progression, invasion, and metastasis. Cancer Cell 27, 561–573 (2015). 24
20
23. Kumamaru, H. et al. Direct isolation and RNA-seq reveal environment-dependent 1
properties of engrafted neural stem/progenitor cells. Nat. Commun. 3, 1140 (2012). 2
24. Kumamaru, H. et al. Therapeutic activities of engrafted neural stem/precursor cells 3
are not dormant in the chronically injured spinal cord. Stem Cells 31, 1535–1547 4
(2013). 5
25. Takeichi, M. The cadherin superfamily in neuronal connections and interactions. Nat. 6
Rev. Neurosci. 8, 11–20 (2007). 7
26. Tran, M. D., Wanner, I. B. & Neary, J. T. Purinergic receptor signaling regulates N-8
cadherin expression in primary astrocyte cultures. J. Neurochem. 105, 272–286 (2008). 9
27. Hynes, R. O. Integrins: Bidirectional, Allosteric Signaling Machines. Cell 110, 673–10
687 (2002). 11
28. Previtali, S. C., Archelos, J. J. & Hartung, H. P. Modulation of the Expression of 12
Integrins on Cells during Experimental Autoimmune Encephalomyelitis. A Central 13
Role for TNF-alpha. Am. J. Pathol. 151, 1425–1435 (1997). 14
29. Yonezawa, T. et al. Type IV collagen induces expression of thrombospondin-1 that is 15
mediated by integrin alpha1beta1 in astrocytes. Glia 58, 755–767 (2010). 16
30. Doyle, J. P. et al. Application of a Translational Profiling Approach for the 17
Comparative Analysis of CNS Cell Types. Cell 135, 749–762 (2008). 18
31. Garg, A. et al. Non-enzymatic dissociation of human mesenchymal stromal cells 19
improves chemokine-dependent migration and maintains immunosuppressive 20
function. Cytotherapy 16, 545–559 (2014). 21
32. Yokota, K. et al. Engrafted Neural Stem/Progenitor Cells Promote Functional 22
Recovery through Synapse Reorganization with Spared Host Neurons after Spinal 23
Cord Injury. Stem Cell Reports 5, 264–277 (2015). 24
21
33. Faulkner, J. R. et al. Reactive astrocytes protect tissue and preserve 1
function after spinal cord injury. J. Neurosci. 24, 2143–2155 (2004). 2
34. Rolls, A. et al. Two faces of chondroitin sulfate proteoglycan in spinal cord 3
repair: a role in microglia/macrophage activation. PLoS Med. 5, e171 4
(2008). 5
35. Rolls, A., Shechter, R. & Schwartz, M. The bright side of the glial scar in 6
CNS repair. Nat. Rev. Neurosci. 10, 235–241 (2009). 7
36. Shechter, R., Raposo, C., London, A., Sagi, I. & Schwartz, M. The glial scar-8
monocyte interplay: A pivotal resolution phase in spinal cord repair. PLoS 9
One 6, e27969 (2011). 10
37. Brionne, T. C., Tesseur, I., Masliah, E. & Wyss-Coray, T. Loss of TGF-β 1 Leads to 11
Increased Neuronal Cell Death and Microgliosis in Mouse Brain. Neuron 40, 1133–12
1145 (2003). 13
38. Abe, K., Chu, P. J., Ishihara, A. & Saito, H. Transforming growth factor-β 1 promotes 14
re-elongation of injured axons of cultured rat hippocampal neurons. Brain Res. 723, 15
206–209 (1996). 16
39. Lutton, C. et al. Combined VEGF and PDGF Treatment Reduces Secondary 17
Degeneration after Spinal Cord Injury. J. Neurotrauma 29, 957–970 (2012). 18
40. DePaul, M. A., Lin, C. Y., Silver, J. & Lee, Y. S. Peripheral Nerve 19
Transplantation Combined with Acidic Fibroblast Growth Factor and 20
Chondroitinase Induces Regeneration and Improves Urinary Function in 21
Complete Spinal Cord Transected Adult Mice. PLoS One 10, e0139335 22
(2015). 23
41. Goritz, C. et al. A Pericyte Origin of Spinal Cord Scar Tissue. Science. 333, 24
22
238–242 (2011). 1
42. Shintani, Y., Wheelock, M. J. & Johnson, K. R. Phosphoinositide-3 Kinase-Rac1-c-2
Jun NH2-terminal Kinase Signaling Mediates Collagen I-induced Cell Scattering and 3
Up-Regulation of N-Cadherin Expression in Mouse Mammary Epithelial Cells. Mol. 4
Biol. Cell 17, 2963–2975 (2006). 5
43. Shintani, Y., Hollingsworth, M. A., Wheelock, M. J. & Johnson, K. R. Collagen I 6
Promotes Metastasis in Pancreatic Cancer by Activating c-Jun NH2-Terminal Kinase 7
1 and Up-regulating N-Cadherin Expression. Cancer Res. 66, 11745–11753 (2006). 8
44. Le Dréau, G. et al. NOV/CCN3 Upregulates CCL2 and CXCL1 Expression in 9
Astrocytes Through β1 and β5 Integrins. Glia 58, 1510–1521 (2010). 10
45. Cao, J., Wang, J. S., Ren, X. H. & Zang, W. D. Spinal sample showing p-JNK and P38 11
associated with the pain signaling transduction of glial cell in neuropathic pain. Spinal 12
Cord 53, 92–97 (2015). 13
46. Gao, K. et al. Traumatic Scratch Injury in Astrocytes Triggers Calcium Influx to 14
Activate the JNK/c-Jun/AP-1 Pathway and Switch on GFAP Expression. Glia 61, 15
2063–2077 (2013). 16
47. Repici, M. et al. Specific inhibition of the JNK pathway promotes locomotor recovery 17
and neuroprotection after mouse spinal cord injury. Neurobiol. Dis. 46, 710–721 18
(2012). 19
48. Kanemaru, K. et al. Calcium-dependent N-cadherin up-regulation mediates reactive 20
astrogliosis and neuroprotection after brain injury. Proc. Natl. Acad. Sci. 110, 11612–21
11617 (2013). 22
49. Péglion, F. & Etienne-Manneville, S. N-cadherin expression level as a critical 23
indicator of invasion in non-epithelial tumors. Cell Adhes. Migr. 6, 327–332 (2012). 24
23
50. Bush, T. G. et al. Leukocyte infiltration, neuronal degeneration, and neurite outgrowth 1
after ablation of scar-forming, reactive astrocytes in adult transgenic mice. Neuron 23, 2
297–308 (1999). 3
51. Silver, J. The glial scar is more than just astrocytes. Exp. Neurol. 286, 147–4
149 (2016). 5
6
7
24
Figure legends 1
Figure 1. Selective in situ isolation and gene expression analysis of astrocytes from the 2
naïve and injured spinal cords. (a, c and e) Example images depicting GFAP (green) staining 3
of the naïve (a) and injured spinal cords at 7 (c) and 14 (e) dpi. The asterisk indicates the lesion 4
epicenter in SCI mice (c and e). Scale bars, 500 µm. (b, d and f) Example high magnification 5
images depicting immunohistochemical analysis of GFAP-positive astrocytes (green) stained 6
with Hoechst (blue) in the naïve (b) and injured spinal cords at 7 (d) and 14 (f) dpi. The 7
arrowheads and dashed-outlines indicate the astrocytes before (left) and after (right) LMD. The 8
images are magnifications of the boxed areas in (a), (c) and (e), respectively. Scale bars, 50µm. 9
(g) A schematic representation of the selective isolation of GFAP-positive astrocytes using 10
LMD. (h) Bioanalyzer gel image (left) and electropherogram with the associated RNA integrity 11
number (RIN) values (right) of RNA from LMD-isolated astrocytes. (i) Example PCR analysis 12
of selected transcripts in whole spinal cord (top) and LMD-isolated astrocytes (bottom). (j) 13
Quantification of mRNA expression levels of RA-related genes in NAs, RAs, and SAs (n = 4 14
mice per group). (k) Quantification of mRNA expression levels of SA-related genes in NAs, 15
RAs, and SAs (n = 4 mice per group). ★P < 0.05, analysis of variance (ANOVA) with the 16
Tukey-Kramer post hoc test (j and k); n.s., not significant. Data represent mean ± SEM. 17
18
Figure 2. Environment-dependent morphological changes of NAs transplanted into naïve 19
or injured spinal cords. (a and b) The NA transplantation protocol. NAs from primary 20
astrocyte cultures of CAG-EGFP mice were transplanted into the naïve and injured spinal cord 21
immediately after SCI. An immunohistochemical (IHC) analysis of the grafted NAs was 22
performed at 0, 7, and 14 dat. (c, e and g) Example images depicting IHC analysis of GFP-23
positive NAs (green) transplanted into the naïve spinal cord at 7 dat (c) and the injured spinal 24
25
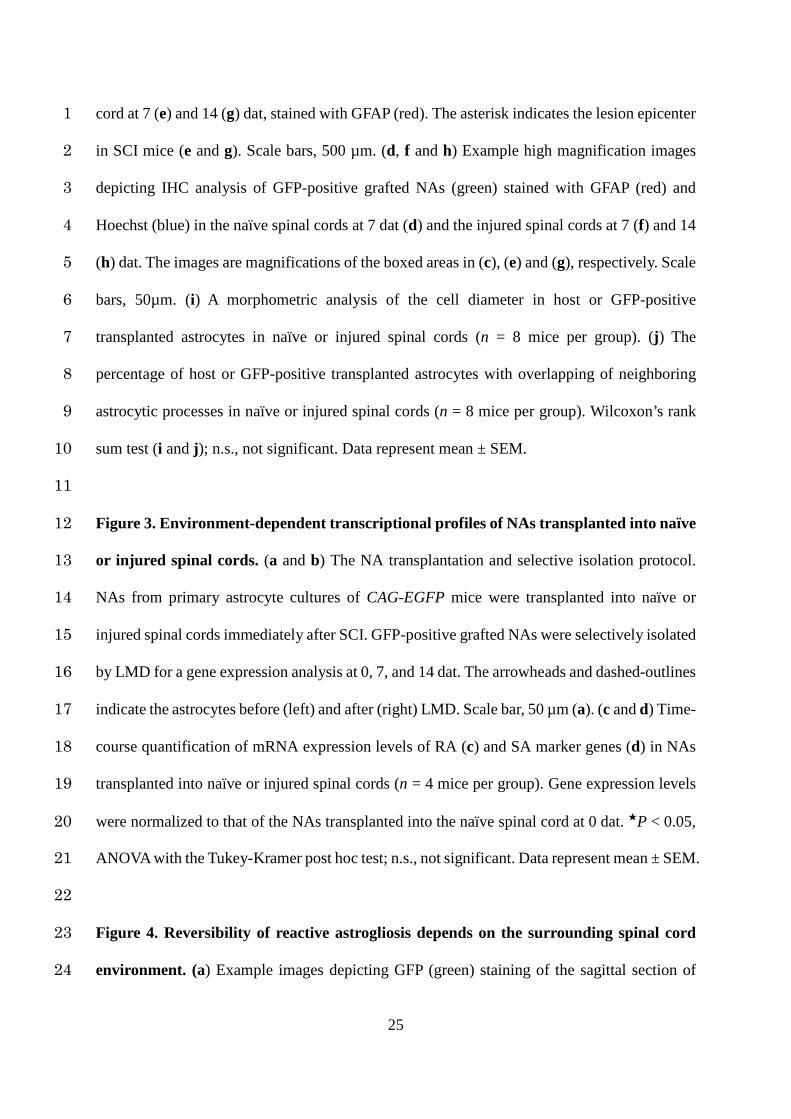
cord at 7 (e) and 14 (g) dat, stained with GFAP (red). The asterisk indicates the lesion epicenter 1
in SCI mice (e and g). Scale bars, 500 µm. (d, f and h) Example high magnification images 2
depicting IHC analysis of GFP-positive grafted NAs (green) stained with GFAP (red) and 3
Hoechst (blue) in the naïve spinal cords at 7 dat (d) and the injured spinal cords at 7 (f) and 14 4
(h) dat. The images are magnifications of the boxed areas in (c), (e) and (g), respectively. Scale 5
bars, 50µm. (i) A morphometric analysis of the cell diameter in host or GFP-positive 6
transplanted astrocytes in naïve or injured spinal cords (n = 8 mice per group). (j) The 7
percentage of host or GFP-positive transplanted astrocytes with overlapping of neighboring 8
astrocytic processes in naïve or injured spinal cords (n = 8 mice per group). Wilcoxon’s rank 9
sum test (i and j); n.s., not significant. Data represent mean ± SEM. 10
11
Figure 3. Environment-dependent transcriptional profiles of NAs transplanted into naïve 12
or injured spinal cords. (a and b) The NA transplantation and selective isolation protocol. 13
NAs from primary astrocyte cultures of CAG-EGFP mice were transplanted into naïve or 14
injured spinal cords immediately after SCI. GFP-positive grafted NAs were selectively isolated 15
by LMD for a gene expression analysis at 0, 7, and 14 dat. The arrowheads and dashed-outlines 16
indicate the astrocytes before (left) and after (right) LMD. Scale bar, 50 µm (a). (c and d) Time-17
course quantification of mRNA expression levels of RA (c) and SA marker genes (d) in NAs 18
transplanted into naïve or injured spinal cords (n = 4 mice per group). Gene expression levels 19
were normalized to that of the NAs transplanted into the naïve spinal cord at 0 dat. ★P < 0.05, 20
ANOVA with the Tukey-Kramer post hoc test; n.s., not significant. Data represent mean ± SEM. 21
22
Figure 4. Reversibility of reactive astrogliosis depends on the surrounding spinal cord 23
environment. (a) Example images depicting GFP (green) staining of the sagittal section of 24
26
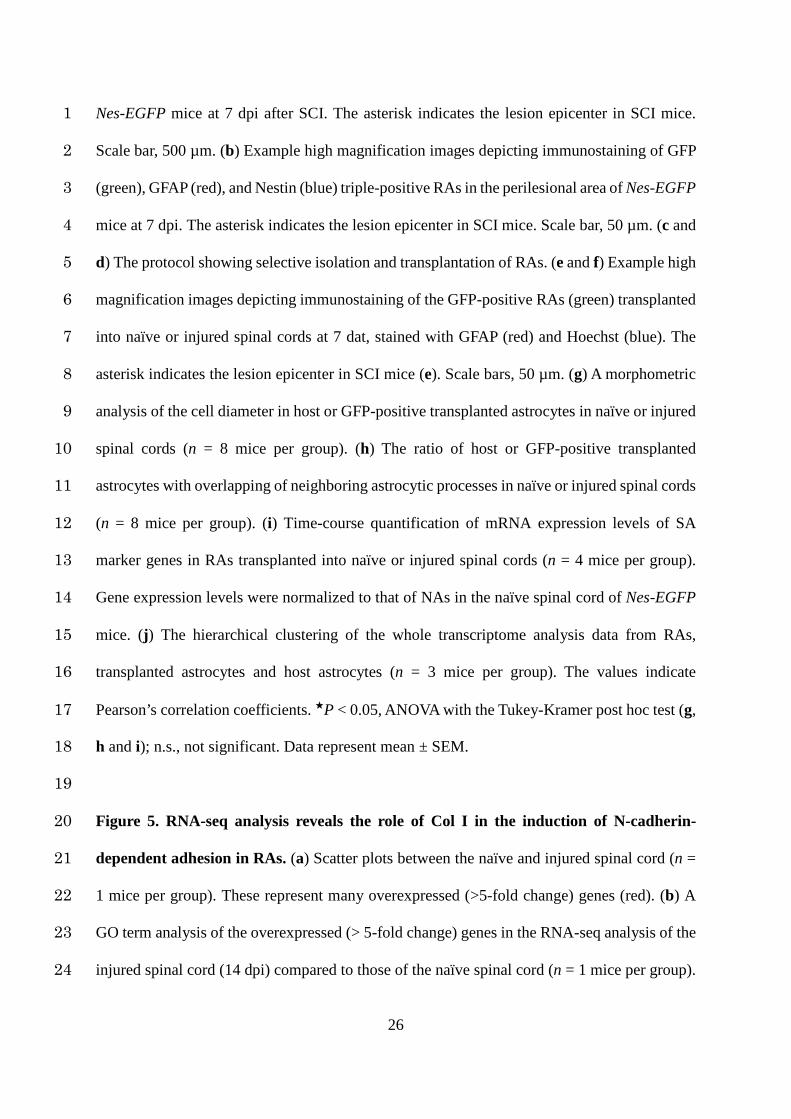
Nes-EGFP mice at 7 dpi after SCI. The asterisk indicates the lesion epicenter in SCI mice. 1
Scale bar, 500 µm. (b) Example high magnification images depicting immunostaining of GFP 2
(green), GFAP (red), and Nestin (blue) triple-positive RAs in the perilesional area of Nes-EGFP 3
mice at 7 dpi. The asterisk indicates the lesion epicenter in SCI mice. Scale bar, 50 µm. (c and 4
d) The protocol showing selective isolation and transplantation of RAs. (e and f) Example high 5
magnification images depicting immunostaining of the GFP-positive RAs (green) transplanted 6
into naïve or injured spinal cords at 7 dat, stained with GFAP (red) and Hoechst (blue). The 7
asterisk indicates the lesion epicenter in SCI mice (e). Scale bars, 50 µm. (g) A morphometric 8
analysis of the cell diameter in host or GFP-positive transplanted astrocytes in naïve or injured 9
spinal cords (n = 8 mice per group). (h) The ratio of host or GFP-positive transplanted 10
astrocytes with overlapping of neighboring astrocytic processes in naïve or injured spinal cords 11
(n = 8 mice per group). (i) Time-course quantification of mRNA expression levels of SA 12
marker genes in RAs transplanted into naïve or injured spinal cords (n = 4 mice per group). 13
Gene expression levels were normalized to that of NAs in the naïve spinal cord of Nes-EGFP 14
mice. (j) The hierarchical clustering of the whole transcriptome analysis data from RAs, 15
transplanted astrocytes and host astrocytes (n = 3 mice per group). The values indicate 16
Pearson’s correlation coefficients. ★P < 0.05, ANOVA with the Tukey-Kramer post hoc test (g, 17
h and i); n.s., not significant. Data represent mean ± SEM. 18
19
Figure 5. RNA-seq analysis reveals the role of Col I in the induction of N-cadherin-20
dependent adhesion in RAs. (a) Scatter plots between the naïve and injured spinal cord (n = 21
1 mice per group). These represent many overexpressed (>5-fold change) genes (red). (b) A 22
GO term analysis of the overexpressed (> 5-fold change) genes in the RNA-seq analysis of the 23
injured spinal cord (14 dpi) compared to those of the naïve spinal cord (n = 1 mice per group). 24
27
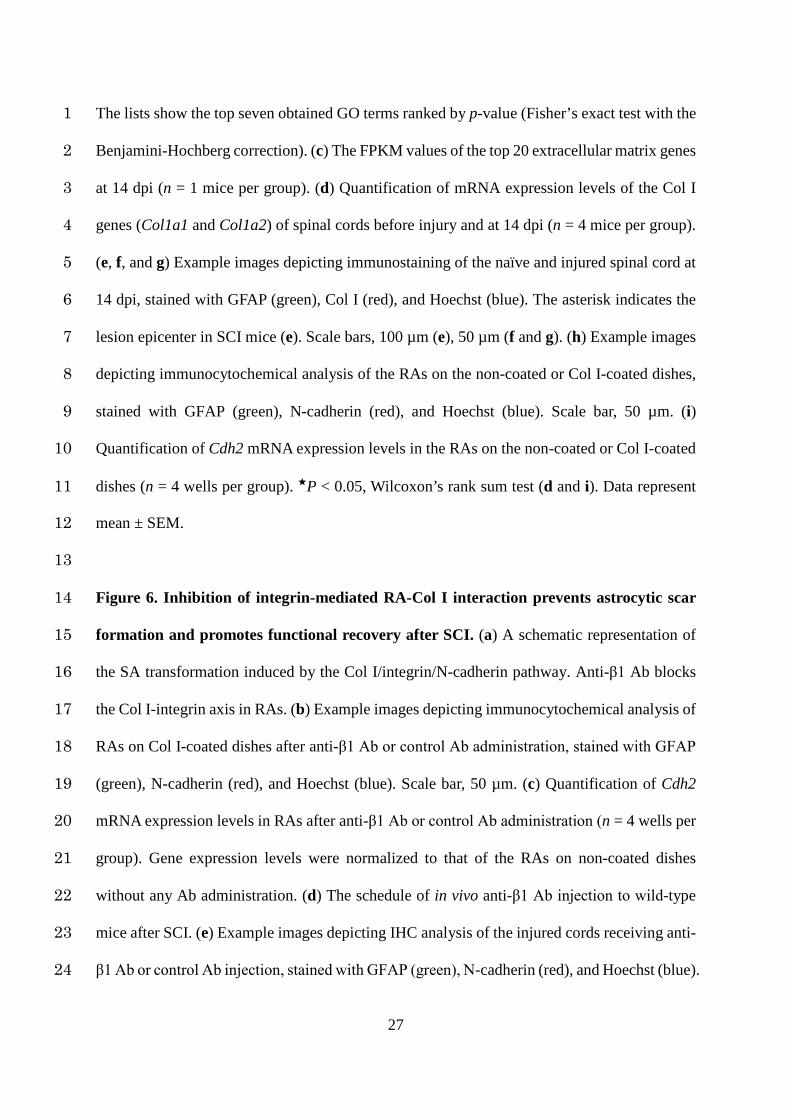
The lists show the top seven obtained GO terms ranked by p-value (Fisher’s exact test with the 1
Benjamini-Hochberg correction). (c) The FPKM values of the top 20 extracellular matrix genes 2
at 14 dpi (n = 1 mice per group). (d) Quantification of mRNA expression levels of the Col I 3
genes (Col1a1 and Col1a2) of spinal cords before injury and at 14 dpi (n = 4 mice per group). 4
(e, f, and g) Example images depicting immunostaining of the naïve and injured spinal cord at 5
14 dpi, stained with GFAP (green), Col I (red), and Hoechst (blue). The asterisk indicates the 6
lesion epicenter in SCI mice (e). Scale bars, 100 µm (e), 50 µm (f and g). (h) Example images 7
depicting immunocytochemical analysis of the RAs on the non-coated or Col I-coated dishes, 8
stained with GFAP (green), N-cadherin (red), and Hoechst (blue). Scale bar, 50 µm. (i) 9
Quantification of Cdh2 mRNA expression levels in the RAs on the non-coated or Col I-coated 10
dishes (n = 4 wells per group). ★P < 0.05, Wilcoxon’s rank sum test (d and i). Data represent 11
mean ± SEM. 12
13
Figure 6. Inhibition of integrin-mediated RA-Col I interaction prevents astrocytic scar 14
formation and promotes functional recovery after SCI. (a) A schematic representation of 15
the SA transformation induced by the Col I/integrin/N-cadherin pathway. Anti-β1 Ab blocks 16
the Col I-integrin axis in RAs. (b) Example images depicting immunocytochemical analysis of 17
RAs on Col I-coated dishes after anti-β1 Ab or control Ab administration, stained with GFAP 18
(green), N-cadherin (red), and Hoechst (blue). Scale bar, 50 µm. (c) Quantification of Cdh2 19
mRNA expression levels in RAs after anti-β1 Ab or control Ab administration (n = 4 wells per 20
group). Gene expression levels were normalized to that of the RAs on non-coated dishes 21
without any Ab administration. (d) The schedule of in vivo anti-β1 Ab injection to wild-type 22
mice after SCI. (e) Example images depicting IHC analysis of the injured cords receiving anti-23
β1 Ab or control Ab injection, stained with GFAP (green), N-cadherin (red), and Hoechst (blue). 24
28
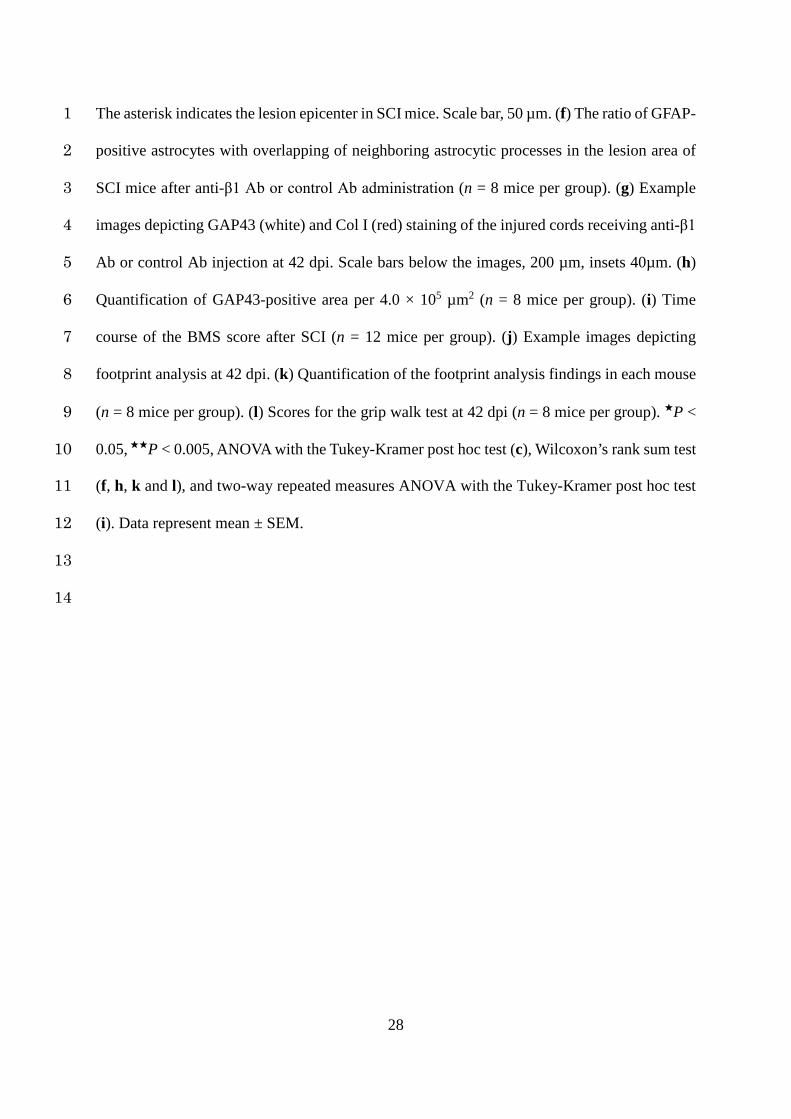
The asterisk indicates the lesion epicenter in SCI mice. Scale bar, 50 µm. (f) The ratio of GFAP-1
positive astrocytes with overlapping of neighboring astrocytic processes in the lesion area of 2
SCI mice after anti-β1 Ab or control Ab administration (n = 8 mice per group). (g) Example 3
images depicting GAP43 (white) and Col I (red) staining of the injured cords receiving anti-β1 4
Ab or control Ab injection at 42 dpi. Scale bars below the images, 200 µm, insets 40µm. (h) 5
Quantification of GAP43-positive area per 4.0 × 105 µm2 (n = 8 mice per group). (i) Time 6
course of the BMS score after SCI (n = 12 mice per group). (j) Example images depicting 7
footprint analysis at 42 dpi. (k) Quantification of the footprint analysis findings in each mouse 8
(n = 8 mice per group). (l) Scores for the grip walk test at 42 dpi (n = 8 mice per group). ★P < 9
0.05, ★★P < 0.005, ANOVA with the Tukey-Kramer post hoc test (c), Wilcoxon’s rank sum test 10
(f, h, k and l), and two-way repeated measures ANOVA with the Tukey-Kramer post hoc test 11
(i). Data represent mean ± SEM. 12
13
14
29
Online Methods 1
Animals 2
All animal studies were approved by the Committee of Ethics on Animal Experimentation of 3
the Faculty of Medicine, Kyushu University. The experiments were conducted in accordance 4
with the National Institutes of Health guidelines for the care and use of animals. Female 5
C57BL/6J mice (8–10 weeks old) were used in this study. CAG-EGFP mice, Nes-Cre mice, 6
and CAG-CATloxP/loxP-EGFP mice were as described previously2,52. To generate Nes-Cre; CAG-7
CATloxP/loxP-EGFP (Nes-EGFP) mice, we crossed Nes-Cre mice and CAG-CATloxP/loxP-EGFP 8
mice. 9
10
Primary astrocyte cultures 11
Purified primary astrocyte cultures were prepared from CAG-EGFP mice or C57BL/6J mice, 12
as described previously2,53. In brief, after the removal of the meninges, postnatal day 2 mouse 13
brain tissues were minced and incubated in a rocking water bath at 37 °C for 30 min in 14
Dulbecco’s modified Eagle’s medium (DMEM; Invitrogen, Carlsbad, California) in the 15
presence of 0.25% trypsin (Sigma-Aldrich) and 300 g ml-1 DNase I (Sigma-Aldrich). The 16
dissociated cells were triturated with 0.25% fetal bovine serum (FBS) and centrifuged at 300 17
× g for 5 min. Following dilution with astrocyte-specific medium (DMEM containing 10% 18
FBS, 0.2 mML-glutamine, and 1% penicillin-streptomycin), the cells were plated on non-19
coated culture dishes. After 7-10 days in a humidified CO2 incubator at 37 °C, the astrocytes 20
were used for experiments. For the activation to RAs, the astrocytes were stimulated with 50 21
ng ml-1 IL-6 (R&D Systems Inc.) and 200 ng ml-1 soluble IL-6 receptor (R&D Systems Inc.). 22
For the preparation of Col I-coated dishes, the dishes were incubated at 37 °C for 2 h with 23
mouse collagen type I (50 µg ml-1; AbD Serotec), as described previously54. 24
30
1
Spinal cord injury 2
The animals were anesthetized via an intraperitoneal injection of pentobarbital (75 mg kg-1) 3
and subjected to a contusion injury (70 kilodyne) at the 10th thoracic level using an Infinite 4
Horizons Impactor (Precision Systems Instrumentation)32. During the period of recovery from 5
anesthesia, the mice were placed in a temperature-controlled chamber until thermoregulation 6
was reestablished. 7
8
Flow cytometry and cell sorting 9
The spinal cord samples (4 mm in length, centered around the lesion) were dissociated in 10
collagenase type I (Invitrogen), followed by an analysis using a cell sorter, SH800 (Sony), as 11
described previously23,55. GFP-positive RAs isolated from the injured spinal cord of Nes-EGFP 12
mice were used for transplantation. 13
14
Cell transplantation 15
Using a stereotaxic injector (KDS 310; Muromachi-kikai), a 25-μl Hamilton syringe 16
(Hamilton) with a glass tip was inserted into the injured spinal cord (1 mm rostral to the lesion 17
epicenter) or the naïve spinal cord. A total volume of 2 µl of cell suspension (2.0 × 10⁴ viable 18
cells per microliter) was injected at a rate of 0.5 µl min-1. 19
20
Behavioral analyses 21
The motor function was evaluated with a locomotor open-field rating scale on the Basso Mouse 22
Scale (BMS)32. A footprint analysis was also performed, as described previously32. The 23
forelimbs and hindlimbs of the mice were dipped in red and green dyes, respectively. For the 24
31
grip walk test, a grid walk was reconstructed for mice using two parallel pieces of wood. After 1
3 days of training, each mouse was evaluated using 50 cm of the grid with three patterns: easy 2
(50 steps, 1 cm apart), medium (every third step removed), and hard (every other step 3
removed)24. The sum of the number of grips for all three patterns was calculated in the analysis. 4
All tests were performed in a double-blinded fashion. 5
6
Histopathological examination 7
After the animals were reanesthetized and transcardially fixed with 4% paraformaldehyde, the 8
spinal cord was removed, dehydrated, and embedded in an OCT compound. The frozen 9
sections were cut in the sagittal plane at 16 µm or the axial plane at 20 µm. The sections were 10
subsequently stained with primary antibodies in the blocking solution at 4 °C overnight and 11
then incubated with Alexa Fluor secondary antibodies 1 (1:200; Invitrogen) and Hoechst 33258. 12
The following primary antibodies were used: GFAP (1:200, rabbit; Dako, Z0334), GFAP 13
(1:200, rat; Life Technologies, 130300), Nestin (1:200, rat; a gift from Dr. Taro Tachibana, 14
Osaka City University, Osaka, Japan), β-catenin (1:200, mouse; Millipore, 05-665), N-cadherin 15
(1:200, mouse; BD Transduction Laboratories, 610921), Sox9 (1:200, rabbit; Abcam, ab26414), 16
COL1A1 (1:200, mouse; Sigma-Aldrich, SAB1402151), GAP-43 (1:200, rabbit; Novus 17
Biologicals, NB300-143), serotonin (5-HT; 1:200, goat; ImmunoStar, 20079), tyrosine 18
hydroxylase (TH; 1:200, mouse; Millipore, MAB318), platelet-derived growth factor receptor 19
β (PDGFRβ; pericyte marker, 1:200, rabbit; Abcam, ab32570), ER-TR7 (fibroblast marker, 20
1:200, rat, Santa Cruz Biotechnology, sc-73355). The GAP43-positive, 5-HT-positive or TH-21
positive area per 4.0 × 105 µm2 at 42 dpi was measured using the BZ-II analyzer software 22
program (Keyence). We randomly selected 20 cells in each sample and measured the astrocyte 23
cell diameter or ratio of cells with overlapping of neighboring astrocytic processes using the 24
32
Image J software program (U.S. National Institutes of Health). All images were captured using 1
a BZ-9000 digital microscope system (Keyence) or epifluorescence microscope equipped with 2
a digital camera (BX51; 12 Olympus). 3
4
Laser-capture microdissection 5
Fresh spinal cords were immediately frozen in dry ice/hexane and stored in a deep freezer at -6
80 °C. The tissues were cut at 16 μm using a cryostat at -20 °C and mounted on PEN membrane 7
slides. The sections were then fixed in ice-cold acetone for 2 min and stained with the antibody 8
against GFAP (1:50, rabbit; Dako) for 5 min. GFP-positive RAs and GFAP-positive astrocytes 9
were dissected with an LMD 6500 system (Leica Microsystems) and transferred by gravity into 10
separate microcentrifuge tube caps placed directly beneath the section. The tube caps were then 11
filled with 75 µl of RLT buffer (Qiagen). For each sample, 1000 cells were dissected from 1 12
series of sagittal sections and subjected to RNA extraction. 13
14
Reverse transcription (RT)-PCR 15
Total RNA was isolated from the astrocytes obtained from the spinal cord tissue using the 16
RNeasy Micro Kit (Qiagen) or from the injured spinal cord (4 mm in length) using the RNeasy 17
Mini Kit (Qiagen). For the complementary DNA (cDNA) synthesis, a reverse transcription 18
reaction was performed using a PrimeScript first-strand cDNA Synthesis Kit (Takara Bio). 19
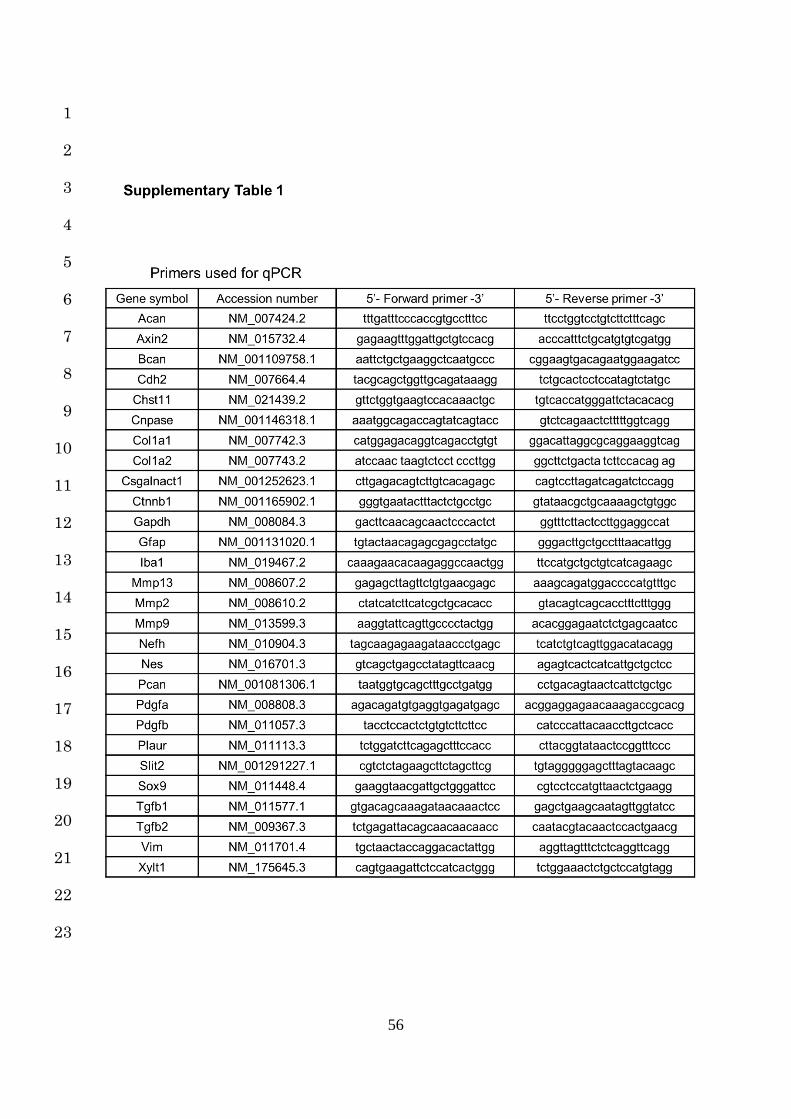
Quantitative RT-PCR was performed using primers specific to the genes of interest (Table S1) 20
and SYBR Premix Dimmer-Eraser (Takara Bio). The data were normalized to the expression 21
of glyceraldehyde-3-phosphate dehydrogenase. RT-PCR was conducted using a Thermocycler 22
(Biometra), and the products were detected by electrophoresis and ethidium bromide staining. 23
24
33
RNA sequencing 1
The sample preparation and data analyses were performed as described previously56. In brief, 2
the mRNA-seq library was prepared using the NEBNext Ultra Directional Library Prep Kit for 3
Illumina (NEB) and sequenced on an Illumina HiSeq-1500 system. The sequence reads were 4
aligned to the mouse reference genome (mm9, build 37), and the gene expression (fragments 5
per kilobase of exon per million mapped sequence reads; FPKM) was calculated using the 6
TopHat (version 2.0.11) and Cufflinks (version 2.1.1) software programs57. The selected genes 7
of interest were converted into lists of GO terms on GO database annotations with DAVID58. 8
The calculated –log10 (P-values) are displayed on the x-axis of the graph. 9
10
The sequencing and data analysis (CEL-Seq2) 11
We performed CEL-Seq2 for the whole transcriptome analysis of RAs (isolated by FACS at 7 12
dpi), transplanted and host astrocytes (both isolated by LMD at 7 dat), in accordance with a 13
previously described protocol59. We sequenced the libraries using an Illumina MiSeq system. 14
The reads were mapped to the mouse reference genome (mm10) using the Bowtie 2 software 15
program (version 2.2.6)60. Pearson’s correlation coefficients were calculated using the common 16
logarithm of the read counts for genes with non-zero counts in at least one sample. 17
Differentially expressed genes (DEGs) were extracted using the DESeq2 library (version 18
1.10.1) for R (with adjusted p-values of < 0.1)61. 19
20
Anti-β1 Ab injection 21
SCI mice received an injection of 1 μg function-blocking monoclonal antibody against β1-22
integrin (anti-β1 Ab; BD Pharmingen, 555003) at the epicenter using a stereotaxic injector 23
(KDS 310; Muromachi-kikai) every 2 days from 9 to 13 dpi. Control mice were given an 24
34
equivalent amount of isotype control (control Ab; BD Pharmingen, 553958). For in vitro 1
blocking of collagen-integrin signaling, anti-β1 Ab or control Ab was added at 1 µg ml-1, and 2
an immunocytological analysis and mRNA extraction were performed at 12 h after 3
administration. 4
5
The administration of N-cadherin nAb 6
We injected 10 μg of neutralizing monoclonal antibody against N-cadherin (N-cadherin nAb; 7
Sigma-Aldrich, C3865) at the lesion epicenter in SCI mice using a stereotaxic injector (KDS 8
310; Muromachi-kikai) every 2 days from 9 to 13 dpi. Control mice received an equivalent 9
amount of isotype control IgG (control IgG; BioXCell, BE0083). For the in vitro N-cadherin 10
blockade experiments, N-cadherin nAb or control IgG was added at 10 µg ml-1, and an 11
immunocytological analysis was performed at 12 h after administration. 12
13
Statistical analysis 14
Wilcoxon’s rank-sum test was used to compare the medians of the data of qPCR, the cell 15
diameter, the ratio of overlapping-positive cells, the GAP43-positive, 5-HT-positive or TH-16
positive area, and the functional outcome scores. For multiple comparisons in qPCR, an 17
analysis of variance (ANOVA) with the Tukey-Kramer post hoc test was applied. For the 18
analysis of the differences in the BMS scores between the groups over time, a two-way repeated 19
measures ANOVA with the Tukey-Kramer post hoc test was performed. In all statistical 20
analyses, the level of significance was set at 0.05. The values for groups are presented as the 21
average ± SEM. All of the statistical analyses were carried out using the JMP software program 22
(version 11; SAS Institute). 23
24
35
Data availability 1
RNA-seq (whole spinal cords) and CEL-Seq2 (isolated astrocytes) data are deposited with 2
accession codes DRA004535 (DDBJ) and DRA005561 (DDBJ), respectively. 3
4
5
6
7
36
Methods-only References 1
52. Okabe, M., Ikawa, M., Kominami, K., Nakanishi, T. & Nishimune, Y. `Green mice’ as 2
a source of ubiquitous green cells. FEBS Lett. 407, 313–319 (1997). 3
53. Sanai, N. et al. Unique astrocyte ribbon in adult human brain contains neural stem 4
cells but lacks chain migration. Nature 427, 740–744 (2004). 5
54. Takahashi, S. et al. C-type lectin-like domain and fibronectin-like type II domain of 6
phospholipase A2 receptor 1 modulate binding and migratory responses to collagen. 7
FEBS Lett. 589, 829–835 (2015). 8
55. Hayashi, M. et al. Chd5 Regulates MuERV-L/MERVL Expression in Mouse 9
Embryonic Stem Cells Via H3K27me3 Modification and Histone H3.1/H3.2. J. Cell. 10
Biochem. 117, 780–792 (2016). 11
56. Harada, A. et al. Incorporation of histone H3.1 suppresses the lineage potential of 12
skeletal muscle. Nucleic Acids Res. 43, 775–786 (2015). 13
57. Trapnell, C. et al. Differential gene and transcript expression analysis of RNA-seq 14
experiments with TopHat and Cufflinks. Nat. Protoc. 7, 562–578 (2012). 15
58. Dennis, G., Jr. et al. DAVID: Database for Annotation, Visualization, and Integrated 16
Discovery. Genome Biol. 4, P3 (2003). 17
59. Hashimshony, T. et al. CEL-Seq2: sensitive highly-multiplexed single-cell RNA-Seq. 18
Genome Biol. 17, 77 (2016). 19
60. Langmead, B. & Salzberg, S. Fast gapped-read alignment with Bowtie 2. Nat Methods. 20
9, 357-359 (2012). 21
61. Love, M. I., Huber, W. & Anders, S. Moderated estimation of fold change and 22
dispersion for RNA-seq data with DESeq2. Genome Biol. 15, 550 (2014). 23
24
37
1
2
3
4
5
6
7
8
9
10
11
12
13
14
15
16
17
18
19
20
21
22
Figure 1. 23
24
38
1
2
3
4
5
6
7
8
9
10
11
12
13
14
15
16
17
18
19
20
21
22
23
Figure 2. 24
39
1
2
3
4
5
6
7
8
9
10
11
12
13
14
15
16
17
18
19
20
21
22
23
Figure 3. 24
40
1
2
3
4
5
6
7
8
9
10
11
12
13
14
15
16
17
18
19
20
21
22
23
Figure 4. 24
41
1
2
3
4
5
6
7
8
9
10
11
12
13
14
15
16
17
18
19
20
21
22
23
Figure 5. 24
42
1
2
3
4
5
6
7
8
9
10
11
12
13
14
15
16
17
18
19
20
21
22
23
Figure 6. 24
43
1
2
3
4
5
6
7
8
9
10
11
12
13
14
15
16
17
18
19
20
21
22
23
24
44
1
2
3
4
5
6
7
8
9
10
11
12
13
14
15
16
17
18
19
20
21
22
23
24
45
1
2
3
4
5
6
7
8
9
10
11
12
13
14
15
16
17
18
19
20
21
22
23
24
46
1
2
3
4
5
6
7
8
9
10
11
12
13
14
15
16
17
18
19
20
21
22
23
24
47
1
2
3
4
5
6
7
8
9
10
11
12
13
14
15
16
17
18
19
20
21
22
23
24
48
1
2
3
4
5
6
7
8
9
10
11
12
13
14
15
16
17
18
19
20
21
22
23
24
49
1
2
3
4
5
6
7
8
9
10
11
12
13
14
15
16
17
18
19
20
21
22
23
24
50
1
2
3
4
5
6
7
8
9
10
11
12
13
14
15
16
17
18
19
20
21
22
23
24
51
1
2
3
4
5
6
7
8
9
10
11
12
13
14
15
16
17
18
19
20
21
22
23
24
52
1
2
3
4
5
6
7
8
9
10
11
12
13
14
15
16
17
18
19
20
21
22
23
24
53
1
2
3
4
5
6
7
8
9
10
11
12
13
14
15
16
17
18
19
20
21
22
23
24
54
1
2
3
4
5
6
7
8
9
10
11
12
13
14
15
16
17
18
19
20
21
22
23
24
55
1
2
3
4
5
6
7
8
9
10
11
12
13
14
15
16
17
18
19
20
21
22
23
24
56
1
2
3
4
5
6
7
8
9
10
11
12
13
14
15
16
17
18
19
20
21
22
23