Embed Size (px)
Citation preview
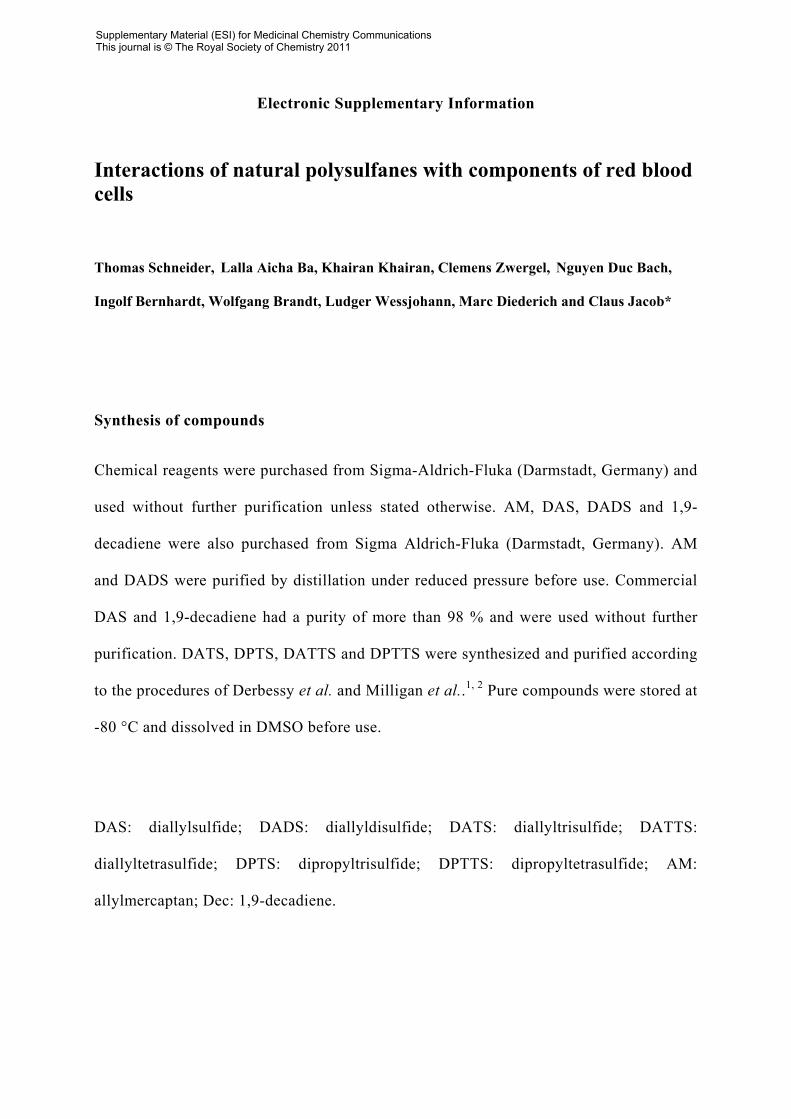
Electronic Supplementary Information
Interactions of natural polysulfanes with components of red blood cells
Thomas Schneider, Lalla Aicha Ba, Khairan Khairan, Clemens Zwergel, Nguyen Duc Bach,
Ingolf Bernhardt, Wolfgang Brandt, Ludger Wessjohann, Marc Diederich and Claus Jacob*
Synthesis of compounds
Chemical reagents were purchased from Sigma-Aldrich-Fluka (Darmstadt, Germany) and
used without further purification unless stated otherwise. AM, DAS, DADS and 1,9-
decadiene were also purchased from Sigma Aldrich-Fluka (Darmstadt, Germany). AM
and DADS were purified by distillation under reduced pressure before use. Commercial
DAS and 1,9-decadiene had a purity of more than 98 % and were used without further
purification. DATS, DPTS, DATTS and DPTTS were synthesized and purified according
to the procedures of Derbessy et al. and Milligan et al..1, 2 Pure compounds were stored at
-80 °C and dissolved in DMSO before use.
DAS: diallylsulfide; DADS: diallyldisulfide; DATS: diallyltrisulfide; DATTS:
diallyltetrasulfide; DPTS: dipropyltrisulfide; DPTTS: dipropyltetrasulfide; AM:
allylmercaptan; Dec: 1,9-decadiene.
Supplementary Material (ESI) for Medicinal Chemistry CommunicationsThis journal is © The Royal Society of Chemistry 2011
In vitro activity assays
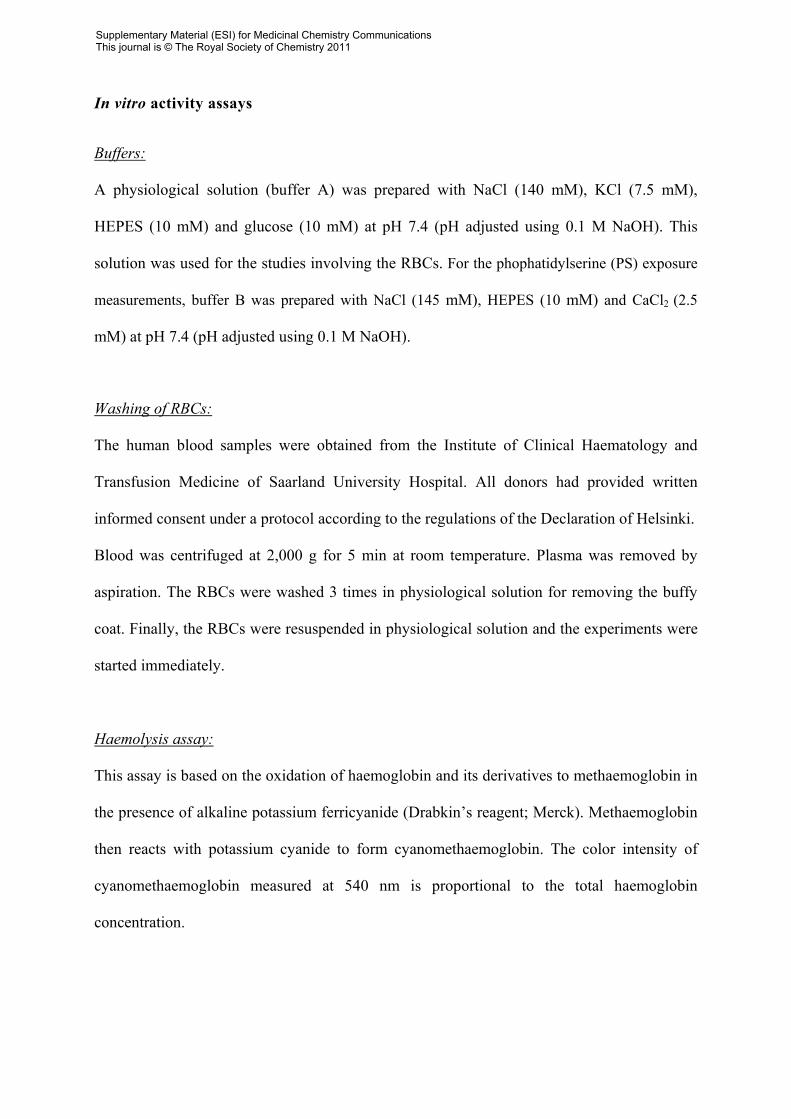
Buffers: A physiological solution (buffer A) was prepared with NaCl (140 mM), KCl (7.5 mM),
HEPES (10 mM) and glucose (10 mM) at pH 7.4 (pH adjusted using 0.1 M NaOH). This
solution was used for the studies involving the RBCs. For the phophatidylserine (PS) exposure
measurements, buffer B was prepared with NaCl (145 mM), HEPES (10 mM) and CaCl2 (2.5
mM) at pH 7.4 (pH adjusted using 0.1 M NaOH).
Washing of RBCs: The human blood samples were obtained from the Institute of Clinical Haematology and
Transfusion Medicine of Saarland University Hospital. All donors had provided written
informed consent under a protocol according to the regulations of the Declaration of Helsinki.
Blood was centrifuged at 2,000 g for 5 min at room temperature. Plasma was removed by
aspiration. The RBCs were washed 3 times in physiological solution for removing the buffy
coat. Finally, the RBCs were resuspended in physiological solution and the experiments were
started immediately.
Haemolysis assay:
This assay is based on the oxidation of haemoglobin and its derivatives to methaemoglobin in
the presence of alkaline potassium ferricyanide (Drabkin’s reagent; Merck). Methaemoglobin
then reacts with potassium cyanide to form cyanomethaemoglobin. The color intensity of
cyanomethaemoglobin measured at 540 nm is proportional to the total haemoglobin
concentration.
Supplementary Material (ESI) for Medicinal Chemistry CommunicationsThis journal is © The Royal Society of Chemistry 2011
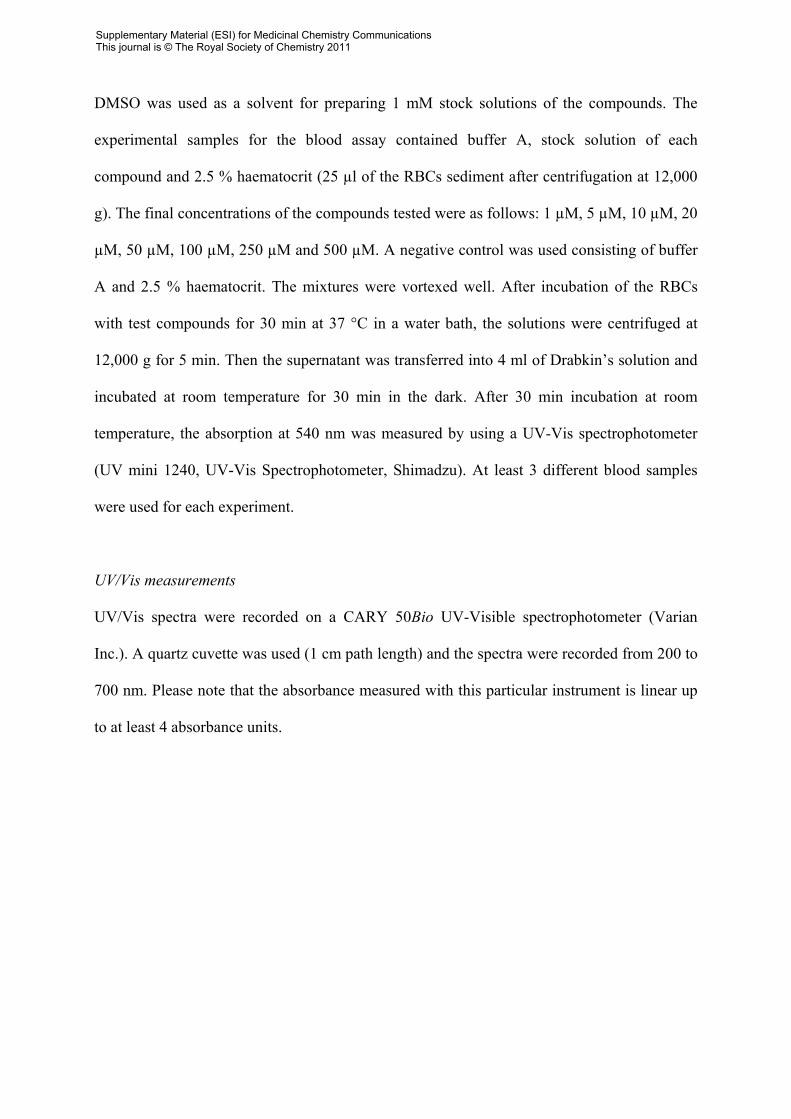
DMSO was used as a solvent for preparing 1 mM stock solutions of the compounds. The
experimental samples for the blood assay contained buffer A, stock solution of each
compound and 2.5 % haematocrit (25 µl of the RBCs sediment after centrifugation at 12,000
g). The final concentrations of the compounds tested were as follows: 1 µM, 5 µM, 10 µM, 20
µM, 50 µM, 100 µM, 250 µM and 500 µM. A negative control was used consisting of buffer
A and 2.5 % haematocrit. The mixtures were vortexed well. After incubation of the RBCs
with test compounds for 30 min at 37 °C in a water bath, the solutions were centrifuged at
12,000 g for 5 min. Then the supernatant was transferred into 4 ml of Drabkin’s solution and
incubated at room temperature for 30 min in the dark. After 30 min incubation at room
temperature, the absorption at 540 nm was measured by using a UV-Vis spectrophotometer
(UV mini 1240, UV-Vis Spectrophotometer, Shimadzu). At least 3 different blood samples
were used for each experiment.
UV/Vis measurements
UV/Vis spectra were recorded on a CARY 50Bio UV-Visible spectrophotometer (Varian
Inc.). A quartz cuvette was used (1 cm path length) and the spectra were recorded from 200 to
700 nm. Please note that the absorbance measured with this particular instrument is linear up
to at least 4 absorbance units.
Supplementary Material (ESI) for Medicinal Chemistry CommunicationsThis journal is © The Royal Society of Chemistry 2011
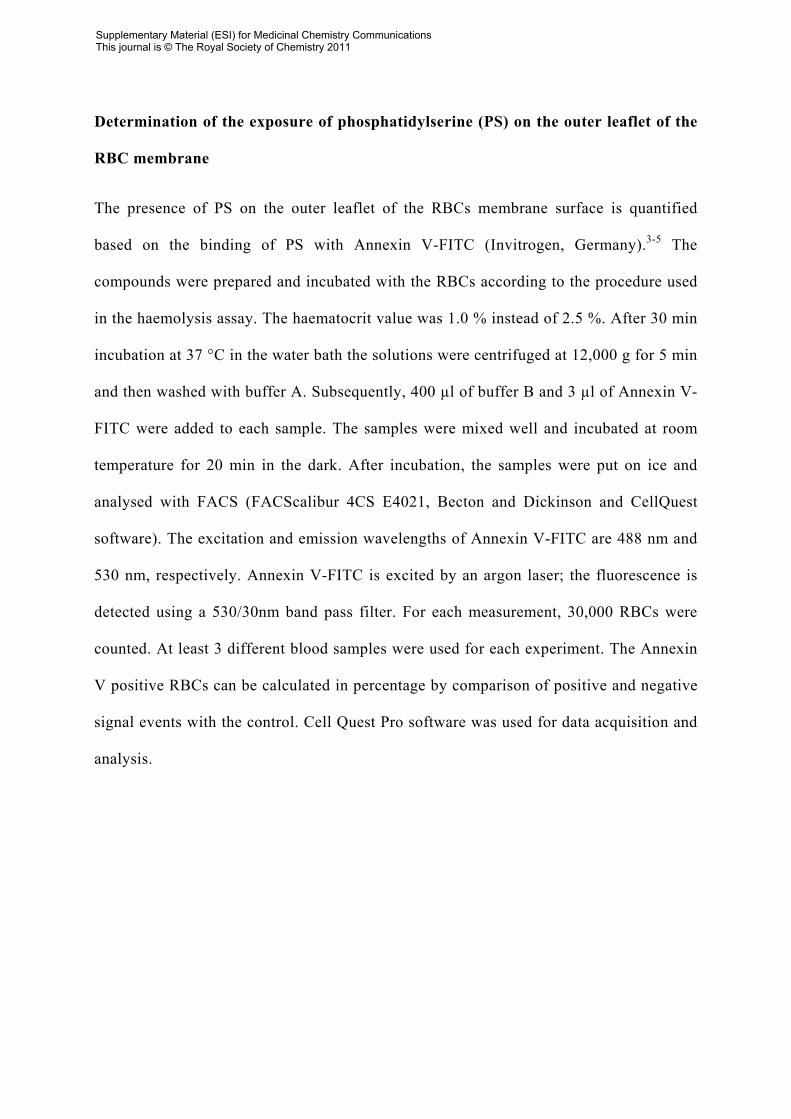
Determination of the exposure of phosphatidylserine (PS) on the outer leaflet of the
RBC membrane
The presence of PS on the outer leaflet of the RBCs membrane surface is quantified
based on the binding of PS with Annexin V-FITC (Invitrogen, Germany).3-5 The
compounds were prepared and incubated with the RBCs according to the procedure used
in the haemolysis assay. The haematocrit value was 1.0 % instead of 2.5 %. After 30 min
incubation at 37 °C in the water bath the solutions were centrifuged at 12,000 g for 5 min
and then washed with buffer A. Subsequently, 400 µl of buffer B and 3 µl of Annexin V-
FITC were added to each sample. The samples were mixed well and incubated at room
temperature for 20 min in the dark. After incubation, the samples were put on ice and
analysed with FACS (FACScalibur 4CS E4021, Becton and Dickinson and CellQuest
software). The excitation and emission wavelengths of Annexin V-FITC are 488 nm and
530 nm, respectively. Annexin V-FITC is excited by an argon laser; the fluorescence is
detected using a 530/30nm band pass filter. For each measurement, 30,000 RBCs were
counted. At least 3 different blood samples were used for each experiment. The Annexin
V positive RBCs can be calculated in percentage by comparison of positive and negative
signal events with the control. Cell Quest Pro software was used for data acquisition and
analysis.
Supplementary Material (ESI) for Medicinal Chemistry CommunicationsThis journal is © The Royal Society of Chemistry 2011
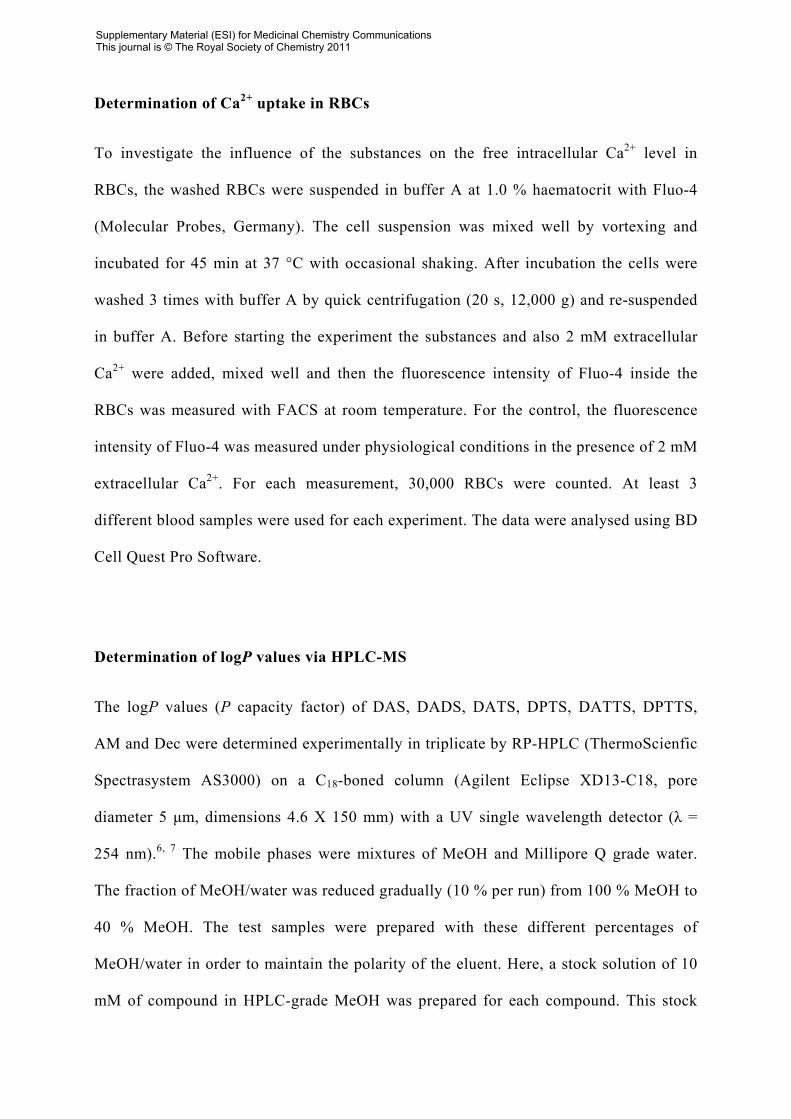
Determination of Ca2+ uptake in RBCs
To investigate the influence of the substances on the free intracellular Ca2+ level in
RBCs, the washed RBCs were suspended in buffer A at 1.0 % haematocrit with Fluo-4
(Molecular Probes, Germany). The cell suspension was mixed well by vortexing and
incubated for 45 min at 37 °C with occasional shaking. After incubation the cells were
washed 3 times with buffer A by quick centrifugation (20 s, 12,000 g) and re-suspended
in buffer A. Before starting the experiment the substances and also 2 mM extracellular
Ca2+ were added, mixed well and then the fluorescence intensity of Fluo-4 inside the
RBCs was measured with FACS at room temperature. For the control, the fluorescence
intensity of Fluo-4 was measured under physiological conditions in the presence of 2 mM
extracellular Ca2+. For each measurement, 30,000 RBCs were counted. At least 3
different blood samples were used for each experiment. The data were analysed using BD
Cell Quest Pro Software.
Determination of logP values via HPLC-MS
The logP values (P capacity factor) of DAS, DADS, DATS, DPTS, DATTS, DPTTS,
AM and Dec were determined experimentally in triplicate by RP-HPLC (ThermoScienfic
Spectrasystem AS3000) on a C18-boned column (Agilent Eclipse XD13-C18, pore
diameter 5 μm, dimensions 4.6 X 150 mm) with a UV single wavelength detector (λ =
254 nm).6, 7 The mobile phases were mixtures of MeOH and Millipore Q grade water.
The fraction of MeOH/water was reduced gradually (10 % per run) from 100 % MeOH to
40 % MeOH. The test samples were prepared with these different percentages of
MeOH/water in order to maintain the polarity of the eluent. Here, a stock solution of 10
mM of compound in HPLC-grade MeOH was prepared for each compound. This stock
Supplementary Material (ESI) for Medicinal Chemistry CommunicationsThis journal is © The Royal Society of Chemistry 2011
solution was used to prepare 1 ml samples of compounds with a final concentration of 1
mM and different MeOH/water percentages. Before each run, the column was washed
with the mobile phase for 5 min. The flow rate was 800 μl/min and the injection volume
was 10 µl.
Calculated logP values:
The theoretical logP values of the various compounds were calculated by using an online
software (ALOGPS 2.1 Program). This online software calculates the expected logP for a
compound by nine different individual software programs and presents the average logP ±
SD.8, 9 In this case, the standard deviation is due to the circumstance that the different
software programs result in slightly different calculated values which are subsequently
averaged.
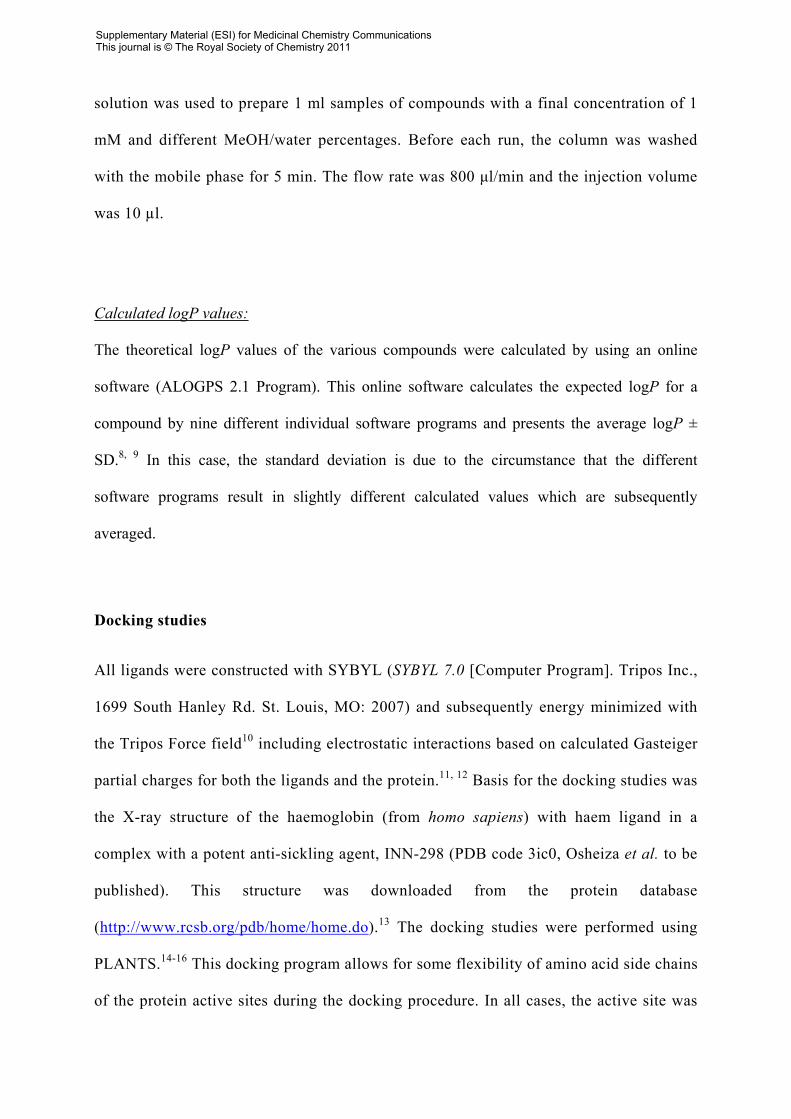
Docking studies
All ligands were constructed with SYBYL (SYBYL 7.0 [Computer Program]. Tripos Inc.,
1699 South Hanley Rd. St. Louis, MO: 2007) and subsequently energy minimized with
the Tripos Force field10 including electrostatic interactions based on calculated Gasteiger
partial charges for both the ligands and the protein.11, 12 Basis for the docking studies was
the X-ray structure of the haemoglobin (from homo sapiens) with haem ligand in a
complex with a potent anti-sickling agent, INN-298 (PDB code 3ic0, Osheiza et al. to be
published). This structure was downloaded from the protein database
(http://www.rcsb.org/pdb/home/home.do).13 The docking studies were performed using
PLANTS.14-16 This docking program allows for some flexibility of amino acid side chains
of the protein active sites during the docking procedure. In all cases, the active site was
Supplementary Material (ESI) for Medicinal Chemistry CommunicationsThis journal is © The Royal Society of Chemistry 2011
defined by a radius of 15Å from the co-crystallized iron atom. The side chains of Leu28,
His63, Val67, Phe71, Leu31, Phe42, Phe45, and Leu106 were considered to be flexible.
From the resulting docking arrangements, the most favored ones were refined by energy
minimization using MOE (Molecular Operating Environment, Chemical Computing
Group Inc., Montreal, Canada: 2009) and subsequent prediction of the pKi-value
available in the ligX-module of MOE was carried out.
Construction of compounds
All compounds were constructed using Maestro 8.0.314, the molecular graphics surface
of the Schroedinger software package (Schroedinger, LLC, 120 West 45th Street, New
York, NY 10036). Subsequently, all structures were energy optimized with JAGUAR 6.0
(Jaguar 6.0. 2007. Schroedinger, LLC, 120 West 45th Street, New York, NY 10036)
using DFT17, 18 with B3LYP functionals19-22 and HF 6-31G**+ basis sets either for closed
shell systems with restricted (RODFT) or for the radicals with spin-unrestricted (UDFT)
calculations allowing a maximum of 2,000 geometry optimizations until the energy
change is not larger than 5.0 e-5 Hartree.
Supplementary Material (ESI) for Medicinal Chemistry CommunicationsThis journal is © The Royal Society of Chemistry 2011
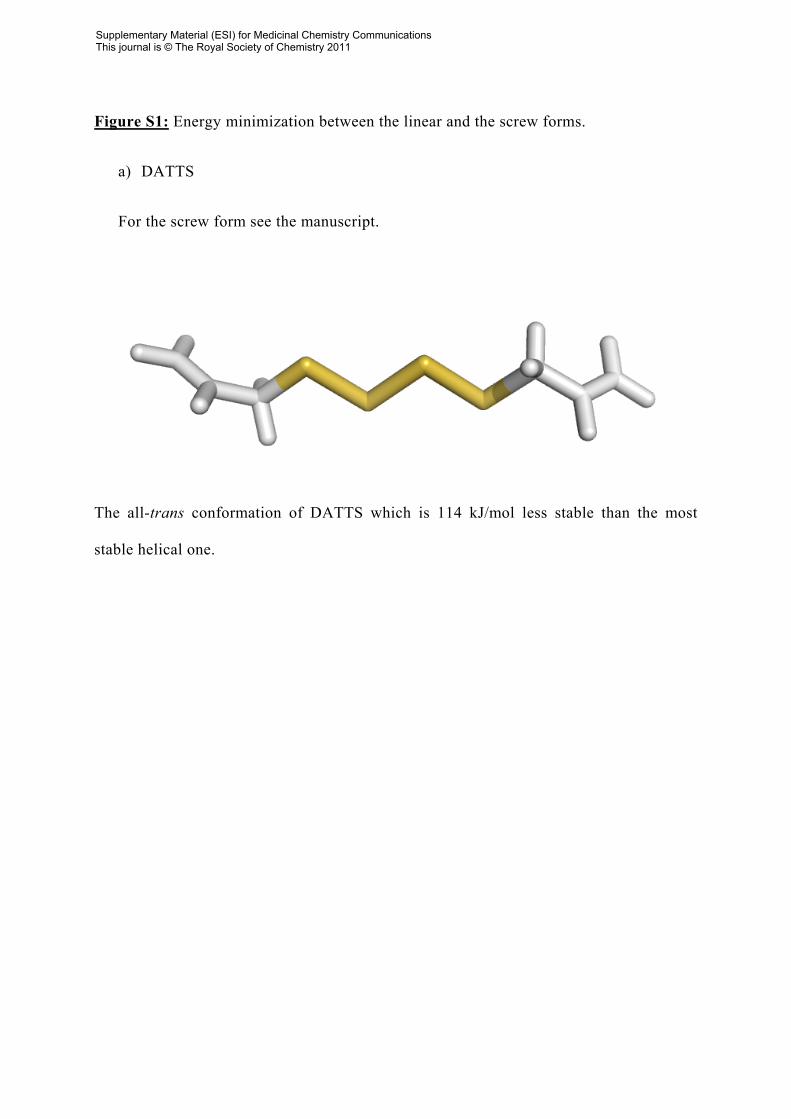
Figure S1: Energy minimization between the linear and the screw forms.
a) DATTS
For the screw form see the manuscript.
The all-trans conformation of DATTS which is 114 kJ/mol less stable than the most
stable helical one.
Supplementary Material (ESI) for Medicinal Chemistry CommunicationsThis journal is © The Royal Society of Chemistry 2011
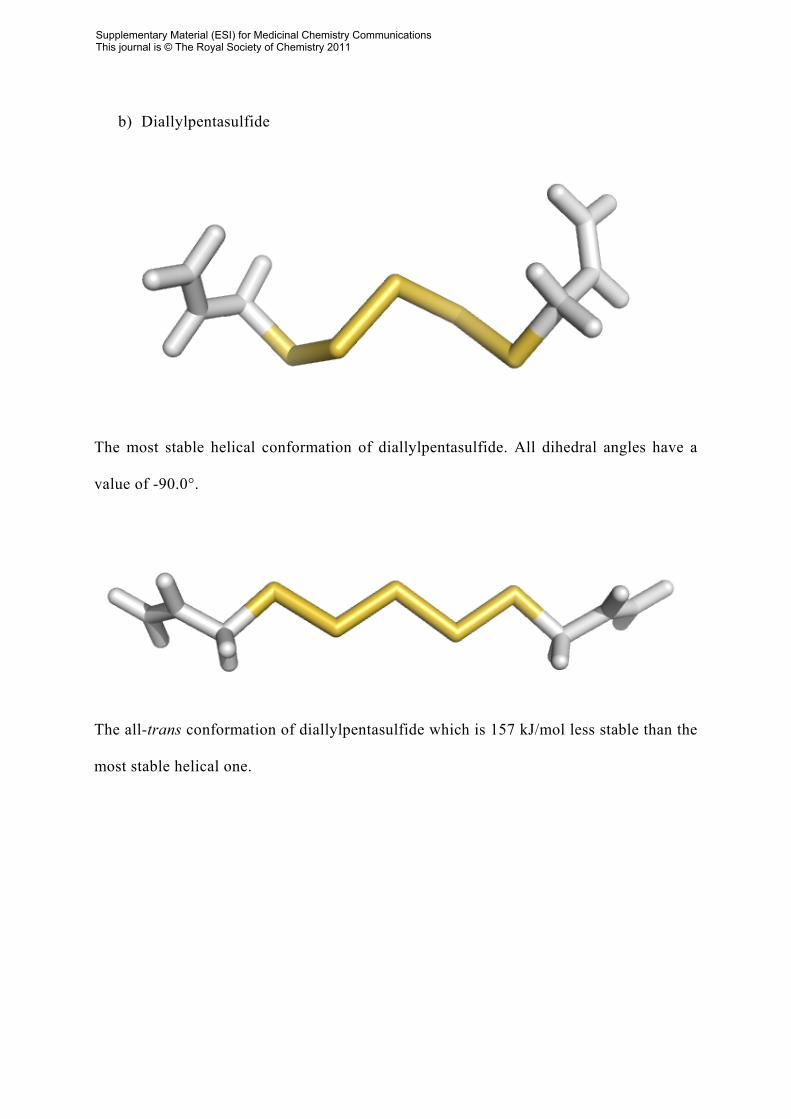
b) Diallylpentasulfide
The most stable helical conformation of diallylpentasulfide. All dihedral angles have a
value of -90.0°.
The all-trans conformation of diallylpentasulfide which is 157 kJ/mol less stable than the
most stable helical one.
Supplementary Material (ESI) for Medicinal Chemistry CommunicationsThis journal is © The Royal Society of Chemistry 2011
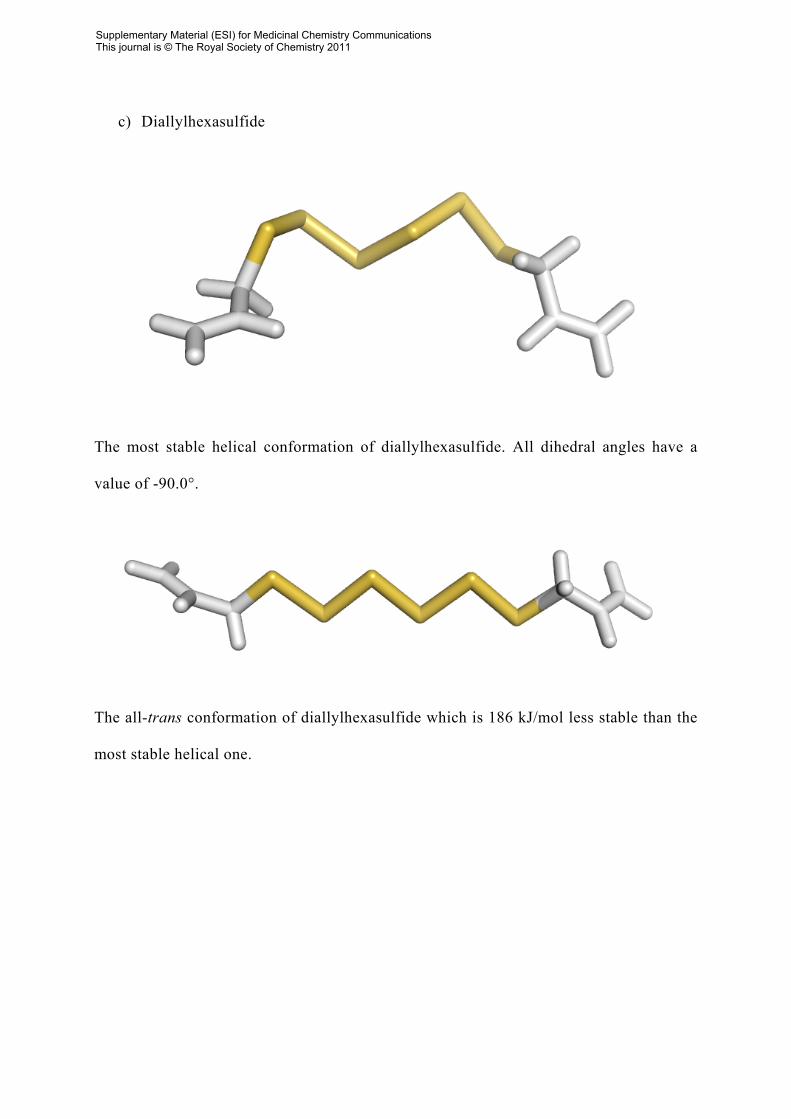
c) Diallylhexasulfide
The most stable helical conformation of diallylhexasulfide. All dihedral angles have a
value of -90.0°.
The all-trans conformation of diallylhexasulfide which is 186 kJ/mol less stable than the
most stable helical one.
Supplementary Material (ESI) for Medicinal Chemistry CommunicationsThis journal is © The Royal Society of Chemistry 2011
References:
1 B. Milligan, B. Saville and J. M. Swan, J. Chem. Soc., 1961, 4850-4853.
2 G. Derbesy and D. N. Harpp, Tetrahedron Lett., 1994, 35, 5381-5384.
3 J. Dachary-Prigent, J. M. Freyssinet, J. M. Pasquet, J. C. Carron and A. T.
Nurden, Blood, 1993, 81, 2554-2565.
4 G. Koopman, C. P. Reutelingsperger, G. A. Kuijten, R. M. Keehnen, S. T. Pals
and M. H. van Oers, Blood, 1994, 84, 1415-1420.
5 F. A. Kuypers, R. A. Lewis, M. Hua, M. A. Schott, D. Discher, J. D. Ernst and B.
H. Lubin, Blood, 1996, 87, 1179-1187.
6 C. Yamagami and N. Takao, Chem. Pharm. Bull., 1992, 40, 925-929.
7 C. Yamagami and N. Takao, Chem. Pharm. Bull., 1993, 41, 694-698.
8 I. V. Tetko, J. Gasteiger, R. Todeschini, A. Mauri, D. Livingstone, P. Ertl, V.
Palyulin, E. Radchenko, N. S. Zefirov, A. S. Makarenko, V. Y. Tanchuk and V. V.
Prokopenko, J. Comput.-Aided Mol. Des., 2005, 19, 453-463.
9 J. J. Irwin and B. K. Shoichet, J. Chem. Inf. Model, 2005, 45, 177-182.
10 M. Clark, R. D. Cramer and N. Vanopdenbosch, J. Comp. Chem., 1989, 10, 982-
1012.
11 J. Gasteiger and M. Marsili, Tetrahedron Lett., 1978, 3181-3184.
12 J. Gasteiger and M. Marsili, Tetrahedron, 1980, 36, 3219-3228.
13 H. M. Berman, J. Westbrook, Z. Feng, G. Gilliland, T. N. Bhat, H. Weissig, I. N.
Shindyalov and P. E. Bourne, Nucleic Acids Res., 2000, 28, 235-242.
14 O. Korb, T. Stutzle and T. E. Exner, in Ant Colony Optimization and Swarm
Intelligence, Proceedings, eds. M. Dorigo, L. M. Gambardella, M. Birattari, A.
Martinoli and T. Stutzle, Springer-Verlag Berlin, Germany 2006, pp. 247-258.
15 O. Korb, T. Stutzle and T. E. Exner, J. Chem. Inf. Model, 2009, 49, 84-96.
Supplementary Material (ESI) for Medicinal Chemistry CommunicationsThis journal is © The Royal Society of Chemistry 2011
16 O. Korb, in 4th German Conference on Chemoinformatics ed. F. Oellien, Chem
Cent J, Goslar, Germany, 2008, p. O10.
17 P. Hohenberg and W. Kohn, Phys. Rev. B, 1964, 136, 864-871.
18 W. Kohn and L. J. Sham, Phys. Rev. A, 1965, 140, 1133-1138.
19 A. D. Becke, J. Chem. Phys., 1993, 98, 5648-5652.
20 A. D. Becke, J. Chem. Phys., 1993, 98, 1372-1377.
21 A. D. Becke, J. Chem. Phys., 1992, 96, 2155-2160.
22 P. J. Stephens, F. J. Devlin, C. F. Chabalowski and M. J. Frisch, J. Phys. Chem.,
1994, 98, 11623-11627.
Supplementary Material (ESI) for Medicinal Chemistry CommunicationsThis journal is © The Royal Society of Chemistry 2011