Embed Size (px)
Citation preview
1
Interactions of Organics within Hydrated Selective Layer of Reverse 1
Osmosis Desalination Membrane: a Combined Experimental and 2
Computational Study 3
Aziz Ghoufi1, Emil Dražević 2,3*, and Anthony Szymczyk4* 4
1Université de Rennes 1, Institut de Physique de Rennes (UMR CNRS 6251), 263 Avenue du 5
Général Leclerc, CS 74205, 35042 Rennes, France 6
2Faculty of Chemical Engineering and Technology, Department of Physical Chemistry, 7
Marulicev trg 19, 10000 Zagreb, Croatia 8
3 Aarhus University, Department of Engineering, Hangøvej 2, 8200 Aarhus, Denmark 9
4Université de Rennes 1, Institut des Sciences Chimiques de Rennes (UMR CNRS 6226), 263 10
Avenue du Général Leclerc, CS 74205, 35042 Rennes, France 11
12
*corresponding authors 13
e-mail: [email protected] ; [email protected] 14
15
Abstract 16
In this work we have examined a computational approach in predicting the interactions between 17
uncharged organic solutes and polyamide membranes. We used three model organic molecules 18
with identical molecular weights (100.1 g/mol), 4-aminopiperidine, 3,3-dimethyl-2-butanone 19
(pinacolone) and methylisobutyl ketone for which we obtained experimental data on 20
partitioning, diffusion and separation on a typical seawater reverse osmosis (RO) membrane. 21
2
The interaction energy between the solutes and the membrane phase (fully aromatic polyamide) 22
was computed from molecular dynamics (MD) simulations and the resulting sequence was 23
found to correlate well with the experimental rejections and sorption data. Sorption of the 24
different organic solutes within the membrane skin layer determined from attenuated total 25
reflection Fourier transform infrared spectroscopy (ATR-FTIR) nicely agreed with interaction 26
energies computed from molecular simulations. Qualitative information about solute diffusivity 27
inside the membrane was also extracted from MD simulations while ATR-FTIR experiments 28
indicated strongly hindered diffusion with diffusion coefficients in the membrane about 10-15 29
m2/s. The computational approach presented here could be a first step toward predicting 30
rejections trends of e.g. hormones and pharmaceuticals by RO dense membranes. 31
32
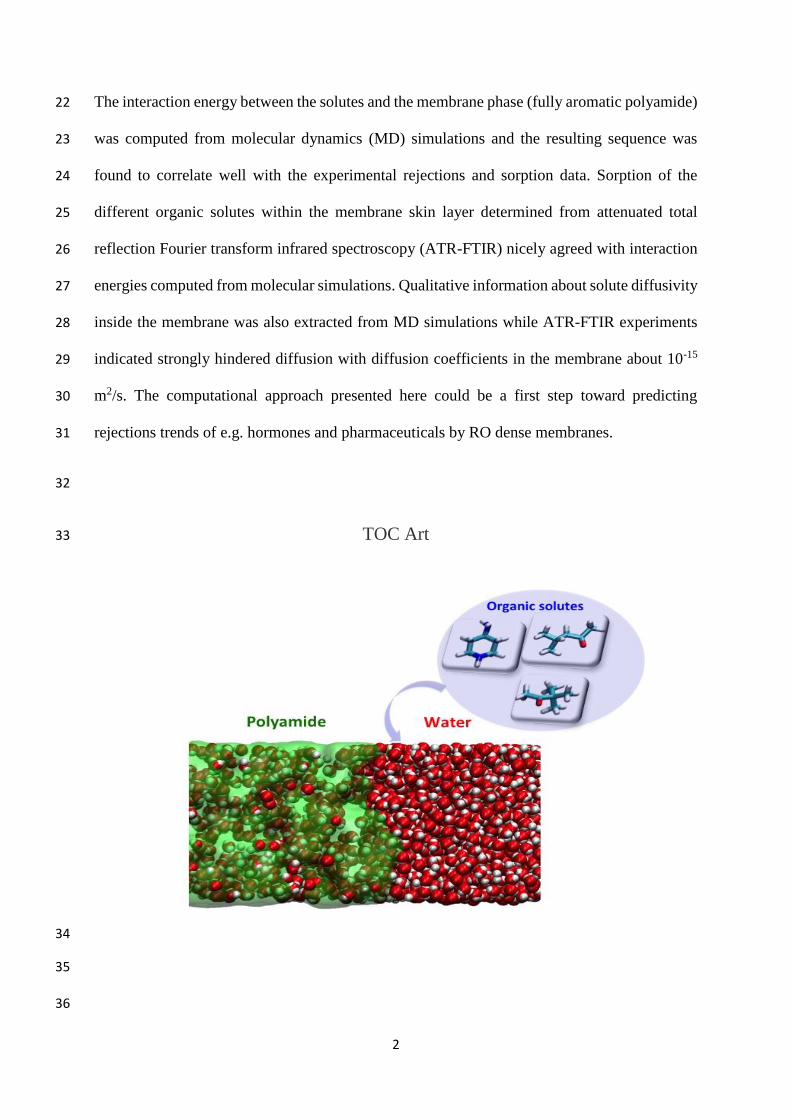
TOC Art 33
34
35
36
3
37
38
39
40
1. Introduction 41
Reverse osmosis (RO) is a well-established membrane process that is usually used to separate 42
dissolved salts and small organic molecules. Its applications range from the production of 43
ultrapure water for semiconductor and pharmaceutical use to seawater desalination for drinking 44
water production and the purification of industrial wastewater.1 45
Nowadays, the RO and nanofiltration (NF) membrane market is dominated by thin-film-46
composite polyamide membranes containing three layers: a polyester web serving as the 47
structural support (100-200 m thick), a mesoporous polysulfone film acting as the supporting 48
mid-layer (about 30-50 m thick), and a selective ultra-thin skin layer on the upper surface (20-49
300 nm thick). This latter is generally fabricated through interfacial polymerization of meta-50
phenylene diamine (MPD) and trimesoyl chloride (TMC) at the interface of two immiscible 51
solvents.2 These two monomers can react to form linear chains as well as undergo two 52
additional side reactions where the third acyl chloride group can either undergo hydrolysis to 53
form carboxylic acid or react with another diamine molecule to produce cross-linking.3 54
Despite the technological success and importance of both RO and NF, the molecular 55
mechanisms of water and solute transport through RO/NF membranes are not completely 56
understood.4-6 State of the art is that the rejection of organics is governed by steric, electrostatic 57
(Donnan) and other interaction mechanisms. When organic solute is dissolved at a pH lower 58
than the pKa value of its most acidic group, or at a pH higher than the pKb of its most basic 59
group, it is considered uncharged and thereby the Donnan exclusion mechanism does not apply. 60
4
This was well documented in the literature.6,7-9 Things can be further complicated since solute 61
is excepted to have different pKa and pKb values in bulk water and in the membrane phase (due 62
to extreme confinement). Such behavior was documented in the literature where it was found 63
that carboxylic groups groups in a PA membrane have two pKa values, which was related to 64
two different types of voids, and thus environments10, so significant variations can be expected, 65
depending on the membrane structure. Although the steric exclusion is the dominating 66
mechanism for an uncharged organic, specific solute-membrane interactions allow can affect 67
adsorption, and thus partitioning and diffusion through the active layer of the RO/NF 68
membranes, which affects rejection.11-14 This was further explored during the recent years and 69
it has been shown that significant amounts of hormones and phenolic compounds adsorb 70
strongly in and on the selective layer of NF polyamide based membranes.15,16 Moreover, 71
Verliefde et al. showed that by including the solute-membrane interactions in a very simple 72
pore flow model one can estimate the rejection of uncharged organics with NF membranes 73
reasonably well.17 Several other studies showed that rejection of uncharged organic solutes by 74
RO membranes cannot be described by a simple sieving effect ruled by the relative size of the 75
solutes and the free volumes within the membrane active layer.18-20 These works also 76
highlighted the crucial role of physicochemical interactions between organic solutes and the 77
membrane material. However, understanding solute / membrane interactions is extremely 78
challenging from an experimental point of view because RO membranes are essentially thin-79
film composite materials, where the skin layer does not represent more than ~ 0.1 % of the total 80
membrane thickness. One of the pathways to understand the fundamentals that lay behind 81
solute-membrane interactions is to pair state of the art experimental and theoretical approaches. 82
Electrochemical impedance spectroscopy (EIS) has proved to be an attractive technique to 83
investigate both solute partitioning and diffusion in membrane skin layers.18 However, the EIS-84
based method is restricted to electroactive solutes. Another method based on attenuated total 85
5
reflection Fourier transform infrared spectroscopy (ATR-FTIR) was proposed to determine 86
partitioning inside thin films.21 Fieldson and Barbari showed that ATR-FTIR could also be used 87
to gain insight into solute diffusion inside polymer films.22 Their method was recently applied 88
by Dražević et al. who reported the first measurements of organic solute diffusion inside the 89
skin layer of a RO membrane.19 It should be stressed that both methods, EIS and ATR-FTIR, 90
have to be applied to the free-standing membrane skin layer. This requires separating this latter 91
from the rest of the membrane, which can be done by selective dissolution of membrane 92
sublayers.23 93
We have therefore used ATR-FTIR spectroscopy and molecular dynamics (MD) simulations to 94
estimate diffusion, partitioning an interaction energies of three model organic solutes (4-95
aminopiperidine, 3,3-dimethyl-2-butanone (pinacolone) and methylisobutyl ketone), with 96
identical molar mass (100.1 g/mol). The interaction energy between model organics and the 97
hydrated polyamide polyamide layer was computed from MD and compared to partitioning 98
coefficients obtained experimentally from ATR-FTIR spectroscopy. 99
100
2. Computational Details 101
The organic solutes (see chemical structures in Figure 1) and the polyamide (PA) membrane 102
skin layer were modeled by means of the AMBER force field.24 Structural information of the 103
PA membrane skin layer can be found elsewhere.25,26 A cutoff radius of 12 Å was set for both 104
electrostatic and van der Waals interactions. The electrostatic contribution was computed by 105
using the Ewald sum method with a convergence parameter of 0.24 Å-1 while the van der Waals 106
interactions were modeled by means of the Lennard-Jones (LJs) potential. Crossed LJs 107
interactions between atoms of PA and those of organic solutes were evaluated from the Lorentz-108
Berthelot mixing rule. Water molecules were described by the TIP4P/2005 model.27 109

6
110
Figure 1. Chemical structures of the organic solutes considered in this work. Carbon, hydrogen, 111
nitrogen and oxygen atoms are shown in light blue, white, navy blue and red, respectively. 112
113
In order to reproduce the hydration process of the PA membrane two reservoirs containing 4600 114
water molecules and 20 solute molecules were added on each side of the dry membrane (see 115
Figure S1 in the supporting information). In the initial configuration organic solutes were 116
inserted close to the membrane surface in order to decrease the computational time. Two 117
graphene walls were also added on each side of the simulation box. After an equilibration in 118
the canonical ensemble (NVT where N is the number of particles, V the volume and T the 119
temperature) at 300 K (see SI for details), non-equilibrium molecular dynamics (NEMD) 120
simulations were performed by applying an external force on each atom of the graphene walls 121
(thus acting as pistons forcing water molecules and organic solutes to enter the PA membrane) 122
so that the external pressure acting on the system was equal to 1 bar. Once a stationary regime 123
was reached, i.e. when the water content inside the membrane became constant (see Results 124
and Discussion section), the force applied on the graphene walls was shut down and equilibrium 125
MD simulations were performed in the NPnT statistical ensemble28 (5 ns of equilibration 126
followed by an acquisition phase of 10 ns). Temperature (T) and normal pressure (Pn) were kept 127
constant and equal to 300 K and 1 bar, respectively, by means of the Nose-Hoover algorithm29 128
with relaxation times of 0.1 and 0.5 ps for the thermostat and the anisotropic barostat, 129
respectively. 130

7
Additional equilibrium MD simulations of the different organic solutes in bulk water (1000 131
water molecules and 5 solute molecules) were carried out for comparison with results obtained 132
inside the membrane. 133
Both equilibrium and non-equilibrium MD simulations were carried out with DL_POLY 134
software.30 Integration of the equations of motion was performed by means of the velocity 135
Verlet algorithm31 with a time step of 1 fs. 136
Mean Square Displacement (MSD) was computed by using the following correlation equation: 137
𝑀𝑆𝐷(𝑡) = ⟨1
𝑁∑ (𝒓𝑖(𝑡) − 𝒓𝑖(0))
2𝑁𝑖=1 ⟩ (1) 138
where denotes the position of a particle i at time t and N the number of particles. 139
140
3. Experimental 141
Membrane and chemicals 142
Desalination membrane SWC4+ (Hydranautics/Nitto Denko, Oceanside, CA, USA) was used 143
in this work as a representative RO membrane with the chemistry of fully aromatic polyamide 144
(PA). Methylisobutyl ketone (Fluka, puriss. ACS; p.a. >99% (GC)), pinacolone (Aldrich, 98%) 145
and 4 aminopiperidine (Tokyo Chemical Industry Co. LTD, > 95 %) were used without further 146
purification. It should be noted that all these three compounds have identical molar mass (100.1 147
g/mol). 148
149
)(i tr

8
Equilibrium partitioning and diffusion measurements 150
Solutions were prepared in the range of concentrations 0.1 – 0.5 mol/L, depending on the 151
solubility of a particular solute in water. Stacks of five SWC4+ skin layers were isolated on the 152
ATR crystal using the same procedure that was described elsewhere.32 Thickness of individual 153
SWC4+ layers along with stacks of layers in dry and wet state may be found elsewhere.19 154
Equations and the numerical procedure for estimating the molar extinction coefficients were 155
described in details elsewhere.21,22 Main equations along with some experimental data can be 156
found in the SI. Experimentally obtained molar extinction coefficients are presented in Table 157
1. 158
159
Table 1. Molar exctinction coefficients, obtained using FTIR on bare diamond, T=21°C. 160
Solute ε/m2mol-1
4 aminopiperidine 19.8
Pinacolone 94.8
Methylisobutyl ketone 112
161
162
All infrared spectra were recorded at a rate of 1.64 second per spectrum at a resolution of 2 163
cm−1 in the range 400 - 4000 cm−1 using a Bruker Vertex 70 series FTIR spectrometer equipped 164
with a Bruker Platinum ATR accessory with a single reflection diamond crystal (nd=2.4). 165
Temperature in the room was held constant at 21°C, with the use of air conditioning device. 166
A stainless steel liquid cell (PikeTech ATR Flow-Through Attachment) was mounted on top of 167
the crystal to enclose the polyamide films, and diffusion measurements were performed using 168
the following procedure; 169
9
1) Deionized water was injected into the liquid cell using a stainless steel syringe, 170
2) A sequence of spectra was recorded until no change was observed to verify the PA film 171
was equilibrated with water, 172
3) After equilibrium with water was reached, the spectrum of PA film in water was 173
recorded as the background for subsequently recorded spectra, 174
4) A solution of a particular organic solute was injected and a sequence of spectra over 175
time was recorded to monitor the change of the appropriate solute band. 176
All measurements were repeated at least three times for each solute, each time with a freshly 177
prepared stack of PA layers. Equilibrium absorbance and diffusion coefficient were estimated 178
by fitting Equation S7 given in the supporting information. 179
180
Rejection experiments 181
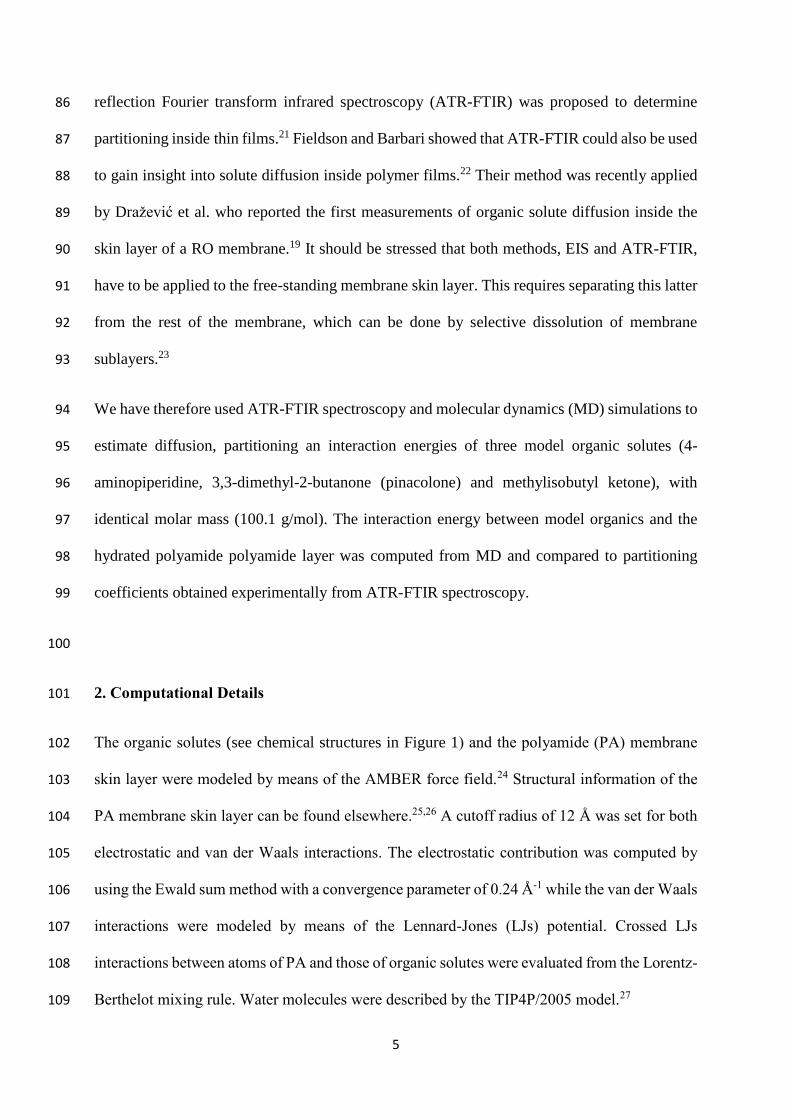
The RO setup used in this study is depicted in Fig. 2 and described in details elsewhere.32 182
Briefly, SWC4+ membrane was initially soaked in a 1:1 water:ethanol solution, rinsed with 183
deionized water and then placed in the reverse osmosis cell. The membrane was further 184
pressurized with Milli-Q water at 40 bar for two hours. Milli-Q water was drained from the 185
system and five liters of 2.5 mmol/L solutions were circulated through the system for 8 hours 186
in order to saturate the membrane with a given solute before the rejection measurements. 187
Measurements were performed at a constant temperature of 21.0 ± 0.1 °C. RO measurements 188
were performed at transmembrane pressure differences of 11, 13, 15 and 17 bar. Concentrations 189
in feed (Cf) and permeate (Cp) were measured using Shimadzu TOC-VWS Carbon Analyzer. 190
10
Permeate flux was determined by weighing the permeate as a function of time. Rejection (R) of 191
each solute was calculated using: 192
1p
f
CR
C
(2) 193
194
Figure 2. RO setup used in this study. Symbols M stand for manometer and F for flowmeter. 195 Feed was circulated at constant flow rate in closed loop system at constant temperature and 196
different pressures. 197 198
199
4. Results and discussion 200
Figure 3 shows the experimental solute rejections by the SWC4+ membrane as a function of 201
the permeate flux. All the three organics were found to be strongly rejected by the membrane 202
(R > 0.95) with the sequence 4 aminopiperidine (4AP) > pinacolone (PI) > methylisobutyl 203
ketone (MIBK). The phenomena that control the separation performance of RO membranes 204
occur inside subnanometric free volumes between the polymer chains.3,33 Molecular 205
simulations were then carried out to rationalize these phenomena. An all-atom model of a PA 206
membrane that has been shown to be fairly representative of actual RO membranes25,26,34 was 207
used in this work. As mentioned in section 2, the dry PA membrane was connected with two 208
reservoirs containing water and organic solute molecules, and was further hydrated by running 209
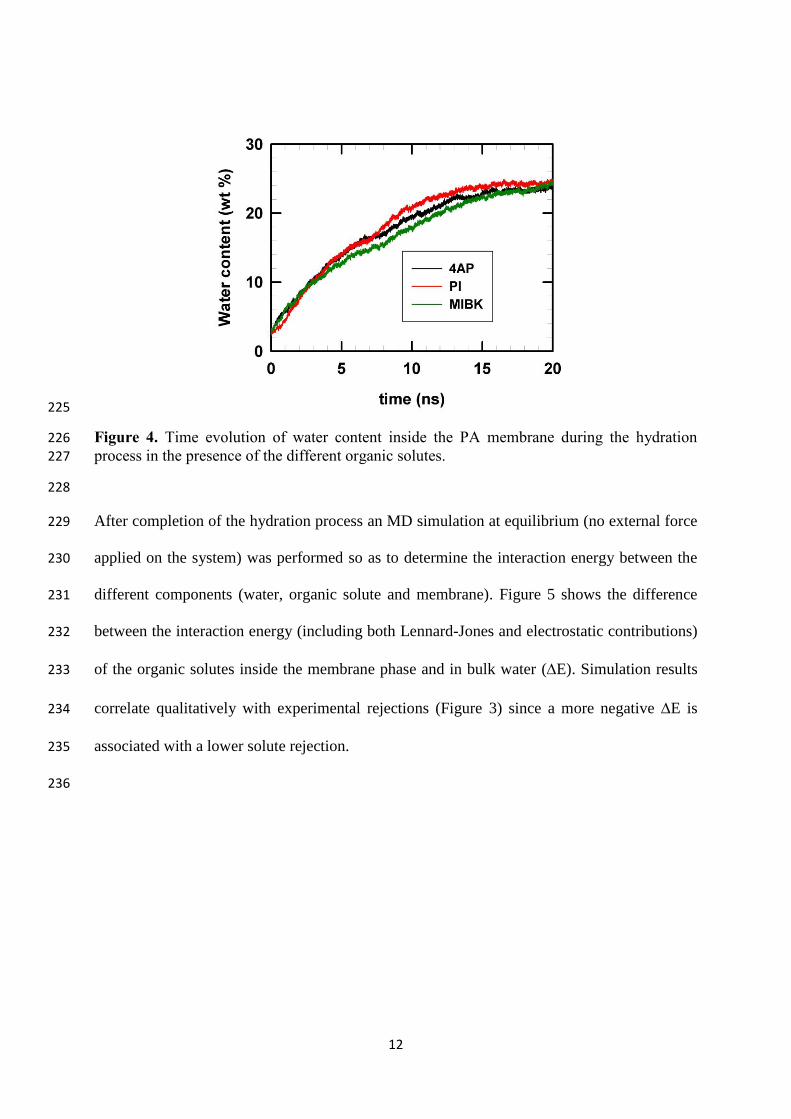
a non-equilibrium MD simulation. The time evolution of the membrane water content is shown 210

11
in Figure 4. Since there was no perfectly defined membrane/water interface water molecules 211
were considered to be inside the membrane when located where the PA density was found 212
almost constant, i.e. for z between – 42 and + 42 Å (see Fig. S2 in the SI). The number of water 213
molecules entering the membrane increased rapidly before levelling off, leading to water 214
content close to 24 wt% independently of the organic solute added to water. This relatively high 215
water uptake is in good agreement with experimental results3,35 and has been shown to result 216
from favorable interactions between PA and water molecules that compensate the energetic 217
penalty associated with the loss of hydrogen bonds formed between water molecules inside the 218
PA membrane.26 219
220
3 4 5 6 70.95
0.96
0.97
0.98
0.99
1.00 MIBK
PI
4AP
R
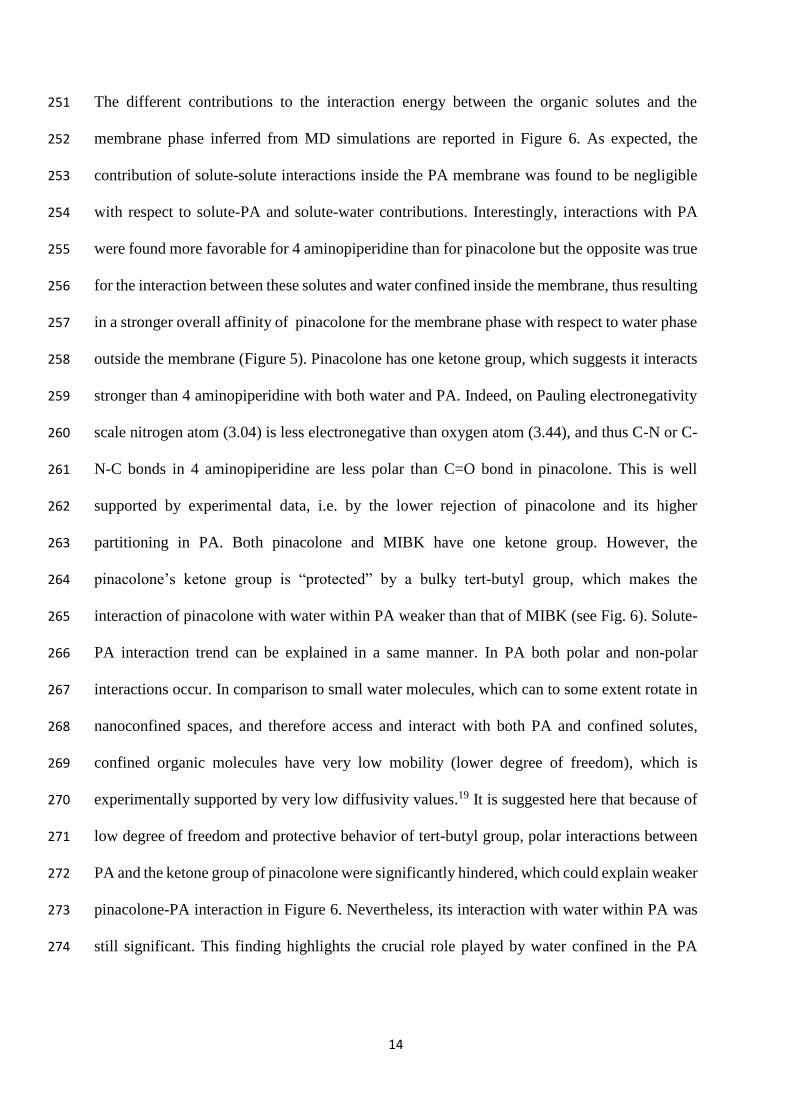
Jv / m s
-1
221
Figure 3. Experimental rejection of organic solutes by SWC4+ membrane as a function of the 222 permeate volume flux. 223 224
12
225
Figure 4. Time evolution of water content inside the PA membrane during the hydration 226
process in the presence of the different organic solutes. 227
228
After completion of the hydration process an MD simulation at equilibrium (no external force 229
applied on the system) was performed so as to determine the interaction energy between the 230
different components (water, organic solute and membrane). Figure 5 shows the difference 231
between the interaction energy (including both Lennard-Jones and electrostatic contributions) 232
of the organic solutes inside the membrane phase and in bulk water (E). Simulation results 233
correlate qualitatively with experimental rejections (Figure 3) since a more negative E is 234
associated with a lower solute rejection. 235
236

13
237
Figure 5. Difference between the interaction energy of the organic solutes and the membrane 238
phase and the interaction energy of the organic solutes and bulk water. 239
240
241
The sequence of relative solute affinity for the PA membrane phase was also corroborated by 242
ATR-FTIR spectroscopy performed with stacks of isolated skin layers of SWC4+ membrane. 243
Indeed, as shown in Table 2 the lowest and highest partitioning coefficients (defined as the ratio 244
between the solute concentration in the PA film and that in the external solution) were obtained 245
with 4 aminopiperidine (4AP) and methylisobutyl ketone (MIBK), respectively. 246
247
Table 2. Partition coefficients (K) of the organic solutes estimated from FTIR spectroscopy. 248
Solute 4AP PI MIBK
K(exp. 1) 0.69 0.52 1.38
K(exp. 2) 0.52 0.58 3.16
K(exp. 3) 0.56 0.83 3.51
K(exp. 4) 0.47 0.85 2.72
K(exp. 5) 0.47 0.59 2.75
K (Avg.) 0.54 0.67 2.70
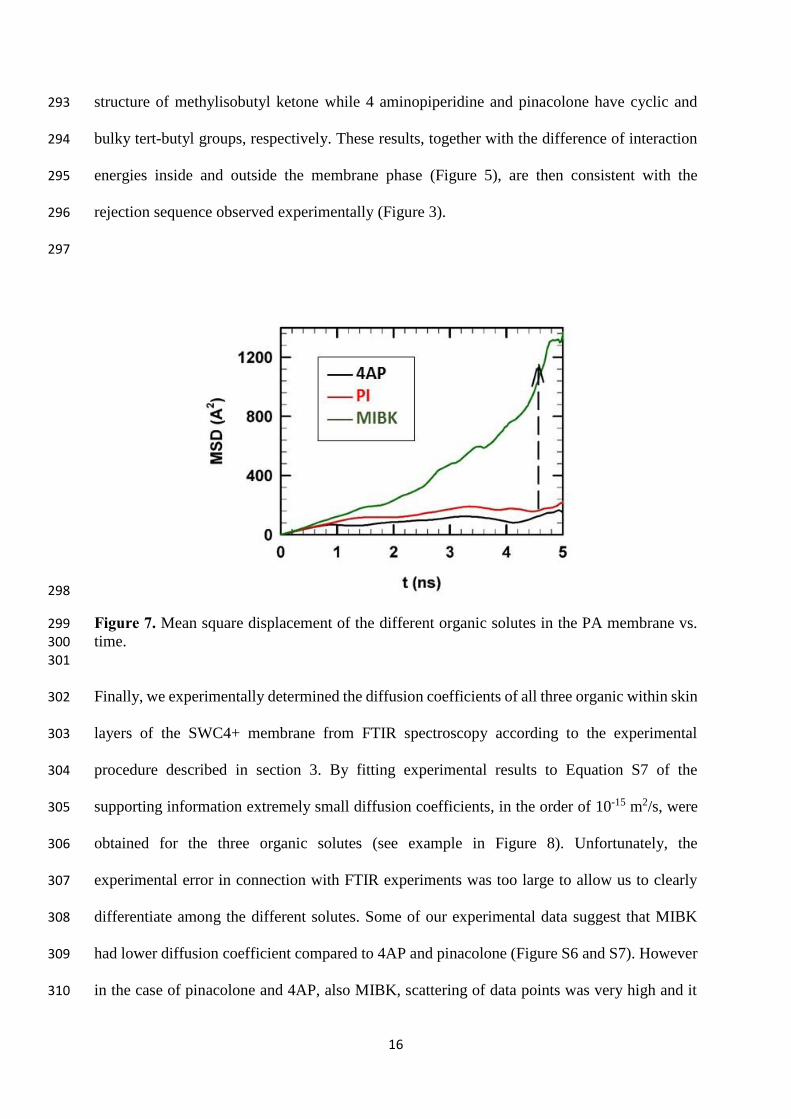
Std. dev. 0.09 0.15 0.81
249
250
14
The different contributions to the interaction energy between the organic solutes and the 251
membrane phase inferred from MD simulations are reported in Figure 6. As expected, the 252
contribution of solute-solute interactions inside the PA membrane was found to be negligible 253
with respect to solute-PA and solute-water contributions. Interestingly, interactions with PA 254
were found more favorable for 4 aminopiperidine than for pinacolone but the opposite was true 255
for the interaction between these solutes and water confined inside the membrane, thus resulting 256
in a stronger overall affinity of pinacolone for the membrane phase with respect to water phase 257
outside the membrane (Figure 5). Pinacolone has one ketone group, which suggests it interacts 258
stronger than 4 aminopiperidine with both water and PA. Indeed, on Pauling electronegativity 259
scale nitrogen atom (3.04) is less electronegative than oxygen atom (3.44), and thus C-N or C-260
N-C bonds in 4 aminopiperidine are less polar than C=O bond in pinacolone. This is well 261
supported by experimental data, i.e. by the lower rejection of pinacolone and its higher 262
partitioning in PA. Both pinacolone and MIBK have one ketone group. However, the 263
pinacolone’s ketone group is “protected” by a bulky tert-butyl group, which makes the 264
interaction of pinacolone with water within PA weaker than that of MIBK (see Fig. 6). Solute-265
PA interaction trend can be explained in a same manner. In PA both polar and non-polar 266
interactions occur. In comparison to small water molecules, which can to some extent rotate in 267
nanoconfined spaces, and therefore access and interact with both PA and confined solutes, 268
confined organic molecules have very low mobility (lower degree of freedom), which is 269
experimentally supported by very low diffusivity values.19 It is suggested here that because of 270
low degree of freedom and protective behavior of tert-butyl group, polar interactions between 271
PA and the ketone group of pinacolone were significantly hindered, which could explain weaker 272
pinacolone-PA interaction in Figure 6. Nevertheless, its interaction with water within PA was 273
still significant. This finding highlights the crucial role played by water confined in the PA 274

15
matrix and thus the importance of water uptake in the performance of reverse osmosis 275
membranes. 276
277
278
Figure 6. Different contributions to the solute interaction energy in the membrane phase. 279 280
In this last part we focused on solute diffusion through the PA membrane since it is commonly 281
accepted that a solution/diffusion mechanism rules transport through RO membranes36 and 282
then, determining the interaction energies and equilibrium partitioning coefficients might not 283
be enough to fully explain experimental rejections shown in Figure 3. Self-diffusion 284
coefficients can be inferred from equilibrium MD simulations by means of the particle mean 285
square displacement (MSD) and the Einstein relation provided that the MSD varies linearly 286
with time.37 287
Figure 7 shows the time evolution of MSD for the three organic solutes in the PA membrane. 288
Non-linear variations were observed for all solutes. It was then impossible to extract the solute 289
self-diffusion coefficients inside the membrane from MSDs. However, the variation of MSD 290
with time strongly indicates a faster diffusion of methylisobutyl ketone inside the membrane 291
compared with both 4 aminopiperidine and pinacolone. This may be related with the more linear 292
16
structure of methylisobutyl ketone while 4 aminopiperidine and pinacolone have cyclic and 293
bulky tert-butyl groups, respectively. These results, together with the difference of interaction 294
energies inside and outside the membrane phase (Figure 5), are then consistent with the 295
rejection sequence observed experimentally (Figure 3). 296
297
298
Figure 7. Mean square displacement of the different organic solutes in the PA membrane vs. 299
time. 300 301
Finally, we experimentally determined the diffusion coefficients of all three organic within skin 302
layers of the SWC4+ membrane from FTIR spectroscopy according to the experimental 303
procedure described in section 3. By fitting experimental results to Equation S7 of the 304
supporting information extremely small diffusion coefficients, in the order of 10-15 m2/s, were 305
obtained for the three organic solutes (see example in Figure 8). Unfortunately, the 306
experimental error in connection with FTIR experiments was too large to allow us to clearly 307
differentiate among the different solutes. Some of our experimental data suggest that MIBK 308
had lower diffusion coefficient compared to 4AP and pinacolone (Figure S6 and S7). However 309
in the case of pinacolone and 4AP, also MIBK, scattering of data points was very high and it 310

17
significantly affected the reproducibility of the diffusion tests. High scattering was related to 311
very low partition coefficients, since because of low partitioning the IR signal in PA became 312
much lower than that in pure water. Scattering was also related to the fact that only one scan 313
had been taken every 1.64 seconds, and it is excepted that reproducibility would have been 314
much higher if FTIR setup was able to make 10 scans every 1 second. For this reason we are 315
only confident to say diffusion coefficients are around 10-15 m2s-1, however it is impossible to 316
resolve whether diffusion of MIBK was indeed lower than that of 4AP and pinacolone neither 317
that 4AP nor pinacolone diffused slower than MIBK. 318
319
Figure 8. An example showing typical ATR-FTIR data used to extract diffusion coefficient and 320 A(∞) of MIBK. As an average of five different measurements values were: A(∞) 0.073 ± 0.002 321
and D = 2.56.10-15 ± 1.43.10-15 m2s-1. 322 323
324 Overall, qualitative diffusivity results and interaction energies determined from molecular 325
simulations and equilibrium partitioning coefficients inferred from ATR-FTIR experiments 326
were consistent with experimental rejections of 4 aminopiperidine, pinacolone and 327
methylisobutyl ketone. Good agreement between molecular simulation and experimental data 328
confirms the relevance of the combined approach which added to the understanding of the 329
separation of organic solutes by dense RO membranes. It has been shown that the total solute-330
hydrated membrane interaction is governed by both solute-water and solute-polymer 331
interactions. This means that solute-dry polymer affinity predicted using, e.g., Hansen solubility 332
0 100 200 300 4000.0
0.2
0.4
0.6
0.8
1.0
exp
fit (MIBK)
A (
t) / A
()
t / s
18
parameters may not apply simply because it does not account for the water content in RO 333
membranes. It also means that solutes that have high affinity for both polymer and water are 334
expected to have high partitioning in polyamide-based membranes, which agrees well with high 335
partitioning reported earlier for n-alcohols in such membranes.14 336
337
Supporting Information Available 338
Computational details; main equations for determination of partitioning coefficients and 339
diffusion coefficients from ATR-FTIR; additional ATR-FTIR results. This information is 340
available free of charge via the Internet at http://pubs.acs.org/. 341
342
References 343
(1) Drioli, E.; Macedonio, F. Membrane Engineering for Water Engineering. Ind. Eng. Chem. 344
Res. 2012, 51, 10051-10056. 345
(2) Wang, T.; Dai, L.; Zhang, Q.; Li, A.; Zhang, S. Effects of acyl chloride monomer 346
functionality on the properties of polyamide reverse osmosis (RO) membrane. J. Membr. Sci. 347
2013, 440, 48-57. 348
(3) Lee, J.; Doherty, C.M.; Hill, A.J.; Kentish, S.E. Water vapor sorption and free volume in 349
the aromatic polyamide layer of reverse osmosis membranes. J. Membr. Sci. 2013, 425-426, 350
217-226. 351
(4) Schäfer, A.I.; Akanyeti, I.; Semião, A.J.C. Micropollutant sorption to membrane polymers: 352
a review of mechanisms for estrogens. Adv. Colloid Interface Sci. 2011, 164, 100-117. 353
(5) Plakas, K.V.; Karabelas, A.J. Removal of pesticides from water by NF and RO membranes 354
- a review. Desalination 2012, 287, 255-265. 355
(6) Bellona, C.; Drewes, J.E.; Xu, P.; Amy, G. Factors affecting the rejection of organic solutes 356
during NF/RO treatment - a literature review. Water Res. 2004, 38, 2795-2809. 357
19
(7) Nghiem, L.D.; Schäfer, A.I.; Elimelech, M. Pharmaceutical Retention Mechanisms by 358
Nanofiltration Membranes. Environ. Sci. Technol. 2005, 39, 7698-7705. 359
(8) Nghiem, L.D.; Schäfer, A.I.; Elimelech, M. Role of electrostatic interactions in the retention 360
of pharmaceutically active contaminants by a loose nanofiltration membrane. J. Membr. Sci. 361
2006, 286, 52-59. 362
(9) Bellona, C.; Drewes, J.E. The role of membrane surface charge and solute physico-chemical 363
properties in the rejection of organic acids by NF membranes. J. Membr. Sci. 2005, 249, 227-364
234. 365
(10) Coronell, O.; Gonzalez, M.; Marinas, B.J.; Cahill, D.G. Ionization behavior, stoichiometry 366
of association, and accessibility of functional groups in the active layers of reverse osmosis and 367
nanofiltration membranes. Environ. Sci. Technol., 2010, 44, 6808–6814. 368
(11) Kimura, K.; Amy, G.; Drewes, J.; Watanabe, Y. Adsorption of hydrophobic compounds 369
onto NF/RO membranes: an artifact leading to overestimation of rejection. J. Membr. Sci. 2003, 370
221, 89-101. 371
(12) Nghiem, L.D.; Schäfer, A.I.; Elimelech, M. Removal of natural hormones by nanofiltration 372
membranes: measurement, modeling, and mechanisms. Environ. Sci. Technol. 2004, 38, 1888-373
1896. 374
(13) Nghiem, L.D.; Schäfer, A.I.; Elimelech, M. Nanofiltration of hormone mimicking trace 375
organic contaminants. Sep. Sci. Technol. 2005, 40, 2633-2649. 376
(14) Ben-David A;. Oren, Y.; Freger, V. Thermodynamic factors in partitioning and rejection 377
of organic compounds by polyamide composite membranes. Environ. Sci. Technol. 2006, 40, 378
7023-7028. 379
(15) Semião, A.J.C.; Schäfer, A.I. Removal of adsorbing estrogenic micropollutants by 380
nanofiltration membranes. Part A - Experimental evidence. J. Membr. Sci. 2013, 431, 244-256. 381
20
(16) Sotto, A.; Arsuaga, J.M.; Van der Bruggen, B. Sorption of phenolic compounds on NF/RO 382
membrane surfaces: Influence on membrane performance. Desalination 2013, 309, 64-73. 383
(17) Verliefde, A.R.D.; Cornelissen, E.R.; Heijman, S.G.J.; Hoek, E.M.V.; Amy, G.L.; Van der 384
Bruggen, B.; Van Dijk, J.C. Influence of solute-membrane affinity on rejection of uncharged 385
organic solutes by nanofiltration membranes. Environ. Sci. Technol. 2009, 43, 2400-2406. 386
(18) Dražević, E.; Bason, S.; Košutić K.; Freger, V. Enhanced partitioning and transport of 387
phenolic micropollutants within polyamide composite membranes. Environ. Sci. Technol. 388
2012, 46, 3377-3383. 389
(19) Dražević, E.; Košutić K.; Kolev, V.; Freger, V. Does hindered transport theory apply to 390
desalination membranes? Environ. Sci. Technol. 2014, 48, 11471-11478. 391
(20) Dlamini, D.S.; Levchenko S.; Bass, M.; Mamba, B.B.; Hoek, E.M.V.; Thwala J.M.; Freger, 392
V. Solute hindrance in non-porous membranes: an ATR-FTIR study. Desalination 2015, 368, 393
60-68. 394
(21) Freger, V.; Ben-David, A. Use of attenuated total reflection infrared spectroscopy for 395
analysis of partitioning of solutes between thin films and solution. Anal. Chem. 2005, 77, 6019-396
6025. 397
(22) Fieldson, G.T.; Barbari, T.A. The use of FTi.r.-a.t.r. spectroscopy to characterize penetrant 398
diffusion in polymers. Polymer 1993, 34, 1146-1153. 399
(23) Freger, V. Swelling and morphology of the skin layer of polyamide composite membranes: 400
an atomic force microscopy study. Environ. Sci. Technol. 2004, 38, 3168-3175. 401
(24) Cornell, W.D.; Cieplak, P.; Bayly, C.I.; Gould, I.R.; Merz, K.M.; Ferguson, D.M.; 402
Spellmeyer, D.C.; Fox, T.; Caldwell, J.W.; Kollman, P.A. A second generation force field for 403
the simulation of proteins, nucleic acids, and organic molecules. J. Am. Chem. Soc. 1995, 117, 404
5179-5197. 405
21
(25) Ding, M.; Szymczyk, A.; Ghoufi, A.; Goujon, F.; Soldera, A. Structure and dynamics of 406
water confined in a polyamide reverse-osmosis membrane: a molecular-simulation study. J. 407
Membr. Sci. 2014, 458, 236–244. 408
(26) Ding, M.; Szymczyk, A.; Ghoufi, A. Hydration of a polyamide reverse osmosis membrane. 409
J. Membr. Sci. 2016, 501, 248–253. 410
(27) Abascal, J. L.; Vega, C. A general purpose model for the condensed phases of water: 411
TIP4P/2005. J. Chem. Phys. 2005, 123, 234505. 412
(28) Ghoufi, A.; Morineau, D.; Lefort, R.; Hureau, I.; Hennous, L.; Zhu, H.; Szymczyk, A.; 413
Malfreyt, P.; Maurin, G. Molecular simulations of confined liquids: an alternative to the GCMC 414
simulations. J. Chem. Phys. 2011, 134, 074104. 415
(29) Nosé, S. A unified formulation of the constant temperature molecular dynamics methods. 416
J. Chem. Phys. 1984, 81, 511-519. 417
(30) Todorov, I.; Smith, W.; Trachenko, K.; Dove, M. DL_POLY_3: new dimensions in 418
molecular dynamics simulations via massive parallelism. J. Mater. Chem. 2006, 16, 1911-1918. 419
(31) Swope, W.C.; Andersen, H.C.; Berens, P.H., Wilson, K.R. A computer simulation method 420
for the calculation of equilibrium constants for the formation of physical clusters of molecules: 421
application to small water clusters. J. Chem. Phys. 1982, 76, 637-649. 422
(32) Dražević, E.; Košutić, K., Freger, V. Permeability and selectivity of reverse osmosis 423
membranes: correlation to swelling revisited. Water Res. 2014, 49, 444-452. 424
(33) Singh, P.S.; Ray, P; Xie, Z.; Hoang, M. Synchrotron SAXS to probe cross-linked network 425
of polyamide ‘reverse osmosis’ and ‘nanofiltration’ membranes. J. Membr. Sci. 2012, 421-422, 426
51-59. 427
(34) Ding, M.; Ghoufi, A.; Szymczyk, A. Molecular simulations of polyamide reverse osmosis 428
membranes. Desalination 2014, 343, 48-53. 429

22
(35) Kotelyanskii, M.J.; Wagner, N.; Paulaitis, M. Atomistic simulation of water and salt 430
transport in the reverse osmosis membrane ft-30. J. Membr. Sci. 1998, 139, 1-16. 431
(36) Wijmans, J.G.; Baker, R.W. The solution-diffusion model: a review. J. Membr. Sci. 1995, 432
107, 1-21. 433
(37) Allen, M. P.; Tildesley, D. J. Computer simulation of liquids. Clarendon press, Oxford, 434
1987. 435