Embed Size (px)
Citation preview
NASA Technical Memorandum 106802AIAA-95--0119 ?./q
,
Interactive Computer Graphics Applicationsfor Compressible Aerodynamics
Thomas J. Benson
Lewis Research Center
Cleveland, Ohio
Prepared for the
33rd Aerospace Sciences Meetingsponsored by the American Institute of Aeronautics and Astronautics
RenD, Nevada, January 9-12, 1995
National Aeronautics andSpace Administration
(NASA-TM-I06802) INTERACTIVE
COMPUTER GRAPHICS APPLICATIONS FOR
COMPRESSIBLE AERODYNAMICS (NASA.
Le_is Research Center) 17 p
N95-I7264
Unclas
G3/61 003]826
https://ntrs.nasa.gov/search.jsp?R=19950010849 2018-07-02T04:33:37+00:00Z

Interactive Computer Graphics Applications for Compressible
Aerodynamics
Thomas J. Benson"
NASA Lewis Research Center
Cleveland, Ohio 44135
November 22, 1994
ABSTRACT
Three computer applications have been developed
to solve inviscid compressible fluids problems using
interactive computer graphics. The first applicationis a compressible flow calculator which solves for
isentropic flow, normal shocks, and oblique shocks
or centered expansions produced by two dimensionalramps. The second application couples the solutions
generated by the first application to a more graphi-cal presentation of the results to produce a desk top
simulator of three compressible flow problems: 1)flow past a single compression ramp; 2) flow past
two ramps in series; and 3) flow past two opposedramps. The third application extends the results of
the second to produce a design tool which solves for
the flow through supersonic external or mixed com-
pression inlets. The applications were originally de-
veloped to run on SGI or IBM workstations running
GL graphics. They are currently being extended to
solve additional types of flow problems and modifiedto operate on any X-based workstation.
INTRODUCTION
Recent advances in computer related technologies
are changing the ways that engineers solve aerody-
namics problems. In the past, preliminary design
was conducted using charts, tables and graphs ofthe performance of similar configurations and final
*Senior Research Engineer, Member AIAA°Copyright c 1994 by the American Institute of Aeronau-
tics and Astronautics, Inc. No copyright is asserted in theUnited States under Title 17, U.S. Code. The U.S. Govern-ment has a royalty-free license to exercise all rights underthe copyright claimed herein for Governmentalpurposes. All
other rights are reserved by the copyright owner.
design was tested and verified using wind tunnel re-
suits. With the advent of large, powerful mainframe
computers, some of the preliminary design tables
and graphs could be generated by solving the equa-
tions of motion and some of the final design results
could be verified using computational fluid mechan-
ics. Today's workstations and personal computers
have computing power equal to that of the older
mainframes. When coupled with window operating
systems and graphical user interfaces, workstationscan now be used to solve preliminary design prob-
lems interactively. Clusters of workstations are even
beginning to rival the supercomputers for the solu-
tion of final design problems.
This paper will present extensions of work begun
by the author in 1993, Refs. 1 and 2, concerning the
development of a family of computer applications
to solve basic, inviscid, compressible aerodynamics
problems using interactive computer graphics on a
workstation. In Ref. 1 an interactive inlet design
tool was developed to solve for the flow through
external compression inlets. Through the use of a
graphical interface, the designer could change the
geometry, and the upstream and downstream flowconditions and immediately see the effects on in-
let performance and drag. As the geometry and
flow conditions were altered, the application would
recompute the important flow variables and redis-
play the geometry, shock wave locations, and outputflow parameters. It became evident during the de-
velopment of the package that if the flow problem
was simplified from flow through an entire inlet to
simply flow past a wedge, undergraduate students
could use this technology to study a fundamental
flow problem in a highly visual and interactive way.
This lead to the development of a second applica-
tion which is described in l_f. 2. Some additional
interactive features were added in this educational
simulator to produce a prototype desk top wind tun-
nel. The student has a flow problem presented in a
view window on the workstation, some controls over
inputs to the problem in a second window, and the
results of the solution presented in a third window.
The student can then vary the input flow conditions
and analyze and record the variation of the selected
output flow variable with an interactive graphics
generator.
Both applications packages have been expanded
to solve additional flow problems. The inlet simu-
lator can now solve for flow through either external
compression inlets with the terminal normal shock
generated outside the cowl, or mixed compressioninlets with the terminal normal shock generated in-
side the duct. The simulator will signal flow condi-tions which can lead to inlet unstart, an undesirable
instability of mixed compression inlets in which thenormal shock moves from inside the duct to out-
side the cowl with a large loss in inlet performance.
An inlet bypass system has also been added to the
model, since most operational mixed compression
inlets require some form of bypass to avoid unstarts
and provide increased stability. The educationalsimulator has been extended to solve two additional
flow problems: 1) flow past opposing wedges whichproduce crossing shocks, and 2) flow past two suc-
ceeding wedges which produce intersecting shocks.
By setting one of the opposed wedges to zero de-
flection, the opposed wedge mode can also be used
to study shock reflections from a solid surface. As
previously discussed, the educational application is
designed to mimic a wind tunnel, giving the stu-
dent control over flow conditions and the taking of
data for later analysis. With the two additional flow
problems, a data probe has been added to the plot-
ter package to allow the student to produce flowfieldmaps of these complex interactions. Details of the
improved educational simulator are given in Ref. 3.
In the development of the two previously re-
ported packages, it was necessary to check the re-
sults against previous analytical results, principally
those in NACA 1135, Ref. 4, and certain compress-
ible aerodynamics text books, Refs. 5 and 6. To fa-
cilitate this verification process, an interactive com-
pressible flow calculator which runs on the worksta-
tion was also developed. This calculator employs no
graphics other than the push button widgets used
toselectoutput variablesand the textinput widgets
used to enter data to the program. The calculator
returnsa singleflow variablefor a given set of in-
put conditionsforthe problems ofsimple isentropic
fow, normal shock flow,obliqueshock flow and cen-
tered Prandtl-Meyer expansion. The calculatorhas
proven to be a niceutilityforother unrelatedtasks,
such as the preparation of consistentinput condi-
tionsforlargeCFD applicationsand the verification
of the resultsofother codes. The calculatorcan be
used inany instancewhere one would normally con-
sultthe NACA 1135 tablesand graphs,except nowitisavailableon the workstation.
ANALYSIS
The compressible flow calculatorwillsolve for
isentropicflow, normal shock flow,oblique shocks
generated by a compression ramp, and centered
Prandtl-Meyer expansion generated by an expan-
sion corner. The equations relating the flow vari-ables in these compressible flow problems all depend
on the ratioofspecificheats,7, which must be spec-
ifiedby the user and which isdefaultedto 1.4. The
isentropicand normal shock equations are algebraic
equations of one parameter, as given in l_ef.4. In
the calculator,allofthe flowvariablesare calculated
as functionsof Mach number. Ifthe user provides
an input variablewhich isnot the Mach number, the
equation relatingthat variableto Mach number is
solvedforthe Mach number and then allthe output
variablesare computed. The obliqueshock and cen-
teredexpansion equations are algebraicequationsof
two parameters chosen from the flow variablesplus
the wedge deflectionangle. In theory,any two of
these parameters willdetermine the valueofallthe
other variables.To simplifythe programming for
the calculator,itisassumed that the freestream
Mach number and one other parameter are speci-
fied. The equations governing these two problems
are given indetailin Ref. 2.
The educationalsimulator willsolveforflow past
a singlewedge, opposed wedges, or two successive
wedges. The flow phenomena presentintheseprob-
lems includeoblique and normal shocks,intersect-
ing and reflectingshocks,and the generationofslip
surfacesat shock intersections.The equations gov-
erningobliqueand normal shocks aregiven inRef.4,
and theirirnplementationinthe simulatorisgivenin
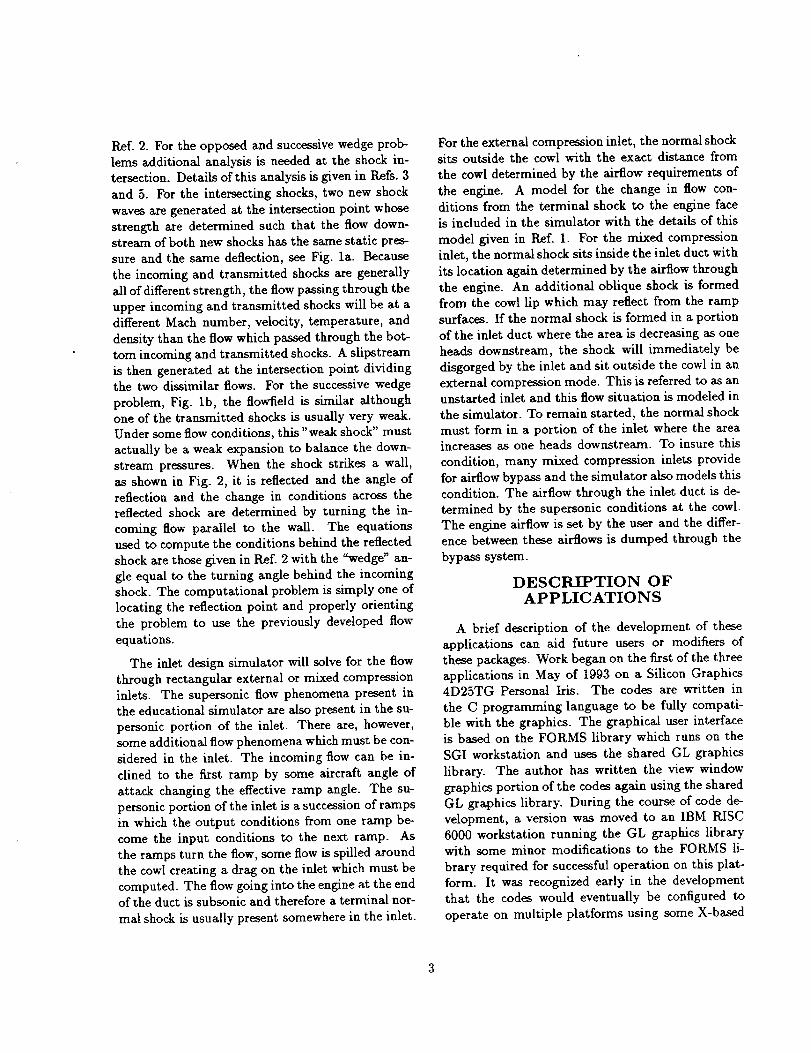
Ref. 2. For the opposed and successive wedge prob-lems additional analysis is needed at the shock in-
tersection. Details of this analysis is given in Refs. 3
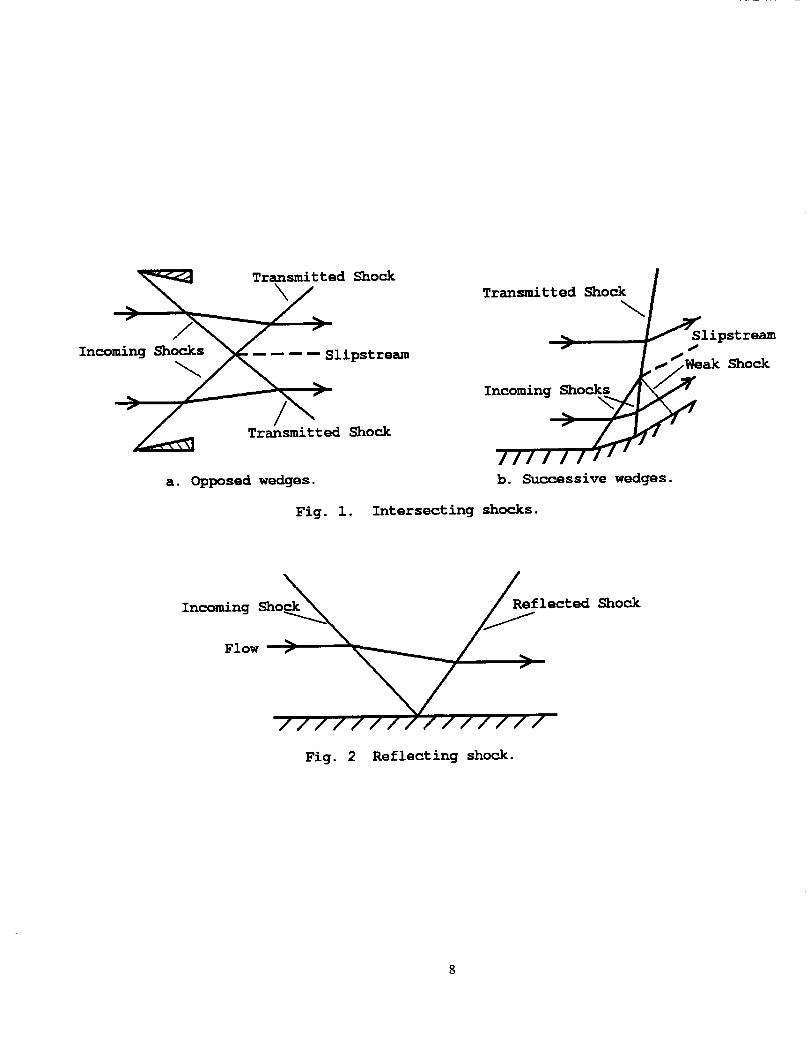
and 5. For the intersecting shocks, two new shock
waves are generated at the intersection point whose
strength are determined such that the flow down-
stream of both new shocks has the same static pres-
sure and the same deflection, see Fig. la. Because
the incoming and transmitted shocks are generally
all of different strength, the flow passing through the
upper incoming and transmitted shocks will be at a
different Mach number, velocity, temperature, and
density than the flow which passed through the bot-
tom incoming and transmitted shocks. A slipstream
is then generated at the intersection point dividing
the two dissimilar flows. For the successive wedge
problem, Fig. lb, the flowfield is similar although
one of the transmitted shocks is usually very weak.
Under some flow conditions, this "weak shock" must
actually be a weak expansion to balance the down-stream pressures. When the shock strikes a wall,
as shown in Fig. 2, it is reflected and the angle of
reflection and the change in conditions across thereflected shock are determined by turning the in-
coming flow parallel to the wall. The equations
used to compute the conditions behind the reflected
shock are those given in Ref. 2 with the _wedge" an-
gle equal to the turning angle behind the incoming
shock. The computational problem is simply one of
locating the reflection point and properly orientingthe problem to use the previously developed flow
equations.
The inlet design simulator will solve for the flow
through rectangular external or mixed compression
inlets. The supersonic flow phenomena present inthe educational simulator are also present in the su-
personic portion of the inlet. There are, however,
some additional flow phenomena which must be con-
sidered in the inlet. The incoming flow can be in-
clined to the first ramp by some aircraft angle of
attack changing the effective ramp angle. The su-
personic portion of the inlet is a succession of rampsin which the output conditions from one ramp be-
come the input conditions to the next ramp. As
the ramps turn the flow, some flow is spilled around
the cowl creating a drag on the inlet which must be
computed. The flow going into the engine at the endof the duct is subsonic and therefore a terminal nor-
mal shock is usually present somewhere in the inlet.
For the external compression inlet, the normal shocksits outside the cowl with the exact distance from
the cowl determined by the airflow requirements of
the engine. A model for the change in flow con-
ditions from the terminal shock to the engine faceis included in the simulator with the details of this
model given in Ref. 1. For the mixed compression
inlet, the normal shock sits inside the inlet duct with
its location again determined by the airflow through
the engine. An additional oblique shock is formed
from the cowl lip which may reflect from the ramp
surfaces. If the normal shock is formed in a portion
of the inlet duct where the area is decreasing as one
heads downstream, the shock will immediately be
disgorged by the inlet and sit outside the cowl in an
external compression mode. This is referred to as anunstarted inlet and this flow situation is modeled in
the simulator. To remain started, the normal shockmust form in a portion of the inlet where the areaincreases as one heads downstream. To insure this
condition, many mixed compression inlets provide
for airflow bypass and the simulator also models this
condition. The airflow through the inlet duct is de-
termined by the supersonic conditions at the cowl.
The engine airflow is set by the user and the differ-
ence between these airflows is dumped through the
bypass system.
DESCRIPTION OF
APPLICATIONS
A brief description of the development of theseapplications can aid future users or modifiers of
these packages. Work began on the first of the three
applications in May of 1993 on a Silicon Graphics4D25TG Personal Iris. The codes are _ritten in
the C programming language to be fully compati-
ble with the graphics. The graphical user interfaceis based on the FORMS library which runs on the
SGI workstation and uses the shared GL graphics
library. The author has written the view window
graphics portion of the codes again using the shared
GL graphics library. During the course of code de-
velopment, a version was moved to an IBM RISC
6000 workstation running the GL graphics librarywith some minor modifications to the FORMS li-
brary required for successful operation on this plat-
form. It was recognized early in the development
that the codes would eventually be configured to
operate on multiple platforms using some X-based
3
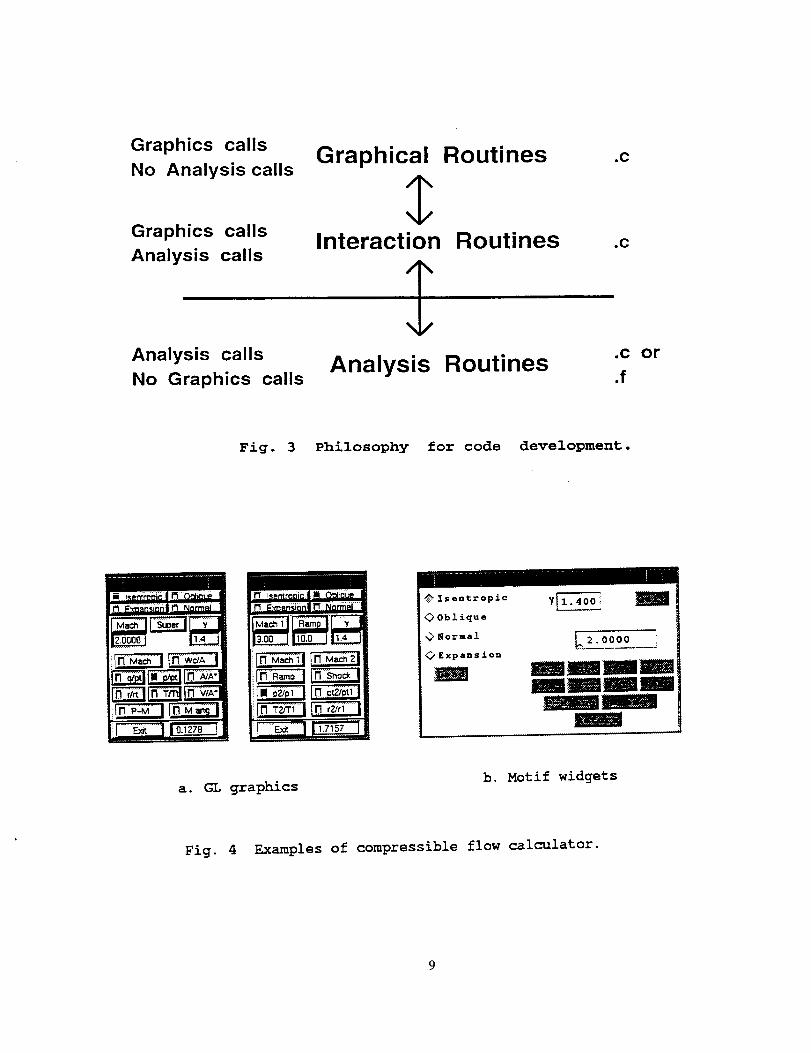
graphicssystemsuchas Open-GL or Motif. Tofacilitate the transition from GL, each code was
originally configured in three sections, as shown in
Fig. 3. The first section deals only with the layout
and drawing of the graphical user interface (GUI).
The second section performs the interactions be-
tween the GUI and computational portion of the
code. The third section contains only the compu-
tational routines for each application and is totally
independent of the graphics system used on a par-
ticnlar platform. This configuration leads to some
inefficiencies, such as flags being set to pass infor-
mation, but a large portion of the code remains un-
changed when moving from one graphics system toanother. The calculator was transitioned to X-based
Motif and it required only several days of recoding.
Additional time will certainly be required for the
simulators because of the more complex widget sets
and the graphics view windows.
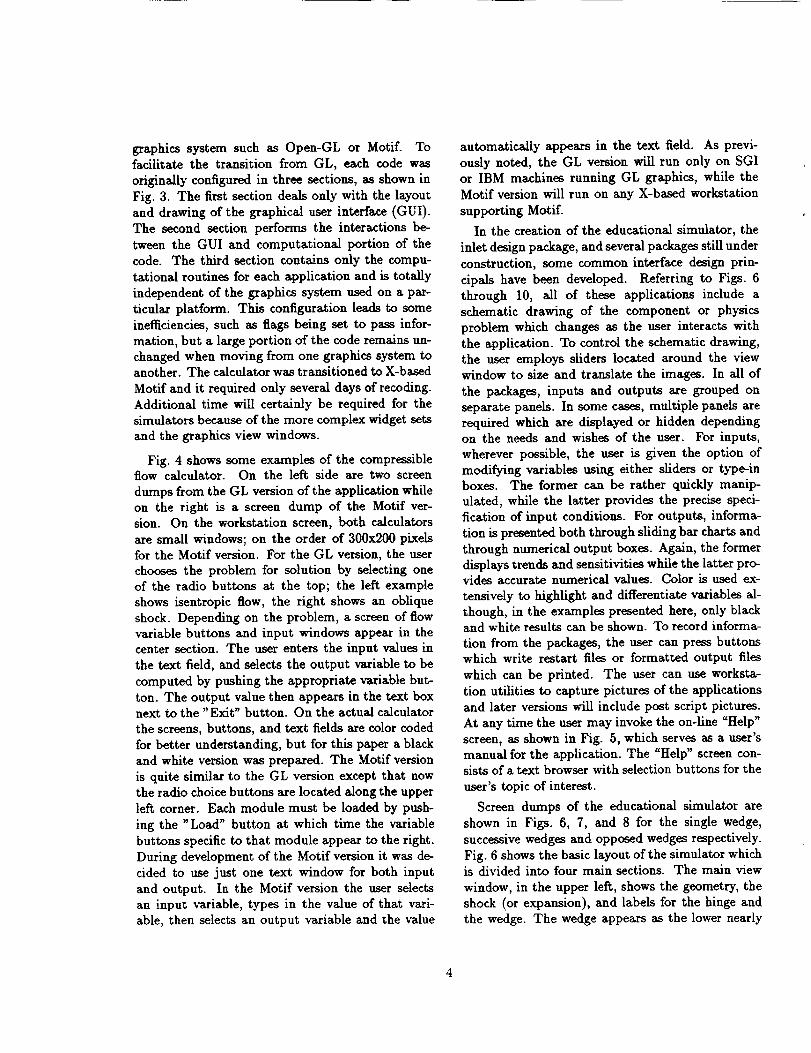
Fig. 4 shows some examples of the compressibleflow calculator. On the left side are two screen
dumps from the GL version of the application while
on the right is a screen dump of the Motif ver-sion. On the workstation screen, both calculators
are small windows; on the order of 300x200 pixelsfor the Motif version. For the GL version, the user
chooses the problem for solution by selecting one
of the radio buttons at the top; the left example
shows isentropic flow, the right shows an oblique
shock. Depending on the problem, a screen of flow
variable buttons and input windows appear in thecenter section. The user enters the input values in
the text field, and selects the output variable to be
computed by pushing the appropriate variable but-
ton. The output value then appears in the text boxnext to the "Exit" button. On the actual calculator
the screens, buttons, and text fields are color coded
for better understanding, but for this paper a black
and white version was prepared. The Motif version
is quite similar to the GL version except that nowthe radio choice buttons are located along the upper
left corner. Each module must be loaded by push-
ing the "Load" button at which time the variable
buttons specific to that module appear to the right.
During development of the Motif version it was de-
cided to use just one text window for both input
and output. In the Motif version the user selects
an input variable, types in the value of that vari-able, then selects an output variable and the value
automatically appears in the text field. As previ-
ously noted, the GL version will run only on SGIor IBM machines running GL graphics, while the
Motif version will run on any X-based workstation
supporting Motif.
In the creation of the educational simulator, the
inlet design package, and several packages still under
construction, some common interface design prin-
cipals have been developed. Referring to Figs. 6
through 10, all of these applications include a
schematic drawing of the component or physics
problem which changes as the user interacts with
the application. To control the schematic drawing,the user employs sliders located around the view
window to size and translate the images. In all of
the packages, inputs and outputs are grouped on
separate panels. In some cases, multiple panels arerequired which are displayed or hidden dependingon the needs and wishes of the user. For inputs,
wherever possible, the user is given the option of
modifying variables using either sliders or type-inboxes. The former can be rather quickly manip-
ulated, while the latter provides the precise speci-
fication of input conditions. For outputs, informa-
tion is presented both through sliding bar charts and
through numerical output boxes. Again, the former
displays trends and sensitivities while the latter pro-vides accurate numerical values. Color is used ex-
tensively to highlight and differentiate variables al-
though, in the examples presented here, only blackand white results can be shown. To record informa-
tion from the packages, the user can press buttonswhich write restart files or formatted output files
which can be printed. The user can use worksta-
tion utilities to capture pictures of the applicationsand later versions will include post script pictures.
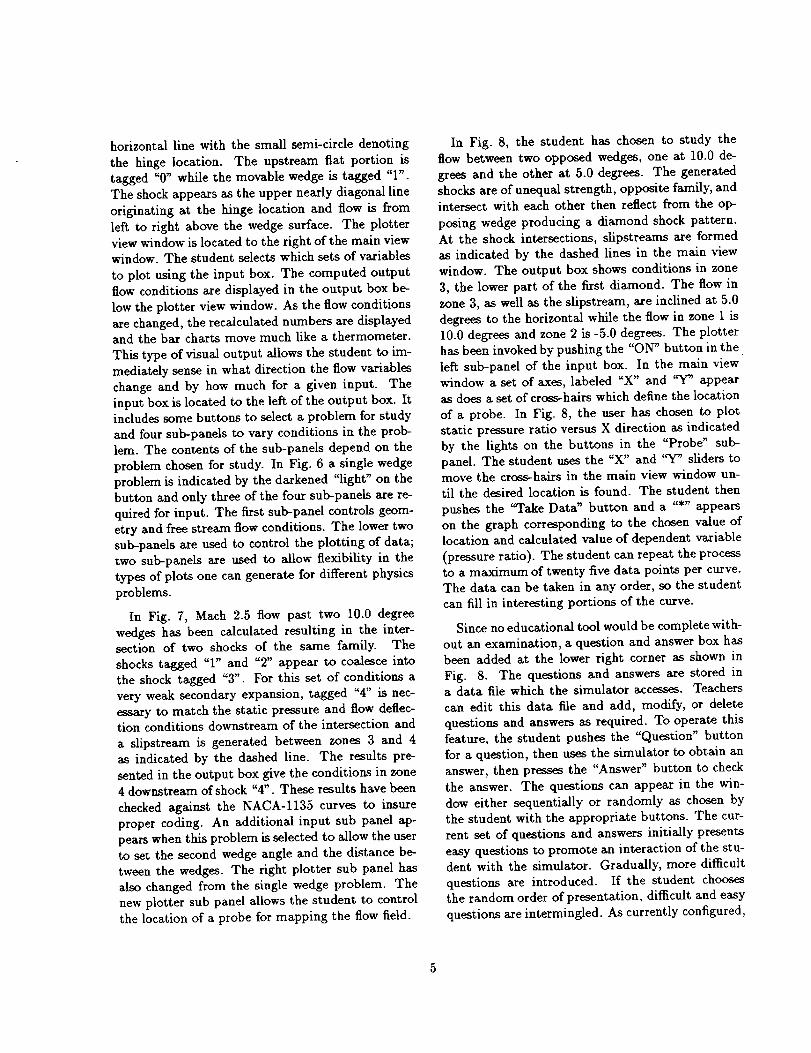
At any time the user may invoke the on-line "Help"
screen, as shown in Fig. 5, which serves as a user's
manual for the application. The "Help" screen con-sists of a text browser with selection buttons for the
user's topic of interest.
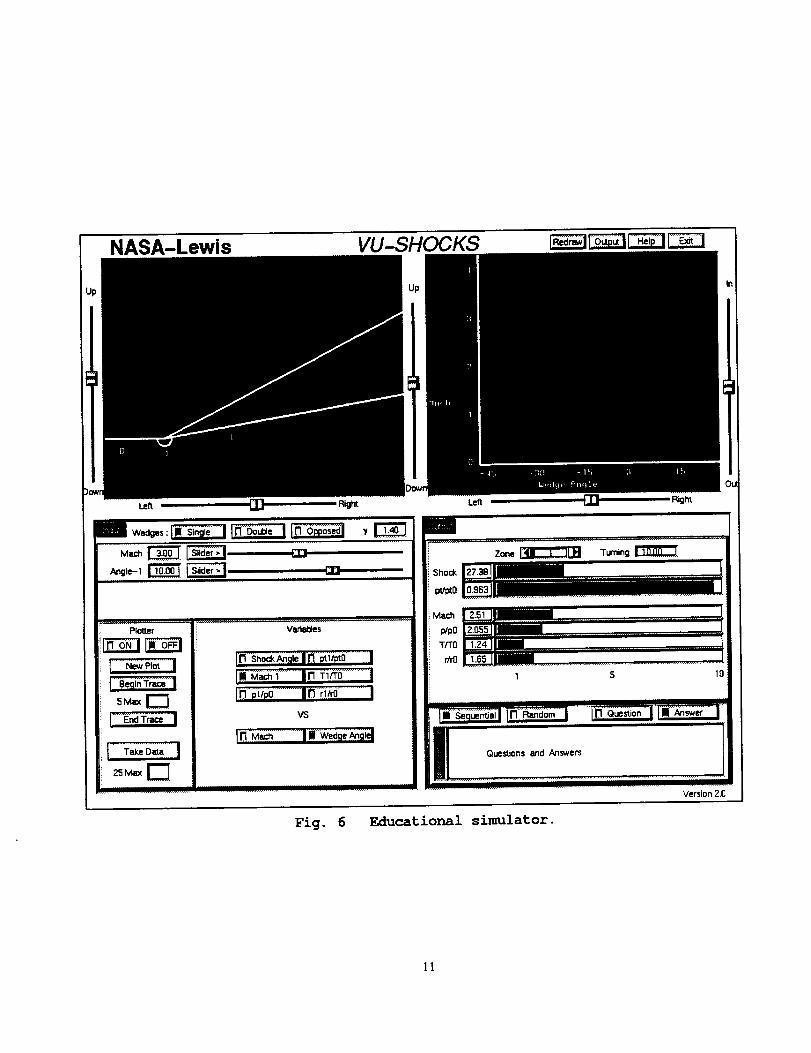
Screen dumps of the educational simulator are
shown in Figs. 6, 7, and 8 for the single wedge,
successive wedges and opposed wedges respectively.
Fig. 6 shows the basic layout of the simulator whichis divided into four main sections. The main view
window, in the upper left, shows the geometry, the
shock (or expansion), and labels for the hinge and
the wedge. The wedge appears as the lower nearly
4
horizontallinewith thesmallsemi-circledenotingthe hingelocation.The upstreamflat portionistagged"0" whilethemovablewedgeis tagged"1".Theshockappearsastheuppernearlydiagonallineoriginatingat the hingelocationandflowis fromleft to rightabovethewedgesurface.Theplotterviewwindowislocatedto therightofthemainviewwindow.Thestudentselectswhichsetsof variablesto plotusingtheinputbox.Thecomputedoutputflow conditions are displayed in the output box be-
low the plotter view window. As the flow conditions
are changed, the recalculated numbers are displayedand the bar charts move much like a thermometer.
This type of visual output allows the student to im-
mediately sense in what direction the flow variables
change and by how much for a given input. The
input box is located to the left of the output box. Itincludes some buttons to select a problem for study
and four sub-panels to vary conditions in the prob-
lem. The contents of the sub-panels depend on the
problem chosen for study. In Fig. 6 a single wedge
problem is indicated by the darkened "light" on the
button and only three of the four sub-panels are re-
quired for input. The first sub-panel controls geom-etry and free stream flow conditions. The lower two
sub-panels are used to control the plotting of data;
two sub-panels are used to allow flexibility in the
types of plots one can generate for different physics
problems.
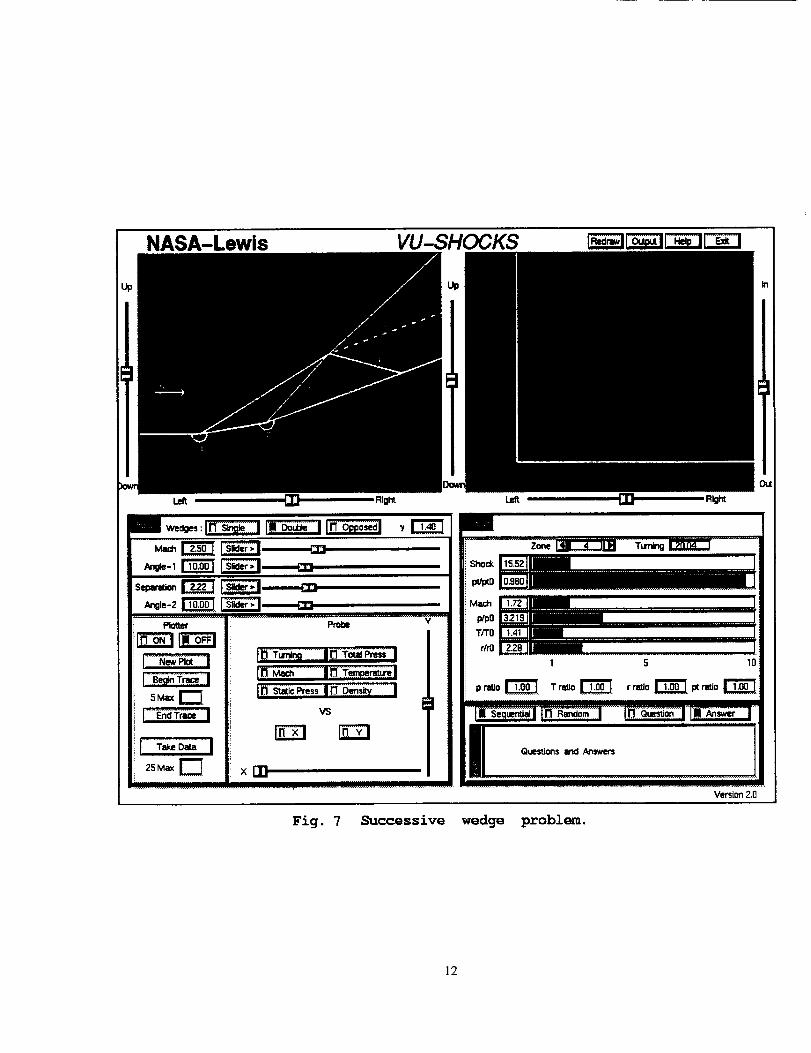
In Fig. 7, Mach 2.5 flow past two 10.0 degree
wedges has been calculated resulting in the inter-section of two shocks of the same family. The
shocks tagged "1" and "2" appear to coalesce into
the shock tagged "3". For this set of conditions a
very weak secondary expansion, tagged "4" is nec-
essary to match the static pressure and flow deflec-tion conditions downstream of the intersection and
a slipstream is generated between zones 3 and 4as indicated by the dashed line. The results pre-
sented in the output box give the conditions in zone4 downstream of shock "4". These results have been
checked against the NACA-1135 curves to insure
proper coding. An additional input sub panel ap-
pears when this problem is selected to allow the user
to set the second wedge angle and the distance be-
tween the wedges. The right plotter sub panel has
also changed from the single wedge problem. The
new plotter sub panel allows the student to control
the location of a probe for mapping the flow field.
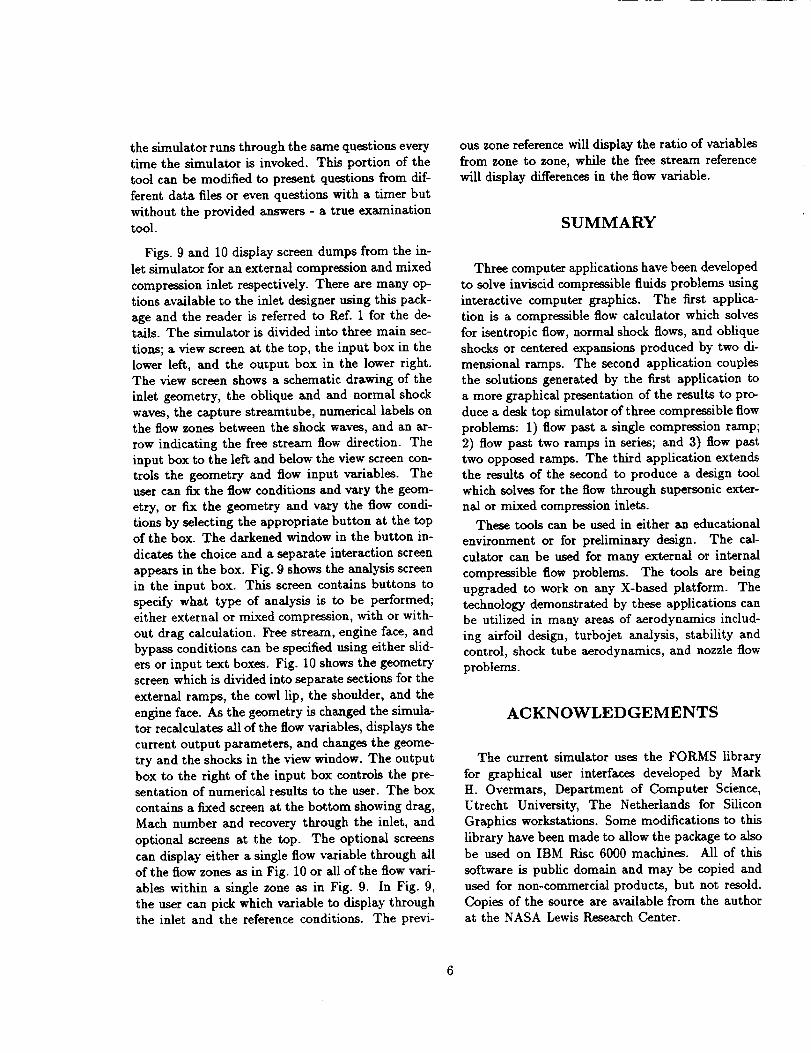
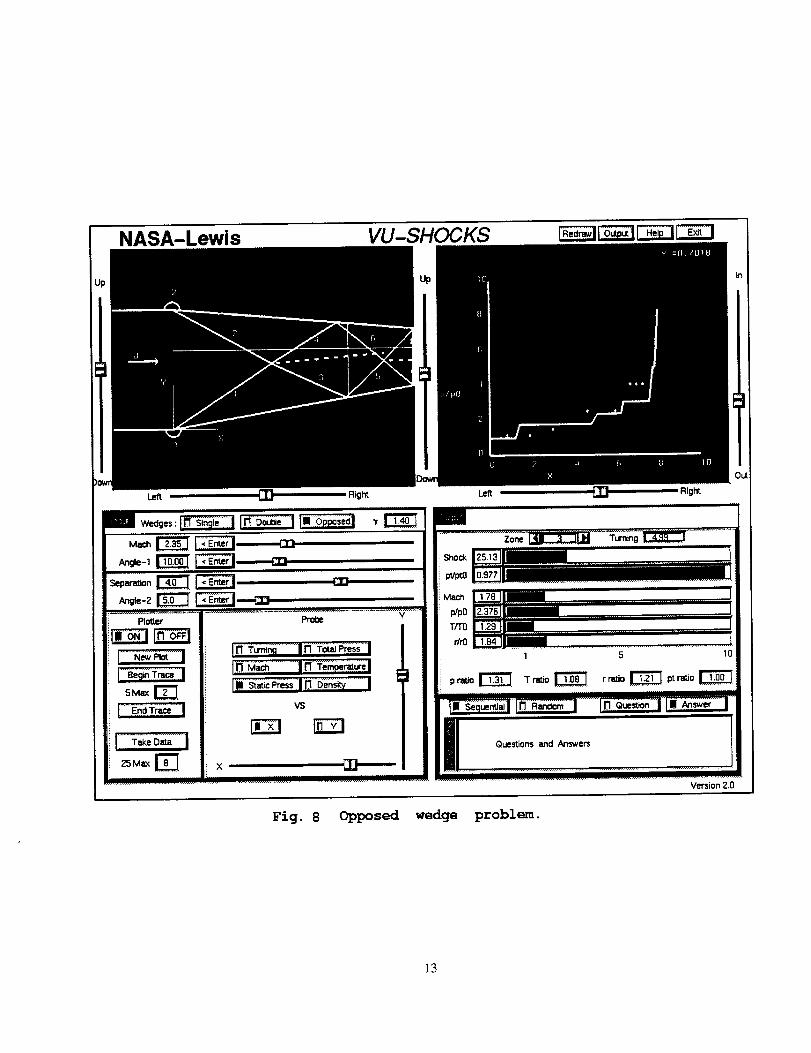
In Fig. 8, the student has chosen to study the
flow between two opposed wedges, one at 10.0 de-
grees and the other at 5.0 degrees. The generated
shocks are of unequal strength, opposite family, and
intersect with each other then reflect from the op-
posing wedge producing a diamond shock pattern.
At the shock intersections, slipstreams are formedas indicated by the dashed lines in the main view
window. The output box shows conditions in zone
3, the lower part of the first diamond. The flow in
zone 3, as well as the slipstream, are inclined at 5.0
degrees to the horizontal while the flow in zone 1 is
10.0 degrees and zone 2 is -5.0 degrees. The plotter
has been invoked by pushing the "ON" button in the
left sub-panel of the input box. In the main view
window a set of axes, labeled "X" and _ appearas does a set of cross-hairs which define the location
of a probe. In Fig. 8, the user has chosen to plotstatic pressure ratio versus X direction as indicated
by the lights on the buttons in the "Probe" sub-
panel. The student uses the "X" and "Y" sliders tomove the cross-hairs in the main view window un-
til the desired location is found. The student then
pushes the _rake Data" button and a "*" appearson the graph corresponding to the chosen value of
location and calculated value of dependent variable
(pressure ratio). The student can repeat the processto a maximum of twenty five data points per curve.
The data can be taken in any order, so the student
can fill in interesting portions of the curve.
Since no educational tool would be complete with-
out an examination, a question and answer box has
been added at the lower right corner as shown in
Fig. 8. The questions and answers are stored ina data file which the simulator accesses. Teachers
can edit this data file and add, modify, or deletequestions and answers as required. To operate this
feature, the student pushes the "Question" button
for a question, then uses the simulator to obtain an
answer, then presses the "Answer" button to check
the answer. The questions can appear in the win-
dow either sequentially or randomly as chosen by
the student with the appropriate buttons. The cur-
rent set of questions and answers initially presents
easy questions to promote an interaction of the stu-
dent with the simulator. Gradually, more difficult
questions are introduced. If the student choosesthe random order of presentation, difficult and easy
questions are intermingled. As currently configured,
the simulator runs through the same questions every
time the simulator is invoked. This portion of the
tool can be modified to present questions from dif-
ferent data files or even questions with a timer but
without the provided answers - a true examination
tool.
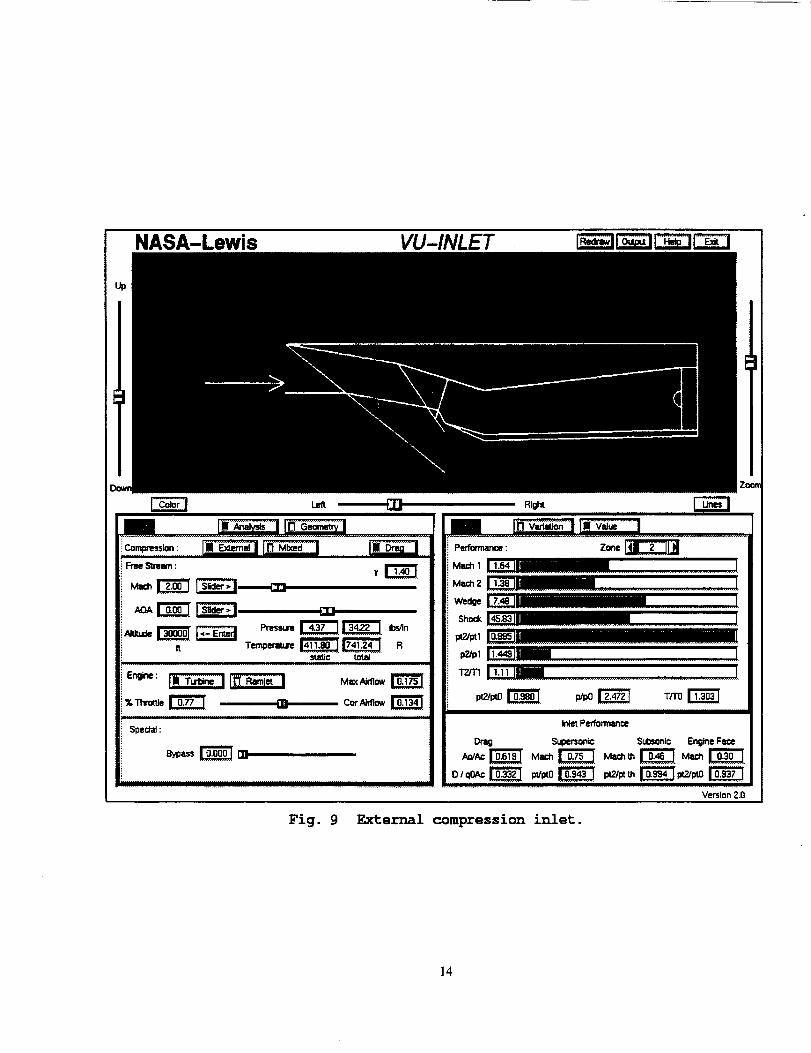
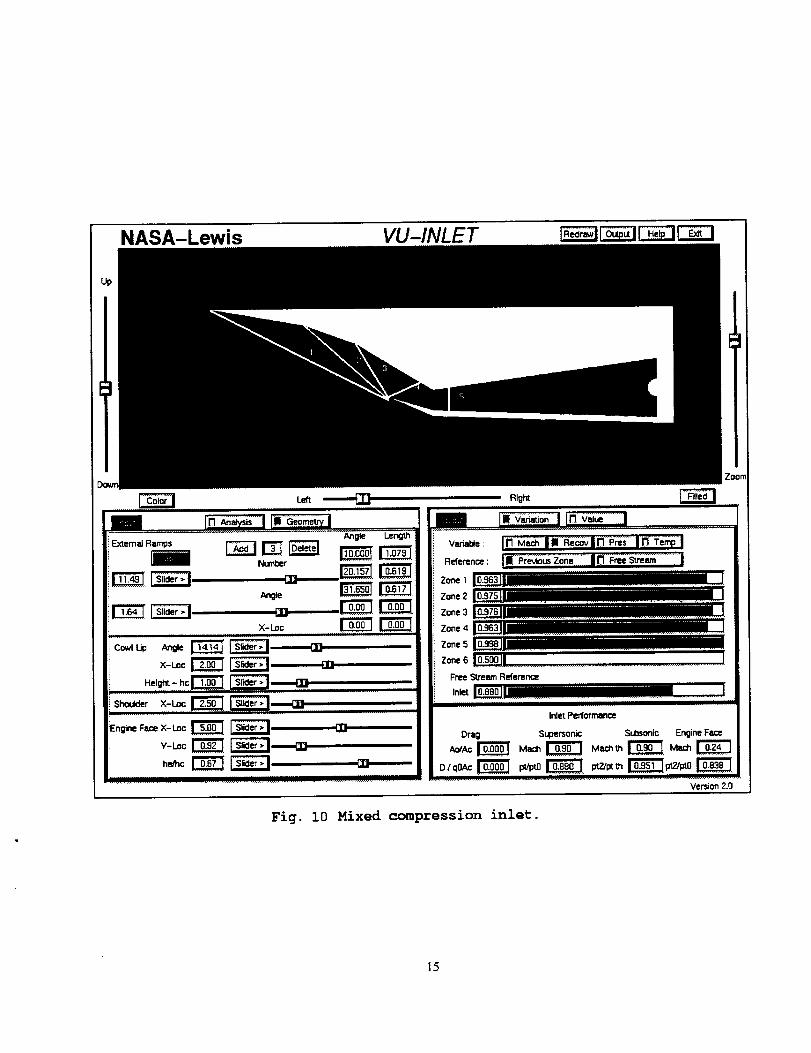
Figs. 9 and 10 display screen dumps from the in-let simulator for an external compression and mixed
compression inlet respectively. There are many op-tions available to the inlet designer using this pack-
age and the reader is referred to Ref. 1 for the de-tails. The simulator is divided into three main sec-
tions; a view screen at the top, the input box in the
lower left, and the output box in the lower right.
The view screen shows a schematic drawing of the
inlet geometry, the oblique and and normal shockwaves, the capture streamtube, numerical labels onthe flow zones between the shock waves, and an ar-
row indicating the free stream flow direction. The
input box to the left and below the view screen con-
trois the geometry and flow input variables. Theuser can fix the flow conditions mad vary the geom-
etry, or fix the geometry and vary the flow condi-
tions by selecting the appropriate button at the topof the box. The darkened window in the button in-
dicates the choice and a separate interaction screen
appears in the box. Fig. 9 shows the analysis screen
in the input box. This screen contains buttons to
specify what type of analysis is to be performed;either external or mixed compression, with or with-
out drag calculation. Free stream, engine face, andbypass conditions can be specified using either slid-
ers or input text boxes. Fig. 10 shows the geometryscreen which is divided into separate sections for the
external ramps, the cowl lip, the shoulder, and the
engine face. As the geometry is changed the simula-tor recalculates all of the flow variables, displays the
current output parameters, and changes the geome-
try and the shocks in the view window. The output
box to the right of the input box controls the pre-sentation of numerical results to the user. The box
contains a fixed screen at the bottom showing drag,
Mach number and recovery through the inlet, and
optional screens at the top. The optional screens
can display either a single flow variable through all
of the flow zones as in Fig. 10 or all of the flow vari-
ables within a single zone as in Fig. 9. In Fig. 9,
the user can pick which variable to display throughthe inlet and the reference conditions. The previ-
ous zone reference will display the ratio of variables
from zone to zone, while the free stream referencewill display differences in the flow variable.
SUMMARY
Three computer applications have been developed
to solve inviscid compressible fluids problems using
interactive computer graphics. The first applica-
tion is a compressible flow calculator which solves
for isentropic flow, normal shock flows, and oblique
shocks or centered expansions produced by two di-
mensional ramps. The second application couples
the solutions generated by the first application to
a more graphical presentation of the results to pro-
duce a desk top simulator of three compressible flow
problems: 1) flow past a single compression ramp;
2) flow past two ramps in series; and 3) flow pasttwo opposed ramps. The third application extends
the results of the second to produce a design tool
which solves for the flow through supersonic exter-
nal or mixed compression inlets.
These tools can be used in either an educational
environment or for preliminary design. The cal-
culator can be used for many external or internal
compressible flow problems. The tools are being
upgraded to work on any X-based platform. The
technology demonstrated by these applications canbe utilized in many areas of aerodynamics includ-
ing airfoil design, turbojet analysis, stability andcontrol, shock tube aerodynamics, and nozzle flow
problems.
ACKNOWLEDGEMENTS
The current simulator uses the FORMS library
for graphical user interfaces developed by Mark
H. Overmars, Department of Computer Science,
Utrecht University, The Netherlands for Silicon
Graphics workstations. Some modifications to this
library have been made to allow the package to alsobe used on IBM Risc 6000 machines. All of this
software is public domain and may be copied andused for non-commercial products, but not resold.
Copies of the source are available from the authorat the NASA Lewis Research Center.
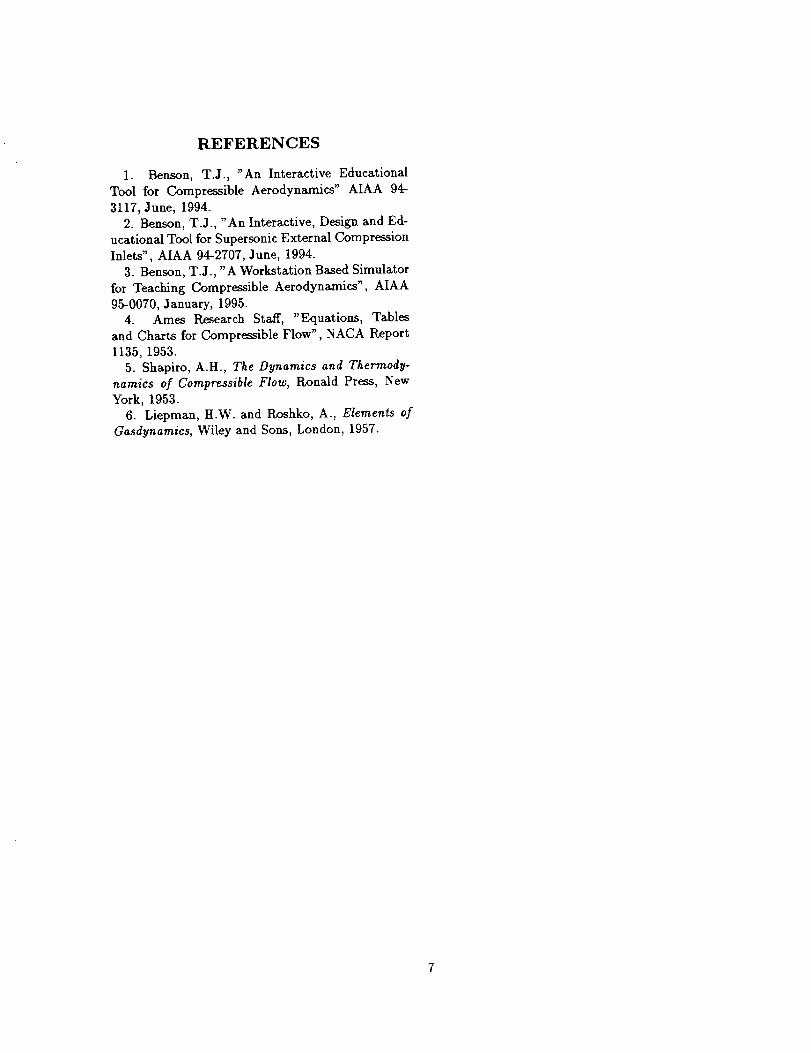
REFERENCES
1. Benson, T.J., "An Interactive Educational
Tool for Compressible Aerodynamics" AIAA 94-
3117, June, 1994.
2. Benson, T.J., "An Interactive, Design and Ed-
ucational Tool for Supersonic External Compression
Inlets", AIAA 94-2707, June, 1994.
3. Benson, T.J., "A Workstation Based Simulator
for Teaching Compressible Aerodynamics", AIAA
95-0070, January, 1995.
4. Ames Research Staff, "Equations, Tables
and Charts for Compressible Flow", NACA Report
1135, 1953.
5. Shapiro, A.H., The Dynamics and Thermody-
namics of Compressible Flow, R.onald Press, NewYork, 1953.
6. Liepman, H.W. and Roshko, A., Elements ofGasdynamics, Wiley and Sons, London, 1957.
Incoming Shocks
Transmitted Shock
\
------Slipstream
Transmitted Shock
a. Opposed wedges.
Transmitted Shock l
___J_Slipstream
_-S_eak Shock
In_
b. Successive wedges.
Fig. I. Intersecting shocks.
Incoming Sho_ _flected Shock
Flow . _/ >
///////////////
Fig. 2 Reflecting shock.
Graphics calls
No Analysis calls
Graphics calls
Analysis calls
Analysis calls
No Graphics calls
Graphical
$Interaction
Analysis
Routines
Routines
Routines
.C
.C
.C or
.f
Fig. 3 Philosophy for code development.
Isentropic
Oblique
Normal
_Expan$ion
0000 _
a. GL graphicsb. Motif widgets
Fig. 4 Examples of compressible flow calculator.
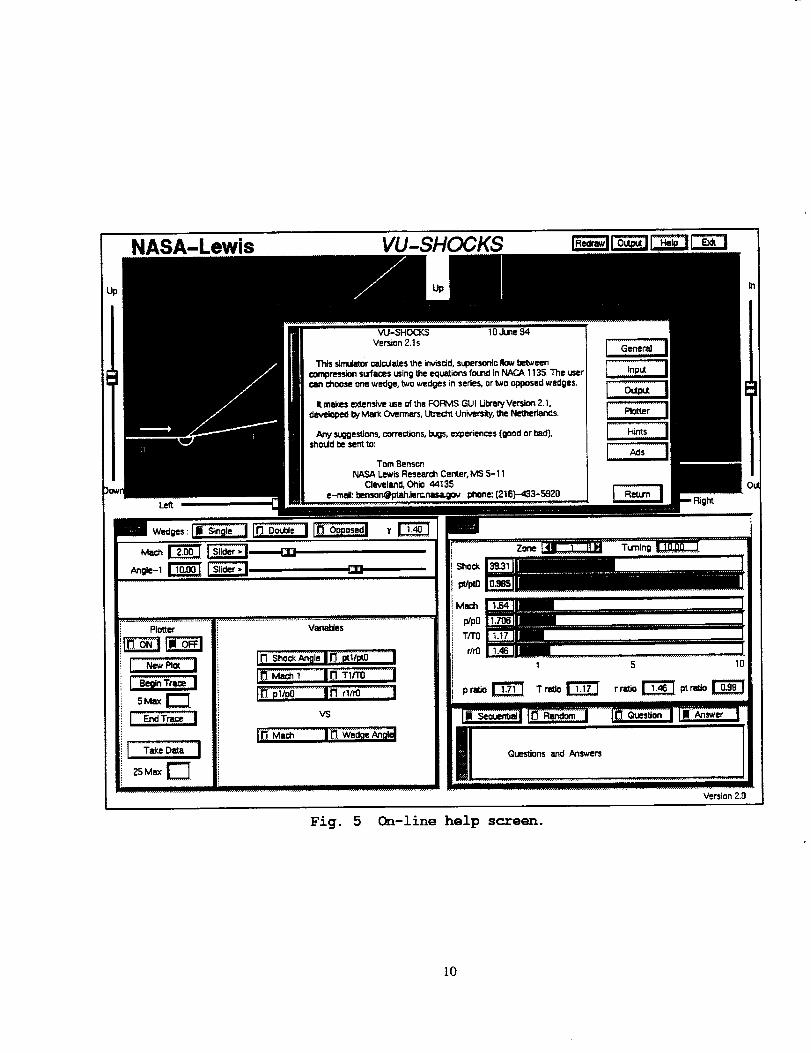
NASA-Lewis VU-SHOCKS
W-SHOCKS 10 June S4Version Z.ls
This simulator ¢zdc_atesthe invtsdd, supersonic flow betweencompressionsurfaces usingthe equations found inNACA 1135. The usercan choose one wedge, twowedges insedes, or two opposed wedges.
It makes extensive useof the FOFgVISGUI UIxap/Version 2.1,developed byMark Overmars, Utrect_ University,the Nethertands.
Any su_ge_ons, corre_ons, bugs, experiences (good or bad),shouldbe sent. to:
Tom BensonNASA Lewis Research Center, MS 5-11
Clevel_d, Ohio 44135e-mail: [email protected] phone: (216)-433-5920
Left
rnAngle-1_
Vari_es
Shock
p/pro
pyp0T/TO
r/r0
Ads
I 5 10
Version 2.0
Fig. 5 C_-line help screen.
I0
NASA-Lewis VU-SHOCKS
Left [] Right
i
Plotter
i..-.---_,p,=•1
5M¢<
25 Max [_
it i ..... j
Vad_es
In's_o__gi_lt__ ............I
vs
.....!!It ............ t....................................................... ! ......
Left [_ Right
Shock
Mach
p/p0
T/TO
dr0
I " Questions and Answers ' "IIVersion 2.I_
Fig. 6 Educational simulator.
11
NASA-Lewis VU-SHOCKS f'i';'l_ i -iii-llT.-_ !
LI_ r'n Right
III w,_o,,:l__i_i,1Ill_, i Ir_i$i_P_-_;d]_
PIoUet
I N,,,_=I
5Ma_ [_
I"-i_7_ii"f_"'"i
i_-_,-_o !25 Max [_
.................... EL ........
...... Pro_ Y
i-t_-_ .............l.i_..%mi,,_ !Ii__ii_i%- !_6_,_ I
VS
rm_ rm_
H
xnn............................_.................................LI_LLL.......................................................
Shock
m/mo
Mach
_'pO
T/TO
r/tO
1 5 10
- I J_
i III
Version 2.0
Fig. 7 Successive wedge problem.
12
NASA-Lewis VU-SHOCKS
Left [] Right
t.i it
i wedg_,:l_single I I_ Do_ III Opposedl "_
PlotLer
i _e6_T_ I
25 Max E] X
Probe
li _iCP_,s I _ D_,_ ...........I
vs
H
El3------
Left [] Right
Sho_k
_pto
Mach
p/pO
T/TO
r/rO
Answer
/
Questions and Answers I
Version 2.0
Fig. 8 Opposed wedge problem.
]3
NASA-Lewis VU-INLET
F_ Sln_em: _/
iiiiiiii i i ii i i iiiii i
ii i iii i
Special :
eyp,,-s[_ []
I
.m _l'_a____lrm-_,;---._I.................Perfomum_ : Zone
M_ I!...1:e.4.J!.....................................IM_ z!_.__-3_".............................................................l
Shock!_:e3!! .....................................................................................................[
_i o.sss ..................
p2/pl!.I:_.!L...............................I.
T_T_!Z_JL. ..............................................................I.
I I I II I III IIIII I II I
InletPerformance
Drag S_oersonic Subsonic Engine Fate
.............................................................................................................. L............ 11.........I ....................
Version 2.0
Fig. 9 External compression inlet.
]4
NASA-Lewis VU-INLET
Angle Lengt_
Number
• An_,e _
×-_o _ [:_Ang,e_ _-------_
rri
Cowl Lip
..i_-,o_ _..--_s,...,=,x-..o_ _.--=",,_ne_.=x-__ _ []
Y-',,o_ _"--=
.................. LL..I......................................I.......................................................L..........J..J.............
...... =_,_,_onIr_v=_........Ia .....I.......I .............
Fig. 10 Mixed compression inlet.
15
Form Approved
REPORT DOCUMENTATION PAGE OMBNo.0704.0188
Public reportingburden for this collectionof informationis e_;tirnated1o average 1 hour per response, includingthe time 1orreviewinginslruclions,searchingexisting data sourco$,gatheringand maintainingthe data needed, and con'_ing and reviewingthe collection of information. Send comments regardingthis burdenestimate or any ether aspect of thiscollection ol information,includingsuggestions for reducing this burden, 1oWashingtonHeadquartersServices. Directoratefor IntorrnationOperations and Reports, 1215 JeffersonDavis Highway, Suite 1204, Arlington,VA 22202-4302. and 1o the Office of Management and Budget,Paperwork ReductionProject(0704-0188). Washington. De 20503.
1. AGENCY USE ONLY (Leave blank) 2. REPORT DATE 3. REPORT TYPE AND DATES COVERED
December 1994
4. TITLE AND SUBTITLE
Interactive Computer Graphics Applications for Compressible Aerodynamics
s. AUTHOR(S)Thomas J. Benson
7. PERFORMINGORGANIZATIONNAME(S)ANDADDRESS{ES)
National Aeronautics and Space AdministrationLewis Research Center
Cleveland, Ohio 44135-3191
9. SPONSORING/MONITORINGAGENCYNAME(S)ANDADDRESS{ES)
National Aeronautics and Space AdministrationWashington, D.C. 20546-0001
Technical Memorandum
5. FUNDING NUMBERS
WU-505-62-52
8. PERFORMING ORGANIZATION
REPORT NUMBER
E-9279
10. SPONSO_NG/MONITORINGAGENCY REPORT NUMBER
NASA TM- 106802AIAA-95-0119
11. SUPPLEMENTARYNOTES
Prepared for the 33rd Aerospace Sciences Meeting sponsored by the American Institute of Aeronautics and Astronautics,Re,no, Nevada, January 9-12, 1995. Responsible person, Thomas J. Benson, organization code 2670, (216) 433-5920.
12a. DISTRIBUTION/AVAILABILITY STATEMENT
Unclassified -Unlimited
Subject Category 61
This publication is available from the NASA Center for Aerospace Information, (301) 621--0390.
12b. DISTRIBUTION CODE
13. ABSTRACT (Maximum 200 words)
Three computer applications have been developed to solve inviscid compressible fluids problems using interactivecomputer graphics. The first application is a compressible flow calculator which solves for isentropic flow, normalshocks, and oblique shocks or centered expansions produced by two dimensional ramps. The second application couplesthe solutions generated by the first application to a more graphical presentation of the results to produce a desk topsimulator of three compressible flow problems: 1) flow past a single compression ramp; 2) flow past two ramps in series;and 3) flow past two opposed ramps. The third application extends the results of the second to produce a design tool
which solves for the flow through supersonic external or mixed compression inlets. The applications were originallydeveloped to run on SGI or IBM workstations running GL graphics. They are currently being extended to solve addi-tional types of flow problems and modified to operate on any X-based workstation.
14. SUBJECTTERMS
Computer graphics; Software; Aerodynamics
17. SECURITY CLASSIFICATION
OF REPORT
Unclassified
NSN 7540-01-280-5500
18. SECURITY CLASSIFICATION
OF THIS PAGE
Unclassified
19. SECURITY CLASSIFICATIONOF ABSTRACT
Unclassified
15. NUMBER OF PAGES
1516. PRICE CODE
A03
20. LIMITATION OF ABSTRACT
Standard Form 298 (Rev. 2-89)
Prescribed by ANSI Std. Z39-18298-102

_ <o_ _._-
._ o°_ -.® .-r'O .,_ 0
o _z _
e-
3