Embed Size (px)
Citation preview

InteractiveData Analysis
Jeffrey HeerStanford University

Node-link

Matrix

Matrix

Acquisition
Cleaning
Integration
Modeling
Visualization
Presentation
Dissemination

Acquisition
Cleaning
Integration
Modeling
Visualization
Presentation
Dissemination

How do people create visualizations?
Chart TypologyPick from a stock of templatesEasy-to-use but limited expressivenessProhibits novel designs, new data types
Component ArchitecturePermits more combinatorial possibilitiesNovel views require new operators, which requires software engineering.

Today's first task is not to invent wholly new [graphical] techniques, though these are needed. Rather we need most vitally to recognize and reorganize the essential of old techniques, to make easy their assembly in new ways, and to modify their external appearances to fit the new opportunities.
John W. TukeyThe Future of Data Analysis, 1962

Protovis: A Language for Visualization
A graphic is a composition of data-representative marks.
with Mike Bostock & Vadim Ogievetsky

Area Bar Dot Image
Line Label Rule Wedge
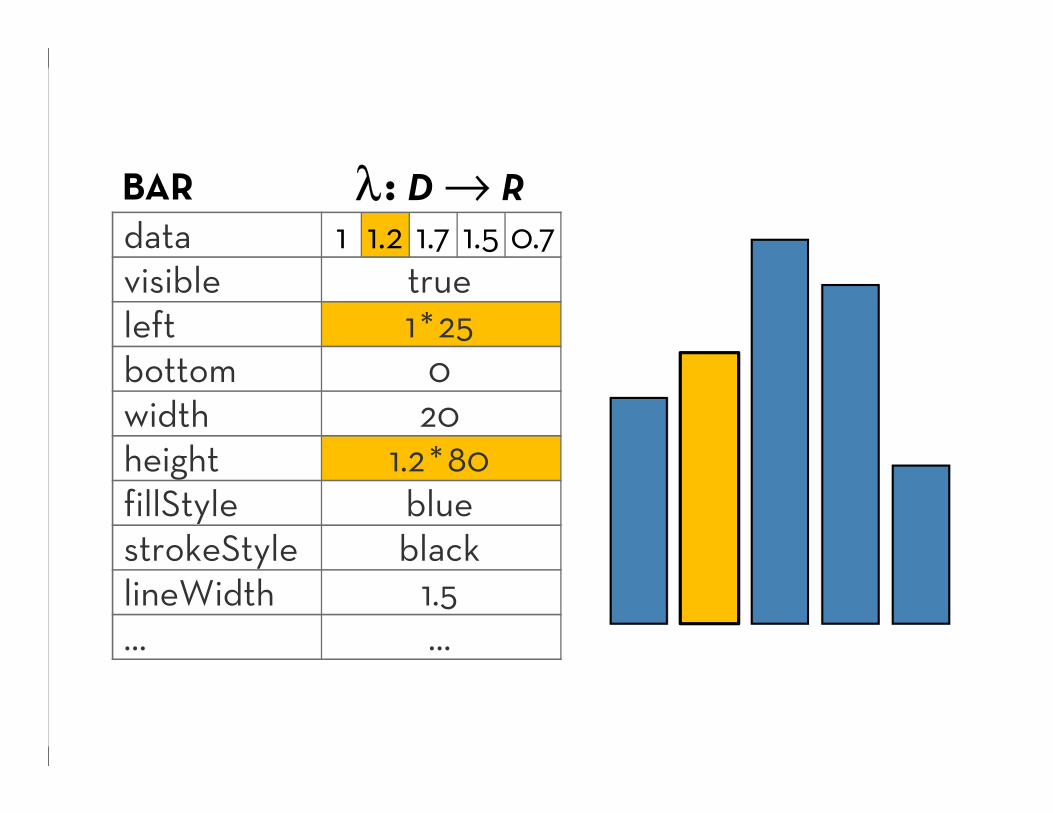
MARKS: Protovis graphical primitives

data λvisible λleft λbottom λwidth λheight λfillStyle λstrokeStyle λlineWidth λ… λ
λ: D → RMARK

datavisibleleftbottomwidthheightfillStylestrokeStylelineWidth…
λ: D → RBAR
trueλ: index*25
020
λ: datum*80blueblack
1.5…
1 1.2 1.7 1.5 0.7

datavisibleleftbottomwidthheightfillStylestrokeStylelineWidth…
λ: D → RBAR1 1.2 1.7 1.5 0.7
true0*25
020
1*80blueblack
1.5…
datavisibleleftbottomwidthheightfillStylestrokeStylelineWidth…
λ: D → RBAR1 1.2 1.7 1.5 0.7
true1*25
020
1.2*80blueblack
1.5…

datavisibleleftbottomwidthheightfillStylestrokeStylelineWidth…
λ: D → RBAR1 1.2 1.7 1.5 0.7
true2*25
020
1.7*80blueblack
1.5…

datavisibleleftbottomwidthheightfillStylestrokeStylelineWidth…
λ: D → RBAR1 1.2 1.7 1.5 0.7
true3*25
020
1.5*80blueblack
1.5…

datavisibleleftbottomwidthheightfillStylestrokeStylelineWidth…
λ: D → RBAR1 1.2 1.7 1.5 0.7
true4*25
020
0.7*80blueblack
1.5…

datavisibleleftbottomwidthheightfillStylestrokeStylelineWidth…
λ: D → RBAR
trueλ: index*25
020
λ: datum*80blueblack
1.5…
1 1.2 1.7 1.5 0.7

var vis = new pv.Panel();vis.add(pv.Bar).data([1, 1.2, 1.7, 1.5, .7]).visible(true).left(function() this.index * 25);.bottom(10).width(20).height(function(d) d * 80).fillStyle(“blue”).strokeStyle(“black”).lineWidth(1.5);
vis.render();

vis.add(pv.Rule).data([0,-10,-20,-30]).top(function(d) 300 - 2*d - 0.5).left(200).right(150).lineWidth(1).strokeStyle("#ccc").anchor("right").add(pv.Label)
.font("italic 10px Georgia")
.text(function(d) d+"°").textBaseline("center");
vis.add(pv.Line).data(napoleon.temp).left(lon).top(tmp) .strokeStyle("#0")
.add(pv.Label).top(function(d) 5 + tmp(d)).text(function(d) d.temp+"° "+d.date.substr(0,6)).textBaseline("top").font("italic 10px Georgia");
var army = pv.nest(napoleon.army, "dir", "group“);var vis = new pv.Panel();
var lines = vis.add(pv.Panel).data(army);lines.add(pv.Line).data(function() army[this.idx]).left(lon).top(lat).size(function(d) d.size/8000).strokeStyle(function() color[army[paneIndex][0].dir]);
vis.add(pv.Label).data(napoleon.cities).left(lon).top(lat).text(function(d) d.city).font("italic 10px Georgia").textAlign("center").textBaseline("middle");

Productivity - Faster Design Cycle, Less CodeComparison: 5x less code, 10x less dev time
Portability - Multiple ImplementationsJavaScript, Adobe Flash, Java/JVM
Performance - Optimization (in Protovis-Java)Just-in-time compilation; parallel executionHardware accelerated renderingUp to 20x scalability boost over prior toolkits

Interactive Graph Layout (Quad-Core MacPro)
20x20x
Graph Size (# Nodes, # Edges)
Fram
es p
er S
econ
d (f
ps)

d3.js Data-Driven Documents
with Mike Bostock & Vadim Ogievetsky

GitHub Rank…
12th most watched project on GitHub


d3 d3

Acquisition
Cleaning
Integration
Modeling
Visualization
Presentation
Dissemination

Acquisition
Cleaning
Integration
Modeling
Visualization
Presentation
Dissemination


I spend more than half of my time integrating, cleansing and transforming data without doing any actual analysis. Most of the time I’m lucky if I get to do any “analysis” at all.
Anonymous Data Scientistfrom our interview study, 2012

The Elephant in the Room

DataWrangler
with Sean Kandel, Philip Guo, Ravi Parikh, Andreas Paepcke & Joe Hellerstein

Wrangler in 2 Parts…
1. Declarative data transformation languageTuple mapping – split, merge, extract, deleteReshaping – fold, unfold (cross-tabulation)Lookups & joins – e.g., FIPS code to US stateSorting, aggregation, etc.
Informed by prior work in databases:Potter’s Wheel, SchemaSQL, AJAX

Wrangler in 2 Parts…
1. Declarative data transformation language
+2. Mixed-initiative interface for data transforms
User: Selects data elements of interestSystem: Suggests applicable transforms via
search over the space of viable transformsEnable rapid preview and refinement

Comparative Evaluation with Excel
Median completion time for Wrangler at leasttwice as fast in all tasks (p < 0.001).Suggestions and visual previews used heavily.
Extract
Impute
Reshape

Acquisition
Cleaning
Integration
Modeling
Visualization
Presentation
Dissemination

Acquisition
Cleaning
Integration
Modeling
Visualization
Presentation
Dissemination

GraphPrismwith Sanjay Kairam, Diana MacLean & Manolis Savva [AVI’12]

Stanford Dissertation Browserwith Jason Chuang, Dan Ramage & Chris Manning [CHI’12]

Stanford Dissertation Browserwith Jason Chuang, Dan Ramage & Chris Manning [CHI’12]

Termite Topic Model Viewerwith Jason Chuang & Chris Manning [AVI’12]

Acquisition
Cleaning
Integration
Modeling
Visualization
Presentation
Dissemination


InteractiveData Analysis
http://vis.stanford.edu