Embed Size (px)
Citation preview
Interactive Graphics Development (IGD):
A framework for studying innovative visual story forms
Abstract: There is considerable scholarship defining unique features of digital storytelling and on interactive content for online newspapers. However, little scholarship exists that provides theoretical and practical analysis of the creation of interactive graphics. This paper establishes the Interactive Graphics Development framework, a theoretical model for researchers studying the effectiveness of interactive graphics and their potential in storytelling. The IGD also standardizes definitions for interactive graphics and provides a touch point for journalists refining nonlinear storytelling.
Interactive Graphics Development (IGD): A framework for studying innovative visual story forms
2
Introduction
The number of unique visitors to news and information sites grew 9.25 percent in
2009 (Pew Center for Excellence in Journalism, 2010) and three-quarters of U.S. adults
(nearly 171 million people) told researchers they read a newspaper, either in print or
online during the past week (Scarborough Research, 2009). However, there is cause for
caution; younger readers are increasingly dissatisfied with traditional news delivery and
prefer nonlinear storytelling forms in greater numbers than those who are older (Jones,
2009).
This trend isn’t surprising when one considers that “digital natives” – those born
in the 1990s and beyond – think and process information differently and are maturing in a
world full of digital cameras, computers, cell phones, and video games (Prensky, 2001).
“Digital Natives are used to receiving information really fast. They like to parallel process and multi-task. They prefer their graphics before their text rather than the opposite. They prefer random access (like hypertext). They function best when networked. They thrive on instant gratification and frequent rewards. They prefer games to ‘serious’ work” (Prensky, 2001, p. 2).
What is surprising is that journalists are not fully addressing this trend and capitalizing on
it to build their future audience. The 2009 State of the News Media Report from the Pew
Project for Excellence in Journalism reported that when online journalists were asked
what the Web does particularly well, 91 percent of respondents named some aspect of
technology such as interactivity and data visualization. However, only 16 percent cited
new forms of storytelling and just 12 percent mentioned reporting depth. (Pew Project
for Excellence in Journalism, 2009). In short, journalists are focusing on the technology
itself rather than on how best to use it to tell stories and add context. This is a serious
Interactive Graphics Development (IGD): A framework for studying innovative visual story forms
3
disconnect for journalists who should be using techniques such as interactive graphics
and nonlinear storytelling to deliver quality content to evolving audiences.
Yaros (2009) suggests that journalists should create new structures for online
news and posits that they should strive for contiguity – a process by which journalists
strategically add multimedia elements at the place that they are most relevant in a story
and most useful to the consumer. This paper will propose a similar approach be applied to
the creation of interactive graphics. Some editors have argued that newsrooms should not
devote resources to interactive graphics because they often require a large time
commitment and specialized skills, and in the end, the resource drain is not worth the
payoff. In other words, interactives often don't equal increased "hits" on the Web site.
According to Scott Goldman, Senior Editor/Visuals at The Indianapolis Star, “There's a
huge push-back on how much time and manpower it takes to create interactives. There
are also issues with the metrics. A lot of sites don't know how to count Flash graphics. …
They see, say, 1,000 page views on a graphic that took a week or more to complete, and
ask, why?” (personal communication, March 25, 2010). However, this thought process is
a bit like the circular metaphor of the chicken and the egg. If journalists fail to create
interactive graphics, there can be no payoff; this storytelling technique won’t gain
traction and “digital natives” and other potential users will seek content elsewhere.
Although there is considerable scholarship defining digital storytelling in terms of
its unique features (Paul & Fiebich, 2005) and on interactive features of online
newspapers (e.g. Chung, 2008; Greer & Mensing, 2006; Rosenberry, 2005; Schultz,
1999) there currently is little scholarship that provides both a theoretical and practical
analysis of the process surrounding creation of interactive graphics. To date, most of the
Interactive Graphics Development (IGD): A framework for studying innovative visual story forms
4
research surrounding interactive graphics on news sites comes in the form of content
analyses that address how, when and how often they are used. While these are certainly
valuable studies, they only scratch the surface of interactive graphics as storytelling
devices. In-depth research requires a clear set of definitions that are universally used in
the academy, industry and classroom. With a solid framework in place, researchers can
more effectively explore interactive graphics typology, user experience, levels of
effectiveness and best practices in development, to name a few. This paper will help fill
that void by providing a framework for researchers studying the effectiveness of
interactive graphics and their potential in storytelling. In addition, this framework will
assist working journalists who strive to refine their nonlinear storytelling techniques.
The interactive Graphics Development (IGD) framework outlined in this paper
was created after a careful examination of the work of news organizations that have
committed time and resources to interactive graphics, such as The New York Times, the
South Florida Sun-Sentinel, the Detroit News, the Los Angeles Times, USA Today and
MSNBC.com. The framework is composed of two phases: Story Evaluation and Story
Form Selection. The Story Evaluation phase is divided into points of analysis that center
on the following three areas: news values, objectives and audience. At each point editors
must apply journalistic standards and practices to determine if a story is worthy of
placement on the budget and worthy of the time needed to complete an interactive
graphic. The Story Form Selection phase defines five types of interactive presentations–
instructives, narratives, data visualizations, simulations, and serious games–and provides
evaluative measures to determine how and when they are best used.
Interactive Graphics Development (IGD): A framework for studying innovative visual story forms
5
Phase One: Story Evaluation
Story evaluation: News values
Academics from diverse fields have long studied news values and have produced
seminal work, especially in terms of gatekeeping (White, 1950; Gans, 1979) and agenda
setting (Tuchman, 1978). Other scholars (Galtung & Ruge, 1965; Bell, 1991) and
journalism textbook authors (Brooks, Kennedy, Moen, & Ranly, 2007) have developed
lists of characteristics that provide a method for studying how news is evaluated.
Although there is considerable debate in academic literature over how news is selected,
no single taxonomy has emerged to guide journalists or researchers who strive to
understand the process, perhaps because it is difficult to analyze human behavior and
because real-world events have many variables and can be complex. Braun (2009) notes
that lists of news characteristics that appear in academic literature often “tell us more
about the people studying and critiquing journalism than about journalists themselves:
researcher-typifications, not actor-typifications. Such typifications run a high risk of
proving specious when applied to journalists themselves” (p. 23).
Nonetheless, when editors learn of a story, they must evaluate it and establish its
newsworthiness. They often use traditional elements that include conflict, significance,
prominence, proximity, timeliness and novelty (Brooks, Kennedy, Moen, & Ranly,
2007). Conflict in news stories may center on overt actions such as a battle or war, crimes
and human struggles against nature (e.g. earthquakes and tornadoes). Conflict also may
be present in a clash of ideas or a psychological struggle such as depression. Significance
– or threshold as defined by Galtung & Ruge (1965) – refers to whether a story has
impact on the lives of the audience. A cure for cancer or record-high gasoline prices each
Interactive Graphics Development (IGD): A framework for studying innovative visual story forms
6
would have great significance. Significance generally increases in direct proportion to the
number of people a particular story affects. Prominence is defined as stories about well-
known people, places or things, e.g. President Obama, Paris, or an iPod. Editors value
news that has proximity because they can target the geographic location of their audience.
A school board decision that affects students in the city in which the news organization
publishes is of more interest than a school board decision on the other side of the state.
Journalists often define news as what is happening “now” or in the “immediate future.”
Conversely, if it happens in the past, it’s history. That philosophy gives import to the
concept of timeliness. Novelty – or unexpectedness as defined by Galtung & Ruge (1965)
– is associated with events or developments that are out of the ordinary or unusual, e.g.
the cliché of dog bites man is not news, while a man who bites a dog is news. Some
scholars also combine novelty with human interest, those stories that tug at the
heartstrings.
Just as one can identify these news characteristics in text-based stories, the
characteristics also are and should be present in interactive graphics, e.g. an interactive
timeline that outlines the life and contributions of a prominent politician who has died
(prominence); a photo-driven exploration that allows users to examine the ocean’s
strangest creatures (human interest) or an interactive map that displays the number and
location of homicides in a city (conflict).
An interactive “game” may allow voters to analyze the stance of candidates for
president (significance) and an animation can follow the flight path of an airplane forced
to make an emergency landing (timeliness). A data visualization can display information
depicting the location of vacant homes in an area and the reasons why they exist

Interactive Graphics Development (IGD): A framework for studying innovative visual story forms
7
(proximity). All these examples contain different levels of interactivity and complexity,
which will be addressed in part two of the IGD framework.
However, significance has particular importance when evaluating news for
interactive storytelling – especially projects with higher levels of interactivity.
Significance, by definition, suggests that a large number of people may be affected by a
story. In terms of time management, the greater the impact, the more justification for the
minutes or hours needed to produce the interactive elements. Economically, more interest
equals increased page views and potentially more time spent on a news organization’s
Web site, both of which can translate into increased revenue from advertisers.
As noted earlier, timeliness (as in what is happening “now” or in the “future”) is
an important element of how news is defined. When considering the potential for
interactive graphics, however, editors also need to look at stories with longer life spans
(longevity). In other words, more effort and time should be spent on interactive elements
that will exist for more than one news cycle. For example, stories on elections,
complicated court trials and health epidemics have the potential to remain on a site for
days, months or even years – and that means the interactive graphic may reach a larger
audience. It also is likely that fresh material could be added continually to the core
graphic, increasing efficiency. Longevity also can be applied to interactive elements
defined as “evergreen,” e.g. a mortgage calculator that could be associated with various
stories about the economy or home buying.
In summary, the IGD framework suggests that editors judging the interactive
potential of a story should first consider and rate the traditional news characteristics of
significance, prominence, proximity, conflict, novelty/human interest and timeliness and
Interactive Graphics Development (IGD): A framework for studying innovative visual story forms
8
select stories that rate highly in these areas (see Table 1). Because of the time needed to
produce most interactive graphics, increased importance should be placed on stories with
significance. Additional consideration also should be given to interactive graphics that
could potentially have longevity.
Story evaluation: Objectives
Before beginning a project, interactive news designers must have clearly defined
objectives both for themselves and the project. Journalistic goals are closely tied to how
journalists see their professional roles. There is no dearth of academic scholarship on the
role of the press; however, technological and economic changes have forced scholars to
rethink the important work of those such as Siebert, Peterson and Schramm (1956),
whose Four Theories of the Press (authoritarian, libertarian, social responsibility and
Soviet Communist) long dominated scholarly literature in journalism. Recent significant
work includes that of Christians, Glasser, McQuail, Nordenstreng, & White (2009) who
developed three levels of analysis – normative traditions, models of democracy and roles
(monitorial, facilitative, collaborative, radical) of media (p. 16). In the monitorial
(surveillance) role, journalists find and publish objective and reliable news accounts, act
as a conduit for news and information and set the agenda. The facilitative role allows
journalists to support community formation and citizen participation with government,
while the collaborative role requires media cooperation with external agencies to meet the
wider needs of society. The radical role allows journalists to act as adversaries in relation
to authority or to advocate for a minority group (Christians et al, 2009). McNair (2005)
describes journalism roles as 1) a “supplier of information,” 2) a “resource for, support to
Interactive Graphics Development (IGD): A framework for studying innovative visual story forms
9
and often participant in public life and political debate,” and 3) a “medium of education,
enlightenment and entertainment” (p. 28). The journalistic role also is related to the
philosophy of the news organization through which the interactive will be viewed. Some
legacy media Web sites might prefer approaches that are rooted in traditional definitions
of objectivity, while editors at upstart online-only publications or blogs might not hesitate
to produce elaborate interactive stories that align with their own political views and have
a persuasive intent. Editors also could choose to place an interactive graphic with a point-
of-view on an opinion page. There is no right or wrong approach; however, role
identification is necessary when evaluating whether resources should be devoted to
producing interactive content. One question to ask is: What is the journalstic
role/objective for our news organization and can it be achieved by creating interactive
content for this story?
The objective for a distinct interactive product should be more specific and should
be user-driven. Journalists can learn from video games – another highly interactive
storytelling form. Game designers are trained to clearly state the objective of the game
before the game is fully developed and to draw a distinction between objective and
outcome. For example, Fullerton, Swain, & Hoffman (2004) note that when someone
reads a book, generally there is not a clear-cut objective for the experience; readers set
their own objectives. In the child’s card game, Go Fish, they note, the player’s objective
is to collect sets of cards by taking them from other players. Any number of players may
successfully create sets as the game progresses, but the outcome is determined by who
creates the most sets. When applied to the creation of interactive graphics, the objective
may be to plot the number of homicides in any given area, but the outcome will be rooted
Interactive Graphics Development (IGD): A framework for studying innovative visual story forms
10
in what the user takes away from the story and is able to apply to his or her life in a
meaningful way.
Games are powerful education tools that have been underutilized by journalists
even though the discussion of educational potential for games spans more than 30 years.
Motivated by a desire to make learning fun, many educators and game developers have
found success by applying game narrative strategies to subjects such as math, science and
history, to name a few. And several studies have shown that simulation brought about by
games accelerates learning (de Freitas, 2006), enables knowledge transfer (Banerjee &
Stone, 2007), and provides experiential opportunities not available in the traditional
classroom setting (Jackson, 2008). Thus “simulation and game environments focus
learning not simply on the knowing of facts, but on the using of facts and ideas”
(Jackson, 2008).
This concept is beginning to grow roots in journalism and multimedia. In their
film, “Playing the News,” Plunkett and Mehta (2006) profile Kuma War, the first video
game company to translate real-world stories of war into a video game experience. The
game is based on the November 2004 U.S.-led attack on the Iraqi "terrorist stronghold" of
Fallujah. The documentary explores whether video games have a place in serious
journalism and whether they “represent the future of journalism or the dangerous blurring
of news and entertainment.” Likewise, in 2007 Paul and Hansen launched the Knight
News Challenge project “Playing the News” (unrelated to the film project previously
discussed), a project intended to “create a toolset that would make the creation of a news
simulation environment/game space easy for a somewhat motivated newsroom.”
Interactive Graphics Development (IGD): A framework for studying innovative visual story forms
11
In summary, editors determining whether an interactive graphic is needed should
be able to relate the journalistic goal of their organization to the specific objective and
outcome for the interactive graphic. Furthermore, journalists should draw from game
design theory and educational models to produce effective interactive content.
Story evaluation: Audience
Many journalists are trained to “know” their audiences. At the macro level, this
means that they know their communities’ demographics and have a clear idea of who is
consuming their news product. This data generally is available through research
(company, trade, consultant), census data and/or focus groups. This mantra likely takes
on increased importance in the creation of interactive graphics. Jones (2009) studied three
online video and interactive storytelling strategies and concluded that preferences, not
surprisingly, may be tied to the age of the audience. The study, although based on a small
sample size, found that users between the ages of 18 and 24 preferred a nonlinear format
and navigated through the story in unpredictable ways. Those over the age of 55
navigated in a traditional manner (starting in the upper right corner of the page and
moving steadily downward) even when they explored content offered in a nonlinear
format.
With this information in mind, editors should also consider their audience at the
micro (story level). If a story has appeal only to an older audience, it might not be time
efficient or effective to create interactive graphics with unconventional or complicated
nonlinear elements. Conversely, a story that appeals to the “digital natives” might merit a
game-like approach that integrates elements from many sources (including social media)
Interactive Graphics Development (IGD): A framework for studying innovative visual story forms
12
and encourages a nonlinear, personal exploration of a topic or story. Age obviously is not
the only audience factor that could affect the decision making process, but it does
illustrate the importance of knowing your core audience (macro) as well as the appeal of
a given story (micro).
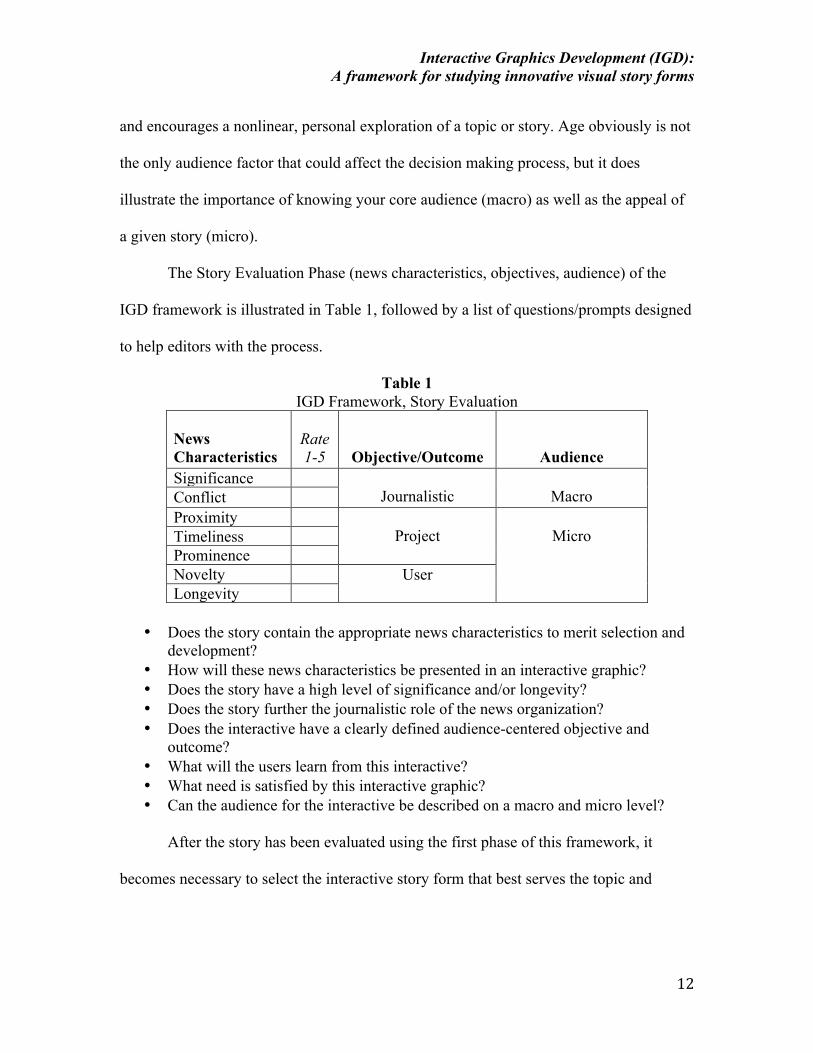
The Story Evaluation Phase (news characteristics, objectives, audience) of the
IGD framework is illustrated in Table 1, followed by a list of questions/prompts designed
to help editors with the process.
Table 1 IGD Framework, Story Evaluation
News Characteristics
Rate 1-5
Objective/Outcome
Audience Significance
Journalistic
Macro Conflict Proximity
Project
Micro Timeliness Prominence Novelty User Longevity
• Does the story contain the appropriate news characteristics to merit selection and
development? • How will these news characteristics be presented in an interactive graphic? • Does the story have a high level of significance and/or longevity? • Does the story further the journalistic role of the news organization? • Does the interactive have a clearly defined audience-centered objective and
outcome? • What will the users learn from this interactive? • What need is satisfied by this interactive graphic? • Can the audience for the interactive be described on a macro and micro level?
After the story has been evaluated using the first phase of this framework, it
becomes necessary to select the interactive story form that best serves the topic and

Interactive Graphics Development (IGD): A framework for studying innovative visual story forms
13
audience. Thus, the Story Form Selection Phase defines various interactive presentations
and helps determine how and when they are best used.
Phase Two: Story Form Selection
In a 2007 article in Design magazine, Don Wittekind noted that small newspapers
significantly lag behind larger newspapers in the sophistication and prevalence of
multimedia and interactive content. Likewise, that same year, the Pew Project for
Excellence in Journalism reported that only six of the 38 news sites it analyzed for
multimedia content offered a rich range of media formats. And on nearly half of the sites
(17) more than 75% of the content was in the form of narrative text. According to
Wittekind, a former South Florida Sun-Sentinel graphics director and multimedia
graphics pioneer, “as news organizations strive to produce ever more multimedia while
expending increasingly less effort, the immersive interactive graphic has become
somewhat of an endangered species” (p. 39). But Wittekind also argues that although
interactive multimedia graphics can be time consuming to create and require specialized
software skills on the part of their producers, they are the types of content most capable
of taking full advantage of the Web’s strengths as an interactive medium. More recent
studies have shown that not much has changed since Wittekind’s assessment. A few
newspaper Web sites, such as nytimes.com, sun-sentinel.com, and washingtonpost.com
have been prolific producers of interactive graphics and data visualizations and have
experimented with combining game strategies with journalistic storytelling (Paul &
Hansen, 2008), but the adoption of interactive news elements on most newspaper and
television station Web sites is still marginal (Pew Project for Excellence in Journalism,
Interactive Graphics Development (IGD): A framework for studying innovative visual story forms
14
2009).
Wittekind asserts that video and linear animations “can be handled by other media,
and none of them take full advantage of all the Internet has to offer. But the interactive
graphic – and the key word here is ‘interactive’ – is something that is unique to the Web”
(p. 39). If this is true, then many news Web site editors clearly are missing out on a very
powerful storytelling form. Yet if we are truly to understand what we’re missing, we
must first attempt to narrowly define different types of interactive graphics. It’s important
to note that as a graphic migrates to the Web, the potential for animation and interactivity
fundamentally change the structure and navigation. Maps, charts and diagrams are still
the basic starting points for online graphics. However, Web graphics go a step further by
providing a more immersive user experience. Online graphics can be presented in a
nonlinear fashion. They can simulate real world experiences and employ game strategies.
And they can implement sound and animation to enrich understanding and better reflect
reality.
For the purposes of this exposition, interactive graphics are divided into five main
categories: instructives, narratives, simulations, serious games and data
visualizations. The first three categories–instructives, narratives and simulations–were
first conceptualized by Rajamanickam and Nichani (2003), and the second two
categories–serious games and data visualizations– were added because of the recent
evolution of journalistic interactives. These definitions are important because they
provide a concrete framework for journalists who wish to produce them and scholars who
wish to study them. The definitions also offer journalists a common vocabulary that can
be regularly used in the newsroom to identify methods of storytelling. After all, being
Interactive Graphics Development (IGD): A framework for studying innovative visual story forms
15
able to clearly communicate the goals for a story package is often half the battle. For
scholars, the definitions provide a clearer typology on which to base future studies that
address user behavior, storytelling techniques and journalistic practice.
Instructives explain how something happens or how something works by
enabling the user to sequentially step through the visual and textual content of the
graphic. Instructives are good for showing processes, such as how a tornado forms or
how to get your home ready to sell. They are immersive because they allow users to click
through at their own pace, however the sequence of events is generally predetermined.
Instructive graphics often are divided into discreet “scenes” and the user can click a
“next” or “back” button to navigate from scene to scene. Instructive graphics generally
are the least time-consuming to create because interactivity and animation are relatively
simple. In fact, with very basic HTML or Adobe Flash skills, a journalist could quickly
turn a simple diagram initially created for print into an instructive graphic for the Web.
Narratives are much like video in that they allow the viewer to watch an
animated explanation of a process or event. Narratives combine audio voice-over with
graphic depth and rich animation. For example, in 2005, msnbc.com created a narrative
graphic to explain the rise and fall of Enron. At first, assessing the graphics potential for
such a story might seem daunting. However, in this case, the narrative graphic format
provided msnbc.com with a unique and simple way to explain an extremely complex
chronology. Because narratives involve very little interactivity, it is important that the
animation be dynamic and relatively constant. If too much time passes with little or no
animation, the user is likely to lose interest in the graphic. Thus, when journalists are
deciding whether a topic would make a good narrative graphic, they should consider

Interactive Graphics Development (IGD): A framework for studying innovative visual story forms
16
whether the illustrative portions of the graphic have enough animation potential. Good
narrative topics include how a space shuttle launches or describe the phases of the moon
because they have great potential for animation and can be explained succinctly and
simply. Depending on the level of animation, narratives can be more time-consuming
than instructives. More knowledge of how to execute animations using a program such
as Adobe Flash is necessary.
Simulations represent real-world phenomena. Highly immersive simulations
allow the user to experience an activity that resembles its real world equivalent. In 2001,
for example, the South Florida Sun-Sentinel created a simulation graphic called
“Hurricane Maker” that helped users understand the conditions present during a
hurricane. By allowing the user to choose the location of a storm over a body of water
and then change wind conditions and humidity levels, the creators were able to illustrate
hurricanes from a much more tangible perspective. It is important to note that only topics
that are effectively reenacted using a computer interface are suitable for simulations.
When you encounter experiences that are difficult to replicate on a computer, an
instructive graphic may be more appropriate. The complexity of a simulation depends on
how much programming is necessary for it to function. Engaging simulations can be
achieved using many different application types, including Adobe Flash, JavaScript and
HTML.
Serious games are like simulations in that they offer a highly immersive,
interactive experience. However, they go a step further by actually applying traditional
gaming strategies to serious storytelling. The idea is that the more you can immerse a
user in the graphic, the more he or she will learn and stay engaged. Serious games are
Interactive Graphics Development (IGD): A framework for studying innovative visual story forms
17
very complex because they must be both journalistically accurate and appropriately
serious in tone, illustration and content, and at the same time be fun, engaging and worth
playing. Likewise, they must effectively employ game strategies, such as having a
storyline that pulls the user through the game. They must also make room for winning
and losing or offer some “payoff” in the end. Serious games must explain the rules of
play, as well as employ tasks that are reasonably achieved using a computer interface.
Perhaps one of the most well known serious games is titled “Darfur is Dying.” Intended
to provide a window into the experience of Darfurian refugees in the Sudan, “Darfur is
Dying” is a viral video game in which players take on the persona of a refugee and must
perform daily life tasks while constantly threatened by militia attackers. Players can also
access information about the Darfur genocide responsible for more than 400,000 deaths,
as well as ways to get involved with humanitarian efforts in the region. Serious games are
commonly combined with other multimedia story packages as a means for journalistic
reporting outside the actual game. For example, a graphics package about a day in the life
of an American soldier combines simple games that allow the user to complete daily
tasks, such as assembling a rifle or searching for IEDs with updated news stories and
other content about ongoing wars in the Middle East. Games are often the most time-
consuming types of interactive graphics because levels of interactivity, animation and
programming are often high.
Data visualizations combine databases with interactive maps, charts and
diagrams to help users visualize complex information. Although they are based on hard
numbers, data visualizations can be the most beautiful, creative interactive graphics. Data
visualizations can come in the form of maps such as The New York Times’ periodically
Interactive Graphics Development (IGD): A framework for studying innovative visual story forms
18
updated “Geography of a Recession” or innovative charts like The Washington Post’s
“POTUS Tracker” an interactive database that provides a visualization of how President
Obama spends his time, what issues are getting the most attention and who is influencing
the debate. They can even be graphically enhanced searchable databases like the Sun-
Sentinel’s mall crimes database. And even more important than the visual display of data
is the ability to understand and effectively synthesize it. In the case of the mall crimes
database, Sun-Sentinel compiled data based on the examination of more than 22,000
police reports. They found that more than 500 cases were violent crimes and cataloged
the details in a spreadsheet. That data was then handed off to a graphics reporter and
multimedia director to design and develop the Flash-based database and accompanying
information graphics. Often, the amount of time it takes to create a rich data visualization
depends on how much data analysis must be done. This has less to do with the production
of the graphic itself and more to do with the amount of research and reporting that are
required. Data visualizations can be created using Adobe Flash and HTML, as well as
ArcView, a GIS data program.
In summary, clearly defined content types are needed before scholars can study
the effectiveness of interactive graphics in storytelling and before their use can become
widespread among all news organizations. Only after these definitions are in place can
we attempt to determine how interactive graphics are best used and develop strategies for
implementation. Although all interactive graphics begin with planning and
conceptualizing the visual narrative, creating all of the illustrations and graphic elements,
researching and writing explanatory text, and the typical editing processes, there are a
few additional considerations that make interactive graphics a bit more challenging.

Interactive Graphics Development (IGD): A framework for studying innovative visual story forms
19
Specifically, in addition to understanding the key characteristics of each type (as outlined
above), journalists must be able to quickly assess the time commitment associated with
each, as well as how and when they are best used. Therefore, Table 2 provides a guide
for navigating those key considerations.
Table 2: IGD Framework, Story Form Selection INSTRUCTIVE NARRATIVE SIMULATION DATA VIS SERIOUS
GAME Intention To explain a
process or how something occurs or works
To explain a process or how something occurs or works; to show how an event unfolds
To heighten understanding by allowing user to experience a process through the graphic
To help user visualize complex data or statistical information.
To enhance understanding through experiential, immersive story structure
When to use When a process or linear event needs visual explanation; when there’s a question of HOW something happened; when a step-by-step process is explained
When a graphic has high animation potential; when a description requires narrative detail; when explaining a linear process or event; when topic is dynamic/active
When interaction makes sense in the digital space; when simulating an experience helps the user better understand a story or concept.
When a story is complemented by a large, often complex, data set
When game strategies enhance storytelling or offer compelling reason to engage; when “serious play” helps users learn about a subject that affects their lives
Navigation Mostly linear; generally navigated in steps (i.e., each frame represents a step in a process)
Linear; user generally begins with a “start” button and animation plays through automatically
Either linear or nonlinear, depending on the topic
Generally nonlinear; user controls which data are visible at once and can view discrete combinations of data at one time
Often linear in parts (navigation through the game environment) and nonlinear in other (segments that allow the user to make choices)
Level of User Interaction
Low to moderate; aside from navigational interaction, there is little interaction on the part of the user
Low; generally passive viewing experience of animated illustration
Moderate to high, depending on the topic; some simulations can randomly respond to user input; some have predetermined outcomes based on user input
Moderate to high, depending on the topic; interactivity often involves clicking to change visualization of data in chart or map form
High; interactive features allow user to experience a scenario; interactivity is used to engage in significant game play
Potential for Animation
Low to moderate; animations are often simple and segmented
High; animation driven; explanation is in the form of audio narrative that is timed to correspond with the animation
Moderate to high, depending on the topic
Light to moderate, depending on the data set and chosen presentation style
High; animation is often heavy in all aspects of the presentation, including general navigation (i.e., moving through the game)
Time Commitment
Low to moderate, depending on
Moderate to high; static images with audio are boring
Moderate to high; heightened levels of interactivity
Moderate to advanced, depending on
High; heightened levels of interactivity,

Interactive Graphics Development (IGD): A framework for studying innovative visual story forms
20
amount of animation; ranges from no animation to light to moderate animation
and can cause readers to quickly disengage if too much time passes with no animation; complex animation and audio development can be time consuming
and a more involved planning state make sims more time consuming; planning stage can be time consuming; higher levels of interactivity make programming more complex
the complexity of data; can quickly become time consuming if data set is very complex or large and if a database is necessary
complex programming and advanced levels of animation
Discussion
There is no denying the major shift in audience expectations for news content
brought about by the coming of age of the digital native generation. Audiences are
increasingly drawn to content that is interactive, dynamic, immersive and nonlinear. As
news organizations seek ways to better respond to these audience trends, it may become
necessary not only to rethink the ways in which stories are structured, but to rethink how
we define the foundational news values used to assess a story’s interactive potential.
Thus, the two-part IGD framework offered here is intended as a call to action for news
organizations to do just that.
Admittedly, news organizations are increasingly limited in resources, and small
news organizations are especially challenged to find staff with the necessary skill sets and
time to execute the types of interactives outlined in this paper. However, an adjustment in
how we currently think about the assessment and development of interactive stories and
an investment in the necessary resources for doing so will surely pay dividends in the
future. During the late-1980s and early 1990s, newspapers experienced a similar
revolution when page design, graphics reporting and information layering took center
stage as ways to better serve the increasingly visually-savvy audiences of scanners and
samplers. By bringing page design into the newsroom and hiring individuals trained as
Interactive Graphics Development (IGD): A framework for studying innovative visual story forms
21
both journalists and graphic artists, newspapers were able to better serve audiences and
meet the needs of a changing readership. This is no different than when other major
technological advances altered the ways news was delivered and consumed. For example,
newspapers were affected by the advent of radio. Radio was changed by the introduction
of television. And the Internet has turned everything upside down. Thus, rather than
trying to shoehorn traditional newspaper delivery into the online platform, journalists and
educators alike should embrace the rich, interactive potential of the Web by putting
resources toward the types of interactive graphics outlined in this paper.
Although many editors have been quick to dismiss interactive graphics as too time
consuming and lacking in payoff, no studies exist that have actually quantified this
assertion. One reason could be that few online news sites actually publish interactives
regularly enough to study them. And as Goldman noted, because many interactives are
developed in Adobe Flash, standard Web metrics don’t always offer an accurate picture
of the number of “hits” or time spent with interactives by users.
Future research based on the IGD framework would benefit practitioners who are
struggling to develop best practices for interactive storytelling. Researchers, educators
and journalists also could use this model to examine which interactives are most
attractive to users, expand on studies that address user recall of information in graphic
storytelling, and determine whether interactives are more appealing to users than
traditional story forms. Ideally, the results would help news managers support interactive
storytelling that benefits the bottom line and enhances the journalistic mission. Likewise,
due to the relative newness of multimedia storytelling and interactive graphics in
journalism, there exists a need for research into the actual effectiveness of different
Interactive Graphics Development (IGD): A framework for studying innovative visual story forms
22
storytelling forms for different audiences and purposes. This will prove to be a relatively
complex endeavor because there are so many variables involved. The presence of
animation, interactivity, nonlinear formats, visual/verbal and audio/visual combinations–
to name a few–make establishing sound methodology for evaluating effectiveness a
formidable challenge. However, with a framework for defining different types of
interactive graphics in place, we are hopefully one step closer to being able to determine
whether the ability to visualize and manipulate large datasets helps or hinders users’
ability to understand large quantities of complex data. Likewise, future studies should
explore the role of animation, nonlinear presentation, and heightened interactivity in
graphics and whether these features advance storytelling or overwhelm the senses.
Ultimately, future research must build on the IGD framework, which establishes the
pragmatics for choosing a graphic story form with an understanding of its effectiveness
among users.
The storytelling methods outlined here run the gamut when it comes to the time
and resources required for their effective creation and implementation. However, forming
a clear understanding of the types of interactive packages that are available is essential to
understanding how to better harness the interactive multimedia potential of the Web.
Likewise, if multimedia journalists have a clearer picture of how these types of
interactives are best applied to individual stories, the question of whether they are “worth
it” becomes easier to negotiate. Although many newsrooms have embraced the use of
video and photo slideshows as worthwhile multimedia endeavors, interactive information
graphics are largely absent on most news sites. Of course, this assessment should in no
way be considered an indictment against photo and video as powerful storytelling tools.

Interactive Graphics Development (IGD): A framework for studying innovative visual story forms
23
However, if Wittekind (2007) is correct in his assertion that interactive graphics are the
only story forms that take full advantage of all the Internet has to offer, then many news
organizations clearly are missing out on a very powerful storytelling form.
Interactive Graphics Development (IGD): A framework for studying innovative visual story forms
24
References
Banerjee, B., & Stone, P. (2007). General game learning using knowledge transfer. In
The 20th International Joint Conference on Artificial Intelligence, 672–677.
Bell, A. (1991). News values. In The language of news media (pp. 155-160). Cambridge,
MA: Blackwell.
Braun, J. (2009, May 20). Rehashing the gate: News values, nonnews spaces, and the
future of gatekeeping. Paper presented at the annual meeting of the International
Communication Association . Chicago, IL.
Brooks, B., Kennedy, G., Moen, D., & Ranly, D. (2007). Telling the story. New York:
Bedford/St. Martins.
Christians, C. G., Glasser, T., McQuail, D., Nordenstreng, K., & White, R. A. (2009).
Normative Theories of Media: Journalism in Democratic Societies. Urban, IL:
University of Illinois.
Chung, D. S. (2008). Interactive features of online newspapers: Identifying patterns and
predicting use of engaged readers. Journal of Computer-Mediated
Communication , 13, 658-679.
de Freitas, S. & Oliver, M. (2006). How can exploratory learning with games and
simulations within the curriculum be most effectively evaluated? Computers &
Education 46(3), 249-264.
Hansen, K. (2008, March 17). Creating a game-building tool for newsrooms. Retrieved
March 1, 2010, from Mediashift Idea Lab website:

Interactive Graphics Development (IGD): A framework for studying innovative visual story forms
25
http://www.pbs.org/idealab/2008/03/creating-a-game-building-tool-for-
newsrooms005.html
Jackson, Melinda. (2008) “Making visible: Using simulation and game environments
across disciplines.” In Davidson (ed.) Beyond Fun: Serious Games and Media.
ETCPress: 18-23.
Fullerton, T., Swain, C., & Hoffman, S. (2004). Game Design Workshop. San Francisco,
California: CMP Books.
Galtung, J., & Ruge, M. (1965). The structure of foreign news: The presentation of the
Congo, Cuba and Cyprus in four Norwegian newspapers. Journal of Peace
Research , 2 (1), 64-90.
Gans, H. (1979). Deciding what's news; A study of CBS Evening News, NBC Nightly
News, Newsweek and Time. New York: Pantheon.
Greer, J., & Mensing, D. (2006). Evolution of Online Newspapers: A Longitudinal
Content Analayis, 1997-2003. In X. Li (Ed.), Internet Newspapers: The Making of
a Mainstream Medium (pp. 13-32). Mahwah, New Jersey: Lawrence Erlbaum.
Harcup, T., & O'Neill, D. (2001). What is news? Galtung and Ruge revisited. Journalism
Studies , 2 (2), 261-280.
Jones, J. (2009, January 15). Video storytelling in a digital age: A study of three online
storytelling strategies. Retrieved March 1, 2010, from NewsLab website:
http://www.newslab.org/research/onlinestory.htm
McNair, B. (2005). What is Journalism? In H. de Burgh (Ed.), Making Journalists:
Diverse Models, Global Issues (pp. 25-43). New York: Routledge.
Paul, N. (2007) Playing the news…The challenge of gaming reality. Retrieved March 1,
Interactive Graphics Development (IGD): A framework for studying innovative visual story forms
26
2010, from Mediashift Idea Lab website:
http://www.pbs.org/idealab/2007/10/playing-the-newsthe-challenge-of-gaming-
reality005.html
Paul, N., & Fiebich, C. (2005). The Elements of Digital Storytelling. Retrieved January
15, 2010 from Institute for New Media Studies website:
http://www.inms.umn.edu/elements/
Pew Project for Excellence in Journalism. (2010, March 15). The state of the news media
2010 report. Retrieved March 20, 2010, from Pew Center website:
http://www.stateofthemedia.org/2010/
Pew Project for Excellence in Journalism. (2009). The state of the news media
2009 report. Retrieved Feb 1, 2010, from Pew Center website:
http://www.stateofthemedia.org/2009/index.htm
Plunkett, J. and Mehta, J. (producers). (2005). Playing the News [Documentary Film].
USA: UC Berkeley Graduate School of Journalism.
Prensky, M. (2001). Digital natives, digital immigrants. On the Horizon , 9 (5), 1-6.
Nichani, M., & Rajamanickam, V. (2006, January 15). Interactive visual explainers – A
simple classification. Retrieved March 12, 2008, from elearningpost.com
http://www.elearningpost.com/articles/archives/interactive_visual_explainers_a_si
mple_classification/
Rosenberry, J. (2005). Few papers use online techniques to improve public
communication. Newspaper Research Journal , 26 (4), 61-73.
Scarborough Research. (2009, November 17). Press Room. Retrieved February 20, 2010

Interactive Graphics Development (IGD): A framework for studying innovative visual story forms
27
from Scarborough Writes Refreshing Headline for News Industry website:
http://www.scarborough.com/press.php
Schultz, T. (1999, September). Interactive options in online journalism: A content
analysis of 100 U.S. newspapers. Retrieved March 27, 2010 from Journal of
Computer Mediated Communication website:
http://jcmc.indiana.edu/vol5/issue1/schultz.html
Siebert, F. S., Peterson, T., & Schramm, W. (1956). Four Theories of the Press. Urbana,
IL: University of Illinois.
Tuchman, G. (1978). Making news: A study in the construction of reality. New York:
Free Press.
White, D. (1950). The 'gatekeeper:' A case study in the selection of news. Journalism
Quarterly , 27, 383-390.
Williams, S. (1967, December). Business process modeling improves administrative
control. Automation , pp. 44-50.
Wittekind, D. (2007). The interactivity gap. Design 105, 38-43.
Yaros, R. A. (2009 , August/September ). Mastering Multimedia. Retrieved February
15, 2010 from American Journalism Review website:
http://www.ajr.org/article.asp?id=4818
Young, J. R. (2010, January 24). 5 Teaching Tips for Professors—From Video Games.
Retrieved March 2, 2010 from The Chronicle website:
http://chronicle.com/article/5-Lessons-Professors-Can-Learn/63708/


![W.2 - IGD 343 INTERACTIVE DESIGN 3 [ 2557 ]](https://img.pdfslide.net/doc/110x75/547c1682b4795993508b45a5/w2-igd-343-interactive-design-3-2557-.jpg)


![W.4 - IGD 343 INTERACTIVE DESIGN 3 [ 2557 ]](https://img.pdfslide.net/doc/110x75/5590bff41a28ab26118b4633/w4-igd-343-interactive-design-3-2557-.jpg)