Embed Size (px)
Citation preview

This interactive PDF allows you to access information easily, search for a specific item, or go directly to the first page of that section.
TAbSClicking on one of the tabs at the side of the page takes you to the first page of that section.
GUIDE TO bUTTONS
go to table of contents
search this PDF
go to next page
go to previous page
Please note: if you are viewing this content on a tablet or mobile device, functionality for Buttons and Tabs will be disabled.


(RE)INSURANCE REGULATORY REPORTSEPTEMBER 2015
regulation: a WorlD VieW


1
taBle oF ContentS
INTRODUCTION 2
I. DEVELOPMENTS IN EUROPE 4
II. DEVELOPMENTS IN THE UNITED STATES 8
III. DEVELOPMENTS IN ASIA PACIfIC 11
IV. MANAGING THE DEMANDS Of GLOBAL AND DOMESTIC REGULATION 18
V. RATING AGENCY DEVELOPMENTS 25
VI. MEETING THE CHALLENGES 28
VII. CONCLUSION 31

2
INTRODUCTION
(re)inSurerS are FaCing neW CoStS anD preSSureS in their eFFortS to manage the regulatory lanDSCape.
3
Financial market regulation has been under review for a number of years but the global financial crisis in 2008 made it a
key priority in many countries. While the previous insurance regulatory framework did remarkably well in the protection
of insurance consumers and companies during the financial crisis, the insurance industry has not been immune from
these factors. today, new and upcoming regulations are having a profound impact on companies’ balance sheets and
risk management practices. although primarily aimed at larger, global (re)insurers, the changes will impact medium
and small (re)insurers as well.
(re)insurers are being challenged as the regulatory environment becomes more complex, with regulation increasing considerably at multiple levels in numerous jurisdictions throughout the world.
(re)insurers are facing new costs and pressures in their efforts to manage the regulatory landscape. the most profound
changes are occurring on the international front, where new solvency frameworks are evolving at the global level.
regulatory solvency and disclosure requirements still generally fall short of “a”-level risk-adjusted capital standards and
rating agency criteria, arguably giving rated carriers some potential advantages over their non-rated peers. however,
capital and disclosure requirements are major emerging factors for (re)insurers around the world.
in this report, we provide an assessment of the development of solvency and other regulatory initiatives, including
changes to capital requirements that are impacting (re)insurers. today most (re)insurers are asking how can they cope
with myriad developments in regulatory, legislative and ratings requirements to maximize opportunities and maintain
profitable growth.

4
I. DEVELOPMENTS IN EUROPE
apart From Still open SolVenCy ii thirD-Country equiValenCe iSSueS, european inSuranCe CompanieS Struggle With DiFFerent interpretationS oF the eiopa guiDelineS anD ruleS.

5
After a long period of discussion and many delays, the new European insurance regulatory regime, Solvency II, will
commence in January 2016. The rules will be compulsory for all insurance and reinsurance companies and groups in
the European Economic Area (EEA). The three pillar approach of Solvency II for (i) quantitative capital requirements, (ii)
qualitative risk management standards and (iii) reporting specifications, was derived from the international banking
sector regulation (Basel II and Basel III). The Solvency II rules were developed over a period of more than 15 years, and
there are many reasons for the long delay. Two notable reasons are differing business models from country to country
and pressure on long-term guarantee products. With the goal of creating a common regulatory system in Europe
there was much political will to find compromises that allowed different insurance business models in the individual
countries to fit into Solvency II, without necessitating many product changes. And the ongoing low interest rate
environment continues to create enormous pressure on long-term guarantee products in the private pension system
of some European countries.
Quantitative Capital ReQuiRements – pillaR 1 of solvenCy iiThe basis for the solvency capital requirement calculation is the economic balance sheet, with market values on the
asset side and best estimate reserves on the liability side. (Re)insurers are required to have adequate capital levels in
place to finance a 1-in-200 year event, or in other words the VaIue-at-Risk (VaR) at the 99.5 percent quantile level.
For non-life businesses we have only seen a few companies that encounter capital constraints when applying the new
Solvency II capital requirement principles. Many of these companies are captives and monoline insurers that lack
diversification opportunities. Generally, the Solvency II capital requirements have not been a major challenge for the
non-life insurance industry. However, there are some exceptions, with specific companies or sectors of the industry
more acutely affected. This is true especially in many Continental European countries where the local Generally
Accepted Accounting Principles (GAAP) include a prudent reserving principle, resulting in a considerable amount of
hidden reserves between local GAAP balance sheet loss reserve values and discounted best estimate reserves. These
hidden reserves are part of the available capital under Solvency II, the “Own Funds,” and can be used to cover the
risks of a company. In countries with local GAAP principles already near the best estimate, this has led to the use of
reinsurance and sub-debt issuances to address emerging capital shortfalls.
For life insurance businesses, the Solvency II capital requirements can be much more challenging. The ongoing low
interest rate environment is especially challenging for long-term guarantee products of the private pension system in
many countries, depending on the type of guarantee in the products. According to an announcement from the European
Systemic Risk Board (ESRB) in late July 2015, Germany, Sweden, Netherlands and Austria will all face severe problems in
their life businesses in the near future due to high minimum guarantee rates above 3 percent in saving products.
To calculate the Pillar 1 solvency position, (re)insurers in Europe may use a standard formula approach, provided by the
European Insurance and Occupational Pension Authority (EIOPA), or they may develop a full internal model or partial
internal model, which will need to be certified by the national regulator. So far, only a few (re)insurers and groups have
applied for internal model certification – many of those are large international insurance groups. Most companies will
rely on the standard formula approach.

6
While many companies have developed internal modeling approaches to improve their control and management
capabilities, they are currently not willing to enter the certification process with national regulators. one of the major
hurdles in this certification process is the extensive documentation requirements for the model description, the
validation process and the use test. in some cases the insurance companies have to interpret unclear rules and the
internal model results are also vulnerable to last-minute decisions on calibrations. this uncertainty, together with
the occasionally limited capital savings opportunities achieved by using an internal model compared to the standard
formula, have steered many (re)insurance companies and groups away from entering the certification process. this, of
course, may change after Solvency ii begins next year when the uncertainty around calibrations and the certification
requirements will likely disappear.
QUALITATIVE RISk MANAGEMENT REQUIREMENTS – PILLAR 2 Of SOLVENCY IIthe own risk and Solvency assessment (orSa) requirements are the key element of the pillar 2 qualitative risk
management requirements. the purpose of an “own risk assessment” by each company is to prove the appropriateness
of the standard formula or internal model results if the company has applied for a certified internal model. While the
pillar 1 solvency capital requirement is calculated on a one-year basis to show that a company has enough capital to
avoid insolvency through the end of the year in a 1-in-200 year event, the focus in pillar 2 orSa is the forward-looking
assessment of solvency capital adequacy. Companies need to provide a projection of the risk and capital position for the
entire planning period (at least three years), which has to be consistent with the business case balance sheet and profit
and loss projection. the aim of orSa is to demonstrate that there is an adequate level of capital available to support the
business plan for a longer period. Based on this planning projection of the risk and capital position, (re)insurers need to
define meaningful stress tests and scenarios to show they would be adequately capitalized in adverse scenarios as well.
if a company would face solvency issues in certain stress scenarios, it needs to show it has countermeasures in place in
order to reach the strategic targets of the corporate and risk strategy again.
a segment of pillar 2 includes the establishment of a proper risk governance system. this requires the definition of clear
responsibilities for four key functions – risk management, actuarial, compliance and internal audit. Some countries,
such as the netherlands, began orSa reporting requirements a few years ago and its (re)insurers are well developed
in providing meaningful orSa processes and reports. (re)insurers in many other european countries are challenged
in fulfilling the pillar 2 requirements, both on the quantitative orSa aspects of projecting solvency and capital position
and in establishing the governance system accordingly.
REPORTING REQUIREMENTS – PILLAR 3 Of SOLVENCY IIthe pillar 3 reporting requirements are quite comprehensive. european (re)insurers need to provide a regular
Supervisory report (rSr) to the regulator as well as a Solvency and Financial Condition report (SFCr) to be published
for clients, financial analysts, rating agencies and other stakeholders. each of these two reports consists of a narrative risk
report where companies have to describe their risk strategy, risk governance system and risk management processes in
place, and extensive quantitative reporting requirements in the form of the quantitative reporting templates (qrts).
european (re)insurers have already invested heavily in data management systems but additional investments are
still necessary for most companies in europe. these systems are needed for compliance with the pillar 3 reporting
requirements to ensure complete, reliable and consistent data for internal risk and capital management purposes as well
as for internal and external reporting. For the last two or three years, the preparation for pillar 3 reporting requirements,
especially the installation of an accurate data management system based on market consistent valuation principles for the
qrts, has absorbed considerable time and money and has typically become one of the largest projects for (re)insurers.
7
CHANGES IN REINSURANCE DECISIONSrecently, we have seen a change in the way reinsurance is viewed in some companies and groups: the chief financial
officer increasingly recognizes reinsurance as an instrument to achieve risk and capital management, rather than using
capital measures like equity and sub-debt issuances.
reinsurance is now also used more often to optimize the diversification benefit, either between different lines of
business or between insurance and market risks. For this, some insurance groups have implemented an internal
reinsurance Vehicle (irV) to manage the diversification benefit in a more efficient way, and to increase the transferability
and fungibility of capital within an insurance group.
Some retrospective reinsurance solutions – loss portfolio transfer (lpt) and adverse development covers (aDC) – have
been used for capital management purposes. in the past, lpts and aDCs have been mainly used for run-off solutions to
dispose of loss payment obligations from past accident years in order to, for example, support merger and acquisition
activities. now, retrospective reinsurance solutions are used to free up capital, either to increase the solvency ratio
up to a competitive level of risk tolerance described in the risk strategy or to invest the capital in areas with higher
return opportunities.
CHALLENGES fOR EUROPEAN COMPANIES apart from still open Solvency ii third-country equivalence issues, which will be discussed in detail in Section iV of this
report, european insurance companies struggle with different interpretations of the eiopa guidelines and rules. For
example, while sovereign debt is considered risk-free in the Standard Formula, eiopa recommended in april 2015
that internal model firms need to consider the spread risk of sovereign debt. however, local supervisors have not
interpreted this guidance in the same way – the united Kingdom’s prudential regulatory authority, France’s autorité
de contrôle prudentiel et de résolution and germany’s Federal Financial Supervisory authority are asking their internal
model firms to fully risk-weight sovereign bonds at the group level. other supervisors are proposing a “light” approach
of risk-weighting of sovereign debt, while italy and Spain maintain the position that sovereign bonds should remain
risk-free under pillar 1.
another challenge for insurance companies and groups arises from singular regulatory developments in certain
countries, for example, early warning indicators in the united Kingdom and the execution of specific stress tests in
many countries.
are these the first steps away from a unique supervisory system in europe? is there any danger of diverging regulation
in the future? or will this really lead to a level playing field – one of the main goals of Solvency ii?

8
II. DEVELOPMENTS IN THE UNITED STATES
orSa iS expeCteD to Further prompt Company managementS to Better reCognize anD analyze the riSKS oF their enterpriSeS.
9
the regulatory system in the united States has best been described as a national system of state-based regulation
consisting of state insurance departments from all 50 states, the District of Columbia and five territories.1 although
there have been questions raised about the system and challenges to it over the years, its regulation remained primarily
within the purview of the state regulators through the protection afforded under the mcCarran-Ferguson act of 1945,
which expressly provided that “acts of Congress” that do not expressly purport to regulate the “business of insurance”
will not preempt state laws or regulations that regulate the “business of insurance.”
however, developments in the past several years since the financial crisis have resulted in significant involvement by
the Federal government in the insurance sector. more specifically, the Dodd–Frank Wall Street reform and Consumer
protection act (pub.l. 111–203, h.r. 4173 (commonly referred to as “Dodd-Frank”)) created, among other things, the
Federal insurance office (Fio) within the treasury Department, which has the authority to monitor all aspects of the
insurance sector, represent the united States on prudential aspects of international insurance matters (including at the
iaiS) and advise the Secretary on important national and international insurance matters.2
Dodd-Frank also gave the Federal reserve Board (FrB) consolidated oversight over any non-bank entity designated by
the Financial Stability oversight Council (FSoC) as systemically important, and of any insurance holding company that
operates a federally chartered thrift. it has been reported that the insurance entities that the FrB has under supervision
hold approximately “one-third of the u.S. insurance industry assets.”3 in november of 2013, the FrB joined the Fio
and their state supervisory colleagues from the national association of insurance Commissioners (naiC) as members
of the iaiS, and in June of the following year hired former Connecticut insurance Commissioner, tom Sullivan, to be a
senior advisor on insurance matters to the Board. in addition, the FrB has recently indicated that it is also considering
a proposal for a new nationwide iCS, so it is quite obvious that the involvement of the FrB in the insurance sector is
increasing in a significant way.
in 2008, through the naiC, state insurance regulators in the united States embarked on the Solvency modernization
initiative (Smi) to perform a critical self-evaluation to improve the insurance solvency regulatory framework in the
united States, which included a review of international developments in insurance supervision, banking supervision
and international accounting standards to determine their potential use in u.S. insurance supervision. the Smi focused
on the following key components of the solvency framework: capital requirements, governance and risk management,
group supervision, statutory accounting and financial reporting and reinsurance.4 Some of the major initiatives of the
Smi (as noted by the naiC) have included:
• the insurance holding Company System regulatory act (model #440) and model regulation (with
reporting Forms and instructions – model #450)
• the Credit for reinsurance model law (model #785) and the Credit for reinsurance model regulation
(model #786)
• the Standard Valuation law (model #820) and the Standard non-forfeiture law for life insurance
(model #808), completion of the industry impact study for life insurance principles-based reserving
and adoption of the Valuation manual
• the Corporate governance annual Disclosure model act and supporting model regulation
• the risk management and own risk and Solvency assessment model act (#505) and the own risk
and Solvency assessment (orSa) guidance manual
• increasing scheduling of, and participation in, supervisory colleges (and creation of supervisory
tracking documentation to monitor the activity of supervisory colleges).5
1. NAIC White Paper: The U.S. National State-Based System of Insurance Financial Regulation and the Solvency Modernization Initiative, August 14, 2013. 2. U.S. Department of the Treasury: About, Federal Insurance Office. 3. Board of Governors of the Federal Reserve System: Testimony by Mark E. Van Der Weide, before the Committee on Banking, Housing, and Urban Affairs,
U.S. Senate, April 28, 2015.4. NAIC White Paper: The U.S. National State-Based System of Insurance Financial Regulation and the Solvency Modernization Initiative, August 14, 2013.5. NAIC: SMI Roadmap, December 21, 2012.

10
GROUP SUPERVISIONthe naiC has stipulated that “the solvency framework of the u.S. system of state-based insurance regulation has
included a review of the holding company system for decades, with an emphasis placed on each insurance legal entity.
in light of the 2008 financial crisis and the globalization of insurance business models, as discussed in this report, u.S.
insurance regulators have begun to modify their group supervisory framework and have been increasingly involved in
developing an international group supervisory framework.”6
“to enhance the systems for group supervision, the naiC adopted the revised insurance holding Company System
regulatory act (model #440) and the insurance holding Company System model regulation with reporting Forms
and instructions (model #450) in 2010. the revisions included the following: expanded ability to evaluate any entity
within an insurance holding company system; enhancements to the regulator’s rights to access books and records and
compelling production of information; establishment of expectation of funding with regard to regulator participation in
supervisory colleges; and enhancements in corporate governance, such as Board of Directors and Senior management
responsibilities. additionally, regulators adopted an expansion to the insurance holding Company System annual
registration Statement (Form B) to broaden requirements to include financial statements of all affiliates.“7
ORSAthe risk management and own Solvency and risk assessment requires that an orSa Summary report be filed in
2015 (or 2016 depending on state adoption of the model act) by individual u.S. (re)insurers writing more than uSD500
million of annual direct written and assumed premium (and/or insurance groups writing more than uSD1 billion of
annual direct written and assumed premium). orSa is expected to cause company managements to demonstrate that
they have a strong enterprise risk management (erm) framework in place, and that they are actually using it to better
identify and analyze the material risks to which the company is exposed and in making decisions regarding capital and
solvency. it requires an in-depth assessment of an insurer’s business, its organizational structure, its risk management
strategy and management’s (and others’) role in the process; the establishment, monitoring and enforcement of risk
appetite, tolerances and limits; the assessment of its risk exposures in both normal and stressed environments; and the
determination of the level of financial resources needed to manage its current business over the longer business cycle.
Section iV of this report includes discussion of these and other issues to demonstrate how a properly structured orSa
can provide tremendous benefits to (re)insurers. Within an organization, the orSa facilitates the establishment and
maintenance of an effective erm framework that minimizes the effects of risk on a company’s capital and earnings. the
assessment is also effective in communications with shareholders, regulators and rating agencies. this report will also
compare some of the requirements in the united States with others territories – including Solvency ii in the european
union. one key point is that through orSa, u.S. regulators will be able to enlarge their existing assessment of group
capital via analysis of a company’s own assessment of group capital needs.
6. NAIC: CIPR Newsletter, Insurance Group Supervision, April 2012. 7. NAIC website on Status of Group Supervision.

11
III. DEVELOPMENTS IN ASIA PACIfIC
in apaC, the approaCh to inSuranCe regulation haS VarieD on a Country-By-Country BaSiS aS eaCh regime aDaptS SolVenCy prinCipleS to their oWn neeDS anD politiCal realitieS.
12
OVERVIEwasia pacific (apaC) is a diverse mix of countries encompassing nearly one-third of the earth’s landmass and more than
one half of its population. given the broad spectrum of economic and regulatory sophistication across the region, the
approach to insurance regulation has varied on a country-by-country basis as each regime adapts solvency principles
to their own needs and political realities.
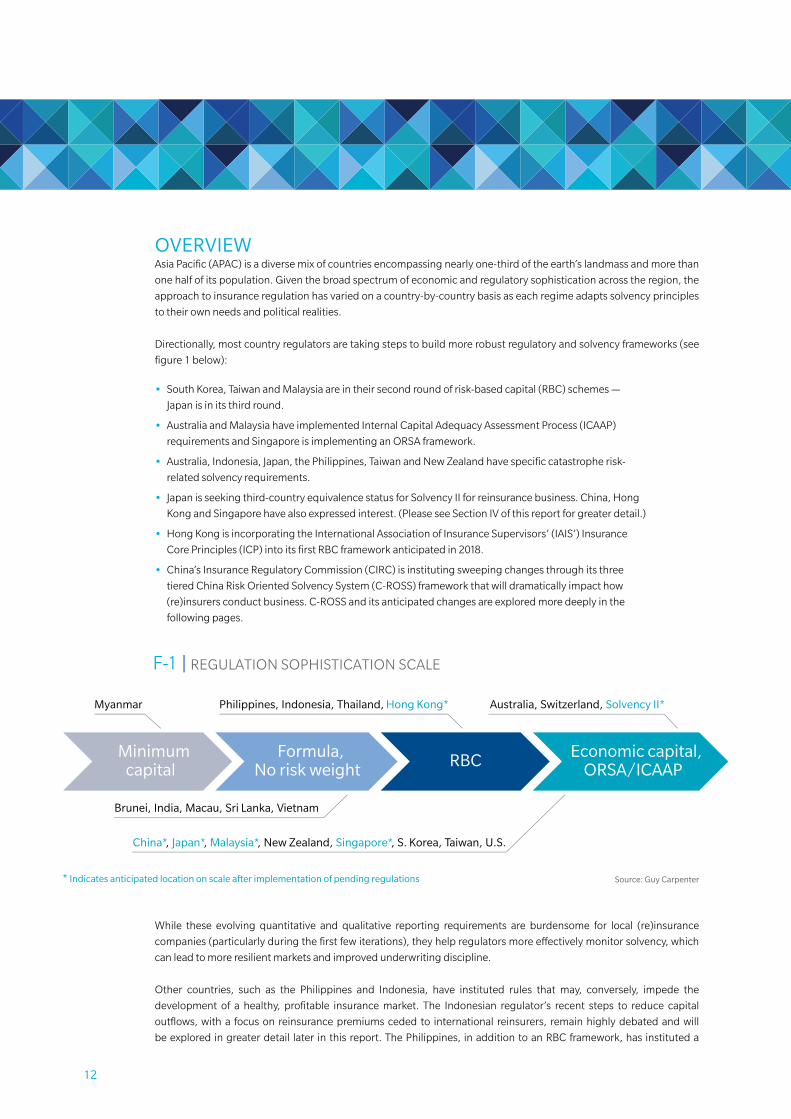
Directionally, most country regulators are taking steps to build more robust regulatory and solvency frameworks (see
figure 1 below):
• South Korea, taiwan and malaysia are in their second round of risk-based capital (rBC) schemes —
Japan is in its third round.
• australia and malaysia have implemented internal Capital adequacy assessment process (iCaap)
requirements and Singapore is implementing an orSa framework.
• australia, indonesia, Japan, the philippines, taiwan and new zealand have specific catastrophe risk-
related solvency requirements.
• Japan is seeking third-country equivalence status for Solvency ii for reinsurance business. China, hong
Kong and Singapore have also expressed interest. (please see Section iV of this report for greater detail.)
• hong Kong is incorporating the international association of insurance Supervisors’ (iaiS’) insurance
Core principles (iCp) into its first rBC framework anticipated in 2018.
• China’s insurance regulatory Commission (CirC) is instituting sweeping changes through its three
tiered China risk oriented Solvency System (C-roSS) framework that will dramatically impact how
(re)insurers conduct business. C-roSS and its anticipated changes are explored more deeply in the
following pages.
While these evolving quantitative and qualitative reporting requirements are burdensome for local (re)insurance
companies (particularly during the first few iterations), they help regulators more effectively monitor solvency, which
can lead to more resilient markets and improved underwriting discipline.
other countries, such as the philippines and indonesia, have instituted rules that may, conversely, impede the
development of a healthy, profitable insurance market. the indonesian regulator’s recent steps to reduce capital
outflows, with a focus on reinsurance premiums ceded to international reinsurers, remain highly debated and will
be explored in greater detail later in this report. the philippines, in addition to an rBC framework, has instituted a
• Actual capital assessment standards and capital classification
• Identification of risks not captured by Pillar 1
• Integrated Risk Rating
• Solvency Aligned Risk Management Requirements and Assessment (SARMRA)
• Improve risk disclosure and transparency
• Develop market disciplinary mechanism and optimize the market environment
Quantitative CapitalRequirements
(Pillar 1)
Company’s Solvency Management
Qualitative CapitalRequirements
(Pillar 2)
• One supervision• Emerging markets
• Risk-oriented with value consideration
Disclosure
(Pillar 3)
Source: Guy Carpenter
Source: CIRC
F-1 | REGULATION SOPHISTICATION SCALE
Minimumcapital
Formula,No risk weight RBC Economic capital,
ORSA/ICAAP
Myanmar
Brunei, India, Macau, Sri Lanka, Vietnam
Philippines, Indonesia, Thailand, Hong Kong* Australia, Switzerland, Solvency II*
China*, Japan*, Malaysia*, New Zealand, Singapore*, S. Korea, Taiwan, U.S.
* Indicates anticipated location on scale after implementation of pending regulations
Lowimpact• Fixed income investments
F-3 | C-ROSS FRAMEWORK
Low-to-mediumimpact• Equity investments
• Credit-reinsurance recoverables
Mediumimpact• Loss and LAE reserves
• Net premium written
Medium-to-highimpact• Potential cat losses
Source: Guy Carpenter
F-5 | MSA BASIC FRAMEWORK
Component 1
SensitivityTesting
Evaluation
Component 2
LossValidation
Component 3
ScientificAppraisal
Component 4
MSA Grid
Integration
Client’s View of Risk
Component 5
Model Enhancement
Component 6
RiskCustomization
Component 7
Documentation
Communication
Component 8
Knowledge Sharing
Minimum capital Formula, No risk weight RBC Economic capital, ORSA/ICAAP
Japan
China
India
Australia
South Korea
Indonesia Thailand
Malaysia
Singapore
Philippines
Taiwan
Hong Kong
New Zealand
Vietnam 0
10,000
20,000
30,000
40,000
50,000
60,000
70,000
Bubbled size = GDP (USD)
F-2 | ASIAN ECONOMIES AND INSURANCE REGULATION IN PERSPECTIVE
2014 GDP Growth
GD
P/C
apita
(1.00) 0.00 1.00 2.00 3.00 4.00 5.00 6.00 7.00 8.00
Source: Economist Intelligence Unit, Guy Carpenter Analysis
Reg
ulat
ory
req
uire
men
tsSy
stem
char
acte
rist
ics
F-4 | ORSA/ERM FRAMEWORK –THE FOUR LAYERS
Source: Oliver Wyman Group
INFRASTRUCTUREPROCESS
Risk identification Risk assessment Risk m
easurement Controlling/m
itigat
ing
Ris
k re
port
ing
CULTURE
Embedded
Compensation
Performance measures
Risk policies
Datamanagement
Reporting &planning
IT &technology
STRATEGY
MissionRisk strategyRisk appetite
Value proposition
Modeling
Risk limits& controls
Organization
Communication
Tone at top
An e�ective ERM is important because it will…
• Enable a deeper understandingof and broader adherence to therisk appetite
• Drive a positive risk culture
• Link risk, capital management and business strategy with each other
• Enable understanding of keyrisk drivers
• Comprehensively assess the current risk profile and aid in forward looking risk management
• Help in the planning process, especially around capitalmanagement
• Provide insight on the robustness and e�cacy of risk management processes, tools and controls
• Satisfy regulatory and ratings agencies requirements and facilitate constructive dialogue

13
minimum paid-up capital requirement (starting in 2006 and revised in 2013) that increases every two years and will
result in a php2 billion (approximately uSD44 million) minimum threshold in 2020. this will put minimum capital
levels in the philippines well above those of more developed markets, including australia, Japan and Singapore. the
policy applies uniformly across the industry regardless of premium volume, line of business or geographic scope and
therefore its impact is more strongly felt by smaller carriers that will most likely be forced out of the market or into
the arms of larger players. the philippines insurer and reinsurer association (pira) has been outspoken against the
minimum capital requirement and stated a preference for a standalone rBC metric.
generally, the more advanced economies across the apaC region have robust insurance regulatory frameworks.
With the exception of hong Kong, each country with a gross domestic product (gDp) per capita over uSD10,000 has,
or is, moving towards an economic capital and/or orSa/iCaap requirement. in less developed countries, the focus
continues to be on educating consumers on the value of insurance and increasing insurance penetration.
the following chart summarizes regulations, including upcoming changes, which have or are expected to have
significant impacts on the insurance market in each territory.
• Actual capital assessment standards and capital classification
• Identification of risks not captured by Pillar 1
• Integrated Risk Rating
• Solvency Aligned Risk Management Requirements and Assessment (SARMRA)
• Improve risk disclosure and transparency
• Develop market disciplinary mechanism and optimize the market environment
Quantitative CapitalRequirements
(Pillar 1)
Company’s Solvency Management
Qualitative CapitalRequirements
(Pillar 2)
• One supervision• Emerging markets
• Risk-oriented with value consideration
Disclosure
(Pillar 3)
Source: Guy Carpenter
Source: CIRC
F-1 | REGULATION SOPHISTICATION SCALE
Minimumcapital
Formula,No risk weight RBC Economic capital,
ORSA/ICAAP
Myanmar
Brunei, India, Macau, Sri Lanka, Vietnam
Philippines, Indonesia, Thailand, Hong Kong* Australia, Switzerland, Solvency II*
China*, Japan*, Malaysia*, New Zealand, Singapore*, S. Korea, Taiwan, U.S.
* Indicates anticipated location on scale after implementation of pending regulations
Lowimpact• Fixed income investments
F-3 | C-ROSS FRAMEWORK
Low-to-mediumimpact• Equity investments
• Credit-reinsurance recoverables
Mediumimpact• Loss and LAE reserves
• Net premium written
Medium-to-highimpact• Potential cat losses
Source: Guy Carpenter
F-5 | MSA BASIC FRAMEWORK
Component 1
SensitivityTesting
Evaluation
Component 2
LossValidation
Component 3
ScientificAppraisal
Component 4
MSA Grid
Integration
Client’s View of Risk
Component 5
Model Enhancement
Component 6
RiskCustomization
Component 7
Documentation
Communication
Component 8
Knowledge Sharing
Minimum capital Formula, No risk weight RBC Economic capital, ORSA/ICAAP
Japan
China
India
Australia
South Korea
Indonesia Thailand
Malaysia
Singapore
Philippines
Taiwan
Hong Kong
New Zealand
Vietnam 0
10,000
20,000
30,000
40,000
50,000
60,000
70,000
Bubbled size = GDP (USD)
F-2 | ASIAN ECONOMIES AND INSURANCE REGULATION IN PERSPECTIVE
2014 GDP Growth
GD
P/C
apita
(1.00) 0.00 1.00 2.00 3.00 4.00 5.00 6.00 7.00 8.00
Source: Economist Intelligence Unit, Guy Carpenter Analysis
Reg
ulat
ory
req
uire
men
tsSy
stem
char
acte
rist
ics
F-4 | ORSA/ERM FRAMEWORK –THE FOUR LAYERS
Source: Oliver Wyman Group
INFRASTRUCTUREPROCESS
Risk identification Risk assessment Risk m
easurement Controlling/m
itigat
ing
Ris
k re
port
ing
CULTURE
Embedded
Compensation
Performance measures
Risk policies
Datamanagement
Reporting &planning
IT &technology
STRATEGY
MissionRisk strategyRisk appetite
Value proposition
Modeling
Risk limits& controls
Organization
Communication
Tone at top
An e�ective ERM is important because it will…
• Enable a deeper understandingof and broader adherence to therisk appetite
• Drive a positive risk culture
• Link risk, capital management and business strategy with each other
• Enable understanding of keyrisk drivers
• Comprehensively assess the current risk profile and aid in forward looking risk management
• Help in the planning process, especially around capitalmanagement
• Provide insight on the robustness and e�cacy of risk management processes, tools and controls
• Satisfy regulatory and ratings agencies requirements and facilitate constructive dialogue

14 Source: Guy Carpenter
t-1 | aSia paCiFiC regulatory Summary
Country
Australia
China
Hong Kong
India
Indonesia
Japan
Malaysia
Philippines
Singapore
South Korea
Thailand
•LifeandGeneralInsuranceCapitalreform(LAGIC)in2013 –3pillarsolvencymethod(similartoSolvencyII) –Quantitative,qualitativeanddisclosure
•InternalCapitaladequacyassessmentprocess(ICAAP)
•ChinaRiskOrientedSolvencySystem(C-ROSS)
•RBCexpectedimplementationin2018 – Includeslatestinsurancecoreprinciples(ICP)fromIAIS
•AnticipateaneventualshifttoRBCframework(fromstraightfactorbased)•Allowanceforforeigninvestmentininsurersincreasedfrom26%to49%
•RecentOJKregulationsrestrictingcessionstooverseasreinsurersandincreasingcompanyretentions
•TheSolvencyMarginRatio,arisk-basedcapitalframeworkwas introducedin1996andhasundergoneseveralrevisions.Includes explicitcatastropheriskcharge.
•Japan’sFSAhasbeenbuildingtowardsIFRSandaneconomiccapitalframework•SolvencyIIequivalenceforreinsuranceunderreviewbyEuropeanCommission
•Detarifficationofmotorandfirelines•RBCschemefortakafulcompanies•ImplementedICAAPrequirementin2012
•Continuedstepupinminimumcapitalrequirements–PHP2billion(approximatelyUSD44million)in2020
•RBCII–anticipated1/1/17•Starting2014,companiesareconductingORSA•Outsourcingconstraints
•RBCmetricsrecentlyrecalibratedtoa99%confidencelevel(from95%)•SouthKorea’sFinancialServicesCommission(FSC)hasdeveloped aRiskAssessmentandApplicationSystem(RAAS)andindicatesa movetowardsORSA
•ImplementationofIFRS4PhaseIIisanticipatedbetween2018–2020•Acceptanceofinternalmodelsbeingexplored
•ForthcomingRBCII(2015forlifecompaniesandanticipated2016-17 fornon-life)
•Nocurrentqualitativemeasureofrisk-stresstestsandriskassessments willbeaddedtoRBCII
•Deregulationoftariffratesforfireandmotorexpectedby2017
AustraliahasachievedprovisionalSolvencyIIequivalencystatusandprovidesanexamplefortherestofAPAC.BankNegaraMalaysia,forexample,hasadoptedAustralia’sICAAPframeworkinfull.
WithtwofullyearsunderLAGICandover10yearsundergeneralinsurance RBCnowinthebooks,insurersandinsurancebuyersarefeelingtherisingcost ofcompliance.
Seefollowingpages
TheOfficeoftheCommissionerofInsurancewilltakeitstimeindevelopingandimplementingRBCtoallowlocalinsurerstoprepare.TherelativelysmallHongKongmarketisfragmented,withapproximately40localinsurersandover100foreigninsurersofferinglifeandgeneralcoverage.
ThefirstRBCquantitativeimpactstudy(QIS)willlikelybeconductedin2016,precedingpotentialrevision,furtherpublicconsultation,additionalstudies,legislationandanextendedimplementationperiod.
TheInsuranceRegulatoryandDevelopmentAuthorityisincrementallymovingtowardsaneconomiccapitalframeworkandisincreasingitsfocusoncorporategovernance,butisgenerallyshortonguidance.Forexample,insurersarenowrequiredtomaintainariskmanagementcommittee,buttheregulatorhasnotprovidedaprescriptivemodelforriskmanagement.Foreignjointventurepartnersthuscurrentlyplayafarmoreimportantroleindeterminingriskmanagementandsolvencyguidelinesthantheregulator.
Seefollowingpages
Withahighlyconcentratedmarket,Japan’sFSAenjoysahighratioofstafftothenumberofregulatedcompanies.ThisallowstheFSAtoconductfrequentandextensiveauditsthathavebeenmoreandmorefocusedonriskmanagement andgovernance.
Mostofthelargenon-lifeandcompositeinsurancegroupsareseveralyearsintothedevelopmentofinternalcapitalmodels.
MalaysiajumpedaheadofmuchoftherestofSoutheastAsiaintermsofsolvencyregulationbyadoptingmanyoftheguidelinesdevelopedbytheAustralianPrudentialRegulationAuthority.WithverylittleguidanceprovidedbyBankNegaraMalaysia,however,insurersstruggletoderivevaluefromtheICAAPexercise.Itisfornowanexpensivebox-tickingexerciseformanyinsurers.
Thestepupofminimumcapitalrequirementswillmakeitprogressivelymoredifficultforcompanieswithsmallerpremiumbasestomaintainreturntargets.ThiscouldpotentiallyleadtoanincreaseinM&AactivityandanincreaseinthegapbetweenexposuresandaffordableinsurancecoverageinthePhilippines.
RBCIIwillintroduceadditionalcompliancecostsandcapitalrequirements(e.g.,catastropheriskcharge).TheMonetaryAuthorityofSingapore(MAS)willrequirecompaniestocompleteanORSAinclusiveofaneconomiccapitalmetric. However,theMAShasstatedit“willnotbeevaluatingtheeconomiccapitalmodelsofinsurers,norwillMASaccepteconomiccapitalinlieuofregulatorycapitalrequirements.”
GiventheFSCwillnolongerrecommendatargetsolvencyratio(exceptabovestatutoryminof100%),companieswillbeencouragedtochoosetheirownRBCtargetsaspartoftheirORSA.
TheupcomingIFRSchangeswillnegativelyimpact(re)insurerbalancesheetsthroughmarket-basedvaluationofliabilities.Accordingly,companiesmaychoosetoincludeabufferwhenselectingtheirsolvencytargets.
Inrecentyearscompaniesneededtoraiseadditionalcapitalandreliedonreinsurancetoremaincompliant–thistrendmaycontinueasnewregulationstakehold.Large,well-capitalizedcompanieswillbebetterpositionedtosucceedintheKoreanmarket.
Foraperiodof3yearsaftertheevent,lossreservesfromtheThaifloodswerenotapplicabletonon-lifecompanies’capitaladequacyratios.Inrecentyears,propertyratesandtermshavesoftenedduetoaresurgenceofavailablecapacity.
Theforthcomingtariffliberalizationmayfurtherreduceratesinanalreadycompetitivemarketplace.
ManycompaniesinThailandcurrentlyuseoutsideactuariesinordertoconductRBCmodeling.Apushtobringmoresophistication“inhouse“astheRBCIIframeworknearsimplementationisanticipated.
Recent/Upcoming Regulation(s) GC Comments
15
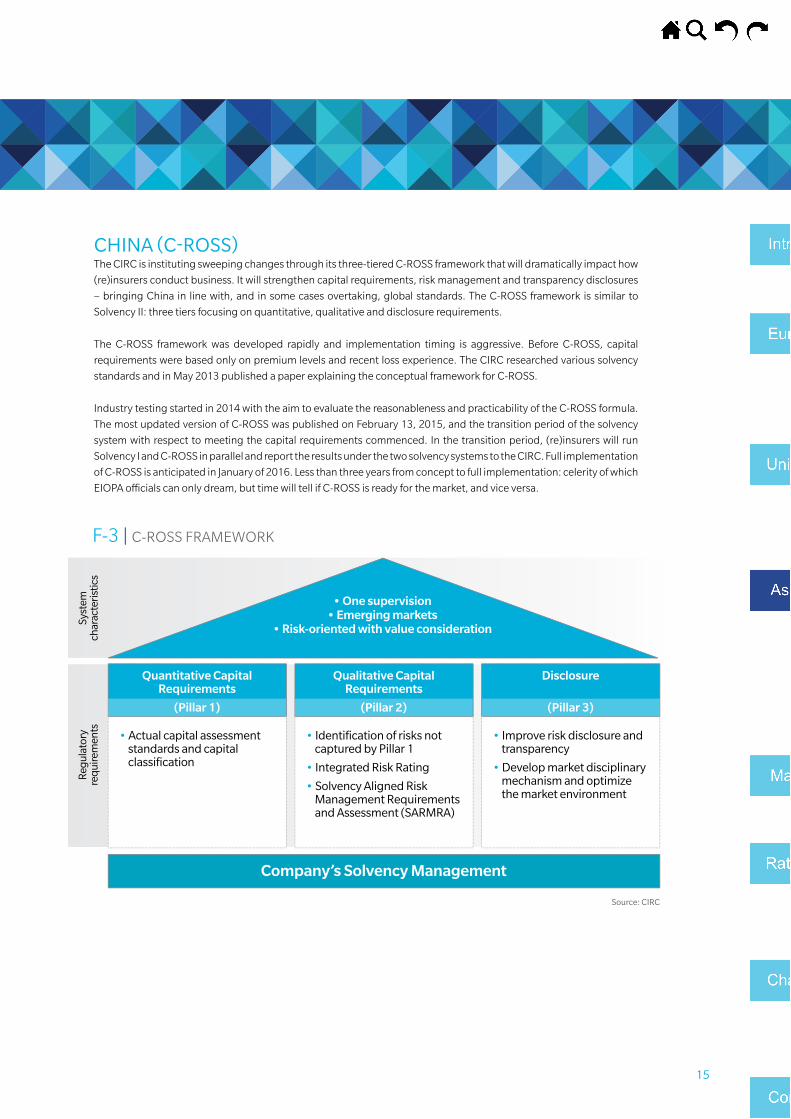
CHINA (C-ROSS)the CirC is instituting sweeping changes through its three-tiered C-roSS framework that will dramatically impact how
(re)insurers conduct business. it will strengthen capital requirements, risk management and transparency disclosures
– bringing China in line with, and in some cases overtaking, global standards. the C-roSS framework is similar to
Solvency ii: three tiers focusing on quantitative, qualitative and disclosure requirements.
the C-roSS framework was developed rapidly and implementation timing is aggressive. Before C-roSS, capital
requirements were based only on premium levels and recent loss experience. the CirC researched various solvency
standards and in may 2013 published a paper explaining the conceptual framework for C-roSS.
industry testing started in 2014 with the aim to evaluate the reasonableness and practicability of the C-roSS formula.
the most updated version of C-roSS was published on February 13, 2015, and the transition period of the solvency
system with respect to meeting the capital requirements commenced. in the transition period, (re)insurers will run
Solvency i and C-roSS in parallel and report the results under the two solvency systems to the CirC. Full implementation
of C-roSS is anticipated in January of 2016. less than three years from concept to full implementation: celerity of which
eiopa officials can only dream, but time will tell if C-roSS is ready for the market, and vice versa.
• Actual capital assessment standards and capital classification
• Identification of risks not captured by Pillar 1
• Integrated Risk Rating
• Solvency Aligned Risk Management Requirements and Assessment (SARMRA)
• Improve risk disclosure and transparency
• Develop market disciplinary mechanism and optimize the market environment
Quantitative CapitalRequirements
(Pillar 1)
Company’s Solvency Management
Qualitative CapitalRequirements
(Pillar 2)
• One supervision• Emerging markets
• Risk-oriented with value consideration
Disclosure
(Pillar 3)
Source: Guy Carpenter
Source: CIRC
F-1 | REGULATION SOPHISTICATION SCALE
Minimumcapital
Formula,No risk weight RBC Economic capital,
ORSA/ICAAP
Myanmar
Brunei, India, Macau, Sri Lanka, Vietnam
Philippines, Indonesia, Thailand, Hong Kong* Australia, Switzerland, Solvency II*
China*, Japan*, Malaysia*, New Zealand, Singapore*, S. Korea, Taiwan, U.S.
* Indicates anticipated location on scale after implementation of pending regulations
Lowimpact• Fixed income investments
F-3 | C-ROSS FRAMEWORK
Low-to-mediumimpact• Equity investments
• Credit-reinsurance recoverables
Mediumimpact• Loss and LAE reserves
• Net premium written
Medium-to-highimpact• Potential cat losses
Source: Guy Carpenter
F-5 | MSA BASIC FRAMEWORK
Component 1
SensitivityTesting
Evaluation
Component 2
LossValidation
Component 3
ScientificAppraisal
Component 4
MSA Grid
Integration
Client’s View of Risk
Component 5
Model Enhancement
Component 6
RiskCustomization
Component 7
Documentation
Communication
Component 8
Knowledge Sharing
Minimum capital Formula, No risk weight RBC Economic capital, ORSA/ICAAP
Japan
China
India
Australia
South Korea
Indonesia Thailand
Malaysia
Singapore
Philippines
Taiwan
Hong Kong
New Zealand
Vietnam 0
10,000
20,000
30,000
40,000
50,000
60,000
70,000
Bubbled size = GDP (USD)
F-2 | ASIAN ECONOMIES AND INSURANCE REGULATION IN PERSPECTIVE
2014 GDP Growth
GD
P/C
apita
(1.00) 0.00 1.00 2.00 3.00 4.00 5.00 6.00 7.00 8.00
Source: Economist Intelligence Unit, Guy Carpenter Analysis
Reg
ulat
ory
req
uire
men
tsSy
stem
char
acte
rist
ics
F-4 | ORSA/ERM FRAMEWORK –THE FOUR LAYERS
Source: Oliver Wyman Group
INFRASTRUCTUREPROCESS
Risk identification Risk assessment Risk m
easurement Controlling/m
itigat
ing
Ris
k re
port
ing
CULTURE
Embedded
Compensation
Performance measures
Risk policies
Datamanagement
Reporting &planning
IT &technology
STRATEGY
MissionRisk strategyRisk appetite
Value proposition
Modeling
Risk limits& controls
Organization
Communication
Tone at top
An e�ective ERM is important because it will…
• Enable a deeper understandingof and broader adherence to therisk appetite
• Drive a positive risk culture
• Link risk, capital management and business strategy with each other
• Enable understanding of keyrisk drivers
• Comprehensively assess the current risk profile and aid in forward looking risk management
• Help in the planning process, especially around capitalmanagement
• Provide insight on the robustness and e�cacy of risk management processes, tools and controls
• Satisfy regulatory and ratings agencies requirements and facilitate constructive dialogue

16
pillar 1 will include various risk factors applied to premium, reserve and catastrophe risk based on lines of business.
a table comparing the premium and reserve risk factors for C-roSS and Solvency ii can be found in appendix exhibit 1.
Credit risk charges are also included in the analysis, which will significantly impact reinsurance cessions and how
international reinsurers conduct business in China. For example, cedents who use offshore reinsurers are penalized
with credit risk factors ranging from 8.7 percent to 86.7 percent depending on reinsurer approval in domiciled countries
and collateral positions. By contrast, cessions to onshore reinsurers are 0.5 percent to 4.7 percent when reinsurers
meet a greater than 100 percent solvency ratio threshold. Collateral is recognized to offset some of the risk charge
applied to cessions to foreign reinsurers. retrocession business to offshore reinsurers is less punitive, with risk factors
on recoverables from reinsurers rated aaa to BBB- ranging from 0.5 percent to 11.5 percent, respectively.
the large risk charge discrepancy is anticipated to increase cessions to onshore reinsurers at a cost to foreign carriers.
recent discussions have indicated various approaches by international reinsurers, including establishing a domestic
capitalized branch, writing through the local lloyd’s operation or writing retrocession to access China-based exposures.
it is anticipated that the CirC will recognize funds withheld and letters of credit as collateral for reinsurance purposes.
the CirC has also announced a system for tracking and approving reinsurance companies writing business in China.
the reinsurance registration System (rrS) is anticipated to launch in January 2016 to coincide with C-roSS. Domestic
and international reinsurers and brokers will be required to register in the rrS.
Cedents must select companies that are approved on the rrS or potentially face penalties from the CirC. Brokers and
reinsurers that are not compliant from a truthfulness or timeliness standpoint will be barred from the rrS for a number
of years.
rrS applicants must be recommended by a China-based affiliate, cedent or broker as well as meet various solvency
and rating requirements. the registration is valid for three years, after which the reinsurer must renew its application.
C-roSS anticipated areas of impact:
• larger, multiline insurers may experience better outcomes based on receiving a diversification benefit.
• Small, monoline or thinly capitalized companies may need to raise capital or consider strategic
alternatives.
• all companies will likely feel pressure to upgrade erm capabilities.
• increased consolidation is likely.
• potential created for new, low-cost providers due to lower capital charges on certain lines.
• C-roSS creates a protected market for domestic reinsurers, including lloyd’s and global reinsurance
groups that have domestic operations. this may contribute to increased volatility in reinsurance and
retrocession pricing.
17
INDONESIAthe average balance of payments in indonesian reinsurance transactions over the past five years has been in a deficit
of iDr5.65 trillion (uSD455 million) per year. this has been a point of frustration for the indonesian government.
as such, the indonesia Financial Services authority (oJK) has instructed insurers to retain more risk and to reinsure
more business with domestic reinsurers, including the recently-formed state reinsurer, indonesia re, to “improve and
optimize capacity in the country.” the oJK has also encouraged all domestic reinsurers to obtain an international rating
in order to improve competitiveness with foreign reinsurers. however, it is anticipated that high cessions to other
unrated, domestic companies will increase credit risk charges and pressure capital adequacy ratios.
For treaty business, a minimum cession to domestic reinsurers is mandatory (25 percent of cessions or approximately
uSD15 million, whichever is higher). Further, the lead market should be a domestic reinsurer and at least two domestic
reinsurers should participate on each treaty. one hundred percent cession to international reinsurers is only allowed
if all domestic reinsurers and six domestic insurance companies all decline to participate. Some classes of business,
including motor, personal accident, surety, credit and cargo must be 100 percent reinsured with local reinsurers.
these issues could potentially emerge in light of these new policies:
• particularly in light of the current capitalization of domestic reinsurers, the local (re)insurance industry
may become increasingly fragile as the level of retained catastrophe risk exposure builds. indonesia is
highly exposed to natural catastrophes, including earthquake and flood losses.
• Domestic reinsurers may not be able to provide lead terms due to lack of technical capabilities.
• local reinsurers may have challenges in achieving an international rating due to weak capitalization.
• a reduction in knowledge transfer as international reinsurers’ participation in the local market
is reduced.
reinsurance rates have fallen dramatically in the first reinsurance renewals under these rules. While this is positive
in the short term for reinsurance buyers, the result contradicts one of the regulator’s stated objectives to encourage
market consolidation. Smaller reinsurers that may otherwise struggle to meet rBC requirements may now draw upon
devalued reinsurance as capital to temporarily remain in compliance. an eventual market correction, particularly in a
shock loss scenario, could be disastrous for policyholders of smaller insurers.

18
IV. MANAGING THE DEMANDS Of GLOBAL AND DOMESTIC REGULATION
noW, anD eSpeCially With the introDuCtion oF the iCS, it iS inCreaSingly important For (re)inSurerS to aVoiD unneCeSSary, reDunDant anD DupliCatiVe aCtiVity in the attainment oF regulatory SatiSFaCtion By StriVing For a uniForm FrameWorK.

19
there is very little doubt that (re)insurers face and will continue to face growing regulation and scrutiny both
domestically and internationally. therefore, (re)insurers should seek the most effective and efficient way to meet the
growing demands of increased global regulation. What follows below is a brief discussion of the overlap of some of
these new global regulatory requirements and thoughts on how (re)insurers might go about approaching them.
COMPARISON Of REGULATORY CAPITAL REQUIREMENTSin planning and formalizing a global (re)insurer’s approach to satisfying the regulatory requirements of each of its regional supervisors, (re)insurers would be wise to understand where the jurisdictional requirements and standards are both similar and dissimilar. understanding these similarities and differences will go a long way in creating an enterprise solution to regulatory compliance while avoiding burdensome tasks and redundant efforts.
20 Source: Guy Carpenter
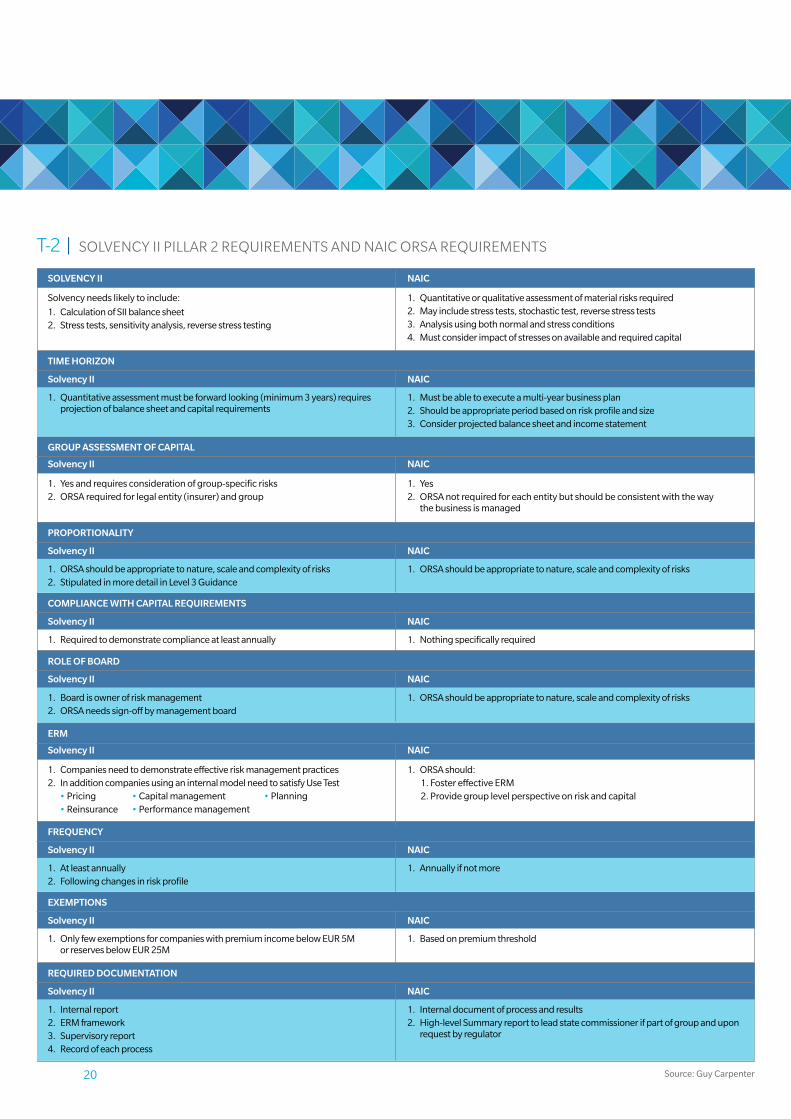
t-2 | SolVenCy ii pillar 2 requirementS anD naiC orSa requirementS
Solvencyneedslikelytoinclude:
1. CalculationofSIIbalancesheet2. Stresstests,sensitivityanalysis,reversestresstesting
1. Yesandrequiresconsiderationofgroup-specificrisks2. ORSArequiredforlegalentity(insurer)andgroup
1. Requiredtodemonstratecomplianceatleastannually
1. OnlyfewexemptionsforcompanieswithpremiumincomebelowEUR5M orreservesbelowEUR25M
1. Companiesneedtodemonstrateeffectiveriskmanagementpractices2. InadditioncompaniesusinganinternalmodelneedtosatisfyUseTest
•Pricing•Reinsurance
•Capitalmanagement•Performancemanagement
•Planning
1. Quantitativeassessmentmustbeforwardlooking(minimum3years)requiresprojectionofbalancesheetandcapitalrequirements
1. Internalreport2. ERMframework3. Supervisoryreport4. Recordofeachprocess
1. ORSAshouldbeappropriatetonature,scaleandcomplexityofrisks2. StipulatedinmoredetailinLevel3Guidance
1. Boardisownerofriskmanagement2. ORSAneedssign-offbymanagementboard
1. Atleastannually2. Followingchangesinriskprofile
1. Quantitativeorqualitativeassessmentofmaterialrisksrequired2. Mayincludestresstests,stochastictest,reversestresstests3. Analysisusingbothnormalandstressconditions4. Mustconsiderimpactofstressesonavailableandrequiredcapital
1. Yes2. ORSAnotrequiredforeachentitybutshouldbeconsistentwiththeway
thebusinessismanaged
1. Nothingspecificallyrequired
1. Basedonpremiumthreshold
1. ORSAshould:1.FostereffectiveERM2.Providegrouplevelperspectiveonriskandcapital
1. Mustbeabletoexecuteamulti-yearbusinessplan2. Shouldbeappropriateperiodbasedonriskprofileandsize3. Considerprojectedbalancesheetandincomestatement
1. Internaldocumentofprocessandresults2. High-levelSummaryreporttoleadstatecommissionerifpartofgroupandupon
requestbyregulator
1. ORSAshouldbeappropriatetonature,scaleandcomplexityofrisks
1. ORSAshouldbeappropriatetonature,scaleandcomplexityofrisks
1. Annuallyifnotmore
SOLVENCY II
Solvency II
Solvency II
Solvency II
Solvency II
Solvency II
Solvency II
Solvency II
Solvency II
Solvency II
GROUP ASSESSMENT OF CAPITAL
COMPLIANCE WITH CAPITAL REQUIREMENTS
EXEMPTIONS
ERM
TIME HORIZON
REQUIRED DOCUMENTATION
PROPORTIONALITY
ROLE OF BOARD
FREQUENCY
NAIC
NAIC
NAIC
NAIC
NAIC
NAIC
NAIC
NAIC
NAIC
NAIC

21
GAINING OPTIMUM VALUE fROM ORSAorSa was first introduced as a regulatory requirement as a result of Solvency ii. (re)insurers would be wise to take note
of the many similarities between Solvency ii and the naiC’s orSa and, where possible, avoid reinventing the wheel
when trying to implement them. now, and especially with the introduction of the iCS, it is increasingly important for
(re)insurers to avoid unnecessary, redundant and duplicative activity in the attainment of regulatory satisfaction by
striving for a uniform framework to establish risk management and controls, corporate governance, transparency and
disclosures across borders. in so doing, (re)insurers will gain optimum value from their orSa.
the primary objective of both the naiC’s and Solvency ii’s orSa is for (re)insurers to be able to demonstrate to
regulators that the legal entities or statutory companies and the group or holding companies have enough regulatory
and economic capital to cover all of their risk and run their businesses. interestingly enough, the iCS is all about creating
a consistent capital measure across globally active (re)insurers and is supposed to provide a solution for group-wide
supervisors to better manage capital allocation around an international business. in the wake of all of this regulation,
(re)insurers would be wise to try and kill two regulatory birds with one stone. We expect the concepts of orSa to play
a significant role in (re)insurance supervision around the globe in at least the following areas:
1. group capital assessments will be performed and examiners, analysts and regulators will use orSa to
assess groups’ own assessment and management of capital.
2. orSa can also provide information to the supervisors in determining supervisory actions, including
sanctions and even capital add-ons that supervisors can impose on (re)insurers.
3. orSa should be used as a tool to help supervisors understand the (re)insurer’s risks and how risk and
capital is managed.
4. a successful and effective Solvency ii orSa process should lend itself to a smoother transition into iCS,
but (re)insurers in the united States will need to understand that iCS, as it is defined today, would be
a considerable change for them. although u.S. (re)insurers would also be wise to leverage the orSa
components in addressing the iCS calculation.
a possible consideration for u.S. (re)insurers is to examine the requirements for a complete orSa Summary report
– specifically Section 3: group risk and Solvency. While iCS would mean a considerable change from the way u.S.
(re)insurers plan on completing Section 3, there is no reason to think that iCS could not be used someday when
completing this section of the orSa Summary report.

22
ORSA fRAMEwORk(re)insurers that are required to implement orSa, or a similar framework such as iCaap, may benefit by adopting a
strong orSa/erm framework. one such framework that could work on a global basis is illustrated in figure 4.
there are four layers to the orSa/erm process. layer 1, is the “Strategy” and it is here where (re)insurers articulate their
mission, value proposition, risk appetite and their risk tolerances. layer 2, is the “Risk Management Process.” layer 2 may
very well be the foundation for orSa/erm as it is here where (re)insurers maintain their risk management processes and
it is here where risks are identified, assessed (quantified), mitigated, monitored and reported on to the stakeholders.
layer 2 is also where the internal model, including the calculation kernel, under Solvency ii resides and where risks and
capital management are to be synchronized with the (re)insurer’s planning process. layer 3, “Infrastructure,” includes
corporate governance, data, systems, methodologies and models, policies and reporting. layer 4, “Culture,” is where
the Board and senior management set the risk management tone through compensation, training, communication
and performance standards.
• Actual capital assessment standards and capital classification
• Identification of risks not captured by Pillar 1
• Integrated Risk Rating
• Solvency Aligned Risk Management Requirements and Assessment (SARMRA)
• Improve risk disclosure and transparency
• Develop market disciplinary mechanism and optimize the market environment
Quantitative CapitalRequirements
(Pillar 1)
Company’s Solvency Management
Qualitative CapitalRequirements
(Pillar 2)
• One supervision• Emerging markets
• Risk-oriented with value consideration
Disclosure
(Pillar 3)
Source: Guy Carpenter
Source: CIRC
F-1 | REGULATION SOPHISTICATION SCALE
Minimumcapital
Formula,No risk weight RBC Economic capital,
ORSA/ICAAP
Myanmar
Brunei, India, Macau, Sri Lanka, Vietnam
Philippines, Indonesia, Thailand, Hong Kong* Australia, Switzerland, Solvency II*
China*, Japan*, Malaysia*, New Zealand, Singapore*, S. Korea, Taiwan, U.S.
* Indicates anticipated location on scale after implementation of pending regulations
Lowimpact• Fixed income investments
F-3 | C-ROSS FRAMEWORK
Low-to-mediumimpact• Equity investments
• Credit-reinsurance recoverables
Mediumimpact• Loss and LAE reserves
• Net premium written
Medium-to-highimpact• Potential cat losses
Source: Guy Carpenter
F-5 | MSA BASIC FRAMEWORK
Component 1
SensitivityTesting
Evaluation
Component 2
LossValidation
Component 3
ScientificAppraisal
Component 4
MSA Grid
Integration
Client’s View of Risk
Component 5
Model Enhancement
Component 6
RiskCustomization
Component 7
Documentation
Communication
Component 8
Knowledge Sharing
Minimum capital Formula, No risk weight RBC Economic capital, ORSA/ICAAP
Japan
China
India
Australia
South Korea
Indonesia Thailand
Malaysia
Singapore
Philippines
Taiwan
Hong Kong
New Zealand
Vietnam 0
10,000
20,000
30,000
40,000
50,000
60,000
70,000
Bubbled size = GDP (USD)
F-2 | ASIAN ECONOMIES AND INSURANCE REGULATION IN PERSPECTIVE
2014 GDP Growth
GD
P/C
apita
(1.00) 0.00 1.00 2.00 3.00 4.00 5.00 6.00 7.00 8.00
Source: Economist Intelligence Unit, Guy Carpenter Analysis
Reg
ulat
ory
req
uire
men
tsSy
stem
char
acte
rist
ics
F-4 | ORSA/ERM FRAMEWORK –THE FOUR LAYERS
Source: Oliver Wyman Group
INFRASTRUCTUREPROCESS
Risk identification Risk assessment Risk m
easurement Controlling/m
itigat
ing
Ris
k re
port
ing
CULTURE
Embedded
Compensation
Performance measures
Risk policies
Datamanagement
Reporting &planning
IT &technology
STRATEGY
MissionRisk strategyRisk appetite
Value proposition
Modeling
Risk limits& controls
Organization
Communication
Tone at top
An e�ective ERM is important because it will…
• Enable a deeper understandingof and broader adherence to therisk appetite
• Drive a positive risk culture
• Link risk, capital management and business strategy with each other
• Enable understanding of keyrisk drivers
• Comprehensively assess the current risk profile and aid in forward looking risk management
• Help in the planning process, especially around capitalmanagement
• Provide insight on the robustness and e�cacy of risk management processes, tools and controls
• Satisfy regulatory and ratings agencies requirements and facilitate constructive dialogue
23
ADDRESSINGORSA/ERMANDICSGLOBALLYin accordance with the objectives of the naiC and eiopa, orSa is “people and risk-centric,” primarily employing a
principles-based approach, as opposed to a rules-based approach. this means that decisions on matters related
to risks are largely based on the judgment of individuals relying on underlying facts, as opposed to decisions being
made mostly by following intricate sets of rules. this is similar to the principles-based approach taken by international
Financial reporting Standards (iFrS). although the calculation of the Solvency Capital requirements (SCr) under
Solvency ii is rules based, like iCS, Solvency ii can be a “one size fits all” rules-based approach to capital, especially if
the standard formula is used. (re)insurers will need to find a way to incorporate iCS into their orSa processes and the
vehicle to accomplish this may be through the internal model.
the calculation of the iCS will most likely be very complicated but it is too soon to determine if the calculation of the
capital measure under iCS will be too dissimilar from the calculation kernel under Solvency ii or even the economic
capital requirements under the naiC’s orSa. With any luck, the calculation of the capital requirements will be similar
to that which groups are already doing and using either because it is similar to the main regulatory calculation or is
similar to the (re)insurer’s own internal model and the calculation of the capital requirements in the calculation kernel.
time will tell just how complicated the iCS will be and whether it will be similar to the standard formula in Solvency ii.
INTERNAL MODELWhat is an internal model? the eiopa does not give a formal definition of what an internal model is. however, in
Article 112, general provisions for the approval of Full and partial models in the Solvency ii Directive, it merely states
that “member States shall ensure that insurance or reinsurance undertakings may calculate the Solvency Capital
requirements using a full or partial internal model as approved by the supervisory authorities.”
much like eiopa, the naiC stated that quantitative risk measurement should incorporate a “range of outcomes” and
that a (re)insurer should use “risk measurement techniques that are fit for purpose and that are proportional to the
(re)insurer’s risk profile and size.” however, unlike european regulators that are required to approve a (re)insurer’s
internal model, the naiC is not currently requiring pre-approval of the (re)insurer’s internal model prior to its use.
What will be interesting to see is how the different proposed iCS options may affect (re)insurers. hopefully whichever
option is selected, it will be a calculation that is not too dissimilar from the one done today or the one that will be done
under Solvency ii and naiC orSa.
THIRD-COUNTRY EQUIVALENCECurrent capital requirements in the united States are set at a legal-entity level. yet there are currently no global
requirements for companies that operate in more than one country, and calculation formulas for capital requirements
typically vary in each jurisdiction. Solvency ii is the closest to mandating a group standard. Solvency ii uses the concept
of “equivalence” to deal with differing capital regimes between the eu and the rest of the world including the united
States, instead of forcing Solvency ii standards on a third country.
in June 2015, the european Commission confirmed “provisional” equivalence for a period of 10 years for six countries –
australia, Bermuda, Brazil, Canada, mexico and the united States. only Switzerland was granted “full and permanent”
equivalence status. to calculate the group solvency position, european insurance groups are permitted to use the local
capital requirement rules of the corresponding country for subsidiaries within these seven countries. But there is still a
lot of uncertainty around the extent to which the different rBC ratios should be used.
24
For subsidiaries in other countries, european insurance groups are still in the dark as to which capital requirement
rules should apply. the same is true for possible group supervisory requirements for european subsidiaries of overseas
groups and the requirements for reinsurance contracts bought from reinsurers outside europe. a second round
of equivalence decisions by the european Commission is expected in the autumn of 2015. it is believed that other
countries, such as China, hong Kong and Singapore are also interested in “provisional” equivalence status.
the Japanese Financial Services agency is seeking to achieve equivalence only for domestic reinsurance companies
writing business in europe. this will allow Japan-domiciled reinsurers to assume business in europe without collateral
requirements for unearned premium or reinsurance recoverables. in a 2015 report by eiopa, Japan was listed as
equivalent or largely equivalent in five out of six considered categories, so it is believed that Japan will be granted “full
and permanent” equivalence for reinsurance business.
u.S. insurance regulators have historically required non-u.S. reinsurers to hold 100 percent collateral within the united
States for the risks they assume from u.S. insurers. as reinsurers are ultimately providing insurance to other insurance
companies that are directly protecting u.S. policyholders, requiring collateral in the united States is intended to ensure
claims-paying capital is available and reachable by u.S. firms and regulators should it be needed, particularly in the
wake of a natural disaster. Foreign reinsurers’ regulators and politicians have objected to this requirement in part
because this capital is not available for investment in other opportunities.
State regulators understand and recognize that the potential for variation across states makes planning for collateral
liability more uncertain and thus potentially more expensive. State regulators have been working together through
the naiC to reduce collateral requirements in a consistent manner commensurate with the financial strength of the
reinsurer and the quality of the regulatory regime that oversees it.
recently, the naiC passed amendments that reduce the financial strain on foreign reinsurers. Foreign insurers may post
less than 100 percent collateral for u.S. claims, provided the reinsurer is evaluated. the naiC established a number of
new processes and procedures for evaluating and overseeing foreign reinsurers in addition to making amendments to
the “Credit for reinsurance models.”

25
V. RATING AGENCY DEVELOPMENTS
inCreaSingly, a Well-DeFineD riSK management FrameWorK With BoarD oF DireCtorS oVerSight iS the BaSeline StanDarD expeCteD From CompanieS SeeKing a rating.
26
there is a great deal of overlap between the goals of government regulators and credit rating agencies. the difference,
however, is in the output, with regulators providing a license to trade, or not, and the rating agencies offering a
graduated scale of relative strength. regulatory solvency approval can be viewed as a “qualifier” or minimum standard
required to be considered by a customer. a credit rating, on the other hand, can act as a “winner” or differentiating
factor that results in a successful sale.
given their impact on customer buying decisions, international rating agencies are able to quickly influence boardroom
discussion around topics such as emerging risks, erm best practices and catastrophe analytics. Currently, the capital
and management sophistication levels needed to obtain a strong credit rating are escalating. as (re)insurance buyers
continue to value the claims-paying ability of their trading partners, rating agency standards will continue to push
insurer erm and capital adequacy innovation further.
UNITED STATESa.m. Best has hosted several Webinars in 2015 to share their proposed changes and preliminary observations related
to their efforts to upgrade the Best’s Capital adequacy ratio (BCar) capital model to include stochastic-based analysis.
the rating agency is in the process of completing internal testing and expects to issue a draft criteria report in the
summer of 2015, with a goal to implement the new model in the second quarter of 2016 using year-end 2015 data. it is
important to note that a.m. Best has not finalized its stochastic BCar model and many open questions and alternative
treatments are being considered during this testing/calibration phase.
a.m. Best plans to establish consistent Var metrics across risk components (investments, interest rate, credit, loss
reserves, underwriting) tied to a company’s rating level and implied security standard. While difficult to predict the final
outcome of these changes directionally, it is anticipated that risk factors will increase.
the methodology of the p&C BCar calculation is expected to remain the same, with the exception of “potential
Catastrophe losses,” which will be moved to the numerator from the denominator. the expected impact of this change
would be to reduce BCar scores for catastrophe-exposed companies.
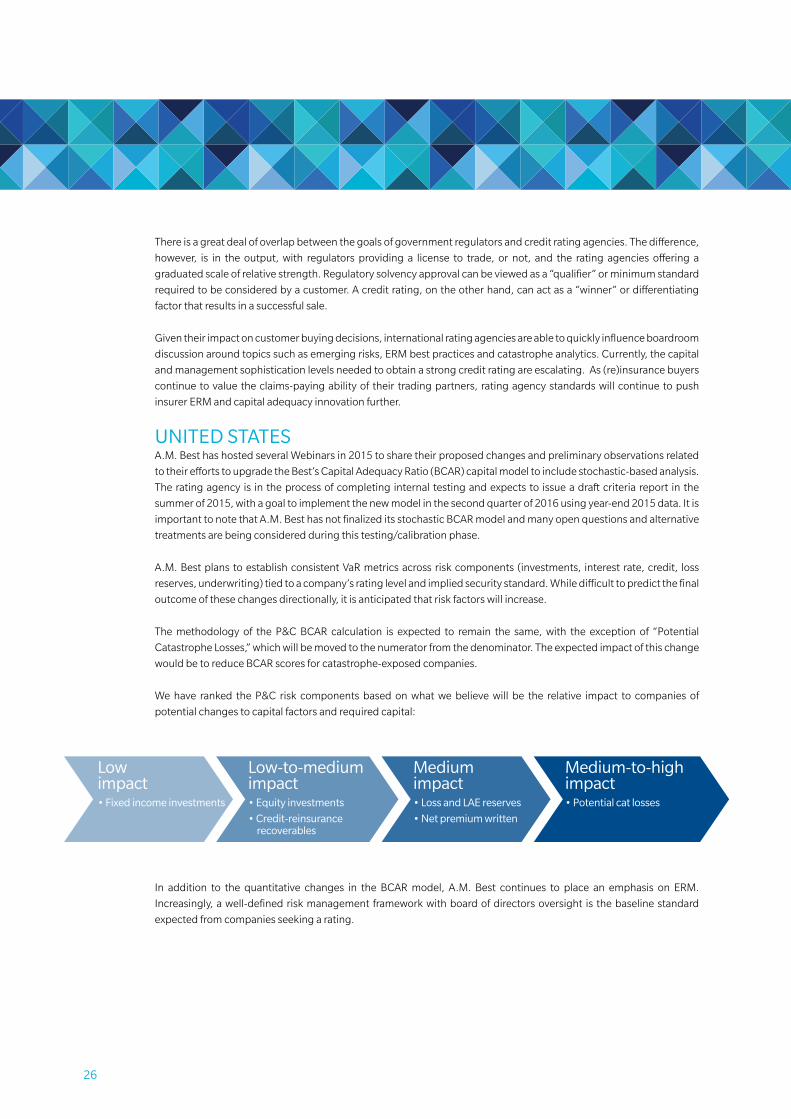
We have ranked the p&C risk components based on what we believe will be the relative impact to companies of
potential changes to capital factors and required capital:
in addition to the quantitative changes in the BCar model, a.m. Best continues to place an emphasis on erm.
increasingly, a well-defined risk management framework with board of directors oversight is the baseline standard
expected from companies seeking a rating. • Actual capital assessment standards and capital classification
• Identification of risks not captured by Pillar 1
• Integrated Risk Rating
• Solvency Aligned Risk Management Requirements and Assessment (SARMRA)
• Improve risk disclosure and transparency
• Develop market disciplinary mechanism and optimize the market environment
Quantitative CapitalRequirements
(Pillar 1)
Company’s Solvency Management
Qualitative CapitalRequirements
(Pillar 2)
• One supervision• Emerging markets
• Risk-oriented with value consideration
Disclosure
(Pillar 3)
Source: Guy Carpenter
Source: CIRC
F-1 | REGULATION SOPHISTICATION SCALE
Minimumcapital
Formula,No risk weight RBC Economic capital,
ORSA/ICAAP
Myanmar
Brunei, India, Macau, Sri Lanka, Vietnam
Philippines, Indonesia, Thailand, Hong Kong* Australia, Switzerland, Solvency II*
China*, Japan*, Malaysia*, New Zealand, Singapore*, S. Korea, Taiwan, U.S.
* Indicates anticipated location on scale after implementation of pending regulations
Lowimpact• Fixed income investments
F-3 | C-ROSS FRAMEWORK
Low-to-mediumimpact• Equity investments
• Credit-reinsurance recoverables
Mediumimpact• Loss and LAE reserves
• Net premium written
Medium-to-highimpact• Potential cat losses
Source: Guy Carpenter
F-5 | MSA BASIC FRAMEWORK
Component 1
SensitivityTesting
Evaluation
Component 2
LossValidation
Component 3
ScientificAppraisal
Component 4
MSA Grid
Integration
Client’s View of Risk
Component 5
Model Enhancement
Component 6
RiskCustomization
Component 7
Documentation
Communication
Component 8
Knowledge Sharing
Minimum capital Formula, No risk weight RBC Economic capital, ORSA/ICAAP
Japan
China
India
Australia
South Korea
Indonesia Thailand
Malaysia
Singapore
Philippines
Taiwan
Hong Kong
New Zealand
Vietnam 0
10,000
20,000
30,000
40,000
50,000
60,000
70,000
Bubbled size = GDP (USD)
F-2 | ASIAN ECONOMIES AND INSURANCE REGULATION IN PERSPECTIVE
2014 GDP Growth
GD
P/C
apita
(1.00) 0.00 1.00 2.00 3.00 4.00 5.00 6.00 7.00 8.00
Source: Economist Intelligence Unit, Guy Carpenter Analysis
Reg
ulat
ory
req
uire
men
tsSy
stem
char
acte
rist
ics
F-4 | ORSA/ERM FRAMEWORK –THE FOUR LAYERS
Source: Oliver Wyman Group
INFRASTRUCTUREPROCESS
Risk identification Risk assessment Risk m
easurement Controlling/m
itigat
ing
Ris
k re
port
ing
CULTURE
Embedded
Compensation
Performance measures
Risk policies
Datamanagement
Reporting &planning
IT &technology
STRATEGY
MissionRisk strategyRisk appetite
Value proposition
Modeling
Risk limits& controls
Organization
Communication
Tone at top
An e�ective ERM is important because it will…
• Enable a deeper understandingof and broader adherence to therisk appetite
• Drive a positive risk culture
• Link risk, capital management and business strategy with each other
• Enable understanding of keyrisk drivers
• Comprehensively assess the current risk profile and aid in forward looking risk management
• Help in the planning process, especially around capitalmanagement
• Provide insight on the robustness and e�cacy of risk management processes, tools and controls
• Satisfy regulatory and ratings agencies requirements and facilitate constructive dialogue
27
EUROPEin anticipation of the January 2016 rollout, the european insurance industry is focused squarely on Solvency ii. rating
agencies have recently refrained from instituting any new criteria and appear to be watching these developments with
a keen eye.
For example, it is expected that a.m. Best will deploy the stochastic BCar analysis one year after its u.S. release (target
europe 2017). Standard & poors (S&p) has not announced any new criteria since the 2013 revision of global criteria,
which left the capital model untouched but improved the transparency and consistency of much of the rest of the
ratings assessment. in July of 2015, Fitch recalibrated its notching criteria for the insurance sector, which led to multiple
reinsurer upgrades.
ASIA PACIfICin asia pacific, as elsewhere in the world, a.m. Best continues to place an increased level of emphasis on erm program
development.
Catastrophe risk, particularly for non-vendor modeled perils, remains an important component of companies’ risk
management review and the capital adequacy analysis as many asian countries face multiple catastrophe perils
including flood, typhoon, earthquake, volcano and terrorism.
in less developed economies, counterparty credit risk can also impact capital adequacy ratios. For example, recent
reinsurance cession requirements in indonesia have created a difficult situation. the regulatory body encourages
companies to obtain ratings from global rating agencies while requiring insurers to cede a larger amount to domestic
reinsurers that do not have a rating. these cedents then face higher credit risk charges which result in pressure
on ratings.
Companies seeking an S&p Financial Strength rating in less developed economies often find their rating limited by the
sovereign rating of the country of domicile, regardless of stand-alone financial strength. this limitation as a function of
rating criteria has contributed to S&p’s shrinking market share in the region.
Fitch and moody’s have similar sovereign rating “ceilings” built into their criteria, but each have invested heavily in
the region to grow ratings coverage. moody’s appear to have recently captured a leading market share in insurance
financial strength ratings in China.

28
VI. MEETING THE CHALLENGES
the inSuranCe inDuStry relieS to a large extent on CataStrophe moDelS to manage CataStrophe riSK. regulatorS anD rating agenCieS reCognize thiS FaCt By aSKing CompanieS to JuStiFy their moDeling approaCh. the unDerlying oBJeCtiVe oF SuCh ruleS iS to enCourage CompanieS to haVe a roBuSt anD ConSiStent proCeSS to uSe moDeling toolS reSponSiBly.

29
in realizing the goal of profitable growth, (re)insurers require a trusted partner to help them manage a rapidly evolving
regulatory and rating agency environment.
REGULATORY ADVISORYthe regulatory issues facing insurers and reinsurers today often require highly specialized expertise that may not be
readily accessible to clients – from taking credit for reinsurance on financial statements to complying with regulatory
requirements in contract wordings to shepherding new products through the approval process. guy Carpenter
Strategic advisorySm has a team of professionals whose deep expertise and knowledge can help companies navigate
the regulatory realm.
in order to respond to client regulatory needs, guy Carpenter Strategic advisory provides a broad range of consulting
services in a number of areas, including licensing, market conduct examination, contracts, trusts and letters of credit,
Solvency ii, orSa and erm advisory, research and client advocacy.
RATING AGENCY ADVISORYratings are a key indicator for many insurers and (re)insurance buyers. amid evolving rating agency concerns and the
complexity of erm requirements, guy Carpenter Strategic advisory provides clarity. We help clients take a proactive
approach to enhance risk-adjusted capitalization, build up erm, improve communications with rating agencies and
optimize rating outcomes.
the guy Carpenter rating agency advisory team helps clients understand the factors that influence ratings, identify the
information and opportunities that can positively (and negatively) impact assessments and strategically communicate
with rating agencies. We have a long and proven track record of providing technically credible and practical ratings
advice and solutions.
our extensive rating agency experience and insight, coupled with guy Carpenter’s expertise in risk management,
reinsurance and capital markets, uniquely position us to provide clients with best-in-class advice and solutions
to achieve ratings goals. additionally, we are able to embed this knowledge into the reinsurance broking and gC
Securities* mergers and acquisitions and insurance-linked securities offerings, ensuring that strategic decisions are
reviewed for their impact on existing ratings.
the rating advisory team delivers a wide range of comprehensive advisory services, including indicative rating
assessment, financial modeling and analysis, presentation support and erm advisory.
CATASTROPHE MODELINGthe insurance industry relies to a large extent on catastrophe models to manage catastrophe risk. regulators and
rating agencies recognize this fact by asking companies to justify their modeling approach. the underlying objective of
such rules is to encourage companies to have a robust and consistent process to use modeling tools responsibly. this
often entails:
• understanding the models and their uncertainty
• Validating the tools they adopt and invalidating the ones they choose not to adopt
• Justifying any adjustments and variations made to commercially available models.
a company that is confident in these areas will have an easier time responding to new regulatory submission
responsibilities.

30
model Suitability analysis (mSa)®: Catastrophe model Confidenceto assist clients in the pursuit of developing a view of risk in which they have confidence, guy Carpenter introduced the
model Suitability analysis (mSa) initiative in 2012. the mSa framework consists of eight components arranged across
three pillars: evaluation, integration and communication:
MSA Evaluation is driven by rigorously defined tests that cover the three critical areas in which models are investigated:
• Sensitivity testing – to establish how the model responds to changes in portfolio data
• loss Validation – to determine whether the model is proficient at reproducing historical claims
• Scientific appraisal – to benchmark model assumptions against scientific datasets.
MSA Integration is about incorporating guy Carpenter’s mSa knowledge into our clients’ operations. tests are tailored
to our clients’ risk exposures. Clients may choose to validate their view of risk or to recalibrate their models to a view
they believe is more suitable for their company.
MSA Communication consists of establishing a standard recording system for all assumptions and analyses made
within the company with regard to model evaluation and adjustments. through a series of protocols and standard
exhibits, mSa helps our clients communicate their understanding of risk with internal as well as with external
stakeholders. Clients use mSa documentation for regulatory submissions and for establishing a common view within
their corporate family.
• Actual capital assessment standards and capital classification
• Identification of risks not captured by Pillar 1
• Integrated Risk Rating
• Solvency Aligned Risk Management Requirements and Assessment (SARMRA)
• Improve risk disclosure and transparency
• Develop market disciplinary mechanism and optimize the market environment
Quantitative CapitalRequirements
(Pillar 1)
Company’s Solvency Management
Qualitative CapitalRequirements
(Pillar 2)
• One supervision• Emerging markets
• Risk-oriented with value consideration
Disclosure
(Pillar 3)
Source: Guy Carpenter
Source: CIRC
F-1 | REGULATION SOPHISTICATION SCALE
Minimumcapital
Formula,No risk weight RBC Economic capital,
ORSA/ICAAP
Myanmar
Brunei, India, Macau, Sri Lanka, Vietnam
Philippines, Indonesia, Thailand, Hong Kong* Australia, Switzerland, Solvency II*
China*, Japan*, Malaysia*, New Zealand, Singapore*, S. Korea, Taiwan, U.S.
* Indicates anticipated location on scale after implementation of pending regulations
Lowimpact• Fixed income investments
F-3 | C-ROSS FRAMEWORK
Low-to-mediumimpact• Equity investments
• Credit-reinsurance recoverables
Mediumimpact• Loss and LAE reserves
• Net premium written
Medium-to-highimpact• Potential cat losses
Source: Guy Carpenter
F-5 | MSA BASIC FRAMEWORK
Component 1
SensitivityTesting
Evaluation
Component 2
LossValidation
Component 3
ScientificAppraisal
Component 4
MSA Grid
Integration
Client’s View of Risk
Component 5
Model Enhancement
Component 6
RiskCustomization
Component 7
Documentation
Communication
Component 8
Knowledge Sharing
Minimum capital Formula, No risk weight RBC Economic capital, ORSA/ICAAP
Japan
China
India
Australia
South Korea
Indonesia Thailand
Malaysia
Singapore
Philippines
Taiwan
Hong Kong
New Zealand
Vietnam 0
10,000
20,000
30,000
40,000
50,000
60,000
70,000
Bubbled size = GDP (USD)
F-2 | ASIAN ECONOMIES AND INSURANCE REGULATION IN PERSPECTIVE
2014 GDP Growth
GD
P/C
apita
(1.00) 0.00 1.00 2.00 3.00 4.00 5.00 6.00 7.00 8.00
Source: Economist Intelligence Unit, Guy Carpenter Analysis
Reg
ulat
ory
req
uire
men
tsSy
stem
char
acte
rist
ics
F-4 | ORSA/ERM FRAMEWORK –THE FOUR LAYERS
Source: Oliver Wyman Group
INFRASTRUCTUREPROCESS
Risk identification Risk assessment Risk m
easurement Controlling/m
itigat
ing
Ris
k re
port
ing
CULTURE
Embedded
Compensation
Performance measures
Risk policies
Datamanagement
Reporting &planning
IT &technology
STRATEGY
MissionRisk strategyRisk appetite
Value proposition
Modeling
Risk limits& controls
Organization
Communication
Tone at top
An e�ective ERM is important because it will…
• Enable a deeper understandingof and broader adherence to therisk appetite
• Drive a positive risk culture
• Link risk, capital management and business strategy with each other
• Enable understanding of keyrisk drivers
• Comprehensively assess the current risk profile and aid in forward looking risk management
• Help in the planning process, especially around capitalmanagement
• Provide insight on the robustness and e�cacy of risk management processes, tools and controls
• Satisfy regulatory and ratings agencies requirements and facilitate constructive dialogue

31
VII. CONCLUSION the costs associated with compliance and disclosure will continue to rise as insurance regulators and rating agencies
increase their scrutiny of the industry. (re)insurers that operate on a global scale, for example, may wrestle with
the complexity of multiple capital requirements and the return targets of investors. Smaller companies, often with
fewer resources, may be forced to allocate a higher percentage of senior management’s time to compliance. it will
become increasingly more important for (re)insurers to avoid unnecessary and redundant activity when seeking
regulatory approval.
in addition to the increased administrative cost of compliance, higher risk-based capital requirements often reduce the
strategic flexibility of insurance company operations and ultimately lower returns.
While these evolving quantitative and qualitative reporting requirements are burdensome, they help regulators
more effectively track and manage risk and reduce harm to policyholders. there is also, of course, the potential for
overregulation leading to risk aversion, reduced competition in the form of higher premiums and fewer product options.
a delicate balance must be struck between the interest of government regulators, (re)insurers and policyholders.
When successful, appropriate regulations can improve underwriting discipline, protect consumers and build more
resilient markets.

32
Andrew CoxSenior Vice president Strategic advisory
Matthew DaySenior Vice president Strategic advisory
Guillermo FrancoSenior Vice president
Graham Jones Senior Vice president Strategic advisory
Markus MuellerSenior Vice president Strategic advisory
Mark Shumwaymanaging Director Strategic advisory
Jack Snydermanaging Director Strategic advisory
Steven Sumneroliver Wyman
James Wrynnmanaging Director Strategic advisory
Contributors
ContactUsFor additional information on guy Carpenter solutions, please contact your representative or visit your local office or guycarp.com. For media or general inquiries: Missy DeAngelis
+1 917 937 3118
Jennifer Ainslie
+44 207 357 2058

33
APPENDIx
Exhibit 1- Comparison of Premium and Reserve Risk Factorspremium risk factors under C-roSS and Solvency ii:
reserve risk factors under C-roSS and Solvency ii:
Motor 8.43~9.3% Motorvehicleliability 30% Motor,otherclasses 24%
Property/CEAR 29.1~40.2% Fire 24%
Marine 24.6~28.0% Marine,aviation,transport(MAT) 45%
Liability 9.0~14.5% Third-partyliability 42%
Agriculture 18.9~33.8%
PA 3.5~8.5% Incomeprotection 25.5%
Health 8.4~20.8%
Credit 37.3~46.3% Creditandsurety 36%
C-ROSS line Risk factor (RF) Solvency II line RF = Std. Dev x 3
Source: Guy Carpenter
Motor 10.03~11.45% Motorvehicleliability 27% Motor,otherclasses 24%
Property/CEAR 57.3~64.1% Fire 30%
Marine 51.3~63.2% Marine,aviation,transport(MAT) 33%
Liability 35.0~42.2% Third-partyliability 33%
Agriculture 27.8~39.8%
PA 13.0~19.3% Incomeprotection 42%
Health 16.8~24.7%
Credit 40.2~50.5% Creditandsurety 57%
C-ROSS line Risk factor (RF) Solvency II line RF = Std. Dev x 3
Source: Guy Carpenter

36
ABOUT GUY CARPENTERguy Carpenter & Company, llC is a global leader in providing risk and reinsurance intermediary services. With over 50 offices worldwide, guy Carpenter creates and executes reinsurance solutions and delivers capital market solutions* for clients across the globe. the firm’s full breadth of services includes line-of-business expertise in agriculture; aviation; casualty clash; construction and engineering; cyber solutions; excess and umbrella; excess and surplus lines; healthcare & life; marine and energy; mutual insurance companies; political risk and trade credit; professional liability; property; public sector; retrocessional reinsurance; surety; terrorism and workers compensation. gC Fac® is guy Carpenter’s dedicated global facultative reinsurance unit that provides placement strategies, timely market access and centralized management of facultative reinsurance solutions. in addition, gC analytics®** utilizes industry-leading quantitative skills and modelling tools that optimize the reinsurance decision-making process and help make the firm’s clients more successful. For more information, visit www.guycarp.com and follow guy Carpenter on twitter @guyCarpenter.
guy Carpenter is a wholly owned subsidiary of marsh & mclennan Companies (nySe: mmC), a global professional services firm offering clients advice and solutions in the areas of risk, strategy and people. marsh is a leader in insurance broking and risk management; guy Carpenter is a leader in providing risk and reinsurance intermediary services; mercer is a leader in talent, health, retirement, and investment consulting; and oliver Wyman is a leader in management consulting. With annual revenue of $13 billion and 57,000 colleagues worldwide, marsh & mclennan Companies provides analysis, advice and transactional capabilities to clients in more than 130 countries. the Company is committed to being a responsible corporate citizen and making a positive impact in the communities in which it operates. Visit www.mmc.com for more information and follow us on linkedin and twitter @mmC_global.
*Securities or investments, as applicable, are offered in the united States through gC Securities, a division of mmC Securities Corp., a uS registered broker-dealer and member Finra/nFa/SipC. main office: 1166 avenue of the americas, new york, ny 10036. phone: (212) 345-5000. Securities or investments, as applicable, are offered in the european union by gC Securities, a division of mmC Securities (europe) ltd. (mmCSel), which is authorized and regulated by the Financial Conduct authority, main office 25 the north Colonnade, Canary Wharf, london e14 5hS. reinsurance products are placed through qualified affiliates of guy Carpenter & Company, llC. mmC Securities Corp., mmC Securities (europe) ltd. and guy Carpenter & Company, llC are affiliates owned by marsh & mclennan Companies. this communication is not intended as an offer to sell or a solicitation of any offer to buy any security, financial instrument, reinsurance or insurance product. **gC analytics is a registered mark with the u.S. patent and trademark office.
DISCLAIMERthe data and analysis provided by guy Carpenter herein or in connection herewith are provided “as is”, without warranty of any kind whether express or implied. the analysis is based upon data provided by the company or obtained from external sources, the accuracy of which has not been independently verified by guy Carpenter. neither guy Carpenter, its affiliates nor their officers, directors, agents, modelers, or subcontractors (collectively, “providers”) guarantee or warrant the correctness, completeness, currentness, merchantability, or fitness for a particular purpose of such data and analysis. the data and analysis is intended to be used solely for the purpose of the company internal evaluation and the company shall not disclose the analysis to any third party, except its reinsurers, auditors, rating agencies and regulators, without guy Carpenter’s prior written consent. in the event that the company discloses the data and analysis or any portion thereof, to any permissible third party, the company shall adopt the data and analysis as its own. in no event will any provider be liable for loss of profits or any other indirect, special, incidental and/or consequential damage of any kind howsoever incurred or designated, arising from any use of the data and analysis provided herein or in connection herewith.
Statements or analysis concerning or incorporating tax, accounting, regulatory or legal matters should be understood to be general observations or applications based solely on our experience as reinsurance brokers and risk consultants and may not be relied upon as tax, accounting, regulatory or legal advice, which we are not authorized to provide. all such matters should be reviewed with the client’s own qualified advisors in these areas.
readers are cautioned not to place undue reliance on any historical, current or forward-looking statements. guy Carpenter & Company, llC undertakes no obligation to update or revise publicly any historical, current or forward-looking statements, whether as a result of new information, research, future events or otherwise.
this document or any portion of the information it contains may not be copied or reproduced in any form without the permission of guy Carpenter & Company, llC, except that clients of guy Carpenter & Company, llC need not obtain such permission when using this report for their internal purposes.
the trademarks and service marks contained herein are the property of their respective owners.
Guy Carpenter Report
© 2015 guy Carpenter & Company, llC


M2451.9.15.900k | (RE)INSURANCE REGULATORY REPORT |©2015GUYCARPENTER&COMPANY,LLC| GUYCARP.COM


![Preface to Credit for Reinsurance Models redlined 6... · Credit for Reinsurance Model Law] of the Act, for the payment of the valid claims of its U.S. domiciled ceding insurers,](https://img.pdfslide.net/doc/110x75/5f0b874f7e708231d430f676/preface-to-credit-for-reinsurance-models-redlined-6-credit-for-reinsurance.jpg)