Embed Size (px)
Citation preview
Interactive Poster: HARVEST - Visualization and Analysis for the MassesDavid Gotz, Zhen Wen, Jie Lu, Peter Kissa, Michelle X. Zhou
IBM T.J. Watson Research CenterNan Cao, Wei Hong Qian, Shi Xia Liu
IBM China Research Lab
ABSTRACT
HARVEST is an intelligent visualization system designed to em-power everyday business users to derive insight from large amountsof data. It combines three key technologies to support a complex,exploratory visualization-based analysis process without requiringusers to be visualization or computer experts. First, HARVEST em-ploys a set of smart visual analytic widgets that can be easily reusedacross applications and support incremental visual updates as re-quired by a continuous visual analytic process. Second, it has a vi-sualization recommendation engine that dynamically suggests suit-able visualization widgets to users in context. Third, it supportsthe semantics-based capture of user visual analytic activity for thereuse and sharing of insight provenance.
Keywords: Automated Visualization, Visual Analytics
Index Terms: H.4.3 [Communications Apps]: Info Browsers—
1 INTRODUCTION
In recent years, a large number of visualization systems havebeen developed to help users view, explore, and analyze informa-tion. The capabilities supported by these visualization systems varybroadly, ranging from supporting casual visual collaborations tocommercial-grade visual analytics.
At the same time, businesses are creating and storing more datathan ever before. Companies are increasingly looking to visualiza-tion as a way to uncover business insights from this data in supportof their employees’ daily business tasks. Yet despite this require-ment for visualization-based analysis from average business users,most of today’s visualization systems still target two niche audi-ences: (1) dedicated information analysts and (2) dashboard con-sumers.
Dedicated information analysts are those who have already ac-quired a high degree of visualization and computer skills and of-ten use sophisticated visualization software (e.g., Spotfire [2] orTableau [1]). These tools provide great analytic power, but are typi-cally too complex for average business users who often posses lim-ited computer or visualization skills.
In contrast, dashboard consumers are typically casual users ofvisualization. They often use common visualizations to view infor-mation (e.g., business dashboards) or engage in collaboration (e.g.,ManyEyes [4]). By design, these tools require far less skill andare accessible to a much wider range of users. However, they lackkey capabilities, such as continuous exploration of large data sets,which are required by many real-world business tasks.
While both of these audiences benefit greatly from existing vi-sualization tools, there is a third and perhaps largest class of usersfor whom existing tools are of limited value. This class of users—everyday business users—often have extensive domain knowledgebut are not visualization or computer experts. Yet as part of theirdaily responsibilities, they perform situational information analysistasks for which visualization can be of great benefit.
To address these challenges, we are building HARVEST, a vi-sual analytic system that is designed for everyday business users.
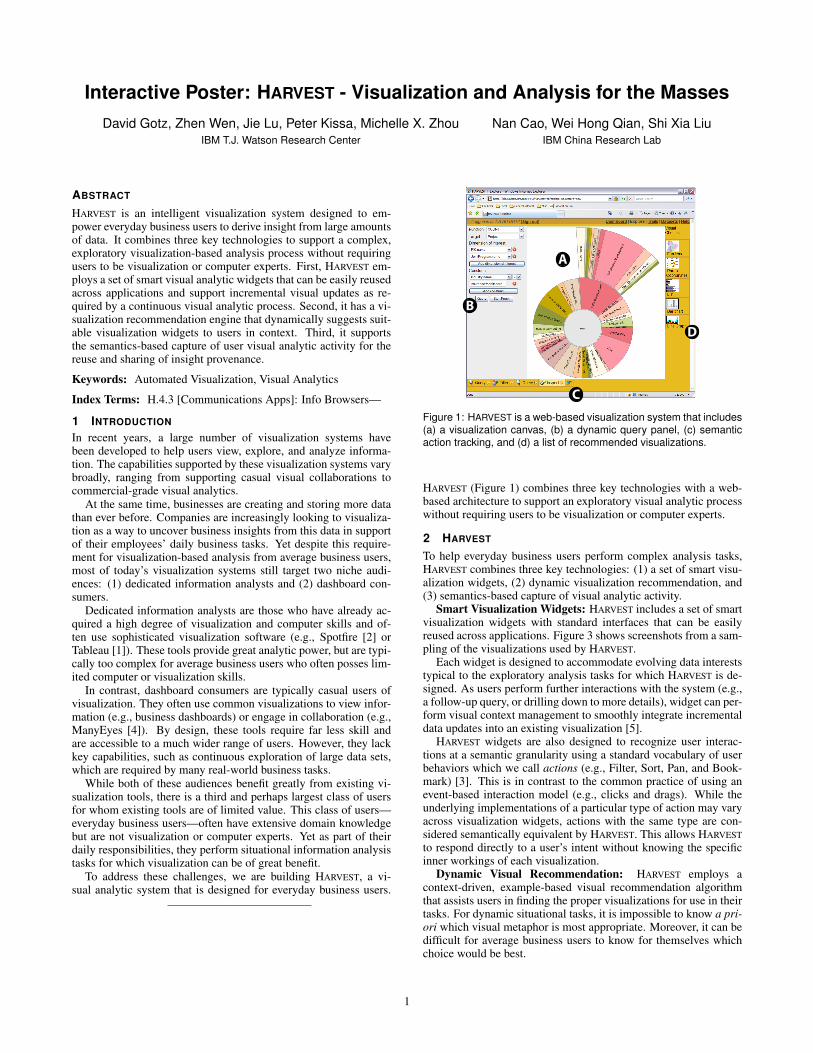
B
A
C
D
Figure 1: HARVEST is a web-based visualization system that includes(a) a visualization canvas, (b) a dynamic query panel, (c) semanticaction tracking, and (d) a list of recommended visualizations.
HARVEST (Figure 1) combines three key technologies with a web-based architecture to support an exploratory visual analytic processwithout requiring users to be visualization or computer experts.
2 HARVEST
To help everyday business users perform complex analysis tasks,HARVEST combines three key technologies: (1) a set of smart visu-alization widgets, (2) dynamic visualization recommendation, and(3) semantics-based capture of visual analytic activity.
Smart Visualization Widgets: HARVEST includes a set of smartvisualization widgets with standard interfaces that can be easilyreused across applications. Figure 3 shows screenshots from a sam-pling of the visualizations used by HARVEST.
Each widget is designed to accommodate evolving data intereststypical to the exploratory analysis tasks for which HARVEST is de-signed. As users perform further interactions with the system (e.g.,a follow-up query, or drilling down to more details), widget can per-form visual context management to smoothly integrate incrementaldata updates into an existing visualization [5].
HARVEST widgets are also designed to recognize user interac-tions at a semantic granularity using a standard vocabulary of userbehaviors which we call actions (e.g., Filter, Sort, Pan, and Book-mark) [3]. This is in contrast to the common practice of using anevent-based interaction model (e.g., clicks and drags). While theunderlying implementations of a particular type of action may varyacross visualization widgets, actions with the same type are con-sidered semantically equivalent by HARVEST. This allows HARVESTto respond directly to a user’s intent without knowing the specificinner workings of each visualization.
Dynamic Visual Recommendation: HARVEST employs acontext-driven, example-based visual recommendation algorithmthat assists users in finding the proper visualizations for use in theirtasks. For dynamic situational tasks, it is impossible to know a pri-ori which visual metaphor is most appropriate. Moreover, it can bedifficult for average business users to know for themselves whichchoice would be best.
1
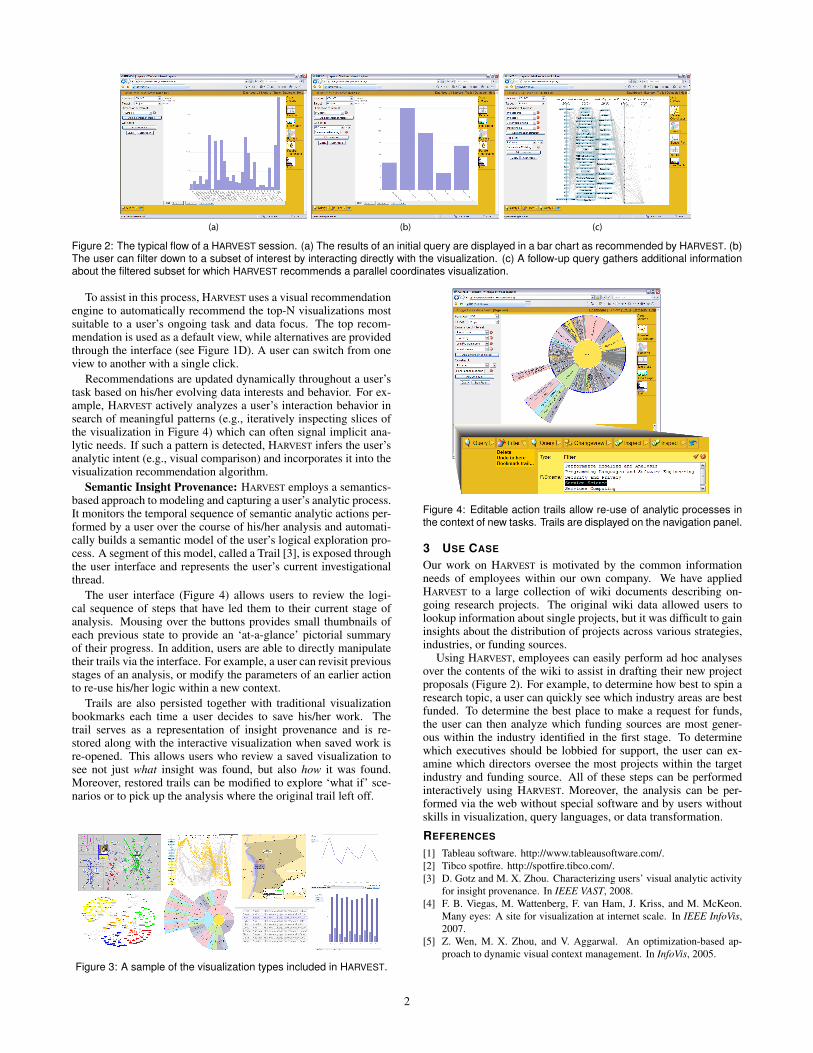
(a) (c)(b)
Figure 2: The typical flow of a HARVEST session. (a) The results of an initial query are displayed in a bar chart as recommended by HARVEST. (b)The user can filter down to a subset of interest by interacting directly with the visualization. (c) A follow-up query gathers additional informationabout the filtered subset for which HARVEST recommends a parallel coordinates visualization.
To assist in this process, HARVEST uses a visual recommendationengine to automatically recommend the top-N visualizations mostsuitable to a user’s ongoing task and data focus. The top recom-mendation is used as a default view, while alternatives are providedthrough the interface (see Figure 1D). A user can switch from oneview to another with a single click.
Recommendations are updated dynamically throughout a user’stask based on his/her evolving data interests and behavior. For ex-ample, HARVEST actively analyzes a user’s interaction behavior insearch of meaningful patterns (e.g., iteratively inspecting slices ofthe visualization in Figure 4) which can often signal implicit ana-lytic needs. If such a pattern is detected, HARVEST infers the user’sanalytic intent (e.g., visual comparison) and incorporates it into thevisualization recommendation algorithm.
Semantic Insight Provenance: HARVEST employs a semantics-based approach to modeling and capturing a user’s analytic process.It monitors the temporal sequence of semantic analytic actions per-formed by a user over the course of his/her analysis and automati-cally builds a semantic model of the user’s logical exploration pro-cess. A segment of this model, called a Trail [3], is exposed throughthe user interface and represents the user’s current investigationalthread.
The user interface (Figure 4) allows users to review the logi-cal sequence of steps that have led them to their current stage ofanalysis. Mousing over the buttons provides small thumbnails ofeach previous state to provide an ‘at-a-glance’ pictorial summaryof their progress. In addition, users are able to directly manipulatetheir trails via the interface. For example, a user can revisit previousstages of an analysis, or modify the parameters of an earlier actionto re-use his/her logic within a new context.
Trails are also persisted together with traditional visualizationbookmarks each time a user decides to save his/her work. Thetrail serves as a representation of insight provenance and is re-stored along with the interactive visualization when saved work isre-opened. This allows users who review a saved visualization tosee not just what insight was found, but also how it was found.Moreover, restored trails can be modified to explore ‘what if’ sce-narios or to pick up the analysis where the original trail left off.
Figure 3: A sample of the visualization types included in HARVEST.
Figure 4: Editable action trails allow re-use of analytic processes inthe context of new tasks. Trails are displayed on the navigation panel.
3 USE CASE
Our work on HARVEST is motivated by the common informationneeds of employees within our own company. We have appliedHARVEST to a large collection of wiki documents describing on-going research projects. The original wiki data allowed users tolookup information about single projects, but it was difficult to gaininsights about the distribution of projects across various strategies,industries, or funding sources.
Using HARVEST, employees can easily perform ad hoc analysesover the contents of the wiki to assist in drafting their new projectproposals (Figure 2). For example, to determine how best to spin aresearch topic, a user can quickly see which industry areas are bestfunded. To determine the best place to make a request for funds,the user can then analyze which funding sources are most gener-ous within the industry identified in the first stage. To determinewhich executives should be lobbied for support, the user can ex-amine which directors oversee the most projects within the targetindustry and funding source. All of these steps can be performedinteractively using HARVEST. Moreover, the analysis can be per-formed via the web without special software and by users withoutskills in visualization, query languages, or data transformation.
REFERENCES
[1] Tableau software. http://www.tableausoftware.com/.[2] Tibco spotfire. http://spotfire.tibco.com/.[3] D. Gotz and M. X. Zhou. Characterizing users’ visual analytic activity
for insight provenance. In IEEE VAST, 2008.[4] F. B. Viegas, M. Wattenberg, F. van Ham, J. Kriss, and M. McKeon.
Many eyes: A site for visualization at internet scale. In IEEE InfoVis,2007.
[5] Z. Wen, M. X. Zhou, and V. Aggarwal. An optimization-based ap-proach to dynamic visual context management. In InfoVis, 2005.
2


![ChOWDER: A VDA-Based Scalable Display System for ...sighpc.ipsj.or.jp/HPCAsia2020/hpcasia2020_poster_abstracts/poster... · the HIVE visualization system [3] via ChOWDER’s Web-API](https://img.pdfslide.net/doc/110x75/60523f909bd0865bf631e099/chowder-a-vda-based-scalable-display-system-for-the-hive-visualization-system.jpg)