Embed Size (px)
Citation preview
1
Interannual variability and long-term trends in global tropospheric ozone and related chemistry during recent decades
*Kengo Sudo1,2
1Grad. School of Environmental Studies, Nagoya University, Nagoya, Japan2JAMSTEC, Yokohama, Japan
Quadrennial Ozone Symposium 2016
4–9 September 2016 Edinburgh, United Kingdom
2
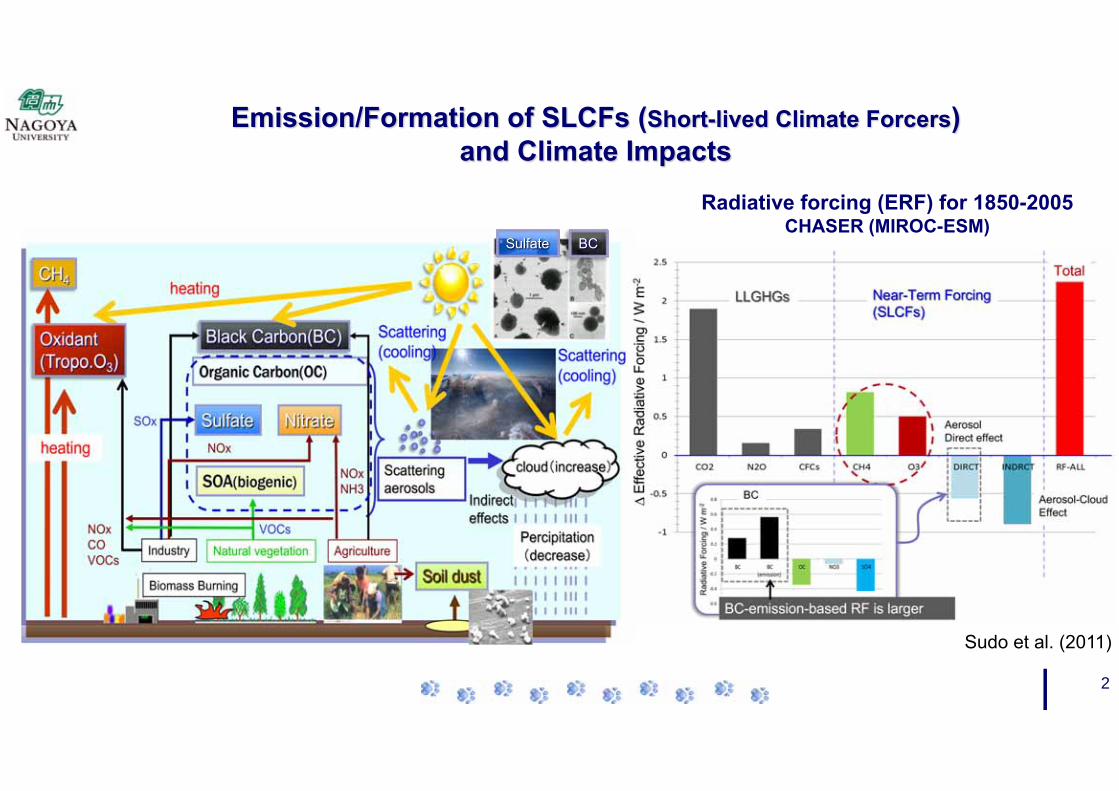
Emission/Formation of SLCFs (Short-lived Climate Forcers) and Climate Impacts
BCSulfate
Radiative forcing (ERF) for 1850-2005CHASER (MIROC-ESM)
Sudo et al. (2011)
3
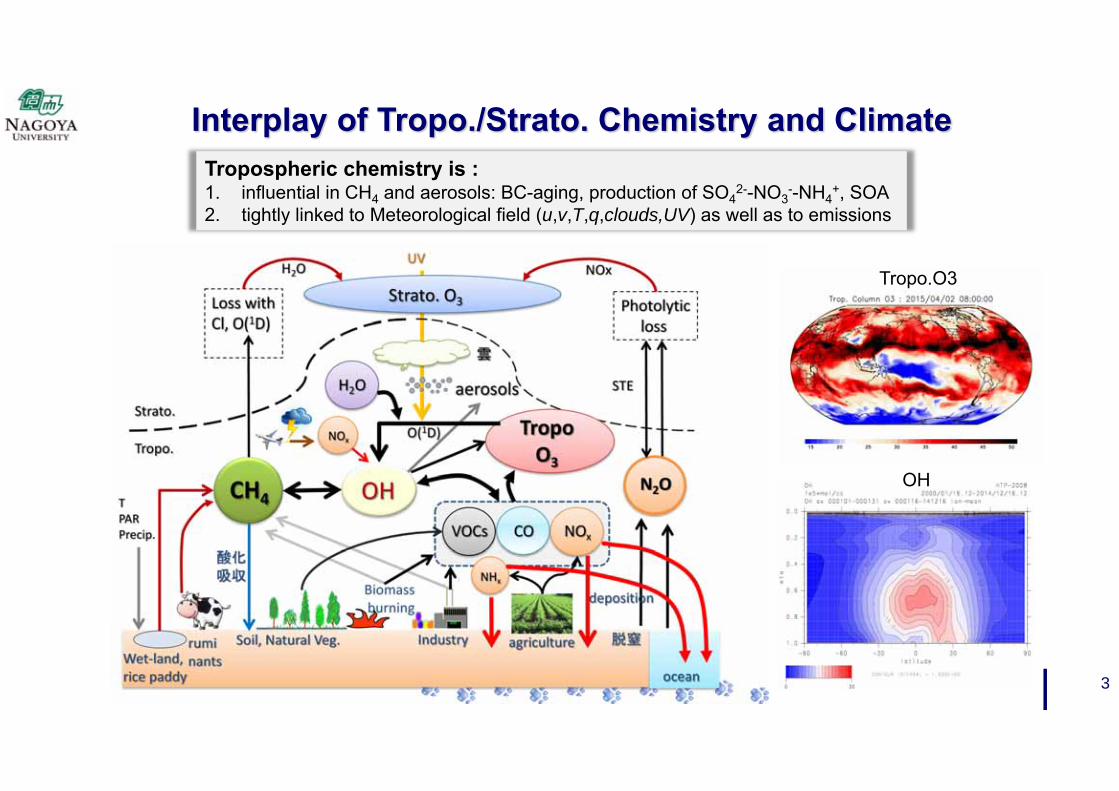
Interplay of Tropo./Strato. Chemistry and ClimateTropospheric chemistry is :1. influential in CH4 and aerosols: BC-aging, production of SO4
2--NO3--NH4
+, SOA2. tightly linked to Meteorological field (u,v,T,q,clouds,UV) as well as to emissions
Tropo.O3
OH

4
Tropospheric Column O3 (Sep.2015‐, 3‐hourly)
CHASER (MIROC‐ESM)
(Dobson‐Unit)
Ozone and related chemistry are highly variable under the multiple influences of atmospheric chemistry & transport
EmissionsAnthropogenicBiomass BurningNatural
(LNOx, BVOCs, etc.)
Meteorology:TransportWater-vaporClouds
CHASER NAGOYA
To elucidate long-term trend and interannual variability (IAV) in O3 and related species (like OH) is a key to precise understanding of chemistry-climate interaction
This talk will discuss long-term trend and IAV in O3 and related species (OH, CH4) in recent decades using the CHASER simulations for CCMI project etc.
5
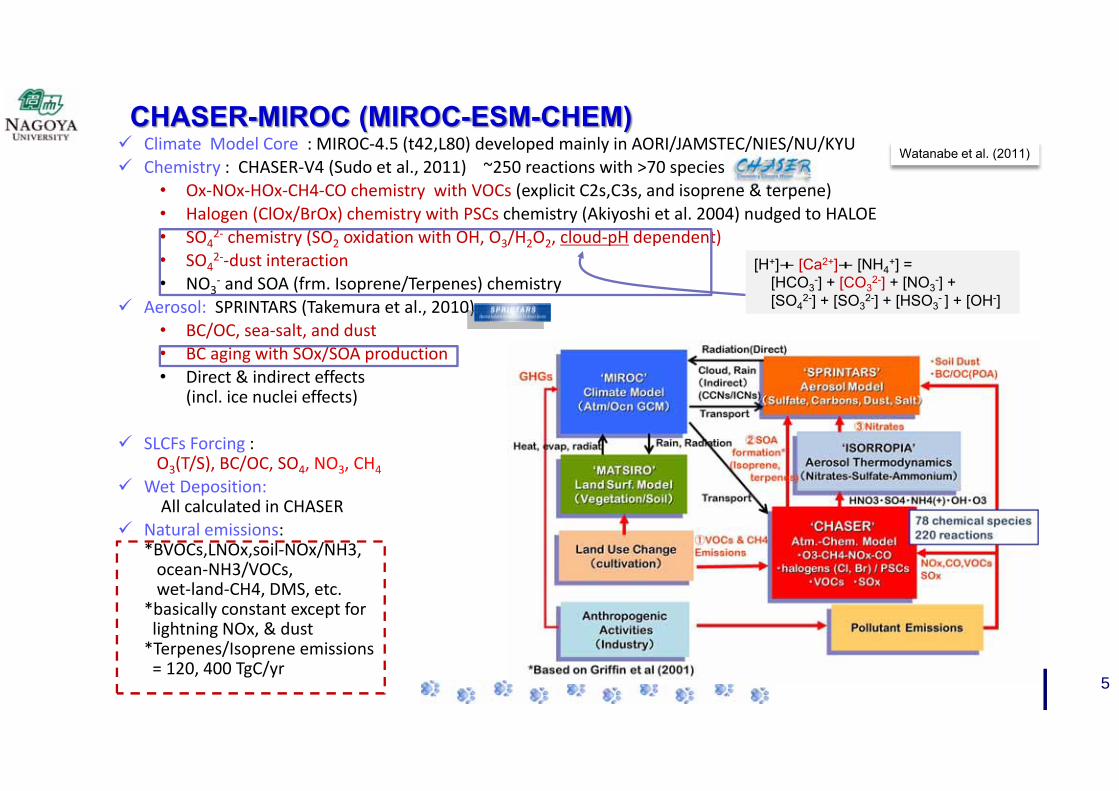
CHASER-MIROC (MIROC-ESM-CHEM) Climate Model Core : MIROC‐4.5 (t42,L80) developed mainly in AORI/JAMSTEC/NIES/NU/KYU Chemistry : CHASER‐V4 (Sudo et al., 2011) ~250 reactions with >70 species
• Ox‐NOx‐HOx‐CH4‐CO chemistry with VOCs (explicit C2s,C3s, and isoprene & terpene)• Halogen (ClOx/BrOx) chemistry with PSCs chemistry (Akiyoshi et al. 2004) nudged to HALOE• SO4
2‐ chemistry (SO2 oxidation with OH, O3/H2O2, cloud‐pH dependent)• SO4
2‐‐dust interaction• NO3
‐ and SOA (frm. Isoprene/Terpenes) chemistry Aerosol: SPRINTARS (Takemura et al., 2010)
• BC/OC, sea‐salt, and dust• BC aging with SOx/SOA production• Direct & indirect effects
(incl. ice nuclei effects)
SLCFs Forcing : O3(T/S), BC/OC, SO4, NO3, CH4
Wet Deposition:All calculated in CHASER
Natural emissions: *BVOCs,LNOx,soil‐NOx/NH3, ocean‐NH3/VOCs, wet‐land‐CH4, DMS, etc.
*basically constant except for lightning NOx, & dust*Terpenes/Isoprene emissions= 120, 400 TgC/yr
Watanabe et al. (2011)
[H+]+ [Ca2+]+ [NH4+] =
[HCO3-] + [CO3
2-] + [NO3-] +
[SO42-] + [SO3
2-] + [HSO3- ] + [OH-]
6
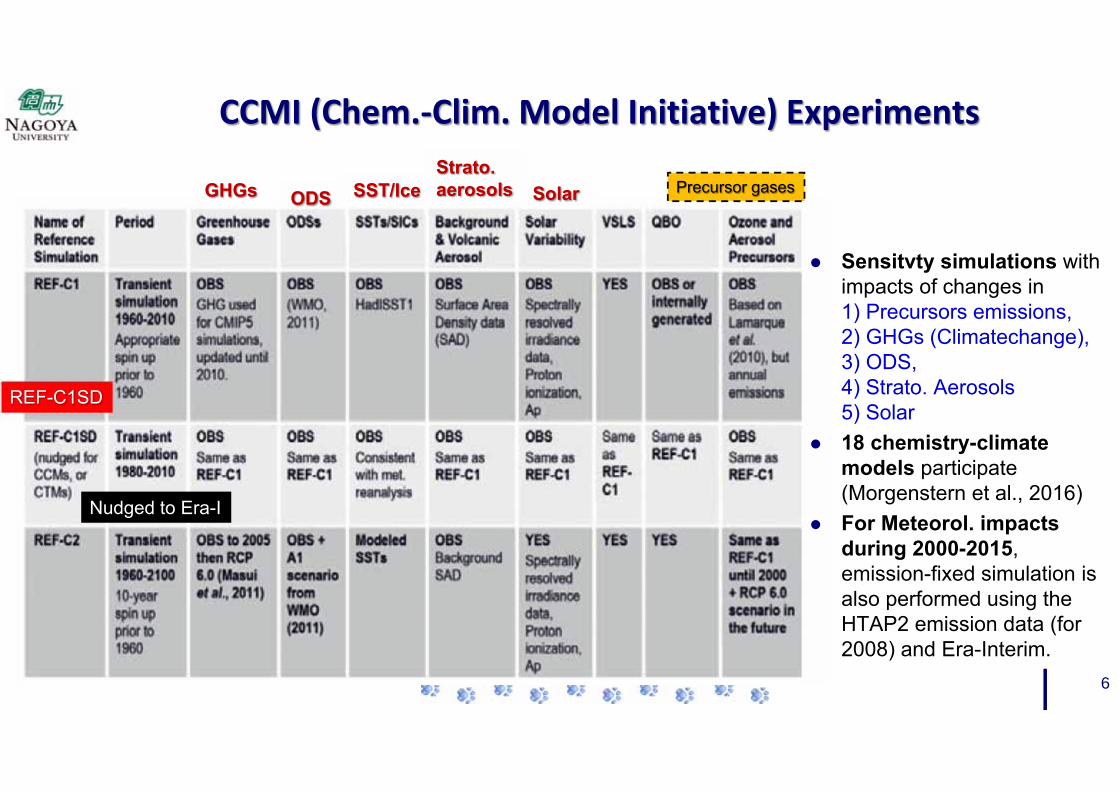
CCMI (Chem.‐Clim. Model Initiative) Experiments
GHGs ODS SST/IceStrato. aerosols Solar Precursor gases
REF-C1SD
Nudged to Era-I
Sensitvty simulations with impacts of changes in 1) Precursors emissions, 2) GHGs (Climatechange), 3) ODS, 4) Strato. Aerosols5) Solar
18 chemistry-climate models participate (Morgenstern et al., 2016)
For Meteorol. impacts during 2000-2015, emission-fixed simulation is also performed using the HTAP2 emission data (for 2008) and Era-Interim.
7
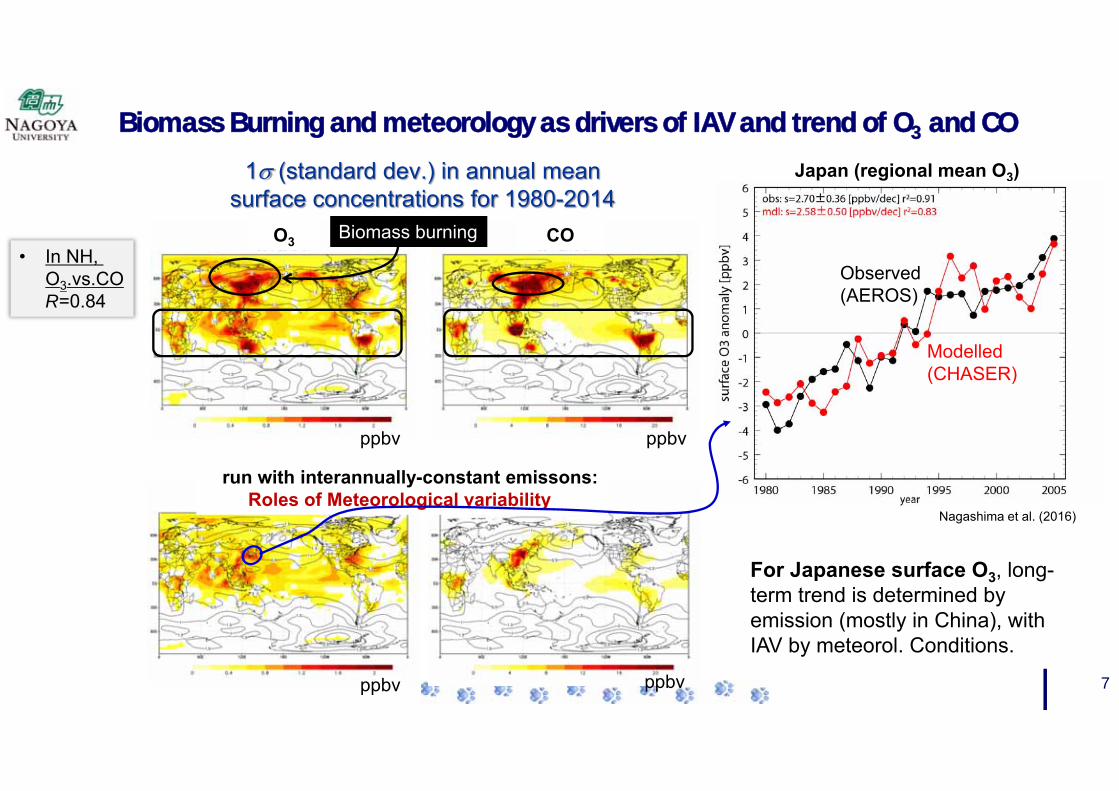
1 (standard dev.) in annual mean surface concentrations for 1980-2014
O3 CO
run with interannually-constant emissons:Roles of Meteorological variability
ppbv
ppbv
ppbv
ppbv
Biomass Burning and meteorology as drivers of IAV and trend of O3 and CO
• In NH, O3.vs.COR=0.84
Biomass burning
Japan (regional mean O3)
Observed(AEROS)
Modelled (CHASER)
Nagashima et al. (2016)
For Japanese surface O3, long-term trend is determined by emission (mostly in China), with IAV by meteorol. Conditions.
8
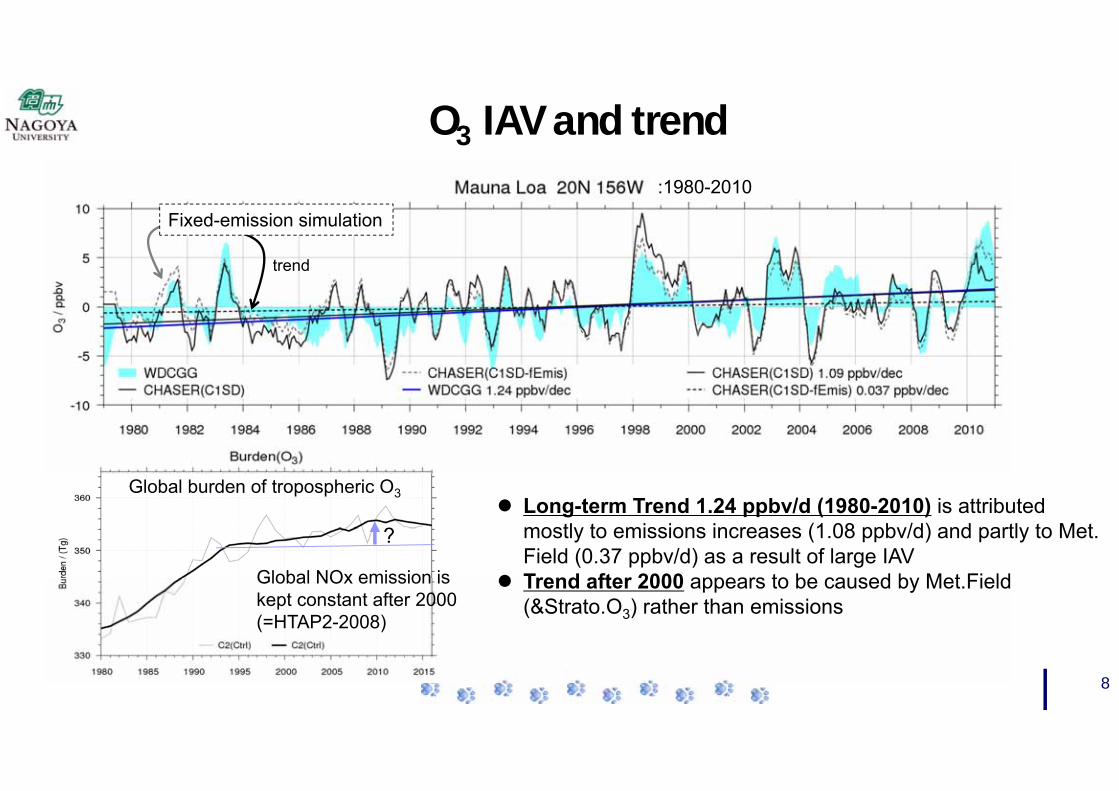
O3 IAV and trend:1980-2010
Long-term Trend 1.24 ppbv/d (1980-2010) is attributed mostly to emissions increases (1.08 ppbv/d) and partly to Met. Field (0.37 ppbv/d) as a result of large IAV
Trend after 2000 appears to be caused by Met.Field(&Strato.O3) rather than emissions
Fixed-emission simulation
trend
Global burden of tropospheric O3
Global NOx emission is kept constant after 2000(=HTAP2-2008)
?
9
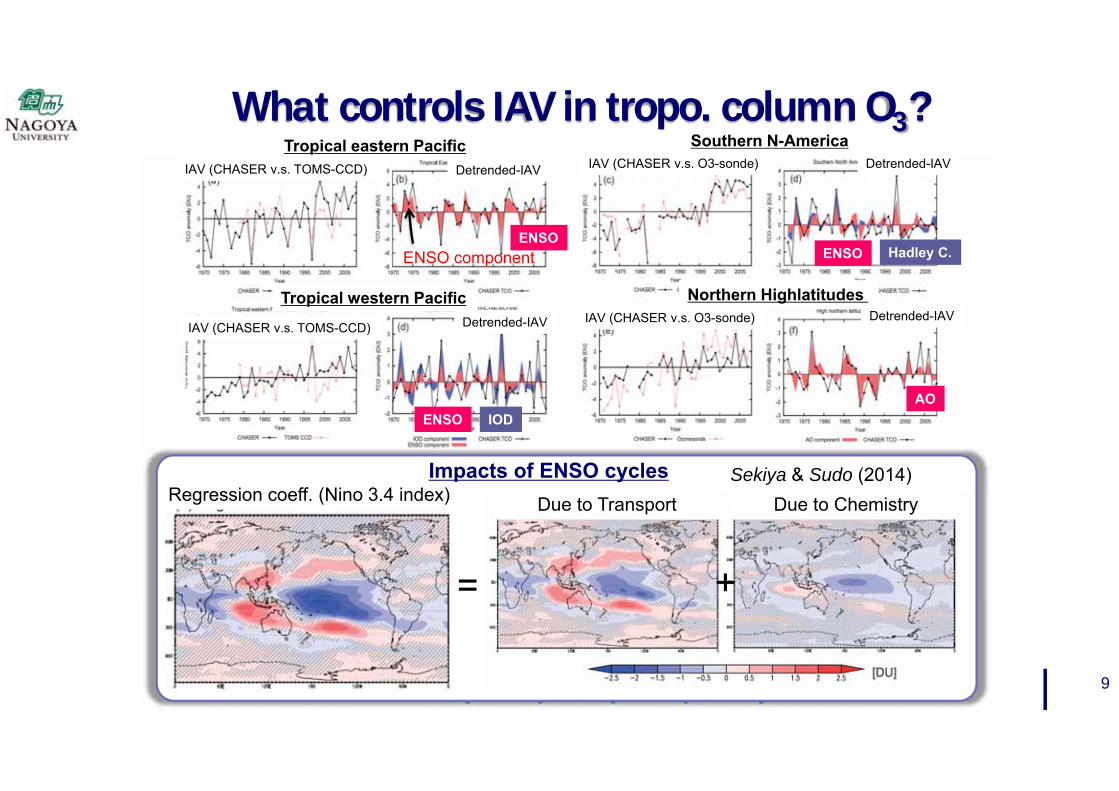
What controls IAV in tropo. column O3?
Regression coeff. (Nino 3.4 index) Due to Transport Due to Chemistry
= +
Impacts of ENSO cycles Sekiya & Sudo (2014)
Tropical eastern PacificDetrended-IAVIAV (CHASER v.s. TOMS-CCD)
IAV (CHASER v.s. TOMS-CCD) Detrended-IAV
Tropical western Pacific
Southern N-America
Northern Highlatitudes
Detrended-IAV
Detrended-IAV
IAV (CHASER v.s. O3-sonde)
IAV (CHASER v.s. O3-sonde)
ENSO component ENSO Hadley C.
AO
ENSO
ENSO IOD

10
CCMI (Chem.‐Clim. Model Initiative) EXPsAnnual mean changes in O3 (19802010)
= +
Due to (emission)
Due to (meteorol. & strato. O3)Net change
Surface O3
Japan(April):~+10ppbv
0.074 W m-264% 0.005 W m-20.069 W m-2
= +RF-O3
w m-2w m-2 w m-2
Surf. O3concentrations
11
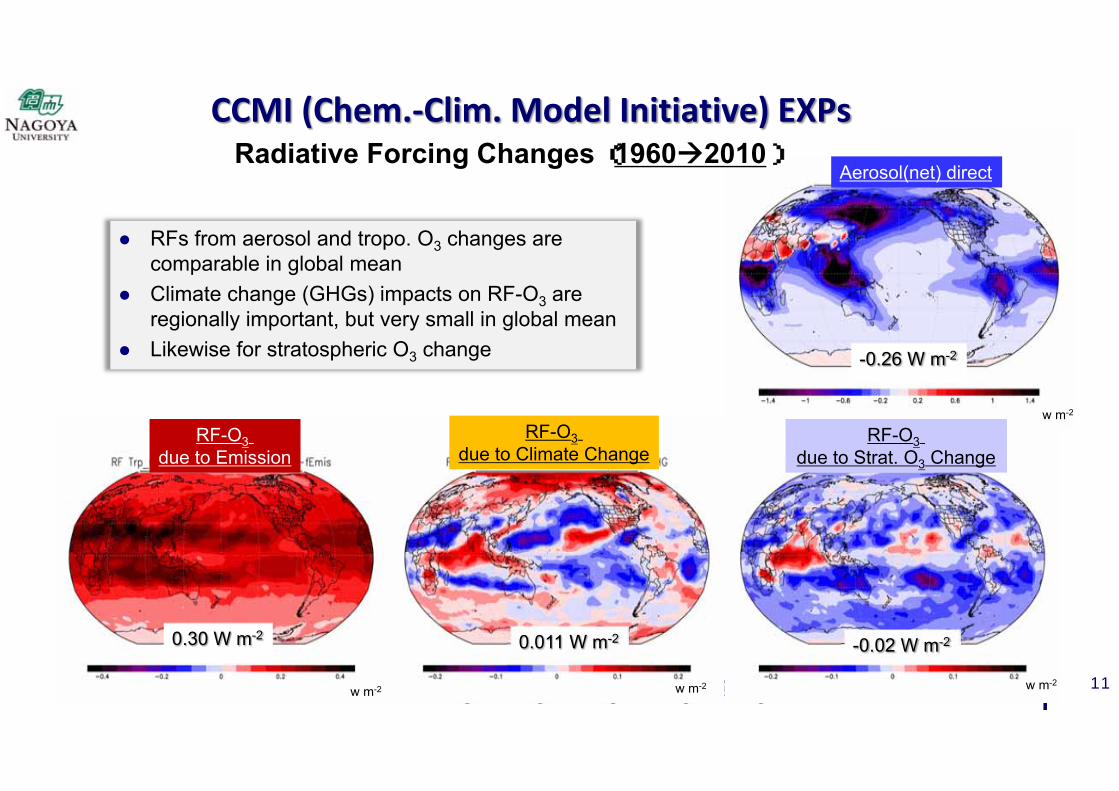
CCMI (Chem.‐Clim. Model Initiative) EXPsRadiative Forcing Changes (19602010)
w m-2 w m-2 w m-2
w m-2
0.30 W m-2 0.011 W m-2 -0.02 W m-2
-0.26 W m-2
RFs from aerosol and tropo. O3 changes are comparable in global mean
Climate change (GHGs) impacts on RF-O3 are regionally important, but very small in global mean
Likewise for stratospheric O3 change
Aerosol(net) direct
RF-O3due to Climate Change
RF-O3due to Emission
RF-O3due to Strat. O3 Change
12
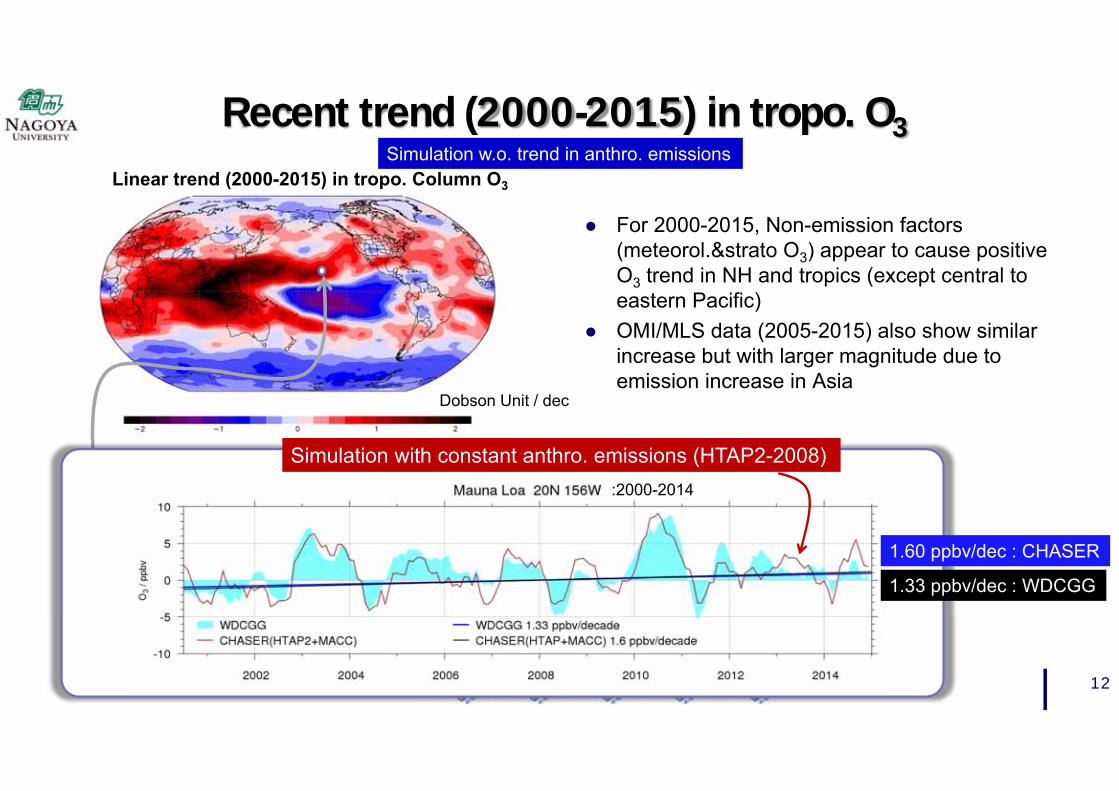
For 2000-2015, Non-emission factors (meteorol.&strato O3) appear to cause positive O3 trend in NH and tropics (except central to eastern Pacific)
OMI/MLS data (2005-2015) also show similar increase but with larger magnitude due to emission increase in Asia
Dobson Unit / dec
Recent trend (2000-2015) in tropo. O3
Linear trend (2000-2015) in tropo. Column O3
:2000-2014
Simulation with constant anthro. emissions (HTAP2-2008)
Simulation w.o. trend in anthro. emissions
1.33 ppbv/dec : WDCGG
1.60 ppbv/dec : CHASER
13
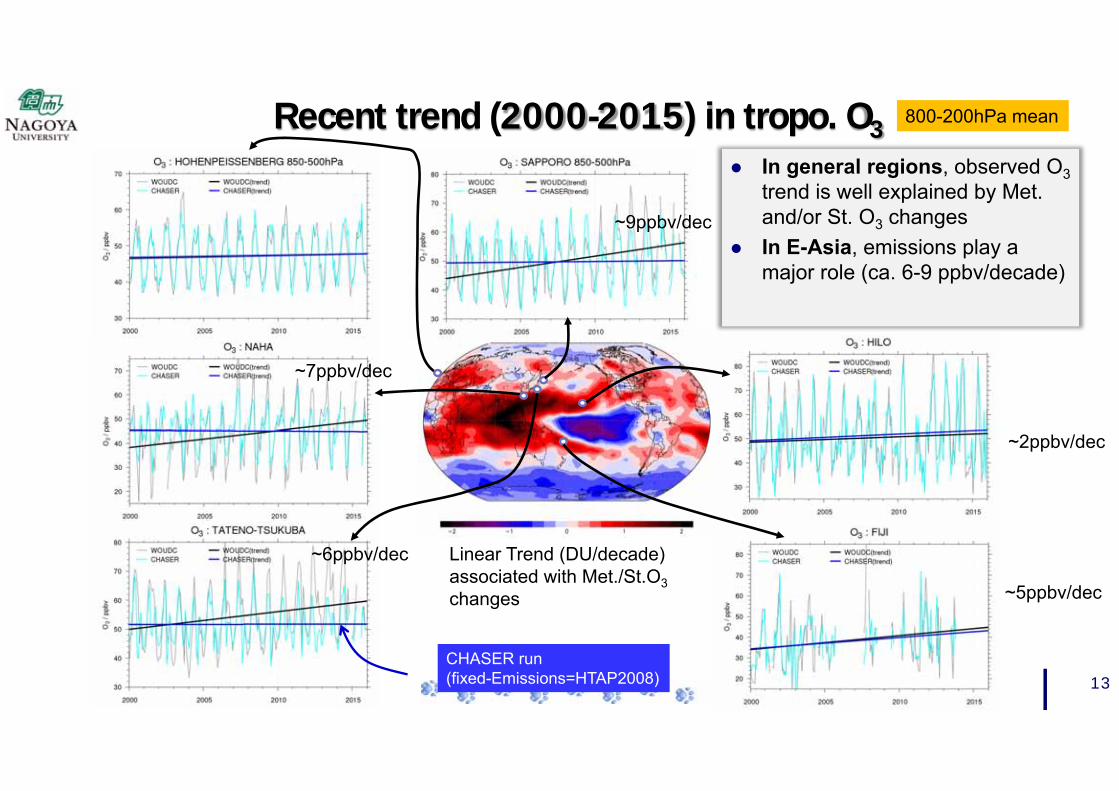
Recent trend (2000-2015) in tropo. O3
Linear Trend (DU/decade)associated with Met./St.O3changes
CHASER run(fixed-Emissions=HTAP2008)
In general regions, observed O3trend is well explained by Met. and/or St. O3 changes
In E-Asia, emissions play a major role (ca. 6-9 ppbv/decade)
800-200hPa mean
~2ppbv/dec
~5ppbv/dec
~9ppbv/dec
~7ppbv/dec
~6ppbv/dec
14
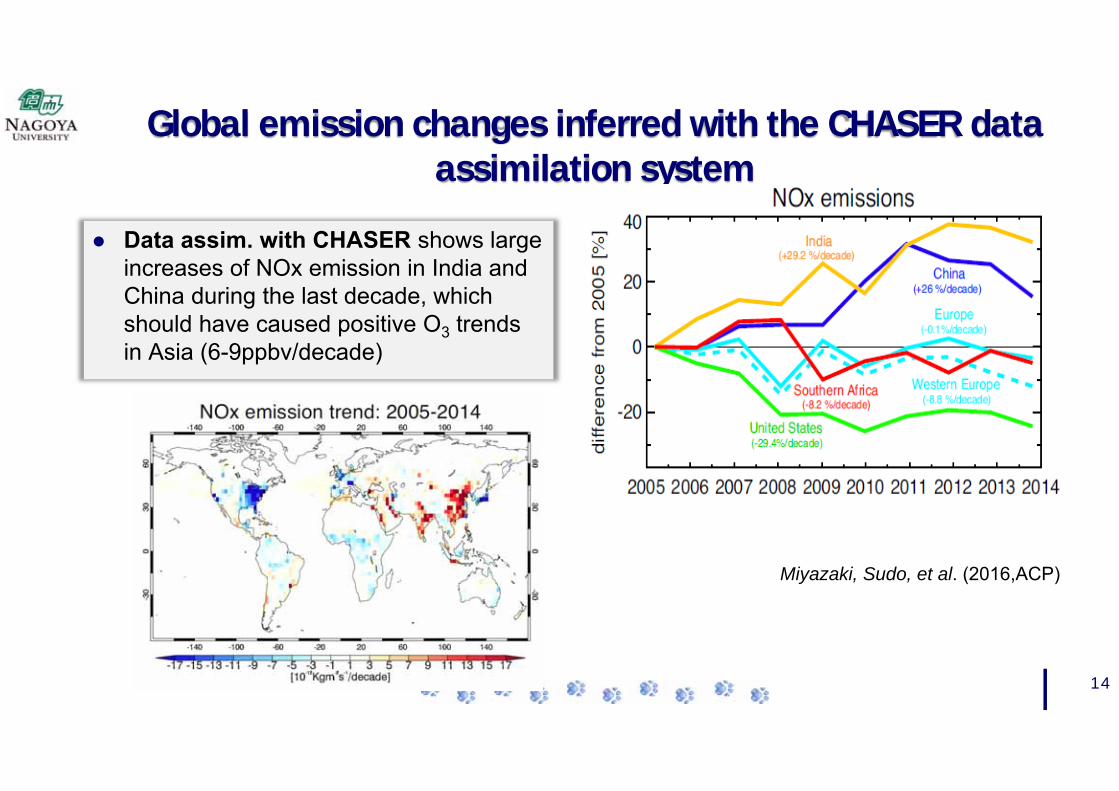
Global emission changes inferred with the CHASER data assimilation system
Data assim. with CHASER shows large increases of NOx emission in India and China during the last decade, which should have caused positive O3 trends in Asia (6-9ppbv/decade)
Miyazaki, Sudo, et al. (2016,ACP)
15
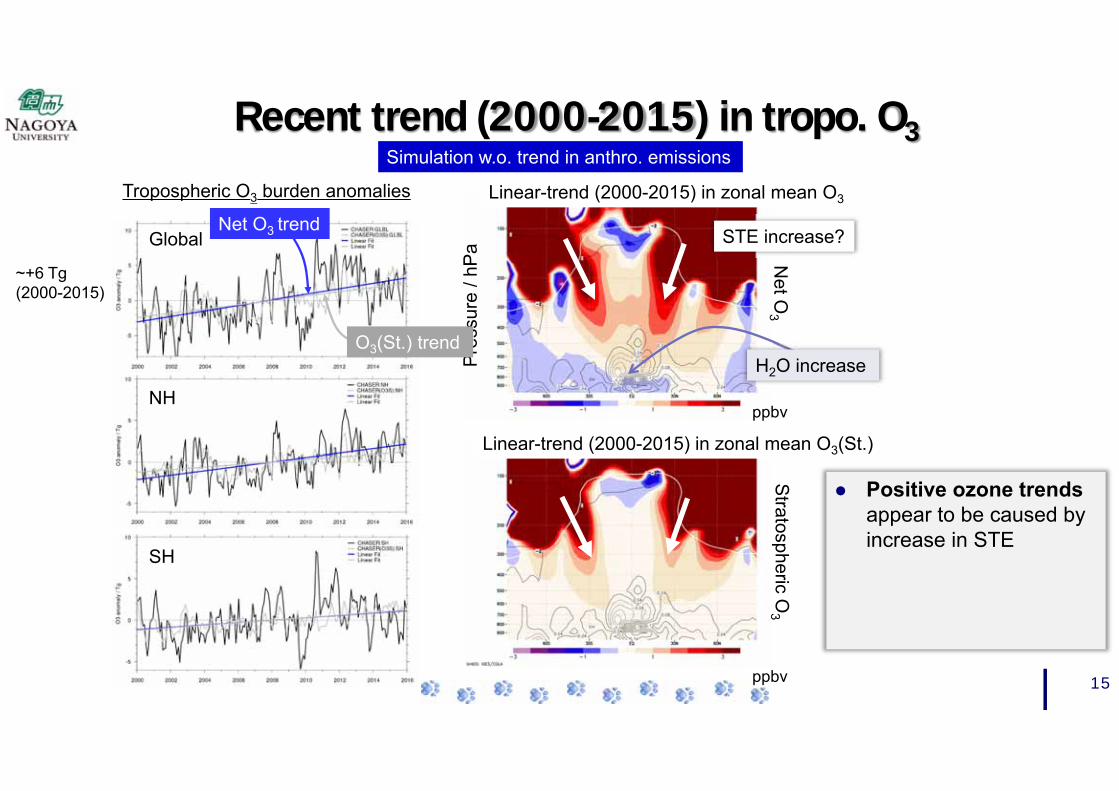
Recent trend (2000-2015) in tropo. O3
Tropospheric O3 burden anomalies
Global
NH
SH
Net O3 trend
Simulation w.o. trend in anthro. emissions
Linear-trend (2000-2015) in zonal mean O3
Linear-trend (2000-2015) in zonal mean O3(St.)
ppbv
ppbv
Stratospheric O3
Net O
3
Pres
sure
/ hP
a
O3(St.) trend
STE increase?
H2O increase
Positive ozone trends appear to be caused by increase in STE
~+6 Tg(2000-2015)
16
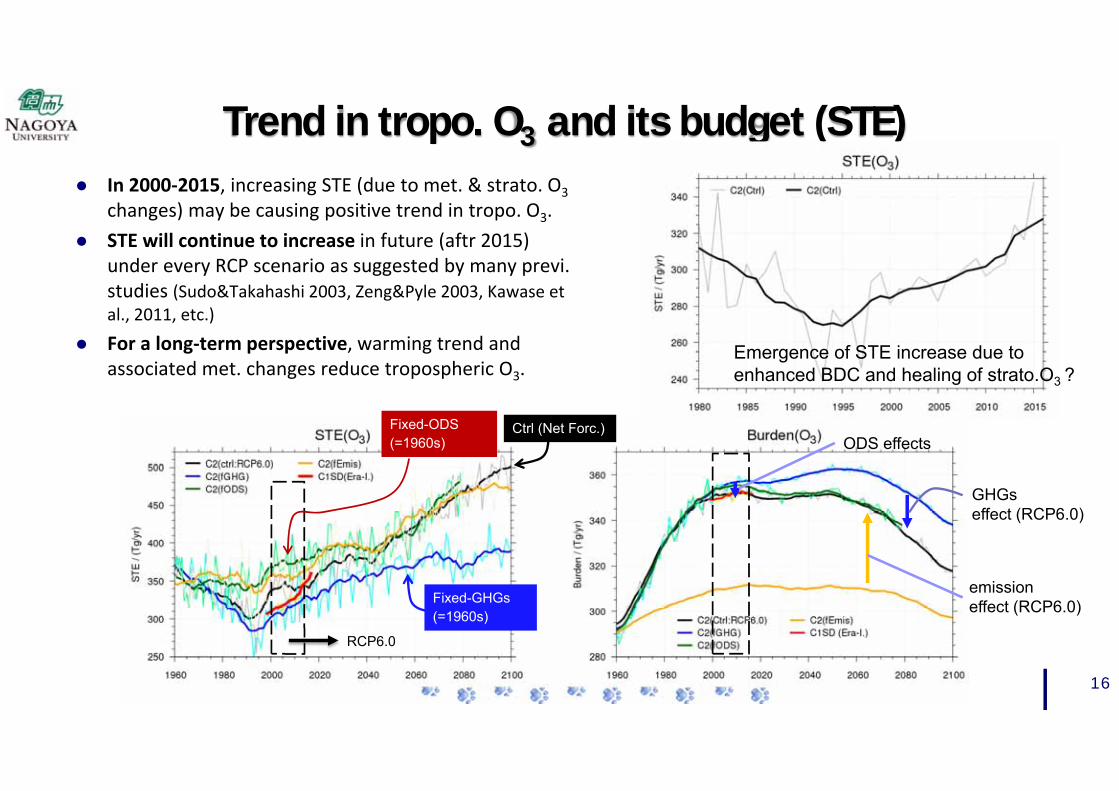
Trend in tropo. O3 and its budget (STE) In 2000‐2015, increasing STE (due to met. & strato. O3
changes) may be causing positive trend in tropo. O3. STE will continue to increase in future (aftr 2015)
under every RCP scenario as suggested by many previ. studies (Sudo&Takahashi 2003, Zeng&Pyle 2003, Kawase et al., 2011, etc.)
For a long‐term perspective, warming trend and associated met. changes reduce tropospheric O3.
Fixed-ODS (=1960s)
Ctrl (Net Forc.)
RCP6.0
Fixed-GHGs(=1960s)
GHGs effect (RCP6.0)
emission effect (RCP6.0)
ODS effects
Emergence of STE increase due to enhanced BDC and healing of strato.O3 ?
17
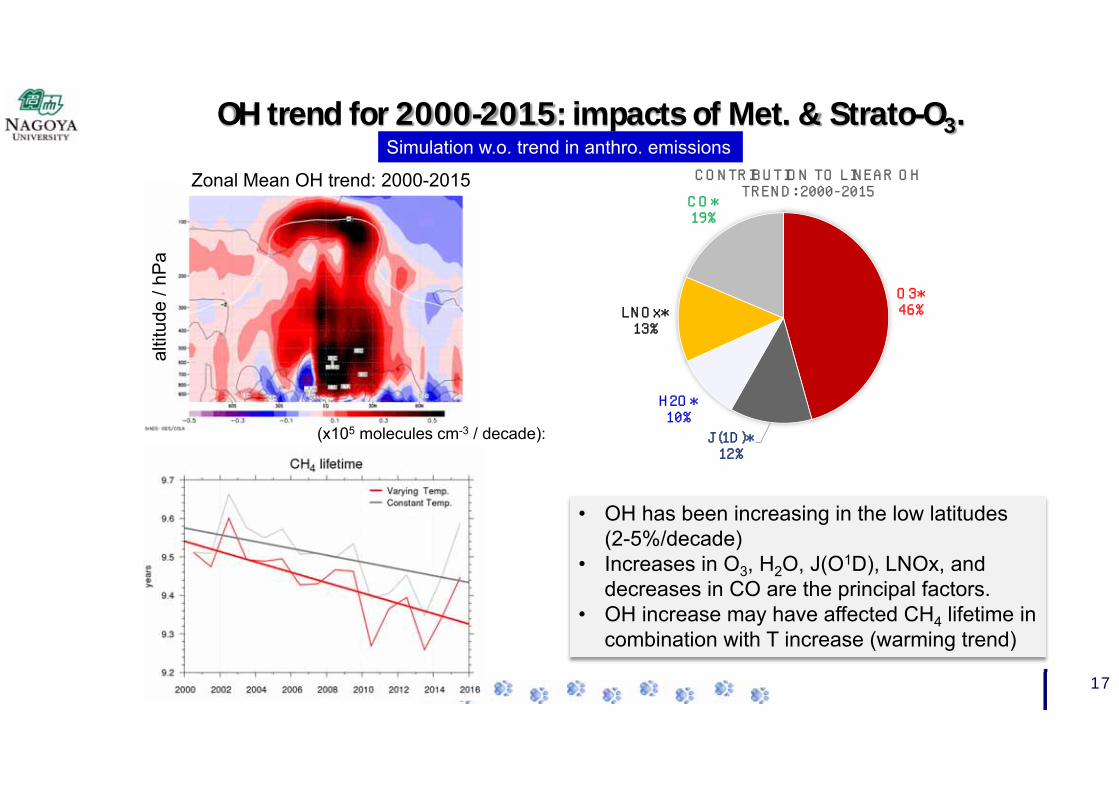
OH trend for 2000-2015: impacts of Met. & Strato-O3.
O3*46%
J(1D)*12%
H2O*10%
LNOx*13%
CO*19%
CONTRIBUTION TO LINEAR OH TREND: 2000-2015
Zonal Mean OH trend: 2000-2015
(x105 molecules cm-3 / decade):
altit
ude
/ hPa
• OH has been increasing in the low latitudes (2-5%/decade)
• Increases in O3, H2O, J(O1D), LNOx, and decreases in CO are the principal factors.
• OH increase may have affected CH4 lifetime in combination with T increase (warming trend)
Simulation w.o. trend in anthro. emissions
18
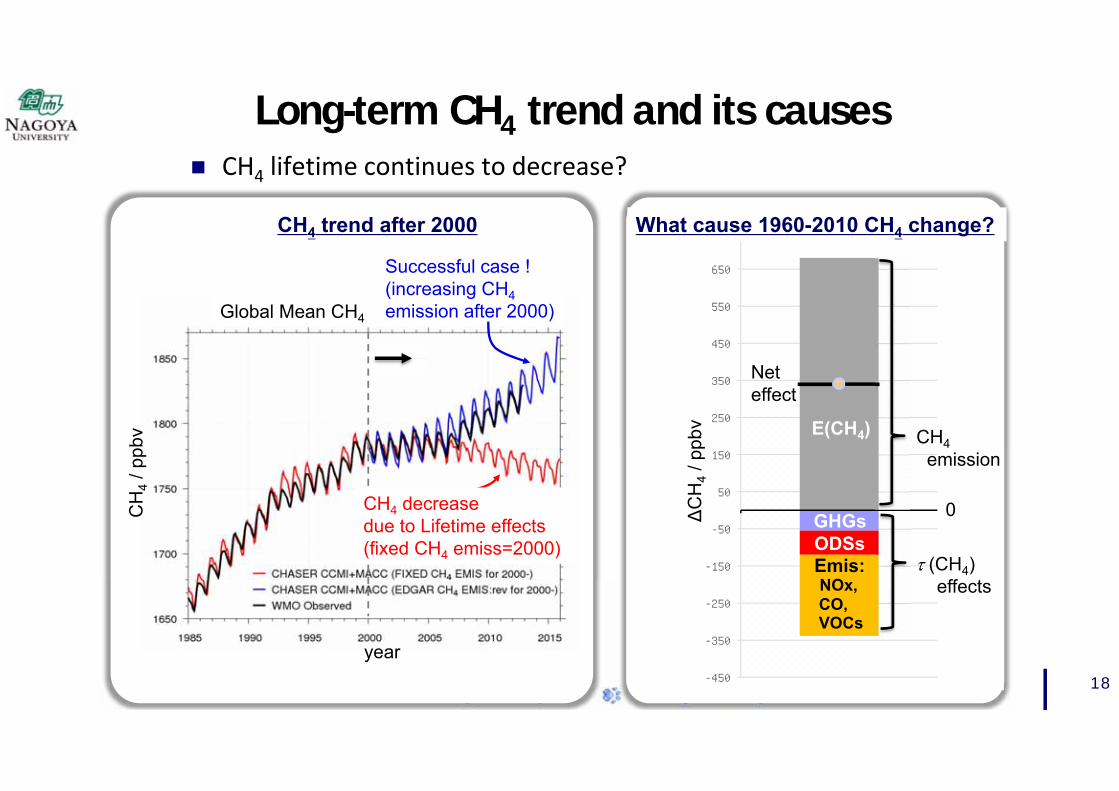
Long-term CH4 trend and its causes
-450
-350
-250
-150
-50
50
150
250
350
450
550
650
750
CH4 lifetime continues to decrease?
CH4 decrease due to Lifetime effects(fixed CH4 emiss=2000)
CH
4/ p
pbv
year
ΔCH
4/ p
pbv
CH4emission
Neteffect
GHGs
(CH4) effects
ODSsEmis:NOx,CO,VOCs
E(CH4)
What cause 1960-2010 CH4 change?
Global Mean CH4
Successful case !(increasing CH4emission after 2000)
CH4 trend after 2000
0

19
Long‐term CH4 trend : 1960 2100
No climate changeFixed-Emission=1960(NOx,CO,VOCs)
Global Mean CH4
Ctrl (Net Forc.)
CH4 lifetime continues to decrease? After 2050, climate change, causing increases in OH and T, will play significant parts
in future CH4 change (reduction) Before 2050, precursor emission (especially NOx) largely deters CH4 from increasing
Fixed-ODS
with RCP 6.0 emissions
year year
RCP6.0
GHGs effect (RCP6.0)
emission effect (RCP6.0)
20
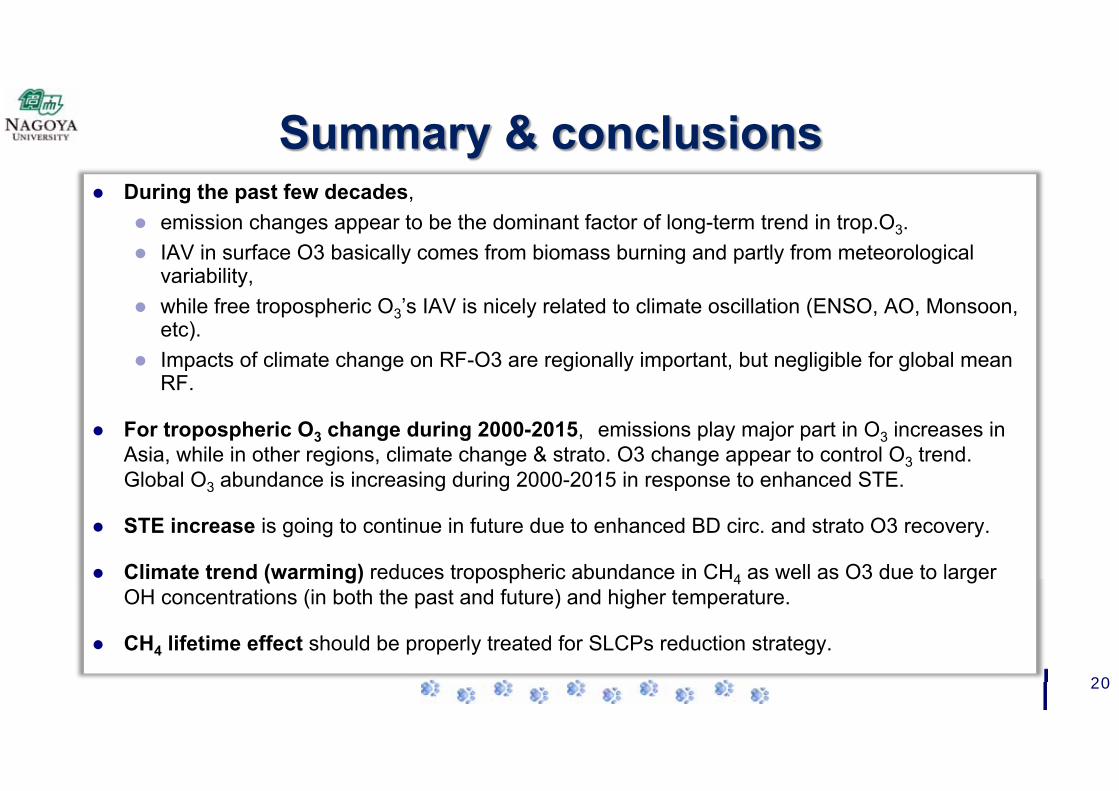
Summary & conclusions During the past few decades,
emission changes appear to be the dominant factor of long-term trend in trop.O3. IAV in surface O3 basically comes from biomass burning and partly from meteorological
variability, while free tropospheric O3’s IAV is nicely related to climate oscillation (ENSO, AO, Monsoon,
etc). Impacts of climate change on RF-O3 are regionally important, but negligible for global mean
RF.
For tropospheric O3 change during 2000-2015, emissions play major part in O3 increases in Asia, while in other regions, climate change & strato. O3 change appear to control O3 trend. Global O3 abundance is increasing during 2000-2015 in response to enhanced STE.
STE increase is going to continue in future due to enhanced BD circ. and strato O3 recovery.
Climate trend (warming) reduces tropospheric abundance in CH4 as well as O3 due to larger OH concentrations (in both the past and future) and higher temperature.
CH4 lifetime effect should be properly treated for SLCPs reduction strategy.

21
O3 / CH4 as SLCPs and a warming mitigator
NOx emission reduction can lower O3’s heating but more enhance CH4’s
Net negative RF (cooling) is only expected in CO reduction cases.
‐1
‐0.5
0
0.5
1
0 0.2 0.4 0.6 0.8 1 1.2 1.4 1.6 1.8 2
グラフタイトル
O3 CH4 SO4 NO3BC OC Net
Rad
iativ
e fo
rcin
g re
lativ
e to
200
8 (W
m-2
)
2008 emission
↓
‐0.2
‐0.1
0
0.1
0.2
0 0.2 0.4 0.6 0.8 1 1.2 1.4 1.6 1.8 2
グラフタイトル
O3 CH4 SO4 NO3
BC OC Net
NOx emission changesE(HTAP2-2008) x 0 to 2
CO emission changesE(HTAP2-2008) x 0 to 2
(direct) Radiative forcing responses to:
For air quality, reduction in precursors (NOx,CO,VOCs) is favourable, however,