Embed Size (px)
Citation preview
Hindawi Publishing CorporationThe Scientific World JournalVolume 2013, Article ID 270726, 8 pageshttp://dx.doi.org/10.1155/2013/270726
Research ArticleIntercomparison of Vertical Structure ofStorms Revealed by Ground-Based (NMQ) and SpaceborneRadars (CloudSat-CPR and TRMM-PR)
Veronica M. Fall,1,2 Qing Cao,3 and Yang Hong3,4,5
1 National Weather Center Research Experiences for Undergraduates Program, Center for Analysis and Prediction of Storms,The University of Oklahoma, National Weather Center, 120 David L. Boren Boulevard, Suite 2500, Norman, OK 73072-7309, USA
2Department of Geography and Meteorology, Valparaiso University, Valparaiso, IN 46383, USA3Advanced Radar Research Center, University of Oklahoma, Norman, OK 73072, USA4Hydrometeorology and Remote Sensing Laboratory, National Weather Center, Norman, OK 73072, USA5 School of Civil Engineering and Environmental Sciences, University of Oklahoma, Norman, OK 73072, USA
Correspondence should be addressed to Veronica M. Fall; [email protected]
Received 18 August 2013; Accepted 2 October 2013
Academic Editors: R. Ferretti, S. Hameed, and V. Levizzani
Copyright © 2013 Veronica M. Fall et al.This is an open access article distributed under theCreativeCommonsAttributionLicense,which permits unrestricted use, distribution, and reproduction in any medium, provided the original work is properly cited.
Spaceborne radars provide great opportunities to investigate the vertical structure of clouds and precipitation. Two typicalspaceborne radars for such a study are the W-band Cloud Profiling Radar (CPR) and Ku-band Precipitation Radar (PR), whichare onboard NASA’s CloudSat and TRMM satellites, respectively. Compared to S-band ground-based radars, they have distinctscattering characteristics for different hydrometeors in clouds and precipitation.The combination of spaceborne and ground-basedradar observations can help in the identification of hydrometeors and improve the radar-based quantitative precipitation estimation(QPE).This study analyzes the vertical structure of the 18 January, 2009 storm using data from the CloudSat CPR, TRMM PR, anda NEXRAD-based National Mosaic and Multisensor QPE (NMQ) system. Microphysics above, within, and below the meltinglayer are studied through an intercomparison of multifrequency measurements. Hydrometeors’ type and their radar scatteringcharacteristics are analyzed. Additionally, the study of the vertical profile of reflectivity (VPR) reveals the brightband propertiesin the cold-season precipitation and its effect on the radar-based QPE. In all, the joint analysis of spaceborne and ground-basedradar data increases the understanding of the vertical structure of storm systems and provides a good insight into themicrophysicalmodeling for weather forecasts.
1. Introduction
There is not much information available to diagnose large-scale vertical cloud structure and associated precipitationcharacteristics other than within the vicinity of ground-based radars. Spaceborne satellites and their onboard radarsprovide the opportunity to observe and analyze the entirevertical cloud structure. One such satellite, CloudSat, will fillthis void of the ground-based radar network, expanding thedata available to better understand weather systems and toproduce more accurate weather models.
To diagnose storm structure, two spaceborne satellitesand their radars, the CloudSat’s Cloud Profiling Radar (CPR)
and the TRMM’s Precipitation Radar (PR), will be used. Tooffer cross-verification of the observationsmade by these tworadars, a comparisonwith theNationalMosaic andMultisen-sor QPE (NMQ) system, which employs the NEXRAD radarnetwork, will be used.The vertical structure of a winter stormsystemwill be analyzed, similar to thework done byMatrosov[1] with a west coast wintertime precipitating system. Thestorm chosen to be analyzed for this research occurred on theeast coast on 18 January, 2009.
On 17 January, 2009, the researched storm had associatedlight freezing rain over Tennessee at 2000 UTC, leadingto a crash involving 55 cars and trucks with over a dozeninjuries, including one woman who broke both of her arms.
2 The Scientific World Journal
On 18 January from 2000 to 2200 UTC, North Carolinaexperienced heavy snow from the same storm, with totalsapproaching six inches in some locations. Neither the TRMMor CloudSat satellites passed over the storm at these exacttimes or locations, due to CloudSat’s limited spatial coverageand TRMM’s latitudinal bounds. This storm, however, wasstill significant enough to warrant looking further into thestorm structure and products through a comparison ofCloudSat and NMQ as well as TRMM and NMQ.
The purpose of this paper is to use spaceborne satellitesthat are sensitive to precipitation and cloud hydrometeors todiagnose vertical storm structure. To cross-verify the obser-vations made by these satellites, a comparison with a ground-based radar system (NMQ) will be performed. Specifically,the brightband level and freezing level will be compared,along with reflectivity values as measured by the differentsystems.
Section 2 will describe the background information onthe different radar systems and satellites used in the study.Section 3 will compare CloudSat and NMQ observations andTRMM and NMQ observations. Concluding thoughts arepresented in Section 4.
2. Background
2.1. NMQ System. The National Mosaic and MultisensorQuantitative Precipitation Estimation (QPE) (NMQ) system(http://nmq.ou.edu/) is a joint project between the NationalSevere Storms Laboratory (NSSL), Federal Aviation Admin-istration (FAA), National Weather Service/Office of Hydro-logical Development (NWS/OHD), the Office of Climate,Water and Weather Services (OCWSS), and the Universityof Oklahoma Cooperative Institute in Mesoscale Meteoro-logical Studies (OU CIMMS) [2]. The project started in June2006, along with the next generation QPE (Q2) as a meansof incorporating several weather products, including radar,satellite, rain gauge, surface observations, and numericalweather prediction (NWP) to produce an all-inclusive high-resolution precipitation estimation system.TheNMQ systemis used internationally as a testbed for the incorporationof a 3D mosaic of multiple radars to aid in aviation andmodeling, with practical applications to monitoring andwarning for flooding events. Operating at high temporal andspatial resolutions of five minutes and one kilometer makesthe NMQ system ideal to use in comparison with variousspaceborne radars.
The NMQ system, through the collection of all the differ-ent weather products, offers a comprehensive view of stormstructure. The system offers several products through whichstorm structure can be diagnosed, including 2D and 3Dreflectivity, vertical profile of reflectivity (VPR), precipitationphase and type, and rainfall rates and rainfall totals. Thereis much more available through this comprehensive system,such as rain rates, rainfall totals, and vertically integrated liq-uid, but only a few products will be utilized for this research.
2.2. CloudSat CPR. The National Aeronautics and SpaceAdministration’s (NASA) Earth Science Enterprise (ESE),
through various satellites, provides information about theinfluence clouds have on the atmosphere, including weatherand climate. The afternoon “A-Train” satellite constellationis a satellite flying formation comprised of several differ-ent missions that simultaneously increase the informationavailable about the condition of the Earth’s atmosphere [3].This constellation contains two Earth Observing System(EOS) missions and three Earth System Science Pathfinder(ESSP)missions, as well as a French Centre National d’EtudesSpatiales (CNES) mission. The five satellites fly in successionin a sun-synchronous orbit over the same locations so thatthe last satellite, Aura, trails the leading satellite, Aqua, byless than ten minutes. When all data from the A-Train iscombined, the satellites provide synergistic information onthe Earth’s climate, giving a complete and thorough view ofthe Earth’s atmosphere.
The CloudSat satellite is one of the five satellites in theA-Train constellation, located at the second flying positionbehind Aqua. CloudSat was launched into the A-Train for-mation on 28 April, 2006 and is managed and maintainedby NASA’s Jet Propulsion Laboratory (JPL) in Pasadena, CA.The onboard W-band nadir-pointing Cloud Profiling Radar(CPR) has been operating since 2 June, 2006, having lostonly ten hours of data since the beginning of operations [4].CloudSat operates at a high frequency of 94GHz and shortwavelength of 3 millimeters, nearly ten times more sensitivethan a typical US Weather Surveillance Radar-1988 Doppler(WSR-88D). CloudSat does not have a horizontal resolutionsince the path width is small but has a cross-track resolutionof 1.4 km and 1.8 km along-track resolution, with a verticalresolution of 500m.The satellite is extremely sensitive at sucha high frequency, with aminimumdetectable signal (MDS) of<−26 dBZ, providing the opportunity for a never-before-seenperspective and analysis of vertical cloud structure, cloudcomposition, and cloud microphysics, even during a lightprecipitation event.
CloudSat offers many different products to better under-stand clouds’ effect on the climate and cloud structure.The CloudSat2B Cloud Geometrical Profile algorithm (2B-GEOPROF) provides CPR reflectivity values, allowing for avertical time-height cross-section of reflectivities along theCloudSat track to be generated. The Cloud Classificationalgorithm (2B-CLDCLASS) is another useful product andprovides the cloud classification for all vertical and horizontallevels within the observed storm, with nine classificationsranging from cirrus clouds to stratus clouds to deep convec-tion.The EuropeanCentre forMedium-RangeWeather Fore-cast (ECMWF)model data is contained within the ECMWF-AUX files and can be accessed to create temperature profiles,which can be useful in the identification of the freezinglevel. Additional products include those which contain dataabout ice and liquid water content, rainfall rates, heatingrates, and heating fluxes. All algorithms and data productsare described in full detail and retrievable from the CloudSatData Processing Center (DPC) in one granule, or one orbit,increments (http://www.cloudsat.cira.colostate.edu/).

The Scientific World Journal 3
2.3. TRMM PR. The Tropical Rainfall Measuring mission(TRMM) satellite’s goal is to provide detailed informationon the distribution of precipitation over the tropics to betterunderstand the connection and interaction between oceans,land masses, and air masses and the shared effect on globalrainfall and climate (http://trmm.gsfc.nasa.gov/). The obser-vations made from the analysis of TRMM data have ledto a better understanding of the precipitation processesthat govern the tropics; therefore, more accurate modelshave been developed to depict these processes. The TRMMsatellite was launched into orbit on 27 November, 1997 fromthe Tanegashima Space Center in Japan as a joint projectbetween NASA’s Goddard Space Flight Center and the JapanAerospace Exploration Agency (JAXA). The instrumentsabroad the TRMM satellite include the Precipitation Radar,TRMM Microwave Imager, Visible and Infrared Scanner,Cloud and Earth Radiant Energy Sensor, and LightningImaging Sensor. Valuable information about the tropics isnow available thanks to the information gathered from eachinstrument.
From the TRMM satellite, the 2A25 product used inVersion 7, the TRMM Precipitation Radar (PR) Rainfall Rateand Profile Product, was used.The PR was built by JAXA in ajoint contribution with the US/Japan TRMM. The PR beganoperating on 8 December, 1997. The PR was the first space-borne instrument designed to provide a three-dimensionalviewof storm structure, providing some similar data productsas those of CloudSat. The radar operates at a frequency of13.8 GHz in the Ku-band and a wavelength of 2 cm, offering ageographic coverage from 38∘S–38∘N and 180∘W–180∘E, witha temporal resolution of sixteen orbits per day (∼91.5 minutesper orbit), a horizontal resolution of 5.0 km, and verticalresolution of 0.25 km along the slant of the ray. TRMM hasa swath width of 247 km with 49 rays per scan, with one scanlasting 0.6 seconds. The PR has a sensitivity less than thatof CPR and is affected by Mie scattering. The PR, throughall of its products, has expanded the knowledge available tounderstand the precipitation characteristics of the tropics.
One of the data products provided by theTRMMPR is thecorrected 𝑍-factor parameter, which contains a value for theattenuation corrected reflectivity factor (𝑍) at each verticalresolution level for each grid point within the TRMM swath.The reflectivity factor ranges from 0.0 to 80.0 dBZ and storesnegative values of reflectivity for bad data points or groundclutter. Although there is no data available to construct a tem-perature profile using the PR, the product “height of freezinglevel” can be used to identify the 0∘C isotherm. Additionaldata products available can distinguish rain rate, precipitationtype, and precipitable water.More information about individ-ual products or algorithms can be located on themainwebsiteforTRMM(http://trmm.gsfc.nasa.gov/overview dir/pr.html).
3. Data Analysis
3.1. CloudSat CPR and NMQ. On 18 January, 2009, theCloudSat satellite passed over a winter storm in SouthCarolina at 1847 UTC, with its path dividing the state intonearly equal eastern and western halves, passing through
NMQ reflectivity (dBZ): 20090118, 1845 UTC38
37
36
35
34
33
32
31
30
29
28−90 −85 −80 −75
60
50
40
30
20
10
0
Latit
ude (
deg)
Longitude (deg)
Figure 1: The CloudSat track has been overlaid with the NMQcomposite reflectivity from 18 January, 2009 at 1845 UTC.
15
10
5
032 33 34 35 36 37 38
20100−10−20−30−40H
eigh
t (km
)
CPR reflectivity (dBZ) (18:47 UTC)
(a)
15
10
5
032 33 34 35 36 37 38
Hei
ght (
km)
NMQ reflectivity (dBZ) (1845 UTC)403020100−10
Latitude (deg)
(b)
Figure 2: Reflectivity cross-sections from (a) CloudSat CPR and (b)NMQ.
Charleston county in the south and advancing northwardthrough Lancaster county, covering latitude and longitudebounds of approximately 32∘–35∘N and 80∘–82∘W (Figure 1).As mentioned in Section 1, this storm had associated injuriesand locally large snowfall totals.
Using the CloudSat products mentioned in Section 2.2,the storm structure and characteristics can be determined,while also using the NMQ data available to cross-validateCloudSat’s observations. Figure 2(a) shows the time-heightcross-section of the CPR reflectivity through the storm. Thecloud top heights from 33∘–35∘N are nearly constant at about7.5 km above mean sea level (MSL) though closer to 6 kmMSL at lower latitudes. Since the NMQ system is not as sen-sitive as CloudSat, it does not detect all of the cloud structurewith small cloud particles that CloudSat has seen. In Figure2(b), the NMQ system shows the storm only extending from32.5∘–35∘N with cloud top heights of approximately 7.5 km.NMQhas captured the largest section of the stormbutmissedsome of the finer details that CloudSat was able to detect.
Brightband features are faintly present at about 2 kmMSLfrom about 33∘-34∘N on the CPR cross-section, where a tight

4 The Scientific World Journal
15
10
5
032 33 34 35 36 37 38
Hei
ght (
km)
Cloud class (18:47 UTC)DCNSCumulusSCStratusACASCirrusNo cloud
Latitude (deg)
Figure 3: The cloud classification determined from CloudSat CPR.
15
10
5
032 33 34 35 36 37 38
Hei
ght (
km)
Latitude (deg)
10
−10
−30
−50
Temperature (∘C) (18:47 UTC)
Figure 4: The temperature profile determined from CloudSat CPR.The dark line shows the freezing level.
vertical reflectivity gradient within the storm is observed,with local reflectivitymaxima values of approximately 15 dBZ.The NMQ cross-section shows the largest reflectivity valuesin roughly the same area as CloudSat. Brightbands occur instratiform precipitation, where a transition between hydrom-eteor phase from solid to liquid occurs [5]. As shown inFigure 3, the CloudSat 2B-CLDCLASS product has identified33∘–35∘N as being composed of nimbostratus clouds, aform of stratiform precipitation. As ice or snow above thebrightband layer begins to melt, there is a marked increase inreflectivity, as the solid hydrometeor becomes covered witha liquid water layer. This liquid casing leads to an enhancedreflectivity signal. Below the brightband layer, a large decreasein reflectivity is noted as all precipitation becomes liquidas a raindrop and the solid hydrometeor completely melts.The presence of a brightband can lead to an overestimationof precipitation rates. Using an appropriate 𝑍-𝑅 relationshipfor stratiform precipitation can aid in eliminating this over-estimation of rainfall rate, 𝑅. Identifying the location of abrightband is crucial to understanding where QPE may beincorrect. Knowing the height at which the brightband occursis one of the advantages offered by CloudSat that will lead tobetter NWP.
The brightband layer of the CPR reflectivity cross-sectionand freezing level and the height of the 0∘C isotherm on theCPR temperature profile are located at nearly the same height.As shown in the temperature profile of Figure 4, the freezinglevel at 33∘N is near 2 kmMSL and decreases with increasinglatitude to approximately 1.5 km MSL at 35∘N. Since thebrightband is associated with a melting hydrometeor, it is nocoincidence that the freezing level and the brightband occurat approximately the same height.
With the NMQ system, a VPR from Columbia, SC,can be used to compare the freezing level with that deter-mined from CloudSat (Figure 5). Columbia is located at34.0∘N and 81.0∘W, while CloudSat passed over the storm at34.0∘N and 80.6∘W. The VPR at this specific location shows
(∘C)
Vertical profile reflectivity (VPR)Plot for radar: KCAE Valid at:
01/18/2009 18:45:00 UTC Q2
KCAE global/averageKCAE convective/averageKCAE stratiform/average Radar elevation
Alti
tude
(m M
SL)
15
10
5
0
Reflectivity (dBZ)0 10 20 30 40 50 60
−10
0
×103
−20
18Z model temp heights −20, −10, 0, 10, 20
∘C][
[mean sea level]
Figure 5:The vertical profile of reflectivity from Columbia, SC.Theblue line indicates the reflectivity values for stratiform precipitation,where the peak shows the brightband level.
the freezing level at 1.8-1.9 km MSL while the temperatureprofile from the CloudSat ECMWF-AUX product shows afreezing level of approximately 2.0 km MSL. The VPR alsoshows the maximum reflectivity, or brightband region, forstratiform precipitation at 1.2–1.4 km MSL, while the time-height cross-section of CPR reflectivity shows the brightbandaround 1.8 km MSL. The VPR shows maximum reflectivityvalues in the brightband region of 30 dBZ, while the CloudSatcross-section records values of only 15 dBZ. Figure 6 showsthat CloudSat consistently records lower values of reflectivitywhen compared to those generated by NMQ and the ground-based radar network, since CloudSat operates at a higherfrequency and is more sensitive to smaller hydrometeorsthan the NMQ system. This trend is especially evident from33∘-34∘N where the brightband layer is most prevalent inthe CloudSat reflectivity cross-section. As expected, where abrightband is present from 33∘-34∘N, 𝑍 has very high valuesof at least 25 dBZ for the NMQ data and 10 dBZ for CloudSat.From 34∘-35∘N, the cross-section does not show a brightbandand the temperature profile shows the freezing level droppingoff to less than 1.5 kmMSL, so that there are not significantlylarge 𝑍 values in this region. The important trend to note isthat where NMQ has recorded its largest reflectivity values,so has CloudSat, located within the melting layer at thebrightband.
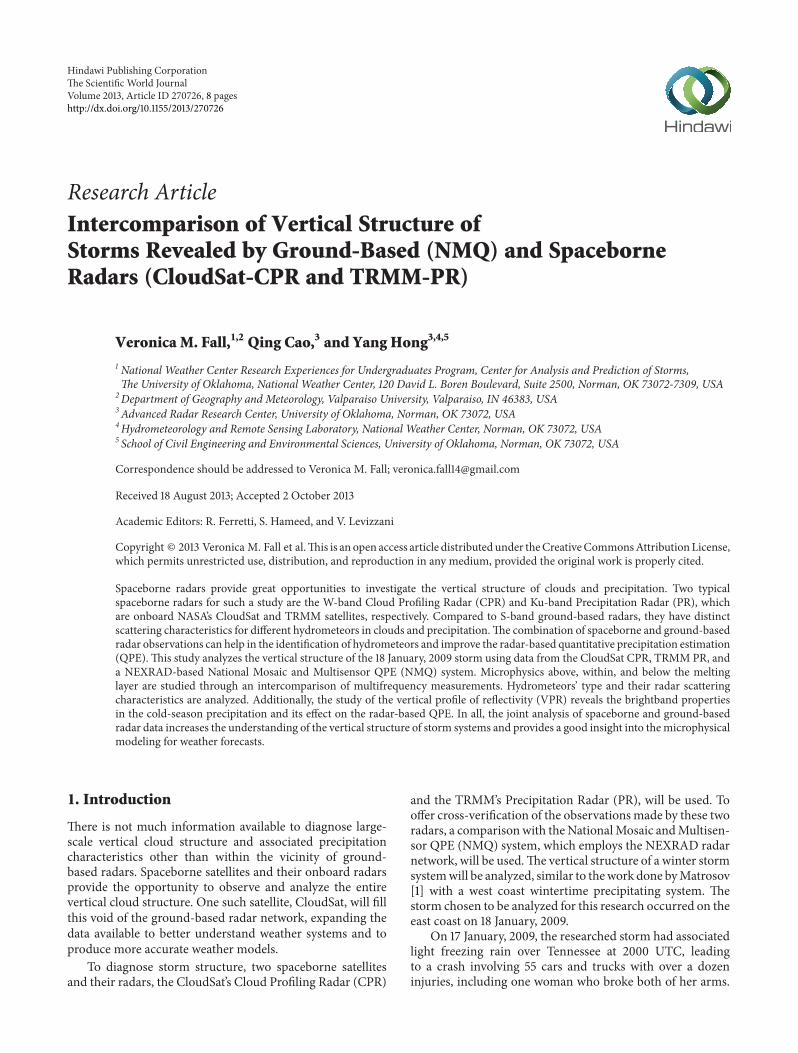
3.2. TRMM PR and NMQ. At 1810 UTC, the TRMM satelliteobserved the same storm over the southeastern US aboutforty minutes before CloudSat. The chosen path to analyzestretches from Grady County in the far southwest of Georgiaand extends northeastward toHorry County in eastern SouthCarolina, bounded approximately by 30∘–34∘N and 79∘–85∘W (Figure 7).

The Scientific World Journal 5
Ice regionMelting layerRain region
CPR
refle
ctiv
ity (d
BZ)
NMQ reflectivity (dBZ)
40
35
30
25
20
15
10
5
00 5 10 15 20 25 30 35 40
CPR and NMQ reflectivity, 33∘–33.5∘ N
(a)
Ice regionMelting layerRain region
CPR
refle
ctiv
ity (d
BZ)
NMQ reflectivity (dBZ)
40
35
30
25
20
15
10
5
00 5 10 15 20 25 30 35 40
CPR and NMQ reflectivity, 33.5∘–34∘ N
(b)
Ice regionMelting layerRain region
CPR
refle
ctiv
ity (d
BZ)
NMQ reflectivity (dBZ)
40
35
30
25
20
15
10
5
00 5 10 15 20 25 30 35 40
CPR and NMQ reflectivity, 34∘–34.5∘ N
(c)
Ice regionMelting layerRain region
CPR
refle
ctiv
ity (d
BZ)
NMQ reflectivity (dBZ)
40
35
30
25
20
15
10
5
00 5 10 15 20 25 30 35 40
CPR and NMQ reflectivity, 34.5∘–35∘ N
(d)
Figure 6: Scatterplots of NMQ reflectivity values and CPR reflectivity values from (a) 33∘–33.5∘N, (b) 33.5∘–34∘N, (c) 34∘–34.5∘N, and (d)34.5∘–35∘N.The diamonds indicate the ice region, the crosses indicate the melting layer, and the circles indicate the rain region.
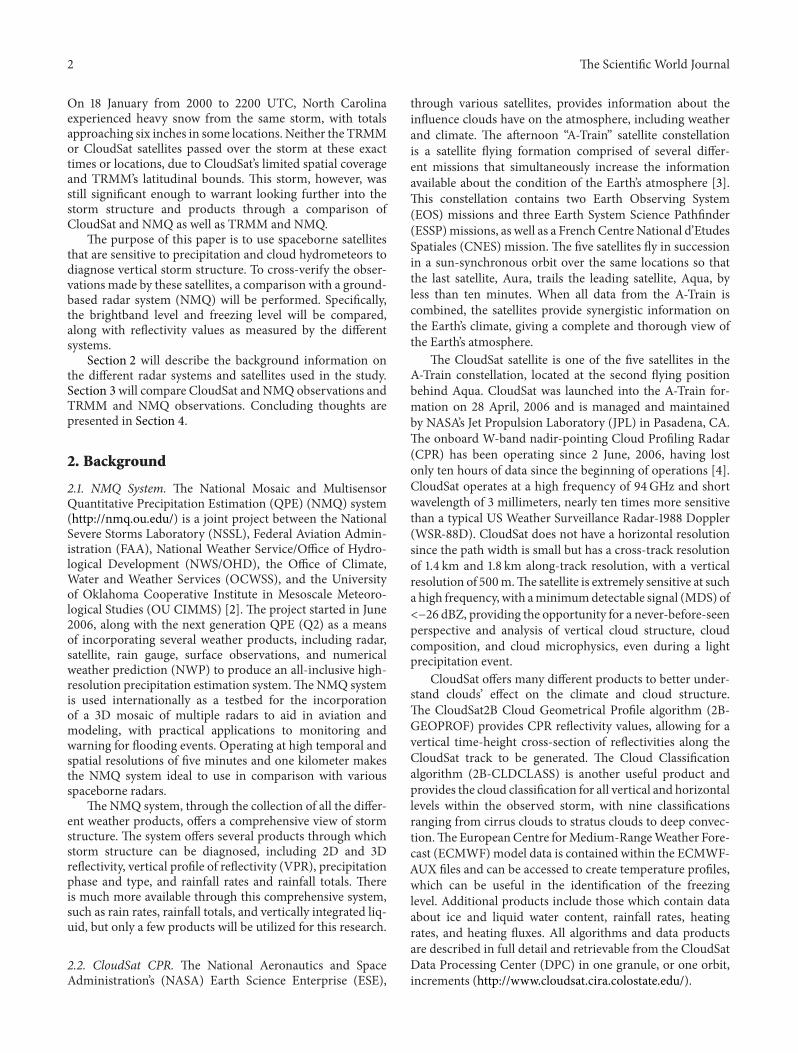
The vertical resolution of the TRMM satellite is worsethan that of CloudSat, but the same features are still dis-tinguishable. From 30∘–32∘N, the cloud tops are very low,at heights less than 5 km MSL in most cases, but the cloudtops stay fairly consistent around 5 km MSL from 32∘–34∘N
(Figure 8(a)). A distinct brightband can be found from31.5∘–33∘N at 2 km MSL in the TRMM cross-section, withreflectivity values approaching 30 dBZ. The NMQ cross-section does not show as strong of a brightband within thesesame latitudes (Figure 8(b)). A brightband can be seen from
6 The Scientific World Journal
NMQ reflectivity (dBZ): 20090118, 1810 UTC38
37
36
35
34
33
32
31
30
29
28−90 −85 −80 −75
60
50
40
30
20
10
0
Latit
ude (
deg)
Longitude (deg)
Figure 7: The TRMM track shown over the NMQ compositereflectivity from 18 January, 2009 at 1810 UTC.
10
15
5
030 30.5 31 31.5 32 32.5 33 33.5 34
Hei
ght (
km)
PR reflectivity (dBZ) (1810 UTC)
Latitude (deg)
403020100−10
(a)
15
10
5
030 30.5 31 31.5 32 32.5 33 33.5 34
Hei
ght (
km)
NMQ reflectivity (dBZ) (1810 UTC)
Latitude (deg)
403020100−10
(b)
Figure 8: Reflectivity cross-sections from the (a) TRMM-PR and(b) NMQ.
32.5∘–33∘N, but there is also a second brightband on theNMQcross-section from 30∘-31∘N that does not appear on from thePR.
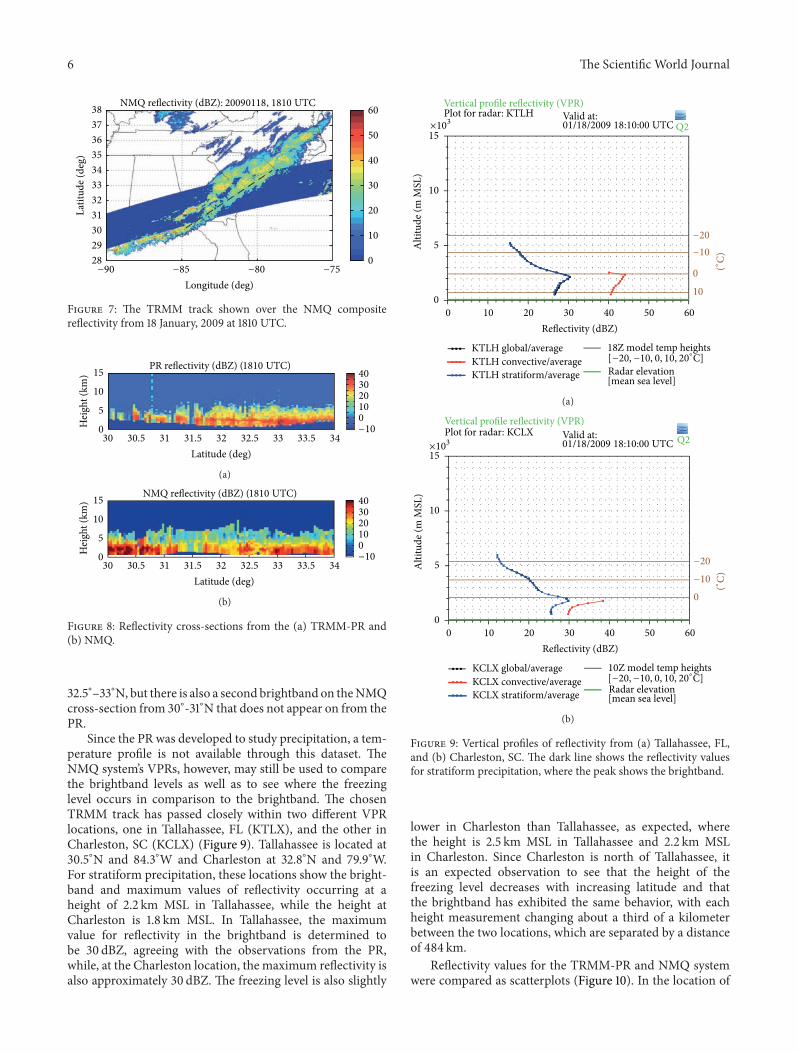
Since the PR was developed to study precipitation, a tem-perature profile is not available through this dataset. TheNMQ system’s VPRs, however, may still be used to comparethe brightband levels as well as to see where the freezinglevel occurs in comparison to the brightband. The chosenTRMM track has passed closely within two different VPRlocations, one in Tallahassee, FL (KTLX), and the other inCharleston, SC (KCLX) (Figure 9). Tallahassee is located at30.5∘N and 84.3∘W and Charleston at 32.8∘N and 79.9∘W.For stratiform precipitation, these locations show the bright-band and maximum values of reflectivity occurring at aheight of 2.2 km MSL in Tallahassee, while the height atCharleston is 1.8 km MSL. In Tallahassee, the maximumvalue for reflectivity in the brightband is determined tobe 30 dBZ, agreeing with the observations from the PR,while, at the Charleston location, the maximum reflectivity isalso approximately 30 dBZ. The freezing level is also slightly
Vertical profile reflectivity (VPR)Plot for radar: KTLH Valid at:
01/18/2009 18:10:00 UTC Q2
KTLH global/averageKTLH convective/averageKTLH stratiform/average
18Z model temp heights −20, −10, 0, 10,
Radar elevation
Alti
tude
(m M
SL)
15
10
5
0
Reflectivity (dBZ)0 10 20 30 40 50 60
×103
[mean sea level]
[
−20
−10
0
10
20∘C]
(∘C)
(a)
Vertical profile reflectivity (VPR)Plot for radar: KCLX Valid at:
01/18/2009 18:10:00 UTC Q2
KCLX global/averageKCLX convective/averageKCLX stratiform/average
10Z model temp heights −20, −10, 0, 10,
Radar elevation
Alti
tude
(m M
SL)
15
10
5
0
Reflectivity (dBZ)0 10 20 30 40 50 60
×103
[mean sea level]
[
−20
−10
0
20∘C]
(∘C)
(b)
Figure 9: Vertical profiles of reflectivity from (a) Tallahassee, FL,and (b) Charleston, SC. The dark line shows the reflectivity valuesfor stratiform precipitation, where the peak shows the brightband.
lower in Charleston than Tallahassee, as expected, wherethe height is 2.5 km MSL in Tallahassee and 2.2 km MSLin Charleston. Since Charleston is north of Tallahassee, itis an expected observation to see that the height of thefreezing level decreases with increasing latitude and thatthe brightband has exhibited the same behavior, with eachheight measurement changing about a third of a kilometerbetween the two locations, which are separated by a distanceof 484 km.
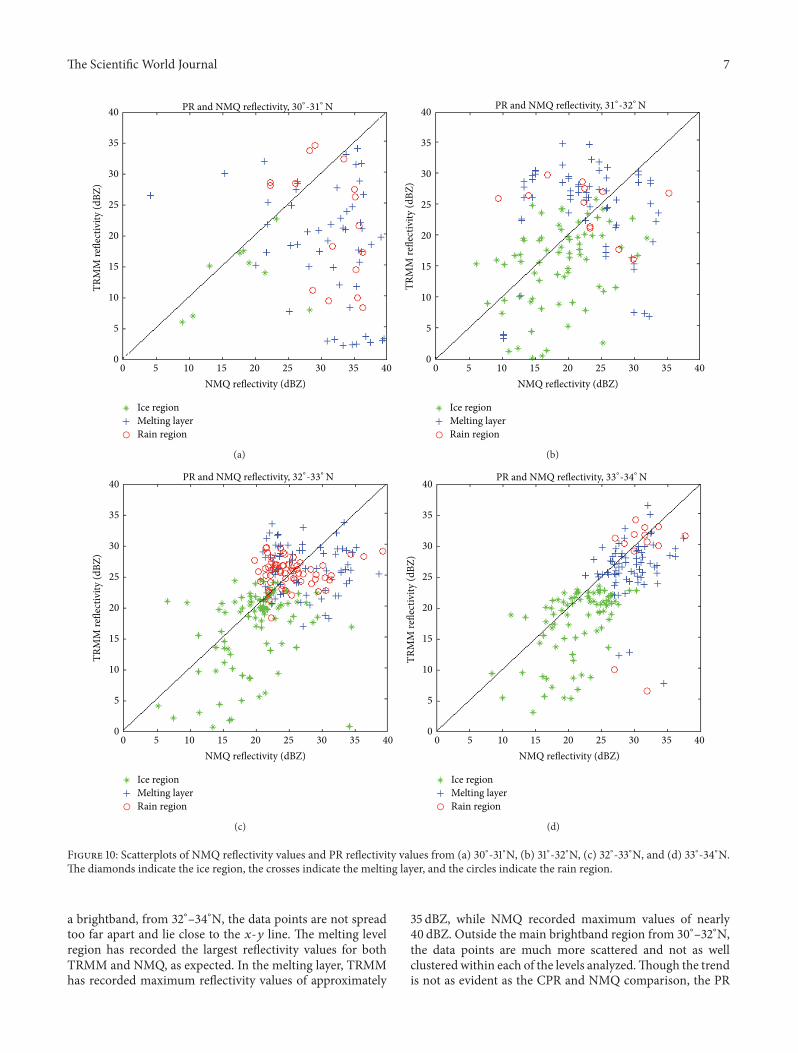
Reflectivity values for the TRMM-PR and NMQ systemwere compared as scatterplots (Figure 10). In the location of
The Scientific World Journal 7
Ice regionMelting layerRain region
NMQ reflectivity (dBZ)
40
35
30
25
20
15
10
5
00 5 10 15 20 25 30 35 40
TRM
M re
flect
ivity
(dBZ
)PR and NMQ reflectivity, 30∘-31∘ N
(a)
Ice regionMelting layerRain region
NMQ reflectivity (dBZ)
40
35
30
25
20
15
10
5
00 5 10 15 20 25 30 35 40
TRM
M re
flect
ivity
(dBZ
)
PR and NMQ reflectivity, 31∘-32∘ N
(b)
Ice regionMelting layerRain region
NMQ reflectivity (dBZ)
40
35
30
25
20
15
10
5
00 5 10 15 20 25 30 35 40
TRM
M re
flect
ivity
(dBZ
)
PR and NMQ reflectivity, 32∘-33∘ N
(c)
Ice regionMelting layerRain region
NMQ reflectivity (dBZ)
40
35
30
25
20
15
10
5
00 5 10 15 20 25 30 35 40
TRM
M re
flect
ivity
(dBZ
)
PR and NMQ reflectivity, 33∘-34∘ N
(d)
Figure 10: Scatterplots of NMQ reflectivity values and PR reflectivity values from (a) 30∘-31∘N, (b) 31∘-32∘N, (c) 32∘-33∘N, and (d) 33∘-34∘N.The diamonds indicate the ice region, the crosses indicate the melting layer, and the circles indicate the rain region.
a brightband, from 32∘–34∘N, the data points are not spreadtoo far apart and lie close to the 𝑥-𝑦 line. The melting levelregion has recorded the largest reflectivity values for bothTRMM and NMQ, as expected. In the melting layer, TRMMhas recorded maximum reflectivity values of approximately
35 dBZ, while NMQ recorded maximum values of nearly40 dBZ. Outside the main brightband region from 30∘–32∘N,the data points are much more scattered and not as wellclustered within each of the levels analyzed.Though the trendis not as evident as the CPR and NMQ comparison, the PR
8 The Scientific World Journal
has recorded slightly lower reflectivity values than NMQ,since the PR operates at a higher frequency than the WSR-88D radars used by the NMQ system. TRMM and NMQhave cross-verified observations though by showing that largereflectivity values are found within the melting layer at thelocation of the brightband.
4. Conclusion
The CloudSat satellite’s Cloud Profiling Radar is very usefulin the diagnosis of storm structure, due to the productsthat show the cross-section of reflectivity and temperatureprofile and also cloud classification and precipitation type.The CPR has a better resolution than the TRMM PR andis able to provide important information about the differentlevels within a storm, specifically above the freezing leveland at the freezing level itself. To provide supplementaryinformation, the ground-based NMQ radar system was used,which incorporates several weather products and will lead toimproved quantitative precipitation estimation.
Through the combination of data available from groundand spaceborne radars, our understanding of vertical cloudstructure has increased. Using different radar systems allowsfor cross-verification of observations, as shown by compar-ing the reflectivity cross-sections, temperature profile, andVPRs. This combination also allows for the classificationof hydrometeors and microphysical retrieval through theusage of multimeasurements. Using CloudSat and TRMMproducts, the NMQ system has been used to verify thefreezing level and brightband level, as well as to providea comparison of the reflectivity values as recorded by thedifferent systems. Through the analysis and comparison ofthese different radar systems, a better understanding of thevertical storm structure will lead to improved quantitativeprecipitation estimation and forecast modeling.
Acknowledgments
Theauthors thankNicoleGrams andBrittanyRecker for theircontributions to this research project. This material is basedupon work supported by the National Science Foundationunder Grant no. AGS-1062932.
References
[1] S. Y. Matrosov, “Observations of wintertime U.S. West Coastprecipitating systems with W-band satellite radar and otherspaceborne instruments,” Journal of Hydrometeorology, vol. 13,no. 1, pp. 223–238, 2012.
[2] J. Zhang, K. Howard, C. Langston et al., “National mosaic andmulti-sensor QPE (NMQ) system description, results, andfuture plans,” Bulletin of the American Meteorological Society,vol. 92, no. 10, pp. 1321–1338, 2011.
[3] G. L. Stephens, D. G. Vane, R. J. Boain et al., “The CloudSatmission and theA-train: a newdimension of space-based obser-vations of clouds and precipitation,” Bulletin of the AmericanMeteorological Society, vol. 83, pp. 1771–1790, 2002.
[4] G. L. Stephens, D. G. Vane, S. Tanelli et al., “CloudSat mission:performance and early science after the first year of operation,”
Journal of Geophysical Research D, vol. 113, no. 8, Article IDD00A18, 2008.
[5] J. Zhang, C. Langston, and K. Howard, “Brightband identifica-tion based on vertical profiles of reflectivity from theWSR-88D,”Journal of Atmospheric and Oceanic Technology, vol. 25, no. 10,pp. 1859–1872, 2008.

Submit your manuscripts athttp://www.hindawi.com
Hindawi Publishing Corporationhttp://www.hindawi.com
Volume 2013
Geological ResearchJournal of
Volume 2013
ISRN Paleontology
Hindawi Publishing Corporationhttp://www.hindawi.com
Geochemistry
Hindawi Publishing Corporationhttp://www.hindawi.com Volume 2013
Journal of
ISRN Geophysics
Hindawi Publishing Corporationhttp://www.hindawi.com Volume 2013
Journal ofPetroleum Engineering
Hindawi Publishing Corporationhttp://www.hindawi.com Volume 2013
Paleontology JournalHindawi Publishing Corporationhttp://www.hindawi.com Volume 2013
OceanographyInternational Journal of
Hindawi Publishing Corporationhttp://www.hindawi.com Volume 2013
ISRN Oceanography
Hindawi Publishing Corporationhttp://www.hindawi.com Volume 2013
EarthquakesJournal of
Hindawi Publishing Corporationhttp://www.hindawi.com Volume 2013
Hindawi Publishing Corporation http://www.hindawi.com Volume 2013
International Journal of
Geophysics
ISRN Atmospheric Sciences
Hindawi Publishing Corporationhttp://www.hindawi.com Volume 2013
Hindawi Publishing Corporationhttp://www.hindawi.com Volume 2013
MineralogyInternational Journal of
ISRN Meteorology
Hindawi Publishing Corporationhttp://www.hindawi.com Volume 2013
Meteorology
Hindawi Publishing Corporationhttp://www.hindawi.com Volume 2013
Advances in
Hindawi Publishing Corporation http://www.hindawi.com Volume 2013Hindawi Publishing Corporation http://www.hindawi.com Volume 2013
The Scientific World Journal
Mining
Hindawi Publishing Corporationhttp://www.hindawi.com Volume 2013
Journal of
ScientificaHindawi Publishing Corporationhttp://www.hindawi.com Volume 2013
ISRN Geology
Hindawi Publishing Corporationhttp://www.hindawi.com Volume 2013
Atmospheric SciencesInternational Journal of
Hindawi Publishing Corporationhttp://www.hindawi.com Volume 2013
![Second EC-JRC aromatic compounds intercomparison with automatic analyzer …publications.jrc.ec.europa.eu/repository/bitstream... · 22523 EN], this intercomparison exercise follows](https://img.pdfslide.net/doc/110x75/612a209d98299b656d0b7fd0/second-ec-jrc-aromatic-compounds-intercomparison-with-automatic-analyzer-22523-en.jpg)


![A [simple] land cover change intercomparison](https://img.pdfslide.net/doc/110x75/56814f92550346895dbd4da4/a-simple-land-cover-change-intercomparison.jpg)