Embed Size (px)
Citation preview
Showa Denko K.K. c1
SHOWA DENKO K.K. Annual Report 2001
Interconnection of Inorganic/Aluminum and Organic Chemical Technologies
Interconnection of Inorganic/Aluminum andOrganic Chemical Technologies
C
c2 Annual Report 2001
Ranking as one of Japan’s leading chemical companies, Showa Denko K.K.
operates in the five major sectors of petrochemicals, chemicals, electronics,
inorganic materials, and aluminum.
Showa Denko has many consolidated subsidiaries active in a wide range of
related operations, including Japan Polyolefins Co., Ltd., which manufactures
polyethylene plastics.
Under the “Cheetah Project,” a medium-term consolidated business plan that
extends from 2000 through 2002, we have been fully renovating operations
through restructuring, the improvement of our financial strength, and the
reduction of our workforce.
Based on achievements made to date under the plan, we have established a
new consolidated business plan for the 2003–2005 period named the “Sprout
Project,” in which we will shift our focus from restructuring to growth strategies.
We will achieve growth through the pursuit of synergies that nurture inter-
connections among inorganic/aluminum and organic chemicals technologies.
Focusing on the three major target markets of electronics, automotive parts,
and personal care/environmental goods, we will fully utilize our core technologies
and provide individualized products that meet stringent customer requirements.
Showa Denko is committed to the principle of Responsible Care and is vigor-
ously carrying out an action plan to implement its Responsible Care program.
PPROFILE
CONTENTS
Consolidated Financial Highlights 1
Message from the Management 2
Progress in the Second Year of the Cheetah Project
& Establishment of the Sprout Project 6
Showa Denko at a Glance 8
Review of Operations 9
Responsible Care Activities 13
Research and Development 14
Consolidated Six-Year Summary 16
Management’s Discussion and Analysis 17
Consolidated Balance Sheets 20
Consolidated Statements of Income 22
Consolidated Statements of Stockholders’ Equity 23
Consolidated Statements of Cash Flows 24
Notes to Financial Statements 25
Report of Independent Certified Public Accountants 36
Major Subsidiaries and Affiliates 37
Directors, Statutory Auditors, Corporate Officers,
and Chief Technologist 38
Corporate Data 39
Forward-Looking Statements
This annual report contains statements relating to management’s projections of future profits,
the possible achievement of the Company’s financial goals and objectives, and management’s
expectations for the Company’s product development program. The Company cannot guaran-
tee that these expectations and projections will be realized or correct. Actual results may differ
materially from the results anticipated in the statements included herein due to a variety of fac-
tors, including such economic factors as fluctuations in foreign currency exchange rates as well
as market supply and demand conditions. The timely commercialization of products under
development by the Company may be disrupted or delayed by a variety of factors, including
market acceptance, the introduction of new products by competitors, and changes in regula-
tions or laws. The foregoing list of factors is not inclusive.
Showa Denko K.K. 1
CThousands of
Millions of yen U.S. dollars (Note)
2001 2000 1999 2001
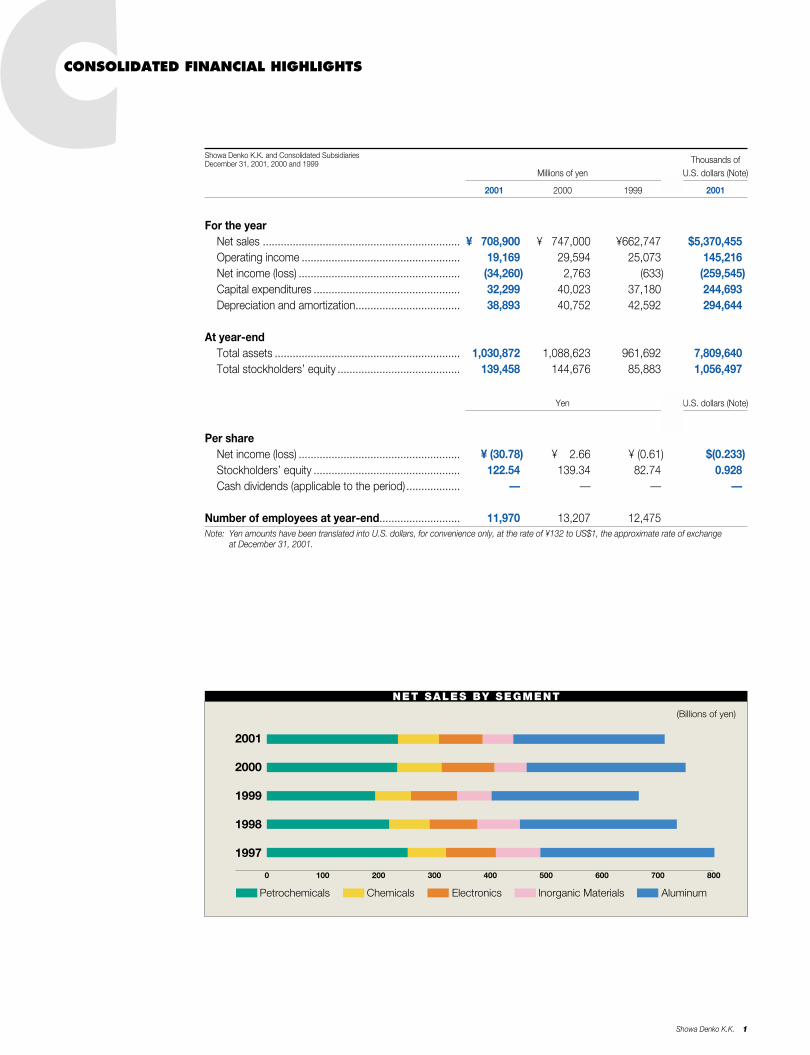
For the yearNet sales .................................................................. ¥0,708,900 ¥0,747,000 ¥662,747 $5,370,455Operating income ..................................................... 19,169 29,594 25,073 145,216Net income (loss) ...................................................... (34,260) 2,763 (633) (259,545)Capital expenditures ................................................. 32,299 40,023 37,180 244,693Depreciation and amortization................................... 38,893 40,752 42,592 294,644
At year-endTotal assets .............................................................. 1,030,872 1,088,623 961,692 7,809,640Total stockholders’ equity ......................................... 139,458 144,676 85,883 1,056,497
Yen U.S. dollars (Note)
Per shareNet income (loss) ...................................................... ¥ (30.78) ¥002.66 ¥ (0.61) $(0.233)Stockholders’ equity ................................................. 122.54 139.34 82.74 0.928Cash dividends (applicable to the period) .................. — — — —
Number of employees at year-end........................... 11,970 13,207 12,475Note: Yen amounts have been translated into U.S. dollars, for convenience only, at the rate of ¥132 to US$1, the approximate rate of exchange
at December 31, 2001.
Showa Denko K.K. and Consolidated SubsidiariesDecember 31, 2001, 2000 and 1999
CONSOLIDATED FINANCIAL HIGHLIGHTS
(Billions of yen)
2001
2000
1999
1998
1997
Petrochemicals Chemicals Electronics Inorganic Materials Aluminum
0 100 200 300 400 500 600 700 800
NET SALES BY SEGMENT
year, we recorded extraordinary losses in advance—
such as provision for restructuring expenses, including
special severance pay for early retirees expected in
2002 and onwards—and we posted a net loss of
¥34,260 million. As a result, we again had to forgo
the payment of dividends for the term, and we deeply
apologize for this to our stockholders.
To counter the non-consolidated deficit incurred
at the end of the term, we drew on our capital reserve
by ¥38,642 million in March 2002.
Regarding capital investment in 2001, we expanded
our compound semiconductor and rare earth magnetic
alloy production capacities and newly constructed
solid conductive polymer aluminum capacitor manu-
facturing facilities. Our capital expenditures in 2001
totaled ¥32,299 million as investments were limited
for the most part to rationalization, maintenance,
and environmental protection measures.
To improve our financial strength, we made all-out
efforts to reduce debt. As a result, the outstanding
balance of debt as of the end of 2001 decreased
¥22,144 million, to ¥622,411 million.
Segment Performances
Broken down by business segment, net sales and
operating income were as follows:
In the Petrochemicals Segment, sales crept up
0.6%, to ¥233,647 million, but operating income fell
44.5%, to ¥6,130 million. Sales from olefins operations
decreased owing to lower selling prices that more than
offset the rise in production and sales volumes. Sales
from organic chemicals operations decreased as a
result of lower acrylonitrile selling prices despite not-
too-severe market conditions for acetic acid, vinyl
acetate monomer, and ethyl acetate.
Japan Polyolefins Co., Ltd. (JPO)’s sales declined
mainly due to the fall in sales volumes. Meanwhile,
sales from plastic products operations increased owing
MMESSAGE FROM THE MANAGEMENT
2 Annual Report 2001
The Japanese economy sharply deteriorated in
2001 following a slowdown in the U.S. economy
that led to lower exports, a prolonged inventory
adjustment process, a decline in private-sector
capital investment, and stagnation in consumer
spending amid increasing uncertainty in the
employment situation. The Japanese chemical
industry continued to face a severe business
environment due to the declines in exports and
the selling prices of petrochemicals as well as
a slowdown in demand for IT-related products.
Promotion of the Cheetah Project
Under such circumstances, Showa Denko K.K. and its
Group companies continued to implement measures
defined in the “Cheetah Project,” a medium-term con-
solidated business plan that was introduced in 2000.
In the second year under the plan, we proceeded with
our efforts to improve our financial strength by cutting
debt, reducing total labor costs, and divesting the
Group of operations that are not consistent with our
desired business portfolio. Furthermore, Showa Denko
merged with Showa Aluminum Corporation and Shotic
Corporation to strengthen the aluminum business
and undertook restructuring measures in the
Petrochemicals Segment. In addition, we reduced the
workforce by around 1,000 employees through an early
retirement program in view of the expansion of our
overseas production and to eliminate the duplication of
staff positions where the mergers had resulted in overlap.
In February 2002, we sold our 50% equity owner-
ship in Showa Cabot Supermetals K.K.—to which the
equity method had been applied—to its co-owner,
Cabot Corporation, of the United States.
As for the Company’s consolidated performance
in 2001, net sales totaled ¥708,900 million, a decrease
of 5.1% from the previous term, and operating income
was down 35.2%, to ¥19,169 million. Also during the
Showa Denko K.K. 3
to the steady growth of production and sales in Asian
markets. Showa Highpolymer Co., Ltd., to which the
equity method had been applied, was consolidated in
the latter half of the year, contributing ¥12,313 million to
the increase in the Petrochemicals Segment’s sales.
During the year under review, we formed a strategic
alliance with BP PETRONAS Acetyls Sdn. Bhd.,
whereby we secured a long-term supply of acetic acid
from that company’s plant in Malaysia with a view to
strengthening our competitive position in the acetic
acid business. In addition, JPO started discussing the
merger of its polyethylene operations with Japan
Polychem Corporation.
In the Chemicals Segment, sales decreased 7.3%,
to ¥73,020 million, and operating income fell 15.8%, to
¥4,708 million. Sales from gases and chemicals opera-
tions were down owing to the decrease in shipments
of industrial gases and chemicals amid the recession.
In specialty chemicals operations, shipments of vitamin
C derivatives and new chelating agents increased.
However, due to decreases in shipments of other
product lines, sales from specialty chemicals opera-
tions declined. Sales from agrochemicals operations
were flat as the depreciation of the yen offset the fall in
the sales volume of Daconil fungicide. During the year,
we started expanding our HFC production capacity to
meet the increase in demand for HFC due to the toll
production arrangement with Asahi Glass Co., Ltd.
In the Electronics Segment, sales decreased 17.6%,
to ¥77,742 million, but operating income increased
6.0%, to ¥1,422 million. Shipments of glass-substrate
hard disks (HDs) saw a substantial increase while
those of compound semiconductors fell sharply due to
production and inventory adjustments by customers.
Sales of other electronic materials, including specialty
gases, rare earth magnetic alloys, fine carbon prod-
ucts, and specialty polishing agents, all decreased due
to lower demand.
During the year, we established a joint venture with
Sachem, Inc., of the United States, for the production
and sale of tetramethyl ammonium hydroxide (TMAH)
for use in photoresist developer. Moreover, we started
up a new company in Singapore to strengthen our
presence overseas in the area of semiconductor-
processing specialty gases.
In the Inorganic Materials Segment, sales fell 5.6%,
to ¥54,555 million, and operating income was down
41.7%, to ¥3,511 million. Sales from ceramics opera-
tions decreased owing to a decline in shipments. Sales
from carbons & metallic materials operations also fell
as sales volumes and selling prices of graphite elec-
trodes and high-carbon ferrochrome declined. Showa
Denko Carbon, Inc., our graphite electrode subsidiary
in the United States, saw a decline in sales due to the
fall in shipments and selling prices that reflected an
economic slowdown in that country.
In the Aluminum Segment, sales were down 4.9%,
to ¥269,936 million, and operating income fell 35.1%,
to ¥8,036 million. Sales from aluminum materials oper-
ations decreased owing to a substantial fall in demand
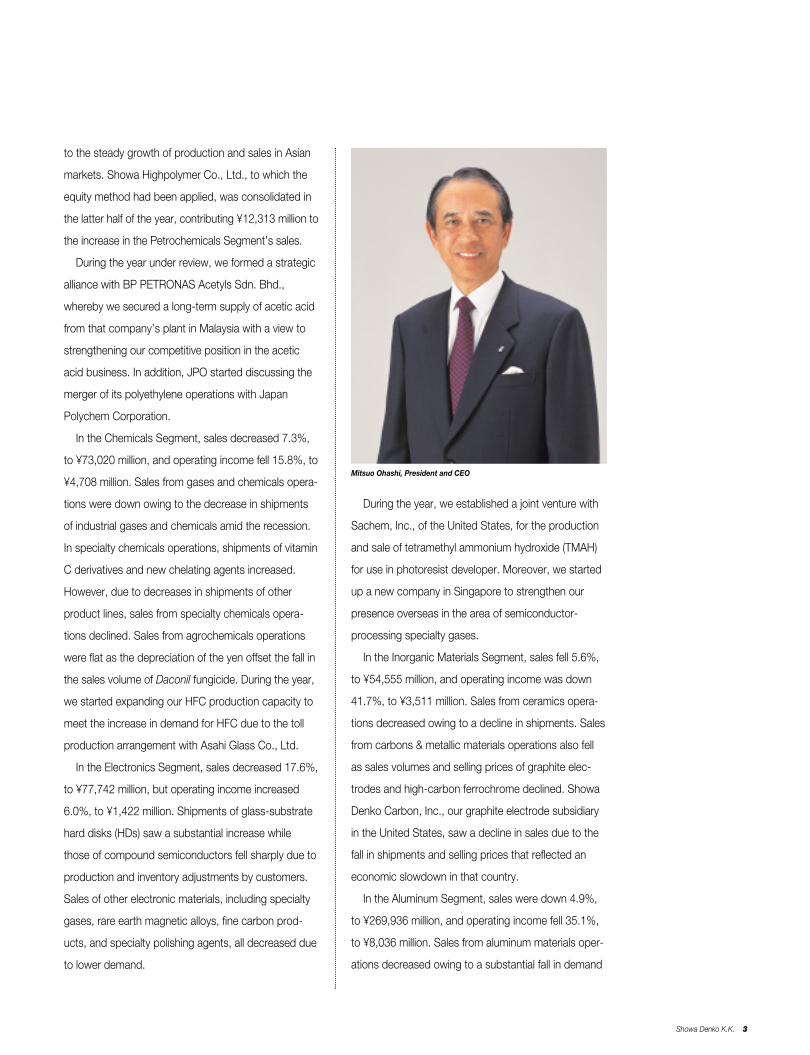
Mitsuo Ohashi, President and CEO
4 Annual Report 2001
for high-purity foils as a result of drastic production
cutbacks and inventory adjustments by capacitor man-
ufacturers. Shipments and selling prices of sheets and
extrusions also fell. Sales from aluminum fabricated
products operations were down as shipments of heat
exchangers and OA equipment components decreased.
Sales of Shotic continuously cast aluminum rods and
their forged products fell due to lower shipments that
reflected stagnant automobile sales in North America.
Meanwhile, sales of aluminum ingots increased as the
rise in domestic selling prices, due to the depreciation
of the yen, more than offset a decline in shipments.
During the year, we established Showa Denko Packaging
Co., Ltd., by consolidating Showa Denko K.K.’s fabri-
cated foil business and Heisei Polymer Co., Ltd.’s
lamination business.
Merger with Showa Aluminum Corporation
Showa Denko K.K. merged with Showa Aluminum
Corporation and Shotic Corporation on March 30,
2001, and July 1, 2001, respectively. Showa Denko
(Europe) GmbH and Showa Aluminium Europe GmbH,
both marketing companies in Europe, were also
merged on January 1, 2002.
Establishment of Sprout Project
While we are proceeding with the full implementation
of the current Cheetah Project, we have mapped out
a new three-year consolidated business plan for the
2003–2005 period named the “Sprout Project.” Com-
pared with the Cheetah Project, which focuses on
improving the consolidated balance sheet and restruc-
turing operations, the new business plan will focus on
growth strategies, taking full advantage of achieve-
ments made under the Cheetah Project. To ensure
a smooth transition to the new business plan, we
reformed our technology-related and aluminum busi-
ness related organizations in March 2002. In addition,
we will further reduce administrative expenses at the
head office through head-count reduction and improve-
ments in efficiency.
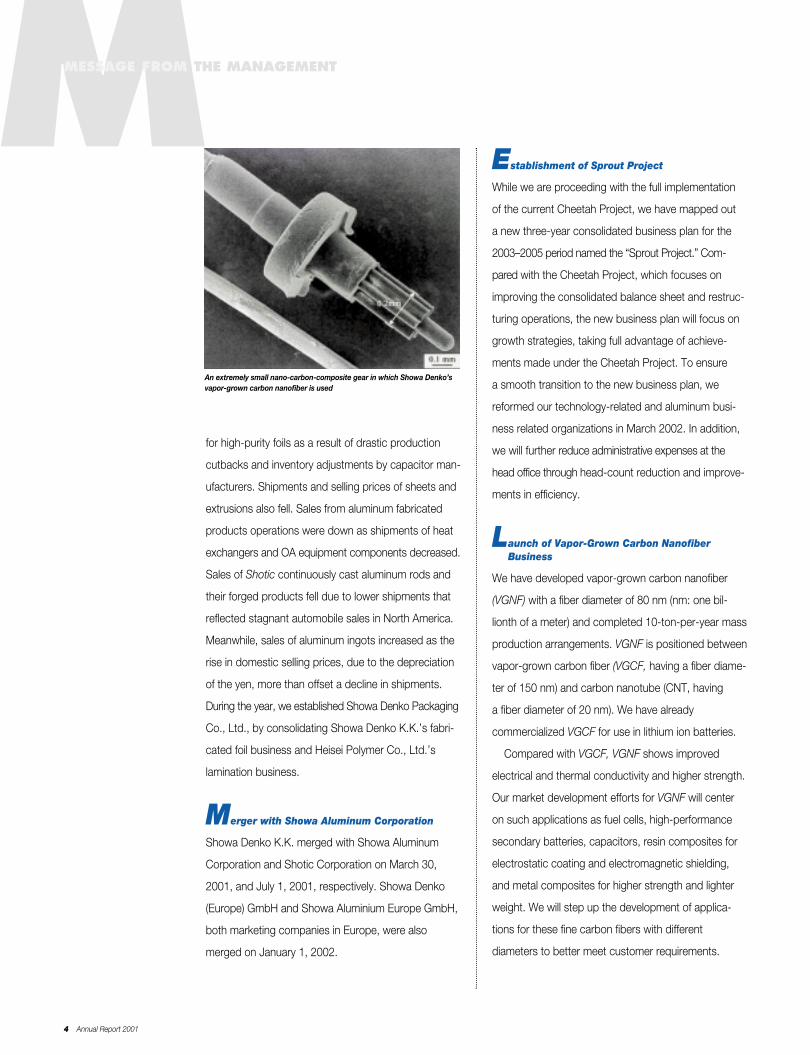
Launch of Vapor-Grown Carbon NanofiberBusiness
We have developed vapor-grown carbon nanofiber
(VGNF) with a fiber diameter of 80 nm (nm: one bil-
lionth of a meter) and completed 10-ton-per-year mass
production arrangements. VGNF is positioned between
vapor-grown carbon fiber (VGCF, having a fiber diame-
ter of 150 nm) and carbon nanotube (CNT, having
a fiber diameter of 20 nm). We have already
commercialized VGCF for use in lithium ion batteries.
Compared with VGCF, VGNF shows improved
electrical and thermal conductivity and higher strength.
Our market development efforts for VGNF will center
on such applications as fuel cells, high-performance
secondary batteries, capacitors, resin composites for
electrostatic coating and electromagnetic shielding,
and metal composites for higher strength and lighter
weight. We will step up the development of applica-
tions for these fine carbon fibers with different
diameters to better meet customer requirements.
MMESSAGE FROM THE MANAGEMENT
An extremely small nano-carbon-composite gear in which Showa Denko’svapor-grown carbon nanofiber is used
Showa Denko K.K. 5
New Products for Personal Care/EnvironmentGoods Markets
In addition to stabilized vitamin C that is effective as a
cosmetic agent against the formation of melanin, acne,
and inflammation and as ultraviolet shielding, we start-
ed selling the inorganic nano-particle ultraviolet shield-
ing materials Maxlight FTS and Maxlight ZS for use in
sunscreen cream and foundation. We also started sell-
ing the surfactin sodium salt Aminofect, a biosurfactant
that is gentle on the skin and shows 100 to 1,000
times greater surface activity than conventional surfac-
tants. Both the Maxlight series and Aminofect have
been adopted by major cosmetics manufacturers. SDS
Biotech K.K.’s herbicide business, which centered on
Dymron, has been strengthened further with the acqui-
sition of the Grachitor rice/lawn herbicide business
and the launch of the in-house-developed new rice
herbicide benzobicyclon.
Strengthening of Electronics Business
We commercialized indium gallium phosphide (InGaP)
epitaxial wafers for use in NTT Advanced Technology
Corporation’s hetero bipolar transistors, which will be
incorporated in next-generation cellular phones.
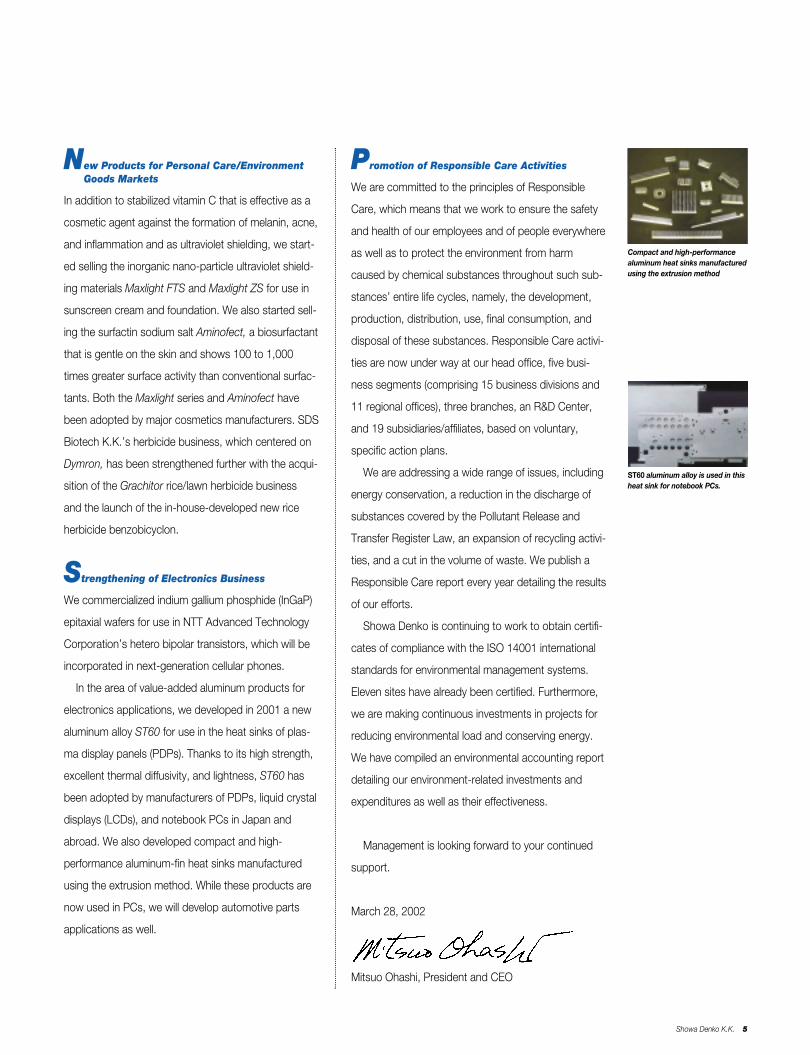
In the area of value-added aluminum products for
electronics applications, we developed in 2001 a new
aluminum alloy ST60 for use in the heat sinks of plas-
ma display panels (PDPs). Thanks to its high strength,
excellent thermal diffusivity, and lightness, ST60 has
been adopted by manufacturers of PDPs, liquid crystal
displays (LCDs), and notebook PCs in Japan and
abroad. We also developed compact and high-
performance aluminum-fin heat sinks manufactured
using the extrusion method. While these products are
now used in PCs, we will develop automotive parts
applications as well.
ST60 aluminum alloy is used in thisheat sink for notebook PCs.
Compact and high-performancealuminum heat sinks manufacturedusing the extrusion method
Promotion of Responsible Care Activities
We are committed to the principles of Responsible
Care, which means that we work to ensure the safety
and health of our employees and of people everywhere
as well as to protect the environment from harm
caused by chemical substances throughout such sub-
stances’ entire life cycles, namely, the development,
production, distribution, use, final consumption, and
disposal of these substances. Responsible Care activi-
ties are now under way at our head office, five busi-
ness segments (comprising 15 business divisions and
11 regional offices), three branches, an R&D Center,
and 19 subsidiaries/affiliates, based on voluntary,
specific action plans.
We are addressing a wide range of issues, including
energy conservation, a reduction in the discharge of
substances covered by the Pollutant Release and
Transfer Register Law, an expansion of recycling activi-
ties, and a cut in the volume of waste. We publish a
Responsible Care report every year detailing the results
of our efforts.
Showa Denko is continuing to work to obtain certifi-
cates of compliance with the ISO 14001 international
standards for environmental management systems.
Eleven sites have already been certified. Furthermore,
we are making continuous investments in projects for
reducing environmental load and conserving energy.
We have compiled an environmental accounting report
detailing our environment-related investments and
expenditures as well as their effectiveness.
Management is looking forward to your continued
support.
March 28, 2002
Mitsuo Ohashi, President and CEO
6 Annual Report 2001
PPROGRESS IN THE SECOND YEAR OF THE CHEETAH PROJECT & ESTABLISHMENT
OF THE SPROUT PROJECT
Showa Denko and its Group companies aremaking progress in the implementation of theCheetah Project. In the three-year period from2000 through 2002, we are carrying out anaction plan to renovate operations to pave theway for future growth. During this period, weare strategically reducing the scope of ouroperations while maintaining investments inhigh growth potential areas.
In order to establish a stronger base forearnings power, we are reducing fixed costsand improving the consolidated balance sheetby selling operations and affiliated companiesthat are not consistent with our target busi-ness portfolio as well as reducing debt andpersonnel.
MAJOR ACCOMPLISHMENTS IN 2001, THESECOND YEAR OF THE CHEETAH PROJECT,WERE AS FOLLOWS:
� Completed the merger with Showa Aluminum
Corporation
� Almost completed restructuring in the Petrochemicals
Segment
� Made progress in reducing debt and total labor costs,
exceeding the numerical targets set forth in the
Cheetah Project
Furthermore, to cope with the deterioration of the busi-
ness environment, we took additional measures, centering
on a reduction of approximately 1,000 workers, with the
aim of cutting costs by around ¥10 billion in 2002.
The following indicates how we are making progress
in implementing the Cheetah Project:
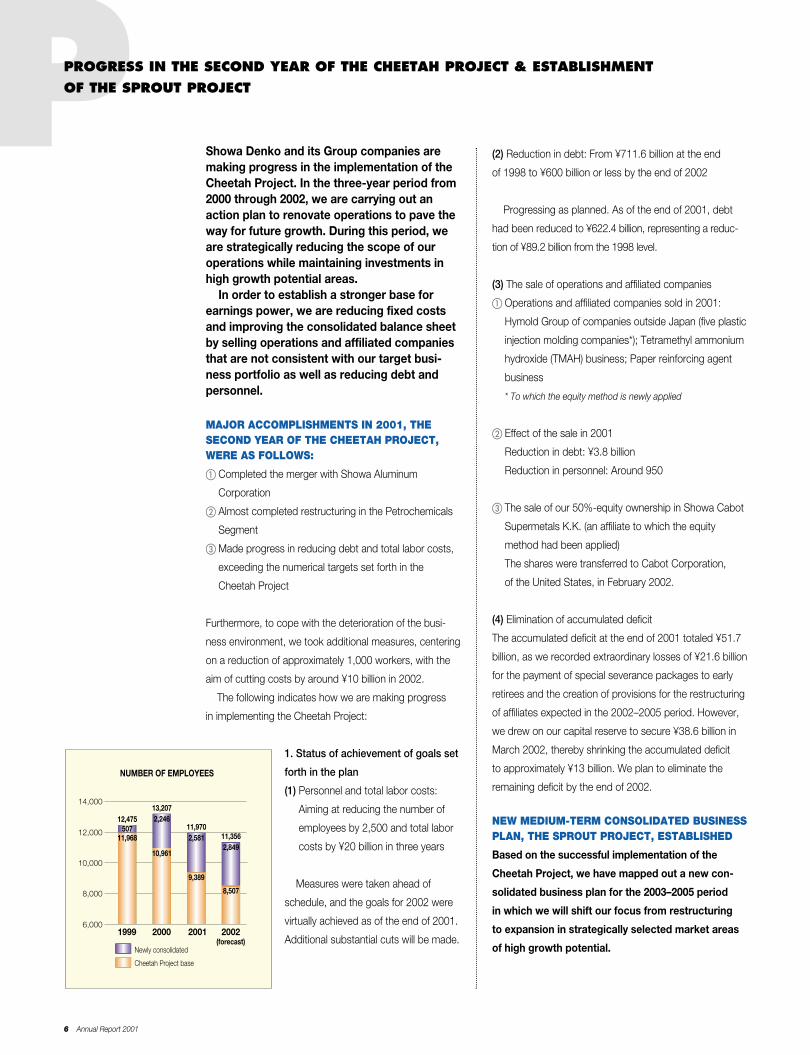
1. Status of achievement of goals set
forth in the plan
(1) Personnel and total labor costs:
Aiming at reducing the number of
employees by 2,500 and total labor
costs by ¥20 billion in three years
Measures were taken ahead of
schedule, and the goals for 2002 were
virtually achieved as of the end of 2001.
Additional substantial cuts will be made.
(2) Reduction in debt: From ¥711.6 billion at the end
of 1998 to ¥600 billion or less by the end of 2002
Progressing as planned. As of the end of 2001, debt
had been reduced to ¥622.4 billion, representing a reduc-
tion of ¥89.2 billion from the 1998 level.
(3) The sale of operations and affiliated companies
� Operations and affiliated companies sold in 2001:
Hymold Group of companies outside Japan (five plastic
injection molding companies*); Tetramethyl ammonium
hydroxide (TMAH) business; Paper reinforcing agent
business
� * To which the equity method is newly applied
� Effect of the sale in 2001
Reduction in debt: ¥3.8 billion
Reduction in personnel: Around 950
� The sale of our 50%-equity ownership in Showa Cabot
Supermetals K.K. (an affiliate to which the equity
method had been applied)
The shares were transferred to Cabot Corporation,
of the United States, in February 2002.
(4) Elimination of accumulated deficit
The accumulated deficit at the end of 2001 totaled ¥51.7
billion, as we recorded extraordinary losses of ¥21.6 billion
for the payment of special severance packages to early
retirees and the creation of provisions for the restructuring
of affiliates expected in the 2002–2005 period. However,
we drew on our capital reserve to secure ¥38.6 billion in
March 2002, thereby shrinking the accumulated deficit
to approximately ¥13 billion. We plan to eliminate the
remaining deficit by the end of 2002.
NEW MEDIUM-TERM CONSOLIDATED BUSINESSPLAN, THE SPROUT PROJECT, ESTABLISHED
Based on the successful implementation of the
Cheetah Project, we have mapped out a new con-
solidated business plan for the 2003–2005 period
in which we will shift our focus from restructuring
to expansion in strategically selected market areas
of high growth potential.1999 2000 2001 2002
(forecast)
6,000
8,000
10,000
14,000
12,000
NUMBER OF EMPLOYEES
5072,246
2,5812,849
12,47513,207
11,97011,35611,968
10,961
9,389
8,507
Newly consolidated
Cheetah Project base
Showa Denko K.K. 7
1. Basic concept of growth strategy
We will pursue synergies by nurturing the interconnection
of inorganic/aluminum and organic chemical technologies,
and change our way of thinking from a production-based
to a market-oriented concept.
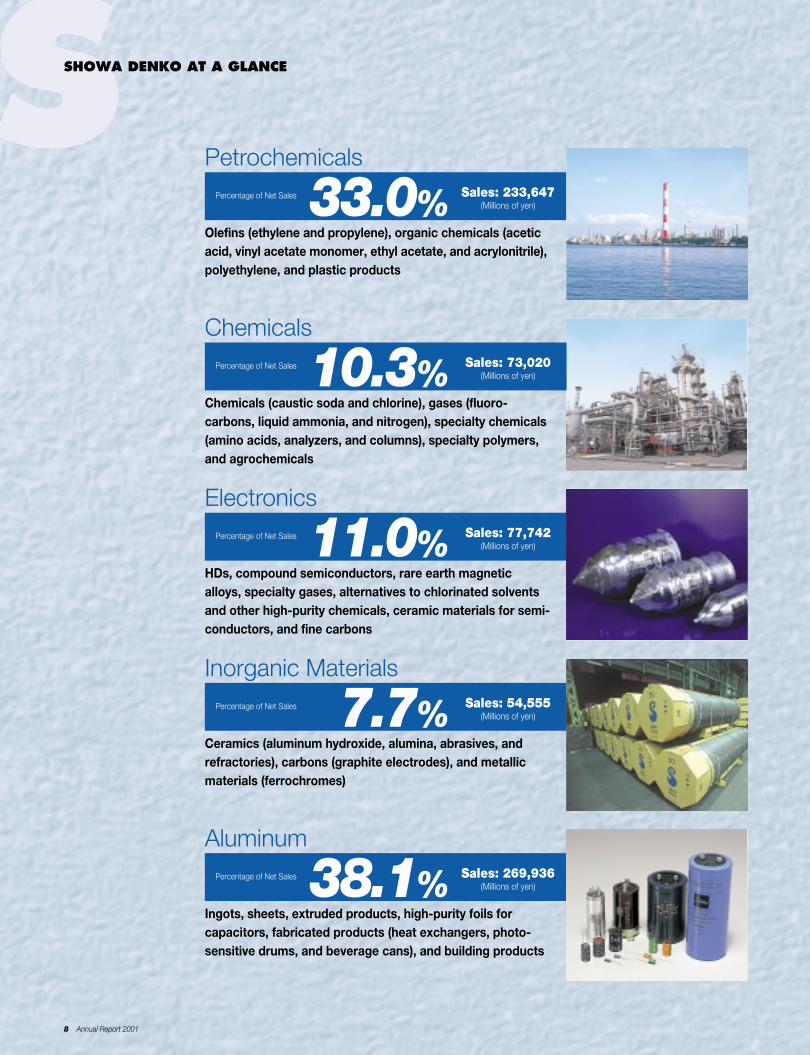
2. Target markets and business domains
(1) Strategic market units (SMUs)
We first examined our extensive businesses and technical
capabilities and analyzed our three major target markets,
namely, electronics, automotive parts, and personal
care/environmental goods. Then, we identified 12 SMUs
where we can expect high growth that will be achieved
by fully utilizing our core technologies and supplying indi-
vidualized product lines that meet stringent customer
requirements.
(2) Business portfolio
Based on the concept of SMUs and identification of our
core technologies, we have classified all of our businesses
into the following three categories:
� “Strategic growth businesses” that are directly linked to
SMUs and will serve as growth engines for Showa
Denko and its Group companies
� “Base businesses” that will, despite their relatively low
growth potential, support the strategic growth businesses
� Businesses that need restructuring regardless of their
current earnings power
We will concentrate our resources on the strategic
growth businesses and make sure that their growth will be
supported by the base businesses. As for the businesses
in the third category, we will pursue their optimum man-
agement environment, taking into account the possibilities
of alliance or divestiture.
(3) Capital investment and R&D spending
The aggregate amounts of capital investment and R&D
spending during the three-year period will be ¥114 billion
and ¥40 billion, respectively. Prior to the start of the
Sprout Project, we reformed our technology-related orga-
nizations in March 2002, introducing a system of technol-
ogy platforms. The new system aims to further strengthen
our core technologies and to encourage interconnection
among the various technological elements.
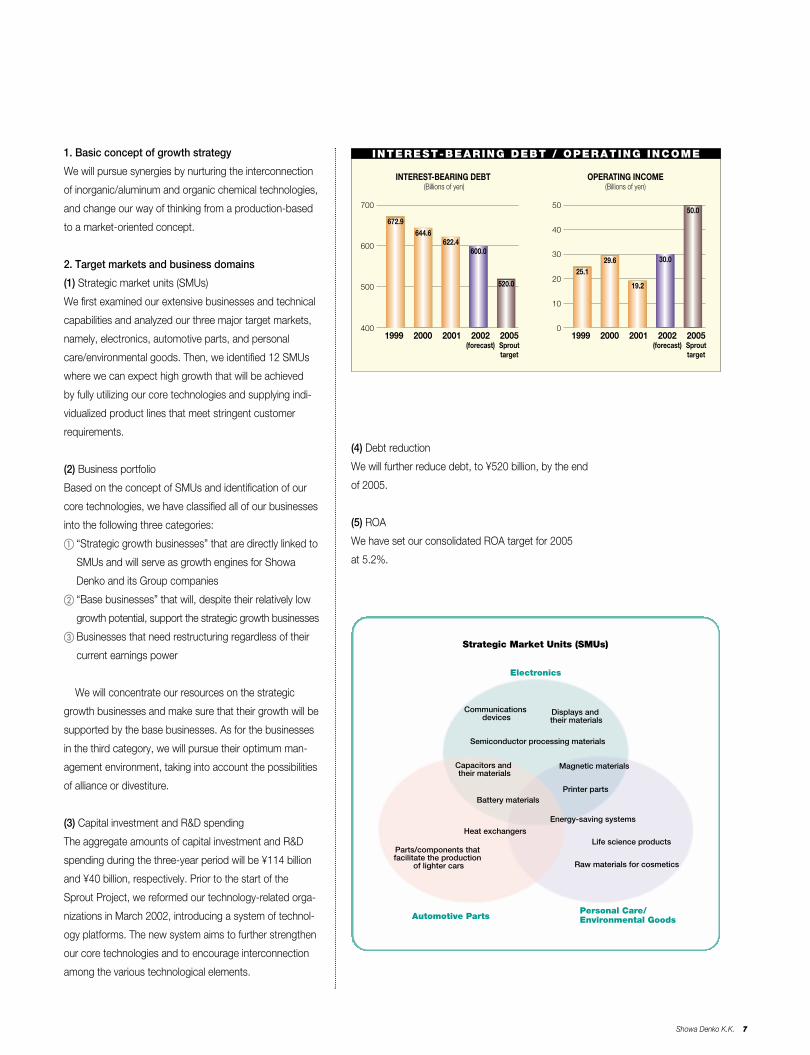
(4) Debt reduction
We will further reduce debt, to ¥520 billion, by the end
of 2005.
(5) ROA
We have set our consolidated ROA target for 2005
at 5.2%.
1999 2000 2001 2002 (forecast)
2005 Sprout target
1999 2000 2001 2002 (forecast)
2005 Sprout target
400
500
600
700
0
10
30
40
20
50
INTEREST-BEARING DEBT (Billions of yen)
OPERATING INCOME (Billions of yen)
672.9644.6
622.4600.0
520.0
25.129.6
19.2
30.0
50.0
INTEREST-BEARING DEBT / OPERATING INCOME
Strategic Market Units (SMUs)
Electronics
Automotive Parts Personal Care/ Environmental Goods
Communications devices
Displays and their materials
Capacitors and their materials
Semiconductor processing materials
Battery materials
Heat exchangers
Parts/components that facilitate the production
of lighter cars
Magnetic materials
Printer parts
Energy-saving systems
Life science products
Raw materials for cosmetics
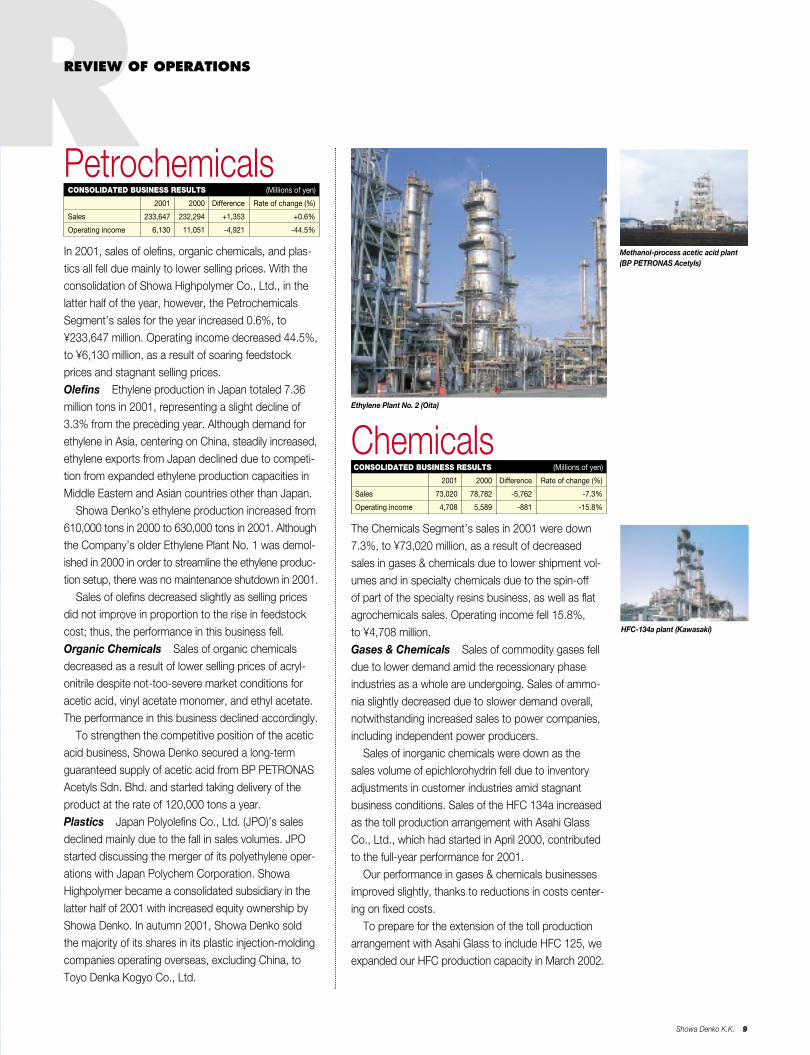
33.0%
11.0%
38.1%
7.7%
R
8 Annual Report 2001
SSHOWA DENKO AT A GLANCE
Chemicals
Chemicals (caustic soda and chlorine), gases (fluoro-carbons, liquid ammonia, and nitrogen), specialty chemicals(amino acids, analyzers, and columns), specialty polymers,and agrochemicals
Electronics
HDs, compound semiconductors, rare earth magneticalloys, specialty gases, alternatives to chlorinated solventsand other high-purity chemicals, ceramic materials for semi-conductors, and fine carbons
Inorganic Materials
Ceramics (aluminum hydroxide, alumina, abrasives, andrefractories), carbons (graphite electrodes), and metallicmaterials (ferrochromes)
Aluminum
Ingots, sheets, extruded products, high-purity foils forcapacitors, fabricated products (heat exchangers, photo-sensitive drums, and beverage cans), and building products
Percentage of Net Sales Sales: 233,647(Millions of yen)
Sales: 73,020(Millions of yen)
Sales: 77,742(Millions of yen)
Sales: 54,555(Millions of yen)
Sales: 269,936(Millions of yen)
Percentage of Net Sales
Percentage of Net Sales
Percentage of Net Sales
Percentage of Net Sales
10.3%
Petrochemicals
Olefins (ethylene and propylene), organic chemicals (aceticacid, vinyl acetate monomer, ethyl acetate, and acrylonitrile),polyethylene, and plastic products
RREVIEW OF OPERATIONS
Showa Denko K.K. 9
PetrochemicalsCONSOLIDATED BUSINESS RESULTS (Millions of yen)
2001 2000 Difference Rate of change (%)
Sales 233,647 232,294 +1,353 +0.6%
Operating income 6,130 11,051 -4,921 -44.5%
In 2001, sales of olefins, organic chemicals, and plas-tics all fell due mainly to lower selling prices. With theconsolidation of Showa Highpolymer Co., Ltd., in thelatter half of the year, however, the PetrochemicalsSegment’s sales for the year increased 0.6%, to¥233,647 million. Operating income decreased 44.5%,to ¥6,130 million, as a result of soaring feedstockprices and stagnant selling prices.Olefins Ethylene production in Japan totaled 7.36million tons in 2001, representing a slight decline of3.3% from the preceding year. Although demand forethylene in Asia, centering on China, steadily increased,ethylene exports from Japan declined due to competi-tion from expanded ethylene production capacities inMiddle Eastern and Asian countries other than Japan.
Showa Denko’s ethylene production increased from610,000 tons in 2000 to 630,000 tons in 2001. Althoughthe Company’s older Ethylene Plant No. 1 was demol-ished in 2000 in order to streamline the ethylene produc-tion setup, there was no maintenance shutdown in 2001.
Sales of olefins decreased slightly as selling pricesdid not improve in proportion to the rise in feedstockcost; thus, the performance in this business fell.Organic Chemicals Sales of organic chemicalsdecreased as a result of lower selling prices of acryl-onitrile despite not-too-severe market conditions foracetic acid, vinyl acetate monomer, and ethyl acetate.The performance in this business declined accordingly.
To strengthen the competitive position of the aceticacid business, Showa Denko secured a long-termguaranteed supply of acetic acid from BP PETRONASAcetyls Sdn. Bhd. and started taking delivery of theproduct at the rate of 120,000 tons a year.Plastics Japan Polyolefins Co., Ltd. (JPO)’s salesdeclined mainly due to the fall in sales volumes. JPOstarted discussing the merger of its polyethylene oper-ations with Japan Polychem Corporation. ShowaHighpolymer became a consolidated subsidiary in thelatter half of 2001 with increased equity ownership byShowa Denko. In autumn 2001, Showa Denko soldthe majority of its shares in its plastic injection-moldingcompanies operating overseas, excluding China, toToyo Denka Kogyo Co., Ltd.
ChemicalsCONSOLIDATED BUSINESS RESULTS (Millions of yen)
2001 2000 Difference Rate of change (%)
Sales 73,020 78,782 -5,762 -7.3%
Operating income 4,708 5,589 -881 -15.8%
The Chemicals Segment’s sales in 2001 were down7.3%, to ¥73,020 million, as a result of decreasedsales in gases & chemicals due to lower shipment vol-umes and in specialty chemicals due to the spin-offof part of the specialty resins business, as well as flatagrochemicals sales. Operating income fell 15.8%,to ¥4,708 million.Gases & Chemicals Sales of commodity gases felldue to lower demand amid the recessionary phaseindustries as a whole are undergoing. Sales of ammo-nia slightly decreased due to slower demand overall,notwithstanding increased sales to power companies,including independent power producers.
Sales of inorganic chemicals were down as thesales volume of epichlorohydrin fell due to inventoryadjustments in customer industries amid stagnantbusiness conditions. Sales of the HFC 134a increasedas the toll production arrangement with Asahi GlassCo., Ltd., which had started in April 2000, contributedto the full-year performance for 2001.
Our performance in gases & chemicals businessesimproved slightly, thanks to reductions in costs center-ing on fixed costs.
To prepare for the extension of the toll productionarrangement with Asahi Glass to include HFC 125, weexpanded our HFC production capacity in March 2002.
Methanol-process acetic acid plant(BP PETRONAS Acetyls)
Ethylene Plant No. 2 (Oita)
HFC-134a plant (Kawasaki)
10 Annual Report 2001
Specialty Chemicals Shipments of stabilizedvitamin C increased, centering on feed additive andcosmetic applications. Shipments of the new chelat-ing agent Glda also increased. However, due to thetransfer in June 2000 of our nylon business to a non-consolidated affiliate and a drop in amino acids sellingprices caused by an influx of low-priced imports, salesof specialty chemicals in 2001 decreased.
SDS Biotech K.K. increased its sales as a result ofstarting sales of new products.
Our performance in specialty chemicals businessesimproved owing to favorable conditions in the stabi-lized vitamin C business and the new product launchby SDS Biotech.New Developments In 2001, Showa Denko and itsconsolidated subsidiary Nippon Polytech Corporationjointly developed a dry-film solder mask (trade name:Topflex) for flexible printed wiring boards.
In addition, Showa Denko developed surfactinsodium salt (trade name: Aminofect), which is a high-performance, gentle-on-the-skin biosurfactant forcosmetic applications, as well as the ultraviolet shield-ing cosmetic materials Maxlight FTS and Maxlight ZS,which consist of nano-particles of titanium oxide andzinc oxide, respectively.
In June 2001, SDS Biotech acquired the rice/lawnherbicide Grachitor (cafenstrole) business of ChugaiPharmaceutical Co., Ltd., and its consolidated sub-sidiary Eiko Kasei Co., Ltd. SDS Biotech started salesof Grachitor in the latter half of 2001. Moreover, SDSBiotech developed a new rice herbicide, benzo-bicyclon, which is very effective in removing toughannual broadleaf weeds.
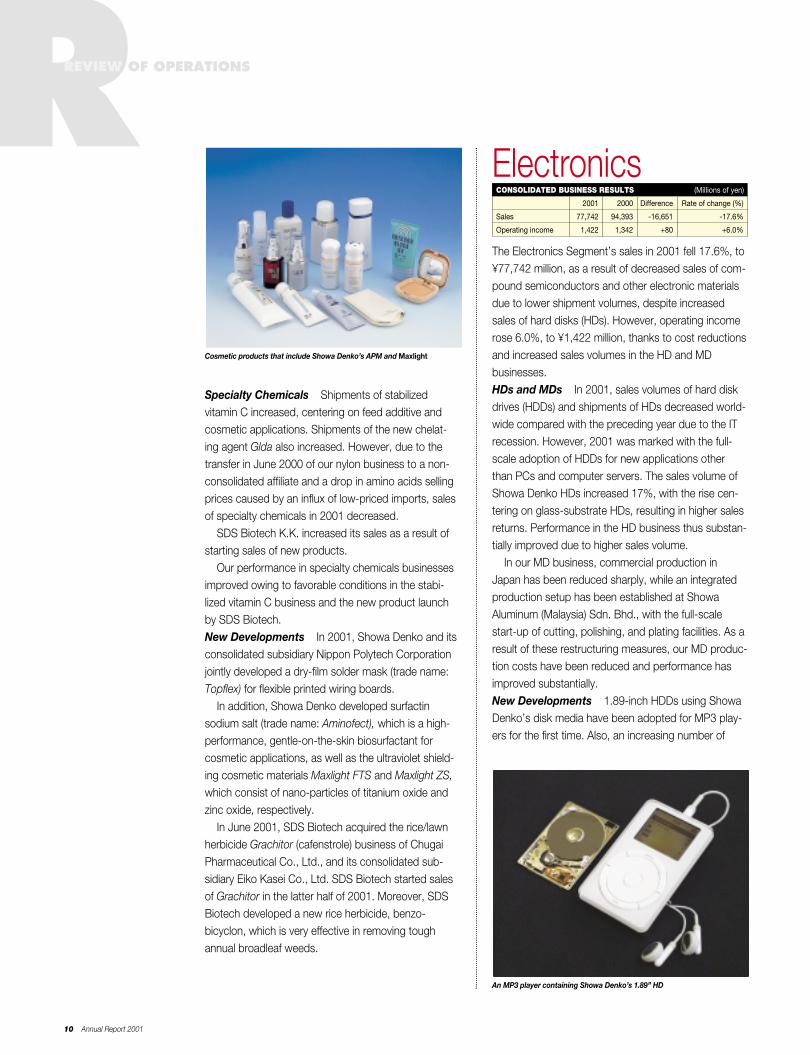
ElectronicsCONSOLIDATED BUSINESS RESULTS (Millions of yen)
2001 2000 Difference Rate of change (%)
Sales 77,742 94,393 -16,651 -17.6%
Operating income 1,422 1,342 +80 +6.0%
The Electronics Segment’s sales in 2001 fell 17.6%, to¥77,742 million, as a result of decreased sales of com-pound semiconductors and other electronic materialsdue to lower shipment volumes, despite increasedsales of hard disks (HDs). However, operating incomerose 6.0%, to ¥1,422 million, thanks to cost reductionsand increased sales volumes in the HD and MDbusinesses.HDs and MDs In 2001, sales volumes of hard diskdrives (HDDs) and shipments of HDs decreased world-wide compared with the preceding year due to the ITrecession. However, 2001 was marked with the full-scale adoption of HDDs for new applications otherthan PCs and computer servers. The sales volume ofShowa Denko HDs increased 17%, with the rise cen-tering on glass-substrate HDs, resulting in higher salesreturns. Performance in the HD business thus substan-tially improved due to higher sales volume.
In our MD business, commercial production inJapan has been reduced sharply, while an integratedproduction setup has been established at ShowaAluminum (Malaysia) Sdn. Bhd., with the full-scalestart-up of cutting, polishing, and plating facilities. As aresult of these restructuring measures, our MD produc-tion costs have been reduced and performance hasimproved substantially.New Developments 1.89-inch HDDs using ShowaDenko’s disk media have been adopted for MP3 play-ers for the first time. Also, an increasing number of
RREVIEW OF OPERATIONS
An MP3 player containing Showa Denko’s 1.89” HD
Cosmetic products that include Showa Denko’s APM and Maxlight
Showa Denko K.K. 11
2.5-inch HDDs that contain Showa Denko’s diskmedia are being used in car navigation systems.Compound Semiconductors Our compound semi-conductor business was hard hit by the IT recession.Sales volumes decreased sharply in the areas of cellularphones, PCs, and optical fiber communications equip-ment, resulting in a substantial overall decline in sales.
Sales of gallium phosphide (GaP) LEDs, the majorcomponent of our optical electronic materials productline, decreased considerably. Meanwhile, sales of four-element high-brightness LEDs were steady. During theyear, we started production and sales of laser-diodeepitaxial wafers for DVD optical pickups.
After rapid expansion in recent years, the opticalfiber communications market in North America basedon wavelength division multiplexing (WDM) technologystarted shrinking drastically in and around the thirdquarter of 2001. As a result, we experienced a sharpdecline in sales of our indium phosphide (InP) epitaxialwafers for photodiodes made using the metal-organicchemical vapor deposition (MOCVD) process.However, overall sales of communications equipmentrelated materials saw no decline from the precedingyear due to favorable sales up to the end of thesecond quarter.New Developments Showa Denko and NTTAdvanced Technology Corporation (NTT-AT) conclud-ed an agreement in July 2001 whereby Showa Denkowill produce indium gallium phosphide (InGaP) epitaxialwafers for use in NTT-AT’s hetero bipolar transistors(HBTs) to be incorporated in next-generation cellularphones. Rare Earths Following production cutbacks bymagnet manufacturers amid the IT recession, the salesvolume of rare earth magnet alloys fell substantially,resulting in decreased overall sales. Business perfor-mance also declined due to the lower sales volume.New Developments For the production ofneodymium-based rare earth magnet alloys, we start-ed up the world’s biggest 1.5-ton vacuum inductionfurnace in 2001.Specialty Gases for Semiconductor ProcessingSales volumes of our semiconductor-processing special-ty gases, scrubbers, and reagents were down consider-ably due to the stagnation in the world’s semiconductorindustry, resulting in a sharp decline in sales.New Developments In the strategically importantarea of fine chemicals, we established a joint venturewith SACHEM, Inc., of the United States, for the
production and sale of tetramethylammonium hydroxide (TMAH) for use inphotoresist developer. The joint venture,SACHEM SHOWA Co., Ltd., is an affiliateto which the equity method is applied.
At our joint venture Showa Denko AirProducts Co., Ltd., the fluorine-basedspecialty gas production facilities wereexpanded during 2001 to meet growingdemand. This move followed an earlierexpansion in February 2000.Ceramics Sales of our ceramic prod-ucts for electronic applications fell asa result of a sharp decline in demand.Meanwhile, we added another production line for ultra-fine particles of high-purity titanium oxide and expand-ed our production capacity for the polishing agentSHOROX for LCD panels.
Sales of chemical mechanical polishing (CMP) slur-ries for use in processing semiconductor devices grewsteadily with customers’ recognition of the quality ofour products. In addition, we put on the market a finalpolishing agent for glass-substrate HDs, increasingsales in this area.Carbons Sales of fine carbon products, includingvapor-grown carbon fiber (VGCF), were depressed dueto the IT recession. New Developments In our semiconductor-process-ing specialty gases operations, we launched C3F8 andC4F6, a new cleaning gas and a new etching gas,respectively.
Our solid conductive polymer aluminum surface-mount capacitors received high evaluations fromcustomers for their very low ESR (equivalent seriesresistance) and high heat resistance. Efforts are beingmade to improve production yields. We are planning toproduce new models with smaller heights and highercapacitance.
We expect growing demand for our proprietarySuper jUFFIT precoating technology, as it is applicableto lead-free solder pastes and the formation of bumpsin IC packages.
We also expect growing demand for our conductivepolymer-based Espacer as an antistatic agent for usein electron beam lithography on silicon wafers.
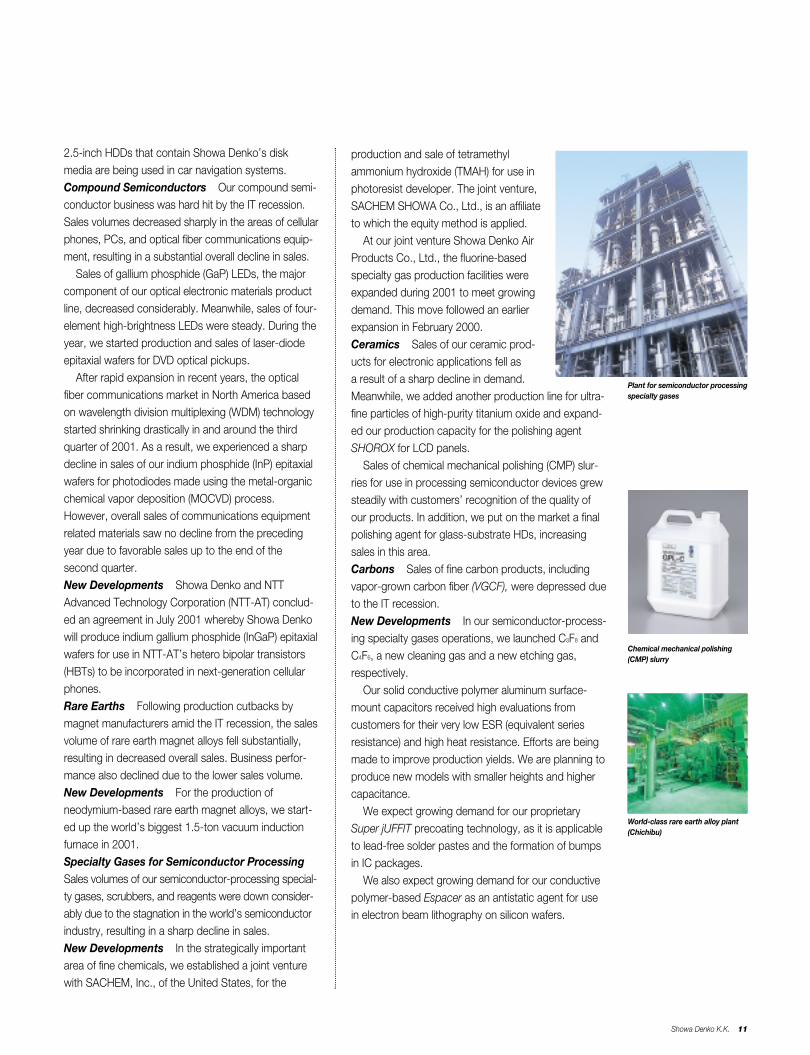
World-class rare earth alloy plant(Chichibu)
Plant for semiconductor processingspecialty gases
Chemical mechanical polishing(CMP) slurry
RREVIEW OF OPERATIONS
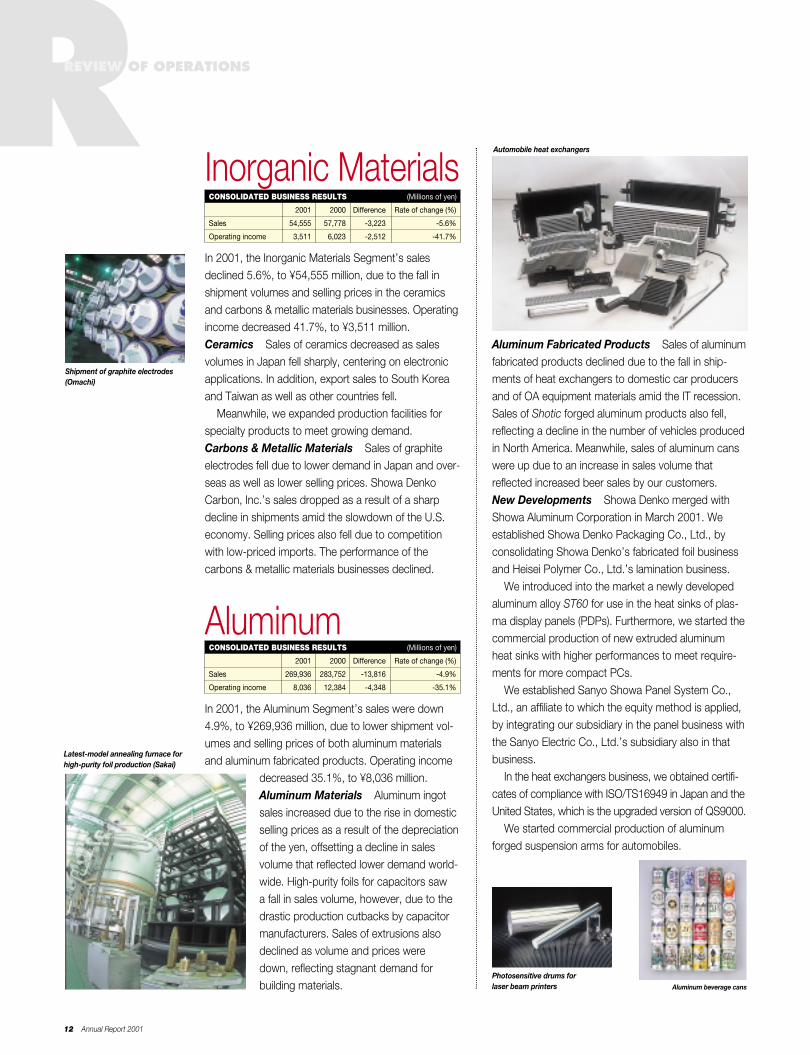
Inorganic MaterialsCONSOLIDATED BUSINESS RESULTS (Millions of yen)
2001 2000 Difference Rate of change (%)
Sales 54,555 57,778 -3,223 -5.6%
Operating income 3,511 6,023 -2,512 -41.7%
In 2001, the Inorganic Materials Segment’s salesdeclined 5.6%, to ¥54,555 million, due to the fall inshipment volumes and selling prices in the ceramicsand carbons & metallic materials businesses. Operatingincome decreased 41.7%, to ¥3,511 million.Ceramics Sales of ceramics decreased as salesvolumes in Japan fell sharply, centering on electronicapplications. In addition, export sales to South Koreaand Taiwan as well as other countries fell.
Meanwhile, we expanded production facilities forspecialty products to meet growing demand.Carbons & Metallic Materials Sales of graphiteelectrodes fell due to lower demand in Japan and over-seas as well as lower selling prices. Showa DenkoCarbon, Inc.’s sales dropped as a result of a sharpdecline in shipments amid the slowdown of the U.S.economy. Selling prices also fell due to competitionwith low-priced imports. The performance of thecarbons & metallic materials businesses declined.
AluminumCONSOLIDATED BUSINESS RESULTS (Millions of yen)
2001 2000 Difference Rate of change (%)
Sales 269,936 283,752 -13,816 -4.9%
Operating income 8,036 12,384 -4,348 -35.1%
In 2001, the Aluminum Segment’s sales were down4.9%, to ¥269,936 million, due to lower shipment vol-umes and selling prices of both aluminum materialsand aluminum fabricated products. Operating income
decreased 35.1%, to ¥8,036 million.Aluminum Materials Aluminum ingotsales increased due to the rise in domesticselling prices as a result of the depreciationof the yen, offsetting a decline in salesvolume that reflected lower demand world-wide. High-purity foils for capacitors sawa fall in sales volume, however, due to thedrastic production cutbacks by capacitormanufacturers. Sales of extrusions alsodeclined as volume and prices weredown, reflecting stagnant demand forbuilding materials.
12 Annual Report 2001
RShipment of graphite electrodes(Omachi)
Aluminum Fabricated Products Sales of aluminumfabricated products declined due to the fall in ship-ments of heat exchangers to domestic car producersand of OA equipment materials amid the IT recession.Sales of Shotic forged aluminum products also fell,reflecting a decline in the number of vehicles producedin North America. Meanwhile, sales of aluminum canswere up due to an increase in sales volume thatreflected increased beer sales by our customers.New Developments Showa Denko merged withShowa Aluminum Corporation in March 2001. Weestablished Showa Denko Packaging Co., Ltd., byconsolidating Showa Denko’s fabricated foil businessand Heisei Polymer Co., Ltd.’s lamination business.
We introduced into the market a newly developedaluminum alloy ST60 for use in the heat sinks of plas-ma display panels (PDPs). Furthermore, we started thecommercial production of new extruded aluminumheat sinks with higher performances to meet require-ments for more compact PCs.
We established Sanyo Showa Panel System Co.,Ltd., an affiliate to which the equity method is applied,by integrating our subsidiary in the panel business withthe Sanyo Electric Co., Ltd.’s subsidiary also in thatbusiness.
In the heat exchangers business, we obtained certifi-cates of compliance with ISO/TS16949 in Japan and theUnited States, which is the upgraded version of QS9000.
We started commercial production of aluminumforged suspension arms for automobiles.
Photosensitive drums for laser beam printers
Automobile heat exchangers
Latest-model annealing furnace forhigh-purity foil production (Sakai)
Aluminum beverage cans
Showa Denko K.K. 13
RRESPONSIBLE CARE ACTIVITIES
Showa Denko has been performing its ResponsibleCare activities since 1995, when it establishedguidelines for action to implement the program.Under the new setup following the merger withShowa Aluminum Corporation and ShoticCorporation in March and July 2001, respectively,Responsible Care activities are going on at ourfive business segments (15 business divisionsand 11 regional offices), three branches, an R&DCenter, and 19 subsidiaries/affiliates, based onvoluntary, specific action plans prepared in linewith the Responsible Care Committee’s basicplan. The following are some examples of ouractivities:
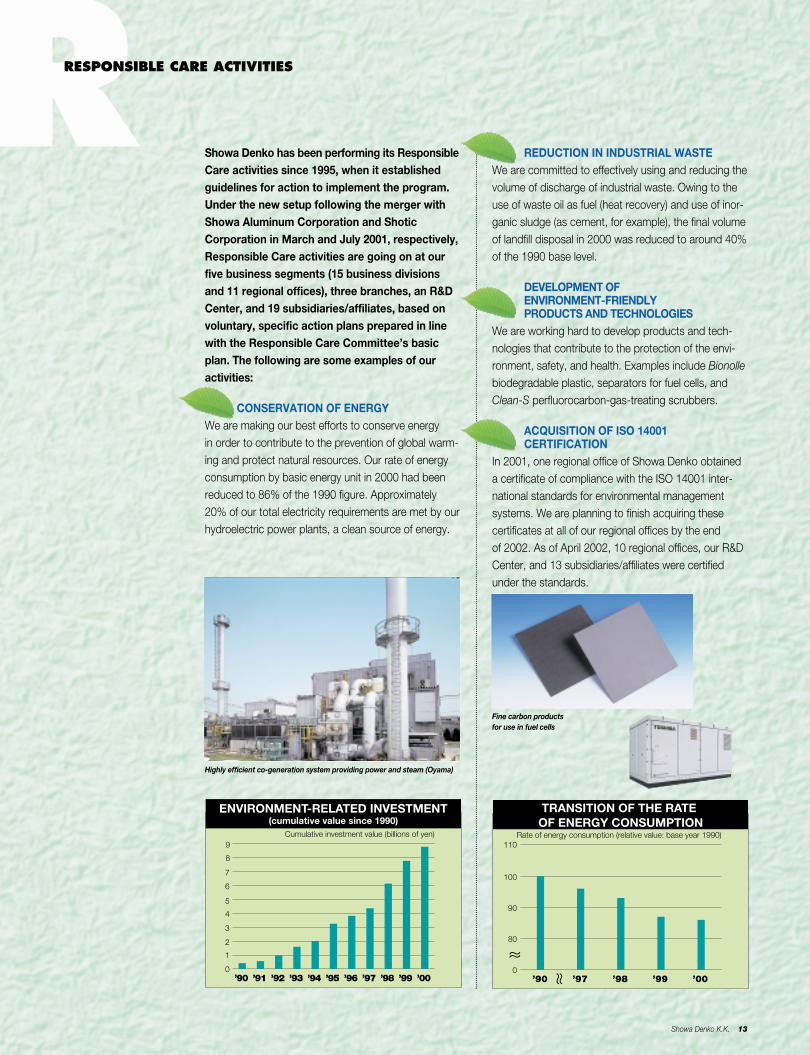
CONSERVATION OF ENERGYWe are making our best efforts to conserve energyin order to contribute to the prevention of global warm-ing and protect natural resources. Our rate of energyconsumption by basic energy unit in 2000 had beenreduced to 86% of the 1990 figure. Approximately20% of our total electricity requirements are met by ourhydroelectric power plants, a clean source of energy.
ENVIRONMENT-RELATED INVESTMENT (cumulative value since 1990)
Cumulative investment value (billions of yen)
0
1
2
3
4
5
6
7
8
9
’90 ’91 ’92 ’93 ’94 ’95 ’96 ’97 ’98 ’99 ’00
TRANSITION OF THE RATE OF ENERGY CONSUMPTION
Rate of energy consumption (relative value: base year 1990)
0
80
90
100
110
’90 ’97 ’98 ’99 ’00
REDUCTION IN INDUSTRIAL WASTEWe are committed to effectively using and reducing thevolume of discharge of industrial waste. Owing to theuse of waste oil as fuel (heat recovery) and use of inor-ganic sludge (as cement, for example), the final volumeof landfill disposal in 2000 was reduced to around 40%of the 1990 base level.
DEVELOPMENT OF ENVIRONMENT-FRIENDLY PRODUCTS AND TECHNOLOGIES
We are working hard to develop products and tech-nologies that contribute to the protection of the envi-ronment, safety, and health. Examples include Bionollebiodegradable plastic, separators for fuel cells, andClean-S perfluorocarbon-gas-treating scrubbers.
ACQUISITION OF ISO 14001CERTIFICATION
In 2001, one regional office of Showa Denko obtaineda certificate of compliance with the ISO 14001 inter-national standards for environmental managementsystems. We are planning to finish acquiring thesecertificates at all of our regional offices by the endof 2002. As of April 2002, 10 regional offices, our R&DCenter, and 13 subsidiaries/affiliates were certifiedunder the standards.
Highly efficient co-generation system providing power and steam (Oyama)
Fine carbon productsfor use in fuel cells
14 Annual Report 2001
Showa Denko and its Group companies are
promoting R&D in line with their medium-term
consolidated business plan to create high-value,
individualized products in the fields of petro-
chemicals, fine chemicals, electronics, and new
materials while facilitating R&D to protect the
environment and natural resources.
In particular, we are focusing on developing
electronic materials, high-value fabricated alu-
minum products, and specialty chemicals for our
strategic growth markets of electronics, automo-
tive parts, and personal care/environmental goods.
To ensure the success of such development, we
are pursuing technological synergies by nurturing
the interconnection of inorganic/aluminum and
organic chemical technologies.
Showa Denko and its Group companies invest-
ed ¥15.4 billion in R&D in 2001. A breakdown by
segment of R&D efforts and investments during
the year is as follows:
PETROCHEMICALS
This segment’s development efforts cover basic prod-
ucts, derivatives, and plastics. As for the propylene-
based product line, where we have already developed
a proprietary allyl ester product, we are now concen-
trating on the development of allyl derivatives for
environment/energy-related applications. The
Petrochemicals Segment invested ¥2.8 billion in
R&D in 2001.
CHEMICALS
Development is under way for optical functional
materials, base materials for cosmetics, and organic
intermediates for pharmaceuticals and agrochemicals.
As for optical functional materials, we are developing
photoresist inks, photosensitive cover lays, and photo
initiators through our subsidiary Nippon Polytech Corp.
In the area of base materials for cosmetics, we added
an innovative biosurfactant to our individualized prod-
uct lines of stabilized vitamin C and nano-particles
for ultraviolet shielding.
Furthermore, we are developing new compounds
for agrochemicals in the areas where our raw materials
position can be fully utilized. We continue to pursue
research into organic intermediates, including new raw
materials for photographic chemicals and biodegrad-
able chelating agents. The Chemicals Segment’s R&D
investment amounted to ¥2.5 billion in 2001.
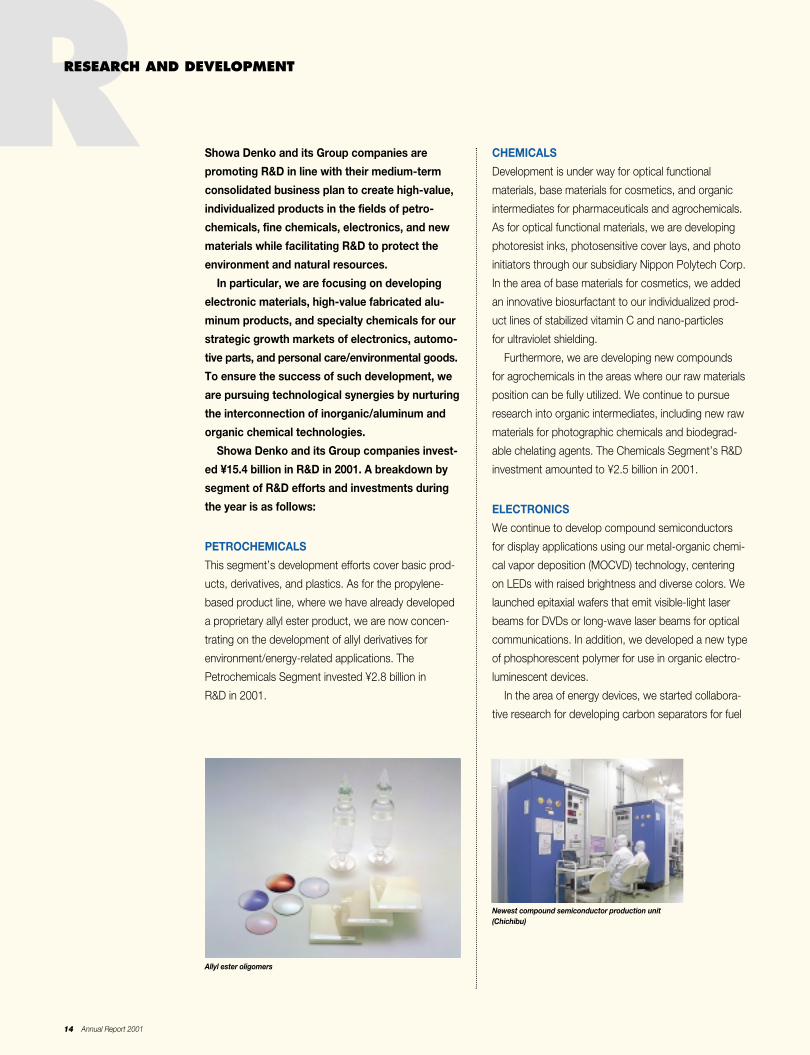
ELECTRONICS
We continue to develop compound semiconductors
for display applications using our metal-organic chemi-
cal vapor deposition (MOCVD) technology, centering
on LEDs with raised brightness and diverse colors. We
launched epitaxial wafers that emit visible-light laser
beams for DVDs or long-wave laser beams for optical
communications. In addition, we developed a new type
of phosphorescent polymer for use in organic electro-
luminescent devices.
In the area of energy devices, we started collabora-
tive research for developing carbon separators for fuel
RRESEARCH AND DEVELOPMENT
Newest compound semiconductor production unit(Chichibu)
Allyl ester oligomers
Showa Denko K.K. 15
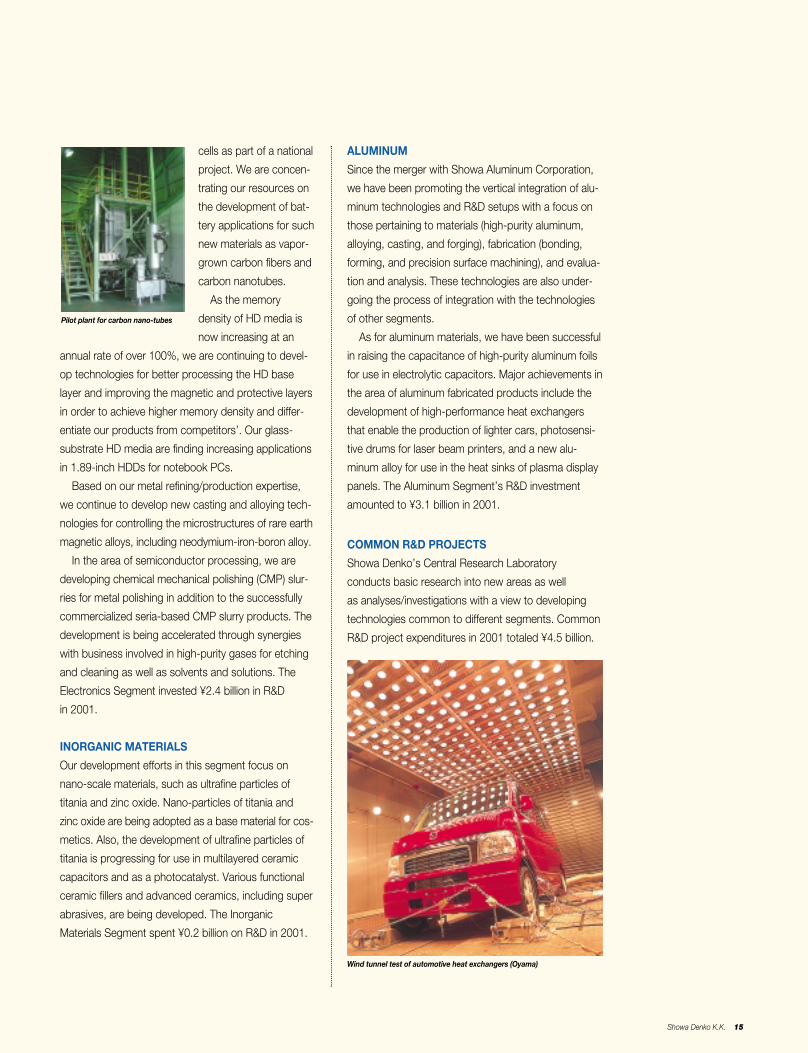
cells as part of a national
project. We are concen-
trating our resources on
the development of bat-
tery applications for such
new materials as vapor-
grown carbon fibers and
carbon nanotubes.
As the memory
density of HD media is
now increasing at an
annual rate of over 100%, we are continuing to devel-
op technologies for better processing the HD base
layer and improving the magnetic and protective layers
in order to achieve higher memory density and differ-
entiate our products from competitors’. Our glass-
substrate HD media are finding increasing applications
in 1.89-inch HDDs for notebook PCs.
Based on our metal refining/production expertise,
we continue to develop new casting and alloying tech-
nologies for controlling the microstructures of rare earth
magnetic alloys, including neodymium-iron-boron alloy.
In the area of semiconductor processing, we are
developing chemical mechanical polishing (CMP) slur-
ries for metal polishing in addition to the successfully
commercialized seria-based CMP slurry products. The
development is being accelerated through synergies
with business involved in high-purity gases for etching
and cleaning as well as solvents and solutions. The
Electronics Segment invested ¥2.4 billion in R&D
in 2001.
INORGANIC MATERIALS
Our development efforts in this segment focus on
nano-scale materials, such as ultrafine particles of
titania and zinc oxide. Nano-particles of titania and
zinc oxide are being adopted as a base material for cos-
metics. Also, the development of ultrafine particles of
titania is progressing for use in multilayered ceramic
capacitors and as a photocatalyst. Various functional
ceramic fillers and advanced ceramics, including super
abrasives, are being developed. The Inorganic
Materials Segment spent ¥0.2 billion on R&D in 2001.
ALUMINUM
Since the merger with Showa Aluminum Corporation,
we have been promoting the vertical integration of alu-
minum technologies and R&D setups with a focus on
those pertaining to materials (high-purity aluminum,
alloying, casting, and forging), fabrication (bonding,
forming, and precision surface machining), and evalua-
tion and analysis. These technologies are also under-
going the process of integration with the technologies
of other segments.
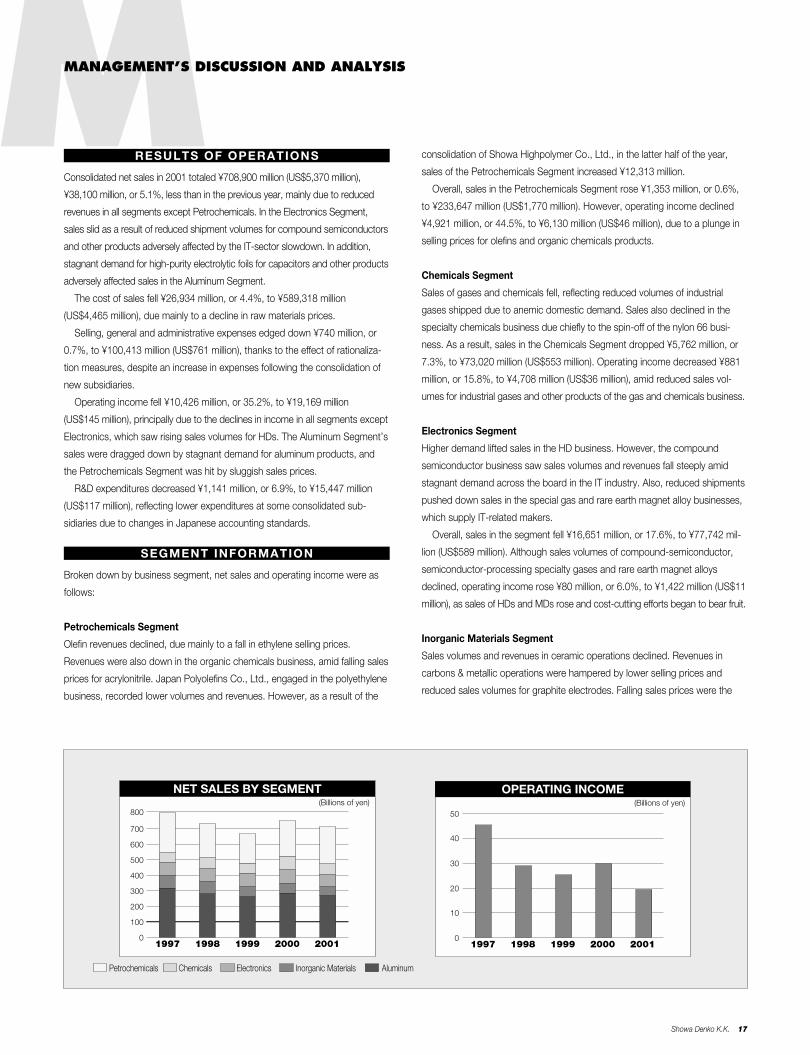
As for aluminum materials, we have been successful
in raising the capacitance of high-purity aluminum foils
for use in electrolytic capacitors. Major achievements in
the area of aluminum fabricated products include the
development of high-performance heat exchangers
that enable the production of lighter cars, photosensi-
tive drums for laser beam printers, and a new alu-
minum alloy for use in the heat sinks of plasma display
panels. The Aluminum Segment’s R&D investment
amounted to ¥3.1 billion in 2001.
COMMON R&D PROJECTS
Showa Denko’s Central Research Laboratory
conducts basic research into new areas as well
as analyses/investigations with a view to developing
technologies common to different segments. Common
R&D project expenditures in 2001 totaled ¥4.5 billion.
Pilot plant for carbon nano-tubes
Wind tunnel test of automotive heat exchangers (Oyama)
C
16 Annual Report 2001
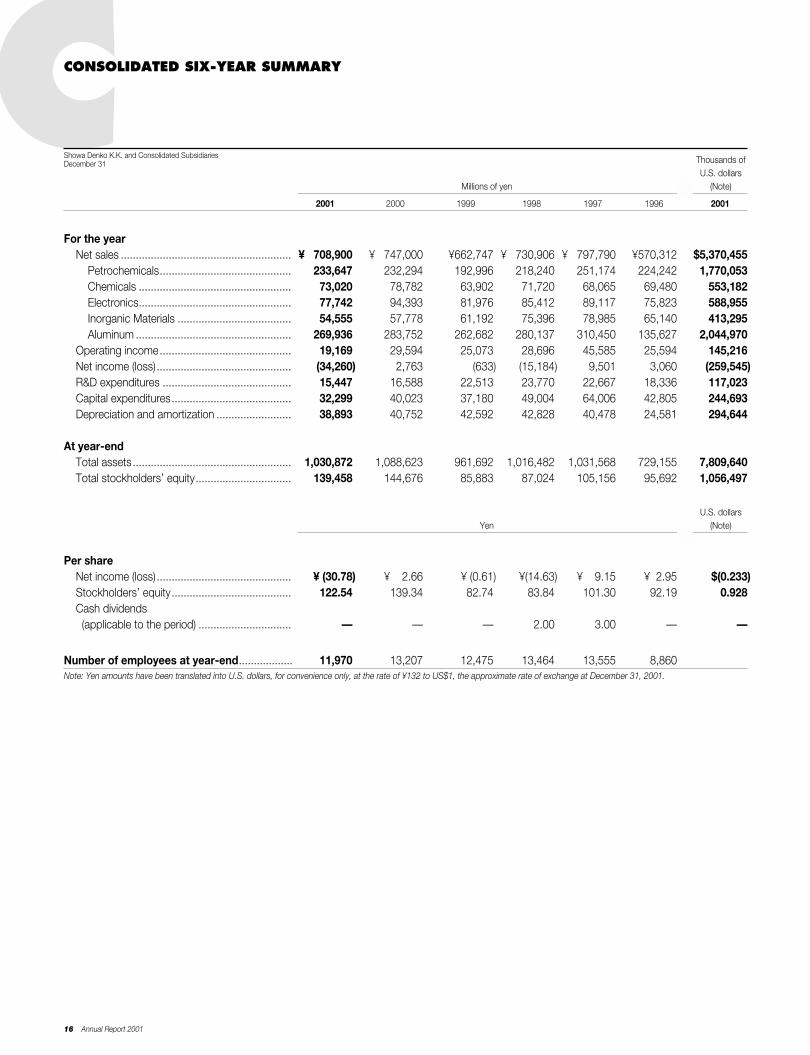
CONSOLIDATED SIX-YEAR SUMMARY MThousands ofU.S. dollars
Millions of yen (Note)
2001 2000 1999 1998 1997 1996 2001
For the yearNet sales ......................................................... ¥ 708,900 ¥ 747,000 ¥662,747 ¥ 730,906 ¥ 797,790 ¥570,312 $5,370,455
Petrochemicals............................................ 233,647 232,294 192,996 218,240 251,174 224,242 1,770,053Chemicals ................................................... 73,020 78,782 63,902 71,720 68,065 69,480 553,182Electronics................................................... 77,742 94,393 81,976 85,412 89,117 75,823 588,955Inorganic Materials ...................................... 54,555 57,778 61,192 75,396 78,985 65,140 413,295Aluminum .................................................... 269,936 283,752 262,682 280,137 310,450 135,627 2,044,970
Operating income............................................ 19,169 29,594 25,073 28,696 45,585 25,594 145,216Net income (loss)............................................. (34,260) 2,763 (633) (15,184) 9,501 3,060 (259,545)R&D expenditures ........................................... 15,447 16,588 22,513 23,770 22,667 18,336 117,023Capital expenditures........................................ 32,299 40,023 37,180 49,004 64,006 42,805 244,693Depreciation and amortization ......................... 38,893 40,752 42,592 42,828 40,478 24,581 294,644
At year-endTotal assets ..................................................... 1,030,872 1,088,623 961,692 1,016,482 1,031,568 729,155 7,809,640Total stockholders’ equity................................ 139,458 144,676 85,883 87,024 105,156 95,692 1,056,497
U.S. dollarsYen (Note)
Per shareNet income (loss)............................................. ¥ (30.78) ¥ 2.66 ¥ (0.61) ¥(14.63) ¥ 9.15 ¥ 2.95 $(0.233)Stockholders’ equity........................................ 122.54 139.34 82.74 83.84 101.30 92.19 0.928Cash dividends (applicable to the period) ............................... — — — 2.00 3.00 — —
Number of employees at year-end.................. 11,970 13,207 12,475 13,464 13,555 8,860Note: Yen amounts have been translated into U.S. dollars, for convenience only, at the rate of ¥132 to US$1, the approximate rate of exchange at December 31, 2001.
Showa Denko K.K. and Consolidated SubsidiariesDecember 31
Showa Denko K.K. 17
MMANAGEMENT’S DISCUSSION AND ANALYSIS
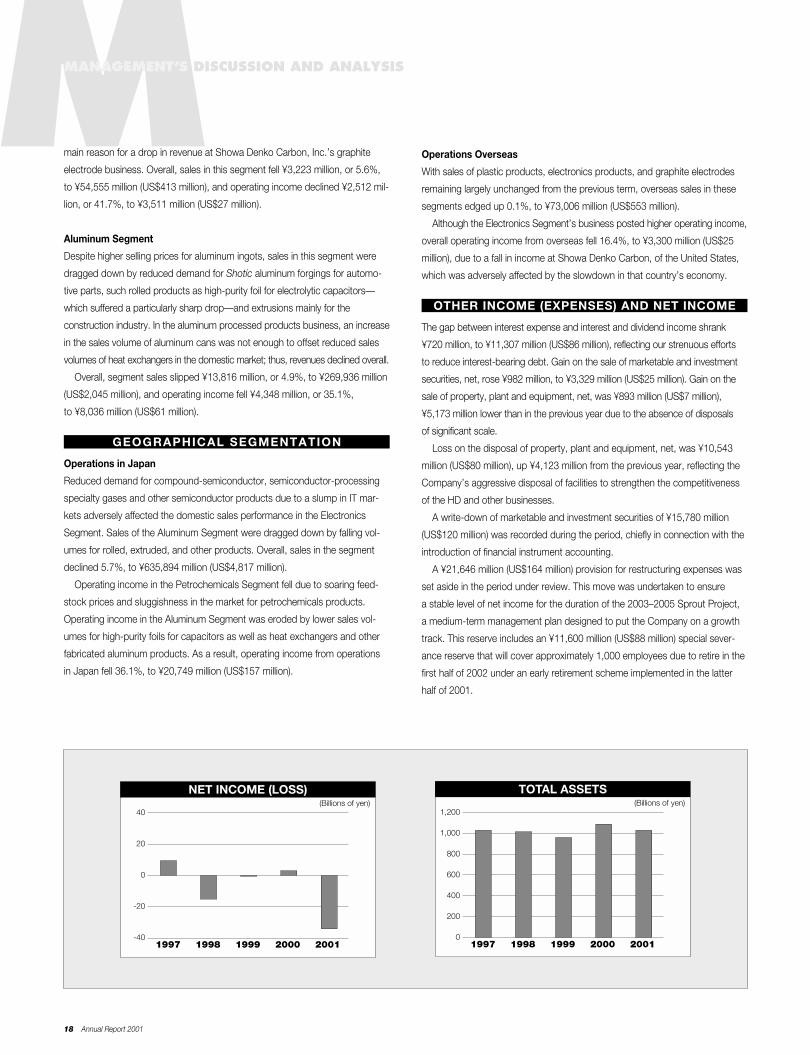
Consolidated net sales in 2001 totaled ¥708,900 million (US$5,370 million),
¥38,100 million, or 5.1%, less than in the previous year, mainly due to reduced
revenues in all segments except Petrochemicals. In the Electronics Segment,
sales slid as a result of reduced shipment volumes for compound semiconductors
and other products adversely affected by the IT-sector slowdown. In addition,
stagnant demand for high-purity electrolytic foils for capacitors and other products
adversely affected sales in the Aluminum Segment.
The cost of sales fell ¥26,934 million, or 4.4%, to ¥589,318 million
(US$4,465 million), due mainly to a decline in raw materials prices.
Selling, general and administrative expenses edged down ¥740 million, or
0.7%, to ¥100,413 million (US$761 million), thanks to the effect of rationaliza-
tion measures, despite an increase in expenses following the consolidation of
new subsidiaries.
Operating income fell ¥10,426 million, or 35.2%, to ¥19,169 million
(US$145 million), principally due to the declines in income in all segments except
Electronics, which saw rising sales volumes for HDs. The Aluminum Segment’s
sales were dragged down by stagnant demand for aluminum products, and
the Petrochemicals Segment was hit by sluggish sales prices.
R&D expenditures decreased ¥1,141 million, or 6.9%, to ¥15,447 million
(US$117 million), reflecting lower expenditures at some consolidated sub-
sidiaries due to changes in Japanese accounting standards.
Broken down by business segment, net sales and operating income were as
follows:
Petrochemicals Segment
Olefin revenues declined, due mainly to a fall in ethylene selling prices.
Revenues were also down in the organic chemicals business, amid falling sales
prices for acrylonitrile. Japan Polyolefins Co., Ltd., engaged in the polyethylene
business, recorded lower volumes and revenues. However, as a result of the
SEGMENT INFORMATION
RESULTS OF OPERATIONS
NET SALES BY SEGMENT(Billions of yen)
0
100
200
300
400
500
600
700
800
1997 1998 1999 2000 2001
Petrochemicals Chemicals Electronics Inorganic Materials Aluminum
consolidation of Showa Highpolymer Co., Ltd., in the latter half of the year,
sales of the Petrochemicals Segment increased ¥12,313 million.
Overall, sales in the Petrochemicals Segment rose ¥1,353 million, or 0.6%,
to ¥233,647 million (US$1,770 million). However, operating income declined
¥4,921 million, or 44.5%, to ¥6,130 million (US$46 million), due to a plunge in
selling prices for olefins and organic chemicals products.
Chemicals Segment
Sales of gases and chemicals fell, reflecting reduced volumes of industrial
gases shipped due to anemic domestic demand. Sales also declined in the
specialty chemicals business due chiefly to the spin-off of the nylon 66 busi-
ness. As a result, sales in the Chemicals Segment dropped ¥5,762 million, or
7.3%, to ¥73,020 million (US$553 million). Operating income decreased ¥881
million, or 15.8%, to ¥4,708 million (US$36 million), amid reduced sales vol-
umes for industrial gases and other products of the gas and chemicals business.
Electronics Segment
Higher demand lifted sales in the HD business. However, the compound
semiconductor business saw sales volumes and revenues fall steeply amid
stagnant demand across the board in the IT industry. Also, reduced shipments
pushed down sales in the special gas and rare earth magnet alloy businesses,
which supply IT-related makers.
Overall, sales in the segment fell ¥16,651 million, or 17.6%, to ¥77,742 mil-
lion (US$589 million). Although sales volumes of compound-semiconductor,
semiconductor-processing specialty gases and rare earth magnet alloys
declined, operating income rose ¥80 million, or 6.0%, to ¥1,422 million (US$11
million), as sales of HDs and MDs rose and cost-cutting efforts began to bear fruit.
Inorganic Materials Segment
Sales volumes and revenues in ceramic operations declined. Revenues in
carbons & metallic operations were hampered by lower selling prices and
reduced sales volumes for graphite electrodes. Falling sales prices were the
OPERATING INCOME(Billions of yen)
0
10
20
30
40
50
1997 1998 1999 2000 2001
18 Annual Report 2001
MMANAGEMENT’S DISCUSSION AND ANALYSIS
main reason for a drop in revenue at Showa Denko Carbon, Inc.’s graphite
electrode business. Overall, sales in this segment fell ¥3,223 million, or 5.6%,
to ¥54,555 million (US$413 million), and operating income declined ¥2,512 mil-
lion, or 41.7%, to ¥3,511 million (US$27 million).
Aluminum Segment
Despite higher selling prices for aluminum ingots, sales in this segment were
dragged down by reduced demand for Shotic aluminum forgings for automo-
tive parts, such rolled products as high-purity foil for electrolytic capacitors—
which suffered a particularly sharp drop—and extrusions mainly for the
construction industry. In the aluminum processed products business, an increase
in the sales volume of aluminum cans was not enough to offset reduced sales
volumes of heat exchangers in the domestic market; thus, revenues declined overall.
Overall, segment sales slipped ¥13,816 million, or 4.9%, to ¥269,936 million
(US$2,045 million), and operating income fell ¥4,348 million, or 35.1%,
to ¥8,036 million (US$61 million).
Operations in Japan
Reduced demand for compound-semiconductor, semiconductor-processing
specialty gases and other semiconductor products due to a slump in IT mar-
kets adversely affected the domestic sales performance in the Electronics
Segment. Sales of the Aluminum Segment were dragged down by falling vol-
umes for rolled, extruded, and other products. Overall, sales in the segment
declined 5.7%, to ¥635,894 million (US$4,817 million).
Operating income in the Petrochemicals Segment fell due to soaring feed-
stock prices and sluggishness in the market for petrochemicals products.
Operating income in the Aluminum Segment was eroded by lower sales vol-
umes for high-purity foils for capacitors as well as heat exchangers and other
fabricated aluminum products. As a result, operating income from operations
in Japan fell 36.1%, to ¥20,749 million (US$157 million).
GEOGRAPHICAL SEGMENTATION
Operations Overseas
With sales of plastic products, electronics products, and graphite electrodes
remaining largely unchanged from the previous term, overseas sales in these
segments edged up 0.1%, to ¥73,006 million (US$553 million).
Although the Electronics Segment’s business posted higher operating income,
overall operating income from overseas fell 16.4%, to ¥3,300 million (US$25
million), due to a fall in income at Showa Denko Carbon, of the United States,
which was adversely affected by the slowdown in that country’s economy.
The gap between interest expense and interest and dividend income shrank
¥720 million, to ¥11,307 million (US$86 million), reflecting our strenuous efforts
to reduce interest-bearing debt. Gain on the sale of marketable and investment
securities, net, rose ¥982 million, to ¥3,329 million (US$25 million). Gain on the
sale of property, plant and equipment, net, was ¥893 million (US$7 million),
¥5,173 million lower than in the previous year due to the absence of disposals
of significant scale.
Loss on the disposal of property, plant and equipment, net, was ¥10,543
million (US$80 million), up ¥4,123 million from the previous year, reflecting the
Company’s aggressive disposal of facilities to strengthen the competitiveness
of the HD and other businesses.
A write-down of marketable and investment securities of ¥15,780 million
(US$120 million) was recorded during the period, chiefly in connection with the
introduction of financial instrument accounting.
A ¥21,646 million (US$164 million) provision for restructuring expenses was
set aside in the period under review. This move was undertaken to ensure
a stable level of net income for the duration of the 2003–2005 Sprout Project,
a medium-term management plan designed to put the Company on a growth
track. This reserve includes an ¥11,600 million (US$88 million) special sever-
ance reserve that will cover approximately 1,000 employees due to retire in the
first half of 2002 under an early retirement scheme implemented in the latter
half of 2001.
OTHER INCOME (EXPENSES) AND NET INCOME
NET INCOME (LOSS)(Billions of yen)
1997 1998 1999 2000 2001-40
-20
0
20
40
TOTAL ASSETS(Billions of yen)
1997 1998 1999 2000 20010
200
400
600
800
1,000
1,200
Showa Denko K.K. 19
Special severance pay for the year under review declined ¥5,680 million, to
¥3,975 million (US$30 million), as a result of ongoing personnel streamlining in
line with the Cheetah Project. As a result of the aforementioned factors, the net
loss before income taxes was ¥49,796 million (US$377 million). After income
taxes, net, of ¥14,287 million (US$108 million) and minority interest of ¥1,249
million (US$9 million), the Company posted a net loss of ¥34,260 million
(US$260 million), compared with net income in the previous year of ¥2,763 million.
Total Assets
At December 31, 2001, total assets amounted to ¥1,030,872 million
(US$7,810 million), down ¥57,750 million from the previous year-end. Cash
and cash equivalents declined ¥2,978 million, to ¥30,089 million (US$228 mil-
lion), as a result of management’s emphasis on cutting interest-bearing debt.
Notes and accounts receivable fell ¥27,685 million, to ¥165,506 million
(US$1,254 million), at the end of the period, chiefly as a result of decreased
sales. Inventories rose ¥2,016 million, to ¥88,492 million (US$670 million),
reflecting the new consolidation of Showa Highpolymer Co., Ltd.
Net property, plant and equipment fell ¥25,047 million, to ¥574,391 million
(US$4,351 million), mainly as a result of an increase in accumulated depreciation.
Investment securities declined ¥4,004 million, to ¥75,727 million (US$574
million), due to an appraisal loss on investment securities accompanying the
introduction of accounting standards for financial instruments.
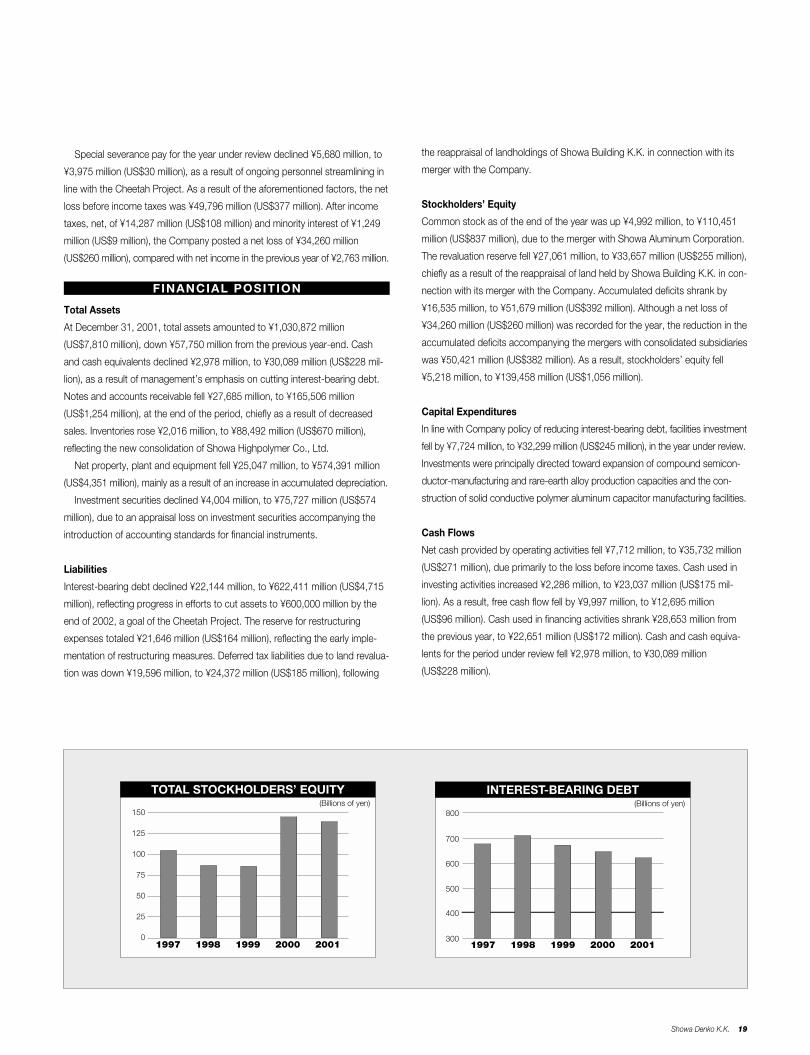
Liabilities
Interest-bearing debt declined ¥22,144 million, to ¥622,411 million (US$4,715
million), reflecting progress in efforts to cut assets to ¥600,000 million by the
end of 2002, a goal of the Cheetah Project. The reserve for restructuring
expenses totaled ¥21,646 million (US$164 million), reflecting the early imple-
mentation of restructuring measures. Deferred tax liabilities due to land revalua-
tion was down ¥19,596 million, to ¥24,372 million (US$185 million), following
FINANCIAL POSITION
the reappraisal of landholdings of Showa Building K.K. in connection with its
merger with the Company.
Stockholders’ Equity
Common stock as of the end of the year was up ¥4,992 million, to ¥110,451
million (US$837 million), due to the merger with Showa Aluminum Corporation.
The revaluation reserve fell ¥27,061 million, to ¥33,657 million (US$255 million),
chiefly as a result of the reappraisal of land held by Showa Building K.K. in con-
nection with its merger with the Company. Accumulated deficits shrank by
¥16,535 million, to ¥51,679 million (US$392 million). Although a net loss of
¥34,260 million (US$260 million) was recorded for the year, the reduction in the
accumulated deficits accompanying the mergers with consolidated subsidiaries
was ¥50,421 million (US$382 million). As a result, stockholders’ equity fell
¥5,218 million, to ¥139,458 million (US$1,056 million).
Capital Expenditures
In line with Company policy of reducing interest-bearing debt, facilities investment
fell by ¥7,724 million, to ¥32,299 million (US$245 million), in the year under review.
Investments were principally directed toward expansion of compound semicon-
ductor-manufacturing and rare-earth alloy production capacities and the con-
struction of solid conductive polymer aluminum capacitor manufacturing facilities.
Cash Flows
Net cash provided by operating activities fell ¥7,712 million, to ¥35,732 million
(US$271 million), due primarily to the loss before income taxes. Cash used in
investing activities increased ¥2,286 million, to ¥23,037 million (US$175 mil-
lion). As a result, free cash flow fell by ¥9,997 million, to ¥12,695 million
(US$96 million). Cash used in financing activities shrank ¥28,653 million from
the previous year, to ¥22,651 million (US$172 million). Cash and cash equiva-
lents for the period under review fell ¥2,978 million, to ¥30,089 million
(US$228 million).
TOTAL STOCKHOLDERS’ EQUITY(Billions of yen)
1997 1998 1999 2000 20010
25
50
75
100
125
150
INTEREST-BEARING DEBT(Billions of yen)
300
400
500
600
700
800
1997 1998 1999 2000 2001
20 Annual Report 2001
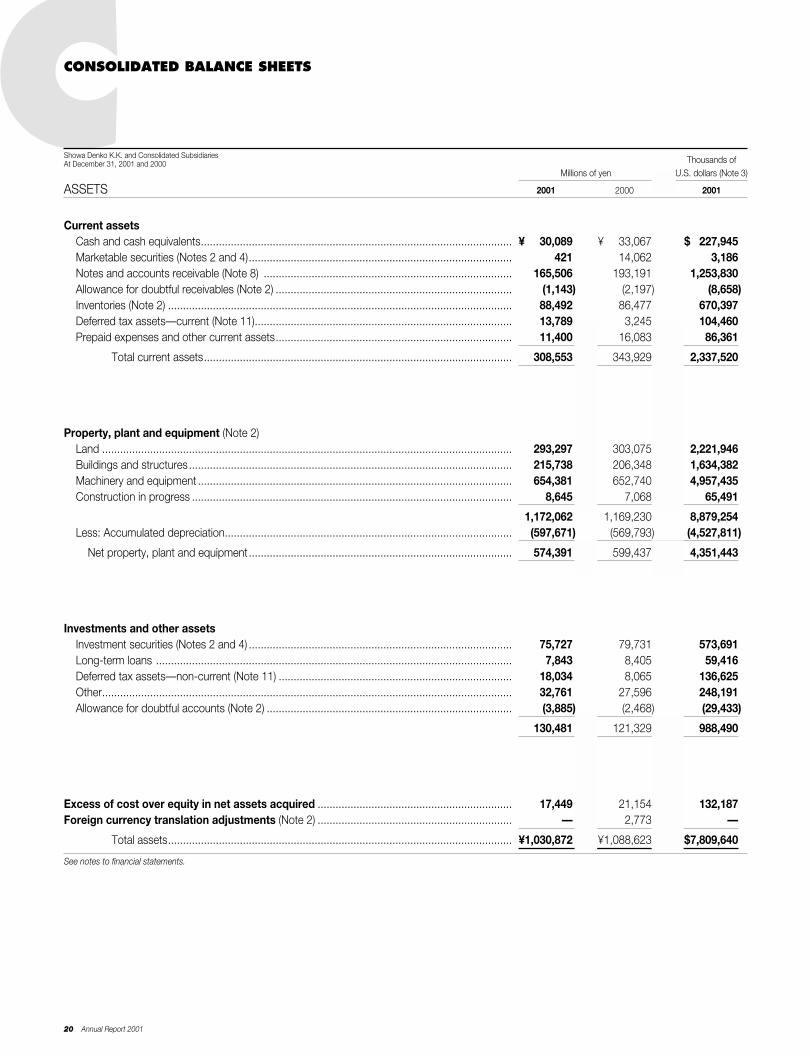
CCONSOLIDATED BALANCE SHEETS
Thousands ofMillions of yen U.S. dollars (Note 3)
ASSETS 2001 2000 2001
Current assetsCash and cash equivalents........................................................................................................ ¥0,030,089 ¥0,033,067 $0,227,945Marketable securities (Notes 2 and 4)........................................................................................ 421 14,062 3,186Notes and accounts receivable (Note 8) ................................................................................... 165,506 193,191 1,253,830Allowance for doubtful receivables (Note 2) ............................................................................... (1,143) (2,197) (8,658)Inventories (Note 2) ................................................................................................................... 88,492 86,477 670,397Deferred tax assets—current (Note 11)...................................................................................... 13,789 3,245 104,460Prepaid expenses and other current assets............................................................................... 11,400 16,083 86,361
Total current assets....................................................................................................... 308,553 343,929 2,337,520
Property, plant and equipment (Note 2)Land ......................................................................................................................................... 293,297 303,075 2,221,946Buildings and structures............................................................................................................ 215,738 206,348 1,634,382Machinery and equipment ......................................................................................................... 654,381 652,740 4,957,435Construction in progress ........................................................................................................... 8,645 7,068 65,491
..................................................................................................................................................... 1,172,062 1,169,230 8,879,254Less: Accumulated depreciation................................................................................................ (597,671) (569,793) (4,527,811)
Net property, plant and equipment........................................................................................ 574,391 599,437 4,351,443
Investments and other assetsInvestment securities (Notes 2 and 4) ........................................................................................ 75,727 79,731 573,691Long-term loans ....................................................................................................................... 7,843 8,405 59,416Deferred tax assets—non-current (Note 11) .............................................................................. 18,034 8,065 136,625Other......................................................................................................................................... 32,761 27,596 248,191Allowance for doubtful accounts (Note 2) .................................................................................. (3,885) (2,468) (29,433)
..................................................................................................................................................... 130,481 121,329 988,490
Excess of cost over equity in net assets acquired ................................................................. 17,449 21,154 132,187Foreign currency translation adjustments (Note 2) ................................................................. — 2,773 —
Total assets................................................................................................................... ¥1,030,872 ¥1,088,623 $7,809,640
See notes to financial statements.
Showa Denko K.K. and Consolidated SubsidiariesAt December 31, 2001 and 2000
Showa Denko K.K. 21
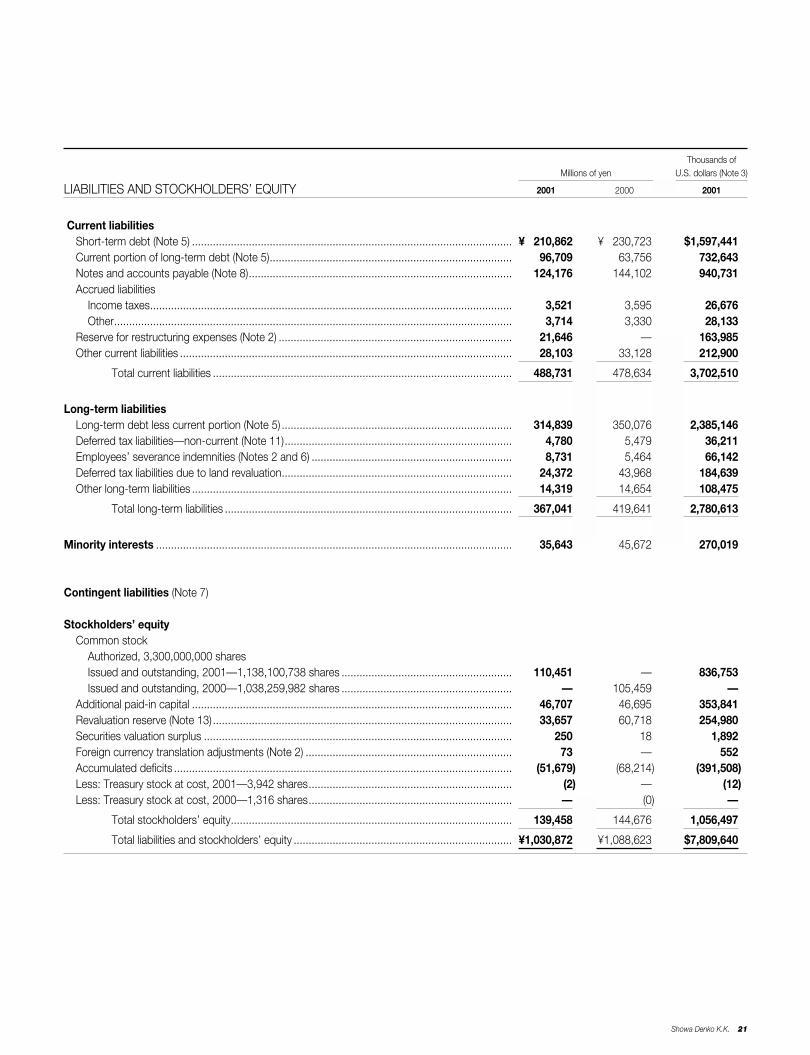
Thousands ofMillions of yen U.S. dollars (Note 3)
LIABILITIES AND STOCKHOLDERS’ EQUITY 2001 2000 2001
Current liabilitiesShort-term debt (Note 5) ........................................................................................................... ¥0,210,862 ¥0,230,723 $1,597,441Current portion of long-term debt (Note 5)................................................................................. 96,709 63,756 732,643Notes and accounts payable (Note 8)........................................................................................ 124,176 144,102 940,731Accrued liabilities
Income taxes......................................................................................................................... 3,521 3,595 26,676Other..................................................................................................................................... 3,714 3,330 28,133
Reserve for restructuring expenses (Note 2) .............................................................................. 21,646 — 163,985Other current liabilities ............................................................................................................... 28,103 33,128 212,900
Total current liabilities .................................................................................................... 488,731 478,634 3,702,510
Long-term liabilitiesLong-term debt less current portion (Note 5) ............................................................................. 314,839 350,076 2,385,146Deferred tax liabilities—non-current (Note 11)............................................................................ 4,780 5,479 36,211Employees’ severance indemnities (Notes 2 and 6) ................................................................... 8,731 5,464 66,142Deferred tax liabilities due to land revaluation............................................................................. 24,372 43,968 184,639Other long-term liabilities ........................................................................................................... 14,319 14,654 108,475
Total long-term liabilities ................................................................................................ 367,041 419,641 2,780,613
Minority interests ....................................................................................................................... 35,643 45,672 270,019
Contingent liabilities (Note 7)
Stockholders’ equityCommon stock
Authorized, 3,300,000,000 sharesIssued and outstanding, 2001—1,138,100,738 shares ......................................................... 110,451 — 836,753Issued and outstanding, 2000—1,038,259,982 shares ......................................................... — 105,459 —
Additional paid-in capital ........................................................................................................... 46,707 46,695 353,841Revaluation reserve (Note 13).................................................................................................... 33,657 60,718 254,980Securities valuation surplus ....................................................................................................... 250 18 1,892Foreign currency translation adjustments (Note 2) ..................................................................... 73 — 552Accumulated deficits ................................................................................................................. (51,679) (68,214) (391,508)Less: Treasury stock at cost, 2001—3,942 shares.................................................................... (2) — (12)Less: Treasury stock at cost, 2000—1,316 shares.................................................................... — (0) —
Total stockholders’ equity.............................................................................................. 139,458 144,676 1,056,497
Total liabilities and stockholders’ equity ......................................................................... ¥1,030,872 ¥1,088,623 $7,809,640
22 Annual Report 2001
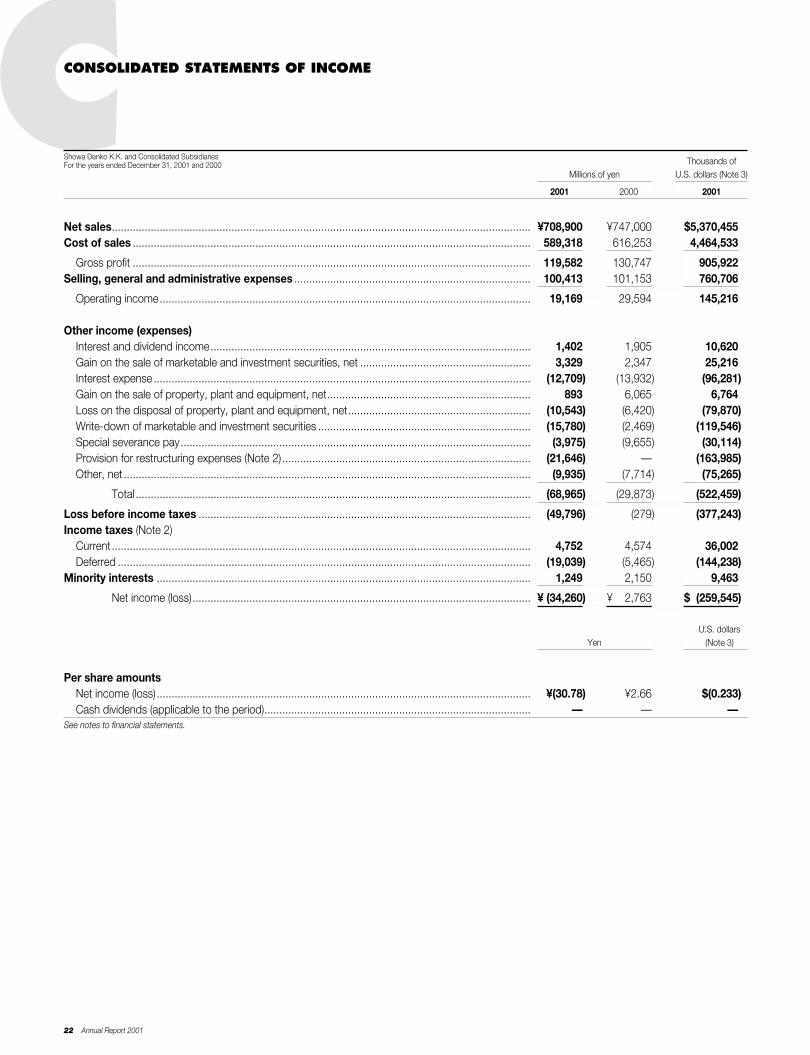
CCONSOLIDATED STATEMENTS OF INCOME
Thousands ofMillions of yen U.S. dollars (Note 3)
2001 2000 2001
Net sales............................................................................................................................................ ¥708,900 ¥747,000 $5,370,455Cost of sales ..................................................................................................................................... 589,318 616,253 4,464,533
Gross profit ..................................................................................................................................... 119,582 130,747 905,922Selling, general and administrative expenses ............................................................................... 100,413 101,153 760,706
Operating income............................................................................................................................ 19,169 29,594 145,216
Other income (expenses)Interest and dividend income........................................................................................................... 1,402 1,905 10,620Gain on the sale of marketable and investment securities, net ......................................................... 3,329 2,347 25,216Interest expense .............................................................................................................................. (12,709) (13,932) (96,281)Gain on the sale of property, plant and equipment, net.................................................................... 893 6,065 6,764Loss on the disposal of property, plant and equipment, net............................................................. (10,543) (6,420) (79,870)Write-down of marketable and investment securities ....................................................................... (15,780) (2,469) (119,546)Special severance pay..................................................................................................................... (3,975) (9,655) (30,114)Provision for restructuring expenses (Note 2) ................................................................................... (21,646) — (163,985)Other, net ........................................................................................................................................ (9,935) (7,714) (75,265)
Total .................................................................................................................................... (68,965) (29,873) (522,459)
Loss before income taxes ............................................................................................................... (49,796) (279) (377,243)Income taxes (Note 2)
Current ............................................................................................................................................ 4,752 4,574 36,002Deferred .......................................................................................................................................... (19,039) (5,465) (144,238)
Minority interests ............................................................................................................................. 1,249 2,150 9,463
Net income (loss)................................................................................................................. ¥ (34,260) ¥002,763 $ (259,545)
U.S. dollarsYen (Note 3)
Per share amountsNet income (loss)............................................................................................................................. ¥(30.78) ¥2.66 $(0.233)Cash dividends (applicable to the period)......................................................................................... — — —
See notes to financial statements.
Showa Denko K.K. and Consolidated SubsidiariesFor the years ended December 31, 2001 and 2000
C
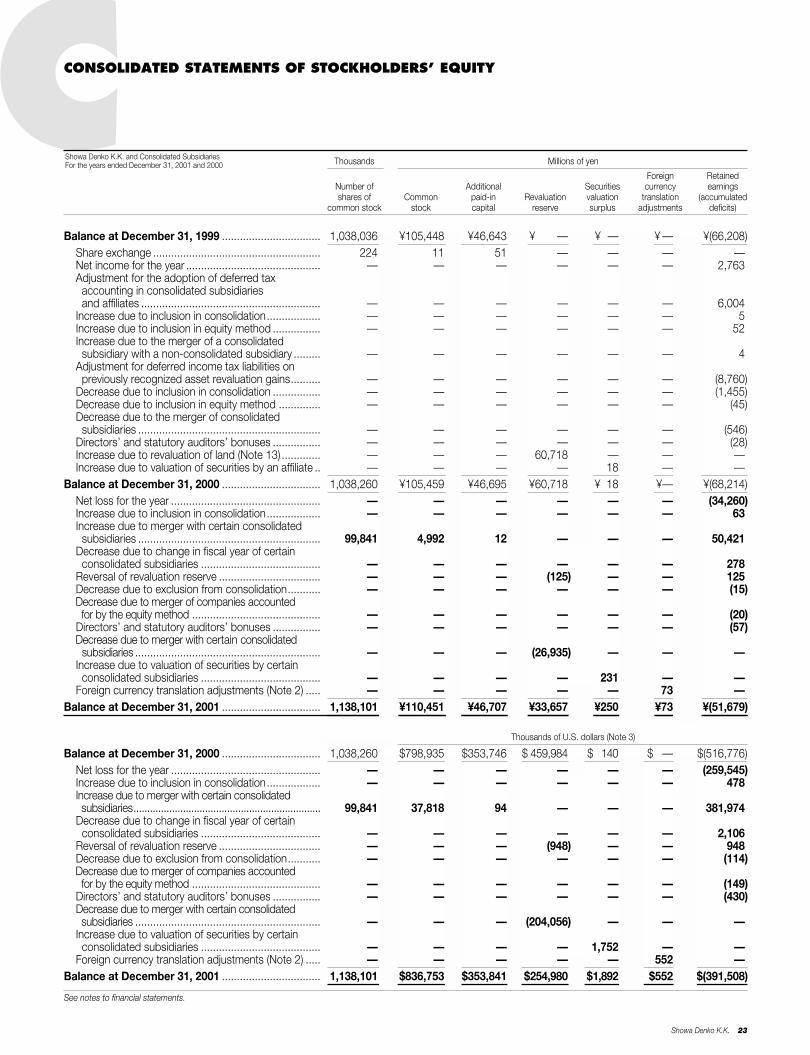
Showa Denko K.K. 23
CCONSOLIDATED STATEMENTS OF STOCKHOLDERS’ EQUITY
Thousands Millions of yen
Foreign RetainedNumber of Additional Securities currency earningsshares of Common paid-in Revaluation valuation translation (accumulated
common stock stock capital reserve surplus adjustments deficits)
Balance at December 31, 1999 ................................. 1,038,036 ¥105,448 ¥46,643 ¥ — ¥0 — ¥ — ¥(66,208)Share exchange ........................................................ 224 11 51 — — — —Net income for the year ............................................. — — — — — — 2,763Adjustment for the adoption of deferred tax accounting in consolidated subsidiaries and affiliates ............................................................ — — — — — — 6,004
Increase due to inclusion in consolidation.................. — — — — — — 5Increase due to inclusion in equity method ................ — — — — — — 52Increase due to the merger of a consolidated subsidiary with a non-consolidated subsidiary ......... — — — — — — 4
Adjustment for deferred income tax liabilities on previously recognized asset revaluation gains.......... — — — — — — (8,760)
Decrease due to inclusion in consolidation ................ — — — — — — (1,455)Decrease due to inclusion in equity method .............. — — — — — — (45)Decrease due to the merger of consolidated subsidiaries ............................................................. — — — — — — (546)
Directors’ and statutory auditors’ bonuses ................ — — — — — — (28)Increase due to revaluation of land (Note 13) ............. — — — 60,718 — — —Increase due to valuation of securities by an affiliate .. — — — — 18 — —
Balance at December 31, 2000 ................................. 1,038,260 ¥105,459 ¥46,695 ¥60,718 ¥018 ¥— ¥(68,214)Net loss for the year .................................................. — — — — — — (34,260)Increase due to inclusion in consolidation.................. — — — — — — 63Increase due to merger with certain consolidated subsidiaries ............................................................. 99,841 4,992 12 — — — 50,421
Decrease due to change in fiscal year of certainconsolidated subsidiaries ........................................ — — — — — — 278
Reversal of revaluation reserve .................................. — — — (125) — — 125Decrease due to exclusion from consolidation........... — — — — — — (15)Decrease due to merger of companies accounted for by the equity method ........................................... — — — — — — (20)
Directors’ and statutory auditors’ bonuses ................ — — — — — — (57)Decrease due to merger with certain consolidated
subsidiaries .............................................................. — — — (26,935) — — —Increase due to valuation of securities by certain consolidated subsidiaries ........................................ — — — — 231 — —
Foreign currency translation adjustments (Note 2) ..... — — — — — 73 —Balance at December 31, 2001 ................................. 1,138,101 ¥110,451 ¥46,707 ¥33,657 ¥250 ¥73 ¥(51,679)
Thousands of U.S. dollars (Note 3)
Balance at December 31, 2000 ................................. 1,038,260 $798,935 $353,746 $ 459,984 $0,140 $ — $(516,776)Net loss for the year .................................................. — — — — — — (259,545)Increase due to inclusion in consolidation.................. — — — — — — 478Increase due to merger with certain consolidated subsidiaries.................................................................... 99,841 37,818 94 — — — 381,974
Decrease due to change in fiscal year of certain consolidated subsidiaries ........................................ — — — — — — 2,106
Reversal of revaluation reserve .................................. — — — (948) — — 948Decrease due to exclusion from consolidation........... — — — — — — (114)Decrease due to merger of companies accounted for by the equity method ........................................... — — — — — — (149)
Directors’ and statutory auditors’ bonuses ................ — — — — — — (430)Decrease due to merger with certain consolidated subsidiaries .............................................................. — — — (204,056) — — —
Increase due to valuation of securities by certain consolidated subsidiaries ........................................ — — — — 1,752 — —
Foreign currency translation adjustments (Note 2) ..... — — — — — 552 —Balance at December 31, 2001 ................................. 1,138,101 $836,753 $353,841 $254,980 $1,892 $552 $(391,508)
See notes to financial statements.
Showa Denko K.K. and Consolidated SubsidiariesFor the years ended December 31, 2001 and 2000
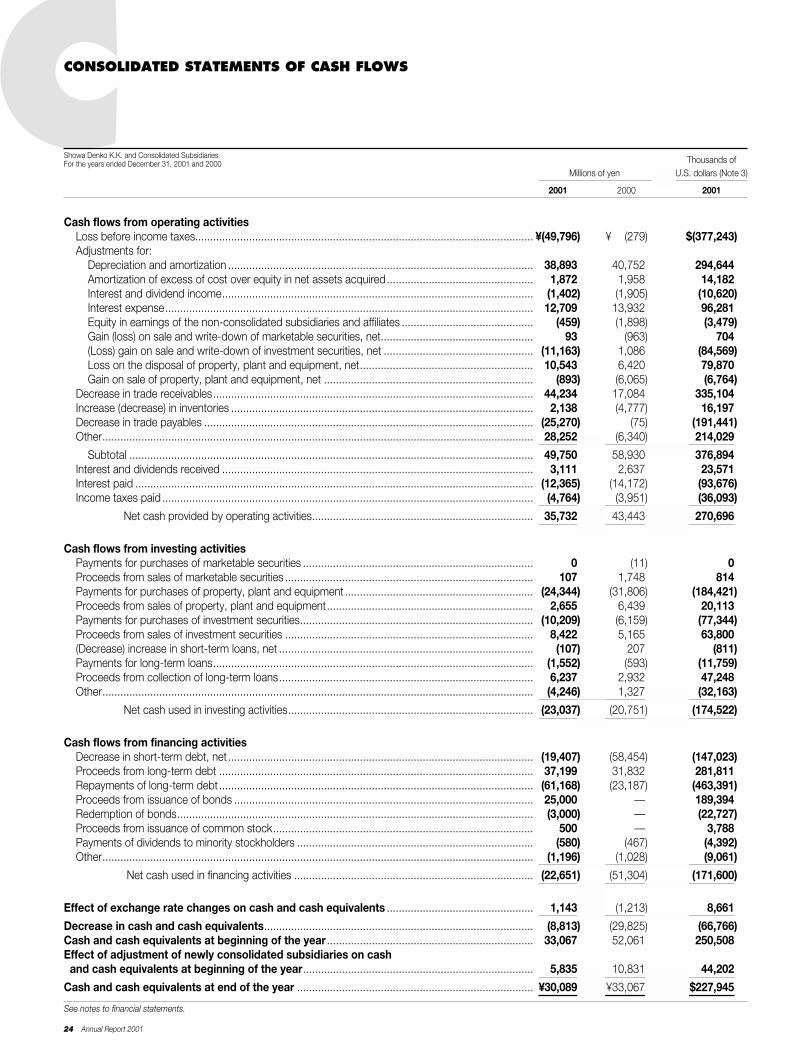
24 Annual Report 2001
CCONSOLIDATED STATEMENTS OF CASH FLOWS NThousands of
Millions of yen U.S. dollars (Note 3)
2001 2000 2001
Cash flows from operating activitiesLoss before income taxes................................................................................................................. ¥(49,796) ¥ (279) $(377,243)Adjustments for:
Depreciation and amortization ...................................................................................................... 38,893 40,752 294,644Amortization of excess of cost over equity in net assets acquired................................................. 1,872 1,958 14,182Interest and dividend income........................................................................................................ (1,402) (1,905) (10,620)Interest expense........................................................................................................................... 12,709 13,932 96,281Equity in earnings of the non-consolidated subsidiaries and affiliates ............................................ (459) (1,898) (3,479)Gain (loss) on sale and write-down of marketable securities, net................................................... 93 (963) 704(Loss) gain on sale and write-down of investment securities, net .................................................. (11,163) 1,086 (84,569)Loss on the disposal of property, plant and equipment, net.......................................................... 10,543 6,420 79,870Gain on sale of property, plant and equipment, net ...................................................................... (893) (6,065) (6,764)
Decrease in trade receivables........................................................................................................... 44,234 17,084 335,104Increase (decrease) in inventories ..................................................................................................... 2,138 (4,777) 16,197Decrease in trade payables .............................................................................................................. (25,270) (75) (191,441)Other................................................................................................................................................ 28,252 (6,340) 214,029
Subtotal ....................................................................................................................................... 49,750 58,930 376,894Interest and dividends received ........................................................................................................ 3,111 2,637 23,571Interest paid ..................................................................................................................................... (12,365) (14,172) (93,676)Income taxes paid ............................................................................................................................ (4,764) (3,951) (36,093)
Net cash provided by operating activities.......................................................................... 35,732 43,443 270,696
Cash flows from investing activitiesPayments for purchases of marketable securities ............................................................................. 0 (11) 0Proceeds from sales of marketable securities ................................................................................... 107 1,748 814Payments for purchases of property, plant and equipment ............................................................... (24,344) (31,806) (184,421)Proceeds from sales of property, plant and equipment..................................................................... 2,655 6,439 20,113Payments for purchases of investment securities.............................................................................. (10,209) (6,159) (77,344)Proceeds from sales of investment securities ................................................................................... 8,422 5,165 63,800(Decrease) increase in short-term loans, net ..................................................................................... (107) 207 (811)Payments for long-term loans........................................................................................................... (1,552) (593) (11,759)Proceeds from collection of long-term loans..................................................................................... 6,237 2,932 47,248Other................................................................................................................................................ (4,246) 1,327 (32,163)
Net cash used in investing activities.................................................................................. (23,037) (20,751) (174,522)
Cash flows from financing activitiesDecrease in short-term debt, net ...................................................................................................... (19,407) (58,454) (147,023)Proceeds from long-term debt ......................................................................................................... 37,199 31,832 281,811Repayments of long-term debt ......................................................................................................... (61,168) (23,187) (463,391)Proceeds from issuance of bonds .................................................................................................... 25,000 — 189,394Redemption of bonds....................................................................................................................... (3,000) — (22,727)Proceeds from issuance of common stock....................................................................................... 500 — 3,788Payments of dividends to minority stockholders ............................................................................... (580) (467) (4,392)Other................................................................................................................................................ (1,196) (1,028) (9,061)
Net cash used in financing activities ................................................................................ (22,651) (51,304) (171,600)
Effect of exchange rate changes on cash and cash equivalents ................................................. 1,143 (1,213) 8,661
Decrease in cash and cash equivalents.......................................................................................... (8,813) (29,825) (66,766)Cash and cash equivalents at beginning of the year ..................................................................... 33,067 52,061 250,508Effect of adjustment of newly consolidated subsidiaries on cash and cash equivalents at beginning of the year............................................................................. 5,835 10,831 44,202
Cash and cash equivalents at end of the year ............................................................................... ¥30,089 ¥33,067 $227,945
See notes to financial statements.
Showa Denko K.K. and Consolidated SubsidiariesFor the years ended December 31, 2001 and 2000
Showa Denko K.K. 25
NNOTES TO FINANCIAL STATEMENTS
Showa Denko K.K. and Consolidated Subsidiaries
1. BASIS OF REPORTING FINANCIAL STATEMENTSThe accompanying consolidated financial statements have been pre-pared in accordance with accounting principles and practices general-ly accepted in Japan and from the consolidated financial statementsfiled with the Director of the Kanto Local Finance Bureau as requiredby the Securities and Exchange Law of Japan.
Certain items have been reclassified for the convenience of readerswho are not familiar with Japanese financial reporting practices.
Where appropriate, certain prior-year balances have been reclassi-fied to conform to the year 2001 presentation.
2. SUMMARY OF SIGNIFICANT ACCOUNTING POLICIES(a) Principles of ConsolidationThe consolidated financial statements include the accounts of the Com-pany and its 49 significant subsidiaries (collectively, “the Companies”)for the year ended December 31, 2001 and 58 significant subsidiariesfor the year ended December 31, 2000.
For the purposes of the consolidated financial statements, all signifi-cant intercompany transactions, account balances and unrealizedprofits among the Companies are entirely eliminated and the portionsattributable to minority interests are credited or charged to income.
Accounts of subsidiaries whose business year-ends differ by morethan three months from December 31 have been included usingappropriate interim financial information.
The excess of cost over equity in net assets is amortized on astraight-line basis within a period of 20 years.
(b) Investments in Non-Consolidated Subsidiaries and AffiliatesThe Company applies the equity method of accounting for investmentsin six non-consolidated subsidiaries and 31 affiliates for the yearended December 31, 2001 and investments in five non-consolidatedsubsidiaries and 26 affiliates for the year ended December 31, 2000.
All underlying intercompany profits obtained from transactionsamong the Companies and non-consolidated subsidiaries and affili-ates to which the equity method is applied are eliminated in theconsolidated financial statements.
The unamortized balance of the difference between the cost ofinvestments and the underlying net equity of investments acquiredamounted to ¥20 million (US$152 thousand) (debit) at December 31,2001, and amortization charged to income for the year endedDecember 31, 2001, totaled ¥34 million (US$258 thousand).
(c) Translation of Foreign Currency AccountsUnder the new Japanese Accounting Standards for Foreign CurrencyTranslation, which have been effective for fiscal years beginning on orafter April 1, 2000, all receivables and payables denominated in for-eign currencies at the balance sheet date are translated into Japaneseyen at the curent exchange rates. The resulting exchange gains orlosses are charged to income.
The monetary amounts stated in the financial statements of a certainconsolidated subsidiary of foreign nationality are translated into Japaneseyen at the year-end rate for assets and liabilities, at historical rates forother balance sheet accounts exclusive of net income and at the aver-age annual rate for revenue and expense accounts and net income.
Under the new Japanese Accounting Standards for ForeignCurrency Translation, which have been effective for fiscal years begin-ning on or after April 1, 2000, translation adjustments resulting from theprocess of translating the financial statements of foreign subsidiaries
into Japanese yen are accumulated and reported as a component ofstockholders’ equity in the consolidated balance sheet. Until December31, 2000, the foreign currency translation adjustments are accumulat-ed and reported as an asset in the consolidated balance sheet.
(d) Income TaxesPeriodical allocation of corporate tax is being made, in principle,regarding taxes pertaining to all temporary differences (differencesbetween the assets/liabilities on the consolidated financial statementsand the assets/liabilities in the calculation of taxable income).
(e) Allowance for Doubtful ReceivablesTo provide for losses from bad debts, the allowance is providedaccording to the actual rate of non-recovery for ordinary claims, andin view of the probability of recovery for specific doubtful receivables.
(f) Reserve for Restructuring ExpensesThe Company and certain consolidated subsidiaries record a reservefor restructuring expenses on an accrual basis to provide for expens-es and losses resulting from their restructuring programs.
(g) SecuritiesSecurities to be owned until the due date are stated at cost as deter-mined by the amortization cost method.
Other securities having current prices are stated at cost as deter-mined mainly by the moving-average method and those without currentprices, by either the moving-average method or the acquisitioncost method.
Under the Japanese Accounting Standards for Financial Instruments,which have been effective for fiscal years beginning on or after April1, 2000, securities are classified into one of the following categoriesbased on the purpose of holding, resulting in the different measure-ment and accounting for the changes in fair value. Debt securities thatare intended to be held to maturity (“held-to-maturity debt securities”)are measured at amortized cost in the balance sheet. Securitiesother than held-to-maturity debt securities and equity investment insubsidiaries and affiliates (“other securities”) are stated at cost exceptfor certain consolidated subsidiaries. Securities that have no marketprices are stated at their historical cost.
Other securities with fair value, whose balance sheet amount was¥29,505 million (US$223,523 thousand) as of the end of the year,had a fair value of ¥34,568 million (US$261,879 thousand), and cor-responding securities valuation surplus, deferred tax liabilities andminority interests would have been ¥2,615 million (US$19,811 thou-sand), ¥2,351 million (US$17,811 thousand) and ¥97 million (US$735thousand), respectively.
(h) InventoriesInventories are stated mainly at cost as determined by the gross-average method. Part of the inventories owned by certain sub-sidiaries is stated at cost as determined by the specific-cost methodor by the final purchasing price method.
(i) Property, Plant and EquipmentProperty, plant and equipment is stated at cost. Depreciation of prop-erty, plant and equipment is computed principally by the straight-linemethod with the exception that the declining-balance method is appliedto certain factories of the Company and certain consolidated subsidiaries.
( j ) LeasesFinance leases other than those that are deemed to transfer the own-ership of the leased assets to the lessees are principally accounted forby the method that is applicable to ordinary operating leases.
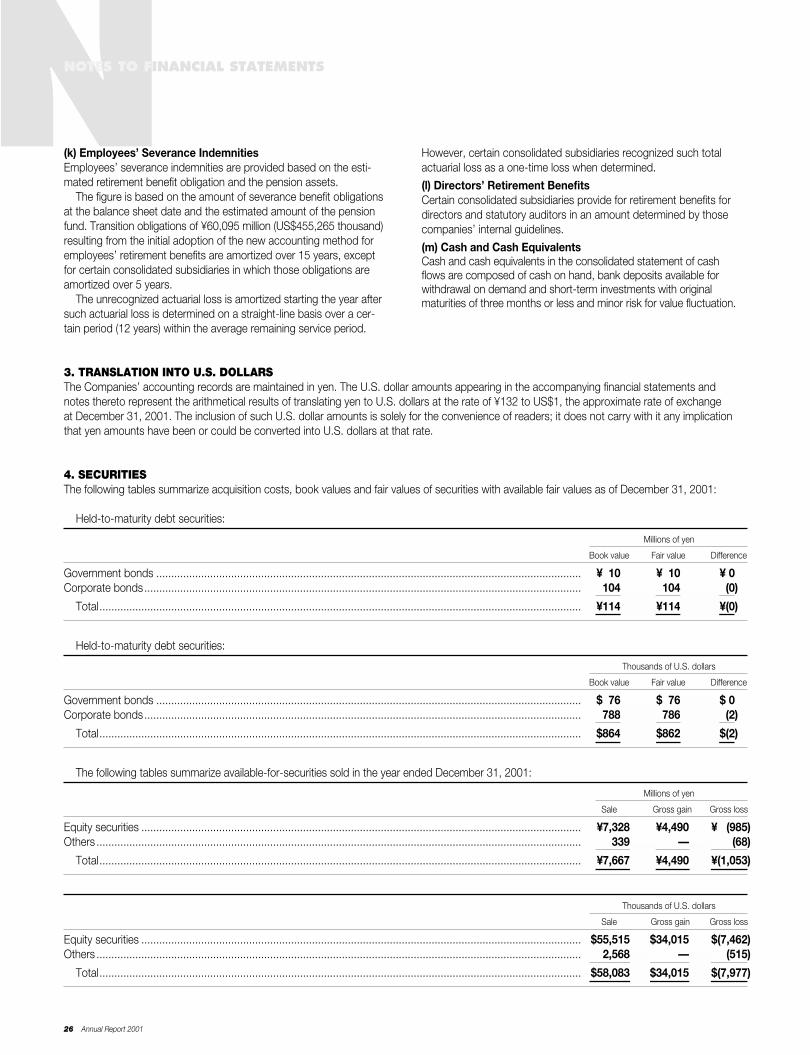
26 Annual Report 2001
NNOTES TO FINANCIAL STATEMENTS
3. TRANSLATION INTO U.S. DOLLARSThe Companies’ accounting records are maintained in yen. The U.S. dollar amounts appearing in the accompanying financial statements andnotes thereto represent the arithmetical results of translating yen to U.S. dollars at the rate of ¥132 to US$1, the approximate rate of exchangeat December 31, 2001. The inclusion of such U.S. dollar amounts is solely for the convenience of readers; it does not carry with it any implicationthat yen amounts have been or could be converted into U.S. dollars at that rate.
4. SECURITIESThe following tables summarize acquisition costs, book values and fair values of securities with available fair values as of December 31, 2001:
Held-to-maturity debt securities:
Millions of yen
Book value Fair value Difference
Government bonds .............................................................................................................................................. ¥010 ¥010 ¥(0Corporate bonds.................................................................................................................................................. 104 104 (0)
Total................................................................................................................................................................. ¥114 ¥114 ¥(0)
Held-to-maturity debt securities:
Thousands of U.S. dollars
Book value Fair value Difference
Government bonds .............................................................................................................................................. $076 $076 $(0Corporate bonds.................................................................................................................................................. 788 786 (2)
Total................................................................................................................................................................. $864 $862 $(2)
The following tables summarize available-for-securities sold in the year ended December 31, 2001:
Millions of yen
Sale Gross gain Gross loss
Equity securities ................................................................................................................................................... ¥7,328 ¥4,490 ¥0,(985)Others .................................................................................................................................................................. 339 — (68)
Total................................................................................................................................................................. ¥7,667 ¥4,490 ¥(1,053)
Thousands of U.S. dollars
Sale Gross gain Gross loss
Equity securities ................................................................................................................................................... $55,515 $34,015 $(7,462)Others .................................................................................................................................................................. 2,568 — (515)
Total................................................................................................................................................................. $58,083 $34,015 $(7,977)
(k) Employees’ Severance IndemnitiesEmployees’ severance indemnities are provided based on the esti-mated retirement benefit obligation and the pension assets.
The figure is based on the amount of severance benefit obligationsat the balance sheet date and the estimated amount of the pensionfund. Transition obligations of ¥60,095 million (US$455,265 thousand)resulting from the initial adoption of the new accounting method foremployees’ retirement benefits are amortized over 15 years, exceptfor certain consolidated subsidiaries in which those obligations areamortized over 5 years.
The unrecognized actuarial loss is amortized starting the year aftersuch actuarial loss is determined on a straight-line basis over a cer-tain period (12 years) within the average remaining service period.
However, certain consolidated subsidiaries recognized such totalactuarial loss as a one-time loss when determined.
(l) Directors’ Retirement BenefitsCertain consolidated subsidiaries provide for retirement benefits fordirectors and statutory auditors in an amount determined by thosecompanies’ internal guidelines.
(m) Cash and Cash EquivalentsCash and cash equivalents in the consolidated statement of cashflows are composed of cash on hand, bank deposits available forwithdrawal on demand and short-term investments with originalmaturities of three months or less and minor risk for value fluctuation.
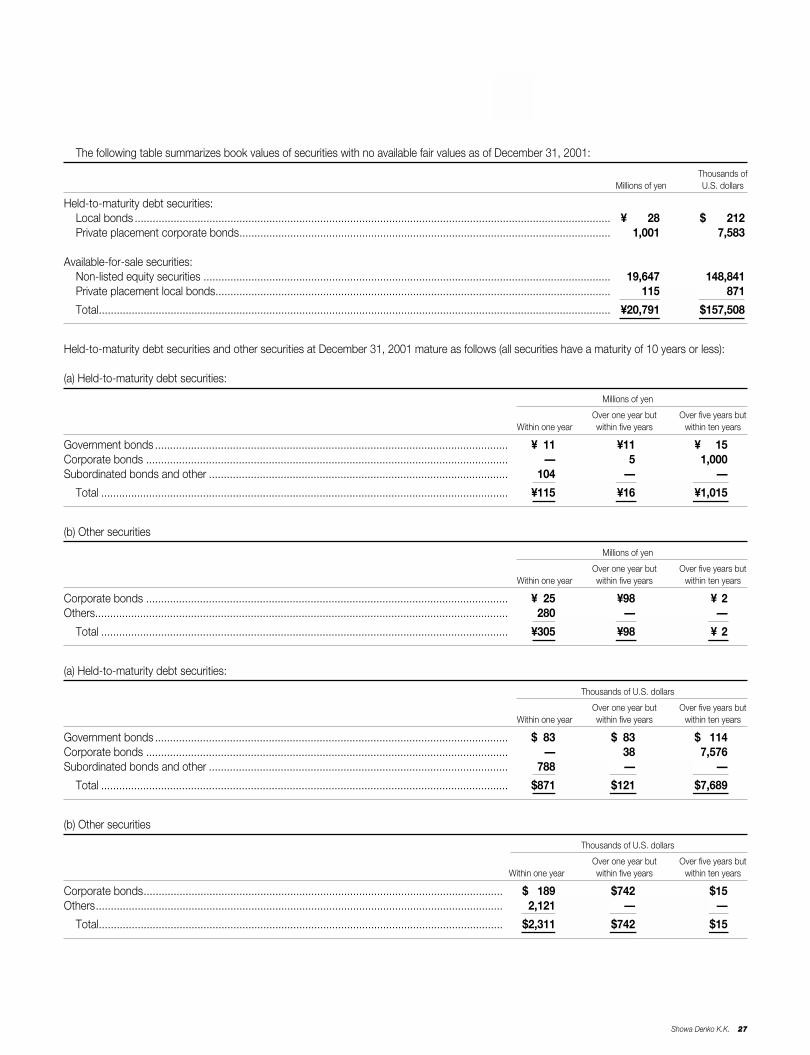
Showa Denko K.K. 27
The following table summarizes book values of securities with no available fair values as of December 31, 2001:
Thousands ofMillions of yen U.S. dollars
Held-to-maturity debt securities:Local bonds ............................................................................................................................................................... ¥ 28 $ 212Private placement corporate bonds............................................................................................................................ 1,001 7,583
Available-for-sale securities:Non-listed equity securities ........................................................................................................................................ 19,647 148,841Private placement local bonds.................................................................................................................................... 115 871
Total........................................................................................................................................................................... ¥20,791 $157,508
Held-to-maturity debt securities and other securities at December 31, 2001 mature as follows (all securities have a maturity of 10 years or less):
(a) Held-to-maturity debt securities:
Millions of yen
Over one year but Over five years butWithin one year within five years within ten years
Government bonds ...................................................................................................................... ¥011 ¥11 ¥0,015Corporate bonds ......................................................................................................................... — 5 1,000Subordinated bonds and other .................................................................................................... 104 — —
Total ........................................................................................................................................ ¥115 ¥16 ¥1,015
(b) Other securities
Millions of yen
Over one year but Over five years butWithin one year within five years within ten years
Corporate bonds ......................................................................................................................... ¥025 ¥98 ¥ 2Others.......................................................................................................................................... 280 — —
Total ........................................................................................................................................ ¥305 ¥98 ¥ 2
(a) Held-to-maturity debt securities:
Thousands of U.S. dollars
Over one year but Over five years butWithin one year within five years within ten years
Government bonds ...................................................................................................................... $083 $083 $0,114Corporate bonds ......................................................................................................................... — 38 7,576Subordinated bonds and other .................................................................................................... 788 — —
Total ........................................................................................................................................ $871 $121 $7,689
(b) Other securities
Thousands of U.S. dollars
Over one year but Over five years butWithin one year within five years within ten years
Corporate bonds........................................................................................................................ $0,189 $742 $15Others........................................................................................................................................ 2,121 — —
Total....................................................................................................................................... $2,311 $742 $15

5. SHORT-TERM DEBT AND LONG-TERM DEBTAt December 31, 2001 and 2000, short-term debt of the Companies consisted of the following:
Thousands ofMillions of yen U.S. dollars
2001 2000 2001
Bank loans, interest 0.483%–7.75%.......................................................................................................... ¥208,862 ¥228,223 $1,582,290Commercial paper..................................................................................................................................... 2,000 2,500 15,152
Total...................................................................................................................................................... ¥210,862 ¥230,723 $1,597,441
At December 31, 2001 and 2000, long-term debt of the Companies consisted of the following:
Thousands ofMillions of yen U.S. dollars
2001 2000 2001
2.19% bonds due 2001 ............................................................................................................................ ¥ — ¥003,000 $ —2.27% bonds due 2002 ............................................................................................................................ 5,000 5,000 37,8792.3% bonds due 2005 .............................................................................................................................. 3,500 3,500 26,515TIBOR+0.55% bonds due 2005 ................................................................................................................ 10,000 — 75,758TIBOR+0.55% bonds due 2006 ................................................................................................................ 15,000 — 113,6361.9% bonds due 2007 .............................................................................................................................. 8,500 8,500 64,3941.7% convertible bonds due 2002, convertible currently at ¥1,058............................................................ 10,000 10,000 75,7581.7% convertible bonds due 2005, convertible currently at ¥1,058............................................................ 28,955 28,955 219,3560.7% convertible bonds due 2006, convertible currently at ¥720............................................................... 1,485 — 11,2500.525%–8.0% loans, principally from banks and insurance companies, due 2002 to 2035 ....................... 329,108 354,877 2,493,244
................................................................................................................................................................ 411,548 413,832 3,117,790Less: Current portion................................................................................................................................. (96,709) (63,756) (732,643)
................................................................................................................................................................. ¥314,839 ¥350,076 $2,385,146
At December 31, 2001, the following assets were pledged as collateral for short-term debt and long-term debt:
Thousands ofMillions of yen U.S. dollars
Investment securities .................................................................................................................................................... ¥002,253 $0,017,068Property, plant and equipment, less accumulated depreciation .................................................................................... 278,796 2,112,091
.................................................................................................................................................................................... ¥281,049 $2,129,159
The aggregate annual maturities of the non-current portion of long-term debt are as follows:Years ending December 31 Thousands of
Millions of yen U.S. dollars
2003 ............................................................................................................................................................................ ¥153,385 $1,162,0082004 ............................................................................................................................................................................ 42,773 324,0372005 ............................................................................................................................................................................ 27,348 207,1842006 ............................................................................................................................................................................ 19,623 148,6602007 and thereafter...................................................................................................................................................... 4,270 32,349
.................................................................................................................................................................................... ¥247,399 $1,874,237
28 Annual Report 2001
NNOTES TO FINANCIAL STATEMENTS
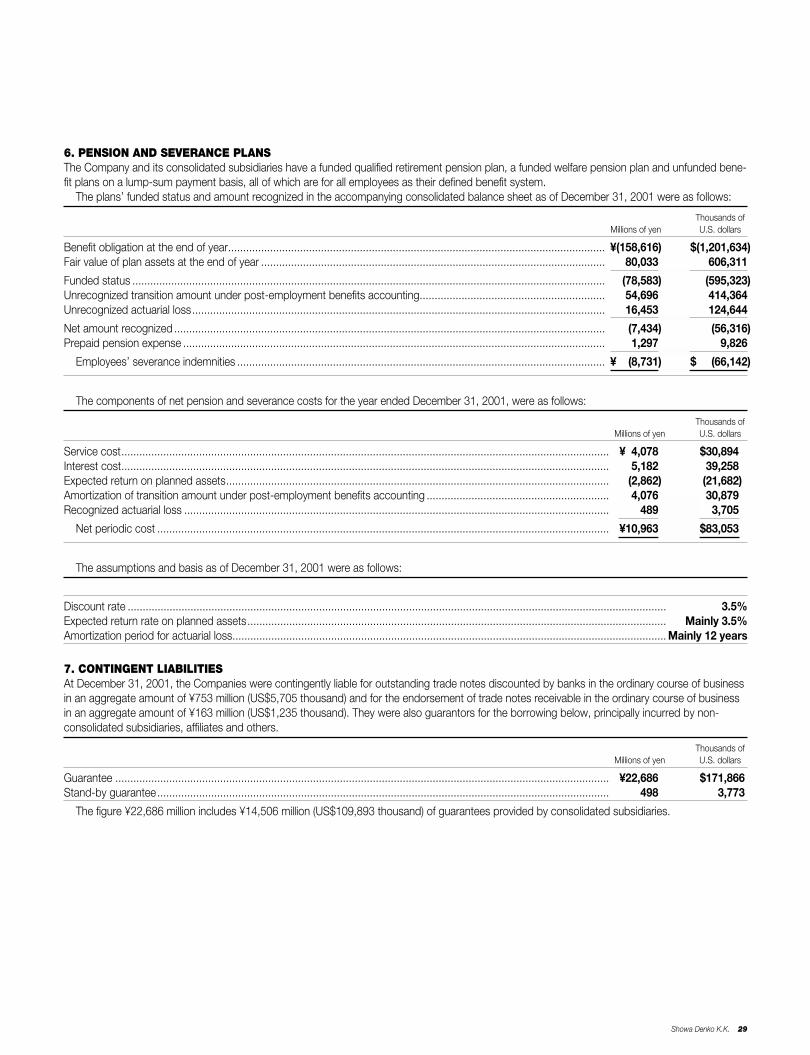
Showa Denko K.K. 29
6. PENSION AND SEVERANCE PLANSThe Company and its consolidated subsidiaries have a funded qualified retirement pension plan, a funded welfare pension plan and unfunded bene-fit plans on a lump-sum payment basis, all of which are for all employees as their defined benefit system.
The plans’ funded status and amount recognized in the accompanying consolidated balance sheet as of December 31, 2001 were as follows:
Thousands ofMillions of yen U.S. dollars
Benefit obligation at the end of year.............................................................................................................................. ¥(158,616) $(1,201,634)Fair value of plan assets at the end of year ................................................................................................................... 80,033 606,311
Funded status .............................................................................................................................................................. (78,583) (595,323)Unrecognized transition amount under post-employment benefits accounting.............................................................. 54,696 414,364Unrecognized actuarial loss.......................................................................................................................................... 16,453 124,644
Net amount recognized ................................................................................................................................................ (7,434) (56,316)Prepaid pension expense ............................................................................................................................................. 1,297 9,826
Employees’ severance indemnities ........................................................................................................................... ¥00(8,731) $0,0(66,142)
The components of net pension and severance costs for the year ended December 31, 2001, were as follows:Year ended December 31, 2001 Thousands of
Millions of yen U.S. dollars
Service cost................................................................................................................................................................... ¥04,078 $30,894Interest cost................................................................................................................................................................... 5,182 39,258Expected return on planned assets................................................................................................................................ (2,862) (21,682)Amortization of transition amount under post-employment benefits accounting ............................................................. 4,076 30,879Recognized actuarial loss .............................................................................................................................................. 489 3,705
Net periodic cost ....................................................................................................................................................... ¥10,963 $83,053
The assumptions and basis as of December 31, 2001 were as follows:Year ended December 31, 2001
Discount rate .................................................................................................................................................................................... 3.5%Expected return rate on planned assets............................................................................................................................................ Mainly 3.5%Amortization period for actuarial loss................................................................................................................................................. Mainly 12 years
7. CONTINGENT LIABILITIESAt December 31, 2001, the Companies were contingently liable for outstanding trade notes discounted by banks in the ordinary course of businessin an aggregate amount of ¥753 million (US$5,705 thousand) and for the endorsement of trade notes receivable in the ordinary course of businessin an aggregate amount of ¥163 million (US$1,235 thousand). They were also guarantors for the borrowing below, principally incurred by non-consolidated subsidiaries, affiliates and others.
Thousands ofMillions of yen U.S. dollars
Guarantee ..................................................................................................................................................................... ¥22,686 $171,866Stand-by guarantee....................................................................................................................................................... 498 3,773
The figure ¥22,686 million includes ¥14,506 million (US$109,893 thousand) of guarantees provided by consolidated subsidiaries.
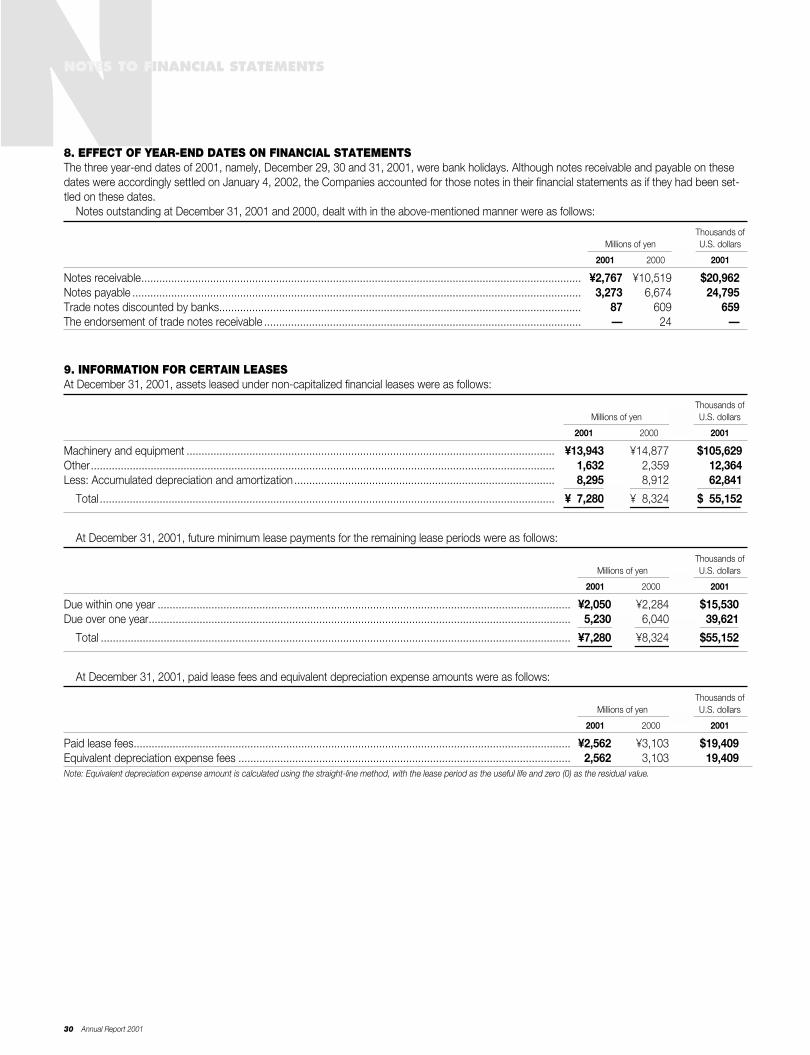
30 Annual Report 2001
8. EFFECT OF YEAR-END DATES ON FINANCIAL STATEMENTSThe three year-end dates of 2001, namely, December 29, 30 and 31, 2001, were bank holidays. Although notes receivable and payable on thesedates were accordingly settled on January 4, 2002, the Companies accounted for those notes in their financial statements as if they had been set-tled on these dates.
Notes outstanding at December 31, 2001 and 2000, dealt with in the above-mentioned manner were as follows:
Thousands ofMillions of yen U.S. dollars
2001 2000 2001
Notes receivable................................................................................................................................................... ¥2,767 ¥10,519 $20,962Notes payable ...................................................................................................................................................... 3,273 6,674 24,795Trade notes discounted by banks......................................................................................................................... 87 609 659The endorsement of trade notes receivable .......................................................................................................... — 24 —
9. INFORMATION FOR CERTAIN LEASESAt December 31, 2001, assets leased under non-capitalized financial leases were as follows:
Thousands ofMillions of yen U.S. dollars
2001 2000 2001
Machinery and equipment ........................................................................................................................... ¥13,943 ¥14,877 $105,629Other........................................................................................................................................................... 1,632 2,359 12,364Less: Accumulated depreciation and amortization ....................................................................................... 8,295 8,912 62,841
Total ........................................................................................................................................................ ¥07,280 ¥08,324 $055,152
At December 31, 2001, future minimum lease payments for the remaining lease periods were as follows:
Thousands ofMillions of yen U.S. dollars
2001 2000 2001
Due within one year .......................................................................................................................................... ¥2,050 ¥2,284 $15,530Due over one year............................................................................................................................................. 5,230 6,040 39,621
Total ............................................................................................................................................................. ¥7,280 ¥8,324 $55,152
At December 31, 2001, paid lease fees and equivalent depreciation expense amounts were as follows:
Thousands ofMillions of yen U.S. dollars
2001 2000 2001
Paid lease fees.................................................................................................................................................. ¥2,562 ¥3,103 $19,409Equivalent depreciation expense fees ............................................................................................................... 2,562 3,103 19,409Note: Equivalent depreciation expense amount is calculated using the straight-line method, with the lease period as the useful life and zero (0) as the residual value.
NNOTES TO FINANCIAL STATEMENTS
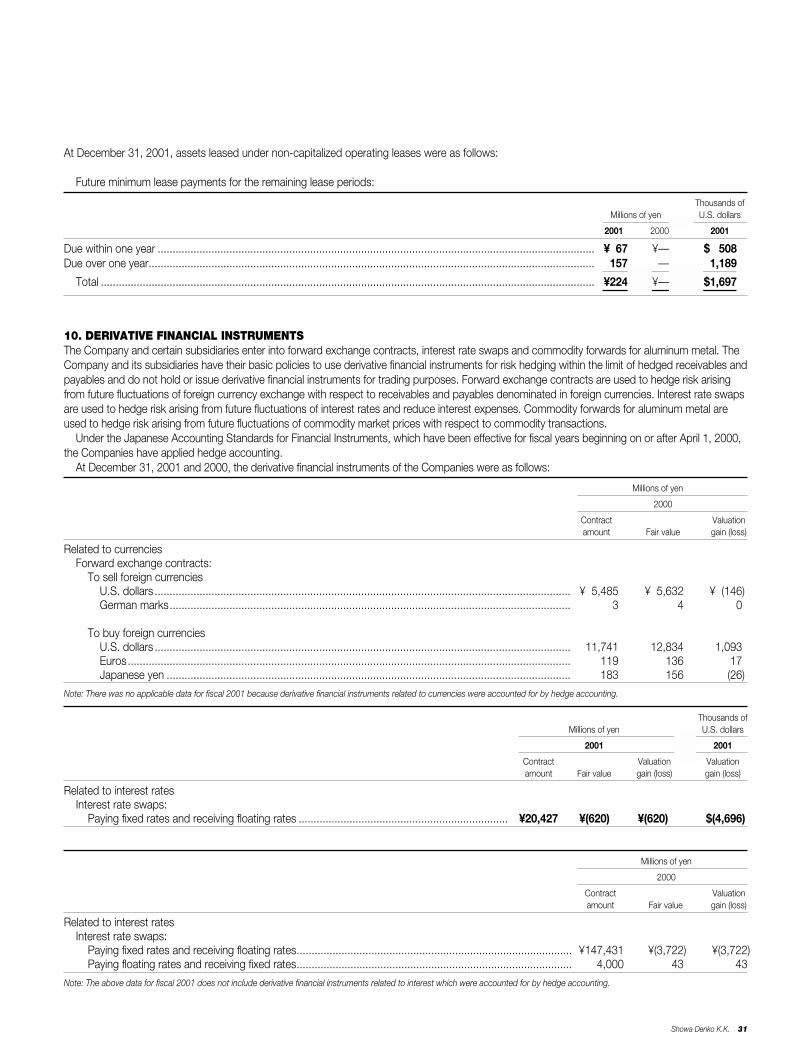
Showa Denko K.K. 31
At December 31, 2001, assets leased under non-capitalized operating leases were as follows:
Future minimum lease payments for the remaining lease periods:
Thousands ofMillions of yen U.S. dollars
2001 2000 2001
Due within one year .................................................................................................................................................. ¥067 ¥— $0,508Due over one year..................................................................................................................................................... 157 — 1,189
Total ..................................................................................................................................................................... ¥224 ¥— $1,697
10. DERIVATIVE FINANCIAL INSTRUMENTSThe Company and certain subsidiaries enter into forward exchange contracts, interest rate swaps and commodity forwards for aluminum metal. TheCompany and its subsidiaries have their basic policies to use derivative financial instruments for risk hedging within the limit of hedged receivables andpayables and do not hold or issue derivative financial instruments for trading purposes. Forward exchange contracts are used to hedge risk arisingfrom future fluctuations of foreign currency exchange with respect to receivables and payables denominated in foreign currencies. Interest rate swapsare used to hedge risk arising from future fluctuations of interest rates and reduce interest expenses. Commodity forwards for aluminum metal areused to hedge risk arising from future fluctuations of commodity market prices with respect to commodity transactions.
Under the Japanese Accounting Standards for Financial Instruments, which have been effective for fiscal years beginning on or after April 1, 2000,the Companies have applied hedge accounting.
At December 31, 2001 and 2000, the derivative financial instruments of the Companies were as follows:
Millions of yen
2000
Contract Valuationamount Fair value gain (loss)
Related to currenciesForward exchange contracts:
To sell foreign currenciesU.S. dollars ........................................................................................................................................... ¥05,485 ¥05,632 ¥ (146)German marks...................................................................................................................................... 3 4 0
To buy foreign currenciesU.S. dollars ........................................................................................................................................... 11,741 12,834 1,093Euros.................................................................................................................................................... 119 136 17Japanese yen ....................................................................................................................................... 183 156 (26)
Note: There was no applicable data for fiscal 2001 because derivative financial instruments related to currencies were accounted for by hedge accounting.
Thousands ofMillions of yen U.S. dollars
2001 2001
Contract Valuation Valuationamount Fair value gain (loss) gain (loss)
Related to interest ratesInterest rate swaps:
Paying fixed rates and receiving floating rates ...................................................................... ¥20,427 ¥(620) ¥(620) $(4,696)
Millions of yen
2000
Contract Valuationamount Fair value gain (loss)
Related to interest ratesInterest rate swaps:
Paying fixed rates and receiving floating rates............................................................................................ ¥147,431 ¥(3,722) ¥(3,722)Paying floating rates and receiving fixed rates............................................................................................ 4,000 43 43
Note: The above data for fiscal 2001 does not include derivative financial instruments related to interest which were accounted for by hedge accounting.
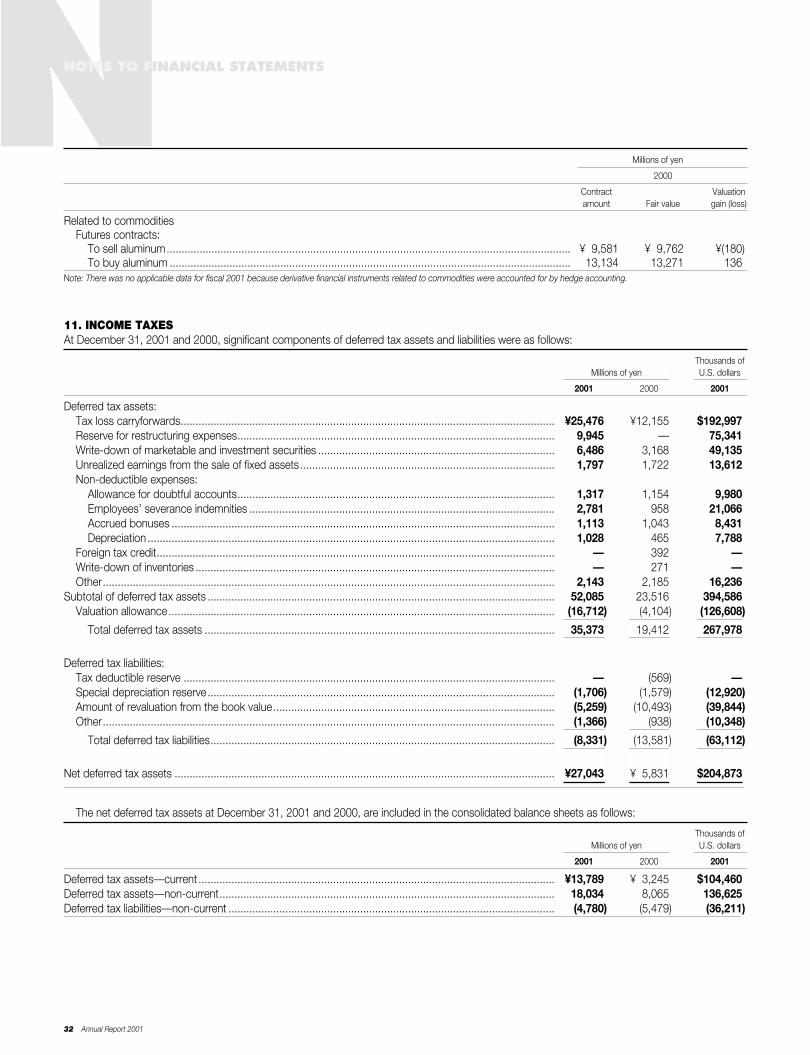
32 Annual Report 2001
Millions of yen
2000
Contract Valuationamount Fair value gain (loss)
Related to commoditiesFutures contracts:
To sell aluminum....................................................................................................................................... ¥09,581 ¥09,762 ¥(180)To buy aluminum ...................................................................................................................................... 13,134 13,271 136
Note: There was no applicable data for fiscal 2001 because derivative financial instruments related to commodities were accounted for by hedge accounting.
11. INCOME TAXESAt December 31, 2001 and 2000, significant components of deferred tax assets and liabilities were as follows:
Thousands ofMillions of yen U.S. dollars
2001 2000 2001
Deferred tax assets:Tax loss carryforwards............................................................................................................................. ¥25,476 ¥12,155 $192,997Reserve for restructuring expenses.......................................................................................................... 9,945 — 75,341Write-down of marketable and investment securities ............................................................................... 6,486 3,168 49,135Unrealized earnings from the sale of fixed assets ..................................................................................... 1,797 1,722 13,612Non-deductible expenses:
Allowance for doubtful accounts.......................................................................................................... 1,317 1,154 9,980Employees’ severance indemnities ...................................................................................................... 2,781 958 21,066Accrued bonuses ................................................................................................................................ 1,113 1,043 8,431Depreciation ........................................................................................................................................ 1,028 465 7,788
Foreign tax credit..................................................................................................................................... — 392 —Write-down of inventories ........................................................................................................................ — 271 —Other....................................................................................................................................................... 2,143 2,185 16,236
Subtotal of deferred tax assets .................................................................................................................... 52,085 23,516 394,586Valuation allowance ................................................................................................................................. (16,712) (4,104) (126,608)
Total deferred tax assets ..................................................................................................................... 35,373 19,412 267,978
Deferred tax liabilities:Tax deductible reserve ............................................................................................................................ — (569) —Special depreciation reserve.................................................................................................................... (1,706) (1,579) (12,920)Amount of revaluation from the book value.............................................................................................. (5,259) (10,493) (39,844)Other....................................................................................................................................................... (1,366) (938) (10,348)
Total deferred tax liabilities................................................................................................................... (8,331) (13,581) (63,112)
Net deferred tax assets ............................................................................................................................... ¥27,043 ¥05,831 $204,873
The net deferred tax assets at December 31, 2001 and 2000, are included in the consolidated balance sheets as follows:
Thousands ofMillions of yen U.S. dollars
2001 2000 2001
Deferred tax assets—current ....................................................................................................................... ¥13,789 ¥ 3,245 $104,460Deferred tax assets—non-current................................................................................................................ 18,034 8,065 136,625Deferred tax liabilities—non-current ............................................................................................................. (4,780) (5,479) (36,211)
NNOTES TO FINANCIAL STATEMENTS
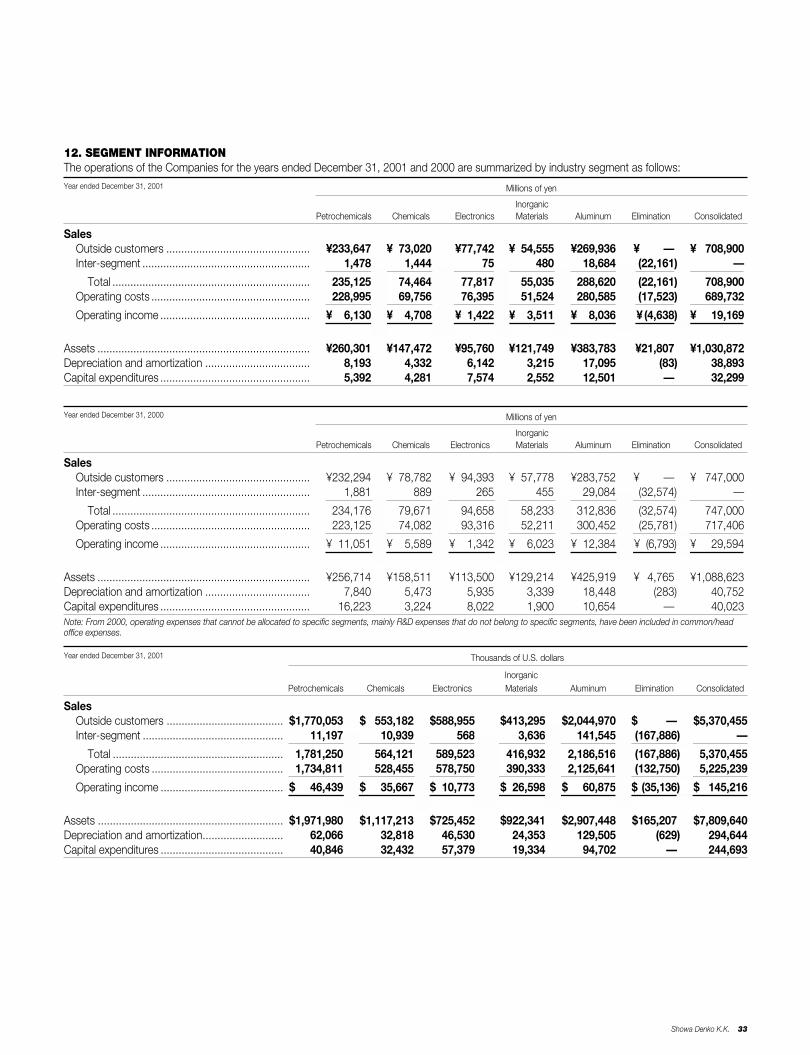
Showa Denko K.K. 33
12. SEGMENT INFORMATIONThe operations of the Companies for the years ended December 31, 2001 and 2000 are summarized by industry segment as follows:Year ended December 31, 2001 Millions of yen
InorganicPetrochemicals Chemicals Electronics Materials Aluminum Elimination Consolidated
SalesOutside customers ................................................ ¥233,647 ¥073,020 ¥77,742 ¥054,555 ¥269,936 ¥ — ¥0,708,900Inter-segment ........................................................ 1,478 1,444 75 480 18,684 (22,161) —
Total .................................................................. 235,125 74,464 77,817 55,035 288,620 (22,161) 708,900Operating costs ..................................................... 228,995 69,756 76,395 51,524 280,585 (17,523) 689,732
Operating income .................................................. ¥006,130 ¥004,708 ¥01,422 ¥003,511 ¥008,036 ¥ (4,638) ¥00,19,169
Assets ....................................................................... ¥260,301 ¥147,472 ¥95,760 ¥121,749 ¥383,783 ¥21,807 ¥1,030,872Depreciation and amortization ................................... 8,193 4,332 6,142 3,215 17,095 (83) 38,893Capital expenditures .................................................. 5,392 4,281 7,574 2,552 12,501 — 32,299
Year ended December 31, 2000 Millions of yen
InorganicPetrochemicals Chemicals Electronics Materials Aluminum Elimination Consolidated
SalesOutside customers ................................................ ¥232,294 ¥078,782 ¥094,393 ¥057,778 ¥283,752 ¥ — ¥0,747,000Inter-segment ........................................................ 1,881 889 265 455 29,084 (32,574) —
Total .................................................................. 234,176 79,671 94,658 58,233 312,836 (32,574) 747,000Operating costs ..................................................... 223,125 74,082 93,316 52,211 300,452 (25,781) 717,406
Operating income .................................................. ¥011,051 ¥005,589 ¥001,342 ¥006,023 ¥012,384 ¥ (6,793) ¥0,029,594
Assets ....................................................................... ¥256,714 ¥158,511 ¥113,500 ¥129,214 ¥425,919 ¥ 4,765 ¥1,088,623Depreciation and amortization ................................... 7,840 5,473 5,935 3,339 18,448 (283) 40,752Capital expenditures .................................................. 16,223 3,224 8,022 1,900 10,654 — 40,023Note: From 2000, operating expenses that cannot be allocated to specific segments, mainly R&D expenses that do not belong to specific segments, have been included in common/headoffice expenses.
Year ended December 31, 2001 Thousands of U.S. dollars
InorganicPetrochemicals Chemicals Electronics Materials Aluminum Elimination Consolidated
SalesOutside customers ....................................... $1,770,053 $0,553,182 $588,955 $413,295 $2,044,970 $ — $5,370,455Inter-segment ............................................... 11,197 10,939 568 3,636 141,545 (167,886) —
Total ......................................................... 1,781,250 564,121 589,523 416,932 2,186,516 (167,886) 5,370,455Operating costs ............................................ 1,734,811 528,455 578,750 390,333 2,125,641 (132,750) 5,225,239
Operating income ......................................... $0,046,439 $0,035,667 $010,773 $026,598 $0,060,875 $ (35,136) $0,145,216
Assets .............................................................. $1,971,980 $1,117,213 $725,452 $922,341 $2,907,448 $165,207 $7,809,640Depreciation and amortization........................... 62,066 32,818 46,530 24,353 129,505 (629) 294,644Capital expenditures ......................................... 40,846 32,432 57,379 19,334 94,702 — 244,693
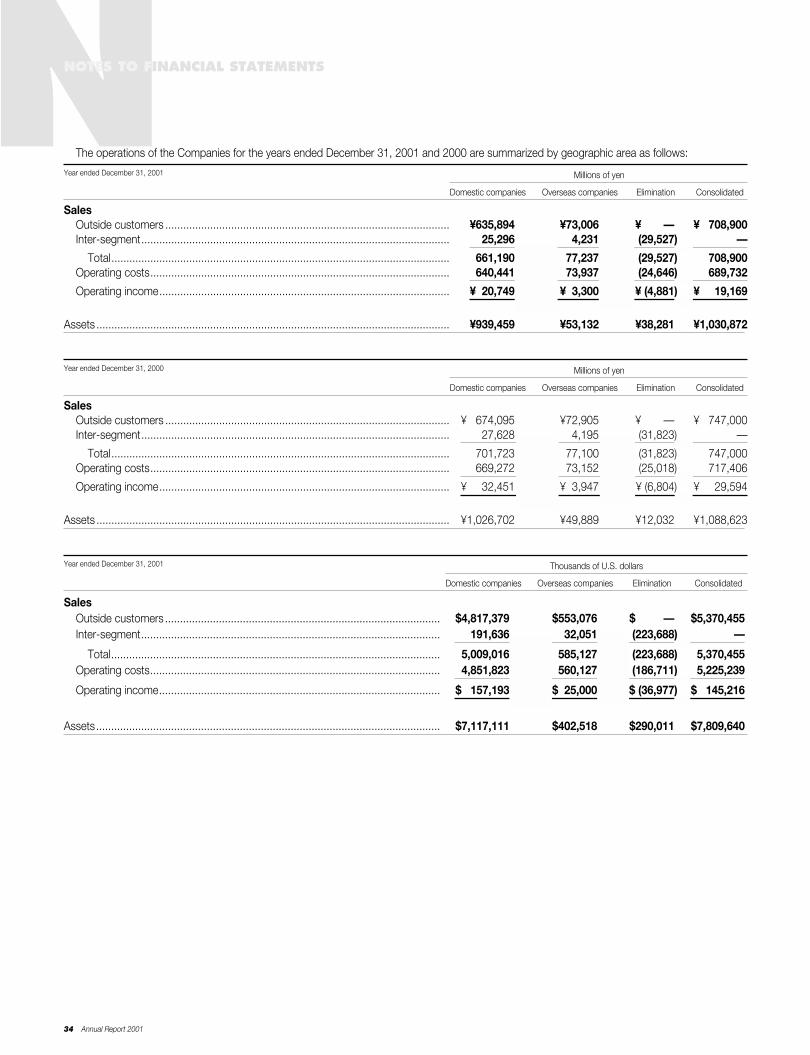
The operations of the Companies for the years ended December 31, 2001 and 2000 are summarized by geographic area as follows:
Year ended December 31, 2001 Millions of yen
Domestic companies Overseas companies Elimination Consolidated
SalesOutside customers ............................................................................................... ¥635,894 ¥73,006 ¥ — ¥0,708,900Inter-segment....................................................................................................... 25,296 4,231 (29,527) —
Total................................................................................................................. 661,190 77,237 (29,527) 708,900Operating costs.................................................................................................... 640,441 73,937 (24,646) 689,732
Operating income................................................................................................. ¥020,749 ¥03,300 ¥ (4,881) ¥0,019,169
Assets ...................................................................................................................... ¥939,459 ¥53,132 ¥38,281 ¥1,030,872
Year ended December 31, 2000 Millions of yen
Domestic companies Overseas companies Elimination Consolidated
SalesOutside customers ............................................................................................... ¥0,674,095 ¥72,905 ¥ — ¥0,747,000Inter-segment....................................................................................................... 27,628 4,195 (31,823) —
Total................................................................................................................. 701,723 77,100 (31,823) 747,000Operating costs.................................................................................................... 669,272 73,152 (25,018) 717,406
Operating income................................................................................................. ¥0,032,451 ¥03,947 ¥ (6,804) ¥0,029,594
Assets ...................................................................................................................... ¥1,026,702 ¥49,889 ¥12,032 ¥1,088,623
Year ended December 31, 2001 Thousands of U.S. dollars
Domestic companies Overseas companies Elimination Consolidated
SalesOutside customers ............................................................................................ $4,817,379 $553,076 $ — $5,370,455Inter-segment.................................................................................................... 191,636 32,051 (223,688) —
Total.............................................................................................................. 5,009,016 585,127 (223,688) 5,370,455Operating costs................................................................................................. 4,851,823 560,127 (186,711) 5,225,239
Operating income.............................................................................................. $0,157,193 $025,000 $ (36,977) $0,145,216
Assets................................................................................................................... $7,117,111 $402,518 $290,011 $7,809,640
34 Annual Report 2001
NNOTES TO FINANCIAL STATEMENTS
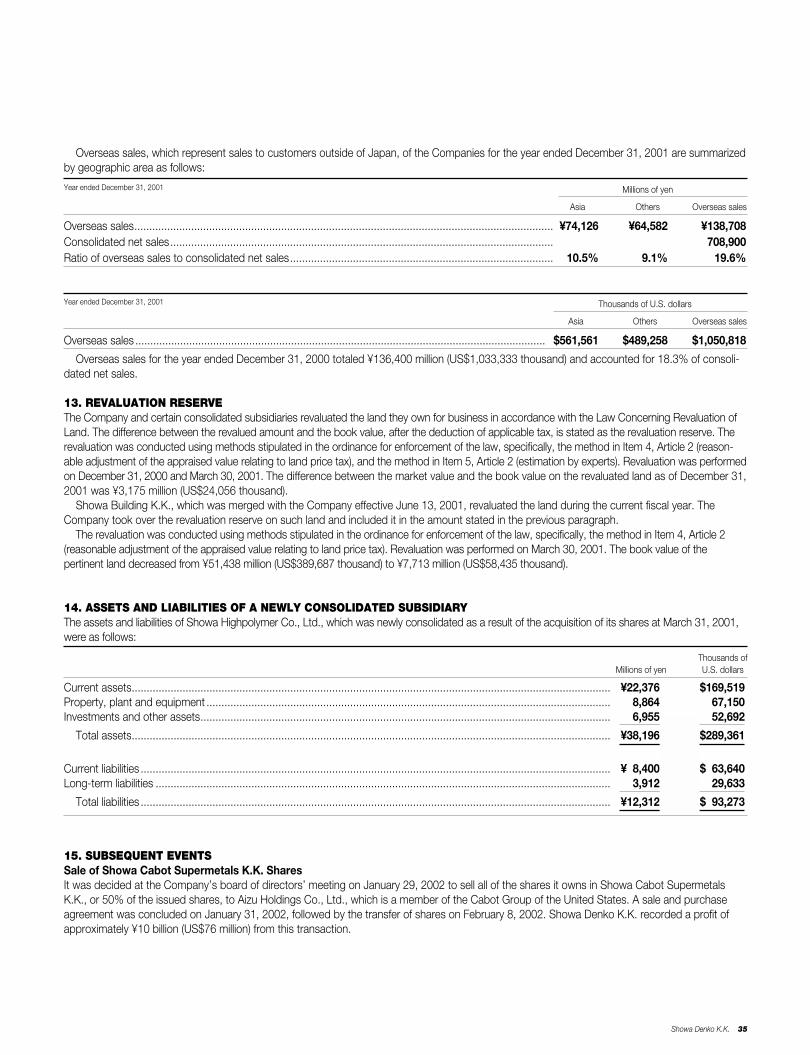
Overseas sales, which represent sales to customers outside of Japan, of the Companies for the year ended December 31, 2001 are summarizedby geographic area as follows:
Year ended December 31, 2001 Millions of yen
Asia Others Overseas sales
Overseas sales............................................................................................................................................ ¥74,126 ¥64,582 ¥138,708Consolidated net sales................................................................................................................................ 708,900Ratio of overseas sales to consolidated net sales........................................................................................ 10.5% 9.1% 19.6%
Year ended December 31, 2001 Thousands of U.S. dollars
Asia Others Overseas sales
Overseas sales ......................................................................................................................................... $561,561 $489,258 $1,050,818
Overseas sales for the year ended December 31, 2000 totaled ¥136,400 million (US$1,033,333 thousand) and accounted for 18.3% of consoli-dated net sales.
13. REVALUATION RESERVEThe Company and certain consolidated subsidiaries revaluated the land they own for business in accordance with the Law Concerning Revaluation ofLand. The difference between the revalued amount and the book value, after the deduction of applicable tax, is stated as the revaluation reserve. Therevaluation was conducted using methods stipulated in the ordinance for enforcement of the law, specifically, the method in Item 4, Article 2 (reason-able adjustment of the appraised value relating to land price tax), and the method in Item 5, Article 2 (estimation by experts). Revaluation was performedon December 31, 2000 and March 30, 2001. The difference between the market value and the book value on the revaluated land as of December 31,2001 was ¥3,175 million (US$24,056 thousand).
Showa Building K.K., which was merged with the Company effective June 13, 2001, revaluated the land during the current fiscal year. TheCompany took over the revaluation reserve on such land and included it in the amount stated in the previous paragraph.
The revaluation was conducted using methods stipulated in the ordinance for enforcement of the law, specifically, the method in Item 4, Article 2(reasonable adjustment of the appraised value relating to land price tax). Revaluation was performed on March 30, 2001. The book value of thepertinent land decreased from ¥51,438 million (US$389,687 thousand) to ¥7,713 million (US$58,435 thousand).
14. ASSETS AND LIABILITIES OF A NEWLY CONSOLIDATED SUBSIDIARYThe assets and liabilities of Showa Highpolymer Co., Ltd., which was newly consolidated as a result of the acquisition of its shares at March 31, 2001,were as follows:
Thousands ofMillions of yen U.S. dollars
Current assets................................................................................................................................................................ ¥22,376 $169,519Property, plant and equipment ....................................................................................................................................... 8,864 67,150Investments and other assets......................................................................................................................................... 6,955 52,692
Total assets................................................................................................................................................................ ¥38,196 $289,361
Current liabilities ............................................................................................................................................................. ¥08,400 $063,640Long-term liabilities ........................................................................................................................................................ 3,912 29,633
Total liabilities ............................................................................................................................................................. ¥12,312 $093,273
15. SUBSEQUENT EVENTSSale of Showa Cabot Supermetals K.K. SharesIt was decided at the Company’s board of directors’ meeting on January 29, 2002 to sell all of the shares it owns in Showa Cabot SupermetalsK.K., or 50% of the issued shares, to Aizu Holdings Co., Ltd., which is a member of the Cabot Group of the United States. A sale and purchaseagreement was concluded on January 31, 2002, followed by the transfer of shares on February 8, 2002. Showa Denko K.K. recorded a profit ofapproximately ¥10 billion (US$76 million) from this transaction.
Showa Denko K.K. 35
36 Annual Report 2001
RREPORT OF INDEPENDENT CERTIFIED PUBLIC ACCOUNTANTS MWe have audited the accompanying consolidated balance sheets of
Showa Denko K.K. and its subsidiaries as of December 31, 2001 and
2000, and the related consolidated statements of income, stockhold-
ers’ equity and cash flows for the years then ended, all expressed
in Japanese yen. These financial statements are the responsibility
of the Company’s management. Our responsibility is to express
an opinion on these financial statements based on our audits.
We conducted our audits in accordance with generally accepted
auditing standards in Japan. Those standards require that we plan
and perform the audit to obtain reasonable assurance about whether
the financial statements are free of material misstatement. An audit
includes examining, on a test basis, evidence supporting the amounts
and disclosures in the financial statements. An audit also includes
assessing the accounting principles used and significant estimates
made by management, as well as evaluating the overall financial state-
ment presentation. We believe that our audits provide a reasonable
basis for our opinion.
In our opinion, the consolidated financial statements referred
to above present fairly, in all material respects, the consolidated finan-
cial position of Showa Denko K.K. and its subsidiaries as of December
31, 2001 and 2000, and the consolidated results of their operations
and their cash flows for the years then ended in conformity with gen-
erally accepted accounting principles in Japan applied on a consistent
basis during the periods.
As described in Note 2, effective from April 1, 2000, Showa Denko
K.K. and its subsidiaries have adopted the new Japanese accounting
standards for financial instruments, retirement benefits, and the
revised standards for foreign currency translation.
As described in Note 15, the Company sold Showa Cabot
Supermetals K.K. on February 8, 2002.
The amounts expressed in U.S. dollars, which are provided solely
for the convenience of the readers, have been translated on the basis
set forth in Note 3.
To the Board of Directors and Shareholders
Showa Denko K.K.
Tokyo, Japan
March 28, 2002
The Fuji Accounting Office
Certified Public Accountants
Showa Denko K.K. 37
MMAJOR SUBSIDIARIES AND AFFILIATES (As of December 31, 2001)
Name Equity Participation (%) Main Product or Business
Heisei Polymer Co., Ltd. *(T5193) 43.9 Plastic cloth, bags, sheeting, etc.Hymold Co., Ltd. 100.0 Plastic products for electrical appliancesJapan Polyolefins Co., Ltd. 65.0 High- and low-density polyethyleneKokusai Eisei Co., Ltd. 100.0 Insecticides, insect and rodent controlPT. Showa Aluminum Indonesia 90.0 Evaporators for refrigeratorsPT. Showa Esterindo Indonesia 67.0 Ethyl acetateSDS Biotech K.K. 100.0 AgrochemicalsShoko Co., Ltd. *(T8090) 43.4 General tradingShotic America Corporation 100.0 Aluminum forged productsShotic (Singapore) Pte. Ltd. 100.0 Aluminum forged productsShowa Aluminum Alloy K.K. 100.0 Aluminum alloyShowa Aluminum Can Corporation 75.0 Beer and soft drink cansShowa Aluminum Corporation of America 100.0 Heat exchange equipment for automobiles, photosensitive drums for laser beam printersShowa Aluminum Czech S.R.O. 100.0 Heat exchange equipment for automobilesShowa Aluminum Exterior Corporation 100.0 Home exterior productsShowa Aluminum (Malaysia) Sdn. Bhd. 100.0 Aluminum substrates for hard disksShowa Aluminum Manufacturing Philippines Corporation 100.0 Evaporators for refrigerators
Showa Aluminum Powder K.K. 100.0 Aluminum pasteShowa Aluminum (Thailand) Co., Ltd. 92.5 Heat exchange equipment for automobilesShowa Aluminum Viewtech Co., Ltd. 93.9 Flagstaffs, lightning rods, etc.Showa Denko Carbon, Inc. 100.0 Graphite electrodesShowa Denko HD 80.1 Hard disksShowa Denko Kenso Co., Ltd. 100.0 Grinding and polishing toolsShowa Denko Kenzai K.K. 100.0 Plaster materials, fire-proofing pipe, wall siding, etc.Showa Denko Packaging Co., Ltd. 100.0 Packaging/containers for food, medicine, and electronic partsShowa Distribution K.K. 100.0 Distribution and warehousingShowa Engineering Co., Ltd. 100.0 Engineering, construction, maintenanceShowa Financing K.K. 92.3 Provision of finance to subsidiaries and affiliatesShowa Highpolymer Co., Ltd.* (T4214) 40.0 Unsaturated polyester, vinyl ester, etc.Showa Homes K.K. 100.0 Company housing rentalShowa Titanium Co., Ltd. 100.0 Ceramics for electronics applicationsShunan Denko K.K. 80.0 High-carbon ferrochromeTsurusaki Kyodo Doryoku K.K. 56.8 Electric power and steam generation, supply of water, treatment of wastewater
SUBSIDIARIES
Name Equity Participation (%) Main Product or Business
Middelburg Technochrome (Pty.) Ltd. 20.7 Low-carbon ferrochromeShowa Cabot K.K. 50.0 Carbon blackShowa Cabot Supermetals K.K. (Note 1) 50.0 Tantalum and rare metalsShowa DDE Manufacturing K.K. 50.0 Synthetic rubberShowa Denko Asia (Pte.) Ltd. (Note 2) 35.0 Investment in Southeast Asian plastic products affiliatesShowa Tansan Co., Ltd.* (T4096) 20.6 Liquid oxygen, nitrogen, argonSKY Aluminium Co., Ltd. 37.3 Sheets, platesSun Allomer Co., Ltd. 50.0 Polypropylene and advanced polypropylene-based materialsTokyo Liquefied Oxygen Co., Ltd. 35.0 Liquefied oxygen, nitrogen, argonUnion Showa K.K. 50.0 Molecular sieves
AFFILIATES
*Tokyo Stock Exchange listed companies
Note (1): In February 2002, Showa Denko K.K. sold all of its shares in Showa Cabot Supermetals K.K.Note (2): In November 2001, Showa Denko K.K. sold the majority of its shares in Showa Denko Asia (Pte.) Ltd.
As of December 31, 2001, Showa Denko K.K. had 49 consolidated subsidiaries, including the above.

CD
38 Annual Report 2001
DIRECTORS, STATUTORY AUDITORS, CORPORATE OFFICERS, AND CHIEF TECHNOLOGIST(As of March 28, 2002)
� PRESIDENT AND CHIEF EXECUTIVE OFFICERMitsuo Ohashi
� EXECUTIVE VICE PRESIDENTIwao KojimaAssistant to President, Executive Officer, Technology Headquarters;Chairman, Security Export Control Committee
� SENIOR MANAGING DIRECTORSHiroshi MatsubaraDirector in charge of Corporate Strategy Department andAudit Office; Chief Manager, Business Support Center; Chairman, IR Committee
Akira FurusawaExecutive Officer, Aluminum Sector
� MANAGING DIRECTORSMinoru KiyonoExecutive Officer, Electronics Sector; Chief Manager, DevelopmentDepartment, Electronics Sector
Kunio KashiwadaExecutive Officer, Chemicals Sector; Chief Manager, PlanningDepartment, Chemicals Sector
Tatsuo SatoChief Manager, Corporate Strategy Department
Kyohei TakahashiExecutive Officer, Petrochemicals Sector; Chief Manager, PlanningDepartment, Petrochemicals Sector
� DIRECTORSOsamu TakahashiGeneral Manager, Extrusion Division, Aluminum Sector
Masayoshi YoneyamaGeneral Manager, Heat Exchanger Division, Aluminum Sector
Norikuni ImotoChief Manager, Corporate Relations Center
Toyoharu Fujii Executive Officer, Inorganic Materials Sector
Note: All directors listed above concurrently serve as corporate officers in capacities corresponding to their respective positions.
DIRECTORS� STANDING STATUTORY AUDITORS
Naoaki YokoboriKeiichi Sugiyama
� AUDITORSTakashi KobayashiNoboru SakaguchiKen-ichiro Kikuchi
Naoshi OnoDeputy Executive Officer, Technology Headquarters; Chairman,Safety Measures Committee
Tadahiro HashimotoGeneral Manager, Rare Earth Division, Electronics Sector; Chief Manager, Marketing Department, Rare Earth Division
Hiroshi ItoChief Manager, Finance & Accounting Group, Business Support Center
Akira TsuchidaChief Manager, Planning Department, Aluminum Sector
Shinzou MiyamotoGeneral Manager, Rolled Products Division, Aluminum Sector
Takayuki KatoGeneral Manager, Shotic Division, Aluminum Sector
Hiromune ChumanGeneral Manager, HD Division, Electronics Sector
Tatsuo OtsukaGeneral Manager, Aluminum Specialty Products Division, Aluminum Sector
Kohji KudoOita Complex Representative; Plant Manager, Oita Plant
Tetsuo TamadaChief Manager, Planning Department, Inorganic Materials Sector
Kenji KatagiriGeneral Manager, Specialty Chemicals Division, Chemicals Sector
Norio MasubuchiGeneral Manager, Gases & Chemicals Division, Chemicals Sector
Eiji OgataManager, Ogata Laboratory, Corporate R&D Center, Technology Headquarters
CHIEF TECHNOLOGIST
CORPORATE OFFICERS
STATUTORY AUDITORS
C
Showa Denko K.K. 39
CORPORATE DATA
Regular General MeetingThe regular general meeting of stockholders was held onMarch 28, 2002.
Number of Shares Outstanding1,138,100,738 at December 31, 2001
Number of Stockholders112,386 at December 31, 2001
Classification of StockAll stock issued by Showa Denko is common stock.
Stock Transfer AgentMizuho Trust & Banking Co., Ltd.
1-5-1, Marunouchi,Chiyoda-ku, Tokyo 100-0005, Japan
Stockholders by Sector (At December 31, 2000)
Number of shares held %
Individuals 384,442 33.78%
Japanese corporate entities 105,593 9.28%
Foreign corporate entities, etc. 63,648 5.59%
Financial firms 574,668 50.49%
Securities firms 9,744 0.86%
Governmental bodies 3 0.90%
Total 100.00%
Head OfficeShowa Denko K.K.
13-9, Shiba Daimon 1-chome,Minato-ku, Tokyo 105-8518, JapanFax: 3-3436-2625
e-mail: [email protected]: http://www.sdk.co.jp
INVESTOR INFORMATION
Showa Denko America, Inc.
Head Office489 Fifth Avenue, 18th Fl.,New York, NY 10017,U.S.A.Phone: 212-370-0033Fax: 212-370-4566
San Francisco Office1900 S. Norfolk St., Suite 240,San Mateo, CA 94403,U.S.A.Phone: 650-345-1338Fax: 650-345-5403
Showa Denko Europe GmbHMartin-Kollar-Str. 10,D-81829 Munich,GermanyPhone: 89-9399620Fax: 89-939962-50
Showa Denko Singapore (Pte.) Ltd.260 Orchard Road, #14-02 The Heeren,Singapore 238855Phone: 732-7111Fax: 733-6803
Showa Denko (Shanghai) Co., Ltd.Room 819, 8 Huajing Road,Waigaogiao Free Trade,Shanghai, ChinaPhone: 21-5820-6120Fax: 21-5820-2034
COMMERCIAL SUBSIDIARIES ABROAD
This annual report is printed on recycled paper and nonwood paper.
Printed in Japan
13-9, Shiba Daimon 1-chome,Minato-ku, Tokyo 105-8518, Japan

![[ Full Report ] - Showa Denko · · 2014-11-27SHOWA DENKO CSR Report 2014 7 Business performance in 2013 ... Chines e integrated graphite electrode manufactur ing ... The medium-term](https://img.pdfslide.net/doc/110x75/5b02e7a97f8b9a65618ff55d/-full-report-showa-denko-csr-report-2014-7-business-performance-in-2013-.jpg)