Embed Size (px)
DESCRIPTION
jurnal
Citation preview

THE J.J. STROSSMAYER UNIVERSITY OF OSIJEKPFORZHEIM UNIVERSITY OF APPLIED SCIENCES
INTERDISZIPLINÄRE MANAGEMENTFORSCHUNG IIINTERDISCIPLINARY MANAGEMENT RESEARCH II

HerausgeberEkonomski fakultet u Osijeku
Fachhochschule PforzheimHochschule für Gestaltung, Technik und Wirtschaft
Für den HerausgeberProf. Dr. Željko Turkalj
Prof. Dr. Ing. Ralph Schieschke
Wissenschaftliche HerausgeberProf. Dr. Dra`en Barkovi}
Prof. Dr. Bodo Runzheimer
RezensentenProf. Dr. Ivan Ferenčak
Prof.Dr. Rainer GildeggenProf. Dr. Marcel Meler
Prof. Dr. Bodo RunzheimerProf. Dr. Hartmut Löffler
Satz und Umbruch Grafika d.o.o.
DruckGrafika d.o.o.
CIP - Katalogizacija u publikacijiGRADSKA I SVEU^ILI[NA KNJI@NICA OSIJEK
UDK 65.012.34(063)65.012.4(063)
INTERDISZIPLINAERE managementforschung II = Interdisciplinary management research II / <wissenschaftliche Herausgeber Dražen Barković, Bodo Runzheimer>. - Osijek : Ekonomski fakultet ; Pforzheim : Fachhochchule, Hochschule fuer Gestaltung, Technik und Wirtschaft, 2006. Tekst na njem. i engl. jeziku. - Bibliografi ja. ISBN 953-253-007-X 460414001

THE J.J. STROSSMAYER UNIVERSITY OF OSIJEKPFORZHEIM UNIVERSITY OF APPLIED SCIENCES
INTERDISCIPLINARY MANAGEMENT RESEARCH II
POSTGRADUATE STUDY MANAGEMENTEKONOMSKI FAKULTET U OSIJEKU
Osijek, 2006.
INTERDISZIPLINÄRE MANAGEMENTFORSCHUNG II


Inhaltverzeichnis – Contents
VORWORT . . . . . . . . . . . . . . . . . . . . . . . . . . . . . . . . . . . . . . . . . . . . . . . . . . . . . . . . . . . . . . 9
FOREWORD . . . . . . . . . . . . . . . . . . . . . . . . . . . . . . . . . . . . . . . . . . . . . . . . . . . . . . . . . . . 10
Issues in macroeconomics
Mladen Vedriš:THE CROATIAN ECONOMY AND ITS ABILITY TO ATTRACT NEW FOREIGN INVESTMENT . . . . . . . . . . . . . . . . . . . . . . . . . . . . . . . . . . . . . . . . . . . . . . . . . . . . . . 13Dirk Wentzel:ZUR BEGRENZUNG DER STAATSVERSCHULDUNGNACH DEM SCHEITERN DES STABILITÄTSPAKTES . . . . . . . . . . . . . . . . . . . . 32Pap Norbert – Végh Andor:THE INSTITUTIONAL SYSTEM AND WORKING EXPERIENCES OF HUNGARIAN SPATIAL DEVELOPMENT . . . . . . . . . . . . . . . . . . . . . . . . . . . . . . . 47Nedeljko Bosanac, Ivana Barković:REGIONALISM, RECONSTITUTION AND THESES FOR DESIGNING A STRA-TEGY FOR ECONOMIC GROWTH AND DEVELOPMENT OF SLAVONIA AND BARANYA . . . . . . . . . . . . . . . . . . . . . . . . . . . . . . . . . . . . . . . . . . . . . . . . . . . . . . . . . 72Zsuzsa M. Császár - József Tóth:REFORMS AND CHANGES IN CONTEMPORARYHUNGARIAN EDUCATION . . . . . . . . . . . . . . . . . . . . . . . . . . . . . . . . . . . . . . . . . . 102Željka Bajto, Dijana Borojević, Stjepan Rudan:SAPARD PRE-ACCESSION ASSISTANCE PROGRAMME: AIMS, IMPLEMENTATION, PRINCIPLES AND CANDIDATE STATES EXPERIENCES . . . . . . . . . . . . . . . . . . . . . . . . . . . . . . . . . 112Dominika Crnjac, Karolina Štefanac:SITUATION ANALYSIS OF THE TRADE SECTOR IN POŽEŠKO – SLAVONSKA COUNTY . . . . . . . . . . . . . . . . . . . . . . . . . . . . . . . . . . 134
Operations management
Niko Majdandžić, Tadija Lovrić, Vido Perić: MANAGEMENT OF BUILDING PROJECTS . . . . . . . . . . . . . . . . . . . . . . . . . . . . 155Bernd Britzelmaier, Brigitte Eller: DER EINSATZ VON UNTERNEHMENSPLANSPIELEN IN DER CONTROLLER-AUSBILDUNG . . . . . . . . . . . . . . . . . . . . . . . . . . . . . . . . . . . . . . . 167
5Inhaltverzeichnis – Contents

Mladen Jurišić, Jozo Kanisek, Dražen Barković: TECHNOLOGISCHE UND TECHNISCHE FAKTOREN UND WIRTSCHAFTLICHE RESULTATE BEI DER GURKENPRODUKTION . . . . . . 178Zlatko Lacković: CIVIL ENGINEERING’S REEINGINEERING AS AN ESSENTIAL FACTOR OF CORPORATE BUSINESS STABILITY. . . . . . . . . . . . . . . . . . . . . . . . . . . . . . . . . . 188Marina Dabić, Mirjana Pejić-Bach: STRATEGY IMPROVEMENT THROUGH INTELLIGENT MANAGEMENT TOOLS IN CROATIAN FIRMS. . . . . . . . . . . . . . . . . . . . . . . . . . . . . . . . . . . . . . . . 200Dunja Maronić – Filaković, Maja Lamza – Maronić:PHARMACOECONOMICS IN THE PROCESS OF PHARMACEUTICAL MARKET REGULATION IN THE REPUBLIC OF CROATIA . . . . . . . . . . . . . . . 215Sanja Popović, Neven Raguž, Danijela Mikulić:THE IMPORTANCE FOR THE APPLICATION OF PHARMACOECONOMIC ANALYSIS IN THE PROCESS OF DRUG REGISTRATION IN THE REPUBLIC OF CROATIA . . . . . . . . . . . . . . . . . . . . . . . . . . . . . . . . . . . . . . . . . . . . . . . . . . . . . . 223Kedačić Anita, Knežević Sandra, Marušić Marina, Medverec Hrvojka, Veir Zdenko: ADJUSTMENT OF PUBLIC ADMINISTRATION IN EU ASSOCIATION PROCESS . . . . . . . . . . . . . . . . . . . . . . . . . . . . . . . . . . . . . . . . . . . . . . . . . . . . . . . . . 237Alka Šofić, Sandra Špiranović, Dalibor Bukvić, Zdravko Dokuzović, Tadija Lovrić:ACCOUNTING INFORMATION FOR PLANNING AND COST CONTROL . . 264Verica Jovanovski, Maja Horonitz, Branislav Orešković:CROSS-CULTURAL MANAGEMENT IN PRIMARY SCHOOL THROUGH INTERNATIONAL PROGRAMMES AND EDUCATIONAL METHODS . . . . . . 290Linda Juraković, Giorgio Cadum, Goran Fabris:ANALYSIS OF FACTS AND DILEMMAS OF GLOBALIZATION ACTIVITIES . . . . . . . . . . . . . . . . . . . . . . . . . . . . . . . . . . . . . . . . . . . . . . . . . . . . . . . 303
Finance
Marius Gavriletea:CONNEXIONS BETWEEN MOTOR LEASING AND INSURANCE IN ROMANIA . . . . . . . . . . . . . . . . . . . . . . . . . . . . . . . . . . . . . . . . . . 317Dr. Izabela Pruchnicka-Grabias:EMPIRICAL STUDIES OF LOOKBACK OPTIONS PRICE SENSITIVITY TO MARKET FACTORS . . . . . . . . . . . . . . . . . . . . . . . . . . . . . . . . . . . . . . . . . . . . . . . . 331Branimir Marković, Branko Matić:THE PROCESS OF TRANSITION AND THE CAPITAL MARKET IN THE REPUBLIC OF CROATIA . . . . . . . . . . . . . . . . . . . . . . . . . . . . . . . . . . . . . . . . . . . . 343
6 Inhaltverzeichnis – Contents

Cornelia Pop, Partenie Dumbrava:BUCHAREST STOCK EXCHANGE EVOLUTIONNOVEMBER 1995 – NOVEMBER 2005 . . . . . . . . . . . . . . . . . . . . . . . . . . . . . . . . 349Miljenko Crnjac, Dominika Crnjac:INVESTMENT PROJECT EFFICIENCY EVALUATION . . . . . . . . . . . . . . . . . . . 368Justyna Maliszewska-Nienartowicz:REGULATION OF CONSUMER CREDIT IN POLISH LAW. . . . . . . . . . . . . . . . 373Gordana Dukić, Darko Dukić:DETERMINANTS OF HOUSEHOLD CREDIT INDEBTEDNESS IN THE REPUBLIC OF CROATIA . . . . . . . . . . . . . . . . . . . . . . . . . . . . . . . . . . . . . . . . . . . . 385
Marketing
Dr. Bela Orosdy, Prof.dr.sc. Mane Medić:POLITICAL MARKETING MANAGEMENT . . . . . . . . . . . . . . . . . . . . . . . . . . . . 399Mr. sc. Željka Zavišić, Prof. dr. sc. Mane Medić:THE MARKETING OF SMALL ENTERPRISES, GUERILLA MARKETING . . 414Gyöngyi Gergely:IS IT POSSIBLE TO INTERPRET THE MARKETING CHANNEL IN THE PRACTICE OF POLITICS? . . . . . . . . . . . . . . . . . . . . . . . . . . . . . . . . . . . . . . . . . . . 426
Miscellaneous
Alexej Steinmark:COMPETITION-COMPLIANCE-PROGRAMM ALS INSTRUMENT DES UNTER-NEHMERISCHEN RISIKOMANAGEMENTS. . . . . . . . . . . . . . . . . . . . . . . . . . . .439Djula Borozan:UPWARD MOBILITY CRITERIA FROM CROATIAN WOMEN’SPOINT OF VIEW . . . . . . . . . . . . . . . . . . . . . . . . . . . . . . . . . . . . . . . . . . . . . . . . . . . 462Ivana Barković, Mario Vinković:GENDER INEQUALITY IN THE CROATIAN LABOUR MARKET – LEGAL AND ECONOMIC ASPECTS . . . . . . . . . . . . . . . . . . . . . . . . . . . . . . . . . . . . . . . . . . . . . . 484Ljiljana Croce:ANTIGLOBALISIERUNG DIE ANDERE GLOBALISIERUNG . . . . . . . . . . . . . 505
7Inhaltverzeichnis – Contents


VORWORTIm Rahmen des wissenschaftlichen Nachdiplomstudiums „Management“ der Wirtschaftsfakultät Osijek wurde im Zeitraum von 2002 bis 2004 an der Wirtschaftsfakultät aus Osijek und an der Partneruniversität University of Applied Sciences aus Pforzheim eine Reihe wissenschaftlicher Kolloquien und Symposien abgehalten, auf denen Arbeiten der Nachdiplomstudenten vorgestellt wurden. Dieses Buch unter dem Titel „INTERDISZIPLINÄRE MANAGEMENTFORSCHUNG II“ besteht aus 9 Arbeiten von Nachdiplomstudenten und 23 Arbeiten der Professoren, die in jener Sprache verfasst wurden, in der sie 2002 und 2003 an der University of Applied Sciences aus Pforzheim und 2005 an der Wirtschaftsfakultät aus Osijek vorgetragen wurden. Somit sind sie ein weiterer Beitrag zur 25jährigen fach-männischen, wissenschaftlichen und überaus freundschaftlichen Zusammenarbeit der Partnerinstitutionen University of Applied Sciences aus Pforzheim und der Wirtschaftsfakultät aus Osijek.
Die Beiträge im Buch, die zahlreiche interdisziplinäre Aspekte des Managements von Globalisierung über Finanzmanagement, Bankenwesen, Informatik, Produktion bis hin zu Qualität und Recht aufdecken, sind von unterschiedlicher Qualität und sowohl theoretischen als auch praktischen Charakters. Geschrieben wurden sie von 66 Autoren und Koautoren, die auch selbst im Rahmen ihrer Fachbereiche in die erwähnte Problematik mit einbezogen sind.
Wir hoffen, dass wir mit diesem Buch die weitere fruchtbare Zusammenarbeit der Autoren mit dem Nachdiplomstudium Management anregen und neuen Projekten den Weg ebnen.
Prof. Dr. Dražen BarkovićProf. Dr. Bodo Runzheimer
9

ForewordWithin the scientific postgraduate study «Management» of the Faculty of Economics in Osijek, the whole range of scientific colloquiums and symposiums was held from 2002 to 2006 at both the Faculty of Economics in Osijek and its partner institu-tion - University of Applied Sciences in Pforzheim. During these events numerous papers of postgraduate students, their professors and other members of academic community interested in this postgraduate study have been presented. This book titled «INTERDISCIPLINARY MANAGEMENT RESEARCH II» is compiled of 9 papers written by postgraduate students and 23 papers written by professors in the language used for their presentation both at the University of Applied Sciences in Pforzheim in 2002 and 2003, and at the Faculty of Economics in Osijek in 2005. This book is one more contribution to the 25th anniversary of the scientific, profes-sional but most of all friendship cooperation of two partner institutions, University of Applied Sciences Pforzheim and Faculty of Economics in Osijek.
The papers in this book, which reveal numerous interdisciplinary aspects of man-agement including topics related to globalization, financial management, banking, computer science, production, quality, law, are of different quality and theoretical and practical character. They were written by 66 authors and co-authors who are themselves engaged in dealing with the aforementioned issues in their respective professions.
We hope that this book has encouraged further fruitful cooperation between authors and the postgraduate study “Management” and opened the way to new projects.
Prof.dr.sc. Dražen BarkovićProf.dr.sc. Bodo Runzheimer
10

Issues in macroeconomics


THE CROATIAN ECONOMY AND ITS ABILITY TO ATTRACT NEW FOREIGN... 13
THE CROATIAN ECONOMY AND ITS ABILITY TO ATTRACT NEW FOREIGN INVESTMENT
Dr.sc. Mladen Vedri{Faculty of Law Zagreb
SummaryCroatia, as well as the other transition countries of the former Eastern bloc,
confronted the fi rst signifi cant wave of European and global investment at the beginning of the 1990s. This was a consequence of new social movements and of the revival of market economies in the countries of Central and Eastern Europe after the fall of the Berlin Wall. Keeping in mind the postwar, but also the wartime, circumstances of Croatia (the occupation of a considerable portion of the country), political and economic uncertainty combined so that investment was directed outside of Croatia, in particular to Hungary and the Czech Republic, and to a lesser extent to Poland and the Baltic states.
At the end of the 1990s a powerful wave of brown fi eld investment, that is, the purchase of existing high-quality enterprises, swept over Croatia. At question was a segment of industrial enterprises (pharmaceutical companies, construction materials, drinks and food industries, tourism, etc.) up to infrastructure monopolies (telecommunications, energy).
Today, in the face of the new European Union expansion, and the pressures of ever greater globalization on national economies and local economic activity, as well as the presence of regional and global companies, the essential question is whether Croatia has the awareness of and the ability to create the appropriate stimulative infrastructure environment, and to seize an essential part of these new, transitory investments -- those products and activities that will not remain / survive in the developed countries of the EU, but where there are business-logisitical reasons not moving them to the Far East; in particular today to China or tomorrow to Vietnam and so on. An essential component of the ability to create absorptive capacity for such investment is to increase the level of employment, and a sustainable, stable growth of GDP. All of that serves as a framework for economic and social stability and durable and sustainable economic progress in society. It also accords with realistic expectations, but also with ever greater pressures to compensate for the lost decade of development caused by wartime and postwar events.

Mladen Vedri{14
Introduction
In the period from 1993 until the middle of 2005 Croatia achieved one-fi fth green fi eld investments in the general infl ow of foreign investments. Brown fi eld investments, that is, investment in existing, profi table industries and sectors, accounted for the remainder, generally greater than four-fi fths. Of this, investments in the banking industry comprised one-quarter of investments, and about 15% were in the telecommunications sector. A signifi cant portion of investment is accounted for by the purchase (from the state) of shares of Pliva and INA. The structure of green fi eld investment is still such that more than half of such investments have been achieved by the construction of new supermarkets (commerce), and the expansion of the network of fi nancial institutions (banks, insurance companies).
This data provides a clear indication of a structure of foreign investment just the opposite to that achieved by neighboring countries, and which has also led to adequate movements in their balance of trade. For example, in 1992, Croatia was at the same level of exports as Hungary and Slovakia. But by 2004, the per capita value of Croatian exports (1,806 USD) was about one-third of that of Hungary (5,454 USD) and Slovakia (5,073).
As a consequence, it is indicative that there has also been an impact on employment, or more accurately, unemployment, on regional development, on the sustainable and stable rate of growth of GDP, and on the degree of growth of the external and internal GDP.
Also, it is necessary to realistically evaluate the infl uence of the continuation of trends until now on strengthening the competitive ability of the national economy, its ability to confront new competitive pressures and challenges from regional, European, and global areas, especially in the period of negotiations and preparation for full membership in the EU.
I. Activities and results achieved by transition countries in central and eastern Europe
The following table shows a comparison of recent data on the reform capacity of individual transition and developed countries, and their readiness for change.

THE CROATIAN ECONOMY AND ITS ABILITY TO ATTRACT NEW FOREIGN... 15
Table 1: The top reformers in 2004
CountrySt
artin
g a
busi
ness
Dea
ling
with
lic
ense
s
Hiri
ng a
nd fi
ring
Reg
iste
ring
prop
erty
Get
ting
cred
it
Prot
ectin
g in
vest
ors
Payi
ng ta
xes
Trad
ing
acro
ss
bord
ers
Enfo
rcin
g co
ntra
cts
Clo
sing
a
busi
ness
SerbiaMontenegro + + + + + + + +Georgia + + + + +Vietnam + + + + +Slovakia + + + +Germany + + + +Egypt + + + +Finland + + + +Romania + + + +Latvia + + + +Pakistan + + + +Ruanda + + +Netherlands + + +
Source: The World Bank, Doing Business in 2006,, Washington 2006, pg.. 2
The leading reform country in 2004 was the Republic of Serbia and Montenegro, which achieved reforms and an improvement in eight of 10 areas that were observed. Slovakia, Romania and Latvia are among the fi rst 10 countries in terms of success in starting and introducing reforms. Germany, Finland, and the Netherlands, as highly developed economies, are also at the top of the rankings. This ranking of countries clearly confi rms a complete awareness of the inevitability of changes in groups of countries with diametrically opposed positions based on the degree of their own level of development.
It is especially interesting to consider the ranking of Eastern European and Baltic countries and the reforms that they achieved in the period under consideration.1 Among the notable reforms in Eastern Europe and the Baltic countries in 2004 were:2
1 In general, it can be estimated that the European countries are the most active ones in implementing reforms.
2 Source : “Doing Busines in 2006: Eastern European and Baltic Nations Encourage Businesses with Aggressive Regulatory Reforms”, Press Release, pg.1, www.doingbusiness.org

Mladen Vedri{16
• Serbia and Montenegro moved start-up registrations from its courts to a new administrative registry. Entrepeneurs can register via the Internet. A company can begin to operate in 15 days rather than 51.
• Slovakia has imposed a time limit for issuing trade licenses. A unifi ed tax number for income and value-added taxes has simplifi ed tax registration. Starting a new business now takes 25 days, 80 days less than in 2003.
• Poland was the most active reformer of business licensing in the world with the passing of the Freedom of Economic Activity Act, now cited as one of the key ingredients for the attractive business and investment climate in Poland.3
• Serbia and Montenegro, and the Former Yugoslav Republic of Macedonia (FYROM), have adopted new labor laws making regulation more fl exible.
• Slovakia abolished its three percent property transfer , placing the country in the top 10 in the world in terms of the ease of registering property. The cost of registering ownership has fallen to only 0.1 percent of the property value.
• Three new private credit bureaux began operations Latvia, Romania, and Slovakia making it easier for lenders to assess creditworthiness.
• The Bulgarian Public Credit Registry launched an online system that has reduced the amount of time for retrieving data from three days to several seconds. The Registry has also scrapped the minimum loan cutoff, thereby increasing the coverage of borrowers by nine times.
• Four countries -- Bosnia Hercegovina, Croatia, Romania, and Serbia and Montenegro -- made it easier to create and enforce collateral agreements.
• Romania introduced a fl at tax of 16 percent and reduced payroll taxes. Albania, Bukgaria, the Czech Republic, Estonia, Latvia, and Poland reduced corporate taxes.
• Hungary introduced electronic fi ling of customs documents, reducing approval time to 10 minutes.
• Serbia and Montegro reduced the time required to enforce simple contracts in the courts from 1,028 days to 635days.
• The Czech Republic, Latvia, Poland, and Slovenia reduced judicial backlogs.
In 2004-2005, exactly half of the top 30 countries in global rankings for reform were from Europe.
3 Polish Information and Foreign Policy Investment Agency , www.paiz.gov.pl

THE CROATIAN ECONOMY AND ITS ABILITY TO ATTRACT NEW FOREIGN... 17
Table 2: Top 30 economies on the ease of doing business
1. New Zealand 16. Estonia2. Singapore 17. Switzerland3. USA 18 Belgium4. Canada 19. Germany5. Norway 20. Thailand6. Australia 21. Malaysia7. Hong Kong/China 22. Puerto Rico8. Denmark 23. Mauritius 9. Great Britain 24. Netherlands10. Japan 25. Chile11. Ireland 26. Latvia12. Iceland 27. Korea13. Finland 28. South Africa14 Sweden 29. Israel15. Lithuania 30. Spain
Source: The World Bank, Doing Business in 2006, Washington 2006, pg.. 3In the same rankings Croatia was rated (un)justifi ably low, at number 118.4 At
the same time, Serbia and Montenegro was ranked 92nd, Ukraine 124th, Slovenia 63rd and Hungary 52nd.
The results that have been achieved by the continuation of these reform activities are evident from data on the export of goods and services from this group of countries to the markets of industrially developed countries, to the EU and to North America. Chart 1: Shore of Success
Source: The Economist, December 3rd, 2005, Special report: Outsourcing in Eastern Europe, pg. 70
4 The data regarding activities undertaken in Croatia after January 2005, when analysis of the collected data was fi nished, give hope for a better position in the next evaluation period.

Mladen Vedri{18
In the period from 1994 to 2004 the exports of 10 transition countries, 8 of which became EU members but including Romania and Bulgaria, increased by more than four times -- from just under 50 billion Euros to more than 200 billion Euros. Moreover, in the last two years the Czech Republic, Hungary and Poland have individually achieved a value of exports equal to or greater than all of the transition countries combined in a single decade. This means that green fi eld investments and new technology have created new markets and new products and services.
Croatia, (un)accidentally omitted from this overview, reduced the shareof its exports to the EU from 1994 until now. Income on the basis of services, which in the Croatian context means tourism, has grown.5
The position of Croatia in the markets of the EU compared to the countries of Central and Eastern Europe are characterized in the following table.
Table 3: Market Share in the European Union
COUNTRY/REGIONYear
1993 2000CROATIA 0,34% 0,19%CENTRAL & EASTERN EUROPE 4,80% 8,10%
Source: Galinec, Jurlin, Lenardić: IMO - The Competitiveness of Croatian Exports to the EU, 2002.
In the period from 1993 until 2000 the share of the Central and Eastern European countries in the EU market doubled. Croatia’s share dropped by one-half.6
A further consequence of the absence for more than a decade of signifi cant investment, either foreign or domestic, has led to the fact that the structure of Croatian exports is outdated, that is, it is dominated by products that were exported even before 1990. The entry of new products as exports has been marginal. The state of such a structure and technological backwardness is also apparent from a comaparative review of the share of unfi nished products to the EU 25.
5 With regard to its sensitivity, vulnerability, outdated tourist offerings, and the current very short tourist season, this is not an area where continued growth can be expected without new investment, new technology and new attractions.
6 A mild tendency to remedy these shortcomings has been noted in the period 2001- 2004

THE CROATIAN ECONOMY AND ITS ABILITY TO ATTRACT NEW FOREIGN... 19
Chart 2: Share of Complex Products Products in EU 25 exports, 2003
19%
7%
8%
9%
9%
7%
11%
9%
5%
6%
12%
1%
10%
32%
21%
12%
24%
13%
6%
6%
1%
3%
60%
57%
20%
28%
35%
19%
29%
20%
17%
14%
8%
9% 21% 20% 7% 7%
0% 10% 20% 30% 40% 50% 60% 70% 80% 90% 100%
IRSKA
MAĐARSKA
SLOVAČKA
SLOVENIJA
AUSTRIJA
PORTUGAL
ITALIJA
HRVATSKA
RUMUNJSKA
BUGARSKA
SRBIJA I C.G.
FOOD, BEVERAGES AND TABACCO RAW MATERIALS AND HALF-PRODUCTS
TEXTILE, LEATHER AND FOOTWEAR METALS
DIFFERENT FINAL PRODUCTS CHEMICALS
VEHICULES MACHINES, EL. MACHINES
Source: “Annual Report on Croatian Competitiveness 2004”, National Competitiveness Council, 2005, based on Eurostat COMTEXT, 2004

Mladen Vedri{20
II. The Republic of Croatia – Achievements and limits;needs and assumptions
1. Achievements To Date
In the period from 1993 until the quarter of 2005 the value of investments in Croatia were as follows.
Chart 3: The Level of FDI and Green Field Investment + Joint Investments, 1993 – 1st Quarter of 2005
0
500
1.000
1.500
2.000
1993
.
1994
.
1995
.
1996
.
1997
.
1998
.
1999
.
2000
.
2001
.
2002
.
2003
.
2004
.
H1
2005
.
mn.
US
D
FDI "Greenfield" i Joint Venture
Source: RBA analysis based on data from the Croatian National Bank (HNB) 2005.
It is apparent that throughout the entire period brown fi eld investments predominated. Based on the level and importance of investments a stronger tendency began in 1998, the year of the fi nal liberation of Croatian territory. This growth trend lasted until 2003, when investment levels began to fall to those of 1999/2000. It is interesting from a research standpoint to consider the areas in which these investments were realized.
THE CROATIAN ECONOMY AND ITS ABILITY TO ATTRACT NEW FOREIGN... 21
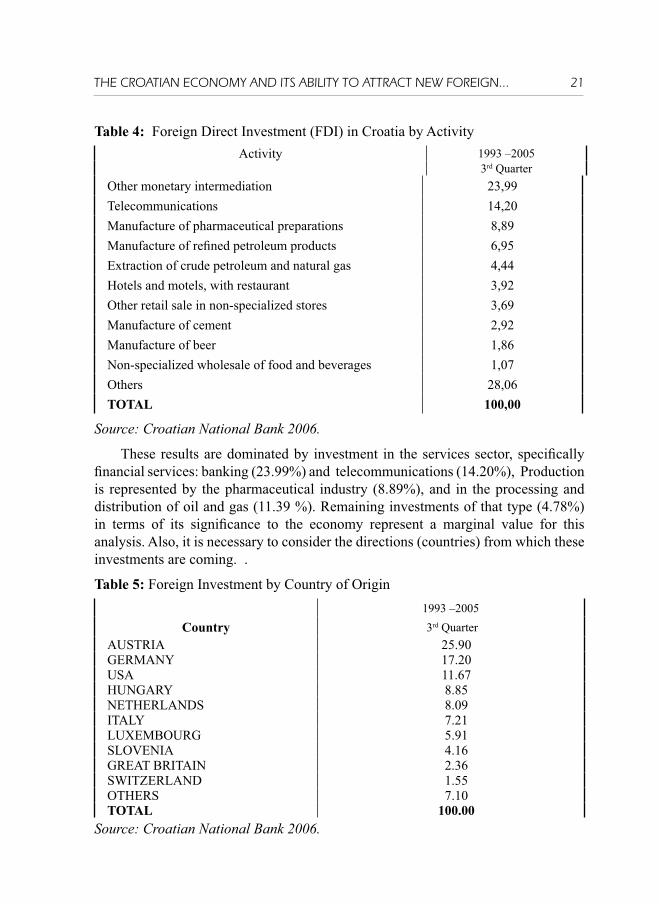
Table 4: Foreign Direct Investment (FDI) in Croatia by Activity Activity 1993 –2005
3rd QuarterOther monetary intermediation 23,99Telecommunications 14,20Manufacture of pharmaceutical preparations 8,89Manufacture of refi ned petroleum products 6,95Extraction of crude petroleum and natural gas 4,44Hotels and motels, with restaurant 3,92Other retail sale in non-specialized stores 3,69Manufacture of cement 2,92Manufacture of beer 1,86Non-specialized wholesale of food and beverages 1,07Others 28,06TOTAL 100,00
Source: Croatian National Bank 2006.
These results are dominated by investment in the services sector, specifi cally fi nancial services: banking (23.99%) and telecommunications (14.20%), Production is represented by the pharmaceutical industry (8.89%), and in the processing and distribution of oil and gas (11.39 %). Remaining investments of that type (4.78%) in terms of its signifi cance to the economy represent a marginal value for this analysis. Also, it is necessary to consider the directions (countries) from which these investments are coming. .
Table 5: Foreign Investment by Country of Origin 1993 –2005
Country 3rd QuarterAUSTRIA 25.90 GERMANY 17.20 USA 11.67 HUNGARY 8.85 NETHERLANDS 8.09 ITALY 7.21 LUXEMBOURG 5.91 SLOVENIA 4.16 GREAT BRITAIN 2.36 SWITZERLAND 1.55 OTHERS 7.10 TOTAL 100.00
Source: Croatian National Bank 2006.

Mladen Vedri{22
The highest percentage of investment comes from Austria (25.9 %), followed by Germany (17.2 %), the USA (11.67 %) and Hungary (8.85 %). Other signifi cant investments come from the Netherlands (8.09 %), Luxembourg (5.91 %), Italy (7.21 %) and Slovenia (4,16 %). These eight countries together represent 88.99% of the capital investment in Croatia. With regard to this dominance, and with the exception of the USA (through investment funds to Pliva), it can be expected that these companies will more quickly and easily adapt themselves to Croatia’s efforts to integrate into the EU.
2. Limitations on Current and Future Investment
The level of foreign investment in Croatia began to rise only in 1998, which is the result of the war and political and economic turbulence that earlier affected this area. This meant that the fi rst wave of signifi cant investment by the EU and other countries in the transition countries bypassed Croatia.
Table 6: Levels of Foreign Direct Investment in Transition Countries of Central and Eastern Europe, 1990-1998, Inward FDI stock per capita in EUR
COUNTRY 1998 1999 2000 2001 2002 2003 2004
Czech Republic 1191 1701 2272 3010 3615 3511 4052
Hungary 1732 2254 2410 3051 3409 3787 4381
Poland 497 671 952 1208 1207 1148 1310
Slovakia 457 588 946 1176 1522 1767 2043
Slovenia 1198 1346 1563 1481 1989 2539 2757
Estonia 1131 1789 2080 2625 2975 3820 5187
Latvia 552 748 948 1129 1149 1136 1430
Lithuania 391 584 720 870 1103 1151 1369
Croatia 360 564 861 1081 1493 1887 2150
Source: WIIW 2006
In the period since 1998 a signifi cant quantitative shortfall is evident when comparing Croatia to the other transition countries. That discrepancy has signifi cantly decreased since 2004. In terms of the absolute value of investment Croatia is equal to Slovakia and has nearly reached the level of Slovenia. Croatia still lags behind Estonia, the Czech Republic, and Hungary, while in comparison to the other transition countries it has achieved quantitatively better results.
However, a signifi cant structural problem remains: the dominance of brown fi eld investment with the total number of investments. And this is an essential difference

THE CROATIAN ECONOMY AND ITS ABILITY TO ATTRACT NEW FOREIGN... 23
in relation to the group of leading countries, Estonia, Hungary, the Czech Republic and Slovakia.
Therefore, it is essential to see what are the current obstacles for further investment in Croatia. Quantitiatively - the level of investment, but even more importantly structural: why is green fi eld investment lagging behind in areas where signifi cant added value can be achieved: electronics, pharmaceuticals, the congress and tourism industries. In order to evaluate the existing situation, we can use data and indicators from the rankings of global competitiveness.
Table 7: Growth Competitiveness Index
Finland 1USA 2Sweden 3Denmark 4Taiwan 5Singapore 6Iceland 7Switzerland 8Norway 9Australia 10................
Estonia 20Slovenia 32Czech Republic 38Hungary 39Slovakia 41Poland 51................Bulgaria 58Croatia 62Romania 67................
Estonia 20Slovenia 32Czech Republic 38Hungary 39
Serbia Montenegro 80Macedonia 85Bosnia Hercegovina 95Albania 100Chad 117
Source: “Global Competitiveness Report 2005-2006”, World Economic Forum, 2005.
Measured by the Index, Croatia is considerably lagging behind the group of leading transition countries (Estonia, Slovenia, the Czech Republic, Hungary). At the same time, it is behind those countries which began the process of change later (Slovakia), or which were burdened by a series of structural problems (Poland), or which were perceived until recently as among those that lagged behind Croatia (Bulgaria).

Mladen Vedri{24
3. Needs - Necessary Assumptions
Following the situation, results and the existing limitations, it is necessary in this section in the sphere of economic policy to make essential and radical alterations. The quality of the achievements of the most recent period can be read also from the following statements:7
“The exclusion of foreign investors, at least in the fi rst half of the 1990s, prevented the growth of demand for companies. It also prevented the infl ux of fresh capital, and the knowledge and experience of those investors. Foreign direct investment (FDI) that reach the country was linked for the most part to large privatization schemes. By the end of 2002, most FDI (61%) went to the service sector. However, FDI did not increase Croatian exports since the companies that received it only represented 16% of the export market (Vidović i Gligorov, 1004:13,15). Nevertheless, the consolidation and progress of the domestic banking sector is a consequence of FDI (Jermić i Vujčić).
During the transition period, Croatia was unsuccessful in changing the structure of its foreign trade, which was dominated by raw materials and labor intensive products (Kušić i Cvijanović, 2003.). The low technological level of Croatia’s foreign trade, along with high cost of labor and inputs, resulted in a decline of Croatia’s share of industrial production on EU markets from 0.42% in 1995 to 0.29% in 2002 (Vidović i Grligorov, 2004.). Exports stagnated, but imports grew, which led to a further weakening of competition on domestic markets
Developmental needs are undeniable; potential and possibilities are present, but as has been seen, until now both have been inadequately and insuffi ciently achieved. Economic theory defi nes where the initial and essential determinants are for such (un)success.8
“First, it is clear that development involves a lot more than economic growth and that variations in economic growth refl ect more than underlying variations in industrial growth ....
Second, a central concern with an economic role of the state in development really demands no justifi cation. It is more than an idiosyncratic assertion to hold that states are an important economic actors in developing countries and thus worthy of scholarly interest -- even if the rates of economic growth refl ect a host of other factors. In this regard one can note numerous that infl uence a given country’s
7 Izvor: Račić, D., Cvijanović, V.: “Privatization in Croatia: Initial Conditions, Processes and Implications,” Croatia on the Road to the European Union, Economic Institute of Zagreb, Zagreb, 2004.
8 Kohli, A.: «State-Directed Development», Cambridge University Press, Cambridge 2004, pgs. 2/3

THE CROATIAN ECONOMY AND ITS ABILITY TO ATTRACT NEW FOREIGN... 25
economic performance over a specifi cc period, including world economic conditions, resource endowments, differing starting points, demographic factors, national price regimes, patterns of savings, levels of technology entrepeneurship. For their part, however, historians of economic processes repeatedly emphasize the signifi cance of institutions, especially the role of government. (Emphasis mine). Lloyd Reynolds, for example, concluded his major study of economic growth in the “Third World” by observing that the analysis of underliying economic factors does not fully reveal the “mystery” of “sources of sustained growth”. What is missing from the economic models, according to him, “can be labeled political. Government matters.” W. Arthur Lewis similarly noted in a presidential address to the American Economic Association that one building block of any full understanding the “engine of growth” would be a “theory of government, where government would appear to be as much the problem as the solution.”
Countries that have respected the necessary rules of the game have been exceptionally successful in development. But, they made considerable efforts in the direction of institutional-organizational solutions:9
• The Austrian Business Agency (ABA) is a government-owned consulting fi rm that offers comprehensive and unbureaucratic know-how, services and advice ranging from incentives to market opportunities to tax concerns. All these services are completely free of charge. Twenty highly qualifi ed and experienced professionals who have all information from Austria as a business location to specifi c information business sectors, development possibilities, and political and economic conditions are at the disposal of potential investors. After the completion of an investment project, ABA remains available as a resource for possible further investment opportunites. ABA has offi ces in New York and Tokyo and has links to the Austrian Chamber of Commerce represenatives.10
• The Invest in France Agency is the French government agency for international investors. The mission of the agency is to help clients fi nd the most profi table and competitive solution in France for their business in the Eurozone. In addition to access to fi nancial and fi scal incentives, the services of the Agency include key industry contacts, site selection studies and regluatory information, as well as assistance in identifying potential partners and acquisition opportunities. According to the Agency, the top seven reasons for investing
9 Here it is extremely valuable to analyze the experience of Austria, which has been exceptionally successful in investment activities in the region (Hungary, Croatia, Slovakia), but which has also had respectable results in attracting investment capital to Austria itself. The elements and effects of this model confi rm the theoretical fi ndings of A. Kohli: State-Directed Development.
10 www.aba.gv.at

Mladen Vedri{26
in France are: the country's location at the heart of the world's largest market; economic power; among the top four FDI destinations; a quality location for businesses and entrepeneurs; a prime site for innovation and R&D; a highly skilled and productive labor force; a business-friendly environment. The website of the Agency contains detailed case studies of foreign investments and testimonials of foreign entrepeneurs who have had positive experiences with the Agency.11
• The Czech Investment and Business Development Agency (CzechInvest) is considered one of the most successful investment promotion agencies in the world. Established by the Ministry of Industry and Commerce in 1992, the CzechInvest helps to attract foreign capital and to assist in the development of Czech companies. Its Mission is to provide support to investments activities at the highest level of expertise, and not only through information services and advice but also through links to European structural funds. The Agency provides comprehensive support to investors (full infomration assistance handling of investment incentives, business property identifi cation, supplier identifi cation, aftercare services, business infrastructure development and access to stuctural funds. All services are free of charge.12
• In the last few years Slovakia has attracted exceptionally important green fi eld investments, primarily through the work of the Slovak Investment and Trade Agency (SARIO), which promotes the investment climate in Slovakia and the opportunities that the country offers. In addition, its also promotes investment projects and incentives for foreign investors, potential and current locations for industrial zones and parks, and the creation of export strategies for Slovak companies looking to enter foreign markets. The Agency assists in implementing green fi eld projects, helps Slovak companies to establish joint ventures with foreign companies, assists foreign partners in acquiring Slovak companies, assists investors from the initial investigation of the business environment to the successful completion of the investment project, helps clients in the search for the best locations, real estate, and subcontractors, and provides partners with assistance in applying for investment incentives, tax reductions and other types of support.13
It is also interesting to consider one other new and expanding area of FDI, offshoring, and not only as an direct opportunity for investment, but more because of the general value of this model – in order to conclude what is important from the perspective of foreign investors.
11 www.investinfrance.org 12 www.czechinvest.org 13 www.sario.sk

THE CROATIAN ECONOMY AND ITS ABILITY TO ATTRACT NEW FOREIGN... 27
Table 9: More than just one measureNational strengths and weaknesses in criteria for offshoring location on scale of 1 to 5* (1= most attractive; 5 = least attractive)
Country
Tota
l Cos
t**
Vend
or
Lan
dsca
pe
Acc
ess t
o M
arke
t***
Ris
k Pr
ofi le
Bus
ines
s E
nvir
onm
ent
Qua
lity
of
Infr
astr
uctu
re
Philippines 1.4 4.5 3.5 3.8 3.7 2.8India 1.5 2.2 3.5 2.7 3.6 3.3Malaysia 1.7 4.7 3.3 2.2 3.4 2.5China 1.8 3.7 1.8 3.4 3.6 2.5Brazil 2.2 3.5 4.2 2.8 3.0 2.0Mexico 2.2 4.7 2.8 3.5 2.8 2.0Czech Rep. 2.6 4.7 3.5 2.2 3.0 3.0Hungary 2.6 4.7 3.3 2.3 2.8 2.8Poland 2.7 4.0 3.3 2.7 3.1 3.0Russia 3.0 4.5 2.8 3.5 3.3 3.3
* From US company’s point of view** Including corporate taxes, labor costs and infrastructure*** Including domestic markets of individual countries and access to nearby countriesSource: McKinsey Quarterly 2005., No. 4, Washington, pg. 14.
When this multiple depiction of essential points of evaluation is weighted, the reality is as follows: Chart 4 : A good choiceAttractiveness of Location for Offshoring on scale of 1 to 5 (1 – most attractive, 5 – least attractive)
2,00
2,00
2,10
2,20
2,30
2,40
2,60
2,60
2,80
3,10
0,00 0,50 1,00 1,50 2,00 2,50 3,00 3,50
India
Malaysia
Philippines
China
Brazil
Mexico
Hungary
Czech Rep.
Poland
Russia
The Cost Location Index expressed in parameters necessary for a US company/investorSource: McKinsey Quarterly 2005., No. 4, Washington ,pg. 15

Mladen Vedri{28
The weighting of components is performed in the following way: Total Cost 70, Vendor Landscape 0, Access to market 0, Risk profi le 10, Environment 10, Quality of infrastructure 10.
For this analysis, the system of valuation for this type of investment requires awareness that among the fi rst ten locations only three countries are in the transition group of Croatia: Hungary, the Czech Republic and Poland. This means that it is possible to create national conditions for the attractiveness of one’s own business environment and in the ever more demanding global environment. That success has been achieve by the concept of the so-called third generation policy, which involves selectively targeting investors at the industry or cluster level, and which also involves active support and cooperation with investors in the development of their projects and in raising competitiveness. 14
Conclusions
1) In the last two years Croatia has succeeded in the economic sphere to: a) begin negotiations with the EU on full membership, now expected in 2009/2010; b) reduce, but not yet halt the galloping growth of the foreign debt as well as the public debt.
In the same period, and with accession to full EU membership, the group of successful transition countries have succeeded in attracting new investors from the former EU 15 in the process of moving to a logistically closer area with considerably more attractive in terms of costs (the price of labor, taxes, various incentives and support to new investors). Here the third generation policy, which involves the selective targeting of and incentives to investors is becoming all the more apparent. At the same time, a third wave of investment in now underway. The fi rst wave began at the beginning of the 1990s and the second one near the end of the decade. This newest wave is prompted by new global pressures for the developed countries of Europe to raise their competitiveness. In the meantime, the fi rst and second waves have moved from the neighboring transition countries to the Far East, in particular to China.
2) The quantitative and qualitative results achieved in foreign investment until now in general have corresponded to events and priorities at the national
14 Source: An opinion for establishing an umbrella organizationto support “Enterprise Croatia,” expressed in documents of the National Competitiveness Council, 2004. Stimulation of global foreign investment has gone through several phases. Many of the countries under consideration are still applying a fi rst generation policy of stimulating foreign investment, comprised of a liberalization of foreign investment and a reduction of obstacles to investors. More progressive countries are now using a second generation policy, which includes active marketing of their countries as business locations and the establishment of national agencies for the promotion of foreign investment.

THE CROATIAN ECONOMY AND ITS ABILITY TO ATTRACT NEW FOREIGN... 29
level. But, it is the same also with institutional forms of support and with a proactive economic policy directed toward that area.
3) The national preference, evident in expert analyses but also in broad-based media research, and confi rmed by the decisions of voters speaks to an interest among a majority of the population for an accelaration on the pace of economic and social development to be the dominant area of activity and responsibility for the government. This turning point will not be easy or quickly achievable after more than a decade of perceptual and factual preoccupation with concerns of another kind: agression and war, internal political tensions, and a preoccupation of political elites with their own relations.
4) The time is now at hand for us to create a macroeconomic framework and an overall regulatory and implementation context (public administration: at the national and local levels) that will create the basis for considerably greater interest of foreign investors to invest in Croatia.
5) There also exists in Croatia a need for even greater free space for forming new organizations and at the same time a need for signifi cantly improving the quality of existing organizations responsible for attracting direct foreign investment. The examples provided by developed and transition countries point to a possible direction for activity. In this period, EU integration, along with the usual investment agencies, might be able to take advantage of the experience of CzechInvest, whose investment projects are linked to EU funds, or from the example of Austria, whose investment agency synergistically operates with a great number of Austrian commercial representative offi ces worldwide.
6) The elimination of those critical shortcomings noted in the rankings of global competitiveness then becomes the conditio sine qua non for an enduring and sustainable transformation. Those shortcomings exist not just in theory; they are are felt in the practical implementation of every foreign (but also domestic) investor that wishes to invest in Croatia. Keeping in mind the ever greater and stronger competitive environment, where today everyone competes against everyone else, it is necessary to recognize one’s strong points and to build on them a coherent strategy for attracting capital (primarily) for investment in areas where a greater degree of added value can be created. A glimpse at the experiences of individual countries or at the realization of individual projects demonstrates only some success in attracting investors, without guaranteeing that they will remain or that their integration into the domestic economy will be sustainable. Full integration is achieved only by means of cooperation with investors in professional training programs and in developing the potential of

Mladen Vedri{30
a newly employed workforce, as well as in building a system linking local suppliers and subcontractors capable of following the core business of the new investor.
7) The process of negotiating with drawing closer to the EU cannot and should not become an additional problem or limitation; to the contrary, it has to become a part of the solution. In fact, this process provides additional institutional security to potential investors.
8) The creation of several powerful clusters, in combination with foreign and domestic investors, in the areas of electronics, shipbuilding, wood products, food processing and the tourist industries -- both in the coastal and inland areas of the country can to a signifi cant extent contribute to a balancing of regional development and the employment of highly qualifi ed experts. At the same time, the reduction of defi cit of goods, today signifi cantly affects the foreign trade balance of the country.
In summary, working out a model of encouraging foreign investment, and its achievement in practice, is a win-win situation for the nation’s economy, if it can be created in a professional way and is sustainable. Alternatively, the sale of remaining assets in order to maintain social peace, and the servicing of outstanding debt, is only a short-term solution and “buying time”. We would still have to come back to this solution again, but under considerably less favorable conditions; economic, social, and political. Objectively, it would be a question of compensating for lost time; subjectively, it would be one of again motivating people to once again accept a new beginning.
LiteratureKohli, A.: “State-Directed Development,” Cambridge University Press, Cambridge 2004Friedman, T. L.: “Lexus and Olives – Understanding Globalization,” Izvori, Zagreb, 2003.Znanstveni skup: “The Croatian Economic Crisis and the Turnaround from Recession in Economic Development,” Ekonomija/Economics, RIFIN, Year 8 Number 1, Zagreb, May 2001.Collected Scholarly Papers: “Croatia at the Door of the EU - Fiscal Aspects,” Croatian Academy of Science and Arts (HAZU), Zagreb, 8 November 2005Joseph E. Stiglitz: “Globalization and the Challenge of Uncertainty,”, Algoritam, Zagreb, 2004Radošević, S., Sachwald, F.: Does Enlargement Conceal Globalisation? Location

THE CROATIAN ECONOMY AND ITS ABILITY TO ATTRACT NEW FOREIGN... 31
Issues in Europe, French Institute for International Relations (www.ifri.org), Paris, 2005Croatian Competitveness Initiative: «The Competitiveness of Croatian Exports to the EU», IMO, Zagreb, June 21, 2002Račić, D., Cvijanović, V.: Privatization in Croatia: Initial Conditions, Processes and Implications,” Croatia on the Road to the European Union, Economic Institute of Zagreb, Zagreb, 2004.Beshouri, C.P,; Farrel, D, Umezawa, F.: “Attracting More Offshoring to the Philippines», McKinsey Quarterly, New York, 2005, No. 4 UN Conference on Trade and Development: “World Investment Report 2005, Transnational Corporations and the Internationalization of R&D”, Overview, UN, New York and Geneva, 2005World Economic Outlook, International Monetary Fund, Washington, September 2005“Report on Global Competitiveness 2005-2006,” World Economic Forum, 2005 WIIW Research Reports / 321: Employment Effects of Foreign Direct Investment in Central and Eastern Europe (Hunya, G. – Geishecker, I.), Vienna, August 2005OECD Investment Committee: «Promoting Investment for Growth and Sustainable Development Worldwide», www.oecd.org/investment/, 2005The Economist, December 3rd, 2005, page 70Institute for World Economics, Hungarian Academy of Sciences, Working Paper, Budapest, April 1994RBA Analyses, Raiffeisen Research, October 2005International Trade Centre UNCTAD/GATT: Monograph on the Role and Organization of Trade Promotion, Geneva 1986Investing in Austria, Vienna, 5th Edition 2003.Starting a Business in Austria, Austrian Business Agency, October 2004Austria – WhereYour Profi ts Climb to the Top, Austrian Business Agency, Vienna, April 2005Polish Information and Foreign Policy Investment Agency, www.paiz.gov.plwww.wiiw.ac.atwww.atkearney.comwww.aba.gv.at www.investinfrance.org www.czechinvest.org Lisbon, Competitiveness – Growth and Jobs, www.theepc.be, 2006

Dirk Wentzel32
ZUR BEGRENZUNG DER STAATSVERSCHULDUNGNACH DEM SCHEITERN DES STABILITÄTSPAKTES1
Prof. Dr. Dirk WentzelHochschule Pforzheim
1. Die Sachlage: Staatliche Verschuldung als alte und neue ordnungspolitische Herausforderung
Seit der Begründung der Volkswirtschaftslehre als eigenständige Wissenschaft sind die Probleme staatlicher Überschuldung und die hieraus erwachsenden nachteiligen Konsequenzen für die Wirtschaftsordnung klar erkannt. Schon bei Adam Smith (1789/1990, S. 803) ist nachzulesen: „Dort, wo die öffentliche Schuld einmal eine bestimmte Höhe überschritten hat, ist es meines Wissens kaum gelungen, sie auf gerechte Weise und vollständig zurückzuzahlen. Sofern es überhaupt gelang, die Staatsfi nanzen wieder einigermaßen in Ordnung zu bringen, bediente man sich stets dazu des Bankrotts, den man bisweilen auch unverhohlen zugegeben hat.“ Auch das Wagnersche Gesetz der „wachsenden Staatstätigkeit“ ist jedem Studierenden der Volkswirtschaft seit mehr als hundert Jahren bekannt: Wann Überschuldung vorliegt, ist theoretisch und statistisch umstritten. Gleichwohl ist zu befürchten, daß ein Prozeß ständiger Neuverschuldung schließlich in den Staatsbankrott führen wird mit verheerenden volkswirtschaftlichen Konsequenzen. Staaten mögen zwar juristisch konkursunfähig sein; de facto sieht das anders aus, wie geschichtliche Beispiele staatlicher Zahlungsverpfl ichtungen und Gläubigerenteignungen durch Währungsschnitte zeigen. Wenn, so ist zu befürchten, nicht eine glaubwürdige Rückführung staatlicher Überschuldung gelingt, werden zahlreiche EU-Staaten schon in mittlerer Frist in Situationen geraten, die der Zahlungsunfähigkeit gleichkommen. Der zunehmende politische Druck auf die Unabhängigkeit der EZB ist ein untrügliches Zeichen hierfür. Durch die Zahlungsschwierigkeiten der großen Länder könnte sogar die Währungsunion selbst in Gefahr geraten.
In der Nachkriegsordnung der Bundesrepublik Deutschland war die Staatsverschuldung anfänglich wirksam begrenzt. Die Alliierte Gesetzgebung unter amerikanischer Führung verbot aufgrund der speziellen deutschen Erfahrungen mit staatlichen Schulden und Währungsverfall ausdrücklich eine staatliche Überschuldung in § 28 des Umstellungsgesetzes2. Für den Fall einer Zuwiderhandlung behielten
1 Ich danke Rainer Gildeggen, Hannelore Hamel und Alfred Schüller für hilfreiche Anmerkungen und Kommentare.
2 Der vollständige Wortlaut des § 28 des Umstellungsgesetzes („Verbot von Haushaltsdefi ziten“) lautet:

ZUR BEGRENZUNG DER STAATSVERSCHULDUNG NACH DEM SCHEITERN... 33
sich die Alliierten sogar ein unmittelbares Eingriffsrecht in Haushaltsbelange vor. Das „Wirtschaftswunder“ wurde trotz der extrem schwierigen Ausgangslage weitgehend schuldenfrei erreicht. Mit der ordnungspolitischen Neuorientierung in den späten sechziger Jahren hin zu einer keynesianisch ausgerichteten antizyklischen Globalsteuerung wurde jedoch auch der Zwang zum ausgeglichenen Haushalt aufgegeben; die Aufnahme von Schulden zu konjunkturpolitischen Zwecken wurde salonfähig. Es kam zu einer „Infl ation ungedeckter Rechte“ (Willgerodt 2005) in allen Bereichen der sozialen Sicherungssysteme, die sich größter Beliebtheit bei den politisch Verantwortlichen erfreuen konnte. Da viele damals begründete soziale Ansprüche unmittelbar budgetwirksam sind – etwa die Beiträge des Staates zur Arbeitslosen- und Rentenversicherung – wirken sie heute in besonderer Weise schuldentreibend.
Staatsverschuldung ist jedoch nicht nur ein deutsches Problem, sondern fi ndet sich in verschiedenen Ausprägungen auch in Europa und anderen Teilen der Welt wieder (siehe Wentzel 2005; Eurostat vom 18. März 2005). Die jüngsten Währungskrisen in Lateinamerika gehen ebenfalls alle mit akuten Haushaltsproblemen Hand in Hand. Der Anstieg der Verschuldung der öffentlichen Haushalte in Deutschland und in Europa verläuft parallel zum Erlahmen des wirtschaftlichen Wachstums, zum Anstieg der Steuerlast sowie zur Erhöhung der Staatsquote: In der Eurozone beläuft sich die kumulierte Staatsschuld auf 71,3% des BIP (vgl. Eurostat, ebenda). Die Konzeption der antizyklischen Globalsteuerung hat den empirischen Bewährungstest nicht bestanden: Vielmehr haben die Interessengruppen diesen Handlungsspielraum zur Durchsetzung eigener Verteilungsforderungen zu Lasten nachwachsender Generationen mißbraucht. Die unmittelbare Konsequenz ist eine nachhaltige Wachstumsschwäche der „alten EU-Staaten“ in Verbindung mit einer zunehmend verfestigten Arbeitslosigkeit. Die durchschnittliche Wachstumsquote der EU 25 liegt unter 2 Prozent, die Arbeitslosigkeit tendiert im Durchschnitt gegen 10 Prozent. Der Anspruch der sog. „Strategie von Lissabon“, die EU wolle bis 2010 zur führenden Wirtschaftsregion der Welt aufsteigen, und die wirtschaftspolitische Realität der EU stehen im krassen Mißverhältnis.
Mit der Hinwendung zu einer schuldengeneigten staatlichen Konjunkturpolitik seit den 60er Jahren hat auch die wissenschaftliche Auseinandersetzung mit diesem Thema wieder zugenommen (Wentzel 1997; Heinemann 1994; Barro 1979). Vor allem in den Arbeiten von Buchanan und Wagner (1967 und 1977) sind die Gründe für Staatsverschuldung in beachtlicher Klarheit erkannt: Der Versuchung der Politiker, Geld ausgeben zu können, ohne die Bürger aktuell mit Steuern zu
„Die Ausgaben der öffentlichen Hand müssen durch laufende Einnahmen gedeckt sein. Die Beschaffung von Mitteln im Kreditwege ist nur im Vorgriff auf künftige Einnahmen zulässig. Die Militärregierung behält sich vor, in Haushaltsangelegenheiten einzugreifen, wenn die Aufrechterhaltung dieser Grundsätze gefährdet ist.“

Dirk Wentzel34
belasten („to spend without to tax“), kann in einer modernen Demokratie mit starkem Medieneinfl uß praktisch nicht widerstanden werden. Die von Ökonomen häufi g beklagte „Durchbrechung des Äquivalenzprinzips“ kommt manchem Politiker sogar sehr gelegen (vgl. Willgerodt 2005), weil es die politische Einfl ußmöglichkeit zu mehr Verschuldung vergrößert.
Auch unter deutschen Ökonomen und Staatsrechtlern wird die Diskussion über die Staatsverschuldung in wiederkehrenden Zeitabständen geführt. Guy Kirsch stellte schon 1983 treffend fest, daß bei der Entwicklung der öffentlichen Haushalte „nach dem Rausch der Katzenjammer“ eingetreten sei. Von Weizsäcker (1992) sah in der Staatsverschuldung ebenfalls langfristig eine Gefährdung für demokratisch verfaßte Gemeinwesen. Auch das Bundesverfassungsgericht mußte sich mehrfach mit der Frage der Verfassungskonformität staatlicher Verschuldung befassen und kam zu dem Urteil, daß staatliche Kreditaufnahme nur unter Wahrung der „goldenen Regel“ zulässig sei. Diese besagt, daß staatliche Einnahmen aus Krediten die im Haushalt veranschlagten Investitionsausgaben nicht überschreiten dürfen: Hierdurch wird Verschuldung zu konsumtiven Zwecken verboten. Gleichwohl hatte das Urteil des Verfassungsgerichts wenig Einfl uß auf die Politik (siehe auch Lappin 1994; Kirchhoff 2002). Die Struktur der Staatsverschuldung hat sich zudem seit den 80er Jahren dramatisch verändert. Während am Beginn der antizyklischen Fiskalpolitik noch Investitionen in Schulen, Verkehrswege und Bildungseinrichtungen dominierten, steht die Bedienung der bestehenden Zinslast heute an vorderster Stelle. Die sog. „Schuldenfalle“ hat Deutschland trotz einer aktuellen Nettokreditaufnahme von ca. 70 Mrd. Euro (3,2% des BIP) bereits voll getroffen.
Mit dem Vertrag von Maastricht 1992 bekam das Thema der wirksamen Schuldenbegrenzung erstmalig eine europäische Dimension. Hieran waren große Hoffnungen geknüpft. Denn was auf nationaler Ebene nicht möglich schien, sollte nunmehr durch die Einhaltung und Überprüfung gemeinsamer „Konvergenzkriterien“ gesichert und der Gesamtschuldenstand auf maximal 60 Prozent des BIP begrenzt werden. In konjunkturpolitisch „normalen“ Zeiten sollte der Haushalt ausgeglichen sein. Lediglich für Krisenzeiten war eine Nettokreditaufnahme in Höhe von 3 Prozent des BIP zulässig. Die Konvergenzkriterien und die zumindest anfänglich noch glaubwürdige Drohung, Stabilitätssünder tatsächlich von der Teilnahme an der Währungsunion auszuschließen, zeigten Wirkung. Seit 1997 sollte zudem der vom damaligen deutschen Finanzminister Theo Waigel ins Leben gerufene Stabilitätspakt die Dauerhaftigkeit der Stabilisierungsbemühungen garantieren. Tatsächlich sind die 90er Jahre eine Phase wirtschaftlicher Konsolidierung und der zeitweiligen Begrenzung staatlicher Neuverschuldung3.
3 Allerdings waren die 90er Jahre eine wirtschaftspolitische „Schönwetterperiode“ mit Internet-Boom, Sonderkonjunktur nach dem Fall des eisernen Vorhangs und der sog. Friedensdividende. Zur Diskussion der Gründe für die Konsolidierung siehe Wentzel 2005.

ZUR BEGRENZUNG DER STAATSVERSCHULDUNG NACH DEM SCHEITERN... 35
Mit dem Beginn der Währungsunion zum 1. Januar 1999 und der Aufnahme mehrerer Länder in die Eurozone, die nachweislich gegen die Stabilitätsaufl agen verstoßen haben, ist der Ankündigungseffekt jedoch beendet. Man kann gleichsam von einem „Olympia-Syndrom“ sprechen: Alle Euroländer bemühten sich zum Stichtag um eine angemessene Form, aber nach dem Erreichen der Eurozone haben die Bemühungen um fi skalische Solidität dramatisch nachgelassen (Wentzel 2005; Eurostat 2005). Als besonders problematisch erweist sich hierbei der Umstand, daß gerade mit Deutschland und Frankreich zwei der wirtschaftlich wichtigsten Länder vom Konvergenzpfad abgewichen sind und sich auch nicht glaubwürdig um einen Haushaltsausgleich bemühen. Dieses schlechte Vorbild hat, wie nicht anders zu erwarten war, gerade auch unter den neuen Beitrittsländern willige Nachahmer gefunden. Tschechien, einstmals Vorreiter unter den sog. Transformationsländern, hat zeitweilig zweistellige Neuverschuldungsquoten vorzuweisen. Den dortigen wirtschaftspolitisch Verantwortlichen fehlt jedoch die Rückendeckung für Reformen, die zu mehr Stabilität führen könnten: Warum, so lautet nicht zu Unrecht die öffentliche Meinung in diesen Ländern, sollen denn ausgerechnet die kleinen und die „neuen Europäer“ zu strenger fi skalpolitischer Disziplin erzogen werden, wenn doch auch die großen „alten“ Europäer von der Haushaltsdisziplin Abschied genommen haben?
Mit der sog. „Flexibilisierung“ des Stabilitätspaktes, die Anfang 2005 vom Europäischen Rat beschlossen wurde, ist jede Begrenzung staatlicher Überschuldung aufgehoben. Mit der Aufl ockerung der 3%-Regel und der Berücksichtigung von Sonderfaktoren sollen die Länder wieder mehr fi nanzpolitischen Spielraum erhalten. Deutschland beispielsweise als größter Netto-Zahler der EU kann sowohl seine EU-Beiträge aus den Defi zitgrenzen herausrechnen ebenso wie die Sonderlasten der deutschen Einheit. Verschiedene Berechnungen zeigen, daß für Deutschland insgesamt eine Nettokreditaufnahme von annähernd 10 Prozent des BIP noch zulässig sein könnte (vgl. Wentzel 2005). Die Bereitschaft, den Haushalt glaubwürdig zu konsolidieren, dürfte noch weiter nachlassen.
Damit schließt sich argumentativ der Kreis. Die Fragestellung der 80er und frühen 90er Jahre ist wieder aktuell: Wenn der Stabilitätspakt de facto gescheitert ist und auch von der Europäischen Kommission und dem EUGH keine Durchsetzung der Konvergenzkriterien erwartet werden kann, muß der Ansatz zur Begrenzung staatlicher Überschuldung wieder auf nationaler Ebene gesucht werden. Aber wie, so stellt sich erneut die Frage, kann der staatlichen Überschuldung wirksam begegnet werden?
Dirk Wentzel36
2. Die medienökonomische Perspektive staatlicher Verschuldung
Staatliche Verschuldung zu rein konsumtiven Zwecken hat unbestreitbar nachteilige volkswirtschaftliche Konsequenzen dadurch, daß auf den Kapitalmärkten die Bedingungen für produktive private Investoren verschlechtert werden. Ebenso führt der Zins- und Zinseszinseffekt zunehmend zur Begrenzung staatlicher Handlungsmöglichkeiten in der Wirtschafts- und Gesellschaftspolitik. Der Posten Zinszahlungen steht im Bundeshaushalt bereits an zweiter Stelle, deutlich vor der Landesverteidigung und lange vor wichtigen Zukunftsinvestitionen, etwa im Forschungs- und Bildungsbereich. Gleichwohl liegen die wissenschaftliche Erkenntnis und die Bereitschaft der politischen Handlungsträger, danach zu handeln, weit auseinander. Entscheidend hierfür sind letztlich zwei Sachverhalte:
Erstens: Das Phänomen der Fiskal- bzw. der Schuldenillusion scheint in der Bevölkerung wesentlich stärker ausgeprägt zu sein, als dies in volkswirtschaftlichen Modellbetrachtungen mit vollständig rationalen Individuen angenommen wird. Die sog. „Ricardianische Äquivalenz“, nach der die Wirtschaftssubjekte rational erkennen, daß der heutigen Kreditnachfrage des Staates zukünftig höhere Steuern folgen werden, um die Schulden zu bedienen und später auch zurückzuzahlen, scheint empirisch nicht zu greifen. Staatsverschuldung ist zwar immer wieder ein Wahlkampfthema, aber die Wähler bringen es praktisch nie mit der eigenen Lebensführung in Verbindung4. Dies hängt auch mit einem Verlust an „intergenerativem Altruismus“ zusammen. Für immer mehr kinderlose Erwerbstätige ist die Verschiebung von Belastungen auf zukünftige Generationen im Sinne einer intergenerativen Lastenverteilung eine „fi rst best-option“, weil sie selbst in den Vorzug staatlicher Ausgaben und schuldenfi nanzierter Sozialleistungen kommen, die Rückzahlung jedoch auf nachwachsende Generationen verlagert wird, mit denen keine persönliche Bindung mehr besteht.
Zweitens: Das Thema Staatsverschuldung eignet sich nur begrenzt, um im Sinne einer Medienkampagne verwendet zu werden und Aufmerksamkeit zu erregen, denn das Thema widerspricht den Grundsätzen des Pressemarktes (hierzu Tietzel und Wentzel 2004): Staatsverschuldung als Thema ist nicht neu und auch nicht spektakulär; es erregt somit kaum spezifi sch zurechenbare Betroffenheit und Aufmerksamkeit5. Es ist selbst für interessierte Laien kaum vermittelbar, wie hoch die tatsächliche Staatsverschuldung ist. Doch wenn ein Thema nicht oder zumindest nur schwer in den Massenmedien darstellbar ist, dann wird es letztlich auch nicht
4 Zur Gewichtung und Wahrnehmung von Staatsverschuldung siehe das Demoskopische Jahrbuch (Allensbach 2002).
5 Lediglich die Endphase eines Staatsbankrotts kann dann aufgrund der Dramaturgie der Ereignisse mit großem Medieninteresse rechnen, wie zuletzt die Argentinien-Krise im Jahre 2002 gezeigt hat.

ZUR BEGRENZUNG DER STAATSVERSCHULDUNG NACH DEM SCHEITERN... 37
zu einer Verhaltensänderung der Politiker beitragen: In der modernen Gesellschaft fi nden Dinge in der Wahrnehmung der Öffentlichkeit nur statt, wenn die Medien darüber berichten (siehe Wentzel 1998; 2002).
Mögliche Reformvorschläge zur Eindämmung staatlicher Verschuldung müssen also die medienökonomische Komponente berücksichtigen und die Wahrnehmung in der Öffentlichkeit. Wenn der gescheiterte Stabilitätspakt eine einzige positive Langzeitwirkung hatte (und vielleicht zukünftig haben wird), dann ist es die Festlegung des 3-Prozent-Kriteriums. Zwar ist in der Fachwelt zu Recht umstritten, ob es wirklich genau drei Prozent sein müßten: Aber immerhin hat fi nanzielle Stabilität nunmehr ein wahrnehmbares Kriterium erhalten: Entweder die Regierung schafft die kritische Marke oder nicht. In den Abendnachrichten und in der Wirtschaftspresse ist dies zumindest für einen Tag im Jahr eine Topmeldung.
Nur vor dem medienökonomischen Hintergrund ist es verständlich, warum die gegenwärtigen Finanzminister sich im März 2005 so vehement um die Aufweichung oder „Flexibilisierung“ des Stabilitätspakts bemüht haben. Obwohl Frankreich und Deutschland mehrfach hintereinander den Pakt verletzt haben, mußten sie keine Konsequenzen fürchten, weil der Europäische Rat der Finanzminister (ECOFIN) das Defi zitverfahren aussetzte. Sie könnten also auch mit dem alten Verfahren leben, da es in der Realität ohne Wirkung war. Dennoch sorgt der verletzte Stabilitätspakt zumindest in der Öffentlichkeit für Aufmerksamkeit, führt zu kritischer Berichterstattung in den Medien und kostet politisches Ansehen. Es ging den Finanzministern de facto also darum, das 3 Prozent-Kriterium als Signal auszulöschen und damit die Beachtung, die es in den Medien schon gefunden hat.
Angesichts des gescheiterten Stabilitätspaktes erscheint es dringend notwendig, erneut über glaubwürdige ordnungspolitische Bindungen für staatliche Schuldenaufnahme nachzudenken. Dabei lassen sich gemäß der ökonomischen Theorie der Verfassung und aus medienökonomischem Blickwinkel verschiedene Kriterien formulieren, die bei einer möglichen verfassungsmäßigen Begrenzung der Staatsverschuldung zu berücksichtigen sind:
Erstens muß eine Regeländerung mit dem Ziel der Schuldenbegrenzung möglichst einfach und verständlich formuliert sein. Nur so besteht die Möglichkeit, eine Regel und deren Wirkung über die Medien der Öffentlichkeit vor Augen zu führen.
Zweitens müssen klare und nachvollziehbare Kriterien vorliegen, die eine grundsätzliche Regelbefolgung ermöglichen. Die Verfassungsergänzung muß auf eindeutigen Werten der Bevölkerung basieren.
Drittens muß die Entscheidung über mögliche Sanktionsmaßnahmen – einen alten Vorschlag der Deutschen Bundesbank aufgreifend (siehe Wentzel 2005)

Dirk Wentzel38
– möglichst automatisch erfolgen. Eine Regel, die beliebig politisch interpretiert werden kann, ist wenig hilfreich, um Stabilisierungsdruck zu erzeugen6.
3. Das Drei-Stufen-Konzept: Verbindung von institutionenökonomischen und medienökonomischen Aspekten
Der nach wie vor grundlegende und keineswegs neue Ansatz zur Begrenzung der Staatsverschuldung ist darin zu sehen, ein Überschuldungsverbot in der nationalen Verfassung zu verankern und ein glaubwürdiges und möglichst automatisches Sanktionsinstrument bei Regelverstößen zu entwickeln. Die Lehren aus dem gescheiterten Stabilitätspakt sind hierbei aufschlußreich. Das Überschuldungsverbot muß durch präzise Regelvorgaben und zugleich durch quantitative Grenzen ergänzt werden, um die Regierung präventiv zu disziplinieren. Wiederaufgenommen wird hier der Vorschlag für ein „Drei-Stufen-Konzept“ mit Bereichen unterschiedlicher fi skalpolitischer Handlungsfähigkeit des Staates (ausführlich Wentzel 1997). Es geht nicht um ein grundsätzliches Verbot von zeitweiliger Kreditaufnahme im Sinne der (ebenfalls wieder diskutierten) Null-Prozent-Regel. Der Staat soll durchaus Freiräume für die Finanzierung von Investitionen erhalten, gegebenenfalls auch über staatliche Kreditaufnahme zur Gewährleistung intergenerativer Gerechtigkeit und Lastenverteilung. Gleichzeitig sind aber Verschuldungsbarrieren mit abnehmenden staatlichen Freiheitsgraden vorgesehen und eine zunehmende Einbeziehung der Medien und der Öffentlichkeit.
Bekanntlich ist bei der Festlegung von Schuldenobergrenzen problematisch, daß es bis heute in der Finanzwissenschaft keine eindeutigen Erkenntnisse über einen maximal noch tragbaren staatlichen Verschuldungsgrad gibt (vgl. R. von Weizsäcker 1992). Es lassen sich empirisch keine eindeutigen Korrelationen zwischen der absoluten Höhe der Staatsverschuldung und der makroökonomischen Entwicklung beobachten. In der EU weisen Italien mit 105,8 Prozent des BIP und Griechenland mit 110,5 Prozent des BIP eine besonders hohe kumulierte Staatsschuld auf. Gleichwohl verschulden sich beide Länder nach wie vor jährlich weiter, ohne daß die Kapitalmärkte bereits eine spürbare Risikoprämie für Staatsanleihen aus diesen Ländern aufschlagen würden. Das griechische Defi zit in 2004 betrug 6,1 Prozent, das italienische 3,0 (siehe Eurostat, 18. März 2005).
Die offensichtliche Schwierigkeit, eine wissenschaftlich korrekte Festlegung einer Maximalverschuldung zu geben, darf aber in der Haushaltspraxis nicht
6 Es ist sicherlich der Kardinalfehler des Stabilitätspaktes, daß die Finanzminister (ECOFIN) letztlich die Aussetzung des Verfahrens gegen ein Land beschließen können. Damit entscheiden „Sünder über Sünder“ – mit der keineswegs überraschenden Konsequenz, daß selbst wiederholte Stabilitätsverstöße nicht geahndet wurden und auch zukünftig nicht geahndet werden.

ZUR BEGRENZUNG DER STAATSVERSCHULDUNG NACH DEM SCHEITERN... 39
dazu führen, die Planungen in der Weise zu betreiben, als ob es eine solche gesamtwirtschaftliche Schmerzgrenze nicht gäbe. Für das vorgeschlagene Drei-Stufen-Modell und für seine Umsetzung in die Verfassungswirklichkeit läßt es sich demnach nicht vermeiden, eine maximale Belastung ad hoc zu fi xieren, so theoretisch unbefriedigend dies erscheinen mag. Die Rechtfertigung für eine solche Setzung liegt unter anderem auch in der Vermutung begründet, daß bestimmte ökonomische Sachverhalte wie viele andere sozialwissenschaftliche Phänomene nicht linearen Gesetzmäßigkeiten folgen, sondern häufi g exponentielle Verläufe nehmen. Gladwell (2000) zeigt beispielsweise anhand markanter Beispiele, daß soziale Prozesse nach dem Überschreiten bestimmter Reizschwellen („tipping points“) erratischen Schwankungen unterliegen können. Die Entwicklung der Staatsverschuldung ist durchaus mit den Überlegungen über Reizschwellen in Einklang zu bringen sein, nach denen offensichtlich eine kritische Masse überschritten sein muß, ab der dann eigendynamische, nicht mehr oder nur unter erschwerten Bedingungen steuerbare Prozesse in Gang kommen (siehe auch von Weizsäcker 1992).
Deshalb erscheint es sinnvoll, in der Verfassung eine maximal zulässige staatliche Verschuldung festzuschreiben. Für die Erläuterung der grundsätzlichen Wirkungen des Modells sei hier vereinfachend angenommen, der zulässige Verschuldungsrahmen bestehe (im Sinne der Maastricht-Kriterien) aus 60% des BIP7. Diese Festlegung einer glaubwürdig durchzusetzenden Höchstgrenze würde unmittelbar disziplinierend auf die Regierung einwirken. Gleichwohl bliebe jedoch Handlungsspielraum für die Wirtschaftspolitik erhalten: Die fi skalische Autonomie der Regierung könnte nun durch Festlegung von drei Stufen geregelt werden, die gleichsam als Analogie zu einer Verkehrsampel mit einem grünen, einem gelben und einem roten Bereich ausgestattet wäre: In einer ersten grünen Stufe vollständiger fi skalischer Autonomie kann die Regierung frei über Mittelaufnahme am Kapitalmarkt und die investive Mittelverwendung entscheiden im Sinne der „goldenen Regel der Finanzwirtschaft“. Dies entspräche auch der Auslegung des Grundgesetzes (Art. 115 GG) durch das Bundesverfassungsgericht.
In der zweiten gelben Verschuldungsstufe ist die Regierung unausweichlich verpfl ichtet, unverzüglich der Öffentlichkeit darzulegen, wie sie innerhalb eines mittelfristigen Zeitraums von z.B. einer Legislaturperiode verläßlich in den ersten Bereich zurückgelangen will, z.B. mit Hilfe eines Schuldenrückzahlungsplanes, der
7 Die tatsächlichen quantitativen Vorgaben sind für die grundsätzliche Wirkungsweise des Vorschlages nicht entscheidend. Prinzipiell wären auch höhere oder niedrigere Werte denkbar. Gleichwohl sei an die Debatte im Vorfeld von Maastricht erinnert, in der die Konvergenzwerte entwickelt wurden. Die Vorgabe einer kumulierten Maximalverschuldung in Höhe von 60 Prozent ist insofern nach wie vor zweckmäßig, weil ab einer bestimmten Schuldenhöhe die Zinsen zu einer großen Last für die Regierung werden und deren fi skalische Autonomie aushöhlen.

Dirk Wentzel40
von der Regierung mit höchster Priorität zu erfüllen ist. Die Öffentlichkeit ist dabei automatisch zu informieren, etwa durch Einberufung der Bundespressekonferenz oder vergleichbarer Institutionen. Die zweite gelbe Verschuldungsstufe ist ein Bereich beschränkter fi skalischer Autonomie. Denkbar wäre es, schuldenwirksame Mehrausgaben durch eine höhere als die Kanzlermehrheit abzusichern, also beispielsweise einer qualifi zierten 2/3-Mehrheit im Bundestag. Hierzu wären entsprechende verfahrensrechtliche Bestimmungen, analog zur Beschließung der Haushaltsgesetze, in der Verfassung zu verankern, die die Rechtsmittel unvermeidlich in Gang setzen. Strategisches Ziel ist es, der staatlichen Verschuldung an der Grenze zwischen der ersten und zweiten Stufe Einhalt zu gebieten und die Öffentlichkeit in einer verständlichen Weise zu informieren. Den Medien kommt hierbei also die Rolle einer echten Übersetzungsleistung zu.
Gerät der Staat dennoch in die dritte Stufe, den roten Bereich der maximal zulässigen Verschuldung und damit in den Bereich der Überschuldung, so ist die Regierung durch die Verfassungsorgane zu zwingen, unmittelbar in die mittlere Verschuldungsstufe zurückzukehren (aufgehobene fi skalische Autonomie). Auch hier ist die Öffentlichkeit automatisch zu informieren, um die Notwendigkeit zur stabilitätspolitischen Umkehr zu signalisieren. In Zusammenarbeit mit den wissenschaftlichen Beratungsgremien (Sachverständigenrat, wissenschaftliche Beiräte, Wirtschaftsforschungsinstitute) sind die genauen Gründe für die Überschuldung aufzuzeigen und nachvollziehbare Strategien für eine Entschuldung zu entwickeln.
Der Stabilitätspakt hat sich, wie viele Ökonomen in einem offenen Brief vorausgesagt haben (siehe FAZ vom 09.02.1998), bereits bei seiner ersten Belastungsprobe als unwirksam erwiesen. Diese Erfahrung verdeutlicht, daß die Frage der Sanktionsgewalt von entscheidender Bedeutung für die Wirksamkeit der vorgeschlagenen Verfassungsergänzung sein wird. Die bisherigen Vorschläge der letzten Dekaden haben vor allen Dingen deshalb noch keine Verhaltensänderung der Politik ausgelöst, weil ihnen eben diese Dimension fehlt. Und der Stabilitätspakt ist auch deshalb gescheitert, weil über die Öffentlichkeit kein ausreichender Druck auf die Politiker ausübt werden konnte. Auch heute schon ist, wie juristische Abhandlungen zeigen, die Praxis der Staatsverschuldung eindeutig verfassungswidrig (vgl. Kirchhoff 2002). Das Parlament wäre eigentlich aufgerufen, der Verfassungsvorgabe zum ausgeglichenen Haushalt zu folgen. Gleichwohl hat sich an der Überschuldungstendenz nichts geändert, da eben die Frage der Sanktionsgewalt bis dato noch nicht gelöst ist. Dies könnte durch autoomatische Sanktionen wie im Drei-Stufen-Konzept verändert werden.
Automatisierte Regelungen aber leiden häufi g unter dem Vorwurf der Demokratiefeindlichkeit. Eine automatische Aufhebung der fi skalischen

ZUR BEGRENZUNG DER STAATSVERSCHULDUNG NACH DEM SCHEITERN... 41
Autonomie der Regierung ist sicherlich einem ähnlichen Vorwurf ausgesetzt8. Ein demokratisch organisiertes Gemeinwesen müßte aber aus eigener Kraft Regelungen fi nden, die ähnlich restriktiv wirken wie der § 28 des Umstellungsgesetzes im Nachkriegsdeutschland, gleichzeitig jedoch die Sanktionsdrohung aus sich heraus bewerkstelligen. Deshalb wäre es denkbar, die dritte Verschuldungsstufe durch ein Element der direkten Demokratie zu stärken und damit unmittelbar am Eigeninteresse der an ihrer Wiederwahl interessierten Volksvertreter anzuknüpfen. Zum Beispiel könnte der Opposition das Recht eingeräumt werden, einen Volksentscheid über die Schuldenpolitik der Regierung herbeizuführen. Es müßte also eine konkrete Sachalternative mit Finanzierungsoption zur Wahl gestellt werden. Dies könnte im konkreten deutschen Fall durch eine Ergänzung des Art. 39 GG (Zusammentritt und Wahlperiode) für den Fall staatlicher Überschuldung erreicht werden. Die Verknüpfung von staatlicher Ausgabenpolitik und Kontrolle durch einen möglichen Volksentscheid, mithin durch ein Element direkter Demokratie, würde also nicht die demokratische Einfl ußmöglichkeit beschneiden, sondern im Gegenteil stärken. Das Drei-Stufen-Modell könnte so zu einer scharfen Waffe gegen schuldengeneigte Regierungen werden, denn diese sähen sich mit der vermutlich wirksamsten Drohung konfrontiert: der Bestrafung durch den Wähler bei einem Volksentscheid.
Gleichwohl ist festzuhalten, daß die Argumentation für mehr Elemente direkter Demokratie in der Literatur nicht unumstritten ist. Manche europäische Staaten haben Elemente direkter Demokratie für Haushaltsfragen ausdrücklich ausgeschlossen, weil die Komplexität dieser Fragen nicht für eine digitale Ja-Nein Antwort geeignet sei. Demgegenüber ist festzuhalten, daß sich in der Schweiz bereits seit längerem Elemente direkter Demokratie sehr disziplinierend auf die Staatsausgaben und die Neuverschuldung auswirken (siehe Schönenberger 1995). Die Steuerbelastung ist regelmäßig dann niedriger, wenn die Steuerzahler stärker mitentscheiden können, welche öffentlichen Güter in welcher Menge und zu welchem Preis der Staat bereitstellen soll.
Die Festlegung der drei Verschuldungsstufen hätte den Vorteil, Transparenz für die Öffentlichkeit zu schaffen. Dies würde der Entstehung von Fiskalillusion wirksam vorbeugen. Die Regel würde es der Bevölkerung erleichtern, den aktuellen Gefährdungsgrad staatlicher Verschuldung besser einzuschätzen, als dies gegenwärtig möglich ist, und eine Präferenz für die solide Führung der Staatsfi nanzen in den Wahlen zu bekunden. Zugleich wären die Anbieter von politischen Programmen
8 Auch die Gegner der Notenbankautonomie beklagen immer wieder, daß die Geldpolitik der „demokratischen Kontrolle“ entzogen sei und ihrer Verantwortung für mehr Beschäftigung nicht nachkomme. Dieser Vorwurf ist gegenstandlos, da keinerlei volkswirtschaftlichen Vorteile erbringen kann, weder in der kurzen noch in der langen Frist.

Dirk Wentzel42
stärker gezwungen, die fi nanziellen Auswirkungen ihrer Wahlversprechen zu bedenken.
Das Drei-Stufen-Modell ist medienökonomisch als Analogie zu einer Verkehrsampel mit einem grünen, einem gelben und einem roten Bereich zu verstehen. Die Bevölkerung kann also zu jedem Zeitpunkt relativ gut den Gefährdungsgrad der aktuellen Staatsverschuldung einschätzen und müßte sich nicht mit abstrakten Größen auseinandersetzen, die teilweise sogar für Fachleute schwer nachvollziehbar sind. Regelüberwachung und -kontrolle sind also im „Ampel-Modell“ vergleichsweise gut durchführbar. Die Vergrößerung der Transparenz erleichtert es der Bevölkerung, Wirtschaftspolitik rational zu bewerten.
Was wäre aber, wenn die Bevölkerung in einer Volksabstimmung eine Verschiebung der intergenerativen Lastenverteilung zum Nachteil künftiger Generationen präferieren würde? Hierzu ist anzumerken, daß die Präferenz für Schuldenfi nanzierung gegenüber einer aktuellen Steuermehrbelastung maßgeblich von den Informationen über den eigenen Lebenshorizont und den Zeitpunkt der Fälligkeit der Staatsschulden abhängen. Die Anhäufung zusätzlicher Staatsschuld wird vermutlich nur dann gewünscht oder zumindest hingenommen, wenn mit großer Wahrscheinlichkeit davon auszugehen ist, daß der Rückzahlungszeitpunkt außerhalb der eigenen Lebenserwartung liegt. Genau hier kann das Ampel-Modell zu einem Strategie-Wechsel führen, wenn es nämlich die Information vermittelt, daß mit steigender Staatsschuld die Wahrscheinlichkeit eines Rückzahlungstermins (oder eines Staatsbankrotts) innerhalb des eigenen Lebenshorizontes steigt. Diese Argumentation basiert auf der Friedmanschen Lebenseinkommenshypothese: Es bedarf gar nicht einmal des intergenerativen Altruismus und Wohlwollens gegenüber der nachwachsenden Generation, sondern nur besserer Informationen über die fi nanziellen Verbindlichkeiten des Staates und die Wahrscheinlichkeit, ob und wann diese unmittelbar für die Bürger zahlungsrelevant werden.
Nach der Klärung des „Wie“ stellt sich unmittelbar die Frage des „Wann“. Dabei ist es aus politischen Überlegungen zweckmäßig, die Drei-Stufen-Lösung erst in der Legislaturperiode, die der Verfassungsänderung folgt, anzuwenden. Hierdurch können Regierung und Opposition beide der Verfassungsänderung eher zustimmen, weil zu diesem Zeitpunkt der „Schleier der Ungewißheit“ noch verbirgt, welche Parteien in der kommenden Wahlperiode die Regierung stellen werden. Einer wirksamen Schuldenbegrenzung kann eigentlich kein vernünftiges Argument entgegengesetzt werden. Die Oppositionsparteien, so jedenfalls zeigen es die Erfahrungen in allen europäischen Staaten und unabhängig von der politischen Couleur, offenbaren sich zumindest verbal immer als vehemente Gegner staatlicher Verschuldung. Die Wandlung vom „Paulus zum Saulus“ fi ndet meistens jedoch mit dem Eintritt in das

ZUR BEGRENZUNG DER STAATSVERSCHULDUNG NACH DEM SCHEITERN... 43
Regierungsamt statt. Dann wird Verschuldung mit „strukturellen Handlungszwängen“ als unvermeidlich gerechtfertigt oder aber der Vorgängerregierung angelastet. Würde die Verfassungsergänzung bereits für die aktuelle Legislaturperiode beschlossen, könnte die Regierung aus nachvollziehbaren Gründen der Regeländerung kaum zustimmen. Ebenfalls würde eine „Regelaufweichung“, etwa durch „ungefährliche“ quantitative Verschuldungsgrenzen, immer wahrscheinlicher.
Vermutlich wären Übergangsfristen zweckmäßig und notwendig, und zwar schon allein deshalb, um angesichts der bereits fortgeschrittenen staatlichen Verschuldung in allen OECD-Ländern und in der Eurozone zumindest die prinzipielle Anwendung der Regeländerung im vernünftigen quantitativen Rahmen sicherzustellen. Ebenfalls wäre es zweckmäßig, den Konsolidierungskurs durch solche Maßnahmen zu begleiten, die vermutlich besonders geeignet sind, die staatliche Einnahmenseite zu verbessern bzw. die Ausgabenseite zu entlasten (siehe Wentzel 2005). Allerdings ist zu vermuten, daß insbesondere die Privatisierung von Staatsunternehmen bzw. die (Rück-) Verlagerung staatlicher Aktivitäten in die Privatwirtschaft dazu beitragen können, den Spielraum für die Schuldenrückzahlung ohne Neuverschuldung zu vergrößern, Ausgaben einzusparen und zugleich die Staatsquote wieder zu reduzieren.
4. Zusammenfassung
Der gescheiterte Stabilitätspakt verdeutlicht: Innerhalb des bestehenden legislativen Rahmens besteht weder in Deutschland noch in Europa die Aussicht, den weiteren Anstieg der Staatsverschuldung zu stoppen. Es bedarf der grundsätzlichen Bereitschaft zur Ergänzung des gegenwärtigen Ordnungsrahmens, um der Gefahr entgegenzutreten, daß sich der Staat immer weiter in die Zahlungsunfähigkeit hineinmanövriert.
Das vorgestellte Drei-Stufen-Modell, das konkret auf eine Ergänzung der bestehenden Verfassung hinausläuft, könnte einen Beitrag zur Begrenzung der Staatsverschuldung liefern, zumindest aber die Diskussion über Alternativen zur gegenwärtig unbefriedigenden Praxis anregen. Das Drei-Stufen-Modell ist für die Bevölkerung und für die politisch Verantwortlichen leicht nachvollziehbar und handhabbar. Zugleich bietet es den Entscheidungsträgern in einem begrenzten Ausmaß einen fl exiblen Rahmen für staatliche Aktivität. Pro-zyklische Wirkungen werden hierdurch vermieden.
Die vorgeschlagene Verfassungsergänzung könnte dem Vorwurf des „Demokratiedefi zits“ ausgesetzt werden, da dem Parlament und der Regierung bestimmte Befugnisse beschnitten werden. Diesem möglichen Vorwurf wird aber

Dirk Wentzel44
dadurch begegnet, daß aus der Verbindung des Drei-Stufen-Modells mit Elementen direkter Demokratie eine Erweiterung der Entscheidungsbefugnisse der Bevölkerung resultiert. Dem eigeninteressierten Politiker wird das Schlupfl och des „Ausgebens ohne zu besteuern“ verschlossen, indem die Kontrolle durch den Wähler erhöht wird.
Im politischen Prozeß besteht die Möglichkeit, eine notwendige Mehrheit für die Verfassungsergänzung zu fi nden. Parteien in der Opposition könnten ein Interesse daran haben, eine solche Regelung durchzusetzen. Sie könnte sich in der Öffentlichkeit als Vertreter von Stabilitätsinteressen profi lieren und zugleich der aktuellen Regierung Handlungspotentiale beschneiden. Wäre das Thema dann einmal in der öffentlichen Diskussion präsent, würde sich die Regierung dem Anliegen zur Verfassungsergänzung nur schwer entziehen können, da das vorgeschlagene Modell lediglich verdeckte Praktiken der Staatsfi nanzierung ausschließen will. Durch die medienökonomische Komponente wird zudem der Fiskalillusion entgegengewirkt.
Bestimmte wirtschaftswissenschaftliche Erkenntnisse benötigen eine gewisse Zeit, bis sie im politischen Prozeß umgesetzt werden können. Die offensichtliche Erkenntnis, daß die gegenwärtige Staatsfi nanzierung kein gangbarer Weg ist, um dauerhaft wirtschaftliche Prosperität und soziale Sicherheit zu gewährleisten, könnte Parlament, Regierung, Medien und die Öffentlichkeit überzeugen, daß eine wirksame Verschuldungsbegrenzung notwendig und auch durchführbar ist, allerdings nicht unter dem gegenwärtigen Ordnungsrahmen auf nationaler und auf europäischer Ebene: Diesen Ordnungsrahmen gilt es zu ersetzen.
Literatur
Barro, Robert J. (1979): On the Determination of Public Debt, in: Journal of Political Economy, Vol. 87, S. 940-971.Bayoumi, Tamim und Barry Eichengreen (1995): Restraining Yourself: The Implications of Fiscal Rules for Economic Stabilization, in: IMF Staff Papers, Vol. 42, No. 1, S. 32-48.Buchanan, James M. und Richard E. Wagner (1977): Democracy in Defi cit, New York.Demoskopisches Institut Allensbach (Hrsg.) (2002): Demoskopisches Jahrbuch (2002).Eurostat vom 18. März 2005: Statistisches Material zur Konvergenzentwicklung der EU-Staaten.Frankfurter Allgemeine Zeitung (1998): Der Euro kommt zu früh: Wissenschaftler nehmen Stellung zum geplanten Beginn der Europäischen Währungsunion, in: FAZ vom 09.02.1998, S. 15.

ZUR BEGRENZUNG DER STAATSVERSCHULDUNG NACH DEM SCHEITERN... 45
Gladwell, Malcom (2000): The Tipping Point. How Little Things Can Make a Big Difference, Boston, New York, London.Heinemann, Friedrich (1994): Staatsverschuldung: Ursachen und Begrenzung, Köln.Isensee, Josef (2003): Die Insolvenzunfähigkeit des Staates, in: Betriebswirtschaftliche Schriften Heft 148: Unternehmen in der Krise, Ringvorlesung des FB Rechts- und Wirtschaftswissenschaft der FU Berlin im Sommersemester 2003, hrsg. von Markus Heintzen und Lutz Kruschwitz, Duncker und Humblodt.Issing, Otmar (1993): Kreditwirtschaft und Staatsverschuldung – Anmerkungen aus der Sicht der Notenbank, in: Banken und Staatsfi nanzen, 16. Symposium zur Bankengeschichte am 14. Oktober 1993, Frankfurt, S. 30-45.Kirchhoff, Paul (2002): Der notwendige Ausstieg aus der Staatsverschuldung, DVBl. 2002, Heft 23/24, S. 1569-1578.Kirsch, Guy (1983): Nach dem Rausch der Katzenjammer. Die politische Perspektive der öffentlichen Verschuldung, in: Frankfurter Allgemeine Zeitung, Nr. 186, 13.08.83, S. 13.Lappin, Roland (1994): Kreditäre Finanzierung des Staates unter dem Grundgesetz: Ein Plädoyer gegen den Kreditstaat, Berlin.Leipold, Helmut und Dirk Wentzel (Hrsg.) (2005): Ordnungsökonomik als akuelle Aufgabe, Schriften zum Vergleich von Wirtschaftsordnungen, Band 78, Stuttgart, Jena, New York.Sachverständigenrat zur Begutachtung der gesamtwirtschaftlichen Entwicklung (SVR) (2005): Jahresgutachten 2004/05.Schönenberger, Peter (1995): Wirksame Verschuldungsbegrenzung, Die Maßnahmen im Kanton St. Gallen, in: Neue Zürcher Zeitung, Internationale Ausgabe, 29.05.95, S. 122.Smith, Adam (1789/1990): Der Wohlstand der Nationen, Hamburg.Tietzel, Manfred und Dirk Wentzel (2004): Pressefreiheit: Erfolg oder Mißerfolg einer Institution, in: Eger, Thomas (Hrsg.) (2005): Erfolg und Versagen von Institutionen, Schriften des Vereins für Socialpolitik, Neue Folge, Band 305, S. 53-88.Wagner, Adolph (1892): Grundlegung der politischen Oekonomie, 3. Aufl ., 1. Theil, Leipzig.Weizsäcker, Robert K. von (1992): Staatsverschuldung und Demokratie, in: Kyklos, Vol. 45, Fasc. 1, S. 51-67.Wentzel, Dirk (1997): Ökonomische Theorie der Verfassung und das Problem der Staatsverschuldung: Anwendungsfall für das Drei-Stufen-Modell, in: Arbeitsberichte zum Systemvergleich der Marburger Gesellschaft für Ordnungsfragen der Wirtschaft Nr. 21, hrsg. von Alfred Schüller, S. 19-47.

Dirk Wentzel46
Wentzel, Dirk (1998): Politischer Wettbewerb in der Informationsgesellschaft: Medien als Einfl ußträger und Kontrollinstanz der Wirtschaftspolitik, in: Cassel, Dieter (Hrsg.) (1998): 50 Jahre Soziale Marktwirtschaft. Ordnungstheoretische Grundlagen, Realisierungsprobleme und Zukunftsperspektiven einer wirtschaftspolitischen Konzeption, S. 711-740.Wentzel, Dirk (2002): Medien im Systemvergleich: Eine ordnungsökonomische Analyse des deutschen und amerikanischen Fernsehmarktes, Schriften zum Vergleich von Wirtschaftsordnungen, Band 69, Stuttgart, Jena, New York.Wentzel, Dirk (2005): Der Stabilitäts- und Wachstumspakt: Prüfstein für ein stabilitätsorientiertes Europa, in: Leipold; Wentzel (Hrsg.), S. 309-331.Willgerodt, Hans (2005): Sozialpolitik und die Infl ation ungedeckter Rechte, in: Leipold; Wentzel (Hrsg.), S. 173-194.

THE INSTITUTIONAL SYSTEM AND WORKING EXPERIENCES OF HUNGARIAN... 47
THE INSTITUTIONAL SYSTEM AND WORKING EXPERIENCES OF HUNGARIAN SPATIAL DEVELOPMENT
Pap Norbert – Végh AndorUniversity of Pécs
Introduction
The Act on Spatial Development and Organisation (1996. XXI.) was passed ten years ago, with the aim of harmonising national and regional developmental and organisational activities, and to provide the basis of an integrate spatial developmental strategy brought in line with EU regional politics.
The act created and gave power to two regional levels formerly not being present in Hungary: NUTS 2 and NUTS 4 levels, i.e. regions and small regions. The former category – the region – is the level that provides the most important and most size-effective spatial framework for harmonising objectives, measures and institutions of Hungarian and EU regional politics, for developing interregional relations, for managing spatial problems, for using structural funds in order to moderate regional differences, for the analysis and planning in regional politics, for the decentralisation of decisions and fi nancial resources (LÁSZLÓ M.–MAGAI M. 2005). On the contrary, the level of small regions is one building in a bottom-up direction, from the level of local governments.
In the present study the authors intend to outline changes in spatial developmental legislation and practice during the past ten years, concentrating on the small region level, and suggesting some possible options meaning the prospective future of this association form.
National and regional institutional system of spatial development in hungary
Because in Hungarian spatial structure it is only settlements and counties that possess public administrational and local governmental functions, therefore small regional and regional levels – fulfi lling modern spatial developmental requirements – are only statistical and planning categories. However, the administrational middle level is questionable, because the currently existing, historic types of local governmental structures do not meet the expectations of present-time European Union planning for middle- and long-term periods. In the future, it is quite likely

Pap Norbert • Végh Andor48
that these new categories will be given self-governmental rights, because rational spatial thinking requires the modifi cation or drastic correction of the constitutional framework in accordance with the aforementioned changes.
Self-governmentsThe Act on Spatial Development and Organisation (1996. XXI.) defi ned
spatial development as an obligatory duty of local governments, but in the freely transformable decentralised organisational and institutional structure this could be realised in several forms. There were places where spatial development was regarded as a spatial organisational duty, whereas in other cases its development-organisational aspects were considered dominant, but in many instances it is the organisation managing possessions that undertakes this duty. Whichever organisational solution is chosen by a local government (or public benefi t companies, limited reliability companies, corporations), duties related with development always require broad, horizontal collaboration at the local level (LÁSZLÓ M.–MAGAI M. 2005).
The Act on Self-Governments does not specify details about the content, frequency and revision limitations of the spatial developmental concepts of settlements. This defi ciency was repaired by the Act on Spatial Development and Organisation (1996. XXI.), then by the Act on the Transformation and Protection of Built Environment (1997. LXXVIII.). It is important to note that the latter one gave a clear separation between long-term strategic and daily operative planning, the latter providing the basis for regular authority work (LÁSZLÓ M.–MAGAI M. 2005). The act makes it compulsory for every local government to create their own spatial developmental plan and local regulations. The revision frequency of spatial organisational plans is 10 years, but in real life it is done much more frequently than that.
The duty of county self-governments and their institutions is to harmonise settlement organisational plans (LÁSZLÓ M.–MAGAI M. 2005).
Small regionsThis type of organisation (association of local governments) fi rst appeared
(following the birth of the Act on Self-Governments 1990. LXV.) as an alternative solution, e.g. in the form of institution operating association or rural district authority), but after 1994-1996 it became a form of co-operation already encouraged by the government. Being the focus of the present study, today this is one of the distinguished spatial levels of the modernisation and regulation of public administration.
CountiesOn the level of counties, it is county spatial developmental councils that perform
the harmonisation task of local governmental spatial developmental duties, produce the long-term spatial developmental plan of the county, in line with the adequate national plan, and also create development programmes and corresponding fi nancial plans for the realisation of these programmes (LÁSZLÓ M.–MAGAI M. 2005).
THE INSTITUTIONAL SYSTEM AND WORKING EXPERIENCES OF HUNGARIAN... 49
Members of the county spatial developmental council are the following:- the chair of the county assembly,- mayor(s) of county-right town(s) within the county,- the representative of the minister leading the Chancellery- leaders of regional economic chambers,- three representatives of spatial developmental associations of local governments
within the county,- leader of the county (capital) Agricultural Regional Authority,- representative of the adequate Regional Tourism Committee.
RegionsThe act on spatial development created the legal grounds for the existence of
regional developmental councils within each of the 7 planning/statistical regions, with the primary aim of producing regional developmental strategies and deciding about the use of decentralised budget and the implementation of investments (LÁSZLÓ M.–MAGAI M. 2005).
Country levelThe Parliament accepted the National Spatial Developmental Concept in 1997,
determining the principles and priorities of spatial developmental politics, and ensured the decentralised system of spatial developmental funds in a parliament resolution, determined the condition system for the categorisation of benefi ciary regions. The duties of spatial development were taken from the ministry of Agriculture and Rural Development and were given to the Chancellery and to the political state secretary for regional development, controlling and supervising the newly established National Spatial Developmental Authority. When governmental duties were re-arranged and the function of state secretary was abolished in 2004, the matters of national spatial development were given to the newly formed Hungarian Spatial and Regional Developmental Authority. This organisation is lead by a president, and there is also a vice-president in the institution, i.e. the leader of the Spatial Developmental, Public Administrational, Financial and Economic, Regional Operative Programs and Interreg Regional Community Initiative Regulation Authority.
The Parliament – by creating the Committee for Spatial Development – raises the duty of spatial development to a distinguished ranking, ensuring its vertical as well as horizontal co-operation possibilities, specifi es distinguished regions, settles the usage of funds for spatial development by passing the Budget, determines the spatial developmental duties and fi nancial sources for local governments.
The Government, as the general, central executive power ensures the nation-wide realisation of spatial developmental politics, releases decrees regulating the

Pap Norbert • Végh Andor50
spatial organisational duties of Ministries and country-level institutions, specifi es the categorisation of benefi ciary areas and demarcates special interest territories, settles the scenarios of harmonising spatial developmental concepts and programmes, spatial organisational plans, specifi es regulations on entrepreneurship zones, information system and monitoring system, and rules on spatial developmental associations of local governments (LÁSZLÓ M.–MAGAI M. 2005). Furthermore, the government carries out its aims and tasks through the adequate ministers, and creates the National Spatial Developmental Authority, which is a supervisory institution regulating:
-Regional Developmental Councils,-County Spatial Developmental Councils,-Balaton Developmental Council,-spatial developmental associations of local governments,-regional co-ordinators,-small regional trustees,-public administrational authorities of the counties and the capital
This Authority is the one to supervise VÁTI Public Benefi t Company which was created from the Institute of Urban Development and Planning, with the following name: VÁTI Hungarian Regional and Urban Developmental Public Benefi t Company. This company is the one to run the spatial information system and co-operates in the preparation and realisation of duties related with EU-integration.
Furthermore, the Authority supervises the Regional Developmental Holding, the role of which is to support small and middle enterprises.
The National Spatial Developmental Council is the board sitting for preparing decisions, making propositions and expressing opinions in spatial developmental politics, with three major interest spheres involved: the government, participants of the economy, and the self-governmental sphere.
The system of small regions in Hungary
The notion of small regions; their geographic delimitationThe multitude of terms such as “small region”, “micro-region”, etc. well
illustrates the confusion created by the problem in defi ning the notion of space. The cause of this confusion is the fact that it is impossible to exactly identify something that has spatial existence as only one aspect – be it however important. As experience shows, these terms denote a range of phenomena rather than a single notion, for which the expression “small region” is used as an umbrella term of territorial character. The notion “small region” is defi ned scientifi cally as well as in empirical and traditional ways. Those approaching the issue from a practical aspect will necessarily face categories and technical terms of the legislative fi eld.
THE INSTITUTIONAL SYSTEM AND WORKING EXPERIENCES OF HUNGARIAN... 51
Legislative regulation defi nes the small region category (Act 1996. 2XXI. 5.§). The defi nition includes the following:
h.) small region: a spatial unit that can be delimited based on a complex of functional relation systems existing between settlements, including neighbouring settlements with intensive relationships and self-organisation.
The term “small region” referred to in scientifi c, professional and everyday language is a framework for many types of economic and administrational activities. It is a legal and organisational category. It is a potential co-operation framework in society, an organisation form of local governmental co-operation for the sake of spatial development and public services, a part of the identity of local societies, a means of communication, and it also has other duties. Local traditions, problems and expectations greatly differentiate the contents of small regions.
The multitude of forces and space-forming factors determining spatial organisation allow us to imagine the space-rational creation of small regions in a variety of spatial frameworks, depending on which points to consider. This fl exibility makes it possible to continuously re-draw the map of small regions.
The place and role of small regions in the system of Hungarian spatial development
When the act on self-governments came into effect in the early 1990s, the former administrative system building on town vicinities was abolished. Around the time of political transition, the independence of settlements became extremely highly valued. Counties that had been traditionally strong lost much of their weight. The restoration of districts and town vicinity organisation was not raised as a priority. However, in certain areas of governmental operation, there were some “small regional” local formations – established earlier for districts and town vicinities – that survived (e.g. in jurisdiction, land registry organisations, etc.). Local governmental representatives and mayors yet unable to even just think over the possibilities offered by local independence soon faced the harsh limitations appearing in settlement management and development, and got acquainted with the opportunities offered by the PHARE programme operating along EU models.
There are two basic small regional organisation types having evolved by today. One is the association of local governments, created for a variety of purposes, and the other is statistical small region units.
The frameworks in which local governments could establish associations for maintaining certain institutions of providing public services were determined by the act on self-governments. The act – besides setting the independence of settlements
Pap Norbert • Végh Andor52
and local governing as top priorities – provided great freedom for establishing associations of local governments. Governmental subsidies and The PHARE programme of the EU expressed preference for associations. However, much dislike remained in local societies and local politicians against co-operation between settlements, mostly because of the bad practice of earlier times. Around 130 local, small-regional associations had formed by 1994. In addition to local governments, these often included NGOs, private enterprises, etc. Around 180 local governments were involved in such self-organised associations. The associations had either village or town centres. Experiences from former town vicinity co-operation types have greatly infl uenced small regional corporations (Hajdú Z., 2001).
Co-operation relying on voluntariness and on the common assertion of the individual interests of the parties, together with the joint implementation and maintenance of infrastructural investments, common operation of public utilities, have lead to a new, organically evolving spatial structure. The formation of settlement associations is not a fi nished process, instead it still happens today. Around 260-270 new local governmental associations were formed in the country in recent years (Hajdú, 2001). The operation effectiveness of these associations is quite variable, and there are dissimilarities also in their organisational qualities and willingness to co-operate.
A special type of associations if the so-called SAPARD small region. These associations were created for receiving grants from the SAPARD pre-accession EU-fund. Their number in autumn 2003 was 191. Their operation concentrated on producing rural developmental programmes. In many cases the spatial framework of SAPARD associations was identical with that of the adequate spatial developmental association. In some instances, however, strange anomalies occurred. Driven by individual ambitions and particular dislikes among settlements, some minute associations were also formed, made up of a few settlements only.
Table 1. The NUTS system in Hungary in 2004
Name of level Number of entitiesNUTS 1 country 1NUTS 2 region 7NUTS 3 county/capital 20NUTS 4 small region 168NUTS 5 settlement 3157
The other small regional system, completely different from the former one was created in accordance with the statistical spatial system of the European Union. This is called the NUTS IV level. The Hungarian Central Bureau of Statistics performed

THE INSTITUTIONAL SYSTEM AND WORKING EXPERIENCES OF HUNGARIAN... 53
attraction zone analyses between 1991-1993. The new small regional data collection and data processing system was introduced on 1st January 1994. A total of 138 small regions were formed in the country, providing complete spatial coverage over Hungary’s area. Based on experiences the system was modifi ed in 1997, and 150 small regions were specifi ed. Although various different possibilities were considered originally, small regions fi nally did not extend beyond county borders. They have no direct administrational functions, but when they were formed, the existing administrational authority areas were taken into consideration.
The small regional system was modifi ed in 2003. In the new small regional division the number of the entities is 168. It is likely that the system will be further fragmented, with the number of units continuing to grow. This is partly related with the fact that several settlements have become new towns which have set the aim of strengthening their regional importance.
The act on regional development gave the small regional system of the Central Bureau of Statistics a highly valued status, viewing small regions as spatial organisational units. The Act 1996. XXI. – 14 § (1) e) – specifi es that members of the County Spatial Developmental Council are “made up by one representative from each of the spatial developmental local government associations existing in the county”. Thus, small regions were given an important role in forming the board that is the key corporation in local spatial developmental politics and in the distribution of decentralised spatial developmental resources.
Similarly, the role of the statistical small regional system was given high importance by the fact that the individual benefi ciary regions were highly determined within this system.
“The short history of statistical small regions of the Central Bureau of Statistics shows how diffi cult it is to fi nd a spatial system and centre on the level of towns vs. rural areas that is acceptable for all parties. Although the two types of statistical division and central system (1994, 1997) were not different, yet there were considerable differences in their distinct formations” (Hajdú Z., 2001).

Pap Norbert • Végh Andor54
Table 2. Connections of administrational and spatial developmental institutions to small regional organisations (Ed.: Norbert Pap, 2004)
Administrational institutions
Partnership and other institutions
How small regions connect
The Parliament determines national spatial developmental politics, approves the National Spatial Developmental Concept, the general rules on the measures and institutions of spatial development.
Professional preparatory work is done in the Spatial Developmental Committee of the Parliament.
Small regions are not involved directly. They can indirectly express their interests through the adequate members of parliament.
The majority of spatial developmental duties of the Government are associated with lower levels of spatial developmental institutions. It promotes the creation of spatial developmental local government associations, encourages the production of regional developmental plans and development projects done in regional co-operation.
The National Spatial Developmental Council is a partnership institution. It harmonises the implementation of spatial developmental activities prescribed as compulsory duties by the Parliament for local governments. The representation of various settlement types in the council is not assured suffi ciently. The associations of local governments can send one delegate to the council.
There is one form of direct connection, via small regional trustees of the Chancellery and via SAPARD managers.Representatives of small regions share the same board in county and regional developmental councils with ministry representatives..
The Ministriesimplement decisions of spatial politics, and take part in producing developmental programmes for distinguished regions

THE INSTITUTIONAL SYSTEM AND WORKING EXPERIENCES OF HUNGARIAN... 55
Regional administrative institutionstake part in executing and controlling governmental duties related with spatial development and organisation, and in the co-ordination process of spatial development and planning, by providing expertise, information and authority control.
Regional Developmental Council - there are 7 planning/statistical
regions currently- examines and evaluates the social
and economic status of the region - approves the complex spatial
developmental programme of the region
- comments on national, sectoral and regional developmental concepts, programmes and spatial plans related with its region,
- produces fi nancial plans for the implementation of developmental programmes
- decides about the use of developmental resources in its competence
- organises programme implementation.
Regional Developmental Councils, in performing their duties, co-operate with:- s patial developmental
local government associations
- county spatial developmental councils,
- regional developmental council,
- regional administrative bodies involved directly or indirectly in regional development,
- regional chambers of economy.
Among their members there is one representative of spatial developmental associations from each county. Spatial developmental settlement associations with no representation in the regional developmental council can be present in the council in the case of matters they are involved in.The representative of spatial developmental settlement associations must report to the delegating local governments regularly, but at least once a year.

Pap Norbert • Végh Andor56
Area developmental councils can be established by regional developmental councils or county developmental councils for managing certain distinguished spatial developmental projects in the region or in areas extending beyond county boundaries.Currently there is only one area developmental council specifi ed, namely the Balaton Developmental Council.
Area developmental councils are made up of maximum 6 representatives of spatial developmental settlement associations in the area of the council. In the meetings of the council the representatives have the right to vote in discussions about developmental projects in their areas.
County Self-GovernmentIt is responsible for producing the spatial plan of the county.Upon request from local governments, it co-ordinates developmental activities of settlements. Upon request from local governments, it promotes the organisation of spatial developmental settlement associations.
County Spatial Developmental Council- Within the area of the county it harmonises developmental plans of the government, local governments, spatial developmental settlement associations and companies.- It produces the long-term spatial developmental concept and programme of the county, including various sub-programmes. - It compiles fi nancial plan for the implementation of developmental programmes. With regard to the spatial developmental concept and programme of the county it decides about the use of appropriate funds in an application system, and about the implementation of developmental projects.
County Spatial Developmental CouncilsThey co-operate with spatial developmental settlement associations. - In the council there are three representatives of the spatial developmental settlement associations operating in the county.- The representative of spatial developmental settlement associations must report to the delegating local governments regularly, but at least once a year.
Local governments Only local governments can participate in small regional developmental settlement associations.

THE INSTITUTIONAL SYSTEM AND WORKING EXPERIENCES OF HUNGARIAN... 57
The effectiveness of small regional co-operation
Today there are 3157 independent local governments operating in Hungary. The average population per local government is around 3100. There are several disadvantages conveyed by this fragmented local governmental system. Size-effi ciency can be achieved by the creation of larger local governments with greater population, or by rearranging the distribution of duties among local governments. Because of historic facts, the former solution is in fact unfeasible in Hungary, whereas the second one is the only way to be taken in terms of small regional co-operations.
The act on self-governments approved in 1997 details precisely the possible association forms that can be formed by local governments, thus the legal framework already exists.
An effective way can be the creation of small regional agencies that could extend their functions to fi nally arriving at establishing a small regional organisation with a complex range of duties. Spatial developmental politics also encourage the creation of associations: county spatial developmental councils are given decentralised funds for fi nancing developmental programmes of the small regions. Certain state resources also show preference for associations, and are also fi nancial tools supporting specifi cally small regional co-operation (pl. KITA).
In the country there are also several hundred other associations created for various purposes (e.g. for implementing public utility investments, operating schools jointly, and for fulfi lling authority tasks together). These often overlap, meaning that a particular local government can be member of several small regional co-operation networks.
The newly created complex associations further complicate the situation, not necessarily in the direction of increasing effi ciency.
Obstacles to small regional co-operation
There are several inhibiting factors to be met by small regional co-operations in Hungary. Firstly, there is the problem of counties, i.e. the intentions by various associations to co-operate with county local governments are very weak or completely lacking. The reason can be found in the forced co-operation forms in the state-socialist era: the county dominated the settlements, and because of bad experiences gained in the distribution of funds, and due to the fact that county measures have considerably weakened, settlements today rather prefer being independent.
Encouragement from the central budget to create local governmental associations is only limited. The majority of central funds used locally – i.e. most of the normative subsidies – do not stimulate the creation of association.

Pap Norbert • Végh Andor58
The bulk of central fi nancial resources is given to individual settlements, whereas it is only recently that some joint projects are favoured by the government, although there is considerable improvement in this respect recently.
According to OECD (OECD, 2001), the central government, instead of directing funds through support schemes to local governments, should hand over certain proportions of the VAT, transportation taxes and income taxes. Currently, levying taxes is centralised, and the redistribution of taxes is actually seen as “support” given to local governments, while the costs of redistribution are paid by the government.
There are also (local) political obstacles to the creation of settlement associations. The mayor is strongly dependant on local governmental representatives.
Establishing relationships between towns and villages also faces diffi culties. The reasons, here too, date back to the state-socialist era, when villages were forced in a disadvantageous position in their relationships with towns. After the political transition the local governments of villages tended to refuse co-operation with towns. In many cases, even small regional developmental associations were established without a single city involved. This problematic relationship between towns and villages means a threat to the effective co-operation at the small regional level.
Co-operation between the governmental and the private sector is also lacking. The majority of partnership relations have been created by local governments, with only exceptional instances of private companies or NGOs being involved.
A further obstacle to co-operation is the limited availability of trained and experienced professionals, and the generally low wage levels.
Small regional concepts and programmes, and their place in small region-al management
Why have small regions (spatial developmental settlement associations) produced spatial developmental concepts and programmes?
The reasons for preparing spatial developmental concepts and programmes (plans, in brief) are as follows:
1. common sense; effective developmental activity can be ensured by planning, consideration of conditions and available resources, reliance on professional aspects
2. innovative thoughts, project ideas, professional input involved in thinking about the development
3. raw material for applications; the complete programme material should be suitable
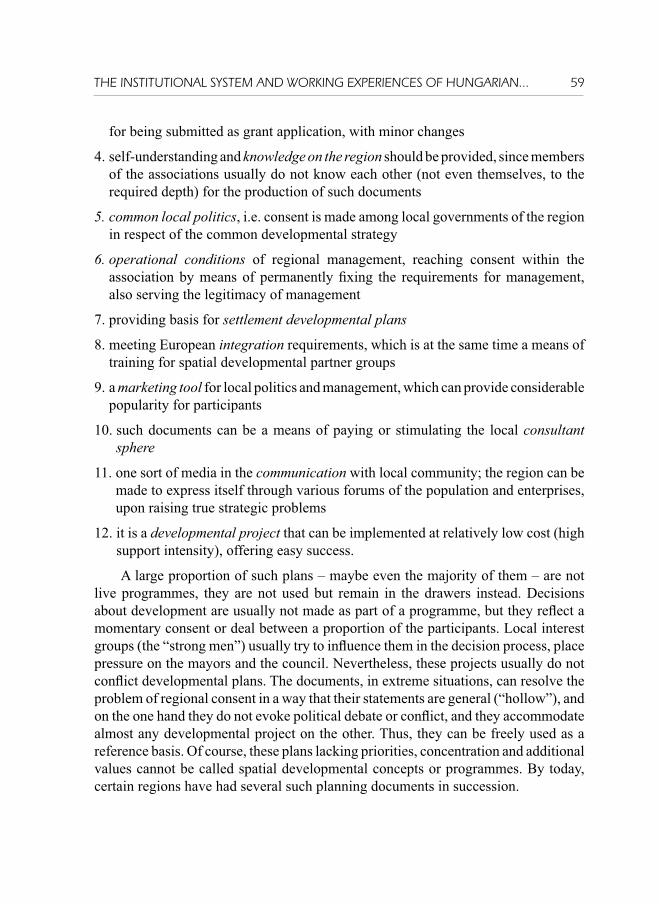
THE INSTITUTIONAL SYSTEM AND WORKING EXPERIENCES OF HUNGARIAN... 59
for being submitted as grant application, with minor changes
4. self-understanding and knowledge on the region should be provided, since members of the associations usually do not know each other (not even themselves, to the required depth) for the production of such documents
5. common local politics, i.e. consent is made among local governments of the region in respect of the common developmental strategy
6. operational conditions of regional management, reaching consent within the association by means of permanently fi xing the requirements for management, also serving the legitimacy of management
7. providing basis for settlement developmental plans
8. meeting European integration requirements, which is at the same time a means of training for spatial developmental partner groups
9. a marketing tool for local politics and management, which can provide considerable popularity for participants
10. such documents can be a means of paying or stimulating the local consultant sphere
11. one sort of media in the communication with local community; the region can be made to express itself through various forums of the population and enterprises, upon raising true strategic problems
12. it is a developmental project that can be implemented at relatively low cost (high support intensity), offering easy success.
A large proportion of such plans – maybe even the majority of them – are not live programmes, they are not used but remain in the drawers instead. Decisions about development are usually not made as part of a programme, but they refl ect a momentary consent or deal between a proportion of the participants. Local interest groups (the “strong men”) usually try to infl uence them in the decision process, place pressure on the mayors and the council. Nevertheless, these projects usually do not confl ict developmental plans. The documents, in extreme situations, can resolve the problem of regional consent in a way that their statements are general (“hollow”), and on the one hand they do not evoke political debate or confl ict, and they accommodate almost any developmental project on the other. Thus, they can be freely used as a reference basis. Of course, these plans lacking priorities, concentration and additional values cannot be called spatial developmental concepts or programmes. By today, certain regions have had several such planning documents in succession.
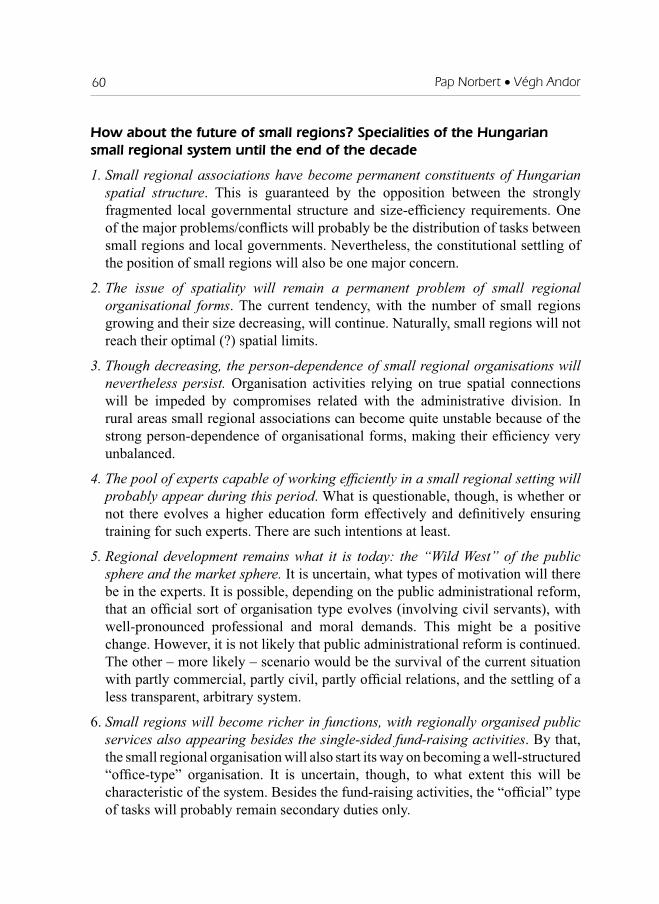
Pap Norbert • Végh Andor60
How about the future of small regions? Specialities of the Hungarian small regional system until the end of the decade
1. Small regional associations have become permanent constituents of Hungarian spatial structure. This is guaranteed by the opposition between the strongly fragmented local governmental structure and size-effi ciency requirements. One of the major problems/confl icts will probably be the distribution of tasks between small regions and local governments. Nevertheless, the constitutional settling of the position of small regions will also be one major concern.
2. The issue of spatiality will remain a permanent problem of small regional organisational forms. The current tendency, with the number of small regions growing and their size decreasing, will continue. Naturally, small regions will not reach their optimal (?) spatial limits.
3. Though decreasing, the person-dependence of small regional organisations will nevertheless persist. Organisation activities relying on true spatial connections will be impeded by compromises related with the administrative division. In rural areas small regional associations can become quite unstable because of the strong person-dependence of organisational forms, making their effi ciency very unbalanced.
4. The pool of experts capable of working effi ciently in a small regional setting will probably appear during this period. What is questionable, though, is whether or not there evolves a higher education form effectively and defi nitively ensuring training for such experts. There are such intentions at least.
5. Regional development remains what it is today: the “Wild West” of the public sphere and the market sphere. It is uncertain, what types of motivation will there be in the experts. It is possible, depending on the public administrational reform, that an offi cial sort of organisation type evolves (involving civil servants), with well-pronounced professional and moral demands. This might be a positive change. However, it is not likely that public administrational reform is continued. The other – more likely – scenario would be the survival of the current situation with partly commercial, partly civil, partly offi cial relations, and the settling of a less transparent, arbitrary system.
6. Small regions will become richer in functions, with regionally organised public services also appearing besides the single-sided fund-raising activities. By that, the small regional organisation will also start its way on becoming a well-structured “offi ce-type” organisation. It is uncertain, though, to what extent this will be characteristic of the system. Besides the fund-raising activities, the “offi cial” type of tasks will probably remain secondary duties only.

THE INSTITUTIONAL SYSTEM AND WORKING EXPERIENCES OF HUNGARIAN... 61
7. Small regional types with new characteristics will evolve. Communities with radical developmental strategies (advertised as “alternative” ones), as well as settlements and regions well adapting themselves to the globalist system will appear and rewrite current typologies.
A case-study: small regions of tolna county
In our study area, in the beginnings of small regional co-operation there were no administrative or fi nancial limiting factors restricting co-operation between settlements. Associations that formed showed only stronger or weaker intentions to co-operate. Furthermore, these early associations were true partnership organisations, with NGOs and private enterprises also taking active and equal part in their work. In the times when the government was making its fi rst efforts to encourage settlement associations – mainly through Act 1996 XXI. – the truly voluntary associations having formed before were called self-organising ones. There were 7 such self-organising small regions in Tolna county: at Iregszemcse, Miszla, Gyulaj, Bátaszék, Fadd, Kölesd and Tevel (SZABÓ – SZÁSZ – PAP, 1996).
The early times were characterised not only with greater freedom, but also with the lack of experiences and with relatively poor results. Nevertheless this period was the one to provide the opportunity for learning, and self-governments gradually got used to the thought of co-operation.
Spatial developmental co-operation between local governments in Tolna county shows considerable overlap with the statistical small regional system.
The statistical spatial system having been created by the Central Bureau of Statistics by 1994 suffered only minute changes recently. The fi ve small regions created around that time were the following:
- Dombóvár - Szekszárd-Tolna- Paks-Dunaföldvár- Tamási- Bonyhád
In recent times there have been changes in the statistical division. Five settlements of the Dombóvár small region (Szakály, Hőgyész, Dúzs, Kalaznó, Mucsi) left and joined the Tamási association.
Luckily for research, planning and monitoring, when the surveys were done, the operating and viable settlement associations coincided with their statistical geographic framework.

Pap Norbert • Végh Andor62
The Dombóvár small region became very compact when Hőgyész left the association, and Dombóvár, the central city with a complete range of functions and strong, complex attraction zone, did not have an opposite. Positive experience from spatial co-operation meant further cohesive power. There were no narrower co-operation forms (called “micro-regional” type in popular terminology) within the association. The attraction power of the city of Dombóvár was felt even beyond the small region.
The Tamási small region was enlarged by newcomer settlements, as mentioned above. There are two cities in the small region: Tamási and Simontornya in the northern lobe of the county and the small region. In the southern areas of the region a problematic area with no cities has evolved. Its formation is partly explained by natural features. The fragmented hilly region favoured the formation of a small-village settlement structure, with dead-end villages in many places. The main transportation routes do not enter the area. This region – the Tolna-Hegyhát – is the most problematic part of the county from spatial developmental aspects. Its settlements playing central role (“defi cit-centre”) are Hőgyész and Gyönk. There is yet another settlement with central functions: Iregszemcse in Külső-Somogy. The problems of the two cities and the southern area, the high variety and diversity of natural environment, the isolation of certain settlements in the small region, the absence of a defi nite and strong centre, and the diffi cult situation of the area together provide explanation for the multitude and complexity of “micro-regional” co-operations. Micro-regional co-operations are the following: with Miszla as a centre (6 settlements), with Nagyszékely as the centre (4 settlements), with Diósberény as the centre (4 settlements), with Iregszemcse as the centre (5 settlements), Közép-Hegyhát (its most important settlement with central functions is Gyönk; 11 settlements). The results achieved by the small regional working structure and the obvious advantages of collaboration have preserved the primacy of small regional co-operation.
The Paks-Dunaföldvár small region also has two city centres. The Danube-bridge at Dunaföldvár turns the attention of this settlement with traditional centre functions towards the Great Plain region, and road No 6 diverts attraction towards the neighbouring county. Paks, a regional centre city with crucial importance in the energy production of the country, is outstandingly rich, has been developing rapidly in recent decades, and as the opposite to Dunaföldvár, has become a determining town of the region. The western areas of the small region face more serious diffi culties, if compared with settlements along the Danube. Their relationship with the eastern part of the region is ambivalent.
The Szekszárd-Tolna small region includes three towns. Szekszárd is a developed small town, county capital, and town with county rights (though the smallest of all

THE INSTITUTIONAL SYSTEM AND WORKING EXPERIENCES OF HUNGARIAN... 63
such towns). Based on its functions it plays the roles of a county seat and regional sub-centre at the same time. The Danube-bridge built near the town has provided new opportunities by offering new spaces to be organised by the city. However, based on experiences there has been no break-through in this respect. The formation of micro-regional co-operations are explained by the attraction zone role of the two other small towns, by different natural features and cultural character, as well as by the existence of local identities. Whereas micro-regional co-operations were stronger in earlier years, today it is co-operation on the entire small regional level that has become stronger, with the frameworks of “micro-regional” co-operations also reserved. There are four such micro-regions: the one with Bátaszék as the centre (Pörböly, Alsónyék, Várdomb, Alsónána), with Bogyiszló as the seat (Tolna, Fadd, Fácánkert, Szedres, Tengelic), with Kölesd as the centre (Kistormás, Felsőnána, Harc, Medina, Murga, Kéty, Zomba), and the one at Sárpilis (Öcsény, Decs, Szálka, Sióagárd, Báta). In some cases the “micro-regional” framework was given legal entity too. Dél-Tolna, with Bátaszék as the seat (7 local governments), Sárköz Association with Decs as the centre (9 local governments), and Zomba and its region (8 local governments) set up associations possessing legal entity.
It is a contradiction that the fi fth small region of the county, namely the Bonyhád one was given a physical geographic, landscape framework, i.e. the Völgység, but at the same it is among the last ones in the levels of integration. The small region was tortured in the stormy times of history: transactions, population exchange, and natural migration greatly transformed its social-cultural pattern. Bonyhád, the natural centre of the region, was successful in surviving the economic re-structuring after political transition. Maybe success, in addition to the aforementioned social background, also contributed to the phenomenon that the regional community did not hold together the small region like in other parts of the county. However, in recent times there have been intentions to strengthen regional co-operation, maybe primarily driven by the desire to fi nd common routes after footwear industry collapsed in the region. This region remained to be the most disintegrated one even today.
If the structure of settlement network is considered, natural frameworks for co-operation are clearly seen. Nagymányok is an important sub-centre in the small region. The immediate surroundings of Bonyhád also maintain closer co-operation. The vicinity of Lengyel and that of Bátaapáti can become more strongly co-operating areas. Narrower micro-regional co-operation forms also do have their own traditions. Also within the framework of small regional co-operation, an issue has been the institutionalisation of micro-regional frameworks.

Pap Norbert • Végh Andor64
Figur 1 Small regions and self governments in Tolna County
Ed.: Pap-Végh 2006.Legend: 1. - Szekszárd-Tolna small region2.- Paks-Dunaföldvár small region3.- Tamási small region4.- Dombóvár small region5.- Bonyhád small region

THE INSTITUTIONAL SYSTEM AND WORKING EXPERIENCES OF HUNGARIAN... 65
Activities and operational specialities of spatial developmental settlement associations
Small regional organisation system in Tolna county
An unavoidable component of spatial development is the formation of the appropriate organisation structure. This involves the establishment of an adequate local developmental agency. Its form may vary from non-profi t organisations such as a public benefi t company to an organisational unit within the local governmental institution.
The form of an institution greatly determines its operation, through having an infl uence on the effi ciency of fund raising and proposal writing activity. However, the crucial element from the aspect of effi ciency is not the organisational form, but the experience of those taking part in the organisation. The person-dependence of activities is quite signifi cant in settlement and regional development, especially on lower levels i.e. in settlement and small regional development. An apt and competent professional can reach considerable success provided that an appropriate fi nancial and technical background is ensured.
Organisations are larger at the levels of county, region, distinguished region and country, with well-trained, partly specialised professionals working in an offi ce-like setting of activities. Here effectiveness is ensured by collective intelligence, a well-formed organisation, and a good internal distribution of duties.
Developmental agencies have not quite evolved in the small regions of the country, their organisations being small, maybe “one-person” developmental setting in many cases. In an ideal case, their operation is regulated by organisational and operational rules encoded in the appropriate document.
Each of the small regions of Tolna county possess a developmental organisation. These were not created at once, but instead were established in different times. Normally they started with one small region manager, and from that setting they have developed to the current organisational status.
The working organisation of the Dombóvár small region has been the Dombóvár Small Regional Developmental Agency since 1998. Currently there are 10 full time workers employed. The following functions were created within the agency: managing director, head of fi nances, administrator, Tourinform bureau offi cer, four project managers (industrial park manager, enterprise manager, association manager and EU Information Point offi cer), and from January 2004 one cultural and two environmental offi cers are also employed.
The operating institution of the association during the fi rst period after its creation has provided assistance to producing project proposals and programmes planned by
Pap Norbert • Végh Andor66
local governments. Its activities broadened when the Tourinform offi ce was opened in 1997, and it also provided educational services by employing a logopaedist and a pedagogist for handicapped children, employed a youth offi cer for two years, took over the duty of attending physician service from the municipality, assisted the district-police network and civil security service with equipment. The support provided for the establishment of the Blue Star Small Regional Association meant an act of opening towards the economic sphere. This organisation has remained the most important partner organisation of the Tourinform offi ce.
In accordance with the agreement signed with the Tolna County Centre for Enterprises, the duty of providing services as an entrepreneurs’ offi ce in the small region is taken by the institution of the developmental organisation. It also has worked as a satellite offi ce of the Chamber of Commerce, which meant that its role in supporting the economic sphere further increased. The functions of the Chamber are currently performed in the framework of the Entrepreneurs’ Club, and the small regional organisation takes part in programmes associated with the Kapos Innovation Transfer Centre too, and serves as the local centre for SAPARD EU accession program.
The Spatial Developmental Association – in co-operation with the German Minority Local Government and with the NGO called “Society for Dombóvár” – has established a European Information Point in the Innovation Centre.
The small regional organisation declares itself to be functioning in accordance with the priorities specifi ed in the “Common Future” small regional programme.
In the case of the Tamási small region the organisation started to work with one small region manager in 1996. As a result of successful projects and development the number of staff has grown to 5 by today (managing director /manager for rural development, manager assistant, project managers). The organisation form is public benefi t company.
It is a lucky situation that the small regional organisation can work in the framework of the broader Small Regional Co-ordination Offi ce together with the small region trustee, and with the representative of the Entrepreneurs’ Centre and the Tolna County Cultural Centre. These organisations are in closer co-operation with each other, and are thus able to work more effi ciently: all this is a good example for positive partnership intentions.
The developmental organisation in the Paks-Dunaföldvár small region has been working as a public benefi t company since 2003. As specifi ed in the rules of operation, the managing director supervises the work of both the rural development manager and the small region managers. There were two occasions when new project

THE INSTITUTIONAL SYSTEM AND WORKING EXPERIENCES OF HUNGARIAN... 67
managers were hired, sponsored from external sources (4 persons in 1999, 3 persons in 2001). Currently four of them are employed at the small regional association. The operation is occasional: activities are performed upon reactions to problems or issues occurring.
The organisation of the Szekszárd-Tolna small region was set up in 2000, with one regional developmental manager being employed. The Szekszárd Regional Developmental Agency was established. Matters of this public benefi t company are handled by one managing director (rural development manager) and by the Chancellery representative assisted by an administrator, plus one project manager in each of the micro-regions. The association regularly holds its meetings with the offi cers and members of the organisation regularly reporting on the activities having completed.
The organisation of the Bonyhád small region consisted of six persons at the time of our survey: one rural development manager, one tourism offi cer, one manager assistant, one environmental manager, and two proposal writers and project managers. Their duties include maintaining contacts with settlements, generating projects, proposal writing. As locals describe, the organisation is still “immature”. No priorities have been set for their operation, and the founders expect to solve problems arising from time to time.
Multipurpose small regional associations of Tolna county
In 2004 the Government released a decree on the fi nancial support of multipurpose small regional associations. Hereby we present the fi ndings by Bernadett Szabó Kovács from research performed on the region (Szabó-Kovács B, 2005).
In 2004 the Government allocated around 7 billion HUF to local governmental co-operation associations operating for at least three years. Settlement associations belonging to the statistical small regional system had the possibility of applying for 20-120 million HUF, with the following conditions:
• The highest support was given to associations that involve all the possible settlements in the particular statistical small region, and undertake the duties of at least three forms of public service for a duration of three years (public education – compulsorily –, plus social/children welfare institutional or social/children welfare basic care and health service – electively), as well as the joint management and organising of spatial developmental duties.
• Smaller support could be awarded to associations that had less population than the total population of the statistical small region, but at least half of the local governments in the particular small region, and minimum 60% of the

Pap Norbert • Végh Andor68
population (or 60% of local governments and 50% of the population) have joined the association. These associations must fulfi l the spatial developmental duties and provide simultaneously at least two public services for at least three years.
• Where the multipurpose small regional association was not created, there was possibility for submitting a purely regional developmental proposal too. In this case the smallest possible amount of support could be granted.
Many of the local governments took advantage of the funding opportunity advertised for multipurpose small regional associations. From the fi nancial sources provided by the Ministry of the Interior funding was provided for multipurpose small region developmental associations, spatial developmental associations and public administrational pilot projects. Out of the 166 possible multipurpose small regional associations 75 were formed until 30 June 2004, and 118 by 15 February 2005 (Budapest and Debrecen are separate small regions and were not allowed to submit proposals). In those small regions where the multipurpose association involving all the settlements was formed, the association performs local governmental duties as well as small regional spatial developmental duties. Where such a multipurpose association involving all the settlements was not created, spatial developmental duties are performed by the established small regional developmental councils.
Table 3. Statistical, spatial developmental and rural developmental small regions of Tolna county (Sources: Central Bureau of Statistics, Ministry of the Interior Ministry of Agriculture and Rural Development, Spatial Department for Development, Tolna County Local Government. Edited from own research by SZABÓ-KOVÁCS B. 2005)
Name of statistical small regionNames of spatial developmental and rural developmental associations
Statistical number of settlements
Multipurpose association: name and number of settlements
Spatial developmental association: number of settlements
Rural developmental association: number of settlements
Bonyhád statistical small region
21 21Bonyhád Multipurpose Small Regional Association
Spatial Developmental Association of Local Governments of Völgység
13 14
West-Völgység Spatial Developmental Association
8 7 (6+1)(1 settlement from the Tamási statistical small region)

THE INSTITUTIONAL SYSTEM AND WORKING EXPERIENCES OF HUNGARIAN... 69
Dombóvár statistical small region
16 16Dombóvár Multipurpose Small Regional Association
Spatial Developmental Association of Local Governments in Dombóvár and Vicinity
16 16
Paks statistical small region 14 14PaksMultipurpose Small Regional Association
Paks-Dunaföldvár Regional Developmental Association of Local Governments
14 14
Regional Developmental Association of Settlements along Sió-Sárvíz
10 (8+2(2 settlements from the Szekszárd statistical small region)
Szekszárd statistical small region
26 26SzekszárdMultipurpose Small Regional Association
Spatial Developmental Association of Local Governments in Sárköz
13 (12+1)(1 settlement from the Paks small region)
Spatial Developmental Association of Local Governments of the City of Szekszárd and Vicinity
26 26
Spatial Developmental Association of Local Governments in Zomba and Vicinity
10
Spatial Developmental Association of Local Governments in South-Tolna, Bátaszék and Small Region
10 (8+2) (2 settlements from the Bonyhád statistical small region)
Tamási statisztical small region
31 31TamásiMultipurpose Small Regional Association
Spatial Developmental Association of Local Governments in Tamási Vicinity
31 26
“Our Home Diósberény” Public Foundation
4
Total number of settlements 108 108

Pap Norbert • Végh Andor70
Summary
In the transforming Hungarian system of public administration, spatial development and fi nancing, serious amounts of task have been allocated to the small regional system created during the past fi fteen years. In the period before Hungary joined the EU (and also after accession) this spatial and developmental category has become the carrier of a number of developmental directions and projects.
From the example of Tolna county, one can observe how colourful the structure of this spatial co-operation form has become. From the expanding variety of forms and content of this ever widening co-operation one can clearly see that this continuously changing system will be able to adapt itself to the demands of new economic and social structures exactly by means of its diversity and versatility. It can be assumed that the small regional integration process of the local governmental system will continue – even if not because of the spatial developmental funding system, but due to problems of size-effectiveness and fi nancing –, and the strengthening of small regional system in the following years or couple of decades will be dominant in the life of the local level.
Literature
1. Csatári Bálint (1995): A kistérség fogalma. In: Csefkó Ferenc (szerk.): Kistérségeknek kistérségekről. Dunaholding City Menedzser Kft., Budapest pp. 11-15.
2. Csefkó Ferenc (szerk. 1995): Kistérségeknek kistérségekről. Dunaholding City Menedzser KFT, Budapest.
3. G. Fekete Éva – Bodolai Éva (1995): Kistérségi szerveződések megjelenése a területfejlesztésben. MTA RKK Északmagyarországi Osztálya, Miskolc.
4. Hajdú Zoltán (2001): Magyarország közigazgatási földrajza. Dialóg Campus Kiadó, Budapest-Pécs, 224 p.
5. Horváth Gyula (2001): OECD. Területi vizsgálatok. Magyarország. MTA RKK, Pécs. 220p.
6. Nemes Nagy József (1997): Régió, regionalizmus. In: Educatio, VI. 3. p. 409.7. Pálné Kovács Ilona (1999): Regionális politika és közigazgatás. Dialóg Campus,
Pécs-Budapest, p. 282.8. Pap Norbert (1998): A régió fogalom politikai manipulációjának lehetõségei.
In: Szuverenitás – Európai Unió – Regionalizmus, IV. Országos Politológus Vándorgyűlés, Székesfehérvár pp. 114-121.
9. Pap Norbert (2003): A területfejlesztési politika földrajzi kérdései. – Fejlesztés és fi nanszírozás. 2003/3 pp. 81-86

THE INSTITUTIONAL SYSTEM AND WORKING EXPERIENCES OF HUNGARIAN... 71
10. Pap Norbert (2004): A kistérségek helye, szerepe Magyarországon, a XXI. század első évtizedében. – Tér és Társadalom, 2004/3.
11. Pap Norbert (szerk., 2005): Terület- és településfejlesztés Tolna megyében. Babits Kiadó, Szekszárd, pp.427.
12. Pap Norbert (2004): A terület- és településfejlesztés cél- és eszközrendszere. In: Pap Norbert – Tóth József (szerk.): Terület- és településfejlesztés I. Alexandra Kiadó, Pécs
13. Winkler György (2001) : Kistérségek. ELTE Eötvös Kiadó, Budapest14. Ágh Attila – Németh Jenő (2003): Kistérségi közigazgatás. Magyar Közigazgatási
Intézet, Budapest, 343 p.15. G. Fekete Éva (2001): Együtt de hogyan? Innovációk a kistérségi fejlesztésekben.
MTA RKK, Miskoc – Pécs, 194 p.16. László Mária (2005): Önkormányzati gazdálkodás és a kistérségi együttműködés
– ösztönzés és/vagy kényszer? (Tolna megye példáján) . In: Bugya Titusz – Wilhelm Zoltán (szerk.): Tanulmányok Tóth Józsefnek. PTE TTK, Pécs, pp. 281 - 294
17. LÁSZLÓ M.–MAGAI M. 2005 A terület- és településfejlesztés szervezeti és intézményi rendszere. In: Pap N.-Tóth J.(szerk.)-Terület- és településfejlesztés I., A terület és településfejlesztés alapjai. Alexandra 2005 pp. 27–69.
18. Pap Norbert – Szabó Loránd (1997): Tolna megye településstruktúrája. – Közlemények a Janus Pannónius Tudományegyetem Általános Társadalomföldrajzi és Urbanisztikai Tanszékéról, Pécs, 22 p.
19. Pap Norbert (2005): A kistérségek problematikája Tolna megyében. In: Bugya Titusz – Wilhelm Zoltán (szerk.): Tanulmányok Tóth Józsefnek. PTE TTK, Pécs, pp. 295 – 306
20. Pap Norbert (2004): A kistérségek helye, szerepe Magyarországon a 21. század első évtizedében. Tér és Társadalom. XVIII. évf. 2. szám. pp. 23-36.
21. Szabó Kovács Bernadett (2005): A kistérségi szint főbb jellemzői Magyarországon. . In: Bugya Titusz – Wilhelm Zoltán (szerk.): Tanulmányok Tóth Józsefnek. PTE TTK, Pécs, pp. 83-94.

Nedeljko Bosanac • Ivana Barkovi}72
REGIONALISM, RECONSTITUTION AND THESES FOR DESIGNING A STRATEGY FOR ECONOMIC GROWTH AND
DEVELOPMENT OF SLAVONIA AND BARANYA
Nedeljko Bosanac, Full Professor Ivana Barkovi}, Assistant Professor
Faculty of Law in Osijek
Message:
“In Slavonia and Baranya every attempt to increase a GDP has been blocked in terms of newly acquired and added values!“
Overview
Intensive ageing of population as well as its overall wrong educational orientation send a strong message that economic regression indicates that population and economy are caught in a vicious circle of a crisis, since under such circumstances people aged between 20 and 35 are leaving this region and heading to Zagreb, Istria and, what is modern these days, to Ireland. It is not diffi cult to conclude that such trends of a demographic and economic crisis are mirrored in all other relevant issues and relationships.
We should not lose sight of important factors stipulated by such circumstances, such as: fi rst, the economy itself, specifi cally and traditionally conditioned (agriculture and industry) as well as the war and war consequences, and second, a complete political failure to adapt to new conditions, absence of a growth and development strategy, selection of huge chains of stores as the basis of growth and development of cities, etc. It can also be noticed that all other resources are neglected (as well). Among others, special stress should be place on education, science and the University. Therefore, it is quite obvious that the above mentioned circumstances must be promptly halted based upon new high-quality fundamentals in the community aiming at creating conditions for the policy of regionalism.
Key words: Regionalism, reconstitution, strategy, economy, education, science, Slavonia and Baranya, Slavonian Parliament.

REGIONALISM, RECONSTITUTION AND THESES FOR DESIGNING A STRATEGY... 73
Introduction
In the past period from 1990 to 2004 political factors did not manage to solve any problems referring to the growth and development of Slavonia and Baranya. During that period the Slavonia and Baranya Region faced unbelievable negative changes.
Demographic features of population, the situation in general and trends assumed strikingly negative tendencies, even worse in comparison with the overall bad tendencies at the level of Croatia, which has the worst demographic degression in Europe. What demographic tendencies are still ahead of us, if we point out the data that the source of their negativity is concentrated in the sample of the situation in the economy.
At the moment Slavonia and Baranya are absolutely in the state of the economic and general crisis, which is made especially clear when it comes to characteristics of their economy as monocultural and existentially dependent on the natural setting(land, forests, water). You may well say that the present situation pertaining to the economy of Slavonia and Baranya is worse than the one experienced in 1950.
Intensive ageing of population as well as its overall wrong educational orientation send a strong message that economic regression indicates that population and economy are caught in a vicious circle of a crisis, since under such circumstances people aged between 20 and 35 are leaving this region and heading to Zagreb, Istria and, what is modern these days, to Ireland. It is not diffi cult to conclude that such trends of a demographic and economic crisis are mirrored in all other relevant issues and relationships.
We should not lose sight of important factors stipulated by such circumstances, such as: fi rst, the economy itself, specifi cally and traditionally conditioned (agriculture and industry) as well as the war and war consequences, and second, a complete political failure to adapt to new conditions, absence of a growth and development strategy, selection of huge chains of stores as the basis of growth and development of cities, etc. It can also be noticed that all other resources are neglected (as well). Among others, special stress should be place on education, science and the University. Therefore, it is quite obvious that the above mentioned circumstances must be promptly halted based upon new high-quality fundamentals in the community aiming at creating conditions for the policy of regionalism.
Conditions should be created in Slavonia and Baranya the result of which would be the annual growth rate of 10% in the next 10 years and that would then enable revitalization of economy and reconstitution of the society in general and stop the transformation of our region into a geriatric environment.

Nedeljko Bosanac • Ivana Barkovi}74
Slavonia and Baranya must present their problems as national, since agriculture and reindustrialization as the bases for their growth and development and the way for solving a general crisis in the region contribute to solving the problem of the country’s balance of payment, as well as the way of integrating national economy, which has been impermissibly disintegrated and made subordinate to both Croatian and foreign monopolies.
By defi ning the strategy for public and economic growth and development of both Croatia and local community units, it has become evident that independence of the developing region must be provided for.
Taking the existing constitutional solutions as a starting point, it was necessary to defi ne the region on new foundations. This refers equally to legal and economic aspects of the growth and development strategy.
Growth and development of the region must proceed not only from comparative advantages, complementarity to other regions within the country, but also from the present situation and possibilities of growth and development. Thus, development disturbs current relationships between numerous factors and creates new equilibria of all relevant factors, both interfering and interacting.
A region is defi ned as a union that comes into being as a result of an agreement between counties. There are 4-5 characteristic regions in Croatia which meet criteria stipulated by the European Convention (Committee of the Regions). Hence, conditions for regionalism must be stipulated.
For the purpose of researching and defi ning regional growth and development, the following key issues should be determined for a longer period of time: general economic, ecological and social regularities on the basis of which growth and development can be funded and specifi c characteristics of the region and behavior of subjects can be recognized which determine organized and/or disorganized impacts of general growth regularities.
Development, both global and national and regional, is conditioned by the overall development of all factors (economic, ecological, technical, technological, social, political, etc., such as interfering and interacting environments).
Economic growth and development is just a subsystem of development in general. Crucial growth and development factors are the following: starting point from which development commences, technical and technological needs and changes, natural possibilities and restrictions, population and its structure with evaluation, human resources and demands, etc., such as religious and other events and relationships.
Therefore, regional development makes a (simulated) system in which there exist fi xed elements (subject to change in the long run), such as: space, resources,

REGIONALISM, RECONSTITUTION AND THESES FOR DESIGNING A STRATEGY... 75
population and other, then target elements, which represent part of the development program, such as changes in the economic structure, and fi nally, factors that appear just like that without being included in the development program, such as the following: wars, economic crises, natural disasters, important political changes, or development of science, engineering and technology, new discoveries, new products, etc.
Regionalism within the framework of both national development as well as concepts and strategies pertaining to growth and development of the country and its integration into the European Union is of crucial importance to the region itself and to a modern country in European context.
Not only is the Croatian country Slavonia and Baranya invited to represent and capable of representing the state in a regional sense, but the existence problem of the community is directly dependent on capabilities of Slavonia and Baranya residents to be self-represented within.
Slavonia and Baranya obviously lags behind others which follows from a shift of historical reality with discrimination against agricultural complexes caused by prejudice and the Croatian low self-esteem. Instead of insisting on concepts and strategies, not rhetoric, based on our own tradition, according to a foreign model, Croatia wanted to be regulated unitary, thereby producing incoherent and illogical internal tensions.
With respect to domination of a neo-liberal economic idea from 1990 to 2005, theory and practice in Croatia did not consider the problem of regional development a problem at all, so in line with those policies no new solutions were offered offi cially. The fi rst important document is “The concept of regional economic development of the Republic of Croatia” (1999). However, that document is full of political prejudice and its concept boils down to the following viewpoint: “regional policy in Croatia should be decentralized and implemented at the level of counties”. This implies that conceptually regional policy in the whole is relocated to the level of counties, whereas regional policy is pursued “from the bottom”! Hence, the basic attitude towards regional development represents a continuation of neo-liberalism based only on “decentralization” with government investments in infrastructure that would “additionally stimulate development of mountain, border and depopulation areas” and especially island economy.
In our opinion, the Slavonia and Baranya region should now start moving towards regionalism as the process of regional independence and strengthening in all segments of growth and development, in order to make regionalism a competitive starting point in the overall development of any country.
A classical approach to development, in which the foundation of growth and development was to exploit nature and society in undeveloped and powerless states

Nedeljko Bosanac • Ivana Barkovi}76
and/or territories, should die out, and sustainable growth and development should take place instead, which rely on competitive and comparative advantages, balanced development of all parts of a region and its cities, as well as a clear defi nition of the regional center observing thereby policy standards of big cities (e.g. Osijek as a center of regionalism of Slavonia and Baranya).
These principles of regionalism of Slavonia and Baranya are as follows:
1. Development is conditioned by comparative advantages of the region, which must be defi ned, developed and used.
2. Development must guarantee to permanently meet interests and needs of the community living in the region.
3. Development must be complementary and competitive with respect to development of other regions within the country, as well as regions in neighboring countries (policy of economic, market and “triangles of interest”).
4. Development should contribute to goals of the government economic policy, whereas regional factors should be obliged to and responsible for the situation in the region, such that their economic policy becomes competitive with respect to regional development of the country as a whole.
5. Regionalism entirely depends on quantitative and qualitative foundations for population evaluation.
6. Development should rely on the unity of economy and ecology, space exploitation, as well as complementarity of all aspects of human activity.
7. Development must be based upon a general consensus of all political factors for a longer period of time.
8. Local community and self-government should take care of development in the region, carry out reconstitution of present political, social and economic relationships regarding the policy of regionalism.
9. Regionalism policy, its growth and development should be adjusted, headed and followed by expert teams and institutions.
The policy of regionalism should be considered a subsystem of national development, development of a broader area (regional in the sense of big macroregions that can be regarded as transnational regions (e.g. Central European Region, the Danube Region, Mediterranean, etc.) of continental and global development. For regional development interest and impacts of the environment are not conditioned only by regional and national, but also by much broader interests. Of course, it does

REGIONALISM, RECONSTITUTION AND THESES FOR DESIGNING A STRATEGY... 77
not apply to all aspects of regionalism. Development of e.g. local community and/or some public activities is primarily interesting to the local and regional community, development of the primary and the secondary sector is of regional and national interest, while some productions can be of both continental and global interest, whereas communications, ecology, science, etc. are at the same time of regional, national, continental and global importance.
Regionalism plays a very important role in lives of individuals living in the region, since through regional development their interests and needs are met. Development also enables life of better quality in the region. Within the framework of democratic institutions, inhabitants of every region want to make decisions pertaining to their lives alone. Therefore, development of the region is conditioned by the democracy for decision-making.
From the viewpoint of the state, development of the region is a subsystem of development of the state. But, quality of the system depends on the quality of the subsystem.
1. Criteria for distinguishing regional features
Criteria according to which regional features are distinguished vary. If economy is taken into consideration, its content is determined by the economic structure and subjects as key issues concerning growth and development. Here cities are very important, considered in terms of their power in economy, policy, culture, education, etc., such as the strategic position and close proximity to road, railroad, water and air communications and the existing infrastructure.
The city of Osijek is the most important and the biggest town in Slavonia and Baranya. It is quite normal to consider the city of Osijek a regional center from which growth and development of the Slavonia and Baranya region should be signifi cantly infl uenced. As it is nowadays, Slavonia and Baranya lags behind the “national average” socially, economically, culturally, scientifi cally, educationally and politically. This is especially refl ected in a high and permanent unemployment rate, severe decrease in production, a high migration rate out of Osijek and other towns and regions, a low level and a slow increase of the GDP, etc. Infrastructure has also lagged behind and thus not adapted to new conditions and there has been various political lobbying always directed against authorities and never towards success as a result of unity and cooperation. Now in a new political era in the County we have a chance to fund a political and professional wish to improve the current situation (i.e. the city of Osijek provides capital investments for revitalization of both city squares, which will not solve any of the problems, except politically, prior to elections (defi nitely!)). A question naturally arises: Is it possible that in a city as
Nedeljko Bosanac • Ivana Barkovi}78
big as Osijek these fourteen years of lagging behind with respect to development as well as growth completely misdirected towards overcrowded chains of stores responsibility for the (un)done will be evaded?
Meanwhile, that neo-liberal economic theory, which supports the view that differences in “the national average” are temporary and short-term, that unemployment is short-term, and that the revenue per capita is temporarily low, sustained a crushing defeat.
They also hold the opinion that in the course of time market lines of force will affect the balance of the level of development (convergence theory). However, our unemployment rate is increased, the standard of living is lower, socio-economic picture of population is complicated, production is lagging behind, institutions are bureaucratized, judiciary is expected (?), etc.
Why in Slavonia and Baranya nobody can notice that companies are moved to the region with a lower unemployment rate and a lower income? Why these companies cannot see that in our region lower costs as to labor force are visible on the surface? At the moment we have an inversion, i.e. labor force is moving from Osijek and Slavonia and Baranya to more developed cities and regions in Croatia (e.g. Zagreb, Istria). This real shift of labor force from poor Osijek and Slavonia and Baranya takes place under pressure of a richer job offer, better employment and higher salaries.
However, we have lately experienced a revival of the interest in regionalism and regional policy in establishing production and service complexes providing stable living conditions, high-quality and inexpensive supply of various services (industrial districts, technology parks, growth poles, research centers, fi nance, educational system, etc.).
An increased interest in regional policy also emphasizes the issue of the system of functioning referring to local government and self-government (e.g. the Parliament of Slavonia and Baranya headquartered in the building of the Croatian Chamber of Commerce in Osijek) with the overall network of institutions and businesses in regions. As to that issue, there increase both the interest in and the need for management and marketing of institutions in question (cities, counties, various profi t and non-profi t institutions), which make a network of local and regional economy.
On the basis of the document “Development priorities of the Republic of Croatia in the period 2002-2004” an emphasis is placed on the following fundamental elements of regional development and policy of regionalism:
1. by the year 2010 the difference between “the most and the least developed regions should be reduced to the ratio of 2:1 (measured by GDP per capita),

REGIONALISM, RECONSTITUTION AND THESES FOR DESIGNING A STRATEGY... 79
2. in the same period, by means of the “national policy” current differences in the fi elds of employment, health care and education should be reduced by 25%,
3. development and living conditions in specifi c regions should be improved (border areas, underpopulated areas with unused natural resources, islands, war-affected areas),
4. “regional system” should be built (regional units, new institutions for regional planning),
5. regional system should be harmonized with the EU system,
6. regional policy should be formed such that the Republic of Croatia starts using EU funds for regional development as soon as possible,
7. the Croatian Government will “form a Commission for regional development and policy”,
8. counties, cities and municipalities will represent active participants conducting regional policy.
It should be kept in mind that the current government and the Croatian Parliament have gradually changed their relationship towards concepts, strategy and policy of regionalism, which represents a favorable circumstance.
A thorough change of government policy is necessary in this fi eld due to the following:
• optimal economic development of Croatia with policy of increasing competitiveness of the Croatian economy based on available and unused resources (physical, human and social),
• need for harmonization of regional policy with the EU system and policy,
• need for a more uniform economic and social development of all areas in Croatia for the purpose of stopping a trend of demographic “emptying” threatening to “empty” some areas in the next two decades (this especially refers to Slavonia and Baranya).
Hence, as regards the attained level of the total growth, as well as development, the need for a faster convergence of regions and Croatia with respect to the EU, inherited regional disproportion, negative impacts of the war, etc., it is not appropriate for Croatia to have a “classical” neo-liberal policy referring to the regional development, which is confi rmed by economic facts from the 15 years, the period during which regional disproportions increased and Croatia started to lag behind developed European countries.

Nedeljko Bosanac • Ivana Barkovi}80
Furthermore, the reason of a negative inheritance of a classical “state interventionism” policy in the fi eld of regionalism should be stressed. It goes without saying that such policy should be abandoned. Regionalism policy should be approached in a complex way, paying a lot of attention and sensitivity, since it is that policy on which future economic and social growth and development depend. It is necessary to combine an approach including our past experience, but also the EU experience, where a sophisticated model of regional development is developed, which has yielded good results in some countries.
The current regionalization in Croatia should be abandoned since it represents an “improvised” condition not created on the basis of economic criteria, and a “rump” decentralization of the fi scal expenditure done in 2001 does not enable formation and application of interregional tax communication and competitiveness.
Competitive regional tax policies (of tax revenues and expenditures) can represent a representative economic basis for the application of numerous modern marketing concepts on the level of cities, counties and other profi t and non-profi t institutions interested in a faster economic growth of the region.
As to the issue of defi ning constituent elements of regionalism policy referring to Slavonia and Baranya, expert teams should be formed, that would operatively research the following:
1. fi nancial results of entrepreneurs per counties; 2. data on the number of entrepreneurs per counties; 3. data on the number of employed persons per counties; 4. data on the number of unemployed persons per counties; 5. data on the total revenue and expenditure per counties; 6. data on the profi t tax per counties; 7. data on the net profi t and the net loss per counties: 8. data on the consolidated fi nancial statement per counties; 9. economic indicators of Slavonia and Baranya;10. general characteristics of the Slavonia and Baranya economy;11. national processes;12. position of Slavonia and Baranya;13. labor market;14. economy and economic setup;15. global effectiveness;16. investments;

REGIONALISM, RECONSTITUTION AND THESES FOR DESIGNING A STRATEGY... 81
17. fundamental fi nancial results;18. secondary market;19. regionalism and globalization;20. the role of “Agrobank” in the regional development of Slavonia and
Baranya;21. noneconomy;22. religion;23. university;24. sports.Such approach to the strategy of regionalism policy has an advantage since it
relies on the existing not only on new resources.
We should not lose sight of the problem of creating a basis for the design of our own regional growth and development strategy referring to Slavonia and Baranya, which would be superior to the existing strategy of neglecting the rural area or the strategy of “transforming” the rural area into an urban one.
Sustainable rural development strategy must be based upon a strong relationship with tradition in all its segments, but it must also start from the hypothesis that it can be used as a signifi cant initial resource for various entrepreneurial activities, especially in the fi eld of rural tourism. Such practice would generate the need for completely new activities and businesses, especially in the service sector, like developing tourism and trade, museums, local applied art and handicraft production and presentation, publishing, etc., which would result in a higher employment rate of the population and a better chance for the young and educated people to stay within the region. When it comes to tourism and trade, it should be particularly emphasized that Slavonia and Baranya could provide its specifi c and recognizable product that would be a result of the interaction between agriculture and tourism (agritourism business).
As things are now in Slavonia and Baranya, Osijek-Baranya county and the city of Osijek, neither successful economic policy nor the process of decentralization can be recognized.
What should be clear at the moment is the fact that the usual method of consultation, negotiation, grumbling and delay cannot be used any more, and that this time, in the system of decentralization, (right) political credentials will be displaced to the knowledge and competence market. Speaking of the knowledge and competence market, let us mention that in our weary economy assistance given by an illusionist will be greatly appreciated.

Nedeljko Bosanac • Ivana Barkovi}82
Perception of a rich region is usually directed through domestic policy that farmers and weary manufacturing industry are to be blamed for lagging behind. It is these people who cannot make a deal with the government – What do they actually want with prices?
Trade, catering and tourism depend on both the attractive offer and the purchasing power. Trade, especially retail trade, is constantly under attack. The number of workers employed in trade has been reduced. The so-called “lost generations” are drafted as salespersons, who are, as a rule, extremely underpaid for the amount of work they do. But, as a message of development possibilities, there appear new forms of trade, e.g. product exchanges, i.e. discount stores for agricultural products. That message makes sense if and only if we “change” the way of thinking and start directing Slavonia and Baranya production and trade towards a new tourism-oriented future. The message will make sense when our publications and other media start presenting e.g. the Slavonia and Baranya region and the Osijek-Baranya County and their productive forces, when specifi c production potentials become directly linked to the tourist season, when our products become in continuo present on the coast, when our products sold in chains of stores signifi cantly contribute to tourist spending and vacancies for domicile labor. Due to that transformation, productive forces of agriculture and food processing industry of the region and the Osijek-Baranya County is of great importance to tourism of Croatia. E.g. the Osijek-Baranya County covers an area of 3,500km2, which makes 6.5% of the Republic of Croatia. According to the 2001 census, 341,180 people live in that area, which make about 7% of the total number of population living in Croatia. About 230,000 hectares of plough-fi elds represent the most important part of production in the county. 300,000 tons of wheat, 30,000 tons of barley and 450,000 tons of corn are grown there. In terms of industrial crops, there are 3,500 tons of oilseed rape, 40,000 tons of sunfl ower, 3,000 tons of soybean and 450,000 tons of sugar beet. In addition to this primary production, over 10,000 tons of grapes are also produced. If livestock production is added to such production as well as processing of over 30 mil liters of milk, over 20,000 heads of cattle, 200,000 pigs, 50,000 sheep, 711 horses and 600,000 poultry, then it can be seen how impressive productive forces of this region are. We should not forget to add fi sh and fry of about 1,200 tones as well as over 160 tones of honey. In terms of percentage, this primary production with respect to Croatia implies 20% of wheat, 33.5% of sugar beet, 56% of sunfl ower, 45% of soybean, 18% of corn, 3.6% of heads of cattle, 11.1% of pigs, 3.5% of horses, 5.7% of sheep and 4.5% of poultry. Milling industry and baker’s trade in the county engage 7 stock corporation mills with the total annual processing capacity of 200.500 tones. Two industrial facilities in the county with the annual capacity of 3,968 tones produce pasta. There is one oil refi nery in the county with the annual capacity of 5,000 tones of refi ned oil, and the only

REGIONALISM, RECONSTITUTION AND THESES FOR DESIGNING A STRATEGY... 83
sugar refi nery functioning in the county has a capacity of producing 62,500 tones of sugar. Currently, there is only one factory dealing with fruit and vegetable processing with the capacity of 2,000 tones. There are also capacities for juice production. Confectionery industry has a capacity of producing 38,000 tones of various products. A signifi cant factor in the brewing industry is the Osijek brewery with the annual capacity of 500,000 hl and capacities for juice production, whereas wine production in four big wineries with the total capacity of 2,012 wagons produces fi ne wines of good quality. In 24 hours dairy industry processes 200,000 liters of milk into butter, yoghurt, cream, cheese and cream cheese. Slaughter and meat processing industry with daily capacities of 1,300 pigs, 235 heads of cattle, 500 sheep and lambs and 24,000 poultry, as well as high-quality processing of medium- and long-life products enables production of fresh and processed meat for all markets. Moreover, there are also capacities for fodder industry with the annual production of 270,000tones. Such productive forces in agriculture and processing of Slavonia and Baranya represent an important factor of the overall development of the processing industry, trade, catering and tourism in the region.
Finally, if we mention that the total output can rely on primary commodities produced in the region and taken as the basis of the overall food and drinks production, the picture of development capacity of Slavonia and Baranya is complete.
2. Wrong growth and development of the city of OsijekIn a socio-economic sense, the city of Osijek, as a future development center of
the region, has not been developing well at all, and both the region and the County feel it as an increasingly heavier millstone, since it will be neither possible nor allowed to cover this deliberate shift of debt to the government from the budget.
The fact that growth and development of the whole region of Slavonia and Baranya have been misdirected and headed without any broader concept is specially disturbing.
We have to insist on the fact that the time has arrived for the policy to shift towards Slavonia and Baranya. Too much time has been lost for the purpose of fi nding “quick” solutions, which obviously do not give expected results. Thus, e.g. Osijek is full of a variety of huge chain stores employing salespersons and cashiers and others who are underpaid and deprived of any rights. Or, which is even worse, aware that one day their daughters and sons will be salespersons and/or catering workers. From a social point of view, it will take decades before they form their own families, have children and security.
Therefore, reindustrialization and the competitive city of Osijek have the region of Slavonia and Baranya as its stronghold. First of all, reconstitution and

Nedeljko Bosanac • Ivana Barkovi}84
revitalization of all of its comparative contents and advantages should take place, and then by means of the growth and development policy, reindustrialization should be defi ned.
Hence, the time has come for the political turn towards agriculture that can represent a good starting point not only for reindustrialization but also for making Osijek a big competitive city.
The fi rst move would be to convince the government policy, not politically but by means of programs, to take some other steps concerning agriculture in Slavonia and Baranya, since it can make a completely different economic picture of Croatia, and the production basis that would make profi t.
Capital intensive agriculture in the Slavonia and Baranya region is not supported by any agricultural bank. In that way agriculture in Slavonia and Baranya has been discouraged from the inside since in modern Croatia there is no special bank for credit fi nancing agriculture. Exceptions to the rule are cooperative bank emerging. Foundation of the “Agrobank” in Osijek is an extremely important factor for agriculture in Slavonia and Baranya.
Agriculture based on new foundations would represent a signifi cant beginning of the reindustrialization process. This and such reindustrialization would entirely release agricultural-processing industry and contribute to forming a new industry in line with modern tendencies concerning nutrition of population in Europe. It requires much modernization since we have to take into account severe competition on the European market. Our neighbors Hungarians, then Czech, Serbian, Macedonian, Bulgarian and other producers of such products are our direct competitors. To us it would be a new beginning since we have traditional knowledge and values in that production. What we need is the capital and time that would create conditions for a fast reindustrialization and regional affi rmation of the country in Europe as well as Slavonia and Baranya in Croatia.
It should be stressed that commercial capital is subject to fast changes, but unfortunately, reindustrialization policy is subject to very expensive and slow changes. We have run behind schedule so far when it comes to the question of growth and development. If we use all of our potentials and create conditions for reindustrialization, we will solve a complex problem of unemployment and socio-economic structure in the region, County and the city of Osijek.
3. Education and development
Minister of Science, Education and Sports announced that pupils who enroll in grammar schools in school year 2004/2005 must compulsory take the national

REGIONALISM, RECONSTITUTION AND THESES FOR DESIGNING A STRATEGY... 85
school-leaving examination at the end of their fourth year. For a number of years the whole world was concerned with the education phenomena in Japan. All were fascinated. They also researched a series of reasons for suicide among pupils and freshmen, isolation of some young people from society and the overall isolation from the outside world which has placed unbridgeable obstacles in their ways referring to competition, knowledge and other issues, such as individual illnesses, alcohol, drugs, etc.
However, all researchers pointed out one common trait, i.e. Japanese society is strictly traditional and well ordered with powerful economy and an entirely coherent domestic and foreign policy isolating Japan from the rest of the world and placing it on top of the pyramid of values that should be followed. But, Japan is a strong and well organized state whose rule of law is, from our point of view, formed almost to perfection, and in which democracy is admiring. On the other hand, youth in Croatia has been formed differently. It is the youth which does not differ (differs) from the Japanese with respect to knowledge and demands. Just the conditions they live in are different. Can conditions with overstretched contents in poor and underdeveloped economy be changed without causing any deviations that will be diffi cult to follow? Japanese youth is strongly oriented from birth. An increasingly greater number of demands arises constantly, but at the same time, a lot of attention is paid to that sensitive resource by providing full care in an organized, systematic and institutional way. Does anyone take care of the youth as a resource in Slavonia and Baranya? Do we make moves according to the old proverb with a frog, a horse and shoeing!
With respect to the procedure and counseling done by the Ministry, it seems that for the fi rst time since independence we have made a structurally very signifi cant and symbolic move in one important segment of the society. It is even more important than it seems to be because the process of transition has permeated almost every pore of the society, excluding education, especially higher education, and especially in Slavonia and Baranya.
The youth represent a resource which can signifi cantly contribute to harmonization of Slavonia and Baranya with European contexts.
Croatia does not have a problem with the ill-behaved youth, but with the educational institutions. Such superfi cial penetration into the way of thinking of our youth is based on quite realistic foundations.
Namely, their views of the world, studying and life are strongly based on everyday practice, which is completely familiar to them, and which they cannot change just like that, although they would like to do that. Very often they use the expression “Make a move!”. What would they actually like to move? They usually level their criticism against some social deviations they faced while studying. They

Nedeljko Bosanac • Ivana Barkovi}86
can immediately tell who does what and how they can become successful. As a rule, there are no surprises when it comes to the position of some of their colleagues in the society in general, at the faculty, in the city. Almost as a rule, they believe that some of their dreams can come true outside Slavonia and Baranya, Osijek and Croatia. Somewhere there, abroad, they suppose they can be fully renowned.
4. Science having growth and development of the region as its purpose
Faculties networked into the J.J. Strossmayer University of Osijek are just individual institutions offering education within their respective facilities, but it is very diffi cult to think that the university will reorient towards the problems of growth and development of the Slavonia and Baranya region, the County and the city of Osijek, especially in terms of practice.
Faculties, and especially the University itself, have not achieved reinvention which would take illumination as practical perception of the importance of adjusting to new economic principles, i.e. knowledge economy.
Retaining the knowledge at faculties and University institutions means approving of the dominating hierarchical structure suitable neither for the implementation of innovative processes nor for democratization of organization relations. Everything boils down to the personnel policy referring to administration and management positions as well as employment of new and/or future scientists. A parasitic relationship towards spending budgetary resources has been established within which faculties and institutions became purposeful by default.
Moreover, on the national level (especially in Slavonia and Baranya), knowledge is not treated as an important resource of modern business activities and therefore it is not surprising that a systematic introduction of most recent innovations, knowledge and services represents an exception, not a rule.
Such situation should be changed if we want Slavonia and Baranya to shift from a misunderstood framework of Croato-centrism to acceptable growth and development of all contexts of Croato-dispersion (education meeting the needs of Slavonia and Baranya, as part of the policy of regionalism).
Care for centralization of all ideas and the intellect in general, which can be found only in Zagreb, opens up a possibility of taking phenomena of nepotism, paternalism and elitism as normal, which are at foreign universities subject to prosecution and administratively continuously controlled. Such phenomena at Croatian universities tend to be declared honorable, whereas any disapproval might cause casting out, humiliation and threats, all falling into a broad area of violation of human and civil rights.

REGIONALISM, RECONSTITUTION AND THESES FOR DESIGNING A STRATEGY... 87
Processes are avoided, the goal of which would be to infl uence growth and development of the region providing support, as well as to bring knowledge and science closer to the public, thereby suffering consequences of the overall condition together. Avoiding the public and hiding hypocritically the ruling elitist and paternalist internal communication at faculties has blocked competition of knowledge, invention and ideas, which has signifi cantly affected the material status of the university that exists in a poor, neglected and underdeveloped region of Slavonia and Baranya (Baranya and the African unemployment rate).
The exact data referring to the J.J. Strossmayer University of Osijek which mention that 523 scientists, lecturers and associates are employed within the University with 10,427 students, and that natural sciences, technical sciences, biomedicine and health care sector, social sciences and humanities make 6.2%, 16.4%, 17%, 45% and 12.4%, respectively, do not represent any step forward.
An overview of the number of students enrolled in the fi rst year of the application-oriented undergraduate study program in academic year 2003/2004 shows even worse percentages with respect to scientifi c fi elds. 17.3% of students enrolled in programs in technical sciences, 9.4% in biotechnical and 73.3% in social sciences.
It is not diffi cult to draw a conclusion from these data that the whole region has been developing in a wrong direction. That condition is both exhausting, measured by workloads at foreign universities and their faculties, and poor, with respect to higher education processes present in the environment of knowledge transfer to students without application of knowledge of economy and joint responsibility for the overall growth and development of the region.
In such conditions there is no knowledge competition, faculties are becoming gerontological institutions in which personnel high appointments are on average over 55. Employment of younger personnel is reduced to painstaking assisting without any signifi cant and recognizable market conditions and knowledge competition.
5. Mistakes of macroeconomic growth and development of the region
Mistakes of macroeconomic growth and development of the Slavonia and Baranya region should be halted and the region should be reconstructed in these pre-integration times of our accession to the European Union for the purpose of redefi ning economic policy (by 2015) that should guarantee survival of our product in order to show that community that we know how to produce, and not only how to incur debts and buy somebody else’s products. By such redefi ned economic policy we introduce Europe to the fact that traditional values of the specifi c Croatian production would enrich the European goods and commodity market.

Nedeljko Bosanac • Ivana Barkovi}88
At the same time, we have emphasized that we are ready to have our place and recognizability at the European market that will gain profi t which will be further invested into national growth and development.
6. Mental metamorphosis in the region
Now, in peace-time, and for the sake of our future, our social and economic growth and development, it is necessary to re-attain that war motivation that would now have a character aimed at development.
Consistence of all of our motives as parts of the regionalism policy with necessary mental metamorphoses in the region at all levels of education, culture, religion and sports can help us reach our goal – competitive Slavonia and Baranya.
For the purpose of development, it is necessary to make authorities responsible, and within the framework tools used for motivation and required for development employees in companies should be motivated. This can be done by means of the system of management that would stimulate rationalization and new solutions to the existing technologies or an introduction of new technologies as well as participation in the management of a company as a legal obligation, not only as an unaccomplished constitutional possibility. Citizens should be motivated to do voluntary work in their municipalities, cities and various activities, thereby reducing costs and having a positive effect on development in general. Inventive work should be encouraged as well, by setting up centers that would enable realization of ideas as well as acceptance and implementation of innovations in national companies. Furthermore, it is important to encourage scientists to solve development problems and projects and to develop technical, technological, organizational and other ideas. Scientists should (also) be engaged outside the faculties in a practical sense, whereas at faculties they should transfer their own achievements and knowledge for the overall practice. Citizens should be motivated to purchase both government and local government bonds and to take over a series of business activities that can increase employment by founding various types of cooperatives which would be supported by smaller banks on the local level.
Motivation factor should become a constituent part of any stimulation provided by the government, through its funds and tax benefi ts offered to companies developing their own knowledge.
Unfortunately, the motivation factor is lost due to closing down of some scientifi c institutions, distrust of our own science, non-introduction of participation, etc. Its part is irreplaceable in the development policy of every country thinking of its future. With respect to this issue, a motivational process should be launched

REGIONALISM, RECONSTITUTION AND THESES FOR DESIGNING A STRATEGY... 89
the result of which would be a mental metamorphosis, that would very soon show outstanding results in every segment referring to growth and development of our society and economy of Slavonia and Baranya.
The fundamental assumption concerning the mental metamorphosis as a driving force of development should be a change of the current and created system of values. That diffi cult and worrisome job is worth its while since it will bring us to a successful reconstruction of our economy and a democratic reconstitution of the Slavonia and Baranya region.
7. Strategy of social and economic development
Strategy of social and economic development is the main topic in the Republic of Croatia. After ten years of stagnation concerning development of democracy, society and economy, in the year 2000 a favorable environment was created, but the economic situation has complicated, and stagnation has not stopped. It acquired characteristics of a general crisis of the Croatian society and economy.
Republic of Croatia is now in a new environment which offers it new conditions by which its development can speed up, but on the other hand, they made its internal problems signifi cantly more complicated. Implementation of the UN methodology for determination of the concept of development is very demanding and an enormous effort should be made by a country like Croatia. In order to provide conditions favorable for recovery and surmounting a crisis, some of the existing views should be abandoned, which encumber economic theory and practice, and refer to revision of privatization that should be carried out, false dilemma regarding the parity of kuna, ownership of the means of production, leaving an impression of the former society Croatia left and became an independent country, superiority of macroeconomy to microeconomy, since national wealth is obviously made in economy and companies involved in production.
The development strategy can be represented as a system in which goals should be set, after which there follows their realization. Thereby, a series of factors referring to he system has to be harmonized, such as the structure, functions, standards, environment, human factors, management, distribution, credit policy, prices, etc.
However, a question naturally arises: Whose hands is our future in? We tried to fi nd the answer to this question on the website of the Government of the Republic of Croatia, where we found “The program of the Government of the Republic of Croatia for the period 2000-2004” (Zagreb, February 8, 2000). After studying the contents of this program, we could not help feeling that particular activities per individual ministries are represented in a completely stereotypical way. The content
Nedeljko Bosanac • Ivana Barkovi}90
included the following: democracy and rule of law (what would be the opposite?), economic policy, social welfare policy and public services, domestic policy, foreign policy and conclusions. Very important regional issues are present as well, such as: European Union, NATO, USA, Russia, Agreement on Stabilization, Regional cooperation, Relationships with neighbors, Countries in transition, promotion of economic interests, all as part of foreign policy.
Social and economic development strategy of the Republic of Croatia should start with economic recognizability of the country and its individual regions. These regions should be reconstituted in accordance with European standards from the policy of regions.
Cooperation between science and economy might results in new ideas and possibilities needed as central values for all promotions in all segments of the national development i.e. development of the national economic, political, social, cultural, university and other type of environment. It is important for a young country that has recently become independent and an international subject.
Here the essence should be stressed and we should orient toward the need for and the function of creating recognizability for the existence, proper functioning and development of the regional economy.
At the present moment, at our new beginning, we are not able to envisage orientation, encouragement, and integration of our potentials, whereas for the world we are still not recognizable enough.
Development strategy for Slavonia and Baranya is a logical and the only possible answer to all of our wishes for successful and fast development. Improving the quality of life as well as paving the way for the accession to the European Union are just but starting points that can be approached in different ways, but there is one common wish shared by all of us: how can real concepts of economic development of Croatian regions be created as a solid foundation for an objective strategy of development, tactical goals and concrete tasks of the Croatian society and economy. Thereby, a great number of political, social and economic delusions should be displaced, which have overpowered the overall relationships in Slavonia and Baranya, the county and the city, as well as in the Croatian society and the country in general.
9. Transitions and mistakes
By ownership, foreign capital was meant, in the sense of a starting position, according to which individuals claim that development is possible only if that capital is invested. Opinion of other people was completely neglected!?

REGIONALISM, RECONSTITUTION AND THESES FOR DESIGNING A STRATEGY... 91
These others share an opinion that foreign investments represent just one of possible sources of investment, taking into account national/regional capital, which was, as a rule, treated as less valuable and out-of-function.
There are various points of view, but here we would like to emphasize the one claiming that only new technology can start development. Attention is not paid here to the fact that development is only but a regular motion with no breaks possible without a drastic infl uence on further development. Supporters of such standpoints, almost as a rule, forgot what can be brought by the national/regional structure of economy and technological development. There occurred the extreme: national/regional capital is not considered at all and it is politically absolutely underestimated.
Delusions of former carriers of economic policy in the Republic of Croatia have started to be manifested in form of the overall lagging of Croatian regions, society and economy.
A long-lasted economic and political crisis in the former socialist countries resulted in a disastrous collapse of the overall social system of those countries. Naturally, what caused a political crisis originated primarily in the economic (fi nancial) sphere, and it is exactly that segment that acted as a catalyst in the breakdown. Namely, problems in a spiritual sphere are coped with better in economic welfare, and vice versa. A downfall of a social system assigned a task to scientist to fi nd a way how to switch from the past into a new system which would not be familiar with shortcomings of the previous system and which would be over the long term more stable and superior to the previous one in the fi eld of economic activities, as well as political and other activities.
Development strategy deals with theoretical and practical aspects of that problem. It requires a complete elimination of the former theory of system convergence, thereby avoiding any modifi cation or revision of the former system.
By adopting the theory and policy of transition the Republic of Croatia has opted for the principle of the so-called one-way return from socialism to capitalism.
Basic principles of the theory of transition have been adopted, and these are: indisputable privatization, development of market institutions and market economy. These principles are derived from the model of maximization of individual interests i.e. benefi t by means of absolute competition at the commodity, labor and capital market.
Practical aspects of transition are more complex that theoretical ones because of the diffi culty in applying the theoretical knowledge to the organism called national economy and society as a whole, including powerful ideologization towards the approach to the system itself.

Nedeljko Bosanac • Ivana Barkovi}92
Application of the theoretical knowledge implies absolute respect of scientifi c principles as a matter of procedure. That is exactly what is demanded by the strategy of development. It requires the system to be established to consist of elements every system must contain, and these are: the defi ned goal, establishment of the structure and functions of the system, infl uence of the environment on the system, subjective factor in the system, information in the system and normative parts of the system.
In the particular case of the regionalism policy of Slavonia and Baranya the ”step-by-step” principle should be followed in order to avoid any improvisation in the sense of legal and political as well as economic arrangements.
The strategy encompasses very sophisticated economic and social conditions. Economic conditions of development are subject to a slow change, just like economic and human factors of the economic structure of any state, whereas social conditions are subject to rapid changes, such as changes in the character of the socio-political and socio-economic system. Rapid changes of social conditions can cause an inexpressible damage to economic and human factors, while economic and human factors can be millstones in the development of social conditions.
If we consider the present condition of development as a legal motion and advancement as a level reached in Slavonia and Baranya, we may open up an extremely important need for a regional strategy of development.
That effort is worth the trouble since the regional strategy of social and economic development of Slavonia and Baranya is always put into a positive Croatian context as to results.
Such context referring to Slavonia and Baranya says that a stable strategy of development should guarantee 10% of growth in the next ten years.
Only that rate of the total economic growth and development of the Slavonia and Baranya region enables continuous involvement of our county into European and world integrations. This exactness in expressing percentage of the total growth rate interferes directly with the time of our desirable European integrations into the European Union. Our total social and economic system requires measures to be defi ned by which a more undiscriminated start and implementation logistics are guaranteed.
In addition to knowledge, capability, self-confi dence and courage, only a unique strategy of our overall social and economic development can take us out of misery and lead us to a developed Europe.

REGIONALISM, RECONSTITUTION AND THESES FOR DESIGNING A STRATEGY... 93
9. Development logistics of Slavonia and Baranya regionalism
Logistics for developing regionalism of Slavonia and Baranya can be especially well described as follows:
1. in the real sense – selected concept and strategy, starting position and environment,
2. in the sense of time – period of 10 years (with the rate of economic growth of 10%),
3. in a technical sense – organization and a general mobilization concerning strategy realization with all relevant factors contributing to the logistics target.
Logistics targets, whether in a company or on the level of local community or national units, are results of a given concept and strategy. If the concept is linked to e.g. tycoon privatization, then within the framework of strategy realization, logistics should enable tycoons to get loans, legal and political protection, etc. Of course, that concept, as well as strategy and its logistics, suffered a severe setback.
If a new concept of development guarantees better life of citizens based on the tradition of civil society, existence of a strong middle class, entrepreneurship, with due respect, but not idealization of private property, making huge joint stock companies, saving and increasing of the capital, with the development of industry and production as well as companies able to come out to the market, then logistics is entirely directed towards development on the concept and strategy given in advance. Anyway, logistics is created for a concrete strategy. But, it must be continuously adjusted to present conditions, as well as new changes, without questioning concept, possibly adjusting the strategy to new changes in the system. This also holds for changes referring to means, economic and social structure, functions in a normative system and all other factors defi ned by social and economic development, as the system for which logistics is defi ned. Since the starting position is fi xed and cannot be changed, it is necessary to choose a targeted environment and adjust the system of measures and activities needed for accomplishing goals. This holds for subjects invited to do some actions in order to obtain good results.
Logistics has its time dimension and dynamics. In order to reach a goal, some actions planned per particular subjects are to be done today or in a year or the last year of a strategic (plan) interval. If e.g. we want to access the European Union in 2015, then requests set by the European Union must be fulfi lled by the year 2010, and in order to have them fulfi lled in 10 years, a question arises: what should be done this year, who will do that, by which means and from which starting position?

Nedeljko Bosanac • Ivana Barkovi}94
In the time given in this way, every subject must contribute to the common goal in order to accomplish the main goal, but also all other independent goals leading to the main one. Subjects which should carry out the strategy of development are as follows:
• Companies with their development and production program, management, labor, product (service), market and other factors;
• Environment, affecting the company, in which banks, social services, public utility services, other cooperative and competitive companies, etc. appear as subjects;
• State and local self-government units, which by means of their systems of values and means and within economic policy, create environment suitable for development, with an infl uence on all three factors of state authority, that by concrete measures of economic policy, enables realization of work in companies providing high-quality management, which gives more than what is spent on it, as well as judicial authorities, which by arbitrating and removing the ones not going “by a rule” ensures realization of the concept, the strategy and logistics.
• Citizens who accepted the concept of development, as well as strategy, believe in them and are motivated for strategy realization.
In the course time it is necessary to ensure activities of all subjects at the same time, on the same concept and with the same goals. Therefore, national consensus of all factors referring to these issues should be reached, especially of political parties, when it comes to a dynamic implementation of the policy of regionalism.
Consensus is necessary as to the concept and goal of development. Consensus gives measures of economic policy with respect to which different views and attitudes arise, all of which should acknowledge solutions accepted once in the past. Such solutions, giving conditions for activities of economic subjects, are obtained by legal regulations, which must be acknowledged. The concept of development should be adopted by citizens who should adjust their behavior to it.
Within the framework of its legislative function, the Croatian Parliament (House of representatives) should do the following:
• defi ne the concept of development of the Republic of Croatia, as well as identify goals and strategies of development in form of a document, that may be wither a resolution or a decision on the defi nition and approval of the concept, goals and strategy of development, with a possible consensus of all relevant political parties;

REGIONALISM, RECONSTITUTION AND THESES FOR DESIGNING A STRATEGY... 95
• on the basis of documents referring to the concept, determine the resolution dynamic of the system as well as subjects due to undertake appropriate actions (Government, ministries, Croatian National Bank);
• pass laws, aimed at accomplishing the concept of development in the fi eld of companies, employment, fi nancial activities, etc., that make development faster, improve operating conditions, protection of workers, participation in management, revision of privatization, rationalization of administration, etc.;
• through parliamentary committees control all segments of the society aimed at development;
• create a system for motivation and information of citizens, etc.
Within the framework of its executive function, the Government should do the following:
• create conditions for enforcement of all laws and acts, especially the ones referring to development, as well as propose to the Parliament to pass the Law/Act that will carry out revision of privatization, create better working and operating conditions, stimulate development by economic policy measures, all based on the proposal made by a company (contribution and tax exemption in case of introducing work in shifts, contribution and tax reduction for particular products, etc.);
• release gradually from the budgetary costs referring to expenditures outside government functions;
• enter into a general long-term collective work agreement in order to make wages (with contributions) fi xed or anticipated operating expenses;
• enable development of local self-government, giving it functions and resources;
• develop and stimulate work through ministries or indirectly, when it provides logistics to big companies and systems which are able to develop economy;
• by economic policy measures direct the banking system to fi nance development of money-making activities, but to base its development on the domestic market, raw materials and higher employment;
• create possibilities for employment of high-quality management teams in state-owned enterprises, economy and the public sector;
• pursue foreign policy in such a way to make the Republic of Croatia a nice country;

Nedeljko Bosanac • Ivana Barkovi}96
• stop a general sale of national wealth meant to cover costs made in the budget, and direct privatization and the sale of companies toward development so that certain ministries or agencies evaluate every sale by using the received funds for the purpose of developing new companies, introducing new technologies, etc.;
• contact and stimulate continuously development of particular companies;
• encourage development in an unconventional way, etc.
Based upon the proposal made by management, individual ministries and the corresponding administration structure should make implementation decisions within the framework of economic policy, which enable a better position, guarantee development, make profi t, etc. Thereby autonomy of these subjects should not be challenged, but more favorable conditions for doing business should be created. It is necessary to form working groups (councils) within ministries, which will on the basis of immediate experience propose to the ministry and the government which measures should be undertaken or which regulations are required for the purpose of doing business in a more qualitative way. Capable managers should take over management of state-owned companies and functions of supervisory boards should be executed by bodies elected by workers (workers’ council), subsumed under participation. The Government and ministries must create a system of motivation for all factors. Bearing this in mind, it is necessary to elaborate the motivation system covering awards to best managers, workers, national medals for successful businesses, titles that can be used, such as meritorious manager, worker, medical worker, professor, etc. Media should be included in motivation through promotion. The major news in the media is neither a crime nor a criminal, but achievements made by some managers, innovators, workers, professors, medical doctors, teachers, etc.
After reconstruction from the regionalism policy and a decrease in the number of cities and municipalities, self-government units should:
• take over and manage part of the state property by giving it into concession;
• encourage motivation of citizens for activities and provide fi nancial support to these activities through voluntary taxes or bonds;
• take their part of obligation concerning employment of citizens;
• develop programs in which volunteers can take part, and provide assistance to non-government organizations already employed on a voluntary basis within the framework of various activities, etc.

REGIONALISM, RECONSTITUTION AND THESES FOR DESIGNING A STRATEGY... 97
Self-government units, in accordance with the Anglo-saxon model, should become units in which citizens along democratic lines satisfy their needs and interests in all sectors of life and work.
They can also be managed as a big system or a big company, not exclusively as a political invention with power as the ultimate goal.
Courts of justice and judicial authority should speed up their work within a new or the existing legislature. Based upon new regulations on procedures initiated on the basis of their experience and passed by the legislator, they should process creditors’ claims for debt enforcement faster, treat the issue of liquidation in a more qualitative manner, especially the one including restructuring, organize the work of registers and executive bodies better, etc. In this sense it is necessary to have better computer equipment that would enable access to various data bases, data networks, etc. Judicial authority can also be improved by founding special judicial departments for particular cases. Improvement of the work of courts of justice is a constituent part of the political will of the legislative and executive authority, which guarantees autonomy of the judicial authority.
Banks and fi nancial institutions, mostly consolidated, should do the following:
• make new offer to citizens and legal entities referring to collection of assets (except savings), with adequate guarantees as given by foreign banks;
• provide service concerning government, self-government and corporation bonds;
• fi nancially support investments for which there exist objective facts confi rming that they are not risky, but with taking risk. Hence, credit fi nancing of companies and their programs in a more liberal way;
• forward saving assets to self-government units in which they have been collected.
The key for success is in the companies. All measures of economic policy, stimulations on the legal basis, credit fi nancing by a bank, shares, etc. are held in the company function. Therefore, the company is a real carrier of any strategy and logistics, and the main problems of the company are as follows:
• poor management both in administration and supervisory boards, roughly the same in public services, state-owned and private companies;
• shortage of the circulating capital, extracted from some companies or taken out of the country, transferred to other companies, reinvested into other companies – it simply turned into losses;

Nedeljko Bosanac • Ivana Barkovi}98
• companies are lagging behind in terms of development – there have been no investments in the last ten years;
• markets were lost due to crucial geopolitical changes in the environment, such as breakup of Yugoslavia, foundation of European Union, recent international associations and integrations of Croatia;
• design of new products is lagging behind;
• too high taxes and contributions;
• insecure and too slow judiciary;
• lack of motivation with workers, whose wages are low, they even do not get their wages regularly, etc., and instead of creativity, they take social insecurity with them when they go to work.
Some economic problems, emerged from obvious social problems, must be solved in the companies themselves. Within their frameworks, the following can be solved:
• Incapable management should be replaced by high-quality people on a short notice, since a long dismissal period and high allowances are not granted to poor managers, and success should be the only remuneration criterion. Responsibility should be claimed for failure and operating loss going to the level of private property mortgaged;
• Supervisory boards should be set up, in which employees would have the majority. Participation should be defi ned by the Statute and in accordance with the Labor Act;
• Development programs should be defi ned, which must guarantee both the market and development of new production, as well as enable a high profi t rate. Such new production programs must be based on innovations, new design and an adequate ratio between prices and quality;
• Trade association along with big companies or associations for the purpose of integrating in the product or creating a brand for the market, etc.
• Return to the lost markets regardless of unsolved political problems in the last ten years. Here the motive is the interest. Lost markets here imply not only the market of former Yugoslavia but also markets of non-aligned countries.
• Motivation of workers, labor productivity, etc.
• Relationships with unions.

REGIONALISM, RECONSTITUTION AND THESES FOR DESIGNING A STRATEGY... 99
It is clear from the previously mentioned that real problems are concentrated in companies, although they have not necessarily emerged from them, so they have to be solved within companies, so that the logic of development is used by activities of the company itself as well as all other factors of strategy and tactics. Within its framework, all contents should be fulfi lled with logistics in a dynamic sense. Here starts separation of the concept and the strategy of development for which the deadline is now. Namely, the concept of social and economic development represents in society and dominant forces in society attitudes with respect to the goal in the society as well as attitudes with respect to goals this society and economy tend to acquire. Thus, after an overall acquisition of the logic of the concept of social and economic development, there comes strategy, which represents a set of measures of logistics, tactic goals and exact tasks along the way of realization of goals of society and economy that are envisaged in advance. Passing single laws/acts, especially the ones referring to revision of privatization, is extremely important for a sound beginning of the overall changes in society and economy. The deadline: at once!
Defi nition of programs referring to the transfer of rights and assets to self-government units – deadline: next two years.
Changes of management structures, which are unsatisfactory, with conditions set for manager contracts – deadline: at once! Defi nition of development programs in companies – deadline: 1 to 2 years, realization in a ten-year period.
Therefore, it can be said that the deadline for creating the business framework is too short!
However, for the realization of strategic goals with a ten-year deadline or even longer, then for urgent changes in the degree of technology development, design and changes in the business logic, the feeling should be continuously nourished implying that the constant in the trend of development cannot be given up or discussed.
Also, care in the fi eld of social welfare must be a constant, especially concerning employment (the Irish model) for which a company must be stimulated, while the Government and local community units must fi nd an adequate stimulation model.
We would also like to outline the principles that macroeconomy is realized through successful operation of microeconomy, that there are no weak companies, there is only poor and incapable management, that there are no working results without motivation of all employees, that there should be a continuous process of accelerated employment and labor turnover, that the country cannot successfully implement measures falling into the microeconomic sector, that judiciary and administration must be reconstituted, that science must be reconstructed, that education must change, and that the political life in Croatia and Slavonia and Baranya must adhere to democracy of the civilized world and Europe.

Nedeljko Bosanac • Ivana Barkovi}100
Summary
Intensive ageing of population as well as its overall wrong educational orientation send a strong message that economic regression indicates that population and economy are caught in a vicious circle of a crisis, since under such circumstances people aged between 20 and 35 are leaving this region and heading to Zagreb, Istria and, what is modern these days, to Ireland. It is not diffi cult to conclude that such trends of a demographic and economic crisis are mirrored in all other relevant issues and relationships.
We should not lose sight of important factors stipulated by such circumstances, such as: fi rst, the economy itself, specifi cally and traditionally conditioned (agriculture and industry) as well as the war and war consequences, and second, a complete political failure to adapt to new conditions, absence of a growth and development strategy, selection of huge chains of stores as the basis of growth and development of cities, etc. It can also be noticed that all other resources are neglected (as well). Among others, special stress should be place on education, science and the University. Therefore, it is quite obvious that the above mentioned circumstances must be promptly halted based upon new high-quality fundamentals in the community aiming at creating conditions for the policy of regionalism.
References: 1. Babić, M., Prijedlog programa privrednog razvitka Republike Hrvatske,
Informator, 4992, Zagreb, 2002.
2. Bosanac, N., Strategija razvoja, Pravni vjesnik, 1-4/1995.
3. Bosanac, N., Slavonski pogled unaprijed, Osijek, 2004.
4. Gustoća naseljenosti Hrvatske 2001., “Meridijani”, 77/ 2003.
5. Kulić, S., Nužnost rekonstitucije hrvatskog društva, Zagreb, 1999.
6. Lokin. S., Hrvatska 2015., Zagreb, 2000.
7. Lovrinović, I., Analiza mogućnosti regije Slavonije i uloga Agrobanke, Zagreb, 2004.
8. Društveni bruto proizvod svijeta 2002., “Meridijani”, 78/2004.
9. Mecanović, I., Bosanac, N., Strategija društvenog i gospodarskog razvoja, Osijek, 2001.
10. Mecanović, I., Teorijski prilog regionalnom razvoju, Pravni vjesnik, 19/2003, 309-410.

REGIONALISM, RECONSTITUTION AND THESES FOR DESIGNING A STRATEGY... 101
11. Nacionalna struktura Hrvatske 2001., “Meridijani”, 78/2003.
12. Ekonomski fakultet u Osijeku, Znanstvene osnove dugoročnog društveno-ekonomskog razvoja Zajednica općina Osijek do 2010. godine, Zagreb, 1990, p.12.
13. Ministarstvo europskih integracija Republike Hrvatske, Mali leksikon europskih integracija, Zagreb, 2001.
14. Prikaz američkog gospodarstva, Informativna agencija Sjedinjenih američkih država. Originalni tekst iz 1981., ažurirani tekst 1991.
15. Sirotković, J., Hrvatska nije samo u recesiji već i u strukturnoj krizi, Poslovni tjednik, 12 June 2002, 4-5.
16. Sundać, D., Kakav regionalni razvitak treba Hrvatskoj, Rijeka, 2001.
17. Zdunić, S., Grgić, M., Elementi za utvrđivanje strategije hrvatskog gospodarstva u uvjetima stabilnosti, Zagreb, 1996.
18. Statistički ljetopis, 2001.
19. Friewald-Hofbauer, T., Scheiber, E., Ekosocijalno-tržišno gospodarstvo / Strategija za opstanak čovječanstva, Zagreb, 2004.
20. Moller, U., Spiegel, P., Globalni Marshallov plan, Svjestkim ugovorom za ekosocijalno-tržišno gospodarstvo omogućiti mir, slobodu i blagostanje diljem Svijeta, Stuttgart, 2004.

Zsuzsa M. Császár • József Tóth102
REFORMS AND CHANGES IN CONTEMPORARY HUNGARIAN EDUCATION
Zsuzsa M. Császár - József TóthUniversity of Pécs
A global social-economic process of utmost importance in the 21st century has been the development of knowledge-based society. In this process the most competitive are those countries and regions that re-programme their production structure in a way that products and services with high added value are created. In Hungary, such development depends on the better utilisation of human resources, on the improvement of economic competitiveness, on using knowledge capital for the benefi t of economic growth, and on the successful establishment of a knowledge-based society which can react to unexpected social and economic challenges.
Together with political changes in the 1990s, signifi cant economic transformations also took place in Hungary. In the process of shifting to market economy, the country started more and more strongly interconnect into mainstream global economic processes. An important tool of reacting to such challenges and external changes is knowledge gained from education and training, which greatly contributes to improving economic potential. A prosperous economy, in turn, has an effect on education, induces modern forms of training to satisfy new requirements. Hungarian public and higher education have gone through considerable changes in the past 15 years. In the present study the authors, trying to go both inspirational and analytic, wish to deal with the changing relationship between education and space, education and planning, and also touch the issue of changes in education.
I. Regionalism and higher education
All universities are universities of a particular region. As spatial structure changes, interconnected spaces will form which then go through processes – not to be specifi ed here – leading to the creation of regions. As a certain type of functional labour division, each region creates its own institution system. Universities are also formed in the regions. A university, from the moment of its birth, can only be understood as a belonging of something, i.e. it can never be independent, it cannot be separated from the environment in which it was created (Figure 1.)

REFORMS AND CHANGES IN CONTEMPORARY HUNGARIAN EDUCATION 103
Figure 1. University, region, relation systems
A region is thus created, with institutions of various levels of hierarchy being established. Let us now play with the idea that while the university is a prominent feature in this region, another region forms with the same processes inside and with another university. From then on what we are talking about is two relation systems that fundamentally infl uence the whole integration system of the universities. Of these two relationships one (1) exists between the universities and the other (2) between the university and its home region (2). Interrelations function both between the universities and between the university and institutions of the region.
Let us discuss briefl y about the former. This is a relationship system existing between the universities. Any university in the world would aim at establishing functional relations with other universities, and thus bring the strength of universities to a higher level. It is right to try to establish stronger bonds with universities of the neighbouring regions. Although relationship with distant partners is important, yet it is mostly relations with neighbouring entities that are socially the “cheapest” in the development of universities – and are also the most effective.
The other relation system is the one existing between the university and other institutions of the region. In this case the university can fulfi l its duties only if this relation system functions properly, if the university receives information from the region on what is expected by various institutions of the region, and the university provides feedback specifying what it can undertake on its own and what it needs assistance for.
Zsuzsa M. Császár • József Tóth104
Why are these relations important? Simply because these interactions contribute to the better development of the texture of the region, and thus to making interregional relations (3) as intense as possible. These relationships – partly stimulated by the universities – become established between various actors of the process. Consequently, the relationship exists on all three levels, and this fact contributes to the successful integration of regions. This is the only way for us, with the assistance of universities, leading to Europe of the regions.
Universities are thus extremely important. Primarily for the region, but also, via interregional associations, for the entire world. However, if universities can be important and useful for the regions, then support for universities from the regions is not luxury, but instead an investment that will pay off. If this mutually advantageous co-operation can be realised, then the regions, the country, the continent and ultimately the entire world will benefi t. However, for this to be achieved, it is essential that higher education preserves local bonds and regional integration, and that universities remain operated within the national framework. Only then, can they be faced with the challenges of the uncertain features of globalisation.
In the past, as the separating power of state borders strengthened, regions were fragmented and deprived of their importance, Hungarian higher education became nationally organised, meaning that – apart from the well-known exceptions – education is done inside Hungary and in Hungarian language. This higher education system is the one that is now expected to react adequately to global challenges.
What we understand as global processes are those dominant tendencies that are present in the entire world but not in the same form. There are also local or regional processes that can sometimes advance in the opposite direction to global ones. Global processes are the ones observed in the most highly developed countries with major economies and military power, i.e. these are currently the processes desired by the United States of America, enforced in the entire world. (The “SDC-principle” is felt here: “Stronger Dog Cordializes”) In our case it is basically the Hungarian appearance of the American process, with a certain type of European fi ltration. Thus, the “Bologna” process is European solely in its name, but in reality it follows an American pattern. What is then behind is in opposition with the tradition system onto which European higher education is built, which system used to have an at least equivalent ranking with the USA despite that the American system has always been better fi nanced. High politics has decided to create a truly permeable and transferable but at the same time uniform higher education. Its advantages are clearly emphasised, but the disadvantages are either neglected or deliberately disregarded.
If we want to outline the processes going on in Hungarian higher education, it appears that as a result of political transformations national universities turn again

REFORMS AND CHANGES IN CONTEMPORARY HUNGARIAN EDUCATION 105
into regional universities, and because regions are international, therefore regional universities become international, too.
There is of course need for some sort of quality assurance in higher education, guaranteed by an accredited approval system. However, quality is dependent on space and time – there is no such thing as absolute quality. Higher education should train specialists who are able to give adequate answers to the challenges of local, regional and national reality. But there is signifi cant difference between Hungarian and American reality. Hungarian higher education will anyhow be part of global processes, provided that it will be available for masses. Large quantities will necessarily mean lower quality. Quality can be maintained and saved by means of the postgradual systems.
Higher education and research make a strategic branch of the economy. Former political leaders have always admitted this, yet providing only stagnating or decreasing amounts of GDP-rate subsidy for higher education. This is partly caused by the weakness of lobbying for higher education. The integration of higher education institutions was not successful in making the system more effective and in bringing more funds into this sphere. There was no true structural transformation.
As one consequence of European accession, much more students will study abroad than currently. Students belonging to the highest 10 percent whose parents can afford fi nancing this, will quite probably study in high-prestige western universities. Demographic trends also suggest decreasing student numbers. Yet, there is no uniform strategy in Hungarian higher education for supplementing the missing student numbers (although independent initiatives do exist). It would be important to work out the strategy of “hired training”. Hungarian universities can be attractive for Ukraine, the Balkan or China, since knowledge could be provided at a cheaper price than at western universities, and this knowledge seems to be worth more than what can be gained at the universities of these countries. In addition to the fi nancial profi t this would be benefi cial for Hungary and Hungarian higher education from the aspect of the cheap export possibility of our culture. Countries like the United States and Canada have long recognised these possibilities, and such export of culture has widely been practised.
It would be necessary to create an integrate higher education strategy that relies on consent, and it should be carried through in a way that there is no cease in the process of reforms when political changes occur from time to time. Knowledge-based society will not create itself, instead it needs to be invested in. At the top, Hungary does quite well in this respect, but this is not enough: advance must be made at the base of the pyramid also, and this cannot be achieved by restrictions and by the confessed or unpronounced limitation of university autonomy. Hungarian higher
Zsuzsa M. Császár • József Tóth106
education will react properly to the challenges of globalisation only if it remains embedded locally and regionally, and concentrates on the interests of the nation and higher education.
It is important to improve the international relations of higher education, but this should not concentrate on western targets only. By establishing contacts in the Balkan, with the Slavs and with Turkey, Hungarian higher education could have an interconnecting role. The concentration of higher education would also be important, because what is observed currently is fragmentation. The limited funds fl owing into this sector should also be concentrated. When working out the strategy, regionalism should by all means be regarded. Equal opportunities should be assured both spatially and socially.
It is desirable that our universities and colleges become excellent Hungarian higher education institutions with a complex local and regional relation system, rather than faint copies of American institutions. This synthesis can be achieved: a fl ourishing university will almost automatically escape provincialisation, but the unifying force of globalisation must be fought against.
II. Reforms and changes in Hungarian public education
In spring 1990, as a result of the fi rst free elections in Hungary, a new political situation formed, establishing the conditions for market economy and parliamentary democracy. Due to that, Hungarian public education also went through enormous changes. The system of institution administration as well as fi nancing was radically transformed. At the same time secondary level education started to expand, with mainly grammar school and vocational secondary school enrolment showing an increase. Also, structural changes occurred in public education: mostly the six- and eight-class system became widespread, but also the transformation of training directions and the approximation of different levels (i.e. secondary and higher levels) were newly introduced. The regulation of the contents and subjects of education also went through enormous changes, with two new curricula having been introduced during a course of 10 years.
Education administration also took up a new approach, starting to function as a tool of education politics strategy. The impression of the differences among settlements and regions into the system of Hungarian public education became clearly visible.
Changes in education system are associated with demographic processes like the decrease or growth of birth numbers, the age structure of the population, and migration. The detailed analysis of age groups involved in education is an essential

REFORMS AND CHANGES IN CONTEMPORARY HUNGARIAN EDUCATION 107
element of education administration. Hungarian population has been considerably declining since the 1980s. Numbers involved in public education have decreased in each of the age groups below the age of 18. This marked demographic trend has an infl uence on the possible directions of public education for 15-20 years. With such a drop in the pool of education subjects in the particular age group, the transformation of the fi nancing system into a norm-based one caused a serious crisis. A certain proportion of schools (mainly primary ones) found themselves in a catastrophic situation anyway, due to the fact that public expenses were cut back. The closing down of schools became news, as well as the protests against such actions.
As required by the principles of market, schools – in order to survive – decided to carry out transformations in terms of both content and structure. As a joint effect of all these processes, the vertical and horizontal transformation of education system commenced simultaneously. By means of the Act on Public Education, changes that had formerly been accepted were confi rmed, thus bringing the three forms of secondary school education – four-class, six-class and eight-class – to an equally ranked position. In addition to that, the government extended the basic education programme from 8 classes to 10. By the shift of secondary education towards the lower ranges, the borderline separating primary and secondary education became considerably less prominent. This way, the Act allowed various types of initiatives on the local, institutional level. A similar process went through in vocational education: professional training can start only after acquiring a general basic knowledge. This type of education can be formed in both primary and secondary level institutions, thus chances can be given to schools of smaller settlements for an upward expansion. Another education-structural change is the arrangement of 13rd-14th classes for those having completed their GCSE/matriculation exams. This makes the limits between secondary and higher levels less marked. Among the changes of the horizontal structure of education, the expansion of secondary school education is the most prominent (Figure 2). Due to the negative demographic trend already mentioned, numbers of schoolchildren in Hungary had dropped considerably by the mid-1990s in comparison with former values. The economic situation and employment problems experienced by younger, unskilled people made vocational secondary education and grammar school education appear more attractive. Total numbers of people involved in secondary education went through a relative increase, with about two-third of those continuing their studies in this particular age group wishing to enrol in secondary schools in the past fi fteen years. The result of this expansion is that numbers and rates of people holding secondary education certifi cates are growing constantly.
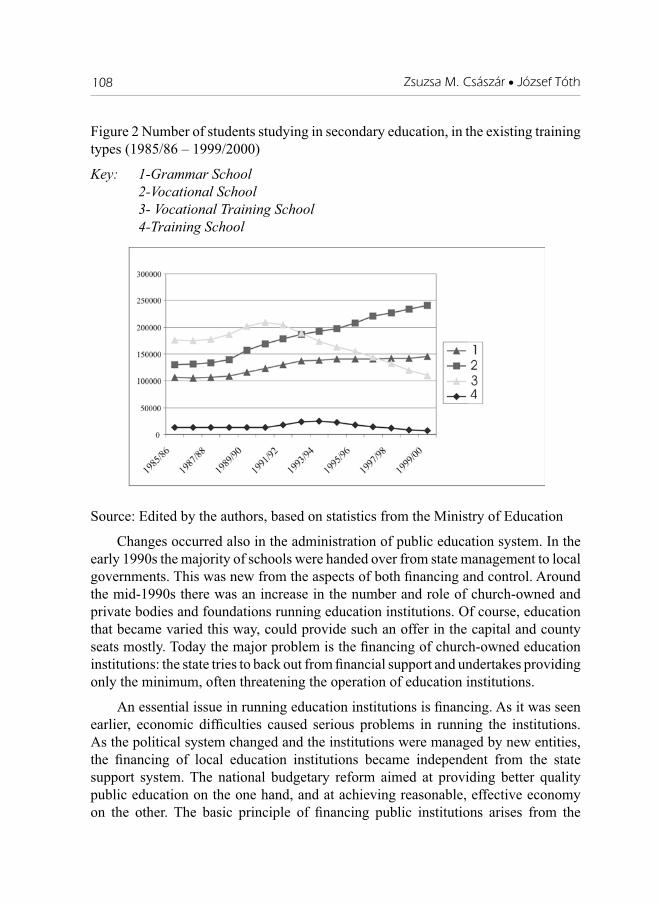
Zsuzsa M. Császár • József Tóth108
Figure 2 Number of students studying in secondary education, in the existing training types (1985/86 – 1999/2000)
Key: 1-Grammar School2-Vocational School3- Vocational Training School4-Training School
Source: Edited by the authors, based on statistics from the Ministry of Education
Changes occurred also in the administration of public education system. In the early 1990s the majority of schools were handed over from state management to local governments. This was new from the aspects of both fi nancing and control. Around the mid-1990s there was an increase in the number and role of church-owned and private bodies and foundations running education institutions. Of course, education that became varied this way, could provide such an offer in the capital and county seats mostly. Today the major problem is the fi nancing of church-owned education institutions: the state tries to back out from fi nancial support and undertakes providing only the minimum, often threatening the operation of education institutions.
An essential issue in running education institutions is fi nancing. As it was seen earlier, economic diffi culties caused serious problems in running the institutions. As the political system changed and the institutions were managed by new entities, the fi nancing of local education institutions became independent from the state support system. The national budgetary reform aimed at providing better quality public education on the one hand, and at achieving reasonable, effective economy on the other. The basic principle of fi nancing public institutions arises from the

REFORMS AND CHANGES IN CONTEMPORARY HUNGARIAN EDUCATION 109
Local Government Act. The fi nancial conditions of functioning is provided by the national budget and by contribution from the operating entity. The annual norm must not be less than 80% of the amount spent by the local government on public education two years before (fi nancing warranty). The normative support – its amount depending on the numbers of students – can be supplemented by special support obtained from grants by the local government. The bipolar character of fi nancing public education is refl ected by the fact that the normative support – covering about 50-70% of total expenses – must be supplemented by the local governments if the institutions are to be maintained in an operable state. The fate of smaller settlements is determined in such a bipolar system: their education institutions can easily become fi nancially unmanageable if local taxes and other incomes are lacking. Thus, the budgetary situation of education depends on the fi nancial status of the various local governments. In several cases drastic solutions are chosen if resources are scarce: explained with the numbers of students decreasing anyway, schools are merged or closed down, and if a particular one is not compulsorily operated, it may be handed over under different management.
Together with political transition, the regulation of the contents of education also had surprising, newly introduced elements. During the past 15 years three different curricula have been introduced. Because the education political (curricular) reforms were associated with new governments taking over power, they could not truly contribute to balanced pedagogical activities, moreover they caused serious disadvantages in a number of cases.
The other element of content regulation, i.e. the new two-level matriculation has intended to make the transition between secondary and higher education smoother, but the higher education reform that was launched simultaneously to introduce the “Bologna system” is totally inconsistent with it.
Education planning also must be dealt with. In this respect, the ultimate goal of education planning is to send such a pool of young people to the labour market, members of which meet the requirements of the economy, and are capable of fl exibly changing their profession. An important element of planning is calculating with school capacities, for which one needs to be familiar with the expectable size of age groups involved in education, must know the characteristics of the demand for education, its spatial distribution, and the requirements and conditions of human and infrastructural resources necessary for running education institutions.
The strategic plan having been released as a constituent of governmental planning – called in other words the “long-term developmental strategy of Hungarian public education” – has become known as the modernisation plan for public education, and it has simultaneously aimed at the expansion of secondary school education, at raising

Zsuzsa M. Császár • József Tóth110
the age level of compulsory education, and at differentiating within education as well as improving its standards. As part of spatial education planning, in accordance with the aforementioned strategy, county-level planning was introduced which served the aim of orientating local governments in deciding what types of institutions and institution profi les are worth creating and maintaining. Act XXI. (1996) on Spatial Development gave the possibility to the makers of county-level education plans for planning public education tasks in accordance with the development activities of the settlements. Due to an amendment to that act, connections between regional and local planning became closer, the local governments being obliged to produce action plans. All this has made the local governments reconsider and revise their activities in fulfi lling their duties. After that date, no spatial developmental plan can be produced without planning about education, and vica versa: education planning can be done only in harmony with spatial development.
On various levels and fi elds of education and training no integrate and properly functioning quality evaluation and improvement systems and institution development schemes have been produced that would be fundamental for the sake of improving the effi ciency of education or training. If the cost-effi ciency of education is examined, an important issue is that of demographic processes – most importantly the continuous decline of school-age population. The decrease in student/teacher rate raises the costs per student, though it does not necessarily mean the improvement of the quality of education. The system of education and training does not suffi ciently ensure the acquisition of skills and abilities necessary for employment. A considerable proportion of young people enter the labour market without the required qualifi cations and skills. The mechanisms continuously adjusting the contents of the training types to the needs of the economy have not evolved. The infrastructure of education is incomplete and out of date, showing considerable regional differences.
The transformation of the economy has brought along strong social selection, with inequalities still remaining the most acute problem. Regional differences in public education have even deepened due to social and economic changes occurring in the society. Signifi cant differences have evolved in the access to education and in the success rate of education between different regions and various settlement types. This is a result of several factors such as the reactions of the particular region to economic development and social changes (especially to political transition – a specifi c challenge); the historic, cultural and associated educational traditions; settlement spatial structure; demographic characteristics of the population found there; and the decisions of governmental and local administration (with special emphasis on education politics). The public education institution system and its transformations are primarily determined by the developmental level and traditions of the particular region. Apart from a few exceptions, the social-economic spatial

REFORMS AND CHANGES IN CONTEMPORARY HUNGARIAN EDUCATION 111
organisation of the country is refl ected in its major features in the spatial structure of education. The space-transforming effect of education is impressive, but it can have considerable infl uence only if it acts together with other forces playing a role in regional development.
Literature
HALÁSZ G. – LANNERT J. (2003): Jelentés a magyar közoktatásról, – Budapest,p. 601.
M. CSÁSZÁR ZS. 2005 Magyarország oktatásföldrajza – Pro Pannónia Pécs p.189.
SZIGETI E. (szerk.) 2001: Régió, közigazgatás, önkormányzat. – Budapest, p. 383.
TÓTH J. 1998: Az egyetem kapcsolatrendszere. In: NAGY F. (szerk.): Az egyetem és társadalmi környezete. Pécs, pp. 7-11.
TÓTH J. 2004: A magyar felsőoktatás és a globális kihívások. – Szegedi Tudományegyetem kiadványa számára készült kézirat, p. 4.
TÓTH J. 2004: Felsőoktatásunk és a lokális-regionális-nemzeti-globális kihívások. – Kézirat a Zsolnai József 70. születésnapjára készülő kötet számára. – Veszprém, p. 7.
TÓTH J. 2004: Kell nekünk régió? – Iskolakultúra, XIV. évf. 11. sz. pp. 48-68.
TRÓCSÁNYI A. – TÓTH J. 2002: A magyarság kulturális földrajza. – Pécs, p. 363.

@eljka Bajto • Dijana Borojevi} • Stjepan Rudan112
SAPARD PRE-ACCESSION ASSISTANCE PROGRAMME: AIMS, IMPLEMENTATION, PRINCIPLES AND CANDIDATE
STATES EXPERIENCES
@eljka Bajto, Dijana Borojevi}, Stjepan RudanFaculty of Economics in Osijek
Postgraduate study: Management
Abstract
Candidate states status for valid membership opens the possibility to use SAPARD preaccession fund of EU for agriculture and rural development, that is assigned to candidate states as a support for structural reforms of agricultural fi eld and for harmmonisation measures with acquis of EU in the area.
The experiences of the middle and east European states – the late candidates for valid membership in EU – pointed out the benefi ts of SAPARD programme for economic developement in agricultural fi eld, as well as for the recovery of the institutions that are important for effective future functioning within the Union. The aims of the projects of SAPARD programme is an improvement of competitiveness of the agricultural products of future member states on the common market by encouraging the improvement of EU products quality standards and producing processes harmmonisation. Some SAPARD measures are intended for resolving the problems of rural infrastructural developement and measures of sustainable rural development.
Annual fi nancial SAPARD funds are 520 bil, in terms of 1999. prices (it was the year when the sums for preaccession funds were determined for the period till the end of 2006.). EU commission determine that sums for each country on the basis of criteria, among which the most important is the surface of agricultural area.
SAPPARD programme fund covers 75% of already realised expenditures. The rest of the costs candidate states cover by funds from national sources private and/or public. A candidate state choose a project in accordance with preliminary determined project criteria of SAPARD programme.
Because of the complexity of SAPARD programme realisation that demands a special institutional system, programme, fi nancial, administrative and monitoring capabilities of candidate state, the candidate states experienced diffi culties while spending these funds, refl ected as relatively low level of their utilisation. The

SAPARD PRE-ACCESSION ASSISTANCE PROGRAMME: AIMS... 113
experiences pointed out the necessity of early creation of necessary strategic documents ( the national strategy of agriculture and rural development), multi annual planning of funds intended for confi nancing SAPARD projects, system of decentralized conduction on national level implementation (by determination of authorities and procedures and insuring human and other necessary resources) and in time informing and possible benefi ciaries qualifying for project application.
Candidate states status acquisition for valid membership in EU opens the possibility for Croatia to use the preaccession funds. The amount and the form of realisation the rights on that funds have to be determined. Preparations for the utilisation of these funds by Croatia have started. At the moment projects fi nanced by CARDS helping programme are realising or planning with the aim of improving the policy and the measures of agriculture and rural development. It is necessary to constitute administrative capacities and to improve the absorption capacity of utilisation the preaccession funds in aim that the capacity of SAPARD fund utilisation represent the real needs of Croatia in the fi eld of agriculture and rural development.
1. The reason of implementation of the SAPARD programme
Agricultural policy is extremely important in EU from the aspect of legislative and budget proportions. Almost 50% of legislative acquisition – EU acquis– is referred to legislative of the fi eld, as well as cca 45% of EU budget (43.9 bil annually in 1999 prices, in duration of current EU fi nancial perspective 2000-2006). In consideration with the importance of Common Agricultural Policy (CAP)and the implication of the policy on the Union expansion on 10 new member states, EU recently focuses a special attention to the structure of this fi eld in candidate states for valid membership in the EU.
In such a manner the European Commission made a frame strategic document Agenda 2000 in July 1997 in which the needs of expanded Union were revised and the necessary measures suggested. In 1999 the European Council brought a decision of improving EU preaccession strategy toward the candidate states by, among others, implementing of preaccession helping programmes. One of the preaccession helping programmes was created for the needs of agriculture and sustainable rural developement; Special Accession Programme for Agriculture and Rural developement – SAPARD, a helping programme implemented by the Council Directive in June 1999. from January 1st 2000.1
The aim of SAPARD programme is to help the countries of Central and Eastern Europe to deal with:
1 Council Regulation (EC)N0 1268/1999 of 21 June 1999 on Community support for pre-accession measures for agriculture and rural development in the applicant countries of central and eastern Europe in the pre-accession period.

@eljka Bajto • Dijana Borojevi} • Stjepan Rudan114
- the problems of the structural adjustment in their agricultural sectors and rural areas, in aim to improve competitiveness against EU market capacities, improve the quality of life of rural inhabitants and sustainable rural developement,
- the implementation of the acquis communautaire concerning the CAP (Common Agricultural Policy) and related legislation to enable equal participation on EU common market; and
- administrative, strategic and institutional qualifying of the candidate states as to enable them to use EU funds from common agricultural policy of EU once entering the Union. These funds are for agriculture (EAGGF)2 and fi shery (FIFG)3 .
SAPARD funds are intended for the candidate states, as well as for the recently adopted ones, from the very moment they start spending funds for agriculture and rural development projects from the assigned funds.4 In that way the crossing over of the fi nancial help is ommitted and the free realisation of already stipulated SAPARD projects is enabled, regardlessly of the act of adoption in EU.
2. SAPARD programmes financial provisions, criteria and measures
The annual budget of SAPARD programme is 520 bil euros in 1999. proces. Total fi nancial provisions alocated untill 2003. are almost 2,2 bil euros ( see Table 1 in Anex). National fi nancial provisions that contribute to the total payement in a lesser extent according to the principal of confi nancing should be added to this sum (see Chapter 3). In accordance with the duration of EU fi nancial perspective, fi nancial provisions of SAPARD programme are determined till 2006.
What is going to happen with the fi nancial provisions of SAPARD and other preaccession helping funds after the year of 2006. is uncertain at the moment. In its draft of the following EU fi nancial perspective for the period 2007-2013, Europea Commission proposed the formation of a single fund out of three present funds (ISPA, SAPARD, PHARE).5 Final decision about the form and fi nancial load of the future EU preaccession helping fund should be adopted unanimously in the second part of the year 2005. by all 25 member states of the Union. The fi nal fi nancial load will be infl uenced by availability of EU budget fi nancial provision, anticipated 2 European Agricultural Guidance and Guarantee Fund3 Financial Instrument for Fisheries Guidance4 Financing of the costs realised after december 31st 2003. is permitted by SAPARD provisions till the
end of 2005.5 COM (2004) 101 fi nal, Brussels, 10.2.24. Communication from the Commission to the Council and
the European Parliament, Building our common Future: Policy challanges and Budgetary means of the Enlarged Union 2007-2013
6 The help for public works undertaken in agricultural area by central authorities or by them authorized bodies EU administrates via PHARE pre-accession programme

SAPARD PRE-ACCESSION ASSISTANCE PROGRAMME: AIMS... 115
number of benefi ciaries and the evaluation of their absorbtion abilities of available provisions ( see Chapter 4).
The way SAPARD programme improves conditions in agricultural area of candidate states of middle and eastern Europe is confi nancing of private managers projects 6 and support of smaller, local public infrastructure projects with the aim of agriculture and rural development. The fi nancial provisios are supposed for the following areas:
1. investments in agricultural holdings,2. improving the processing and marketing of agricultural and fi shery products, 3. improving the structures for quality, veterinary and plant-health controls, for
quality of foodstuffs and for consumer protection,4. agricultural production methods designed to protect the environment and
maintain the countryside5. development and diversifi cation of economic activities, providing for activities
and alternative income,6. setting up farm relief and farm management services,7. setting up producer groups,8. renovation and development of villages and the protection and conservation
of the rural heritage,9. land improvement and reparcelling,
10. establishment and updating of land registers,11. qimprovement of vocational training,12. qdevelopment and improvement of rural infrastructure,13. agricultural water resources management,14. forestry, including afforestation of agricultural areas, investments in forest
owned by private forest owners and processing and marketing of forestry products,
15. technical assistance for the measures covered by this Regulation, including studies assist with the preparation and monitoring of the programme, information and publicity campaigns
The largest proportion of SAPARD fi nancial provisions was utilized for the investment in to the processing measures improvement and marketing of agricultural and fi shery products (26%), investments in agricultural (20%) and rural infrastructure (20%) and into rural activities diversifi cation measures (11%).7
7 Institute for intenational relationships (IMO), CARDS programme- preliminary review and elements implementation perspective of preaccession strategy for Croatia, may 2003, Zagreb

@eljka Bajto • Dijana Borojevi} • Stjepan Rudan116
Slovenian SAPARD programme is a representative example (see fi gure 1). See Anex 3 for the priority measures and suitable projects in relation to each benefi ciary country. It is interesting that the programme includes some measures that can not be fi nd among the measures of national rural programmes of the member states. SAPARD measures specifi c for the candidate states are those dealing with the improvement of product quality, conduction of phytosanitary measures ( animal and plant health), resolving the problems of land registers and promotion of agricultural holdings.
While some benefi ciary states choose the SAPARD fi nanced measures themselves, the proportion of each state in the total EU expenditure for SAPARD is decided according to the fi nancial needs factors in agriculture and rural developement of these countries. These factors, at the same time the criteria for fi nancial support, are detailed according to their importance in counting of alocation of each benefi ciary state:
1. farming population,2. agricultural area,3. gross domestic product (GDP) per capita in purchasing power,4. specifi c territorial situation
Figure 1. SAPARD programme in Slovenia, proportion in assigned fi nancial provisions for 2002.
source: Ministry of agriculture, forestry and nutrition Republic Slovenia, june 2003.According to the assigned fi nancial provision criteria, each candidate state was
assigned essentialy different fi nancial provision. So, in the period from 2000 – 2003 70% of the SAPARD programme budget was assigned to Poland, Romania and Bulgaria ( see fi gure 2)

SAPARD PRE-ACCESSION ASSISTANCE PROGRAMME: AIMS... 117
Figure 2. Proportion of benefi ciary states in totally assigned SAPARD fi nancial provisions
SLOVENIJA1%
ESTONIJA2%
BUGARSKA10%
MAĐARSKA7%
SLOVAČKA4%
LITVA6%
LATVIJA4%
ČEŠKA 4%
RUMUNJSKA29%
POLJSKA33%
source: European commission data
3. SAPARD programme implementation criteria and problems in practice
SAPARD is a unique EU fi nancial helping programme whose fi nancial provisions are managed by benefi ciary states themselves. Their authorised agencies choose and implement projects, and the only role of the EU is ex post control, id est fi nancial control. This, so called expanded decentralized implementation qualifi es candidate states for the implementation of structural programmes available to EU member states. It is a european fund for focusing and guarantees in agriculture( EAGGF)in which the national SAPARD agency is converted at the moment of adoption in the Union. Besides, institutional capability improvement of candidate states is a common aim and a priority process of their association to Union. As SAPARD programme includes a large number of smaller projects and EU has not got enough human resources for their monitoring it is very suitable for the Union to accreditate national agencies of candidate states for its performing. To be sure of their capability in effi cacious management with EU provisions, European Commission puts complex criteria in front of them as a prerequisite of independent SAPARD programme implementation. These critera are substituted in the following principles:

@eljka Bajto • Dijana Borojevi} • Stjepan Rudan118
- The principle of decentralized implementation
The possibility of decentralized implementation is legally based by article 12. European Council Directive No 1266/1999.8 Decentralization is related to the selection and the management with projects, fi nancial management and continuos monitoring of implementation. For these tasks European Commission accreditates9 national SAPARD agency ( in the ministries of agriculture). The prerequisite for the accreditation is a realisation of minimum conditions for decentralized management with EU fi nancial helping provisions, announced Multi – annual Financing Agreement.10
In order to prevent management irregularities, SAPARD agency can be subjected to examination by European Commission. +Inside the agency there must exist an independent system of revision and fi nancial control in accordance with international criteria. Because of the same reason, the agency must strictly separate the process of project approval, paying out authorisation, book – keeping and the very payement. Because of that it is necessary to establish inside the agency (fi gure 3):
1. paying agency, responsible for all the fi nancial procedures, including request checking and authorisation of paying outs; and
2. implementing body, responsible for aplication checking, fi eld control, project approval and monitoring of the project progress.
In aim to additionaly ensure the regular EU fi nancial provisions utilization , the responsibility for the fi nancial business of SAPARD agency on the national level takes over National Authorizing Offi cer (NAO). This person, directly responsible to European Commission, is on the head of the National fund, inside the Ministry of fi nance, by which European Commission pays out fi nancial help. Financial provisions are, as well as the implementation criteria, determined by MAFA Agreement for a seven year period, while the annual fi nancial provisions are determined by Annual Financing Agreement – AFA.
8 Council Regulation (EC) No 1266/1999 of 21 June 1999 on coordinanting aid to the applicant counties in the framework of the pre-accession strategy and amending Regulation (EEC) No 3906/89
9 The Commission confi rms accreditation of the national agency accreditated by National fund( so called competent authority) , in the other words national body accreditated by the fund for the very purpose- so called certifying body. So, Commission accreditation follows national
10 Multi-Annual Financing agreement, MAFA; Anex: Council Regulation (EC) No 2222/2000 of 7 June 2000 laying down fi nancial rules for the application of Council Regulation (EC) N0 1268/1999 on Community support for pre – accession measures for agriculture and rural development in the applicant countries of central and eastern Europe in the pre-accession period

SAPARD PRE-ACCESSION ASSISTANCE PROGRAMME: AIMS... 119
- The principle of multi – annual programming
While SAPARD measures do not differ in substance from national policies on agriculture and rural development of candidate states, the principle of programming is an inovation introduced in that policy by SAPARD programme. The fi rst prerequiste for the utilization of the provisions is a national plan for agriculture and rural developement accomplishment that represents national priorities and the needs of a candidate state in the following seven years period. Such plan is made by a special, authorised body of candidate state. In accordance with the Council Regulation11 a national plan must include:
1. a quantifi ed description of the current situation showing disparities, shortcomings potential for development, the main results of previous operations undertaken with Community assistance, the fi nancial resources deployed and the evaluation results available,
2. a description of the strategy proposed, its quantifi ed objectives, the priorities selected and the geographical scope,
3. a prior appraisal showing the anticipated economic, environmental and social impact including effects on employment,
4. an indicative overall fi nancial table summarising the national, the Community and, appropriate, the private fi nancial resources provided for and corresponding to each rural development priority adopted in the context of the plan, including, if necessary, measures fi nanced by the EIB and other international fi nancial instruments,
5. an indicative fi nancial profi le for each year covered by the programming period for each source contributing to the programme,
6. where appropriate, information on the need for any studies, training or technical assistance operations relating to the preparation, implementation or adaptation of the measures concerned,
7. the names of the competent authorities and bodies responsible for carrying out programme, including the paying agency,
8. a defi nition of _fi nal benefi ciaries’, which may be organisations, or public or undertakings responsible for conducting the operations. In cases where public aid is granted by authorities entrusted there with by the applicant countries, the fi nal benefi ciaries shall be the institutions deciding the granting of the public aid,
11 Council Regulation (EC) N0 1268/1999 on Community support for pre – accession measures for agriculture and rural development in the applicant countries of central and eastern Europe in the pre-accession period

@eljka Bajto • Dijana Borojevi} • Stjepan Rudan120
9. a description of the measures contemplated for implementing the plans, and in particular aidschemes, including the points necessary for assessing the rules of competition,
10. provisions ensuring correct implementation of the programme, including monitoring and evaluation and the defi nition of quantifi ed indicators for evaluation and the arrangements for controls and penalties,
11. the results of consultations and provisions adopted for associating competent authorities and bodies as well as appropriate economic, social and environmental partners.
Figure 3. SAPARD programme Enlarged decentralized implementation system
source: European Commission, october,2000.
The Commission estimates the plan and in a six – months period approves it as a national Programme of agriculture and rural development. At the time of the estiomation, its harmmonisation with the EU policy in agriculture and rural development is very important, as well as with the national plan of implementing acquis of each benefi ciary state and with the agreement the state signed with EU (Europe Agreements). The time period of the national Programme must be harmmonized with the duration of EU budget cycles, the current, so called fi nancial perspective covers 2000 -2006. period. If necessary, a plan can be revised.
SAPARD PRE-ACCESSION ASSISTANCE PROGRAMME: AIMS... 121
-The principle of confinancing
EU confi nancing provisions of SAPARD projects can reach 75% of total costs of each project . In the case of profi table projects, public fi nancial provisions- in which EU can take part up to 70%- can cover up to 50% of costs. The EU contribution must be ruled according to EU rules dealing with state subventions in aim to prevent market competition principles violation.
As SAPARD fund provisions are payed out for already spent national fi nancial provisions, the usage of EU fi nancial provisions asks the insurance of enough confi nancing provisions on the national level – from public and/or private sources- for the corresponding multiannual period.
- Project selection criteria
Projects accepted by Agency must respect EU legislation in the area of public supply, state subventions, market competition and agriculture and rural developement. The projects also must agree with the rules of SAPARD programme, some of them are listed below:
1. the producer is a member of a professional or marketing organisation2. the fi rm exists at least three years in economical activity within whisch the help
is asked for3. organic, sustainable production in accordance with EU environmental protection
crireria4. product quality warranr and processing cerifi cate5. minimum agricultural surface for reporting the help6. at least 50% of the budget is realised within the aplicant agricultural activity7. feasibility studies foe lager projects: over 138.000 euros costs payable by SAPARD
fi nancial provisions8. there are no other fi nancial sources, for example national budget or another EU
helping programme9. the project is harmmonized with the programme of agriculture and rural
development and with the regional development plans10. positive project impact on common public estate and employement in rural
areas
SAPARD programme implementation in practice pointed out to be diffi cult because of the impossibility of candidate states to fulfi ll decentralized criteria on time and effectively. Only fi ve of ten states started with its usage till the end of 2001. and all ten states fulfi lled the usage criteria by the end of 2002. To accelerate the provisions usage European Commission accreditated the national SAPARD
@eljka Bajto • Dijana Borojevi} • Stjepan Rudan122
agencies gradually in accordance with their ability to implement each measure. In that way SAPARD agencies were accreditated later on for the implementation of more demanding measures. To enlarge the utilisation of the fi nancial provisions European Commission called the candidate states to suggest certain changes in assigning fi nancial criteria by the middle of 2002. So, in certain cases European Commission allowed diminishing of the number of necessary documents for the project report, spectar of costs confi nanced by EU was enlarged, the lower limit was further diminished and the upper limit of investment into projects confi nanced by EU was raised.
SAPARD problems in practice relate on complex administrative and organisational procedures that strictly determine the contents and the time – limits for aplication fi lling out; on fi nancial criteria of assignement that limit a number of potential benefi ciaries; confusion of business books and proprietary documentation; on the insuffi ciency of available national confi nancing provisions.
4. Evaluation of SAPARD programme effectiveness
Several factors must be concerned in evaluation of SAPARD programme impact on agricultural area and rural holdings of benefi ciary states. On one side the available provisions are determined according to the needs of candidate states in agriculture and rural development. On the other hand the impact of those provisions «delays» bacause of the complexity of programme implementation and that is the reason why the projects for evaluation by SAPARD programme are limited by number. The best indicator of implementation effectiveness is an utilisation rate of assigned provisions that can be seen from the number of stipulated projects and the rate of assigned and avaliable EU fi nancial provisions. Till the end of 2003. only a bit more than a half of the available provisions were engaged of which 209 bil euros were ( or 9.6% of totaly available sum) payed out till the middle of 2003. ( table 2, Annex) Ten benefi ciary states succeeded to contract 1.2 bil euros of EU provisions from SAPARD fund, the sum used for confi nancing of almost 13.000 of accepted projects. Till the beginning of 2003. utilisation rate the number of accepted SAPARD projects and on them agreed fi nancial provisions were extremely low respectivly. The late utilisation rate increased essentialy that pointed out that certain time was needed for the acceptable functioning of the national implementation system. So the percent of the provision settled by the end of 2002. was 10% of the totaly available fi nancial provisions and even 50% by the end of the next year. This sudden settled provision increase refl ects the sudden increase of the allowed provisions as well: till the end of 2002. there were a bit more than 2,000 of them and till the end of 2003. almost 13.000.

SAPARD PRE-ACCESSION ASSISTANCE PROGRAMME: AIMS... 123
The experiences of candidate states pointed out the fact that SAPARD programme was mainly useful to larger agricultural producers and to processing industry. Most of SAPARD measures and provisions are aimed for agricultural holdings modernisation for achieving the competitiveness of their products according the criteria of EU common market. These criteria are resulting from EU legislation in the areas like phytosanitarian criteria, food safety, marketing, consumers protection, technological processes control, working conditions etc. By fullfi lling these criteria the farmers of the future member states are also enabled to realise direct EU payments whose assignement is more and more determined by implementing modern and sustainable criteria of agricultural production.
In comparison with larger and more profi table holdings smaller agricultural holdings have problems in getting necessary personal confi nancing provisions and in comparison with the larger, more modern and more profi table ones, they hardly comply with technical criteria of project aplication.
Because of too small surface and modest production, unfavourable proprietary structure , insuffi cient visions and fi nancial provision, smaller holdings insuffi ciently invests in production modernisation and so the complex SAPARD aplication procedures are not suitable for them. The additional reason of a relativly low small farms representation is frequently lower number of adopted projects.
Figure 4. SAPARD programme utilization rate ( in %) by the end of 2003.
100 100 100 100 100 100 100 100 100 100 100
4352
61
33
84
115
73
63
98
57 56
27
13.914.38
25.4 23 25.23
9.6
0
20
40
60
80
100
120
140
Poljsk
a
Rumun
jska
Bugars
kaLit
vaLa
tvija
Estonij
a
Sloven
ija
UKUPNO
Naznačeno
Ugovoreno
Isplaćeno
source: European Commission dana

@eljka Bajto • Dijana Borojevi} • Stjepan Rudan124
The result of that is that the pre-accession help enlarges the present discrepancy between smaller, more competitive segment of agricultural production and non competitive but more numerous agricultural holdings. Reconstruction of agricultural processing industry in the states of the region is mostly occuring thanks to the infl uence of foreign capital and not EU help. On the other hand, SAPARD programme is trying to help nonperspective farmers in looking for suitable alternative for rural activity – by means of special measures that were not essentialy represented in the policy of regional state till now. So, while SAPARD programme points out on the problem of rural development in the region, its aim is not to resolve agricultural problems and rural areas: disposed funds provisions are not suffi cient for such a dislocation which demands fi nancial as well as an essential time component.
Of a decisive importance, however, is an institutional impact of SAPARD programme on administrative capacities of candidate states institutions. For the effective utilisation of funds provisions, the approach of the institutions to potential benefi ciaries must be open, regular and complete to enable the informations about the fi nancing possibilites and payement criteria for succesful adoption of the projects to be spread to as many farmers as possible. So SAPARD programme interests depend on adequate access, effectiveness, competence and number of staff responsible for the implementation. The effectiveness of SAPARD institution of candidate states refl ects (non)competence to utilize essentialy larger helping provisions after entering the Union: so the fi nancial provision assigned for agriculture and rural development needs of new EU member states rose from 2.1 bil euros pre-accession provisions in the period 2000-2003. to 9.8 bil euros in the period 2004.-2006. The institution restored for SAPARD programme implementation will further manage the fi nancial provisions for member states agriculture and rural development without further changes.

SAPARD PRE-ACCESSION ASSISTANCE PROGRAMME: AIMS... 125
ANNEXES:
Table 1. SAPARD prvosion assigned to member states till the end of 2003 ( bill. euros)
• The sums are approximated and indicative because they are expressed as current prices in each year
Bebefi ciary candidate states 2000. 2001. 2002. 2003. UKUPNO
1. POLAND 168,7 175,1 179,9 181,6 708,2(32,43%)
2. ROMANIA 150,6 156,3 160,7 162,2 632,4(28,97%)
3. BULGARIA 52,1 54,1 55,6 56,1 218,8(10,02%)
4. HUNGARY 38,1 39,5 40,5 40,9 159,8(7,32%)
5. LITHUANIA 29,8 31,0 31,8 32,3 125,2(5,74%)
6. CZECH REPUBLIC 22,1 22,9 23,5 23,7 92,6(4,24%)
7. LATVIA 21,8 22,7 23,3 23,5 91,7(4.20%)
8. SLOVAKIA 18,3 19,0 19,5 19,6 76,8(3,52%)
9. ESTONIA 12,1 12,6 12,9 13,1 51,0(2,33%)
10. SLOVENIA 6,3 6,6 6,8 6,8 26,6(1,22%)
TOTAL 520,00 m 539,65 m 554,50 m 560,00 m 2.183,05 m

@eljka Bajto • Dijana Borojevi} • Stjepan Rudan126
Table 2. SAPARD provisions utilisation rate in period 2000. - 2003.
Benefi ciary state
Totaly available fi nancial provisions in bill €
Number of approved projects
Assigned provisions (bil € ) and as % of totaly available
payed out provisions (% of totaly available ) (till the end of 2002!)
Poland 708,2 4.98643%(305,24 b)
no data
Romania 632,4 58452%(331,05 b)
no data
Bulgaria 218,8 946 61% (134,18 b)
27%
Hungary 159,8 67733%(52,19 b)
no data
Lithuania 125,2 50984%(105,13 b)
13,91%
Czech Republic 92,6 1.656115%(106,34 b)
4,38%
Latvia 91,7 1.50273%(66,65 b)
25,4%
Slovakia 76,8 49463%(48,72 b)
no data
Estonia 51,0 1.32398%(49,68 b)
23%
Slovenia 26,6 23657%(15,26 b)
25,23%
TOTALtill the end of 2003. 2.183,05 m 12.913
56% (1.214 b)
9,6%(209,44 b)till 30. 6. 2003!

SAPARD PRE-ACCESSION ASSISTANCE PROGRAMME: AIMS... 127
Annex 3. Measures confi nanced by SAPARD programme fi nancial provisions
Measure 1. Investment in agricultural propeties
Aim
product quality improvement; costs diminishing; production effi cacity and competitiveness improvement; animal sanitary and living conditions improvement; phytosanitarian conditions harmmonization with EU; technological processes modernisation; environmental pollution control.
Priorities of some benefi ciary states
Bulgaria (205 projects):specialized equipement acquisition for the production in the area of cereals, tobacco and cotton (147), phytosanitarian harmmonization in the area of fruits and vegetables (38), sanitary conditios harmmonization in the area of meat (16), milk area (4). Slovenia (12 projects): stable building for milking cows (8), stable building for breeding pigs(3) and beef processing (1). Estonia (361 projects): cereals growing modernisation then modernisation in the area of diary and infrastructure constructions in cattle-breeding. Lithuania (100 projects): modernisation in the diary area (36), pig breeding (29) livestock breeding criteria implementation and for growing cereals (25). Latvia (229 projects): investments in diary area and milk products (79) and cereals (108).Czech Republic (108 projects): pig stables building (31) and livestock(29) and fertilizer storage (31).
Measure 2. Processing and marketing improvement of agricultural and fi shery products
Aim
process procedure improvement and racionalisation; stimulation of technology implementation for new products and packaging; production accommodation harmmonitzation with EU sanitary and food quality standards; improvment of storage capacities; products presentation and preparation improvement
Priorities of some benefi ciary states
Bulgaria (65 approved projects): the fi rst three positions by number and fi nancial provisions are investments in the areas of meat, wine, and fruit and vegetables. The most frequent projects are improvement, i.e. processing rationalisation (22), adoption of technologies for new products and moder packaging (18) and processing accommoditations harmmonization with EU sanitary and food quality standards (12). Slovenia (10 projects): meat industry (6) and diary industry (4).Estonia (42 approved projects): mostly for building and reconstruction of plant and equipement intended for milk processing , then meat and fi nally fi sh products.Lithuania (25 projects): mostly for meat processing modernisation (14).Latvia (27 projects): (5).Czech Republic (67 projects): mostly investments in meat processing technology (40) and milk(13).

@eljka Bajto • Dijana Borojevi} • Stjepan Rudan128
Measure 3. Development and ramifi cation of rural economic activities
GoalBetter exploitation and protection of local natural and historical-cultural potentials; decreasing of unemployment and increasing of local households incomes; decreasing the depopulation of rural areas
Priorities for the some of benefi ciary countries
Bulgaria (28 projects): majority of resources is directed to rural tourism (building the accommodation facilities). Smaller amount of money are directed to carpentries, fabrication of biological fuel, bees cultivation, water economy, mushroom cultivation, cultivation of herbs etc. Slovenia (21 projects): all projects directed to the rural development, fi rst of all in the area of building new accommodation capacities Estonia (80 projects): most of them for the rural tourism (39).Lithuania (16 projects): majority of them are intended for the rural tourism and recreation (8) and for the services indirectly or directly connected with agricultural activities (7). Latvia (96 projects): 58 from the sector of rural tourism Czech Republic: (47 projects): most of them are dealing with investment in small and medium size holding (22) and rural tourism (7).
Measure 4. Rrural infrastrukture development and improvement
Aim drinking water supply improvement; communication connection; theme paths.
Priorities of some benefi ciary states
Bulgaria: non utilized.Slovenia (10 projects): all projects are connected with drinking water supply.Estonia (26 projects): mostly for watersupply and sewage system construction, then for highway availability improvement Lithuania (39 projects): mostly sewage system construction and drinking water supplyLatvia (10 projects): highways construction (6) and watersupply (3). Czech Republic (28 projects): mostly for local roads construction (9) and sewage systems construction (8).

SAPARD PRE-ACCESSION ASSISTANCE PROGRAMME: AIMS... 129
PRE-ACCESSION ISPA AND SAPARD FUNDS UTILIZATION CRITERIA
Introduction
Pre-accession funds ISPA (Instrument for Structural Policies for Pre-accession) and SAPARD (Special Accession Programme for Agriculture and Rural Development) are the sources of the additional help that EU assignes to candidate states of middle and eastern Europe for valid membership in the Union from 2000. Defi ned by Directive comming after a political agreement on the summit in Luxembourg by the end of 1997., the fi nancial provisions of ISPA fund are intended for infrastructural projects in the area of communication and environmental protection, while those of SAPARD fund resolve agriculture and rural development needs.
To assure that candidate states use the pre-accession provisions for designated purposes and in the most effective way, European Commission stipulate fi hnancial provisions paying out with the implementation of certain implementing criteriaof these programmes. The establishment of corresponding institutional implementation system on a national level is therefore a complex and time consuming activity. System effectiveness directly impacts candidate states capability to use as much of EU fi nancial provisions as availabe. The late candidate states started to use provisions with delay because of the diffi culties in implementation and accreditation of national institutions for the implementation of ISPA and SAPARD programmes fi nancial provisions that had a negative impact on the level of totaly settled and payed out fi nancial provisions.
With regard to certainty of opening new additional pre-accession helping fi nancial sources for Croatia after becomming a candidate state for valid membership, it is of utmost importance to start as early as possible with the constitution of the necessary institutional implementing system. After that follows revision of the institutions ordered by ISPA and SAPARD programmes rules which that remain the sources of pre-accession candidate states help till the end of 2006.
ISPA programme utilization criteria
1. To elaborate areal National strategies- On the basis of the national communication strategy and national environmental
protection strategy the priorities of these areas are determined( sector and sub-sector priorities and geographical priorities- for example space specifi c

@eljka Bajto • Dijana Borojevi} • Stjepan Rudan130
communication and environmental problems), the sources of fi nancila provisions needs for their fi nancing( the best combinationa of provisions from different sources must be determined) and selection and evaluation criteria of project applications. The strategies can be changed if necessary.
- National strategies are not legal documents but directives harmmonized with EU policy in certain sectors ( for example TINA methodology for transeuropean communication network determination, i.e. the way of transport network of candidate states and EU member states connection) and with pre-accession candidate state partnership and its national programme for the adoption of EU legislative- acquis communautaire. ISPA strategies have also to be harmmonized with national development plan (NDP).
- National stratigies in agreement with ISPA benefi ciary states approve European Commission. Yet, by adoption of national strategies European Commission keeps the right to approve each project of the strategy subsequently. Each project is aplicated itself to the Commission for consideration.
2. To choose projects for confinancing- European Commission carries out the initial project selection on the candidate
state proposal, but can take an active part and propose itself some projects if they are not already implemented within national proposals. This selection is made out before starting with complex project documentation production fro each project. The aim is an identifi cation of projects harmmonized with the scope of ISPA programme and EU policy in the communication and environmental protection areas and other relevant acquis areas.
3. To establish the implementation organizations at national level• The ISPA Monitoring Committee is the chief monitoring authority for the
implementation of ISPA projects and is responsible for monitoring the progress made in the implementation of individual ISPA projects. It can give the recommendations to the European Commission concerning necessary changes connected with the projects. The ISPA Monitoring Committee consists of representatives of the EC, the representatives of the country candidate and International Financial Institutions (”IFI”). The ISPA Monitoring Committee is made up of the NIC, NAO, SAO, MTPT and MEn, delegated representatives of the EC, IFI, and fi nal benefi ciaries. The ISPA Monitoring Committee is chaired by the NIC.
• The National ISPA Coordinator (NIC) is a senior offi cer responsible for the implementation of the ISPA programme in the candidate country; he

SAPARD PRE-ACCESSION ASSISTANCE PROGRAMME: AIMS... 131
is also head of the ISPA Monitoring Committee. The National ISPA Co-ordinator (NIC) fulfi ls the following tasks: 1. co-ordinates the preparation and implementation of the EU pre-accession assistance programmes within the framework of the ISPA Programme at the national level, submits basic programming documents concerning pre-accession assistance within the ISPA Programme to the European Commission, signs fi nancing memoranda of ISPA for approved projects on behalf of the Government (Financing Memorandum) 2. informs the MF of requirements for co-fi nancing of ISPA projects, monitors the fulfi lment of approved programming documents, fulfi lment of their priority goals in the preparation and implementation of concrete projects and the operation of implementation agencies, and submits reports to the ISPA Monitoring Committee.
• National Fund: central coffer, inside of the Ministry of fi nance, with special account for receving the EU approved fi nances for the fi inancing of the ISPA projects.
• National Authorising Offi cer (NAO) leads the National Fund and he is responsible for the overall management of the fi nance from ISPA assistance for the candidate country.
• SPA Implementing Agency or Authority (IA): there are two of them, concerning the sectors represented by the ISPA projects-transportation and environment. The responsibility for the implementation of individual ISPA Programme projects is held by these implementation agencies. These are usually Ministries responsible for the sector of environment protection and transportation or public bodies, benefi ciaries of the fi nances. The Sectoral Authorizing Offi cer (SAO), who submits his report to the National ISPA Co-ordinator, chairs the IA. SAO is a signer of different contracts; he is responsible for the administrative, fi nancial and technical leadership and monitoring of the projects and for the submissions of regular technical and fi nancial reports competent higher authorities on the progress of ISPA projects.
• Final benefi ciaries: these are bodies of local self-government, public bodies like Hrvatske željeznice, Hrvatske ceste, Hrvatske vode etc.

@eljka Bajto • Dijana Borojevi} • Stjepan Rudan132
Conditions for the SAPARD resources usage
1. To develop national plan for agricultural and rural development- Plan of rural development
• Plan represent national priorities and needs for the next seven years, or till the end of the moment fi nancial perspective of EU (in case that usage of this fi nances soon be approved for Croatia, national plan will include period from 2004 to 2006)
• According to the prescript VM number 1268/1999, plan consists: description of the moment condition and potential; strategy of the development, goals and measures (especially measures of the country support) on which the strategy is based of; estimation of economic, environmental and social impact of a plan; available fi nances and annual fi nance plans.
• Plan has to be assorted with the EU politics concerning agricultural and rural development and also with the NPPEU and Accession Partnership that the benefi ciary country has signed with EU.
• Plan has to be submitted to the European Commission who approves it in the period of following 6 months as a national programme of agricultural and rural development.
2. To establish the performance bodies at the national level• National SAPARD agency is a body with the accreditation given by the EU in
order to choose projects, deal with the fi nancial management and to conduct systematic implementation control. Agency is usually independent from the Ministry of agriculture (in many cases this agency consist of upgraded previously established national agencies dealing with the payment of country fi nancial support in the agricultural sector). Before the accreditation process, Agency has to meet complicated conditions established in the Financing Memorandum that the benefi ciary country has signed with EU. Inside the agency there is strict segregation among functions of fi nancial payment and choosing and also performance of these projects. Because of that inside the Agency there are two independent bodies: one responsible for the payment and all fi nancial procedures (Paying Agency) and another responsible for the implementation of the projects (Implementing Agency).
• National fund and National Authorizing Offi cer (NAO) the same as in the ISPA programme.
• Competent Authority is a body inside of the National fond that is dealing with the accreditation for the National SAPARD Agency. After that Accreditation has to be confi rmed by the European Commission.

SAPARD PRE-ACCESSION ASSISTANCE PROGRAMME: AIMS... 133
• Certifying Body is a body that National Fond empowers to fortify the fulfi lment of all conditions that SAPARD Agency needs to have in order to obtain national accreditation. This Certifying Body is usually National revision Offi ce.
• Final benefi ciaries are usually private sector contractor dealing with agricultural and rural affairs and contractors that are dealing with public operations on smaller local infrastructure objects.
Literatura:
1. SAPARD – Special Accession Programme for Agriculture & Rural Developmenthttp://europa.eu.int/comm/enlargement/pas/sapard.htm
2. REPUBLIC OF SLOVENIA MINISTRY OF AGRICULTURE, FORESTRY AND FOOD: Rural Development Plan 2000 – 2006http://europa.eu.int/comm/agriculture/external/enlarge/countries/slovenia/plan/plan_en.pdf
3. Council Regulation (EC) No 1268/99 of 21 June 1999 on Community support for pre-accession measures for agriculture and rural development in the applicant countries of central and eastern Europe in the pre-accession periodhttp://europa.eu.int/scadplus/leg/en/lvb/l60023.htm
4. Pre-accession agricultural instrument (Sapard)http://europa.eu.int/scadplus/leg/en/lvb/l60023.htm#AMENDINGACT

Dominika Crnjac • Karolina [tefanac134
SITUATION ANALYSIS OF THE TRADE SECTOR IN PO@E[KO – SLAVONSKA COUNTY
Dr. sc. Dominika CrnjacFaculty of Electrical Engineering Osijek
Karolina [tefanac, dipl. oec.
Summary
This paper provides account of situation in the trade sector of Požeško-slavonska county.
The following indicators were used: the number of business entities, the number of employees, investments in trade, exports and imports, price trends index and costs of living as well as turnover and the number of employees in shops.
The above listed indicators were analized for several previous years.
Key words: distribution trade, G-trade, wholesale trade, retail trade
1. IntroductionThe process of economic opening of Croatia, accelerated liberalization processes
and globalization of macro-markets weakened competitiveness of the Croatian trade. At the time of economic transition, trade had no clear strategy, technologically it was underdeveloped, with inadequate laws, fragmentized and with high price of capital. Further, our country failed to use incentive measures to strengthen and consolidate domestic supermarket chains and other trade activities.
Situation analysis of the trade sector has been developed based on statistical indicators according to the National Classifi cation of Activities (NCA). According to the same classifi cation, trade was categorized into G area, as distributive trade.
Distributive trade1 is defi ned as sum of all forms of trade activities, from procurement of goods from producer to delivery of the goods to the end consumer.
1 Segetlija Z., Lamza-Maronić M., Distributive system of trade companies -Distribution-Logistics- Information, Faculty of Economy Osijek, 1995

SITUATION ANALYSIS OF THE TRADE SECTOR IN PO@E[KO – SLAVONSKA... 135
Distributive trade plays the key role in economy, due to its position between supply and demand for goods, infl uencing both producers and consumers.
Distributive trade can be roughly divided into wholesale trade and retail trade. Trade agents, that is, trade representatives, also belong to the trade sector, specifi cally to wholesale trade. These agents are also known as mediators in wholesale trade, they connect buyers and sellers, without actually becoming owners of goods. It should be also mentioned that export and import activities are also included in wholesale trade.
Although wholesale and retail traders really buy and sell goods, procured goods are not treated as part of their internal consumption, if they resell it with minimum fi nishing like sorting, cleaning, packaging, etc. Wholesale and retail trade are treated as services of purchasing goods, storing them and displaying product range at an adequate location, which makes them accessible for buying. Output of trade activities2 is measured by the total value of margin realized on the goods purchased for the purpose of reselling.
Distributive trade includes the following activities3:
� Wholesale trade with collection of payments or according to an agreement
(mediation in wholesale trade)
� Wholesale trade on one’s own
� Retail trade
� Repairs of motor vehicles and motorcycles as well as objects for personal use and household
Economic role of wholesale trade is defi ned in relation to producers and retail traders. Wholesale traders store large quantities of goods and contribute to regulation of production by scheduling their orders over a certain period. They continuously provide fi nancial fl ow for producers by paying these orders. At the same time, wholesale traders supply buyers with goods, regardless of the place and time of production.
Wholesale traders are intermediary connection between retail traders and producers, in this way allowing producers to acquire knowledge about the market through reaction they receive about their products. Besides, they also play an important role for retail traders, because they supply them with information about products and
2 Segetlija Z., Lamza-Maronić M., International logistical systems, Contemporary trade, Zagreb,19943 Segetlija Z., Lamza-Maronić M., Distributive system of trade companies -Distribution-Logistics-
Information, Faculty of Economy Osijek, 1995

Dominika Crnjac • Karolina [tefanac136
brands available on the market, and help them form their product ranges. Function of procurement and selection of products is important in wholesale trade because it gives advantage to trade specialization and reduces production costs in this way.
Retail traders have similar function, but to a lesser extent. Retail trade mainly consists of purchasing goods that will be resold to consumers. Some of the most important basic services of this sector are location adequacy, wide product range and procurement of small quantities of goods for consumers.
Trading forms consist of local units and sales outlets that use the same ways of selling and offer the same type of services.
Main trading forms are:
For wholesale trade:� traditional wholesale� «cash and carry» or wholesale self-service with non-specialized product lines � resale of entire specialized product lines
For retail trade:� supermarket� discount shops� department store� grocery shop� widely specialized salesperson� narrowly specialized salesperson
For direct sale:� catalogue sale� telemarketing� electronic sale� travelling sale, street sale
2. Situation analysis of trade from 2001 – 2005This part of analysis provides account of trade activities in the past fi ve years
with larger number of indicators and with more detailed analysis that serves as basis in developing the strategy for development of trade on the area of Požeško – slavonska county. The analysis includes the indicators about:
o the number of trade entities, o operations of business entities in trade sector, o investments,

SITUATION ANALYSIS OF THE TRADE SECTOR IN PO@E[KO – SLAVONSKA... 137
o characteristics of the population and its purchasing power, o the number of sales outlets and turnover in trade,o trends in prices and living costs and o export and import.
a) Indicators of the number of business entities and the number of employees
Table 1- Registered economic entities according to NCA
Activity 2002 2003 2004 2005
Total countyregistered registered active registered active registered active2.280 2.325 781 2.378 892 2.437 841
Trade 775 912 329 786 311 798 278
Trade share 33,9 % 39,3 % 42,1 % 33 % 34,8 % 32,7 % 33 %
Source: Central Bureau of Statistics
Table 2- The number of companies whose main activity is trade and their share in the total number of companies in the county:
Year Small % Medium % Large % Total %2001 247 98,40 3 1,19 1 0,39 251 40,422002 229 98,70 2 0,86 1 0,43 232 39,862003 210 97,22 5 2,31 1 0,46 216 39,052004 204 97,14 5 2,38 1 0,47 210 39,552005 - - - - - - 190 37,62
Source: FINA; all active legal persons whose turnover in the referential year was larger than zero
The stated indicators show that the total number of business entities in the trade sector in the analized years exibits negative trends on the area of Požeško-slavonska county.
Most of the total number of active companies whose main activity is trade are small companies with 97,14%, then medium-sized with 2,38% and one large company with 0,47%.
The share of trade in the total number of registered business entities in Požeško – slavonska county is about 34%, and active business entities about 36%. Through analized period, and according to the information from the State Bureau of Statistics, the table shows large difference between registered and active business entities. The same information was taken from the administrative register of the State Bureau of Statistics, and this register is not regularly updated. It is estimated that more than a
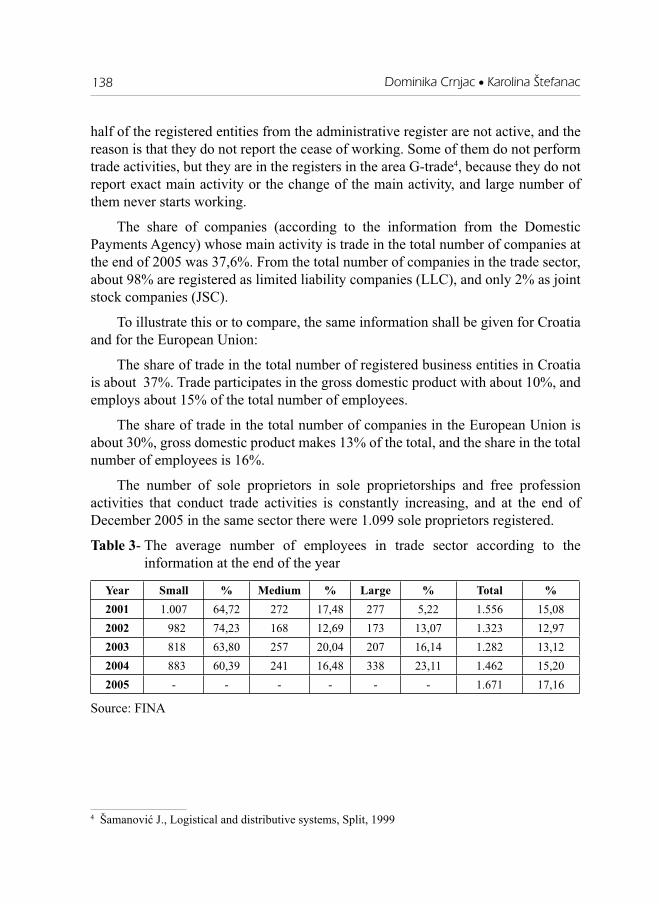
Dominika Crnjac • Karolina [tefanac138
half of the registered entities from the administrative register are not active, and the reason is that they do not report the cease of working. Some of them do not perform trade activities, but they are in the registers in the area G-trade4, because they do not report exact main activity or the change of the main activity, and large number of them never starts working.
The share of companies (according to the information from the Domestic Payments Agency) whose main activity is trade in the total number of companies at the end of 2005 was 37,6%. From the total number of companies in the trade sector, about 98% are registered as limited liability companies (LLC), and only 2% as joint stock companies (JSC).
To illustrate this or to compare, the same information shall be given for Croatia and for the European Union:
The share of trade in the total number of registered business entities in Croatia is about 37%. Trade participates in the gross domestic product with about 10%, and employs about 15% of the total number of employees.
The share of trade in the total number of companies in the European Union is about 30%, gross domestic product makes 13% of the total, and the share in the total number of employees is 16%.
The number of sole proprietors in sole proprietorships and free profession activities that conduct trade activities is constantly increasing, and at the end of December 2005 in the same sector there were 1.099 sole proprietors registered.
Table 3- The average number of employees in trade sector according to the information at the end of the year
Year Small % Medium % Large % Total %2001 1.007 64,72 272 17,48 277 5,22 1.556 15,082002 982 74,23 168 12,69 173 13,07 1.323 12,972003 818 63,80 257 20,04 207 16,14 1.282 13,122004 883 60,39 241 16,48 338 23,11 1.462 15,202005 - - - - - - 1.671 17,16
Source: FINA
4 Šamanović J., Logistical and distributive systems, Split, 1999
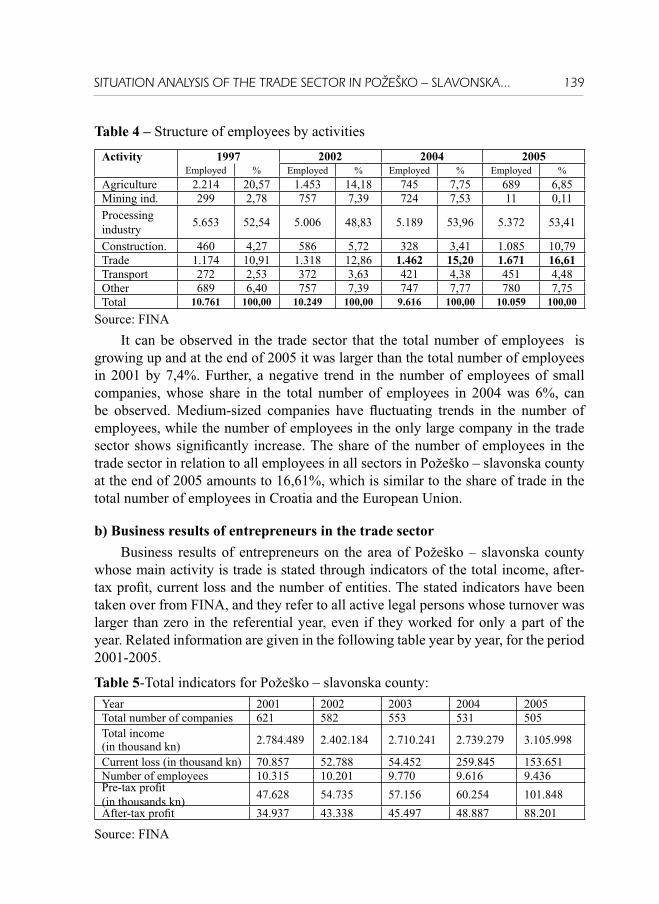
SITUATION ANALYSIS OF THE TRADE SECTOR IN PO@E[KO – SLAVONSKA... 139
Table 4 – Structure of employees by activities
Activity 1997 2002 2004 2005Employed % Employed % Employed % Employed %
Agriculture 2.214 20,57 1.453 14,18 745 7,75 689 6,85Mining ind. 299 2,78 757 7,39 724 7,53 11 0,11Processing industry 5.653 52,54 5.006 48,83 5.189 53,96 5.372 53,41
Construction. 460 4,27 586 5,72 328 3,41 1.085 10,79Trade 1.174 10,91 1.318 12,86 1.462 15,20 1.671 16,61Transport 272 2,53 372 3,63 421 4,38 451 4,48Other 689 6,40 757 7,39 747 7,77 780 7,75Total 10.761 100,00 10.249 100,00 9.616 100,00 10.059 100,00
Source: FINAIt can be observed in the trade sector that the total number of employees is
growing up and at the end of 2005 it was larger than the total number of employees in 2001 by 7,4%. Further, a negative trend in the number of employees of small companies, whose share in the total number of employees in 2004 was 6%, can be observed. Medium-sized companies have fl uctuating trends in the number of employees, while the number of employees in the only large company in the trade sector shows signifi cantly increase. The share of the number of employees in the trade sector in relation to all employees in all sectors in Požeško – slavonska county at the end of 2005 amounts to 16,61%, which is similar to the share of trade in the total number of employees in Croatia and the European Union.
b) Business results of entrepreneurs in the trade sector Business results of entrepreneurs on the area of Požeško – slavonska county
whose main activity is trade is stated through indicators of the total income, after-tax profi t, current loss and the number of entities. The stated indicators have been taken over from FINA, and they refer to all active legal persons whose turnover was larger than zero in the referential year, even if they worked for only a part of the year. Related information are given in the following table year by year, for the period 2001-2005.
Table 5-Total indicators for Požeško – slavonska county: Year 2001 2002 2003 2004 2005 Total number of companies 621 582 553 531 505Total income (in thousand kn) 2.784.489 2.402.184 2.710.241 2.739.279 3.105.998
Current loss (in thousand kn) 70.857 52.788 54.452 259.845 153.651Number of employees 10.315 10.201 9.770 9.616 9.436Pre-tax profi t (in thousands kn) 47.628 54.735 57.156 60.254 101.848After-tax profi t 34.937 43.338 45.497 48.887 88.201
Source: FINA

Dominika Crnjac • Karolina [tefanac140
Business operations of companies in the trade sector:
Table 6- Total income in the trade sectorin thousand kn
Year Small % Medium % Large % Total % in the county
2001 653.147 53,44 130.214 23,26 171.960 17,15 955.323 34,312002 431.444 53,61 49.065 13,12 217.973 17,77 698.483 29,082003 352.709 51,28 96.209 23,42 259.027 16,07 707.946 26,122004 389.230 54,66 106.219 25,35 374.596 31,76 870.046 31,762005 - - - - - - 1.103.558 35,52
Table 7 – Current lossin thousand kn
Year Small % Medium % Large % Total %2001 6.782 34,68 1.235 9,11 0 0,00 8.018 11,322002 8.772 46,28 0 0,00 0 0,00 8.772 16,622003 7.933 33,26 2.043 17,90 0 0,00 9.976 18,322004 10.292 38,62 0 0,00 0 0,00 10.292 3,962005 - - - - - - 15.675 10,20
Source: FINA
Table 8 – Pre-tax profi tin thousand kn
Year Small % Medium % Large % Total %2001 8.633 34,36 932 8,02 2.555 23,52 12.121 25,452002 9.972 48,75 705 5,59 1.507 6,96 12.185 22,262003 8.769 47,44 1.968 11,71 2.194 10,04 12.931 22,632004 11.296 52,03 2.940 20,11 2.620 10,96 16.858 27,982005 - - - - - - 22.581 22,17
Source: FINA
Table 9 – After-tax profi tin thousand kn
Year Small % Medium % Large % Total %2001 5.854 33,98 583 6,49 1.644 18,88 8.083 23,142002 6.945 49,06 478 4,58 992 5,30 8.416 19,422003 6.308 45,77 1.444 11,32 1.585 8,36 9.338 20,522004 8.647 51,21 2.268 19,45 1.971 9,69 12.886 26,362005 - - - - - - 18.724 21,22
Source: FINA

SITUATION ANALYSIS OF THE TRADE SECTOR IN PO@E[KO – SLAVONSKA... 141
From the above stated indicators it can be observed that the total number of companies in Požeško – slavonska county in the analized period 2001 – 2005 decreased, and the same negative trend in the number of companies was observed in the trade sector.
Total income in all sectors on the area of our county (table 5) in 2002 in relation to 2001 went down by 13,73%. In other years an increase can be observed, and total income in all sectors in 2005 when compared to 2001 increased by 11,55%, and similar trends can be noticed in total income and in the trade sector.
In the trade sector, the loss in the analized period (table 7) had negative trends, and the largest loss was realized in 2005, and it is larger by 34,34% in relation to the loss from 2004. Positive trends in the trade sector can be seen in the increase of the total number of employees.
Besides, positive movement in the trade sector in this period were observed in pre-tax and after-tax profi t.
Fixed assets grew in 2005 by 14,05% in relation to 2004, and current assets increased by 18,1%. The share of fi xed assests in total assets in trade in 2001 amounted to 41,05 %, an the share of current assets was 54,93 %, which is at the same level as in 2004.
Capital and reserves in the trade sector in 2005 were larger by 7,76% in relation to 2004. Capital and reserves in the trade sector participated with 18,97% in the total assets of the trade sector, and in the total assets in all sectors 3,2%.
Long-term liabilities in the trade sector in 2005, compared to 2004, were higher by 29,7%, short-term liabilities by 17,9%, and the total liabilities were larger by 15,8%.
Table 10 – Ratio between after-tax profi t and loss in companies
Year Ratio between profi t and lossSmall Medium Large Trade total
2001 0,86 0,47 0 1,012002 0,79 0 0 0,952003 0,79 0,70 0 0,942004 0,84 0 0 1,252005 - - - 1,19
Source: Calculation based on indicators from the tables 7 and 9> 1 – favourable ratio< 1 – unfavourable ratio 0 – favourable business operations without loss

Dominika Crnjac • Karolina [tefanac142
If ratio between profi t and loss as the most important indicator is analized, it can be observed that it was unfavourable for small companies throughout the analized period.
The ratio in medium-sized companies is a little bit more favourable, while the only large trading company worked without losses in all years of the observed period. Based on the favourable ratio between after-tax profi t and loss realized by medium and large companies, we obtained favourable ratio of the total business operations in the trade sector.
Total business operations of entrepreneurs in the trade sector can be given a positive grade. If business operations of companies in the trade sector are evaluated according to the achieved total income, it can be said that the trade is the second sector by the size of the total income, with the share of about 31% in the total income in all sectors in the county. The largest total income is achieved in the processing industry, whose share in the total income in the county is 34%. Looking individually, the largest total income in the total income of all companies in the county is realized by large company Presofl ex LLC from Požega, in the trade sector.
Besides good examples in business operations of companies in the trade sector, 53 small companies had diffi culties in doing business, due to which 52 companies are in liquidation and one is in bankruptcy. In companies where liquidation procedure started there were 69 employees.
c ) Investments in fi xed assets
Realized investments in fi xed assets on the area of Požeško – slavonska county represent the value of physically realized construction, production or purchase of fi xed assets throughout the year, regardless of if and when their payment was collected.
Table 11- Investments by activities and seat of investor 2001 – 2004in thousand kuna
Activity 2001 2002 Index02/01 2003 Index
03/02 2004 Index04/03
Trade 4.147 1.872 45,1 14.804 790,8 38.356 259,1Total
activities 137.888 153.477111,3
175.585 114,4 173.624 98,9
Share of trade in the total 3 % 1,2% - 8,4 % - 22,1 -
Source: Central Bureau of Statistics

SITUATION ANALYSIS OF THE TRADE SECTOR IN PO@E[KO – SLAVONSKA... 143
In the analized period (2001 - 2004) there were positive trends in total investments in all sectors in Požeško – slavonska county. In 2001 and 2002 there were no signifi cant investments in the trade sector, and investments in this sector in 2003 and 2004 increased. The share of trade in the total investments in our county in the fi rst two stated years was insignifi cant, but at the end of 2004 the share in the total investments went up and it was realistic in relation to the share of trade in the total number of active companies. Large increase of total investments in the trade sector resulted from consolidation and concentration of retail trade entities and establishment of large supermarkets, increase of sale and storage space and better informatization..
d) Wholesale trade
According to the Trade law, wholesale trade5 is defi ned as purchase of goods for the purpose of reselling them further to retail traders, industrial, trade and professional users and institutions, and other wholesale traders as well as mediation in trade, that is, sale of goods for third persons. Here belongs transit traffi c, that is, sale of goods that are delivered at the order of salesperson directly to the buyer, from storage or other destination of producer, importer, or other business entity, without previous storage of such goods at producer’s premises. Further, the same law determines that purchase and sale of goods on a foreign market is also wholesale trade.
Trade with foreign countries is conducted based on a contract between a trader with seat in Croatia and persons with seat in foreign countries, in accordance with regulations of Croatia and international agreements and contracts.
Any trader or other physical or legal person that transports goods into or out of the country in order to conduct registered activities can be an importer or exporter. Also, any trader or other physical or legal person registered to conduct production activities who sells its products on the market can be an importer or exporter. This is the case with most of the legal persons in Požeško – slavonska county that conduct production activities, and sell their products on a foreign market.
This analysis included indicators for Požeško – slavonska county about the toal value of goods that were exported within a certain period to a foreign market or imported from the same market into our county. Wider analysis of wholesale trade was not made due to the lack of information, so we analized only trends of that part of wholesale trade that refers to exports and imports.
5 Trade law, National Gazette

Dominika Crnjac • Karolina [tefanac144
Relation between exports and imports
Table 12 - Exports – imports by sectors; 2001 – 2005
Year 2001 2002 2003 2004 2005
Total exports000 USD 59.667 61.487 54.296 45.767 48.967
index ‘01/’0089,5
‘02/’01103,1
‘03/’0288,3
‘04/’0384,3
‘05/’04107,0
Total imports 000 USD 50.176 45.166 34.556 27.053 31.076
Index ‘01/’00102,9
‘02/’0190,0
‘03/’0276,5
‘04/’0378,3
‘05/’04114,9
Coeffi cient (exports/imports) 1,19 1,36 1,57 1,69 1,58
Source: Central Bureau of Statistics
Amounts in USD were calculated based on daily exchange rates on the day of custom clearance of goods, they are determined by Croatian National Bank, medium exchange rate was used.
It can be observed in the analized period, according to the table 12, that values of the total exports and total imports had decreasing tendency, except increase in 2005.
Požeško – slavonska county showed export – import surplus in the analized fi ve-year period, that is, the value of exports during all fi ve years was larger than the value of imports. Coeffi cient of exporting predominance was constantly rising, except that in 2005 it decreased to the level as in 2003.
Our county, along with positive trends in export – import, has good preconditions to increase the value of total exports. This in the fi rst place refers to tradition in production in processing industry, then good natural resources and production potential oriented toward exports, and cheap labour force. In order to make this preconditions come true, it is necessary to make investments in new technology, which would make production cheaper and increase its effi ciency.
Beside stated measures, the Government of Croatia has to adopt certain measures to stimulate exports at the national level, and this in the fi rst place refers to monetary and fi scal politics6. By current monetary and fi scal politics, the state stimulated imports through appreciation of domestic currency. In addition to export benefi ts that would manifest through positive politics of domestic currency exchange rate, loan support and incentive for implementation of new technologies in production, the state should provide incentives for exported goods to producers in the form of loans for working capital in preparing exports and for export of goods and services.
6 V. Srb, B. Matić, B. Marković: Monetarne fi nancije (Monetary Finances), Ekonomski fakultet u Osijeku, Osijek, 2003.
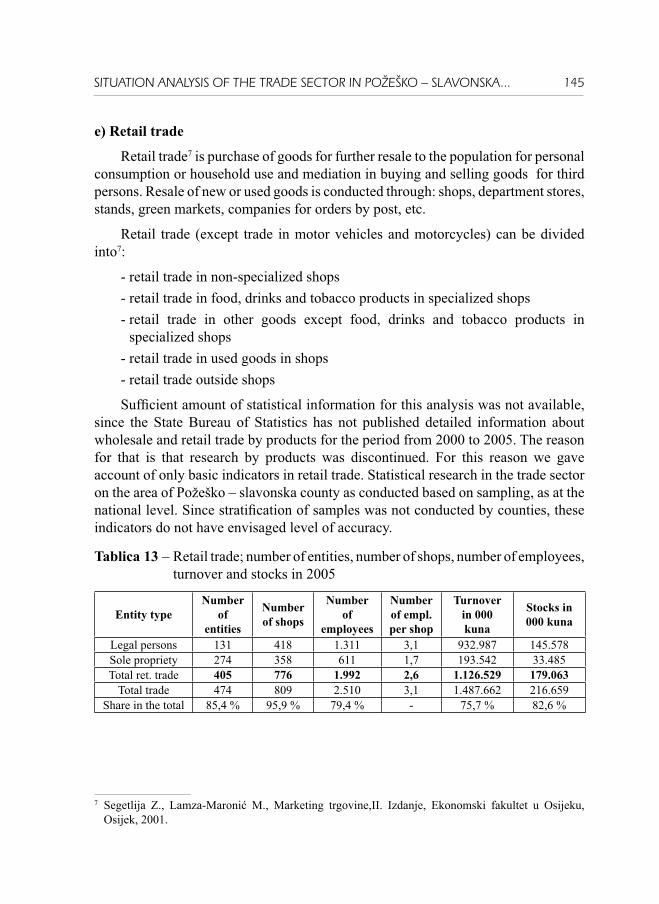
SITUATION ANALYSIS OF THE TRADE SECTOR IN PO@E[KO – SLAVONSKA... 145
e) Retail trade
Retail trade7 is purchase of goods for further resale to the population for personal consumption or household use and mediation in buying and selling goods for third persons. Resale of new or used goods is conducted through: shops, department stores, stands, green markets, companies for orders by post, etc.
Retail trade (except trade in motor vehicles and motorcycles) can be divided into7:
- retail trade in non-specialized shops- retail trade in food, drinks and tobacco products in specialized shops- retail trade in other goods except food, drinks and tobacco products in
specialized shops- retail trade in used goods in shops- retail trade outside shops
Suffi cient amount of statistical information for this analysis was not available, since the State Bureau of Statistics has not published detailed information about wholesale and retail trade by products for the period from 2000 to 2005. The reason for that is that research by products was discontinued. For this reason we gave account of only basic indicators in retail trade. Statistical research in the trade sector on the area of Požeško – slavonska county as conducted based on sampling, as at the national level. Since stratifi cation of samples was not conducted by counties, these indicators do not have envisaged level of accuracy.
Tablica 13 – Retail trade; number of entities, number of shops, number of employees, turnover and stocks in 2005
Entity typeNumber
of entities
Number of shops
Number of
employees
Number of empl. per shop
Turnover in 000 kuna
Stocks in 000 kuna
Legal persons 131 418 1.311 3,1 932.987 145.578Sole propriety 274 358 611 1,7 193.542 33.485Total ret. trade 405 776 1.992 2,6 1.126.529 179.063
Total trade 474 809 2.510 3,1 1.487.662 216.659Share in the total 85,4 % 95,9 % 79,4 % - 75,7 % 82,6 %
7 Segetlija Z., Lamza-Maronić M., Marketing trgovine,II. Izdanje, Ekonomski fakultet u Osijeku, Osijek, 2001.

Dominika Crnjac • Karolina [tefanac146
Table 14 – Turnover in shops in 2005 in thousands kn
Type of econ. entity
Number of ent.
Number of empl.
Turnover in shops
Turnover per econ. entity
Turnover per employee
Legal persons 131 1.311 932.987 7.122 711
Sole propr. 274 611 193.542 706 316Total retail
trade 405 1.992 1.126.529 2.781 565
Total trade 474 2.510 1.487.662 3.138 592
Source: Central Bureau of Statistics
Table 15 – Number of inhabitants according to the Registry of 2005 per number of shops in retail trade in Požeško – slavonska county
Year Number of inhabitants Number of shops Number of people per 1 shop2005 85.831 776 110,6
Source: Central Bureau of Statistics
According to the table 13, retail trade has signiicant share in the total indicators in the trade sector of Požeško – slavonska county, and this share ranges from 75 – 95%.
Further, it can be observed from this table that the signifi cant share of retail trade belongs to sole proprietorships and free professions. Over 45% of shops and 30% of employees in the retail trade of Požeško – slavonska county is in the fi eld of sole proprietorships and free professions.
Turnover in retail trade in the fi eld of sole proprietorships and free professions makes 17% of the total turnover in retail trade in our county. If turnover is put into relation to the number of registered entities, it can be observed that the value of realized turnover in the fi eld of sole proprietorships and free professions is very small in relation to legal persons. Turnover per number of employees also has small value in relation to turnover per employee realized in retail trade of legal persons. The reasons for that are the size of business premises, the number of employees on these premises, and narow product range..
In 2005 in Požeško – slavonska county there were 405 business entities registered for conducting trade activities in retail trade. The same business entities conducted retail trade in 776 shops. The number of employees per shop was 2.6, and the number of inhabitants per shop was 110, while turnover per employee amounted to 565 thousand kunas.
Retail trade is still fragmentized, although this sector in Europe goes through largest changes, which are manifested through integration and restructuring of the

SITUATION ANALYSIS OF THE TRADE SECTOR IN PO@E[KO – SLAVONSKA... 147
market, which is, according to experts, expected to last until 2010. This process was observed to a great extent in all transition countries in the 90-ies, while this process could be observed in Croatia only in the past few years.
When Croatia is observed in this process, then on one side there is a very strong occurrence of foreign supermarket chains entering our market, and on the other hand, as reaction to these processes, domestic trade goes through consolidation and concentration processes.
Processs of consolidation and concentration of trade also take place in our county. Unfortunately, these processes should have started earlier and they should have been managed and directed by state institutions and the county.
Total turnover, the number of employees and average salaries in companies in the trade sector
These indicators have been taken over from statistical research in the fi eld of distributive trade with the aim of explaining trends in turnover and the number of employees in the companies in the trade sector.
Table 16 – Turnover in thousands kn, VAT not included
2003 2004 2005Activity Turnover Empl. Turnover Employees Turnover EmployeesWholesale trade 274.022 138 216.920 58 257.979 426Mediation 9.011 128 188 1 68.952 35Retail trade 435.305 804 316.373 1.932 932.987 1.311Repair sevices 6.596 21 99 8 11.009 67Total trade 724.934 1.091 533.580 1.999 1.270.927 1.839
Source: Central Bureau of Statistics
It can be observed from the indicators shown in the table above that the process of consolidation and concentration in our county in the last two years resulted in signifi cant increase in turnover and the number of employees. Looking individually by activities within the total situation in all trade activities, it can be noticed that there has been a signifi cant increase in turnover and the number of employees in wholesale trade, mediation, repairs, and in 2005 in retail trade, which had the largest turnover and the largest number of employees in the analized period.
Further, increased turnover resulted from increased number of supermarkets who offered lower prices and in this way prevented our citizens from going shopping abroad.
Besides, increased turnover in retail trade resulted from various payment-related benefi ts for buyers, like deferred payments for checks and credit cards and increase

Dominika Crnjac • Karolina [tefanac148
in the number of loans that are offered at far better conditions than in previous years. Increased turnover was also infl uenced by good conditions for car buying for war veterans, which was discontinued in the middle of 2001.
Although average net salaries in all activities on the area of Požeško-slavonska county showed positive trends from 1993 to 2001 (they were constantly increasing), average net salaries in the trade sector in the same period were lower than average salaries in other sectors.
Explanation for such indicators can be found in the facts related to qualifi cation structure of employees in the trade sector, where employers pay salaries according to educational background, but in most cases without bonus if turnover was larger than expected. In the total number of employees in the trade sector in 2000, on the area of Požeško-slavonska county, most of employees were with secondary school qualifi cations and qualifi ed salespersons with 78,6%, then semi-qualifi ed, non-qualifi ed, and lower educational background with 9%, highly qualifi ed with 3,9%, and two-year of post secondary or university qualifi cations with 8,4%. Situation is similar also in other years of the analized period from 1993 to 2001.
f) Living standard and purchasing power of population
Economic development and purchasing power of population are of great importance for possibilities of further development and strengthening of business activities in the trade sector. Although war damages signifi cantly reduced economic capacities and production on the area of Požeško-slavonska county, its economy did not suffer any shortage. Trade companies faced various diffi culties in doing business at that time, and these problems inluded: decreased purchasing power of population, disturbed relations on broader market, problems with liquidity, etc. The post-war period was the key period which brought to bad situation in the trade sector, due to decreased living standard. Such negative trends stopped in 1995, but since 1999 purchasing power of the population decreased again, which was caused by further rise of prices and living costs, irregular payments of salaries, etc.
Table 18 – Retail price indexes and living costs indexes 1991 – 1999Year 91/90 92/91 93/92 94/93 95/94 96/95 97/96 98/97 99/98
Retail prices indexes 223,0 765,5 1.617,5 197,6 102,0 103,5 103,6 105,7 104,2Indexes of living costs 224,2 734,0 1.586,3 207,2 104,0 104,3 104,1 106,4 103,5
Source: Central Bureau of Statistics
For evaluation of trends in economic development and living standard of the population we had to use indicators for Croatia, because such statistical researches have not been conducted at the county level.

SITUATION ANALYSIS OF THE TRADE SECTOR IN PO@E[KO – SLAVONSKA... 149
The level of economic development and living standard of the population are best illustrated by information about: gross domestic product, structure of personal consumption of a consumer (especially important for development of retail trade), and presence of durable consumer goods in households of Croatia.
Table 19 – Information about values of gross domestic product per capita, in USD
Year 1990 1991 1992 1993 1994 1995 1996 1997 1998 1999GDP 5.106 3.887 2.664 2.481 3.062 3.873 4.243 4.398 4.833 4.480
Source: Central Bureau of Statistics, statististical information
Analizing gross domestic product in the period from 1990 to 1999, it can be observed that there was a decrease from 1991 to as long as 1994 as a result of war. After that there were positive trends until 1999, when GDP went down.
Table 20 – Structure of personal consumption, average per household from 1998 to 1999
Consumption groups Average annual personal consumption in kunas
Structure of personal cosumption in %
2002 2003 2004 2002 2003 2004Personal consumption - total 53. 677 52. 382 58.613 100 100 100
Food and beverages 20. 485 19. 826 18.845 38,17 37,85 32,15Alcoholic drinks and tobacco 2. 473 2. 391 2. 273 4,61 4,56 3,89Clothes and shoes 3. 367 3. 911 5. 907 6,27 7,47 10,08Dwelling and energy consumption 5. 800 6. 958 7. 811 10,81 13,28 13,33Furniture, equipment and regular maintenance 3. 387 3. 081 2. 880 6,31 5,88 4,91
Health care 898 957 1.228 1,67 1,83 2,09Transport 7. 204 5. 752 7. 156 13,42 10,98 12,20Communications 1. 008 1. 113 1. 619 1,88 2,12 2,76Recreation and culture 2. 758 2. 994 3. 931 5,13 5,72 6,71Education 330 368 431 0,61 0,70 0,73Catering services 1. 653 1.429 2. 155 3,05 2,73 3,68Other goods and services 4. 332 3. 602 4. 377 8,07 6,88 7,47
Source: Central Bureau of Statistics, priopćenje br.13.2.1. / 2001
The quality of living and purchasing power can be evaluated based on indicators of structure of personal consumption, when these are compared to information about personal consumption in nine more important EU countries. Croatian people on average spend about 40% of the total consumption on food, drinks and tobacco, while about 13% of the total consumption is spent on dwelling. Compared to average consumption in the EU countries, this is a very bad relation, because in these countries

Dominika Crnjac • Karolina [tefanac150
about 19,7% is spent on food, drinks and tobacco, and about 25,3% for dweling. When it comes to transport, communications, clothes and shoes, furniture and house maintenance, recreation, culture, hotels and restaurants, European people spend in these fi elds signifi cantly more than Croatian people.
3. Conclusion
In modern conditions of conducting business, decisions made at the company level, and also at the level of the entire economy of our county, are very important for selection of adequate strategy for trade development, due to relatively high distribution costs.
In the new economic system, trade will develop as market institution. Economic conditions should no longer be an obstacle in development of internal trade in Požeško-slavonska county.
Organization and structure of our internal trade has to be a function: of size and potential of the market, properties of available goods and services, size of production units and state of their specialization, etc., and level of total economic development.
Along with expansion of foreign supermarket chains in Croatia, the process of consolidation and concentration of domestic trade started, but it is currently still inadequate to respond to foreign competition. Weaknesses of domestic trade became prominent in such situation, and this are in the fi rst place small possibilities of investing into own development, high retail prices conditioned by costs on which trade had no impact, insuffi cient informatical equipment, weak personnel structure, that is, low level of knowledge due to weaknesses of education system, delayed business and development linkage with production and creation of partner relations. As a result of arrival of foreign supermarket chains, several thousands of small shops were closed in Croatia in the past year, and this trend goes on. Foreign supermarket chains build large business centers in all larger towns and so they throw domestic traders out from the ever crowded market. The role of the state in terms of protection of domestic trade is almost non-existing, and the state should fi nally decide on what kind of trade it wants, because domestic food industry depends on it to a large extent. The situation in Požeško-slavonska county is almost the same, only comfort being that there are no foreign traders in our county. Large business centers were built or established by Presofl ex and KTC, with mostly food products. In the western part of our county and towns Pakrac and Lipik, war resulted in reduced number of inhabitants by almost 50%, so there was no interest in establishing a larger supermarket there.
Due to the above stated reasons it is necessary to persist during the coming period in the following:

SITUATION ANALYSIS OF THE TRADE SECTOR IN PO@E[KO – SLAVONSKA... 151
� conduct restructuring in direction of consolidation and raising quality of services
� more even physical planning of trade network and infrastructure
� improved qualifi cation structure of personnel
� rationalization of operations costs, increased quality and lower prices of services
� better development of electronic business
� minimalization of grey and black market
� introduction of new forms of sale
� development of private labels
� Obtain support of the county and the state in upgrading and improvement of legal framework, especially Trade Act, Consumer Protection Law, Law on market competition protection, adopting other regulations
� domestic trade should utilize its competitive advantages, in the fi rst place good knowledge of market, knowing customs and institutional conditions for doing business, use of attractive locations and existing network of retail shops, and links with domestic suppliers.
Literature
1. Segetlija Z., Lamza-Maronić M., Distributive system of a trade company - Distributon-Logistics- Information, Faculty of Economy, 1995
2. Segetlija Z., Lamza-Maronić M., International logistical systems, Contemporary trade, Zagreb,1994
3. Šamanović J., Logistcal and distributive systems, Split, 1999
4. V. Srb, B. Matić, B. Marković: Monetarne fi nancije (Monetary Finances), Faculty of Economy in Osijek, Osijek, 2003
5. Segetlija Z., Lamza-Maronić M., Trade Marketing, II. edition, Faculty of Economy in Osijek, Osijek, 2001
6. Trade Act, National Gazette
7. Campbell R. McConnell, Stanley L. Brue, Economics: Principle, Problems and Policies, Irwin McGraw-Hill, 2001.


Operations management


MANAGEMENT OF BUILDING PROJECTS 155
MANAGEMENT OF BUILDING PROJECTS
PhD. prof. Niko Majdand`i}Faculty of Mechanical Engineering
University of Josip Juraj Strossmayer in Osijek, Slavonski Brod
Tadija Lovri}Informatic engineering-ININ, Slavonski Brod
Mr.sc. Vido Peri}Vibrobeton d.d., Vinkovci
Summary
In this work we have shown the concept of logistic support in management in building production and in building of objects, which is realised in Enterprise resource Planning – ERP system ERPINSG, developed in Informatic fi rm Informatic engineering – ININ in Slavonski Brod, and in cooperation with scientists of catedra for informatics of Faculty of Mechanical Engineering and users from building fi rms.
Key words: manufacturing logistic, management, ERP systems, ERPINSG
IntroductionEuropean society for logistic defi nes logistic [1] like “organising, planing,
management and fl uctation of business, starting with development and procuration to production and distribution towards fi nal customers order for purchase, in that way that all conditions of market are satisfi ed with minimal costs”.
Informatization of company represents one of main development assignments with purpouse of achievement competition of product or service in price, delivery term and quality. Implementation of ERP system as highest level of business, technical and production integration, with informations and planing, and monitoring of the work, affects on rising of total technological and organization level of the company. In that way introduction of controlling is possible, as preparation function for successful work of company management. ERP systems are integrating in their work models of modern logistic support to production and dealings (SWOT analysis, methods of evaluation and trends in controlling, MRP, MRPII, JIT, SIGMA6, methods of planning and dating, methods of multi-criterion optimisation), allowing to management receiving of alternative for options in taking certain business action.
Beside trying for development of uviversal ERP systems [2] the practise has shown existing of certain demands and needs which follows from technology of work

Niko Majdand`i} • Tadija Lovri} • Vido Peri}156
in every company apropos confi guration of preparational, business and productional processes in every arm of industry.
There are two ways of development of ERP systems in manufacturing companies in different arms of industry:
• Projecting and development ERP systems in manufacturing companies in different arms of industry [3] so it exists (example with fi rm of Informatic engineering - ININ) ERPINSM for metal-working industry, ERPINSD for wood-working industry, ERPINSP for nutrition and process industry and ERPINSG for building manufacturing and construction of objects.
• Adaptation of fi nished universal ERP system to special demands in every arm of industry
Special demands which are posting in building industry and construction of objects are:
• Demands for making calculation towards prescription for fi nished products with addition of indirectly costs which are arranged by certain keys, and also dinamic elaboration of calculation during prepaire for projecting of objects and parts of object
• Needs for following of objects as the place of costs (direct and indirect) and as a carrier of costs and also organisation units whitch participate in realization of objects and costs by that organisation units
• Making plan of objects building with need of fi ne terminning of special critical capaticies, possibility of rebalance of the plan towards to present condition of realization and evaluation of expected costs and building deadlines.
1. Content of Erpinsg system
On the picture 1 there are shown subsystems of ERPINSG system whitch satisfi eds mentioned demands and needs of building industry.

MANAGEMENT OF BUILDING PROJECTS 157
(translation follows)
Integration and realised fl exibility by intergration of ERPINS system is contained in next:
� Intergration of all functions and businesses in company (business, engineering, technical and production) from making of calcullation, through preparement of realisation, planning and monitoring of works, control of normative and costs consumprion to making of situation and distribution of means by participants and monitoring of payment and transmission of object,
� Input of data in every function in business chain is made once and it is beeing integrated in all functions in needed moment,
� Integration of the construction site and sub-contractors with company who carries the building with monitoring of planned and realised results on construction of objects by all participants,
� Besides of integration of modules in subsystem, it is realised high integration between subsystems: during launching it is possible to check the stage and replacement materials, costs of working orders are transfered directly in accountancy, in defi ning of the price for product or services we take average or by method of FIFO with defi ned price of the material or price from possibilities of potential suppliers etc.
� In the same way it is also realised integration with construction sites, bank chains, buyers and suppliers; by using of their codes or bar-code, direct exchange of data and electronic documents is possible,
� Prototype of document making for input on the computer screen provides fast and fl exibile document making of material traffi c (by contest, shape and name), work orders and following documentation withouth need for extra programming.
� Possibility of calcullation and bill of quantities making by normative work and materials business or with direct input of normatives by businesses (activities) or by input of the price by work unit,
� Proper planning system of making of the projects and building of the objects with checking of main capacity avilability and with possibility of making of term plan of all other works by needs of main plan, and by Just In Time – JIT Japaneese productional philosophy,
� Making of various plans of building objects,� Possibility of plan and construction costs monitoring and also calcullation of
expectable dead lines and costs by current effi ciency of works according to plan,
� High level of business, technical and productional integration of data with collective overview for management needs,

Niko Majdand`i} • Tadija Lovri} • Vido Peri}158
� Subsystem of maintance whitch supports work of existing strategies of maintaining: preventive, collective and planed, monitoring of vehicle fl eet,
� Monitoring of employees presence, dispensation of tools and materials with hand terminals and bar code,
� Monitoring of work effi ciency on construction site by using of bar code or RF chips,
� Claim on certain modules whitch is controlled by password,� Usage of actual shapes of business comunicating (telebanking, Internet, SMS),� Managing of documentation (binary contents: memos, pictures, drawings...),� Integrated report of mistakes/new requests,� Relation data base ORACLE.
Picture 1 Subsystems and module of ERPINSG system
Containing following subsystems:

MANAGEMENT OF BUILDING PROJECTS 159
• Collective data base (BAza ZAjedničkih Podataka) – BAZAP (contains collective data : organisation structure and hierarchy, partners and contact persons data, employees data, lists of rates of exchange, collective working calendar or working calendar by construction sites, dictionary of data and collective clasifi cation codes, measure units)
• Sales and comercial (PROdaja i KomercijalA) – PROKA (contains data and programs for work of functions for sale, calculation and opening of work orders, and also provides: getting bill of quantities of object and servicesa, opening and following orders from customers, getting of the plan and effi ciency of work orders and dailiy assigments, making of yearly plan and following of it`s realisation, following of accomplishment by organization units, objects, construction sites and sub-contractors, following of tendered, contracted and retrospectived calculation as also incurred costs, automatic billing towards bill of lading or construction book.
• Normatives of work and material (NORMAtivi rada i materijala) – NORMA (contains basic data of standard works, normatives of works and normatives of materials by each business, operations by each business, possibiliy of withdraw of the price of the material from the material accounting, possibilities or conditions of suppliers or by direct input, the prescription of material by products and variations of prescription, technology of making of the products and work in process, technology for calculation)
• Aquisition and stock of matarial and extra parts (NAbava i ZALihe materijala i rezervnih dijelova) – NAZAL (contains data about stage of basic, accessory and spent material, state of work in process and products on the construction site, choice of optimal supplier, background for preforming of inventory process, possibility of organizing high regular stok and also enterance and exit of material and products by using RF terminal and marking with bar code)
• Launching of work orders (LANsiranje RAdnih naloga) – LANRA (contains possibility of interactive creating of work orders for starting of production, assemblage of production, services of maintaining and transport, businesses in sub-contracting, following of scheduled and realised costs by work orders, checking of needed material by prescription for scheduled quantities on work order, reserving of materials by work orders, possibility of using alternative materials, automatic making of production-technological documentation: technological maps, capitulations for deliverance of fi nished products and work in proces, deliverance for needs for materials towards prescription)
• Managing of building objects (UPRavljanje izgradnjom OBjekta) – UPROB (contains possibilities of making scale of charges on three levels: making of list of

Niko Majdand`i} • Tadija Lovri} • Vido Peri}160
activities without planning of activities, making of scale of charges by schedule of activities, making of scale of charges by term of schedule of all sub-contractors and by basic schedule, following of direction of scheduling, corrections in scale of charges, report of additional works and excess works by scale of charges)
• Monitroting of construction site (PRAćenje Gradilišta) – PRAG (gives the possibility of monitoring of changes on construction sites: time, employees, progress of the works, work of capacity, employees and mechanization, report of effi ciencyis made on the list of works or activity of schedule by direct input or by input a bar code, also by automatic created construction book and after that the situations for collection and bill are occurring)
• Insurance of quality (OSiguranje KValitetE) – OSKVE (contains data about deviation of quality, costs of bad quality, certifi cates of materials and products, complaints of customers, complaints of suppliers, results of trial and fi nishing tests, calibration of measuring devices and instruments)
• Maintaining of capacity and mechanization (ODržavanje KAPaciteta i mehanizacije) – ODKAP (gives the possibility of scheduling and monitoring of work for preventive and planned maintaining, monitoring of correctional maintaining, following of scheduled and realised costs of maintaining, accounting of reliability and availability of the equipment, fi nding of weak spots, defi ning of necessary spare parts)
• Accountancy information subsystem (Računovodstveni INformacijski podSustav) – RINIS (represents integrated support to accountancy and fi nance businesses in company with modules: Diary of accounting, main book, closing of item, internet banking, transfer and automatic accounting of exit bills – IFA, book of UFA, IFA with automatic printing of credit transfer, calculation of taxes, calculation of payments, long-term property, minute inventory, good-materially, accountancy with automatic transfer of currency from stock, cash desk, credit transfer, calculation of interest, working accountancy, automatic account of situation)
• Management and controling (MEnadžment i KONtroling) – MEKON (contains selected review and reports about stage of making business and production: balance sheet, plan of intake and outtake, stage of staff by structure, stage of stocks, total and reserved by work orders, cover of arranged businesses with material, panned and realised production, planned and spent hours of work, stage of realization by work orders, stage of arrears and debts for certain period, review of arranged and businesses in contracting, costs of deviation from quality, expences of maintaining, graphic display of doihg business and stage on stock.)

MANAGEMENT OF BUILDING PROJECTS 161
2. Managing of object building
Object building is conected with all the activities nu preparation, production and setting of objects on construction sites. The report of working time expense, capacity and mechanization is done in production drive and in construction sites. On picture 2 it is shown work schema of managing system in building of objects.
Picture 2 Schema of managing system in building of objects
Managing is beeing done in following steps:
• Preparation and input or choice from standard works of activities in building of new object
• Input of work and material normatives if there are no standard works• Making a bill of quantities and his corrections• Input basic data about objects and construction site• Making a plan of building of object, plan of sub-contractors, plan of mechanization,
plan of needed materials, plan of tools, ferries and equipment, showing plan with gantt chart, curve of progress, plan by all involved, plan for certain period of time
• Report of effi ciency (by bar code or input of percent of effi ciency, or effi ciency in measure unit by activities or directly from effi ciency in construction book)

Niko Majdand`i} • Tadija Lovri} • Vido Peri}162
• Automatic making of construction book, construction diary (by report of the work on object), situation collection, fi nal accounting and bills
• Monitoring of realization by quantities of the work and value (arranged-realised), billing and charging, and fi nal accounting with showing added and excess works
• Monitoring of realisation and costs (direct and indirect) of organization units which are involved in making of object
• Making of plan rebalance with prognosis of new deadlines and costs on realisation of theobject.
Making of plan and plan rebalance is managed with original program system by algorithm, which is developed on Faculty of Mechanical Engineering in Slavonski Brod [5].
On picture 3 it is shown the part of the plan by organization units.
Picture 3 Part of the plan on construction of the halls SF by departments

MANAGEMENT OF BUILDING PROJECTS 163
Special problem for monitoring of costs by objects and productional organisation units represents unsolved ways of indirect costs distribution.
3. Model of indirect costs distribution by objects
In most of the companies (by the research on project of MZOŠ 152001) we monitor and distribute only direct costs by objects and organisation units. In this costs are entering work costs (through calculations of salary and monitoring of the employees work and productional capacity by objects apropos in organisation units) and costs of material (through delivery note with average price from material accounting or by method of FIFO).
However, meaningfull costs remains excluded (costs of electric energy, gas, wather, costs of sub-contractor services) as also special indirect costs (costs of management, preparation, support and administrative activities etc.). Special part represents services between themselves (maintaining of equipment, transport) whitch represents internal realization for organisation units of support activities and cost for object and organisation units of the production.
In subsystem of management anf controlling of MEKON is developed in module of controlling a model of key construction for distribution of this indirect costs by organisation units and objects and in a module of management, model of reports and lists of incur direct and distributed indirect costs ba organisation units and objects.
On picture 4 it is shown an example for input of key for distribution of costs in module of controlling. Selection of keys and defi ning the part of the percent is matter of each company and as example of costs distribution of electric energy, we take installed strenght of work time waster in current month regarding on total installed energy, and costs of management are shared by the key of reached realisation and by the number of the employees in current month.

Niko Majdand`i} • Tadija Lovri} • Vido Peri}164
Picture 4 Defi ning of the keys for distribution of indirect costs
In purpuose of easier comparation, we made a groups for monitoring of costs whitch can be seen on picture 6.

MANAGEMENT OF BUILDING PROJECTS 165
Picture 5 The groups of costs for comparation
On picture 6 we have shown total results for chosen object. On accomplished direct costs, there are added and distributed indirect costs. In the same way we have shown calcullated (by component and prescription) and realised costs of material.
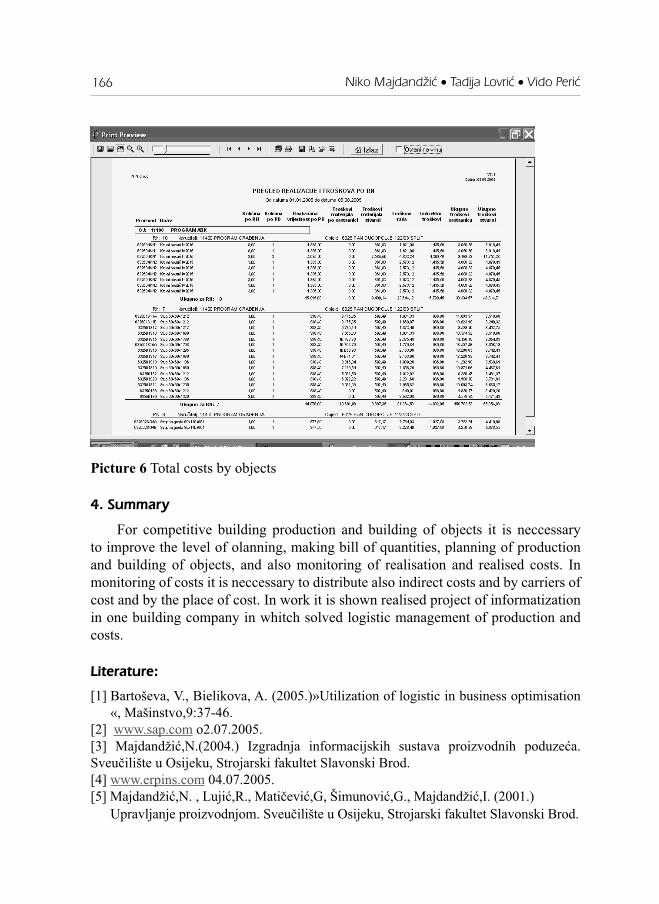
Niko Majdand`i} • Tadija Lovri} • Vido Peri}166
Picture 6 Total costs by objects
4. Summary
For competitive building production and building of objects it is neccessary to improve the level of olanning, making bill of quantities, planning of production and building of objects, and also monitoring of realisation and realised costs. In monitoring of costs it is neccessary to distribute also indirect costs and by carriers of cost and by the place of cost. In work it is shown realised project of informatization in one building company in whitch solved logistic management of production and costs.
Literature:
[1] Bartoševa, V., Bielikova, A. (2005.)»Utilization of logistic in business optimisation «, Mašinstvo,9:37-46.
[2] www.sap.com o2.07.2005.[3] Majdandžić,N.(2004.) Izgradnja informacijskih sustava proizvodnih poduzeća. Sveučilište u Osijeku, Strojarski fakultet Slavonski Brod.[4] www.erpins.com 04.07.2005.[5] Majdandžić,N. , Lujić,R., Matičević,G, Šimunović,G., Majdandžić,I. (2001.)
Upravljanje proizvodnjom. Sveučilište u Osijeku, Strojarski fakultet Slavonski Brod.

DER EINSATZ VON UNTERNEHMENSPLANSPIELEN IN DER CONTROLLER ... 167
DER EINSATZ VON UNTERNEHMENSPLANSPIELEN IN DER CONTROLLER-AUSBILDUNG
Prof. Dr. Bernd Britzelmaier, Dipl. Ing. Brigitte Eller MScHochschule Pforzheim
Lernen mit Planspielen
Die ersten Planspiele wurden bereits im 19. Jahrhundert von Generälen gespielt, die Strategien zur Bezwingung der gegnerischen Armeen im Spiel testeten und perfektionierten. Für diese ersten Planspiele wurde die Umwelt des Kriegsgeschehens modellhaft dargestellt (vgl. Capaul/Ulrich 2003). Für Unternehmensplanspiele (auf diese Art von Planspielen beschränken wir uns in den nachfolgenden Ausführungen) wird die reale Situation und das reale Geschehen in Unternehmen modelliert.
Wie Betriebswirtschaft „funktioniert“ und welchen Beitrag der Einzelne zum Unternehmenserfolg leisten kann, erarbeiten die Teilnehmer eines Planspiels (Unternehmenssimulation) interaktiv innerhalb der gegebenen Spielrealität. In der simulierten Handlungsumgebung treffen sie selbstständige unternehmerische Entscheidungen, erhalten den Erfolg unmittelbar rückgekoppelt und erleben hautnah unternehmerisches Denken und Handeln. Die angehenden Controller erkennen die Stellhebel für unternehmerischen Erfolg, begreifen z.B. die Zusammenhänge von Güterprozess und Geldprozess und erleben die Verantwortung für den eigenen Erfolgsbeitrag.
Als Trainingsteilnehmer erfahren künftige Controller den ausgewählten Teil der Unternehmenswirklichkeit sehr direkt, indem Sie sich aktiv an der Simulation dieser Wirklichkeit beteiligen. Entscheidend dabei ist, dass Sie in die simulierte „Realität“ eintauchen. In diesem Fall wird die Spielrealität Spuren bei den Teilnehmern hinterlassen. Im Spiel vertiefen sie sich in das stark vereinfachte Geschehen innerhalb eines Unternehmens und machen dabei individuelle und unmittelbare Erfahrungen. Diese Erfahrungen bilden die Grundlage für eine nachfolgende bewusste Refl exion allein oder in der Gruppe. Dadurch entstehen klarere Vorstellungen über das Abgelaufene und darüber, wie das System „Unternehmen“ funktioniert. Der Transfer der individuellen Erfahrungen in das eigene Wirkungsfeld ist vorbereitet, damit können die Erlebnisse zu Erkenntnissen werden.
Das Begreifen der Unternehmensprozesse z.B. von der Produktion bis zum Rechnungswesen ist gleichzeitig vergnüglich, unterhaltsam und spannend. Die

Bernd Britzelmaier • Brigitte Eller168
Teilnehmer werden in die Situation hineingezogen. Somit wird ein rascher Einstieg in die komplexen Zusammenhänge im Unternehmen vermittelt. Überlegungen verbinden sich mit Gefühlen und Handlungen. Spielhandlungen führen zu neuen Erfahrungen oder akzentuieren das bisherige Wissen der Controller.
Ob eine Ausbildungsmaßnahme erfolgreich ist, hängt nicht nur vom eigentlichen Lernen ab, sondern auch vom Lerntransfer, d.h. vom Ausmaß, in dem die Übertragung des Gelernten auf die praktischen Tätigkeiten am Arbeitsplatz gelingen kann.
PHASE 1Einführung(Briefing)
PHASE 2Spieldurchführung(Simulatiosphase)
PHASE 3Auswertung(Debriefing)
Abb. 1. Planspielphasen
Angelehnt an die drei Phasen von Planspielen (vgl. Abbildung 1, angelehnt an Capaul/Ulrich 2003) soll hier speziell die Bedeutung der dritten Phase für den Einsatz von Planspielen in Unternehmen hingewiesen werden. Mittels der „vier E´s“ (Petranek, 1992) sind folgende Aspekte wesentlich:
Emotions
Was haben Sie empfunden?Die Teilnehmer äußern spontan Freude, Frust, Ärger usw.
Events
Was ist abgelaufen?Die Teilnehmer betrachten das abgelaufene Spiel aus der Vogelperspektive und halten einzelne Beobachtungen fest.
Explications
Weshalb ist das so geschehen?Die Teilnehmer suchen Erklärungen und Begründungen für Ereignisse und Beobachtungen.
Every day life
Was können sie aus dem Spiel in die Realität mitnehmen?Die gewonnenen Erkenntnisse werden für die Realität nutzbar gemacht.
Anhand dieser Strukturierung in der wichtigen Phase des Debriefi ng können die Vorteile von Planspieleinsätzen im Lerntransfer innerhalb der Controller-Ausbildung aufgezeigt werden.

DER EINSATZ VON UNTERNEHMENSPLANSPIELEN IN DER CONTROLLER ... 169
Spezifika der Controller-Ausbildung
Bereits in den achtziger- und neunziger Jahren des vorigen Jahrhunderts wurden empirische Untersuchungen zu Controlleraufgaben und deren Wandel im Zeitablauf angestellt. Es gelang jedoch nicht, aus diesem Material ein allgemein-verbindliches Controllerprofi l abzuleiten (vgl. Horvath 2004). Die Ausprägung der fachlichen (inhaltlicher Natur ebenso wie theoretischer und methodischer Natur) und persönlichen Anforderungen an den Controller sind abhängig von den unterschiedlichen Ausprägungen der Controllership in den Betrieben. Ein Bereichscontroller in einem Zweigwerk muss andere Anforderungen erfüllen als ein Controller, der wesentlich im Bereich der Unternehmensentwicklung angesiedelt ist. Trotz aller Gegensätzlichkeiten lässt sich dennoch ein gemeinsamer Kern von Anforderungen festhalten:
Controller müssen, um ihre Aufgaben zu erfüllen, hoch qualifi zierte Führungskräfte sein, die im Anforderungsniveau Linienverantwortlichen prinzipiell nicht nachstehen. Wer in Führungsfragen nicht kompetent mitreden kann, wird von Führungskräften in der Führungsunterstützung nicht akzeptiert. Die Tatsache, Fehlentwicklungen vermeiden und richtige Wege unterstützen zu müssen, ohne dafür ein Weisungsrecht zu besitzen, also quasi „durch andere hindurch“ zu wirken, prädestinieren Controller für spätere direkte Führungsaufgaben (vgl. Weber 2004). Zugleich macht diese Konstellation Controllerstellen zu idealen Qualifi kationsstellen für Führungsnachwuchs.
Neben der Entdeckung und Platzierung von solchen (Nachwuchs-) Führungskräften geht es insbesondere auch um die Förderung dieser. Die Förderung beschränkt sich nicht nur auf die Vermittlung von Fachkenntnissen, sondern umfasst ebenso die Bereiche „Wissen“, „Denken“, „Wollen“ und „soziale Kompetenz“.
Im Bereich „Wissen“ wird die Vermittlung problemorientierter Controller-Kenntnisse subsumiert. „Denken“ steht für die Entwicklung von selbstständigem, verantwortungsbewusstem Denken, logisch-rationalem und systematischem Denken, kreativ-intuitivem Denken, vernetztem Denken aber auch für die Entwicklung von Argumentations- und Kritikfähigkeit (Sprech-Denken). Genauso wichtig wie „Wissen“ und „Denken“ ist das Wecken spezifi scher Grundhaltungen wie z.B. „Vision“, „Schwung“, „Leistungsfreude“ als Beweggründe für zielorientierte Steuerung (Motivation, Einstellungen). Die sozialen Fähigkeiten stehen gleichrangig neben den intellektuellen und motivationalen Fähigkeiten. Es geht darum, die Fähigkeit des situationsgerechten Führens zu entwickeln (vgl. Ulrich/Fluri 1995).
Inhaltlich umfasst die Controller-Ausbildung neben allgemeiner Betriebswirtschafslehre und anderen relevanten Gebieten (z.B. IT, quantitative Methoden, Präsentationstechnik, Kommunikation) vor allem die Kerngebiete

Bernd Britzelmaier • Brigitte Eller170
der Kostenrechnung sowie der Unternehmensplanung und –analyse. Fundierte Kenntnisse des externen Rechnungswesens, der Finanzierung und Investition sowie Aspekte des Leistungserstellungsprozesses sollten das Profi l abrunden.
Controlling-Ausbildungen können an Weiterbildungseinrichtungen oder an Hochschulen absolviert werden.
An der Controller-Akademie in München erfolgt die Controller-Ausbildung in 5 Stufen (vgl. CA Controller Akademie 2005):
• Stufe 1: Controller’s Grundseminar• Stufe 2: Controller’s Budgetseminar• Stufe 3: Berichtswesen und Kommunikations-Seminar• Stufe 4: Controller’s Planungs-Workshop• Stufe 5: Controller’s Präsentations- und Moderations-Workshop
Der gesamte Stoffkomplex in seiner Vernetzung (Rechnungswesen-System, Unternehmensplanung-Konzeption sowie Organisation der Führung durch Ziele) bildet unterstützt durch Fallstudien, welche Aufgabe und Rolle des Controllers unterstreichen, die Grundlage der Seminare. Ausgehend von dieser Grundlage wird der Stoff stufenweise vertieft und ergänzt. Diese Vertiefung erfolgt fachlich ebenso wie methodisch. Auch die psychologischen Aspekte der Controller-Arbeit (Kommunikation, Zusammenarbeit und Führungsverhalten) werden vertieft. Die fünf Seminarstufen sind so gestaltet, dass von Stufe 1 bis Stufe 5 die Themenvermittlung durch die Dozenten abnimmt, während das "Selbertun" des Teilnehmerkreises im Seminarstoff zunehmend Gewicht erhält. Auf diese Weise soll berufl iches Arbeiten und Seminarbegleitung vernäht sein.
An Hochschulen fi ndet die Controlling-Ausbildung vor allem im Rahmen einer Schwerpunktbildung innerhalb betriebswirtschaftlicher Studiengänge statt. Daneben existieren Angebote im Rahmen von Wirtschaftsingenieur-Studiengängen. Während in letzteren Aspekte des Projekt-, Produktions- und Produktmanagements eine stärkere Rolle spielen, wird in den betriebswirtschaftlichen Angeboten neben den Kerngebieten Kostenrechnung, Unternehmensplanung und –analyse auf externes Rechnunsgwesen, Investitionscontrolling, Finanzmanagement, Revision und steuerliche Aspekte fokussiert. Auf weiterführende Master-Studiengänge wie den Master of Arts in International Finance an der Hochschule Pforzheim soll im Rahmen dieses Beitrages nicht eingegangen werden.
So beinhaltet der Studiengang „Controlling, Finanz- und Rechnungswesen“ an der Hochschule Pforzheim neben allgemeinen betriebswirtschaftlichen, volkswirtschaftlichen und juristischen folgende Controlling-Inhalte:

DER EINSATZ VON UNTERNEHMENSPLANSPIELEN IN DER CONTROLLER ... 171
Wochenstunden im Semester
Fachgebiet (Lehrveranstaltung) 4. 5. 6. 7. 8.
Grundlagen des Controlling 4
2. praktisches Studiensemester
Einzelabschluss (HGB, IFRS) 4Gesellschaftsrecht 4Seminar I 2Steuerbilanzrecht 2Besteuerung der Gesellschaften 2Finanzmanagement 2Revision 2IT und Controlling 2IT-Anwendungen im Rechnungswesen 2Konzernabschluss (HGB, IFRS) 2Unternehmensplanung 2Investitionscontrolling 2
Wahlpfl ichtfach (1 wählbar)Kapitalmarktfi nanzierungUnternehmens- und FinanzanalyseStrategisches Controlling 2Seminar II 2Projektarbeit / Fallstudien 4Begleitende Blockveranstaltung 2
Summe der Wochenstunden je Semester 4 14 14 2 12
Abb. 2. Controlling-Inhalte im Studiengang „Controlling, Finanz- und Rechnungswesen“ an der Hochschule Pforzheim
Vernetzte Vermittlung von Controlling- und Rechnungswesen inhalten
In der betriebswirtschaftlichen Ausbildung werden Inhalte zu Themengebieten wie Externes Rechnungswesen, Investition, Finanzierung und Internes Rechnungswesen gerne isoliert vermittelt. Diese isolierte Vermittlung fi ndet meist (noch) in Form von Frontalunterricht statt. Darstellungen der Zusammenhänge zwischen den einzelnen Rechenwerke z.B. zwischen Bilanz, Erfolgsrechnung und Geldfl ussrechnung oder zwischen den operativen Teilplänen und Teilrechnungen innerhalb der Budgetierung wie sie die Abbildungen 2 und 3 (in Anlehnung an Leimgruber/Prochinig 2002 und Horvath 2004) zeigen, erfolgen ansatzweise aber meist nicht umfassend. Die Methode des Frontalunterrichts in der Ausbildung von Controllern

Bernd Britzelmaier • Brigitte Eller172
vermag das Begreifen dieser zentralen Zusammenhänge durch die Studierenden jedoch nur unzureichend zu unterstützen. In der berufl ichen Praxis wird jedoch von einer Controlling-Fachkraft erwartet, dass sie im Rahmen der Planung und Analyse den Leistungserstellungsprozess integriert in den verschiedenen Instrumenten des Finanz- und Rechnungswesens mengen- und wertmäßig abbilden kann.
Eröffnungsbilanz
Eigenkapital
Ausgaben
Einnahmen
Geldflussrechnung
Zunahmeliquide Mittel
Aufwand
Ertrag
Erfolgsrechnung
ZunahmeEigenkapital(Gewinn)
liquide Mittel
Schlussbilanz
Eigenkapital
liquide Mittel
Zunahmeliquide Mittel
ZunahmeEigenkapital(Gewinn)
Abb. 3. Zusammenhänge wichtiger Rechenwerke

DER EINSATZ VON UNTERNEHMENSPLANSPIELEN IN DER CONTROLLER ... 173
Investitions-budget
Budget derFinanzmittel
BudgetierteBilanz
Plan-Veränderungendes working capital
Dividendenplan
Kalk. d. Standard-Herstllkosten
mengen- undwertmässige
Absatzplanung Produktions-planung
Standardherstell-kosten derFertigung
Materialkosten
Beschaffungsbudget
Forschungs- undEntwicklungs-
budget
Verwaltungs- undVertriebsbudget
BudgetierteErfolgsrechnung
Budgetierte Gewinn-und Verlustrechnung
Plan-Abstimmbrücke
Abb. 4. Teilpläne und Teilrechnungen im Rahmen der Budgetierung
Durch den Einsatz von gut auf- und vorbereiteten Fallstudien als partizipativ orientiertes Lehr- und Lern-Arrangement in Ergänzung zu herkömmlichen Vorlesungen kann hier eine Verbesserung insofern erreicht werden, als neben fachlichen Lernzielen auch überfachliche Lernziele erreicht werden können (z.B. Analysefähigkeit, Diskussionsfähigkeit und Argumentationsfähigkeit). Fallstudien erlauben die Einübung, Entwicklung und sukzessive Aneignung von verschiedenen Fähigkeiten. Die Bearbeitung von eingesetzten Fallstudien ist in der Regel themenspezifi sch und erfolgt ergänzend zu herkömmlichen Vorlesungen (z.B. Make or Buy Entscheidungen, Investitionsentscheidungen, Target Costing). Eine ganzheitliche Integration von Themengebieten wie Externes Rechnungswesen, Investition, Finanzierung und Internes Rechnungswesen innerhalb einer Fallstudie kann innerhalb deren Bearbeitung im besten Fall ansatzweise erfolgen.

Bernd Britzelmaier • Brigitte Eller174
Planspiele als Integrationsmedium
Wesentlich für die Ausbildung von Controllern ist neben Verhandlungskompetenz, Fachwissen, Kommunikationsfähigkeiten vor allem das Verstehen der Mechanismen im Unternehmen. Darstellungen wie in Abbildung 4 verdeutlichen die Zusammenhänge innerhalb eines Unternehmens und stellen gleichzeitig dar, wie z.B. die Integration von Geld- und Güterprozess im Unternehmen aussieht. Mit derartigen partiellen Darstellungen werden u.a. auch die Zusammenhänge innerhalb von Planspielen visualisiert. Die Darstellungen allein vermögen allerdings nicht, die Integration für den angehenden Controller spürbar werden zu lassen.
Unternehmen
BeschaffungProduktion /Leistungs-erstellung
Roh-material-
lager
Fertig-waren-lager
Absatz
VerwaltungGüter
Kosten-arten
Kosten-stellen
Kosten-träger
Kosten-rechnung
Finanz-buch-haltung
Gesamtkostenverfahren Umsatz
+/-Bestandsveränderungen Fertigwaren- Gesamtkosten der PeriodeJahresgewinn/ -verlust
Kostenartenrechnung
Unterteilung in Einzel- undGemeinkosten
Kostenstellenrechnung
Aufteilung derGemeinkosten
Kostenträgerrechnung
Ermittlung der Herstell-kosten
BewertungRohmateriallagerBerechnung desMaterialverbrauchs
AbschreibungenBerechnung derAbschreibungen
BewertungFertigwarenlager
Umsatzkostenverfahren Umsatz
- Herstellkosten der verkauftenProdukte (Fertigwaren)- übrige Gemeinkosten des UmsatzesJahresgewinn/ -verlust
Aufwände
Gewinn- und Verlustrechnung
Jahresgewinn
Erträge
Erfolg
Gemeinkosten Fixe/variable Kosten
Einzelkosten
Input Output
Anlage-vermögen
Aktiva PassivaBilanz
Eigenkapital(Reinvermögen)
Umlauf-vermögenKasseForderungenVorräte
Fremdkapital(Schulden)
Finanzmittel
Abb. 5. Integration von Güter- und Geldprozess

DER EINSATZ VON UNTERNEHMENSPLANSPIELEN IN DER CONTROLLER ... 175
Eine Steigerung der Verdeutlichung dieser Integration und das „Begreifen„ der Zusammenhänge des Unternehmensgeschehens - auch in Wechselwirkung mit simulierten Absatzmärkten - wird durch Unternehmensplanspiele (auch Unternehmenssimulationen genannt) so zu sagen „Live“ ermöglicht. Ergänzt durch das wahrnehmen und erleben gruppendynamischer Prozesse sowie Unterstützt durch ergänzende Methoden innerhalb des Lerntransferns wird es den Controllern mit dem Einsatz von Unternehmensplanspielen bereits in ihrer Ausbildung ermöglicht, zusätzliches Know-how und wertvolle Erfahrung zu gewinnen, welche ihnen für den Berufsalltag einen entsprechenden Vorsprung verschafft.
Ablauf von Planspiel und Workshops
Für den Einsatz eines Planspiels (hier TopSim General Management II) zur Unterstützung der Controlling-Ausbildung kann z. B. der folgende Seminarablauf eingesetzt werden. Die festgelegten Zeitraster stellen eine Empfehlung dar, sie können abhängig von den Vorkenntnissen der Teilnehmer und vom Technologieeinsatz variiert werden.
1. Tag 2. Tag 3. Tag 4. Tag
09:00 –
11:00
Einführung in das SeminarSchwerpunkt:Integrierte Unternehmens-planung
Workshop zum Thema „Strategisches Kosten-management“
Auswertung Periode 4Entscheidungen Periode 5
Workshop „Unternehmens-bewertung“
11:00 - 13:00
Organisation der GruppenarbeitFestlegung der jeweiligen Unternehmens-strategie und der strategischen Ziele für 8 Perioden
Auswertung Periode 3Entscheidungen Periode 4
Gruppenprojekt „Bilanzpresse-konferenz“
Auswertung Periode 8Vorbereitung der Hauptversammlung
13:00 –
14:00Mittagspause
14:00 –
16:00
EntscheidungenPeriode 1
Gruppenprojekt: Entwicklung Marketing-Konzept
Auswertung Periode 5Entscheidungen Periode 6
Durchführung der Hauptversammlung

Bernd Britzelmaier • Brigitte Eller176
16:00 –
18:00
Auswertung Periode 1Entscheidungen Periode 2
Auswertung Periode 4Entscheidungen Periode 5
Workshop „Finanz-management“
18:00 –
20:00
Workshop Wertorientierte Unterneh-mensführung
Workshop „Umstellung von HGB auf US-GAAP“
Auswertung Periode 6Entscheidungen Periode 7
20:00 –
21:00Abendessen
21:00 – 23:00
Auswertung Periode 2
Entscheidungen Periode 3
Workshop „Investition-
sentscheidungen unter
Unsicherheit“
Auswertung Periode 7
Entscheidungen Periode 8
Abb. 6. Seminarablauf
Das Unternehmensplanspiel General Management II bietet die Möglichkeit, neben deutschsprachigen Veranstaltungen auch englischsprachige Seminare durchzuführen. Ebenfalls kann im externen Rechnungswesen zwischen HGB und (rudimentärem) US-GAAP ausgewählt werden; IFRS wird leider derzeit noch nicht unterstützt. Diese Möglichkeiten lassen es zu, z.B. nach der 5. Periode alle Unternehmen von einem amerikanischen Investor aufkaufen zu lassen und damit zur englischen Sprache zu zur Bilanzierung nach US-GAAP zu wechseln. Die Erfahrung zeigt, dass mehrtägige Seminare einen größeren Nutzen stiften als das allwöchentliche Spielen über ein ganzes Semester. Zu bevorzugen ist dabei die Unterbringung an einem von der Hochschule möglichst weit entfernten Ort, damit die gruppendynamischen Prozesse voll zu Entfaltung gelangen können.
AusblickDurch den Einsatz von (rechnungswesenlastigen) Planspielen kann die
Controller-Ausbildung sinnvoll ergänzt werden. Zu den Aspekten der einzelnen Ausbildungsfächer tritt erlebnisorientiert deren Integration. Die Integration von Planspielen in Curricula ist daher tendenziell steigend.
Die mangelnde Anpassbarkeit von Planspielen an spezifi sche betriebliche Gegebenheiten soll nicht unerwähnt bleiben, ist jedoch für Basisausbildungen von geringerer Relevanz.
Leider ist den Autoren kein Planspiel bekannt, das neben einer ausgeprägten Finanz- und Rechnungswesen-Orientierung mehrere Rechnungslegungsstandards

DER EINSATZ VON UNTERNEHMENSPLANSPIELEN IN DER CONTROLLER ... 177
(HGB, IFRS und US-GAAP) sowie in hinreichender Komplexität Aspekte der Produktionsplanung (Stücklisten, Arbeitspläne usw.) integriert. Der zusätzliche Nutzen daraus wäre, dass Zusammenhänge, wie sie beispielsweise auch in ERP-Sytemen implementiert sind, für Controller und auch für Verantwortliche aus anderen Bereichen schneller begreifbar werden.
Literatur
Britzelmaier, Bernd, Dittrich, Klaus, Macha, Roman: Starthilfe Finanz- und Rechnungswesen, Stuttgart/Leipzig 2003
Britzelmaier, Bernd: Starthilfe Finanzierung, Leipzig 2005.
Capaul, Roman, Ulrich, Markus: Planspiele; Simulationsspiele für Unterricht und Training. Tobler Verlag AG, Altstätten, 2003
CA Controller Akademie: 5-Stufen-Programm, In: http://www.controllerakademie.de/ca_aktuell/ca_aktuell.html (2005)
Horvath Peter: Controlling, 10. Aufl age, Verlag Vahlen, 2004
Leimgruber, Jürg, Prochinig, Urs: Das Rechnungswesen als Führungsinstrument. 3. Aufl age, Verlag SKV, Zürich, 2002
Ulrich, Peter, Fluri, Edgar: Management. 7. verb. Aufl age, Verlag Paul Haupt, Bern et al., 1995
Petranek Ch.: Three levels of learning in simulations: Participating, debriefi ng and journal writing. Simulation and Gaming: An International Journal, 23 (2), 174-185, 1992
Weber Jürgen: Einführung in das Controlling. 10. Aufl age, Schäffer-Poeschel, Stuttgart, 2004

Juri{i}, M. • Kanisek, J. • Barkovi}, D178
TECHNOLOGISCHE UND TECHNISCHE FAKTOREN UND WIRTSCHAFTLICHE RESULTATE BEI DER
GURKENPRODUKTION
Mladen Juri{i}, Jozo KanisekLandwirtschaftliche Fakultät Osijek
Dra`en Barkovi}Wirtschaftsfakultät in Osijek
Zusammenfassung
Für die Produktion von Gurken, die für die Verarbeitung vorgesehen sind, bestehen in Kroatien ideale Voraussetzungen und ein gesicherter Markt. Gleichfalls sind Gurken eine Kultur, für die auch auf ausländischen Märkten großes Interesse besteht. Die Produktion ist arbeitsintensiv und sehr einträglich, sodass sie als solche sehr interessant für Familienbetriebe ist, die relativ geringe Ackerfl ächen bearbeiten.
In dieser Arbeit wird die Organisation der Gurkenproduktion auf einer Fläche von einem Hektar untersucht, in die anhand von berechneten Normen und einer erstellten technologischen Karte 49 Stunden Maschinenarbeit und 534 Stunden menschlicher Arbeit investiert wurden. Die Gesamtkosten belaufen sich auf 23.934,20 Kn, bei einem Ertrag von 20.700 kg und einem erzielten Wert von 39.675,00 Kn. Der Gewinn beträgt daher 15.742,00 Kn, was für einen Familienbetrieb ziemlich zufrieden stellend ist. Der größte Kostenanteil entfällt auf die menschliche Arbeit und auf die Polyethylenfolie, was über 50 % der Kosten ausmacht. Durch Berechnung der wirtschaftlichen Indikatoren wurde festgestellt, dass der Koeffi zient der Wirtschaftlichkeit einen Wert von 1,65 besitzt, was zur Schlussfolgerung verleitet, dass die Produktion wirtschaftlich ist.
Bei der Aussaat der Gurken werden 1,5 Kilo Samen/ha verbraucht, was bedeutet, dass man für deren Anschaffung 1.170,00 Kn aufwenden muss. Für Mineraldünger, organischen Dünger und Blattdünger wurden 2.869,00 Kn/ha und 770,00 Kn/ha für Pfl anzenschutzmittel benötigt. Die Ausgaben für die Polyethylenfolie betrugen 4.900 Kn/ha. Mittelschwere Traktoren wurden 21,66 Stunden und leichte Traktoren 31,34 Stunden in Anspruch genommen, wobei die gesamten Arbeitskosten für die Traktoren 5.491,20 Kn betragen. Die Saat, das Auslegen der Folie und die Ernte wurden manuell verrichtet, sodass deswegen 534 Stunden pro Hektar aufgewendet

TECHNOLOGISCHE UND TECHNISCHE FAKTOREN UND WIRTSCHAFTLICHE ... 179
wurden; bei einem Preis von 15,50 Kn/h entstanden so Kosten in einer Höhe von 8.277,00 Kn/ha. Der erwirtschaftete Ertrag beträgt 20.700 kg/ha, wovon 15 % Gurken der Klasse I, 45 % Gurken der Klasse II und 35 % Gurken der Klasse III sind.
Gurken gehören zu einer Kultur, die Ende Mai gesät wird und schon nach 50 Tagen Gewinn bringt. Auch die Anwesenheit von Verarbeitungsanlagen weist auf eine gesteigerte und intensivere Gurkenproduktion hin, die den wissenschaftlichen und fachmännischen Erkenntnissen und Erfahrungen Rechnung trägt.
Schlüsselwörter: Gewinn, Gurken, Technik, Technologie, Kosten
Einführung
Gurken gehören zur Familie der Kürbisse (Cucurbitaceae) und stellen eine Hortikultur dar, die wegen der jungen Früchte, in denen sich die Samen im Anfangsstadium der Entwicklung befi nden, kultiviert wird. Für die Produktion von Gurken, die für die Verarbeitung vorgesehen sind, bestehen in Kroatien ideale Voraussetzungen und ein gesicherter Markt. Gleichfalls sind Gurken eine Kultur, für die auch auf ausländischen Märkten großes Interesse besteht. Die Produktion ist arbeitsintensiv und sehr einträglich, sodass sie als solche sehr interessant für Familienbetriebe ist, die relativ geringe Ackerfl ächen bearbeiten und vor allem in den Sommermonaten Juli und August ausreichende Arbeitskräfte zur Verfügung haben, wenn die Ernte herangereift ist, die ordentlich und gründlich jeden oder jeden zweiten Tag organisiert werden muss. Damit erzielt man neben einem größeren Ertrag auch eine höhere Klasse und somit eine größere Profi tabilität der Produktion, bzw. einen bedeutenden Zusatzerwerb für die Familienbetriebe.
Die Marktorganisation ist ebenfalls eine außerordentlich wichtige Voraussetzung für den Erfolg bei der Gurkenproduktion. Da Gurken im Frischzustand einen hohen Wasseranteil besitzen und als solche nicht für Lagerhaltung und längerfristige Aufbewahrung geeignet sind, ist es vorteilhaft, die Gurkenproduktion mit einem der Produktionsorganisatoren zu vereinbaren, der die Ernte kontinuierlich abkauft, den Erzeuger mit dem benötigten Produktionsmaterial versorgt und an der Durchführung der technologischen Maßnahmen teilnimmt, wie z.B. die Vorbereitung des Bodens, das Auslegen der Folien oder die Aussaat, und der im Produktionsverlauf Ratschläge geben und die Kontrolle sichern kann.
Einen großen Anteil der globalen Produktion machen Gurken für die Weiterverarbeitung aus. In Kroatien werden sie auf etwa 3.300 Hektar angebaut. Der überwiegende Anteil besteht aus Gurken, die in Gärten angebaut werden und für den Verzehr im frischen Zustand oder als Wintervorräte vorgesehen sind. Über 80 % der insgesamt erzeugten Gurken, die überwiegend in einheimischen Fabriken verarbeitet wurden, wurden nach Österreich, Deutschland und in andere Länder ausgeführt.

Juri{i}, M. • Kanisek, J. • Barkovi}, D180
Im Jahr 1996 war die Gurkenproduktion, die für die Weiterverarbeitung vorgesehen war, auf 400 Hektar organisiert. Auf dieser Fläche wurden insgesamt etwa 7.800 Tonnen erzeugt und ein Ertrag von etwa 20 t/ha erzielt. Die Produktion wurde auf etwa 4.300 Familienbetrieben organisiert, die im Durchschnitt über jeweils 900 Quadratmeter Anbaufl äche verfügten.
Arbeitsorganisation bei der Gurkenproduktion
Die Organisation der grundlegenden Verarbeitung, die Vorbereitung der Aussaat und die Aussaat
Auf Familienbetrieben werden Gurken zumeist auf jenen Flächen angebaut, die dem Betrieb am nahesten liegen, sodass man sie auf den besagten Flächen sehr häufi g antrifft. Dies ist nicht wünschenswert, denn Gurken dürfen für mindestens vier Jahre nicht auf derselben Fläche angebaut werden.
Gute Vorkulturen für Gurken sind jene Kulturen, die den Boden früh verlassen. Wenn die Ernte der Vorkultur beendet ist (die Stoppeln von Getreide, Erbsen, Paprika), wird eine fl ache Bearbeitung des Stoppelfelds in einer Tiefe von 8-12 Zentimeter vorgenommen. Dies tut man mithilfe einer Scheibenegge mit einer Arbeitstiefe von 3,1 cm, einer Masse von 1200 Kg, und einem Scheibendurchschnitt von 560 cm.
Die Wirksamkeit der Scheibenegge wird so berechnet, dass man bei einer Arbeitsgeschwindigkeit von 8,5 km/h, einer Instandhaltungszeit von 15 Minuten und einer Geschwindigkeit von 12 km/h vom Betriebshof zur Parzelle hin und zurück ausgeht.
Da Gurken vorteilhaft auf die Düngung mit organischen Düngern reagieren, wird die Düngung mit reifem Stallmist vorgenommen. Dies tut man Ende August oder Anfang September in einer Menge von 30-40 t/ha.
Im Oktober wird der Stallmist auf eine Tiefe von 30-35 Zentimeter überackert. Das Pfl ügen wird mit einem Doppelpfl ug mit einer Arbeitsbreite von 0,7 m durchgeführt. Die Wirksamkeitsnorm wird für eine Arbeitsgeschwindigkeit von 5 km/h, einer Instandhaltungszeit von 15 Minuten und einer Geschwindigkeit des Aggregats von 12 km/h vom Hof zur Parzelle und zurück berechnet.
Das Schließen der Winterscholle wird mit einer Scheibenegge durchgeführt, sobald die Oberfl ächenschicht ausreichend getrocknet ist. Die Wirksamkeit wird für eine Arbeitsgeschwindigkeit von 7-8 km/h, einer Instandhaltungszeit von 15 Minuten und einer Geschwindigkeit von 12 km/h vom Hof zur Parzelle und zurück berechnet. Der zweite Durchlauf erfolgt mit dem Ziel, den Mineraldünger mit der Erde zu vermengen und den Boden gründlich für die Aussaat vorzubereiten.

TECHNOLOGISCHE UND TECHNISCHE FAKTOREN UND WIRTSCHAFTLICHE ... 181
Um das erst sprießende Unkraut zu vernichten und den Boden so gründlich wie möglich zu zerkrümeln, wird Ende März das Eggen vorgenommen. Die Wirksamkeitsnorm für die Egge wird anhand folgender Daten berechnet: Arbeitsgeschwindigkeit 8,5 km/h, Instandhaltungszeit 15 Minuten und Fahrtgeschwindigkeit von 12 km/h.
Tabelle 1. Projekt für die Normung für die Bearbeitung des Stoppelfelds mit der Scheibenegge und das Pfl ügen
Länge der Parzelle
Scheibenegge Entfernung von der Parzelle (m)
Pfl ugEntfernung von der Parzelle (m)
1.000 2.000 3.000 1.000 2.000 3.000200 9,7 9,4 9,1 1,7 1,7 1,6300 11 10,7 10,4 1,9 1,8 1,7400 11,8 11,5 11,1 2,0 1,9 1,8
Tabelle 2. Projekt der Wirksamkeitsnormen für das Schließen der Winterscholle mit der Scheibenegge, der zweite Durchlauf mit der Scheibenegge und Vorbereitung des Bodens für die Aussaat mit der Egge
Länge der Parzelle
(m)
Scheibenegge (erster Durchlauf)
Entfernung von der Parzelle (m)
Scheibenegge (zweiter Durchlauf)Entfernung von der
Parzelle (m)
Egge Entfernung von der
Parzelle (m)
1.000 2.000 3.000 1.000 2.000 3.000 1.000 2.000 3.000200 5,6 5,4 5,2 7,0 6,7 6,5 6,8 6,5 6,3300 6,1 5,9 5,7 7,6 7,4 7,1 7,4 7,2 6,9400 6,4 6,1 5,8 8,0 7,6 7,2 7,8 7,4 7,8Die Aussaat wird am Anfang der zweiten Dekade im Mai vorgenommen, denn da
besteht keine Gefahr mehr vor späten Frühlingsfrösten. Unmittelbar vor der Aussaat wird eine schwarze Polyethylenfolie mit einer Stärke von 0,04 mm und einer Breite von 120 cm ausgelegt.
Bei der Aussaat werden in der Mitte der Folie mit der scharfen Spitze eines Metallrohres mit einem Durchmesser von 5 cm Löcher im Abstand von 30 cm gestanzt, und in jedes dieser Löcher werden 3-4 Samenkörner hineingelegt und mit einer Erdschicht von 2 cm bedeckt. Für die Saat eines Hektars braucht man 1,5-1,8 kg Samenkörner. Bei der Saat wurde Samen der Sorte Cornichon verwendet.

Juri{i}, M. • Kanisek, J. • Barkovi}, D182
Die Organisation der Düngung und Maßnahmen zur Pflege der Gurken
Bei der Kultivierung auf schwarzer Polyethylenfolie muss die gesamte Düngung vor dem Verlegen der Folie vorgenommen werden. Zu diesem Zweck wird Mineraldünger der Formulation NPK 7-14-21 in einer Menge von 350-500 kg/ha verwendet.
Die Wirksamkeit des Zerstreuers für Mineraldünger mit einer Arbeitsbreite von 10 m wurde für eine Geschwindigkeit von 8 km/h, einer Instandhaltungszeit von 20 Minuten und einer Fahrtgeschwindigkeit von 12 km/h zur Parzelle und zurück berechnet.
Der Schutz vor Unkraut wurde nur in den Reihen zwischen den Folien mit den Herbiziden Sencor oder Reglone in einer Dosis von 1,5-2 l/ha vorgenommen. Die Schutzmaßnahmen werden manuell durchgeführt, indem man mit einem Zerstäuber die Reihen zwischen den Folien behandelt. Da es sich um Kontaktherbizide handelt, die über das Blattwerk eindringen, muss man vorsichtig sein, damit das Mittel bei der Behandlung nicht mit den grünen Pfl anzenteilen in Berührung kommt.
Die Schutzmaßnahmen gegen Getreiderost wurden sofort in der ersten Phase mit dem Fungizid Dithane (von 5.6 bis 10.6), als die ersten Blätter sprossen, vorgenommen. Die nächste Behandlung erfolgte bei drei-vier Blättern mit dem Mittel Ridomil 2,5 kg/ha, das eine verkürzte Karenz (von 20.6 bis 1.7) besitzt. Die Schädlingsbehandlung wurde gleichzeitig mit der Behandlung gegen Krankheiten mit dem Mittel Dotan 0,4 kg/ha vorgenommen.
In den Zeitabständen zwischen den Anwendungen der Pfl anzenschutzmittel wurde eine Zusatznahrung in Form des fl üssigen Blattdüngers Folifertil-T in einer Menge von 3 l/ha vorgenommen. Ein Liter Folifertil enthält 120 g N, 40 g P2O5 und 60 g K2O. Die Zusatznahrung und der Schutz vor Schädlingen und Krankheiten wurden mit einem Zerstäuber mit der Arbeitsbreite 9,2 m, einer Arbeitsgeschwindigkeit von 8 km/h und einer Instandhaltungszeit von 30 Minuten durchgeführt. Die Fahrgeschwindigkeit vom Betriebshof zur Parzelle beträgt 8 km/h, und bei der Rückfahrt 12 km/h.

TECHNOLOGISCHE UND TECHNISCHE FAKTOREN UND WIRTSCHAFTLICHE ... 183
Tabelle 3. Projekt der Wirksamkeitsnormen für das Zerstreuen des Mineraldüngers, des chemischen Schutzes der Aussaat und die Blattdüngung
Länge der Parzelle
Zerstreuer Entfernung von der Parzelle (m)
ZerstäuberEntfernung von der Parzelle (m)
1.000 2.000 3.000 1.000 2.000 3.000200 9,7 9,3 9,0 4,1 4,0 3,9300 10,5 10,2 9,8 4,4 4,7 4,2400 11,0 10,5 9,9 4,7 4,5 4,3
Organisation der Gurkenernte
Die Gurkenernte beginnt Anfang Juli und dauert bis zum Ende der Vegetationsphase 30-40 Tage. Die Früchte reifen und altern rasch, sodass ein alltägliches Ernten notwendig ist. Die Ernte wird manuell durchgeführt. Für die Ernte sind 420 Stunden menschlicher Arbeit je Hektar notwendig.
Kosten und Ergebnisse der Gurkenproduktion
Die gesamten Produktionskosten, der Wert der Erzeugnisse und der eventuelle Gewinn oder Verlust können anhand der Daten über die Arbeitskosten der Maschinen und des Materials sowie des Niveaus der verwirklichten Erträge errechnet werden. In der Tabelle sind die Kostenanalyse, die Summe der Gesamtkosten und der Produktionswert dargestellt.
Bei der Aussaat der Gurken werden 1,5 kg Saatgut pro Hektar verbraucht, sodass für ihre Anschaffung 1.170,00 Kn/ha ausgegeben werden müssen. Für Mineraldünger, organischen Dünger und Blattdünger wurden 2.869,00 Kn/ha und für Pfl anzenschutzmittel 770,00Kn/ha ausgegeben. Die Kosten der Polyethylenfolie betragen 4.900,00 Kn/ha.
Der nächste wichtige Posten ist die Arbeit der Maschinen. Die mittleren Traktoren werden 21,66 und die leichten 31,34 Stunden benutzt, sodass die Gesamtkosten für die Arbeit der Traktoren 5.491,00 Kn betragen.
Die Aussaat, das Auslegen der Folie und die Ernte werden manuell ausgeführt. Es wurden 534 Stunden per Hektar zum Preis von 15,50 Kn/h aufgewendet; so erhält man Kosten in einer Höhe von 8.277,00 Kn/ha.
Die Gesamtkosten der Gurkenproduktion betragen 23.932,20 Kn/ha. Der erzielte Ertrag auf einem Hektar Saatfl äche beträgt 20.700,00 kg, wovon 15 % Gurken der Klasse I, 45 % der Klasse II und 35 % Gurken der Klasse III sind. Der Gesamtwert der Produktion beträgt 39.675,00 Kuna. Die Differenz zwischen dem Wert der Produktion und den Gesamtkosten stellt einen Gewinn von 15.742,00 Kn dar.

Juri{i}, M. • Kanisek, J. • Barkovi}, D184
Tabelle 12. Kosten und Ergebnisse der Gurkenproduktion pro Hektar
Nr. Posten Maß-einheit Menge Preis in
Kuna Betrag in Kuna
1.2.
3.4.5.
6.7.8.9.
10.11.12.13.14.15.
SamenPolyethylenfolieMineraldüngerNPK 7:14:21Folifertil-TStallmistSchädlingsbekämpfungsmittel RegloneDithaneRidomilDotanArbeitsmittelLeichte TraktorenMittelschwere TraktorenMenschliche ArbeitWasserkostenAntransport der DüngerAllgemeine Kosten
kgkg
kglt
llkgl
hhh---
1,5350
400645
1,52,52,53,5
31,3421,66524---
780,0014,00
1,8965,0038,31
95,0084,00117,0036,00
75,00145,0015,50---
1.170,004.900,00
756,00390,001.723,95
142,50210,00292,50126,00
2.350,003.140,708.277,0080,0075,00300,00
Gesamtkosten 23.932,20
Wert der ProduktionKlasse IKlasse IIKlasse III
kgkgkgkg
3.45010.3506.90020.700
3,502,001,00-
12.075,0020.700,006.900,0039.675,00
Gewinn 15.742,80
Wirtschaftsindikatoren für den Produktionserfolg
Der wirtschaftliche Erfolg der Produktion wird meistens so analysiert, dass man die Produktivität der menschlichen Arbeit, die Wirtschaftlichkeit der Produktion und die Rentabilität der Produktion berechnet.
Die Produktivität der Arbeit stellt das Verhältnis der verwendeten Arbeitsstunden pro Flächeneinheit dar

TECHNOLOGISCHE UND TECHNISCHE FAKTOREN UND WIRTSCHAFTLICHE ... 185
Q (Ertrag) 20.700,00 kg/haP = -------------------- = ------------------------------- = 38,76 kg/ha T (Stunden/ha) 534 Stunden/ha
oder umgekehrt
T (Stunden menschl. Arbeit) 534 Stunden/haP = ------------------------------------ = --------------------------- = 25 Stunden/ha Q (Ertrag) 20.7 t/ha
Die Wirtschaftlichkeit der Produktion wird anhand der Grundelemente der Abrechnungskalkulation berechnet. Sie enthält die Menge und den Preis der verwendeten Materialien, Dienstleistungen und andere Kosten, sodass man die Wirtschaftlichkeit der folgenden Formel zufolge berechnen kann:
Wert der Produktion Kn/ha 39.675,00 Kn/haE = -------------------------------------- = ------------------------------- = 1,65 Gesamtkosten Kn/ha 23.932,20 Kn/ha
Die Rentabilität der Produktion wird mit dem Rentabilitätssatz in Prozent ausgedrückt. Berechnet wird er anhand des Verhältnisses zwischen dem Gewinn und den Gesamtkosten. Die Rentabilität der Produktion stellt dar, wie viel Kuna Gewinn man aufgrund 100 in die Produktion investierter Kuna verwirklichen kann.
Gewinn Kn/ha x 100 15.742,00 x 100R = ------------------------------------- = ------------------------------- = 65,7 % Gesamtkosten Kn/ha 23.932,20
Schlussfolgerung
Gurken spielen einen wichtige Rolle in der menschlichen Ernährung, weil sie außer ihrem angenehmen Geschmack auch Kohlenhydrate, Minerale und Vitamine enthalten, die für die Ernährung des Menschen unentbehrlich sind.
Für die Produktion dieser Kultur besteht ein großes Interesse. Die Produktion in Kroatien befi ndet sich weiterhin nicht auf einem zufrieden stellenden Niveau.

Juri{i}, M. • Kanisek, J. • Barkovi}, D186
Im Jahr 1996 wurde die Gurkenproduktion in 4300 Familienbetrieben mit einer durchschnittlichen Anbaufl äche von etwa 900 m2 je Betrieb organisiert.
Gurken erreichen rasch ihre technologische Reife und können daher auch in Gebieten mit kurzen Sommerperioden angebaut werden. Der Boden muss strukturiert, warm und reich an organischen und mineralischen Bestandteilen sein.
Es existieren mehrere verschiedene Technologien des Gurkenanbaus, sodass man zwischen Freilandanbau, unter schwarzer Polyethylenfolie und auf der so genannten Armatur unterscheiden muss.
Beim Freilandanbau sind die Produktionsinvestitionen geringer, doch sind die Pfl anzen anfälliger für Krankheiten, und auch das Wuchern von Unkraut kann Probleme bereiten. Die Erträge sind geringer als bei den anderen Methoden.
Bei der Produktion mit Polyethylenfolie gibt es nicht so große Probleme mit dem Unkraut, die Feuchtigkeit wird unter der Folie aufgestaut, sodass keine Bewässerung notwendig ist. Die Erträge sind größer.
Der Gurkenanbau mithilfe von Armatur ist die intensivste Produktionsweise, die auch die höchsten Erträge erzielt. Gewährleistet sind eine bessere Belüftung der Pfl anzen, weniger Probleme mit Pfl anzenkrankheiten, die Früchte sind sauberer, die Ernte erleichtert. Die Investitionen in eine solche Anbauweise sind jedoch hoch.
In dieser Arbeit wurden vier Gurkensaatmaschinen mit unterschiedlichen Saatvorrichtungen vorgestellt. Am besten haben sich pneumatische Saatmaschinen bewährt, die auf dem Prinzip des Über- und Unterdrucks funktionieren.
Gurken sind eine Krankheiten gegenüber sehr empfi ndliche Kultur. Wirtschaftlich einschränkende Krankheiten sind Oidium und Getreiderost, aber man muss auch andere Krankheiten und Schädlinge beachten. Krankheiten und Schädlinge werden mit verschiedenen Präparaten bekämpft, um den wirtschaftlichen Wert der Früchte zu steigern. Um Pestizide gleichmäßig zu verteilen, werden Luftdruck-Zerstäuber („AIR-plus“) angewendet, die im Vergleich zu klassischen Zerstäubern große Vorteile aufweisen (hohe Effi zienz bei geringen Kosten für den Schutz). Die Anwendung solcher Zerstäuber ist bei größeren Flächen gerechtfertigt.
Eine mechanisierte Gurkenernte ist in Kroatien nicht entwickelt und nur bei größeren Flächen gerechtfertigt. In Kroatien ist die manuelle Ernte am weitesten verbreitet, bei der jeden Tag geerntet wird. Die Ernte dauert von Anfang Juli bis zum Ende der Vegetationsperiode (30-40 Tage). Die mechanisierte Ernte erfolgt in einem Durchlauf, und die Gurken sind ausschließlich für die Weiterverarbeitung vorgesehen. In diesem Fall wird eine besondere Auswahl der zeitgleich reifenden Gurken vorgenommen, sodass diese in einem Durchlauf geerntet werden können.
TECHNOLOGISCHE UND TECHNISCHE FAKTOREN UND WIRTSCHAFTLICHE ... 187
Die Produktionsorganisation ist eine außerordentlich wichtige Voraussetzung für den Erfolg der Gurkenproduktion. Die Produktion ist arbeitsintensiv und bringt hohe Erträge ein, und ist demzufolge sehr interessant für Familienbetriebe, die relativ kleine Flächen bearbeiten und zusätzliche Arbeiter beschäftigen können. Dies bezieht sich vor allem auf den Monat, in dem die Gurkenrente anfällt, die sehr gründlich verrichtet werden muss. Diese Gründlichkeit bedingt außer einem höheren Gewinn auch ein besseres Verhältnis der Gurkenklassen und somit eine höhere Profi tabilität der Produktion.
In dieser Arbeit wurde die Organisation der Gurkenproduktion auf einer Fläche von einem Hektar untersucht. Aufgrund der berechneten Norm und der verwendeten technologischen Karte betrug der Arbeitsaufwand 49 Maschinenarbeitsstunden und 534 menschliche Arbeitsstunden. Die Gesamtkosten betrugen 23.934 Kuna. Bei einem Ertrag von 20.700 kg und einem Produktionswert von 39.675 Kuna wurde ein Gewinn von 15.742.00 Kuna erzielt, was für einen Familienbetrieb vollkommen zufrieden stellend ist. Die größten Kostenanteile stellen die menschliche Arbeit und die Polyethylenfolie dar, die zusammen über 50 % der Kosten ausmachen. Durch Berechnung der wirtschaftlichen Indikatoren wurde festgestellt, dass der Koeffi zient der Wirtschaftlichkeit den Wert 1,65 besitzt, was darauf hinweist, dass sich die Produktion wirtschaftlich auszahlt.
Gurken sind eine Kultur, die Ende Mai gesät wird und bereits nach etwa 50 Tagen Gewinn bringt. Die Anwendung von Verarbeitungsanlagen bedingt eine größere und intensivere Gurkenproduktion, vor allem wenn man wissenschaftliche und fachmännische Erkenntnisse und Erfahrung mit einbringt.
Literatur
1. Brčić, J. (1991): Mehanizacija u povrčarstvu, Agronomische Fakultät, Zagreb
2. Matotan, Z. (1994): Proizvodnja povrća, Zagreb
3. Zimer, R.; Banaj, Đ. und Košutić, S. (1997): Mehanizacija u ratarstvu, Landwirtschaftliche Fakultät, Osijek
*** Anleitung zur Produktion von Cornichon-Gurken (1991): Landwirtschaftlich-industrielles Kombinat Đakovo, Đakovo

Zlatko Lackovi}188
CIVIL ENGINEERING’S REEINGINEERING AS AN ESSENTIAL FACTOR OF CORPORATE BUSINESS STABILITY
Zlatko Lackovi}, DBA, Associated Prof.Osijek Civil Engineering School
Abstract
The article deals with a new approach to the business system’s managemental process improvement thru reengineering. Essentially, it pertains to the radical changes, whereby the new managemental, organizational, and especially decision-making methods are being applied. Thus, the topic contextually deals with the phenomenon, objective, and strategic behavior, i.e., concept, defi nition. It has been upgraded by process virtualization and an activity method development. In the sense applied, the very process pertains to the construction industry activities, which deserve it due to their dynamics in any case.
Keywords: reengineering, process, organization, development, virtualization
1. Introduction
In modern business transactions of all subjects, including the civil engineering ones, emergent is a need for managemental process dynamism as to secure business stability. In that sense, new methods emerge, whereby permanent improvement, i.e., mistake elimination and innovation introduction, are effectuated. Bearing in mind that civil engineering represents a very dynamic part of economy, the application of new managemental methods and procedures is imperative in this activity.
Civil engineering has special characteristics with regard to other economic trends and activities, especially the following ones:
• Immobility of civil engineering facilities as the work outputs;• Voluminosity and product inseparability;• Productional process length;• Usage of high material quantities;• Seasonal civil engineering production character;• Individual civil engineering production character;

CIVIL ENGINEERING’S REEINGINEERING AS AN ESSENTIAL FACTOR... 189
• Order-based production;• High number of complementary production participants.1
The adduced civil engineering characteristics necessitate managemental dynamism in the sense of the new method and procedure application. Additionally, one should mention that civil engineering is the main dynamic instigator of the rest of economy and infrastructure. Known is the fact that economic development is signifi cantly infl uenced by civil engineering dynamism. Moreover, any important economic developmental and infrastructural activity move enables civil engineering activation. One may add that civil engineering engages a large number of complementary participants as well as equipment and reproduction material manufacturers. Therefore, new methods and procedures, notably reengineering, should be constantly introduced especially in civil engineering. Basically, it pertains to a permanent improvement method as well as to drastic changes. Reengineering is actually created as a consequence of the following:
• Organizational crisis;• Informational crisis;• Innovational crisis;• Morale crisis;• Lack of technical progress.2
Pursuant to the abovementioned samples, it is necessary to introduce certain alterations in organization, new system and process creation, as well as other modern managemental innovations. Concretely, the introduction of reengineering implies a defi nition of fundamental entries, i.e., the concepts. A civil engineering’s reengineering process is being established on the basis of a concept. As reengineering implies a permanent activity, it is necessary to defi ne the dynamic, i.e., developmental, elements. A technological progress, especially the informatical technology application, should be taken into account
In all the adduced activities. Additionally, one should bear in mind that all changes are related to the each entity’s ultimate business objective, being the satisfaction of desires or consumer, i.e., market, needs.
1 Medanić, B. (1997), Management u građevinarstvu, Osijek, Civil Engineering School.2 Ređep, T. (2000), Reinženjering poslovnih procesa, Varaždin, Organization and Informatics School.

Zlatko Lackovi}190
2. Concept
Rapid changes happening in a business-like environment under an increased impact of technologies, globalization, and market demands pronouncedly emphasize the reengineering process and its overall application. The fundamental Adam Smith’s excogitation, whereupon the conventional technical processes were based, is being abandoned. It was fundamented on the following:
• Fragmented tasks are being assigned to the narrowly specialized workers;• The workers are isolated in various organizational units;• Effectuation of confl ict positions between the main corporate organizational
entities (procurement department, sales department, production, blueprint department, distribution, etc.).
The following is needed for the business process reengineering implementation:
• Divide a business process in the parts realizable up to the ultimate time;• Group them into the subsystems according to the data;• Defi ne priorities;• Defi ne subsystems’ connections via databases.
All have a congenial goal, being the consumer satisfaction, not the profi t yield of the main units competing among themselves and leaving the profi t yield obtained thru consumer satisfaction to someone else, what is feasible by virtue of a new radical blueprint, reengineering. That necessitates a process dismantling and its reassembling, denying fragmentation and necessitating teamwork and an overall process-solving approach. A technical process manager has to behave as a trainer who coordinates the operation of all processual parts. That can be performed by the keen, educated, and highly motivated employees who collaborate with the variously profi led specialists and work on the satisfaction of a congenial goal, profi t realization. This problem is specially pronounced in civil engineering, where each construction site is a kind of a profi t center. Profi t distribution according to the results is an additional motive for a successful process realization. The following has to be done:
• Process synthesis;• Employee classifi cation;• New employee evaluation method;• New operational organization setup.
Thereby, one should take into account that a radical process solution approach should not hurt the employees directly, so the lab-based reengineering versions,

CIVIL ENGINEERING’S REEINGINEERING AS AN ESSENTIAL FACTOR... 191
whereby the functional checkups are done and mistakes observed and eliminated, have to be implemented fi rstly, with the reengineering realization coming subsequently.3
A reengineering concept is based on processes and characterized by an attempt to make one job out of many while respecting the following procedures:
• Involvement of all employees in a decision-making process;• Instrumentalization of certain processual phases following a natural, logical,
and rational order;• Acknowledgement that the processes have multiple realization modalities;• Job operationalization where most adequate;• Reduction of classic employees control and checkup modes, starting from the
employee-oriented confi dence;• Introduction of a hybrid centralized-decentzralized organization.
Fig. 1: Notions and activities
Reengineering could be presented by the following notions, as depicted by Fig. 1: the fundamental changes imply reengineering, i.e., one starts from ground zero subsequent to the processor division, and the basic alterations are to be done, a basic technical process objective set, and its exit and its purpose defi ned. Under a radical change, one implies the way in which that basic goal is to be realized, neglecting
3 Veljivić, A. (2003), „Reinženjering poslovnih procesa,“ BPR i organizacijske promjene, Varaždin, p. 2.

Zlatko Lackovi}192
the heretofore mode that has not produced satisfactory results. The goal realization venue could also be classifi ed among the radical changes, as well as who would realize that goal. For the radical change realization, one should effectuate dramatic moves in the heretofore process in both the quantitative and qualitative sense, also resulting in expected dramatic improvements. The process is being created as a result of an overall activity, an activity set whose mutual interest is the achievement of a preset goal, earning a profi t to a general consumer and corporate satisfaction.4 In civil engineering, it pertains to multiple processes that have to be operationalized toward an ultimate goal, consumer satisfaction.
The dramatic moves’ result is the creation of new processes, having completely new dimensions concerning the initial ones. The structure is a processual one, not functional any more. The operation mode is primary. The employees effectuating the change have to be intelligent, trained, highly motivated, and stimulated, aimed at the processual result obtainance.5 A process created thru reengineering application is comprised of entirely new ingredients, being process-oriented and comprising the tightly interconnected entities.
Total Quality Management (TQM) implies managing the total quality.6 As to realize it, it has to be incessant, providing for all employees’ participance. The TQM has ensued from the following:
• An increased purchaser quality demand;• Quotidian change monitoring;• Know-how improvement.
Construction industry has to specially satisfy the TQM guidelines also due to the globalization processes, implying the creation of a common market. This process requires a voluntary employee involvement under a managerial surveillance and direction. It also requires a continuous employee education monitoring, their training, and qualifi cation.7 The result is a continuous product quality improvement. Fig. 2 depicts a difference between the TQM and reengineering.
4 Veljivić, op. cit., p. 56.5 Ređep, op. cit., p. 8.6 Veljivić, p. 2.7 Veljivić, p. 3.

CIVIL ENGINEERING’S REEINGINEERING AS AN ESSENTIAL FACTOR... 193
Fig. 2: TQM – reengineering difference
3. Goals
Necessary is an entirely new consolidation, in addition to the innovation-enabled changes. The long-term nonprofi t and slow-paced improvements are being replaced while enabling the individual’s activity as to improve creativity and self-learning in process participation.8
A productivity increase is obtained due to the introduction of information technology (IT). This very fact increases cost-effectiveness, as the fi rst step toward business improvement. The processual investments are reduced, so the investment payoff rate is increased.
By virtue of IT introduction and direct data access and retrieval, both the input raw material resource, maintenance resource, and prefabricated products’ differences are reduced. Systemic reliability improvement is increased due to a high IT reliability degree, thus infl uencing a cut in all processual costs.
Processual improvement and radical changes create a positive climate for further improvement and team and individual collaboration. It leads toward expert qualifi cation and processual activity improvement of both the individuals,
8 Lacković, Z. (2004), Management tehničih sustava (script), Osijek, Electrical Engineering School, p. 142.

Zlatko Lackovi}194
stakeholders, and all employees. They become interested in further betterment, for the profi t and stimulation and distributed according to the work outputs. The expertly qualifi ed process participants enable the introduction of Computer-Integrated Manufacturing (CIM).
User demand is being centralized, infl uencing the process and regulating it, so that the process result becomes more competitive at the market.
The IT introduction does not only create an increased process reliability but also an increase in result quality due to the IT-based controls, which also affects market competitiveness.
Thru the introduction of reengineering, one may continue the improvement process at a higher scientifi c tier. This provides for good predispositions for further upgrades and processual betterments and the improvements of its personnel. Based upon practical experiences in companies wherein business process reengineering is conducted, the following data are being obtained:
• Quality increase by 84%;• Reduction in product emergence time by 75%;• Communicational improvements by 61%;• Developmental costs reduced by 54%;• Replacement reductions by 48%;• Profi t increase by 35%.9
9 Lacković, ibid., p. 143.
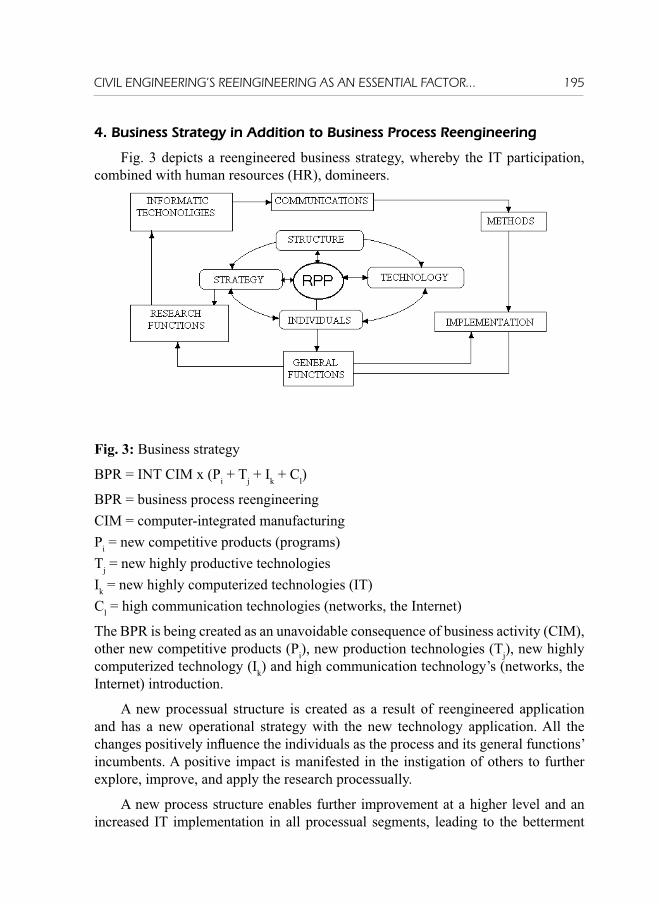
CIVIL ENGINEERING’S REEINGINEERING AS AN ESSENTIAL FACTOR... 195
4. Business Strategy in Addition to Business Process Reengineering
Fig. 3 depicts a reengineered business strategy, whereby the IT participation, combined with human resources (HR), domineers.
Fig. 3: Business strategy
BPR = INT CIM x (Pi + Tj + Ik + Cl)
BPR = business process reengineeringCIM = computer-integrated manufacturingPi = new competitive products (programs)Tj = new highly productive technologiesIk = new highly computerized technologies (IT)Cl = high communication technologies (networks, the Internet)
The BPR is being created as an unavoidable consequence of business activity (CIM), other new competitive products (Pi), new production technologies (Tj), new highly computerized technology (Ik) and high communication technology’s (networks, the Internet) introduction.
A new processual structure is created as a result of reengineered application and has a new operational strategy with the new technology application. All the changes positively infl uence the individuals as the process and its general functions’ incumbents. A positive impact is manifested in the instigation of others to further explore, improve, and apply the research processually.
A new process structure enables further improvement at a higher level and an increased IT implementation in all processual segments, leading to the betterment

Zlatko Lackovi}196
in both the intern and extern communication. The intern communication improves team coordination within a process, while the extern communication improves environmental analysis, thus inducing a better process regulation and a competitive increase. The improvement process is being continued and the new methods are being found, the implementation of which effectuates a betterment of the general processual functions. Each satisfactory improvement provides an impetus to go forward.
5. Reengineering in the Innovation Process Design
Reengineering represents the basic, radical, and dramatic changes. Thus, it does not introduce a single innovation in a working system but a series thereof, aimed at a business transaction betterment. These improvements are refl ected as follows:
• Abbreviation of process completion time;• Small-value process elimination;• Productivity increase;• Communication improvement;• Further development expenditure cuts;• Replacement reductions.10
As to achieve this, existent is a rational series of activities, depicted by a diagram on Fig. 4.
Fig. 4: Innovation process
10 Lacković, ibid., p. 145.

CIVIL ENGINEERING’S REEINGINEERING AS AN ESSENTIAL FACTOR... 197
As to launch a reengineering process, it is fi rstly necessary to conduct a detailed existent process analysis. Based upon this environmental impact analysis’ results, created is a possible new process vision and a new process is planned. By virtue of an applied reengineering, a new processual model is being established. Prior to its processual implementation, it is necessary to develop a processual prototype and its functionality model. Subsequent to a checkup, one should make the possible upgrades and improvements to the prototype solution. Having all the preparations fi nalized, one should approach the IT restructuralization.
6. Reengineering Development
We live in the time of intensive changes.11 Indubitably, the monitoring of these changes necessitates constant improvements but fails to achieve results quickly enough. Thru reengineering, we try to anticipate the changes, be visionaries, and effectuate radical processual alterations that would achieve satisfactory results for a company and a client. There are multiple reasons why to solve a business problem while applying reengineering. Firstly, the ever so quick changes that happen in the technical-technological and business fi eld grow following a geometric progression. This alterational progression is observable thru the introduction of IT in all human life spheres, what has enabled the interconnection of heretofore unconnectable or hardly connectable processes, as well as that of human life. Thus, the communication between various fi elds, as well as a necessary information interchange, is brought to an envy-awakening level. Excogitated is a new common language and its communicational modality. A new processual and business solution model is being created, the fundamental changes have happened. The IT introduction has elevated the quality level, thus inducing an increased purchaser quality and design demand.
Initially, the ITs have been utilized solely administratively, for the automated data processing (ADP). A realization that the entire processual entities, and even the process as a whole, may be virtualized — realized thru the IT — is caused by virtue of their development, so that the organization increasingly becomes virtualized.
By the means of certain entities’ virtualization, created is also a possibility of their interconnection, what has created a possibility of direct internal communication. Other processes are also virtualized, so an external communication capacity exists between two or more different processes and the environment.
11 Idem, ibid., p. 138.

Zlatko Lackovi}198
Fig. 5: Virtual system structure
C1 – Cn = education centersPO = process owners (leaders)
The whole process was under the Board members’ control, while either a product or a service user is in the center of a virtual system attention, determining the main business policy directives. A virtual system structure might be represented by Fig. 5, whereby it is visible that the process leaders are backed by educational centers, which might be located inside or outside a company. The processes exist for a user, and all of them are market- and user-oriented, organized via virtual systems. The systems (processes) dispose of all the necessary operative information directly. The users regulate the process operation, while the guidelines pertaining to further process development are dependent on the market status.
7. Conclusion
The aforementioned debate hypotheses demonstrate that the reengineering implementation represents a complex, permanent, and multidisciplinary process. An activity’s complexity depends on the objectives, and the concept and strategic behavior are defi ned in this respect. A process is therefore a consequence of goals and the concept. It is worth emphasizing that everything proceeds in a spirit of dynamic virtualization, with a constant change tendency. The reengineering application is especially necessary in civil engineering due to its dynamism and this activity’s representation in economy and infrastructure.

CIVIL ENGINEERING’S REEINGINEERING AS AN ESSENTIAL FACTOR... 199
8. References
Adamović, Ž and D. Stojčević (1989), Reengineering, Zrenjanin Technical School.Lacković, Z. (2004), Management tehničih sustava (script), Osijek, Electrical Engineering School, p. 142. Medanić, B. (1997), Management u građevinarstvu, Osijek, Civil Engineering School.Ređep, T. (2000), Reinženjering poslovnih procesa, Varaždin, Organization and Informatics School.Vajić, I. (1994), Management i poduzetništvo. Mladost, Zagreb.Veljivić, A. (2003), „Reinženjering poslovnih procesa,“ BPR i organizacijske promjene, Varaždin, p. 2.
Marina Dabi} • Mirjana Peji}-Bach200
STRATEGY IMPROVEMENT THROUGH INTELLIGENT MANAGEMENT TOOLS IN CROATIAN FIRMS
Marina Dabi}1, Vice Dean Assosciate ProfessorUniversity of Osijek, Mechanical Engineering Faculty
Mirjana Peji}-Bach, Assistant ProfessorUniversity of Zagreb, Graduate Business School
1. Introduction
Trends that appeared together with the development and the increasing application of information technology, whose infl uence on the organization structure is the great est, are the business globalization, change in the structure of employees, elimination of boundaries among the parts within the organizations, but also among individual organizations.
With the increasing globalization of the business the Central Eastern European Countries (CEE) such as Croatia will face mounting competitive pressures and further squeeze on effectiveness. For the adequate running of the business operation all the requisite various information with which quantity, value and quality (or any other important) characteristics of operations are presented. However, their treatment is linked to the variety of content and methodology issues (Gunton, 1998; Fry, Stoner, 2000). Given the complexity of the management environment the development of a corporate managerial tools and techniques is likely to include the applications of strategy methodologies and information systems as tools to facilitate the exploitation of the full potential of management. What is happening is the realization that there is a new measure of tools, global tools, which incorporates the accelerating tempo of decision-making and at the same time the growing complexity of the basic concept of managerial tools due to its global nature.
This paper examines the dimensions of accepted managerial tools and techniques in Croatian companies, develops a means for visualizing global management and provides insights into how to develop a support infrastructure for middle managers who have to deal with the issues associated with competition in global time. In sum, this study addresses the following research question. To what extent are intelligent
1 1 Corresponding author

STRATEGY IMPROVEMENT THROUGH INTELLIGENT MANAGEMENT TOOLS ... 201
managerial tools recognized in Croatian fi rms as the importance attributing to corporate success by managers and professionals?
2. Theoretical background
In each company, there seems to be something that is as the core competence of the fi rm’s existence, and has roots of the fi rm’s in driving it forward. Quality and process improvements are recognized major strategic issues for those who wish to compete successfully. Comparatively few studies have examined the role of managerial tools as a tool for middle mangers to anticipate and address success (Reh, 2005; Singh et. Al.,2000; McQuater et. al., 1995; Rigby et.al., 2005). However, there are two factors, information technology and management, which are considered both by a great number of theoreticians as well as practitioners as being those that will make possible the construction of an organisation that will satisfy the challenges of fl exibility, and in the same time provide the needed control, because in today’s companies everything seems as if it were getting out of control.
Possibilities of information technology are being increasingly studied and accepted by the modern business world (Malhotra, 1999). To be able to determine oneself within a turbulent environment and not just overcome the turbulence means to gain advantage. However, how is one to provide constant monitoring and responding to the changes in the mean time? Within the fi eld of management there appears to be shortage of tools and techniques that describes best practice for managed business improvement by implementation of management tools and tecniques.
Firstly, some defi nitions are required. What are tools and techniques? According the McQuarter et al (1995) they are practical skills, methods means or mechanisms that can applied to particular task. A very simple tools can be Pareto analysis, control charts etc. A techniques has specifi c application and resulting in the search and needs for more training, knowledge and skill if we wish to used them effi ciently. In 1993 Bain and Company launched a multiyear research project to get the facts about management tools. The research is conducted every two years. The full defi nitions of the 25 tools along with the guide to resources on each one appear in the Bain & Company booklet Management Tools 2005 An Executives Guide (Rigby, 2005).
Altough in the Bain research 25 management tools are examined, this research is focused only to the management tools that heavily lie on the extensive use of information technology. We call these tools intelligent management tools because of extensive use of information technology increases capability of fi rm to learn (Sharif, 2006).
These tools are: Strategic Planning; Total Quality Management; Knowledge Management;, Customer Relationship Management; Business Process Reengineering;

Marina Dabi} • Mirjana Peji}-Bach202
Balance Scorecard, Scenario and Contingency Planning, Supply Chain Integration, Mass Customization, Six Sigma, and RFID. In the next session we shall describe them briefl y.
2.1. Strategic planning System
Lorange and Vancil (1977) in their work, Strategic planning System, make useful defi nitions of strategy, objectives and goals and put forward fi ve pillars for planning, as follows: (1) Planning systems should help to formulate strategic choice, (2) Plans must be understood at all levels, communication, opinions interaction and iterations are to be stressed. (3) Plans have to be consistent in formats, method, deadlines so that confusion in planning reviews and consolidation can be minimized, (4) Planning system should be integrated with other management systems, and (5) Line mangers must be centrally involved in planning.
However, in the last decade approaches to strategy has been changed and adopted as a new management paradigm. In addition, much attention is given to the role of “new manager” (Mintzberg, 1994; Porter, 1991). As Davidson described (1995) change management has its basis in leadership, shared purpose and values and the role of the manger as facilitator and coach. Today, strategic thinking offers managers and their companies the opportunity to move beyond the automatic application of traditional strategic frameworks to identify and to achieve breakthrough marketing strategies (Fodness, 2005).
2.2. Total quality management
Total quality management has been stimulated by the need of fi rms to sustain unchanged quality of its products or services. The fundamental principle behind TQM is that management of quality is addressed at all levels of an organization. Luthans (1995) summarized TQM as being a participative system that empowers all to take responsibility for improving quality in the organization. Improvements are made on a continuous basis by applying the theories and approaches of managers in an attempt to improve quality and decrease costs (Hellsten, 2000). Recently, sustainability of values, tools and techniques as additional core value of the components of TQM are evaluated based on perspective of sustainable quality management, rather than tactical and operative ones (Svensson, 2006).
2.3. Knowledge managementIn the “new economic growth theory” various scholars shifted their focus from
traditional, tangible capital assets in the neo-classical model to intangible knowledge assets accumulated through science and technology investments. Knowledge

STRATEGY IMPROVEMENT THROUGH INTELLIGENT MANAGEMENT TOOLS ... 203
management has continued to generate an enormous amount of interest from the early 1990s, with some proponents contending that the knowledge-based view represents a fundamentally new theory of the fi rm (e.g., Nonaka and Takeuchi, 1995).
Knowledge management is here defi ned as the management of tacit and explicit knowledge with the purpose of creating organizational learning innovation and sustainable competitive advantage through the use of information technology. Much of this debate began by distinguishing between information and knowledge and has subsequently delved into the meaning of knowledge, determining how knowledge is generated and disseminated, setting out the foundations of a knowledge-based theory of the fi rm, prescribing the adoption of a knowledge perspective and so forth (Nonaka, 1994; Kogut and Zander, 1992, 1993; Spender, 1996; Grant, 1996; Nonaka and Takeuchi, Teece, 1998, Nonaka and Teece, 2000).
Acquiring managerial skills and technical know-how will further improve operational effi ciency and enhance the competitiveness of organizations in Eastern Europe, ultimately improving living standards and broadening the market base which is currently constrained by poverty and high unemployment.
2.4. Customer relationship management -CRM
Kotler and Armstorng (2004) defi ne CRM as “the overall process of building and maintaining profi table customer relationships by delivering superior customer value and satisfaction.” Customer relationship management (CRM) is a process or methodology used to learn more about customers’ needs and behaviors in order to develop stronger relationships with them. CRM frequently employs IT technology as a means to attract, develop and retain customers (Lindgreen, et.al., 2005). However, CRM is not primarily technological term, but it consists on many components: key customer focus, CRM organization, knowledge management, and technology-based CRM (Sim et.al, 2005).
Accurate customer data is essential to successful CRM performance and according to that fact, technology plays an important role in CRM as value added to organizational intelligence (Abbott et al.,2001). Although CRM is not primarily the information tool; it is associated with heavy investments in information technology that has not always proved their profi tability (Compton, 2004). Still, investments in CRM have top priorities according to the Morgan Stanley CIO Survey (Zencke, 2004).
2.5. Business Process Reengineering Re-engineering is alternatively known as re-cyclin, reclamation, remarketing,
de- manufacturing and has the various means by which product or components can

Marina Dabi} • Mirjana Peji}-Bach204
be re-used. Hammer and Champy (1993) in their work recognized some frequent themes in re-engineering process such as worker participation in decision making is increased; there are fewer checks and controls; the work is done where it makes sense; and the steps in completing a process are done in a natural order. The different surveys existed in that fi eld and they concluded that the introduction and implementation of process reengineering has produced mixed results (Stoddard et al., 1996)
2.6. Balanced scorecard system (BCS)
Over the last decade there has been move toward a more balanced measurement process. Kaplan, Lowes and Norton developed the balanced scorecard system (BCS) (1996). The balanced scorecard seeks to assist business in clarifying their visions and strategies and provide them with a means by which they can be translated into action. The BSC is designed to link the data together in ways that produce better information and decisions across all levels of the organizations. The four perspectives of the BSC framework include:
• Financial - which includes metrics such as cost benefi t analysis and fi nancial risk assessment
• Internal business processes –how well your core processes produce value
• People and knowledge- which seek to identify where employee training budget can be best deployed with the goal of ensuring continued individual and corporate improvement
• Customer – This focuses on the analysis of customer satisfaction and different types of mechanisms for that.
2.7. Scenario and Contingency Planning
The majority of today’s production companies are subjected to the infl uence of an extremely dynamic, even turbulent environment (Schoemaker, 2002). Frequent, stormy and above all, unpredictable changes occur in such environments, whose causes and consequences are sometimes hard to fi nd and relate. One tries to explain such environment and its infl uence on the business activities through theses of new scientifi c disciplines such as synergetic and theory of chaos (Gharajedaghi, 1999).
Scenario management combines methods of systems thinking, future-open thinking and strategic thinking (Fink et al.;2000; Fink; 2002). A scenario is “one of several future images that describe a future situation based on a signifi cant number of consistent developments”. The use of these scenarios in corporate or business planning is described as scenario management. Strategic contingency controlling

STRATEGY IMPROVEMENT THROUGH INTELLIGENT MANAGEMENT TOOLS ... 205
is used in order to ensure that their strategy is always in line with the current developments of their industry, market, competitors and global situation.
2.8. Supply Chain IntegrationBoth information and material fl ow from the supplier to the customer, through a
manufacturing company. Although fi rms traditionally gave much attention to the fl ow of material, it has become important to fi rms to manage the supply chain in order to improve customer service, achieve a balance between costs and services, and thereby give a company a competitive advantage. At strategic, tactical and operational level the use of all of the fi rms’ resources have to be coordinated, which could be achieved in three phases: (1) evaluation of the competitive environment; (2) diagnostic review of the supply chain; (3) development of the supply chain, which involves functional integration, internal integration and fi nally external integration (Stevens, 1990). The sudden increase in electronic commerce and the Internet have resulted in new opportunities to improve the performance of the supply chain (Lankford, 2004).
2.9. Mass customization
In the past, fi rms had to choose to produce either product specifi cally customized to the customer, or product that is standardized. The fi rms had to choose, to be large and standardized or small and customized. Therefore, the idea of mass customization is basically contradictive, because it allows fi rms to produce customized products to the large number of customers.
Mass customization involves the production of mass produced, standard products, with slight variations for particular market or customer segments. According to Sean (1996) the customers now has been pushed to specify their exact requirements without extra charge for it. Pine (1993) cites fi ve methods that fi rms should use in order to achieve mass customization: (1) customize services around standard products; (2) create customizable products; (3) provide point of delivery customization; (4) provide quick response; and (5) modularize components.
2.10. Six Sigma
Researchers and consultants have tried to set criteria in which one six sigma methodology becomes a priority over the other for current processes and products. Current literature presents growth and investment of six sigma in industry. It is focused on improving processes by eliminating variation using a well-structured methodology. The main objectives of six sigma is to reduce potential variability from processes and products by using either a continuous improvement methodology or a
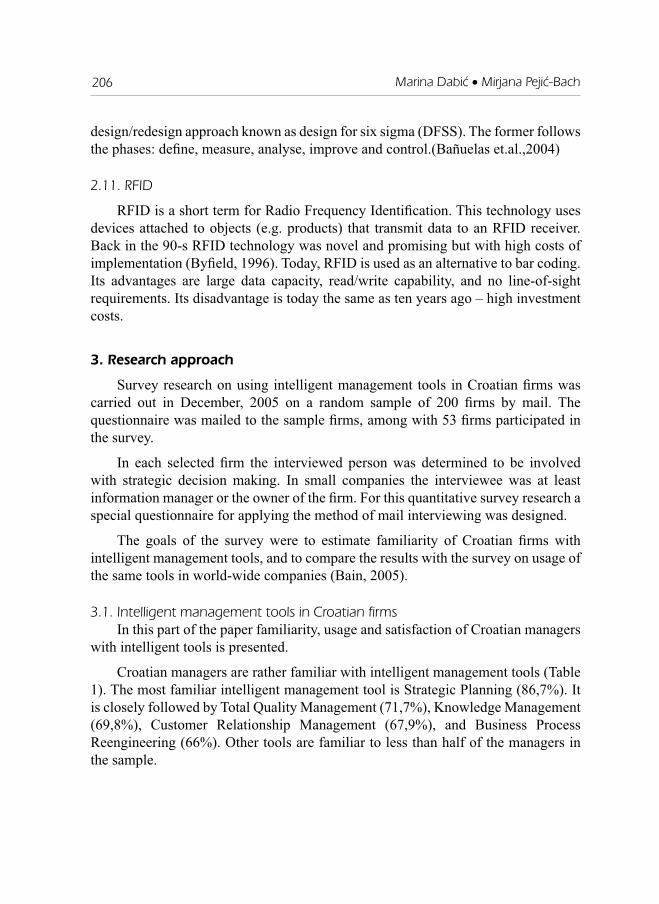
Marina Dabi} • Mirjana Peji}-Bach206
design/redesign approach known as design for six sigma (DFSS). The former follows the phases: defi ne, measure, analyse, improve and control.(Bañuelas et.al.,2004)
2.11. RFID
RFID is a short term for Radio Frequency Identifi cation. This technology uses devices attached to objects (e.g. products) that transmit data to an RFID receiver. Back in the 90-s RFID technology was novel and promising but with high costs of implementation (Byfi eld, 1996). Today, RFID is used as an alternative to bar coding. Its advantages are large data capacity, read/write capability, and no line-of-sight requirements. Its disadvantage is today the same as ten years ago – high investment costs.
3. Research approach
Survey research on using intelligent management tools in Croatian fi rms was carried out in December, 2005 on a random sample of 200 fi rms by mail. The questionnaire was mailed to the sample fi rms, among with 53 fi rms participated in the survey.
In each selected fi rm the interviewed person was determined to be involved with strategic decision making. In small companies the interviewee was at least information manager or the owner of the fi rm. For this quantitative survey research a special questionnaire for applying the method of mail interviewing was designed.
The goals of the survey were to estimate familiarity of Croatian fi rms with intelligent management tools, and to compare the results with the survey on usage of the same tools in world-wide companies (Bain, 2005).
3.1. Intelligent management tools in Croatian firmsIn this part of the paper familiarity, usage and satisfaction of Croatian managers
with intelligent tools is presented.
Croatian managers are rather familiar with intelligent management tools (Table 1). The most familiar intelligent management tool is Strategic Planning (86,7%). It is closely followed by Total Quality Management (71,7%), Knowledge Management (69,8%), Customer Relationship Management (67,9%), and Business Process Reengineering (66%). Other tools are familiar to less than half of the managers in the sample.

STRATEGY IMPROVEMENT THROUGH INTELLIGENT MANAGEMENT TOOLS ... 207
Table 1. Number of respondents that are familiar with the tool
Number of fi rms % in total number of fi rms1. Strategic Planning 46 86,8%2. Total Quality Management 38 71,7%3. Knowledge Management 37 69,8%4. Customer Relationship Management 36 67,9%5. Business Process Reengineering 35 66,0%6. Balance Scorecard 24 45,3%7. Scenario and Contingency Planning 20 37,7%8. Supply Chain Integration 19 35,8%9. Mass Customization 15 28,3%10. Six Sigma 7 13,2%11. RFID 4 7,5%
The usage of intelligent management tools can give us feeling of where do executives’ strategic priorities lie (Table 2). Usage of intelligent management tools in Croatian fi rms indicates that their managers are oriented to three things: future, customers, and quality.
Croatian managers most intensively think about the future. Strategic planning is their preoccupation (69,8%), but they do not use Scenario and Contingency Planning too often. However, they are ready to reorganize itself with the Business Process Reengineering (28,3%).
Based on high usage and satisfaction with Customer Relationship Management (39,6%) both with Knowledge Management (35,8%), Croatian managers obviously think about customers, how to acquire them, keep them, learn more about what they want, and satisfy their needs.
Global economy turned the whole world into the one marketplace. Strong competition forces the fi rms not only to monitor the customers, but also to take care on the quality of its products. Based on high usage of Total Quality Management (28,3%), Croatian managers are following the trend. However, in the same time they rarely not use Six Sigma method in obtaining that goal.
Table 2. Number of respondents that use the tool
Number of fi rms % in total number of fi rmsStrategic Planning 37 69,8%Customer Relationship Management 21 39,6%Knowledge Management 19 35,8%Business Process Reengineering 15 28,3%Total Quality Management 15 28,3%
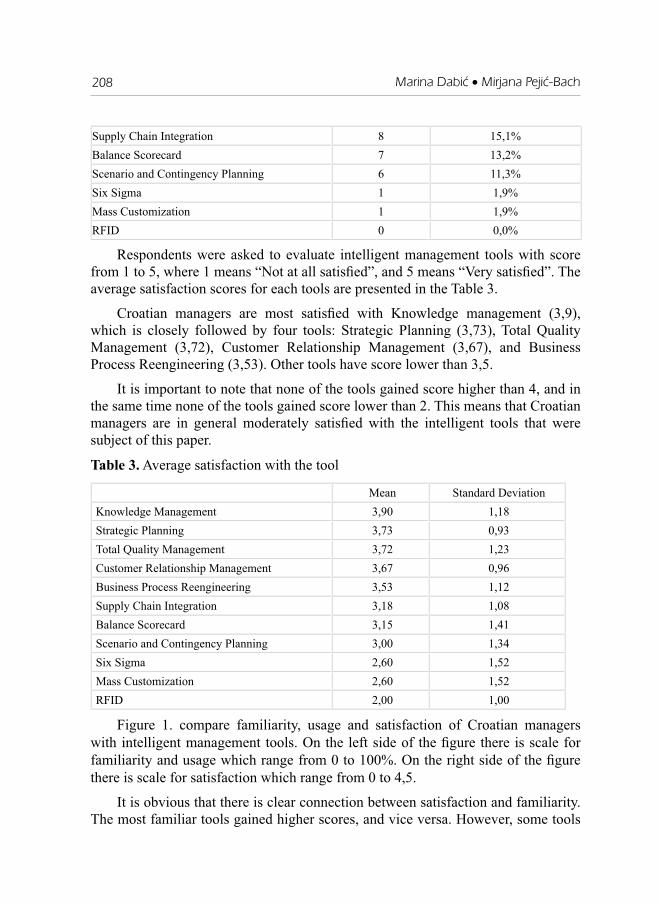
Marina Dabi} • Mirjana Peji}-Bach208
Supply Chain Integration 8 15,1%Balance Scorecard 7 13,2%Scenario and Contingency Planning 6 11,3%Six Sigma 1 1,9%Mass Customization 1 1,9%RFID 0 0,0%
Respondents were asked to evaluate intelligent management tools with score from 1 to 5, where 1 means “Not at all satisfi ed”, and 5 means “Very satisfi ed”. The average satisfaction scores for each tools are presented in the Table 3.
Croatian managers are most satisfi ed with Knowledge management (3,9), which is closely followed by four tools: Strategic Planning (3,73), Total Quality Management (3,72), Customer Relationship Management (3,67), and Business Process Reengineering (3,53). Other tools have score lower than 3,5.
It is important to note that none of the tools gained score higher than 4, and in the same time none of the tools gained score lower than 2. This means that Croatian managers are in general moderately satisfi ed with the intelligent tools that were subject of this paper.
Table 3. Average satisfaction with the tool
Mean Standard DeviationKnowledge Management 3,90 1,18Strategic Planning 3,73 0,93Total Quality Management 3,72 1,23Customer Relationship Management 3,67 0,96Business Process Reengineering 3,53 1,12Supply Chain Integration 3,18 1,08Balance Scorecard 3,15 1,41Scenario and Contingency Planning 3,00 1,34Six Sigma 2,60 1,52Mass Customization 2,60 1,52RFID 2,00 1,00
Figure 1. compare familiarity, usage and satisfaction of Croatian managers with intelligent management tools. On the left side of the fi gure there is scale for familiarity and usage which range from 0 to 100%. On the right side of the fi gure there is scale for satisfaction which range from 0 to 4,5.
It is obvious that there is clear connection between satisfaction and familiarity. The most familiar tools gained higher scores, and vice versa. However, some tools

STRATEGY IMPROVEMENT THROUGH INTELLIGENT MANAGEMENT TOOLS ... 209
have rather low usage and are in the same time highly scored. One example is Total Quality Management, and other is Knowledge Management. These are probably the future stars which usage will increase in the near future.
0,00%
20,00%
40,00%
60,00%
80,00%
100,00%
Strateg
ic Plan
ning
TQM
Knowledg
e Man
agemen
tCRM
BPR
Balanc
e Sco
recard
Scenari
o and C
ontin
genc
y Plan
ning
Supply
Cha
in Int
egratio
n
Mass C
ustomiza
tion
Six Sigma
RFID
0
0,5
1
1,5
2
2,5
3
3,5
4
4,5
FamiliarityUsageSatisfaction
Figure 1. Comparison of familiarity, usage and satisfaction of Croatian managers with intelligent management tools
3.1. Comparison with world wide firms
The results of our survey will be compared with the survey that is conducted with the number of world-wide fi rms (Bain, 2005). This survey will be shortly described. In 1993, Bain launched a multi-year research project to get the facts about management tools and trends. Their objective is two-fold: (1) Provide managers with information they need to identify and integrate tools that will improve bottom-line results, and (2) Understand how global executives view their strategic challenges and priorities.
Over the past 12 years, they have completed 10 surveys, assembling a database that now includes 7,283 respondents from more than 70 countries in North America, Europe, Asia, Africa, the Middle East and Latin America. In 2005, they received 960 completed surveys from a broad range of international executives. They also conducted personal follow-up interviews to further probe the circumstances under which tools are most likely to produce desired results.

Marina Dabi} • Mirjana Peji}-Bach210
At fi rst sight, intelligent management tools are more used in world-wide companies compared to Croatia. This is true for all of the tools. However, the difference is rather low for most popular tools: Knowledge Management, and Strategic Planning.
On the other side, the difference is especially high for Supply Chain Integration, Mass Customization, Six Sigma. This could be explained by the fact that in Croatia there are very few fi rms that follow cutting-edge technology in production, and all of the mentioned tools are typical for production fi rms. In addition, RFID is not used in any of the Croatian fi rms.
Strategic Planning
Customer RelationshipManagement
Business ProcessReengineering
Total Quality Management
Balance Scorecard
Know ledge Management
Scenario and ContingencyPlanning
Six Sigma
Mass Customization
RFID
Supply Chain Integration
Bain (2005)
Croatia
Figure 2. Usage of tool in Croatian and world wide fi rms (Bain, 2005)
Croatian managers are in most of the cases less satisfi ed with intelligent tools compared to world-wide managers. The only one exception is Knowledge Management that is widely used in Croatian fi rms, and that has better satisfaction score in Croatia compared to world-wide fi rms.
Again, the most popular tools have rather similar satisfaction score in both Croatian fi rms and world-wide fi rms: Total Quality Management, Business Process Reengineering, Customer Relationship Management, and Strategic Planning.

STRATEGY IMPROVEMENT THROUGH INTELLIGENT MANAGEMENT TOOLS ... 211
On the other side, Supply Chain Integration, Mass Customization, Six Sigma and Scenario and Contingency Planning got rather low satisfaction scores in Croatian fi rms compared to world-wide fi rms.
Strategic Planning
Customer Relationship Management
Business Process Reengineering
Total Quality Management
Balance Scorecard
Knowledge Management
Scenario and Contingency Planning
Six Sigma
Mass Customization
RFID
Supply Chain Integration
Bain (2005)Croatia
Figure 3. Satisfaction with tools in Croatian and world wide fi rms (Bain, 2005)
4. Conclusion
In the circumstances of restricted available factors and present conditions of business operation, results can be primarily improved by an adequate management. Various solutions are available to improve the quality of management while one important improvement of business is provided by a suitable information support of business, its management and basic processes.
Intelligent management tools show mixed results. On the one side of the story there are most popular tools, and on the other there are the least popular tools. Two important questions are: (1) Why is particular intelligent management tools often used or not used, and (2) What infl uence has particular intelligent management tools to the performance of the fi rm.
Marina Dabi} • Mirjana Peji}-Bach212
Management tools and techniques have certainly not been used to the best advantage within company. Although those that have been correctly applied and have provided signifi cant benefi ts this is believed to be due the lack of middle management understanding and acceptance.
Aligning strategy within company is people, processes and technology typically requires signifi cant change in all areas of the organizations. There is tendency to continue old practice regardless of their effi ciency. However, people do not resist the all change. Instead, what people resist is the personal threat posed by a specifi c change in the workplace (Burke (1982). The degree of resistance to change, therefore, depends on the kind of change involved and how well the perceived threat to the employees is managed. Resistance is likely when users perceive new technologies as threatening. Therefore, it is not surprising that leaders have great diffi culty implementing the managerial tools and get the commitment of followers to it.
5. References
1. Bain Company (2005). http://www.bain.com/managemetn_tools/home.asp
2. Bañuelas, R.; Antony, J.(2004) Six sigma or design for six sigma?The TQM Magazin, Vol 16, No 4 pp.250-263
3. Burke,W.W. (1982) Organizational Development: Principles and Practices, Little Brown, Boston, MA
4. Byfi eld, I. (1996). Developments in RFID. Sensor Review, Vol. 16, No. 4, pp 4-5.
5. Compton, J. (2004), “CRM gets real”, Customer Relationship Management, Vol. 8 No.5, pp 11-12.
6. Davidson, M. (1995). The Transformation of Management, Macmillan Business Press, London.
7. Fink, A. (2002), “Scenarios to plan”, in Ringland, G. (Eds),Scenarios in Business, Wiley, Chichester, .
8. Fink, A., Schlake, O. (2000), “Scenario management – an approach for strategic foresight”, Competitive Intelligence Review, Vol. 11 No.1, pp.37-45.
9. Fodness, D. (2005). Rethinking strategic marketing: achieving breakthrough results, Journal of Business Strategy, Vol. 26., No. 3, pp 20 – 34.
10. Gharajedaghi, J. (1999). Systems Thinking: Managing Chaos and Complexity – A Platform for Designing Business Architecture, Butterworth-Heinemann, Boston, MA.

STRATEGY IMPROVEMENT THROUGH INTELLIGENT MANAGEMENT TOOLS ... 213
11. Grant, R.M. (1996) ‘Toward a knowledge-based theory of the fi rm’. Strategic Management Journal, 17: 109-122.
12. Hammer, M., Champy, J. (1993), Reengineering the Corporation, Harper Business, New York, NY.
13. Hellsten, U., Klefsjo, M. (2000), “TQM as a management system consisting of values, techniques and tools”, The TQM Magazine, Vol. 12 No.4, pp 238-44.
14. Kaplan, R.; Lowes, A.; Norton, D.P. (1996) : Balanced Scorrecard: Translating Strategy into Action, Watertown, MA: Harvard Business School Press,
15. Kogut, B. and Zander, U. (1992) ‘Knowledge of the fi rm, combinative capabilities and the replication of technology’. Organization Science, 3: 383-397.
16. Kogut, B. and Zander, U. (1993) ‘Knowledge of the fi rm and the evolutionary theory of the multinational corporation’. Journal of International Business Studies, 24: 625-645.
17. Kotler, P., Armstrong, G. (2004), Principles of Marketing, 10th ed., Prentice-Hall, Englewood Cliffs, NJ.
18. Lankford, W.M. (2004). Supply chain management and the Internet. Online Information Review, Vol. 28, No. 4, pp 301-305.
19. Lindgreen, A., Antioco, M. (2005). Customer relationship management: the case of a European bank. Marketing Intelligence & Planning. Vol. 23, No. 2, pp 136-154.
20. Malhotra, Y.: Role of Information Technology In Mana ging Orgaizational Change and Organizational Interde pendence, http://www.brint.com/papers , 1999.
21. McQuarter .R.E.; Scurr, C.H. Dale, B.G. Hillman, P.G. (1995) Using quality tools and techniques successfully, The TQM Magazin, Vol.7, No.6. pp. 37-42.
22. Mintzberg, H. (1994), The Rise and Fall of Strategic Planning, Financial Times/Prentice-Hall, London, .
23. Nonaka, I. and Takeuchi, H. (1995) The Knowledge Creating Company. New York: Oxford University Press.
24. Nonaka, I. and Teece, D. (2001) Managing Industrial Knowledge. London: Sage.
25. Porter, M. E. 1991. Towards a dynamic theory of strategy, Strategic Management Journal, 12: 95-117.
26. Reh, F.J. (2005), “Key performance indicators (KPI)”, available at: http://management.about.com/cs/generalmanagement/a/keyperfi ndic_p.htm

Marina Dabi} • Mirjana Peji}-Bach214
27. Rigby D. and Bilodeau, B (2005) The Bain 2005 Mangement tool survey, Strategy& Leadership, Vol.33 No.4 pp 4-12.
28. Schoemaker, P.J.H. (2002), Profi ting from Uncertainty: Strategies for Succeeding No Matter What the Future Brings, Free Press, New York, NY.
29. Sean, K. (1996) Data Warehousing: The Route to Mass Customization, Chichester, John Wiley.
30. Sharif, A.M. (2006). Realizing the business benefi ts of enterprise IT. Handbook of Business Strategy, Vol.7, No.1, pp 347 – 350.
31. Sim, L.Y.M. Tse, A.C.B., Yim, F.H.K. (2005). CRM: conceptualization and scale development. European Journal of Marketing. Vol. 39, No. 11/12, pp 1264 – 1290.
32. Singh, H., Motwani, J., Kumar, A. (2000), “A review and analysis of the state-of-the-art research on productivity measurement”, Industrial Management & Data Systems, Vol. 100 No.5, pp.234-41.
33. Spender, J-C. (1996) ‘Making knowledge the basis of a dynamic theory of the fi rm’, Strategic Management Journal, 17(S2): 45-62.
34. Stevens, G.C. (1990). Successful Supply-Chain Management. Management Decision. Vol. 28, No. 8, pp 28-32.
35. Stoddard, D.B., Jarvenpaa, S.L., Littlejohn, M. (1996), “The reality of business reengineering”, California Management Review, Vol. 38 pp.57-76.
36. Svensson, G. (2006). Sustainable quality management: a strategic perspective. The TQM Magazine. Vol. 18. No. 1, pp 22-29.
37. Teece, D. (1998). Capturing value from knowledge assets: the new economy, markets for know-how, and intangible assets. California Management Review, 40(3): 55-79.
38. Zencke, P. (2004), “CRM after the hype: from front offi ce to one offi ce”, www.crm2day.com
PHARMACOECONOMICS IN THE PROCESS OF PHARMACEUTICAL... 215
PHARMACOECONOMICS IN THE PROCESS OF PHARMACEUTICAL MARKET REGULATION IN THE
REPUBLIC OF CROATIA
Dunja Maroni} - Filakovi}Pharma Swiss d.o.o. Zagreb
Maja Lamza - Maroni}Faculty of Economics in Osijek
Introduction
It is a well-known fact that the demand for drugs (and other goods) is always higher than the actual payment ability. In almost all countries in the world the expenses for drugs grow faster than GDP and make up 10-20% of total health care costs, i.e. 1-2% of GDP. The analyses conducted in the developed countries indicate that the increase in drug expenses is infl uenced mostly by the changes of the population’s demographic structure (aging of the population), chronic non-infectious diseases, and the dynamics of continuous introduction of new and increasingly more expensive drugs.
The use of drugs in the Republic of Croatia is too high and it is not rational, increasing the pressure of health care costs on the depleted state budget. In searching for the model of rationalization of drugs use, it is possible to apply a more rational pharmacotherapy and the recent fi ndings of pharmacoeconomics. Rational pharmacotherapy presupposes the use of the right drug in the right dose, at the right time, and at the lowest cost for the individual and the community. These are the principles based on which the Republic of Croatia prepares the measures for reducing the use of medicines. A decrease in unnecessary drug consumption would contribute to better functioning of pharmaceutical market, and the Croatian Institute for Health Insurance (HZZO) could make the payments to pharmaceutical wholesalers in a safer and a timelier manner.
Pharmaceutical market in the Republic of CroatiaThe Republic of Croatia has been facing extensive health care expenses since
the early 90ies, which pose a constant threat of the health care system crash. This has lead to the need of a thorough reorganization or re-engineering of the entire health

Dunja Maroni} - Filakovi} • Maja Lamza - Maroni}216
care system. The characteristics of the new system, which is still in the process of reorganization and re-engineering, are a more thorough application of health care economics, defi ning and application of health care standards, determination of ownership rights for each health care institution (town, county...), privatization of parts of the health care system, introduction of users’ participation in health care costs, additional health care insurance, and acceptance of the principles and a more dynamic application of pharmacoeconomics.
The reform of the health care system in the Republic of Croatia started with the centralization of health care funds, introduction of fi nancial discipline in collecting contributions, obligatory use of tenders that determine prices and/or suppliers for the largest part of health care expenses. The procurement of medical equipment has also been centralized and standardized, resulting in savings in procurement, and the same standard of equipment in health care institutions in the entire country.
Pliva (Zagreb) and Belupo (Koprivnica) are two largest Croatian pharmaceutical companies. Galenski laboratorij (Rijeka), Imunološki Zavod (Zagreb), and Zavod za transfuziju krvi (Zagreb) have smaller production of pharmaceuticals .
In the Croatian pharmaceutical market, the largest share is taken by Pliva d.d. (46%) and Belupo (18%), with sales of almost $20 million USD. The share of 20% taken by Slovenian producers Lek and Krka is a result of tradition and habit rather than better quality and price of their products. Over fi fty more pharmaceutical companies that have their local branches or agencies in Croatia are also part of the Croatian pharmaceutical market.
The trading process in pharmaceutics is strictly regulated. The process of drug and other medical products registration is especially strict, time-consuming and expensive. The Croatian Ministry of Health issues a special permit for importing drugs, without which it is not possible to clear the customs for imported drugs. Each series of imported drugs cannot be put on the Croatian market before they are issued a positive opinion by the Croatian Agency for Medicines and Medical Products. Local producers are allowed to control their products in their own quality control labs.
The main subjects in the pharmaceutical whole sale business are large drugs wholesalers. Drugs wholesalers are trading companies that supply health care institutions with medical supplies, drugs, and expendable medical supplies1. Drugs wholesalers are registered and work in line with the Law on Trading Companies. Drugs wholesalers are free to set their margins, prices and other sales conditions
1 Tipurić,D.,Perić,V. Temeljne odrednice konkurentne strukture hrvatske veledrogerijske djelatnosti, Poslovna analiza i upravljanje, 11/97. str..23-33.
PHARMACOECONOMICS IN THE PROCESS OF PHARMACEUTICAL... 217
for their products. As not only the price, but also the supplier for each product are determined using tenders according to the Croatian Law on Healthcare, the Ministry of Health with HZZO have the negotiating position, often dictating the conditions for doing business with drugs wholesalers.
Although drugs wholesalers make only 0.5% of all Croatian wholesalers, very high shares of whole sale drugs trade in the total income and total profi t in whole sale business in the Republic of Croatia confi rm that there are relatively few well positioned and funded companies.
Organizational positioning in drug trading in the Republic of Croatia makes it possible to distinguish between three types of drugs wholesalers: national drugs wholesalers, drugs wholesalers - focusers, and drugs wholesalers - differentiators. National drugs wholesalers (Medika, Medical Intertrade, Octal Pharma, Phenix) are the biggest and work in the entire Croatia. They offer all sorts of products and provide for all ‘classes’ of buyers. Drugs wholesalers - focusers (Medifarm, Jadranfarma, AdriaPharma, Unifarm) are active in certain regions of Croatia (Slavonia, Dalmatia), have a relatively wide product range, and focus only on particular buyers (pharmacies or community health centers), whereas drugs wholesalers differentiators (Hospitalija, Medias, Medicom) have only a clearly differentiated product range.
Market criteria in the fi eld of drug prices initiate prompt solutions for big price differences within EU member states on one side, and countries that will or have just become members of the EU. Since average prices of drugs in the Republic of Croatia are at 30% of prices in EU member states, the screening process calls for a fast and effi cient solution.
Merket regulation through pharmacoeconomics
Recent fi ndings in the fi eld of science and practice of investigating, creating, producing, selling, distributing, marketing and using drugs in pharmacy and medicine indicate that the funds used in both rich and poor countries are still insuffi cient to satisfy the population health care needs.
The well known slogan ‘health is priceless’ is in current market conditions challenged with the question ‘under which conditions?’.
This gives rise to a new scientifi c discipline – pharmacoeconomics.Pharmacoeconomics is a young, interdisciplinary scientifi c discipline seeking to
give answers to how to best use drug funds at our disposal.When the new drug was being registered ten years ago, effi ciency, safety and
acceptable quality had priority. They were taken as crucial in deciding whether the drug should be used at all and what was its position in relation to other drugs in the market that were used for same indications.

Dunja Maroni} - Filakovi} • Maja Lamza - Maroni}218
The development of pharmacoeconomics, i.e. the application of certain techniques of pharmacoeconomics analysis calls for the introduction of the ‘value for money’ criterion. Pharmacoeconomic analyses of drug effi ciency vs. price are part of the necessary standard specifi cations in most highly developed countries for the registration of new drugs. EU members are working on the system of drug registration mirroring those of Canada and Australia. These systems should be compatible and mutually transparent.
The essence of pharmacoeconomics is not only in saving, but also in re-distribution of limited funds, aiming for maximum effi ciency for the invested funding.
Seeking to fi nd the answer to the question ‘what do I give up in favor of something else?’2 (e.g. investments in heart transplants or inoculation of newborns, prevention of osteoporosis or cardiovascular diseases, the use of drug A or drug B for treatment of schizophrenia, etc.). Understandably, the increase of cost for one intervention or drug necessarily refl ects on the reduction of funds for another intervention (opportunity cost).
The use of pharmacoeconomics is now a reality in health care systems and pharmaceutical industry.
Examples:Australian Pharmaceutical Benefi ts Advisory Committee3 is in charge
of estimating economic legitimacy of proposed drug prices, thus making a pharmacoeconomic study an obligatory part of a registration fi le in case of:
introducing a new drug to the drug listregistration of a drug for new indicationsconsiderable increase of prices for listed drugs.In Canada, Drug Quality and Therapeutics4 proposes drugs to be listed to the
minister of health, and need to attach a study that confi rms economic legitimacy of a certain drug to the registration fi le.
Possiblites of pharmacoeconomic studies
Today there is a wide range of models and applications of pharmacoeconomic studies. The most popular are ‘piggyback’ studies, and studies of cost effi ciency.
2 Vrhovec,B.; Farmakoterapijski priručnik, Medicinska naklada, Zagreb, 2004.3 Bootman, JL.; Towsend,RJ.; Principles OF Pharmacoeconomics, Cincinnaty, Harvey Withney Books
Company, 1997.4 Stemeroff,M., Gagon JP.; The evolving structure of health economics, Scrip Magazine, 03/01.

PHARMACOECONOMICS IN THE PROCESS OF PHARMACEUTICAL... 219
The most frequent method of pharmacoeconomic studies is conducted together with clinical tests, piggyback studies, i.e. a questionnaire about necessary pharmacoeconomic data in the clinical studies protocol.5 The advantages of this method are in the timely collection of data on cost effi ciency. Additional data on quality of life (QoL) and preferred health conditions. They are conducted in strictly controlled conditions, not characteristic of routine medical practice.
Cost effi ciency studies6 are an alternative to piggyback studies. Such studies are specially planned for the analysis of cost effi ciency. As opposed to clinical studies, patients for the sample are selected using statistical tools, and are analyzed regardless of behavior (co-operation or withdrawal). The aim of a cost effi ciency study is to continuously compare the examined therapy with the regular practice over a certain time period. The advantages of this method are the analysis of everyday medical practice in conditions typical of the environment in which the costs are incurred. The disadvantages are the long duration and variations in medical practice, and the impossibility of simple comparisons of different national settings.
The model 7 obligatory elements of pharmacoeconomic studies in economic analysis are:
types of cost analysis - analysis of cost effi ciency, benefi t analysis, cost-effectiveness analysis (cost-benefi t analysis), and cost minimization analysisperspectives of analysis - society, patient, buyer, supplier of servicecost types - direct medical costs, indirect costs, unmeasurable costs
The models most frequently used in pharmacoeconomic studies can be classifi ed as:
clinical models for decision analysisepidemiological models.
Clinical models for decision analysis are based on medical practice. Clinical decisions are connected to interventions and are suitable for the analysis of cost effi ciency studies. Epidemiological models monitor factors and the development of a disease, giving transitional estimates of clinical procedure outcomes8.
5 Drummond, M., Economic evaluation of pharmaceuticals-science or marketing, Pharmacoeconomics, 1998.
6 Herrero, L.; Pharmacoeconomics- exploring the modeling option, Scrip magazine, 10/ 1994. str. 42-45.
7 Sikavica, P.; Bahtijarević-Šiber, F.; Management ljudskih resursa, Informator, Zagreb, 2005.8 Gold, M.; Siegel, J.: Cost effectives in health and medicine, Oxford, Oxford University Press, 2001.
str. 60-64.

Dunja Maroni} - Filakovi} • Maja Lamza - Maroni}220
An example of using pharmacoeconomics hypercholesterolemia
The link between the increased level of cholesterol and the development of coronary diseases is well known*. High cholesterol levels contribute to the development of coronary diseases. The increase of the level of cholesterol may be controlled by changing habits and using drugs. The pharmacoeconomic principle is applied in treating hypercholesterolemia.
Cost to benefit ratio for cardiovascular prevention
Table 1.
COST BENEFIT
DIRECTprevention program cost savings for insurance funds, individuals(detection, intervention, drugs) societyprice of false positive fi ndings cost of treatment, e.g. hear attackunnecessary interventions sick leave costs, help costsdisease monitoring price physical damages
INDIRECTlonger life costs better healthpension costs longer lifetreatment costs reduction of risks and illnessestherapy side-effects reduction of productivity decreaseaccommodation costs indirect effects of better health
UNMESURABLEpsychosocial price psychosocial benefi t of improvedof healthier living health (less pain, suffering and stress)(changes in diet, habits, activities)
Source: Rumbolt,Z.; Farmakoekonomika hiperkolesterolemije, Pharmaca, 1995.;33:1-2, Str. 39-40.
PROCAM Study9 used in the Republic of Croatia indicates that of 4800,000 people, 1500 die in the most productive age from coronary disease complications, and further 3,000 suffer from acute heart disease. Due to coronary diseases in the most productive age, over 22,000 years of life, and about 9,000 years of active work are lost.
The analysis of clinical tests has shown that the treatment of hypercholesterolemia in patients who had a stroke can reduce the incidence of non-fatal stroke by 25%,
9 Rumbolt,Z.; Farmakoekonomika hiperkolesterolemije, Pharmaca 1999;33:1-235-46

PHARMACOECONOMICS IN THE PROCESS OF PHARMACEUTICAL... 221
fatal stroke by 15%, and total death rate by 10%. In other words, out of 1,000 patients treated for stroke, 25 can be prevented with appropriate treatment. The success is unfortunately 75% lower in primary prevention.
The analysis of results obtained indicates that the cholesterol level can be decreased by 15% with dieting, and by 30% with regular use of medicines, thus preventing the incidence of 600 strokes in the active population, and about 200 coronary deaths a year.
The computer model programmed according to the data of the Framingham Heart Study by Goldman10 et al, calculated the cost of a year of saved life if certain classes of hyperlypidemics are prescribed the drug Lovastatin at 20 mg.
The cost of a yearly treatment with drugs (Simvastatin or Lovastatin) is estimated at about 3300,00 HRK. Results indicate that an annual prevention of a cardiovascular incident in secondary prevention costs about 85,000 HRK. A range of variants has to be taken into consideration.
Cost of a year of saved life (USD) with 20 mg of Lovastatin a day
Table 2.
primary prevention, age 35-44cholesterol 13 mmol/l, withoutother risk factors
Men Women
400,000 1.000,000
primary prevention of analogouspersons, with additional riskfactors (adiposity, smokingdiastolic blood pressure 95-104 mmHg)
81,000 220,000
primary prevention in heterozygoteswith family hypercholesterolemiaof the same age
$ 300
secondary prevention of coronopathyage 55-65, cholesterol 7 mmol/l $ 300
$ = costs become savings
The application of the Framingham Hear Study model indicates that the cost of a year of saved life is lower for men than women. As the CVD risk increases, the cost decreases, so for certain high risk groups it turns from cost to savings. Savings do not refer only to money; the prevention is cheaper than treatment, but also to saved lives that could not have been saved using available treatment. The therapy
10 Source: Rumbolt,Z.; Pharmaca,1999;33; 1-2,str.42.

Dunja Maroni} - Filakovi} • Maja Lamza - Maroni}222
should therefore be individualized. The higher the risk, the secondary prevention, i.e. therapy with hypolipidemics becomes not only ethically justifi ed, but also farmacoencomically cost-effective.
Conclusion
Kontinuitet praćenja dinamike okruženja u kojem živimo prati i povećana potreba uzimanja lijekova (kao i kod potrošnje drugih roba ), koja je u kontinuumu uvijek veća od platežno sposobne potražnje. Obuzdavanje troškova zdravstva ( health cost containment ) u prvi plan stavljaju mjere za obuzdavanje troškova za lijekove, koji prema podacima Svjetske zdravstvene organizacije variraju izmedju 10 do 66% cjelokupnih troškova za zdravstvo. Farmakoekonomika, kao znanstvena disciplina ekonomike zdravstva, sa stajališta farmaceutike pokušava dati svoj prilog rješavanju ovoga problema.
References1. Drummond M.: Cost of illness studies a major headache, Pharmacoeconomics,
1999;II2. Eisenberg JM: Clinical Economics – a guide of the economics analysis of clinical
practices,JAMA ,1999.3. Goldman L., Weinstein MC, Williams LW: Cost effectivness of HNG CoA
reductase inhibition for primary and secondary prevention of coronary heart disease JAMA, 1999.
4. Herrero LE: Pharmacoeconomics – exploring the modeling option, Scrip Magazine, 1994.
5. Hrastić- Novak, A., Jeniček,K: Analiza potrošnje lijekova u 2004. godini, www.hfd-fg.hr
6. Ontario Ministry of health and long term care: Ontario guidelines for economic analysis of pharmaceutical products, Queen s Printer for Ontario, 2000.
7. Tipurić D., Perić V.: Temeljne odrednice konkurentne structure hrvatske veledrogerijske djelatnosti, Poslovna analiza I upravljanje, 11/12. 1997.
8. Vukušić, I.: Kako smanjiti visoku potrošnju lijekova u Hrvatskoj?, Farmaceutski glasnik 60, 3/2004.
9. WHO, Medicine strategy, Framework of action in essential drugs and medicines policy 2000-2003, Geneva: WHO/HQ 2000.
10. Bergman V.: Izvješće o poslovanju HZZO-a u 2003.godini, Zagreb, 2004.
THE IMPORTANCE FOR THE APPLICATION OF PHARMACOECONOMIC... 223
THE IMPORTANCE FOR THE APPLICATION OF PHARMACOECONOMIC ANALYSIS IN THE PROCESS OF DRUG REGISTRATION IN THE REPUBLIC OF CROATIA
Sanja Popovi}, jurist Neven Ragu`, general practicioner
Danijela Mikuli}, general practicioner
1. IntroductionThe costs of healing in the most of the countries in Europe, as well as in the
whole world are increasing 7-10 % annually, and drugs are becoming the best sold product. This situation makes a burden for the state budget and the medical protection funds, so the way out is sought in applying rational pharmacotherapy, which has been introduced as one of the aspects of the possible solution for the present situation. A pharmacoeconomic analysis, while a new drug is being put on the market, enables better insight for justifi cation of application of certain product compared with the other product or treatment on the market.
We want to draw attention of ‘noneconomic’ staff for the importance of the pharmacoeconomic analysis and the objective reasons for using this method in the process of sending the medicine onto the market, because, fi nally, it results in the rational pharmacotherapy and cutting down the costs.
2. About drugs in general
Since the beginning of our days and the fi rst human beings, a man had tried to fi nd the way and means to reduce or eliminate pain. The history of producing drugs till nowadays has developed to unimagined proportions. Today, the drugs are a part of our everyday life and thus it is very important to have high quality drugs, which are effi cacious, safe and less damaging at the same time.
There are various defi nitions for a drug, the one according to The Act on Drugs and Medical Products defi nes the drug as any substance or mixture of substances intended for healing or preventing illness of people, and any substance or mixture of substances that can be used with people in order to regenerate, improve or adjust physiological functions or to reach a diagnosis.

Sanja Popovi} • Neven Ragu` • Danijela Mikuli}224
3. Agency for drugs and medical productsAgency for Drugs and Medical Products is a legal party with a public sanction.
It was founded on 01/10/2003 and it is a legal successor of the Croatian Institution for Drug Control and the Croatian Institution for Control of Immunobiological Preparations.
The Agency was founded by the Republic of Croatia, and the superintendence over its legislative is performed by a competent ministry, and at present it is the Ministry of Health and Social Care.
The main activity of the Agency is dealing with drugs and medical products according to the Law of the Republic of Croatia.
The Agency consists of the Managing Board, the director, the Board of Experts and the other bodies according to the Statute.
The role of the Agency is to actively improve prevention and promotion of public health by providing the medicine of high quality, effi cacy and harmlessness on the market of the Republic of Croatia, and by providing the public and medical workers with useful and clear information. It can be achieved by checking and evaluating the quality, and by laboratory testing before giving permission for selling (registration) of drugs, as well as by controlling the production, trade and usage of drugs and medical products, and by observing unwanted side-effects.
The Agency, taking the norms of the EU into account, as well as the skilful laboratory practice of the WHO, takes necessary actions to insure the proper control of drugs and medical products according to the standards, given conditions and high ethical principles.
CROATIAN INSTITUTION
FOR DRUG CONTROL
CROATION INSTITUTION FOR CONTROL OF
IMMUNOBIOLOGICAL PREPARATIONS
AGENCY FOR DRUGS AND
MEDICAL PRODUCTS

THE IMPORTANCE FOR THE APPLICATION OF PHARMACOECONOMIC... 225
4. Permission for selling the drug on the market
4.1. Procedure of giving permisson for selling the drug on the market
a) Request for getting permission
In the Republic of Croatia permission for selling drugs on the market is regulated by the Act on Drugs and Medical Products. The procedure of giving permission for selling drugs on the market is complicated, long-lasting and extensive task.
The request for getting permission for selling the drug on the market is addressed to the Agency for Drugs and Medical Products by the legal party with the residence in the Republic of Croatia. By giving permission for selling the drug on the market, the procedure of estimating quality, effi cacy and harmlessness of the examined drug is fi nished.
The permission is also given for radionuclide generators, radionuclide sets, radiopharmaceutical, radiopharmaceutical precoursors and industrially prepared radiopharmaceutical.
The following data and documents have to be enclosed to the request:
a) The name and the address of the request applicant, and sometimes, if needed, also of the producer,
b) the name of the drug,c) the facts about the quality and the content of all of the substances in the drug,
using international unprotected terms or, if this doesn’t exist, the other common term for those substances,
d) the description of the production,e) therapeutic indications, contraindications and side-effects,f) dosage, pharmaceutical form, way and procedure of usage, and expected validity
period,g) if necessary, the reasons for taking some extra precautions during storage, usage
and disposal of the drug, as well as all the possible dangers, that drug represents for the environment,
h) the description of the procedures used by producer to check the quality (quality and quantity analysis of active and supportive substances, of the drug, special tests),
i) results:– physical-chemical, biological and microbiological tests,– toxicological and pharmacological tests,– clinical tests,

Sanja Popovi} • Neven Ragu` • Danijela Mikuli}226
j) the summary of the description of the characteristics of the drug, the suggestion for outer and inner signing, and some samples of the packages of the drug, together with the instructions for the drug,
k) production permission of the producer,l) the copies of the permission given in the other countries and the list of the countries,
where the procedure of giving permission is already in progress; the copies of the summaries of the description of the characteristics of the drug, approved in the other countries or proposed in the procedure of getting permission in the other countries; the copies of the instructions for the drug, approved in the other countries or proposed in the procedure of getting permission in the other countries; the content of the decision and the explanation of the refusal for giving permission for selling the drug on the market in the other countries.
The documents given to the Agency are considered confi dential.
All the costs in the procedure for giving permission for selling the drug on the market are paid by the request applicant, and set by the Agency.
b) Term for getting permission
The Agency has to give or refuse the permission for selling the drug on the market within 210 days, starting with the day of receiving valid request, together with the decision on permission to the applicant, the Agency sends the approved Summary of the description of the characteristics of the drug. The decision on permission for selling the drug on the market is published in the Offi cial Newspaper of the Republic of Croatia, “Narodne novine”.
The permission for selling the drugs on the market is given for the period of fi ve years.
4.2. Short procedure of giving the permission for selling the drug on the market
The term ORIGINAL MEDICINE should be differed from the term HOMOGENEOUS MEDICINE. According to the Act on Drugs and Medical Products:
Original medicine is a medicine that was primarily approved for selling on the market in the world, based on the complete documentation on effi cacy, harmlessness and quality according to the existing requests.
Homogeneous medicine is a complete medicine, with the same substances in the same amount and in the same form, as well as the equal biodisposal/bioequivalency as the original medicine. The medicine is considered homogeneous even if it has a

THE IMPORTANCE FOR THE APPLICATION OF PHARMACOECONOMIC... 227
different pharmaceutical form from the other medicine of the same content (capsule/pill) prepared for the oral consumption, if it is not a form with controlled release of the active substance.
According to that, the short procedure for giving permission for selling the drug on the market is applied for:
a) medicine that is homogeneous with the same medicine of the original producer, under condition that the original producer of the medicine has the permission of selling the drug on the market in the Republic of Croatia or in some EU country more then six years ago, and that that medicine has been sold in the Republic of Croatia or,
b) medicine, that contains the active substance or substances that have the approved medical usage, tested effi cacy and harmlessness, judged by the thorough scientifi c facts from the literature or
c) medicine that is the same as the medicine of the original producer, when the original producer and the owner of the permission for the drug approved in the Republic of Croatia agree that their toxicological, pharmaceutical and/or clinical data on the original medicine, enclosed to their documentation, can be used in order to approve the request.
The request applicant in the case of short procedure doesn’t have to enclose the results of toxicological, pharmaceutical and clinical tests.
4.3. Renewal of the permission
The Agency for Drugs and Medical Products gives the permission for selling the drug on the market for the period of 5 years. The owner of the permission can ask the Agency for the renewal of the permission for selling the drug on the market, 90 days before the expiration at the latest.
The Agency has to give or refuse the renewal of the permission within 90 days starting with the day of receiving valid request.
4.4. Aleteration of the permission
For every alteration in the documentation, which the permission for selling the drug on the market is based on, the owner of the permission has to give the Agency a request for alteration of the permission.
The request must be made separately for each alteration, except when more alterations are a consequence of only one alteration.

Sanja Popovi} • Neven Ragu` • Danijela Mikuli}228
The Agency has to give or refuse the alteration of the permission within 90 days starting with the day of receiving valid request.
4.5. Withdrawal of the permission
If the owner of the permission for selling the drug on the market decides to suspend the production or to withdraw the medicine from the market before the expiration of the permission, he must inform the Agency six months ahead, except in the case of urgent withdrawal.
The urgent withdrawal of the drug from the market is ordered by the decision of the pharmaceutical inspector from the Ministry of Health.
4.6. Depriving of the permissionThe permission for selling the drug on the market will be taken away before the
expiration of the permission if it is found that:
– the drug sold on the market is against the Act on Drugs and Medical Products,
– the drug is unacceptably damaging, or not effi cacious enough in the given conditions for the usage,
– the content of the drug doesn’t match the given documentation in quality and quantity even with the request for the permission or alteration,
– the data in the given documentation are not correct,
– the data of the request applicant are not correct.
The depriving of the permission is published in “Narodne novine”.
5. Croatian health insurance agency anf the list of drugs of the croatian health insurance agency
Croatian Health Insurance Agency (“HZZO”), with the seat in Zagreb, Margaretska street 3, has been founded with the goal of executing the basic health insurance tasks, as well as executing other tasks related to the Act on Health Insurance from the year 2001, and the Act on Health Care from the year 1993.
The rights, obligations and responsibilities of HZZO are regulated by the Act on Health Insurance and the Statute of HZZO. The Statute of HZZO was passed by the Managing Board on 14/02/2001, it was confi rmed by the Government of the Republic of Croatia on the same day.

THE IMPORTANCE FOR THE APPLICATION OF PHARMACOECONOMIC... 229
The superintendence over the HZZO is conveyed by the Ministry of Health and Social Care. By the Act on Health Insurance the revision of HZZO is conveyed by the State Revision Agency. The HZZO is a part of the system of the State Treasury. Contributions for the basic health insurance are sent directly to the one account by the State Treasury and as such they are a part of the income of the State Budget. The State Budget remits payments directly to the hospitals for the performed medical services based on the contract signed with the HZZO, whereas the payments for the other medical care is remitted to the HZZO, that makes the other payments.
The HZZO offers also the additional health insurance according to the Act on Health Insurance passed in January 2002 in a form of a voluntary health insurance, and slightly changed in June 2002. By the end of the year 2002 the contracts for the additional health insurance was made with 725 532 policyholders.
The activities of the HZZO related to the basic health insurance, and since the year 2002 to the additional health insurance are immense, but we are going to present only one of those, and that is a conveying of the list of drugs of the HZZO.
The list of drugs of the Croatian Health Insurance Agency is conveyed by the Managing Board of the HZZO, after it has been proposed by the HZZO Committee for Drugs. The Managing Board of the HZZO has passed the Resolution on the list of drugs of the Croatian Health Insurance Agency during the meeting on December, 21 in 2004 and it has been applied since January, 17 in 2005. There are 2157 drugs on the List, and 256 out of them are magistrative preparations.
It should be mentioned that the Committee makes suggestions according to the following criteria:
medical: only drugs with already proved effi cacy and minimal side-effects can be proposed for entering the List,
quality: only high-quality drugs can be proposed for entering the List (proved by the experiment of bioequivalency),
economic: the price of the drug must be acceptable and related to the effect and
legal: the drug must be registered for usage in the Republic of Croatia.
The list of drugs sets the drugs that are used at primary, secondary and tertiary level of the health care.
Sanja Popovi} • Neven Ragu` • Danijela Mikuli}230
6. Application of the pharmacoeconomical analysis
In the previous chapters we showed the procedure of getting permission for selling the drug on the market. In the Republic of Croatia the great importance is given to the tests of effi cacy and harmlessness of the drug, which is the absolute priority when it comes to drugs. But lately, the pharmacoeconomic analysis is of no less importance.
The fact is that the new patented drugs are more expensive and a cause for growing medicine expenses in the developed countries, so we cannot fully ignore that fact in our country, but we also cannot ignore the unreasonable and out of date therapies, that raise the costs as well.
The procedure of setting the price of the drug for wholesale in the Republic of Croatia is regulated by the Regulations for the setting the price of drugs for wholesale and the way of informing about the wholesale prices. It is all according to the Act on Drugs and Medical Products, which states that the prices of drugs on the Croatian market have to be appropriate with the social policy of the Republic of Croatia, for reaching optimum in providing medicine for the health care of the population. According to the present Regulations the wholesale price of the drug must be set by the legal party with the residence in the Republic of Croatia that owns the permission for selling the drug on the market in the Republic of Croatia.
The Regulations state the following criteria for setting the prices of drugs on wholesale:
- comparison of the prices of the same medicine in the other countries,- the level of the compared prices on wholesale,- pharmacoeconomic study.
So, the Regulations ask for pharmacoeconomic study as well, as one of the criteria for setting the prices. But it hasn’t been stated what it really means and how it should be conveyed. The rules for details should be set for proper analysis. There is pharmacoeconomic analysis needed for setting the prices of drugs, but there is no such analysis needed for putting the drug on the List of the HZZO. It would be better to introduce pharmacoeconomic analysis as a condition for putting the drug onto the list of the State Insurance Agency. Thus, through this analysis, we get the insight, based on the real facts got on the spot, about the therapeutic value of the drug, the real costs of the usage and possible reducing of the costs, when compared with the other drug or treatment. It is logical that the Agency for Drugs and Medical Products could develop these researches and become the resource for the HZZO of such analyses and opinion about the producer.
The rational pharmacotherapy is one of the aspects of the possible solution for the present situation, and pharmacoeconomic analysis in the process of putting

THE IMPORTANCE FOR THE APPLICATION OF PHARMACOECONOMIC... 231
certain drug on the market provides better insight for justifying the application of the certain product compared with the other product or treatment on the market.
Pharmacoeconomic analysis provides us with economic analysis of all the aspects of the medical treatments, starting with diagnostics to the healing, and it also compares the relationship of the spent resources and given (added) quality.
Some countries introduced pharmacoeconomic analyses as a condition for putting the drug on the list of the drugs of the state insurance agencies, and we ask for such analyses at the Committee for Drugs by HZZO, but we do not have real studies in our region, but we use (even copy) the results from the foreign markets.
We believe that pharmacoeconomic analysis must be an obligatory document for explaining and defi ning the objective reasons of the new method or drug while putting it on the market, which leads to rational pharmacotherapy, which results in lower costs for drugs of the HZZO and lower costs for health care for each individual user.
Diabetes mellitus is one of the examples for the increasing number of patients in epidemiological proportions, which enormously increased the costs for the health care. The rational pharmacotherapy, which is supported by pharmacoeconomic analysis, seems to be the one of the possible ways of solving the problem that we are going to face in the future.
2000 god.:151 000 0002030 god .:
370 000 000!
Epidemija dijabetesa
If we apply this pharmacoeconomic analysis about diabetes in Croatia, we

Sanja Popovi} • Neven Ragu` • Danijela Mikuli}232
could explain it with the usage of the drug XY, the drug that consists of two active substances, which are used as monotherapy (drug X, drug Y) in treatment of diabetes. The price of the drug XY is almost the same as the sum of the prices of the drug X and the drug Y, but the fi nal results of the treatment are better, and side-effects are lower than when the drugs X and Y are used separately.
The similar example can be pointed out with another great public health problem, which is hypertension and its consequences (infarct, chronic heart suppression). Consumption of the drugs treating heart problems in Croatia is the highest in Europe. These drugs made 27% of the total consumption of drugs in the year 2001.
Artery hypertension is one of the most common reasons for visiting doctors in the most of the west European countries, 20-40% of all the consultations with the doctors. It is our wish to fi nd the cure with fast and constant antihypertensive result, low amount of side-effects and simple dosage. A French study compares the daily costs of treatment of different antihypertensive drugs according to ADTC (Average Daily Treatment Cost).
During observation the patients could choose to use their previous medicine, to use the new one or to combine the previous one with the new one. After 4 months the costs of therapies were checked and they tried to fi nd the cheapest therapeutic choice.
The other method (Hoerger and co.) of so called pharmacoeconomic modelling is the concept of 3-years long treatment of the patients with three sorts of different drugs. We took into consideration the costs of the drug, the costs of visiting doctors, controlling tests and procedures and the costs of healing side-effects. The patients who did not succeed to regulate their blood pressure with one of the therapeutic choices, they could choose the other one or combine any of the three offered drugs in the study. Finally, the results were checked and the most optimal treatment has been found.
With the example with HYPERTENSION RR – we will try to show how to measure benefi t got for the complication of hypertension (chronic heart suppression).
At fi rst by introducing the medicine the costs raise for certain amount of money. Later, on the other hand (research done in Great Britain, Germany and France) we get the decrease of costs due to the lower number of hospitalisations per patient, shorter period of hospitalisation, lower number of days spent in hospitals. The revision of costs showed that money has actually been saved. The research has been done this way that a certain group of patients was treated with the drug HYPERTENSION RR, whereas the other group got placebo. So, in pharmacoeconomic analysis we should include all the costs of the treatment of the patient, and not only the price of the drug.

THE IMPORTANCE FOR THE APPLICATION OF PHARMACOECONOMIC... 233
Consumaption of the drugs taking the efficacy into account - 20 most prescribed drugs in the year 2003
050000
100000150000200000250000300000350000400000450000
HEART ANDCIRCULATORY
SYSTEM
SYSTEMINFECTIONS
DIGESTION NERVOUSSYSTEM
BONES ANDMUSCLES
edicine
cost
s * 1
000
kn
The number of patients in the world 2000 - 2030
1985
1990
1995
2000
2005
2010
2015
2020
2025
2030
2035
1 20
50000
100000
150000
200000
250000
300000
350000
400000
period number of patients

Sanja Popovi} • Neven Ragu` • Danijela Mikuli}234
The amount of 60% of the costs for the treatment of only one epidemic illness, which can be infl uenced by prevention is pretty impressive and important. So, with these facts we would like to point out very great and important role of pharmacoeconomic analysis as a condition for putting the drug on the list, as well as the great importance of the studies that could be conveyed on our market.
The number of patients in Croatia 2000 - 2030
19851990199520002005201020152020202520302035
1 2214000
216000
218000
220000
222000
224000
226000
228000
230000
number of patients period
The needs for the health care induced by the growing population, various epidemics, ecological catastrophes, natural disasters are growing every day, and so grow the costs of healing in the whole world, so, in Croatia, too. The HZZO in its fi nancial report for the year 2003 informed that the costs for the drugs were 21% of the whole costs, or 2.6 billion kunas, while in the developed countries the costs make 10 – 15% of the whole amount. These facts are rather worrying and thus we have to increase the rationality on the local, national, but also international level.

THE IMPORTANCE FOR THE APPLICATION OF PHARMACOECONOMIC... 235
Costs for the prescribed drugs in the year 2003.
1515
15
21
0 5 10 15 20 25
Australia
USA
Western Europe
Croatia
%
7. Conclusion
Pharmacoeconomic analysis is not only the comparison of prices of two products, but the whole process includes far more complex methods and it is a result of multidisciplinary cost benefi t analyses.
The expected growing of population, and the average life-expectancy set the new challenges for the public health organizations, which don’t know yet, with their poor health budgets, especially in the transitional countries, how to cope with it.
One of the solutions for the present situation, except the prescription of the generic drugs, is introducing the participation of the patients for buying drugs, abandoning the additional health insurance (in the year 2003 there were 2 100 000 patients, whose costs were covered absolutely by the HZZO), and also the applying of the pharmacoeconomic analysis, which should be the task for the most eminent experts to research, explore and measure. Unfortunately, in Croatia there are not many cases of own researches, but the foreign results have mostly been used, and they are not completely applicable and comparable because of the certain disparity (price of drugs, health services, income, GNP).

Sanja Popovi} • Neven Ragu` • Danijela Mikuli}236
Literature
1. The Act on Drugs and Medical Products («Narodne novine» nr. 121/03, 177/04)2. The Regulations for the setting the price of drugs for wholesale and the way of
informing about the wholesale prices («Narodne novine» nr. 87/2004)3. Pharmaceutic magazine, Croatian pharmaceutical society, Zagreb Croatia, 3/2004,
pp. 98-104. http://www.mef.hr/katedre/socijalna/organiz/lijekovi.htm, Datum:10/08/2005,
21:03:285. http://www.hzzo-net.hr/informacije/POTROSNJA_LIJEKOVA.pdf, Datum:
05/09/2005, 22:00:246. HZZO fi nancial report for the year 2003; http//www.hzzo-net.hr7. Delea TE, Vera Llonch M, Richner RE Fowler MB,
Oster G. Cost effectiveness of carvedilol for heart failure. Am J Cardiol1999;83:890-6
8. CIBIS-ll Investigators ane HealthEconomics Group. Reduced Costs with Bisoprolol Treatment for Heart Failure.Eur Heart J 2001;22:1021-31

A 237
ADJUSTMENT OF PUBLIC ADMINISTRATION IN EU ASSOCIATION PROCESS
Keda~i} Anita, Kne`evi} Sandra, Maru{i} Marina, Medverec Hrvojka, Veir ZdenkoFaculty of Economics in Osijek
Postgraduate study: Management
Summary
The object of this work is to show the present situation of public administration in Croatia concerning the process of Association to European Union and to defi ne in which direction the further adjustment have to go. Namely, Croatia has by signing the Agreement of stabilization and association started a number of great adjusting of legalization with EU legal acquest, and great changes is nearly all parts of social and managing life. One of the most important bearer of stated changes is surely the public administration. It’s importance is additional empfahized by Madrid criterion too, that is, administrative criterion for the state candidates. Public administration will be defi ned as the main bearer of all changes, and the success of all reforms is based on successful reform of public administration.
During investigation of the present statement and sugestions for the future adjustments, we investigated the present statement in negotiations of accession between Croatia and EU for the reason that they defi ne the direction and the way of adjustment process. In Croatia the monitoring is present from the moment of request, and the results are carefully controlled and are published as returning informations and measurement for further process. Furthermore, the Government and Ministry for Foreign Affairs regulary publish the reports of achieved reforms and national programs which on the best way show the position of Croatia in the complette process. Everything stated before make the fi rm base for evaluation of the present, and the proposal for improvement of the statemnt.
Instead of results, we can conclude that the process of reform of public adminsitration is nenecesary and it is the last time to do it. For the reason that the process of accommodation lasts some time, it can be said that the formal steps are present, but it is not even enough, because there is lack practice, and the time is shorter and shorter.
Key words: association to EU, public administration, memebership criteria, reform of public administration, condition for membership, governance, tax system, health sector, energetics, references

Keda~i} Anita • Kne`evi} Sandra • Maru{i} Marina • Medverec Hrvojka • Veir Zdenko238
1. Introduction
Among other conditios which Croatia has to fulfi ll to become the memeber of EU, there is a request for reforms of public administration. Home objective of reforms of public administration are the same as criterions for membership which demands European Union, and they are based on effi cacity of institutions which have to enable the right function of market economy and respect the fundamental principle of domocracy. Reform is engeged in
legalization of public administration, its managing structures and strenghtining of capacity which are needed for better functioning and more efi cacious public administration. That what is important to emphasize is the importance of such reforms, without respect to negotitations of association to European Union and the dynamics to the complete process.
To reach the niveau of development and on this way to realize the economical prosperity and progress, Croatia has to perform the reform of public administration, that is reform of greater systems where the authority and administration have effect on each other.
The fi rst part of the work gave a short summary of relation between Croatia and EU, and the conditions and criterion which were defi ned by Stabilization and Association Agreement, as the fi rst contracted relation between Republic of Croatia and EU, concerning public administration.
The second part showed the present situation and organization of public administration in Croatia with special review on lack in functioning and organization of public administration, and references in which direction the reforms of public administration have to go.
Further, there is a description of separate sectors of public administration and that is the tax system, health sector and sector of energetics of Croatia.
2. Relations between Croatia and European Union
The plan of EU is performing of common foreign and security policy which purpose is:
- protection of fundamental interests and common value of Union- strenghtening of Union security and its memeber states- strenghtening of international security and preserving of peace- development and strenghtening of democracy, legal state and respect of human
rights and fundamentals of freedom- stimulating of international cooperation.
239
Request for membership in EU can submit each european state which is constituted on the principle of freedom, democracy, respect of human rights, fundamental freedom and rules of justice. Three criterions are stated (so-called Criteios from Copenhagen) which all future memebers have to fulfi ll before admittance in complete juridical membership of EU1:
1. POLITICAL: stability of institutions which ensure democracy, rules of justice, respect of human rights and right of the minority and accept of political goals of Union;
2. ECONOMIC: existing of effi cacious market economy
3. JURIDICAL: adoption of compelte juridical acquest of EU.
There is also the fourth criterion by which effi cacious performing and application of juridical acquest of EU will be insured:
4. ADMINISTRATIVE: adaption of correspondiong administrative structures with goal to insure the conditions for gradual and harmonious integration.
By request for membership starts the process for reviewing of state capability, which requests to be member of EU. Making distinction to present states–candidates, which fi rst signed the agreement of cooperation, and after that the agreement of association, EU has to the states included into process of stabilization and association-Albania, Bosnia and Hercegovina, Croatia, Macedonia, and Serbia and Monte Negro immidiately offered the new generation of Eurpean agreement –Stabilization and Association Agreement.
Republic of Croatia and EU established relation by international acknowledgement of Republic of Croatia as independant and sovereign state on 15th January 1992. The most important step in the process of approaching of Republic of Croatia to EU was on 29th October 2001 by signing the Stabilization and Association Agreement. Republic of Croatia got on this way the status of associated memeber and potential candidate for membership in EU. Furthermore, it is the fi rst state which has complete program of addoption to the standards of EU. National program for association to EU for 2003 the government of Republic of Croatia accepted on 12th December 2002.
Entry to EU and NATO and promoting of policy good-neighbourgh are the base foreign policy goals of Republic of Croatia. By status of candidate Croatia will have the right of use of means from Funds of EU2.
1 Croatia on the Road to the EU: From Candidacy to Membership, Ministry of Foreign Affairs and European Integration, second extended edition, Zagreb, 2004.
2 Fifth enlargement of EU: 2004., Ministry of European Integration, Zagreb, 2005.
A

Keda~i} Anita • Kne`evi} Sandra • Maru{i} Marina • Medverec Hrvojka • Veir Zdenko240
After fi nished negotiation in all parts of juridical acquest of EU, there are 31 of them, Croatia will be permited to entry EU. There is stated time for negotitaion about membership, and it depends on performing of fundamental reforms on the area of law, economy, policy and administrative structures in the state. Owing to the Process of Stabilization and Association for West Balkan, EU has the frame for dialogue of civilian society with Croatia. At the same time bilateral activities between Croatia and other state – members of EU are stimulated.
Council for stabilization and association is constituted according to Stabilization and Association Agreement between Croatia and EU, and is valied from 1st February 2005.
The Council for stabilization and association (common constitution of EU and Croatia) respects the achieved macro economical stability in Croatia, and emphasizes that Croatia shlould continue with fi skal consolidation. Council stated that the continuation of perfomirng of reforms program should enable Croatia to be on line with competative pressure and market power inside Union in medium-term. EU respects the efforts which Croatia does on business area, minority rights, returning of refuges, regional cooperation, and emphasizes again that the full cooperation with the Hague Tribunal is a “very important” prerequisite for opening of admission negotiations3.
Croatia has clear promise to start the negotiation about memebership in EU as soon as the full cooperation with Hague Tribunal exists, and the problem of refusing of European constitution of referendum in France and Netherland will have no infl uence on its further memebership. Association to EU results important and permanent enlargement of competition on inland market and Croatia has to do everything to use the period of negotiation of association to preparte itsef as better as posible.
The most important goal ist to be good prepared for memebership in EU. For that reason Croatia has to perform the deep reforms to satisfy agreement of stabilization and association to be able later to cary the burden of membership. One of reforms ist the reform of public administration where the priority has to be stated, the plans of activities must be elaborated and the performing of the same must be resoluted.
There is optimism that the negotitation can start in autmn 2005.
3 www.htnet.hr/fset.html 26.04.2005.

241
3. Adjustment of public administration
Croatia started with the process of adjustment to European Union demands after signing up the Stabilization and Association Agreement (further: SSA). Today, inadequacy is clearly visible in the functioning of the whole project. The main cause of obstruction is public administration in Croatia which should carry out the whole process. The fact is that whithout the public administration effi ciency in implementation of changes and reforms, there can´t be effi ciency on any other level. As a confi rmation, conlusion of International Monetary Fund (further: IMF) states that rose in the quality of institutions will result in rose of the gross domestic product per capita (GDP/per capita) in apsolute and relative fi gures and in more stabile economic growth (IMF, 2003.).
Starting point of every reform is a review of the present situation. Although authors use different terminology when defi ning the conception of public administration, it could be defi ned as institutions for enforcing legal rules, especially those which perform “positive” actions on the state level, as shown in table 1 (Boromisa, 2004.).
A

Keda~i} Anita • Kne`evi} Sandra • Maru{i} Marina • Medverec Hrvojka • Veir Zdenko242
Table 1: Public administration in Croatia*
State administration Other institutions
Ministries ofState
Administrative Organizations
Central State Administrative
Offi ces
Offi ces of the Government Public sector
- fi nance- interior- Foreign Affairs
and European Integration
- Defence- the Economy,
Labour and Entre-preneurship
- the Family, Veterans Affairs and Inter-generational Solidarity
- Culture- Agriculture,
Foresty and Water Management
- the Sea, Tourism, Transport and Development
- Justice- Environmental
protection, Physical Planning and Construction
- Science, Education and Sports
- Health and Social Welfare
- State Geodetic Directorate
- State Institute of Radiation Protection
- Meterological and Hydrological Service
- State Offi ce for Nuclear Safety
- State Intelectual Property Offi ce
- State Bureao of Metrology
- Central Bureau of Statistics
- State Inspector´s Offi ce
- National Protection and Rescue Directorate
- for the Development Startegy
- for e-Croatia- for State
Property management
- for PublicAdmini-stration
- Offi ce of the Prime Minister
- for Public Procurement
- for Human Rights
- for Natonal Minoities
- for Public Relations
- General Adminis-tration Offi ce of the Croatian Government and Parliament
- for the Protocol- for Gender
Equality- for Social
Partnership- for the
Prevention of Drugs Abuse
- for Cooperation with NGOs
- for Internal Supervision
- Legislation Offi ce
- for Succession Settlement
- Agency for Export and Investment Promotion
- Agency for the Protection of Market Competition
- Agency for the Supervision of Pension Funds and Insurance Companies (HAGENA)
- Agency for Transactionsand Mediation in Immovable Properties
- Center for Human Rights- Central Register of Insured Persons
(REGOS)- Croatian Academic and Research
Network (CARNet)- Croatian Agency for Small
Business- Croatian Demining Centre- Croatia Employment Institute- Croatian Hydrographic Institute- Croatian Information and
Documentation Referal Agency- Croatian Institute for Health
Insurance- CroatianPension Insurance Institute- Croatian Privatization Fund- Croatia Securities Commission- Environment Agency- Export and Investment Promotion
agency- Financial Agency (FINA)- Fund for the compnsation of
expropriated property- State Agency for Deposit Insurance
and Bank Rehabilitation- State Institute for Nature Protection
* Local self-government not included
Source: www.vlada.hr
There are no rules about how big and organized the public administration of the one country should be. However, at the beginning of negotiations, EU provides only fundamental guidelines and criteria about the organization of public administration. After the current condition screening and actual problems defi ning, recommendations

243
are more detailed and on specifi c terms of every conutry based. At the same time, EU implement standards and criterion for monitoring of the whole process. That’s how the timely control allows fast reaction in dealing with problems.
3.1. Governance vs. Public administration
Governance is a term which is being used in the context of Government effi ciently and state managing. Ahrens (Ahrens in Bađun, 2004.) defi ne governance as the capacity ot the formal and informal institutional environment to apply and carry trough a given government policy and to improve coordination in the private sector.
The linkage between governance and public administration is in their interdependency; public administration is only one of the protagonist of governance and the success of the governance, amongst other, depends on effective public administration.
Since the governance is a hard to measure, the quality of governance is assessed according to the following indicators:
� rule of law� democracy� freedom of the media� coruption� political stability.
3.2. Conditions for the accession to the EU
The Copenhagen criteria for full membership in the EU stipulate:
1. stability of intitutions that provide for democracy, rule of law and order
2. ability to take on the obligations that are entailed by the Stabilization and Accession Agreement.
At the same time, EU provides fundamental gudielines aout the way on which Croatia can accomplish that. It also give fi nancial support in accession programs form, depending of programs and purpose which are being fi nanced. Concerning governance, EU gives principles of a good governance4:
4 Bađun Marijana: Governance and public administration in context of the EU accession, Institute of Public Finance, 2004., page 129
A

Keda~i} Anita • Kne`evi} Sandra • Maru{i} Marina • Medverec Hrvojka • Veir Zdenko244
• "openness in public comunication and transparency• citizen participation in political issues• rose of responsibility for the politicians• effi ciency in political management."
Concerning public administration, only general instruction are given, but it is strongly emphasized that the public administration should carry out and will be responsible for all the reforms and changes in society.
European Commission, in the SSA, has clearly identifi ed the public administration reform as one of the areas to which resources from the CARDS assistance programme will be direct. For the 2001.-2004. period, 23 million euros have been earmarked for assistance to the reform of the public administration, which includes:5
• "improving the legislative framework regulating the work of puplic administration, the aim being to achive as great transparency in hiring, promotion and the salaries system as possible,
• enhancing the institutional capacities of the Ministry of Justice, Administration and Local Self-Government and other institutions curcial for the management of puplic administration,
• professional further training of civil servants."
3.3. Valuation of Croatia’s public administration
Valuation of current state of affairs in public administrationis made out trough the Croatia´s success in fulfi lling politacal, econimic and legal criteria. State of affairs in public administration and progress of public administration is based on European Commission´s reports. Those reports are based on the Croatian comparison with other candidate countries (table 2).
5 Bađun Marijana: Governance and public administration in the context of Croatian accession to the European Union, Institute of Public Finance, 2004., page 131
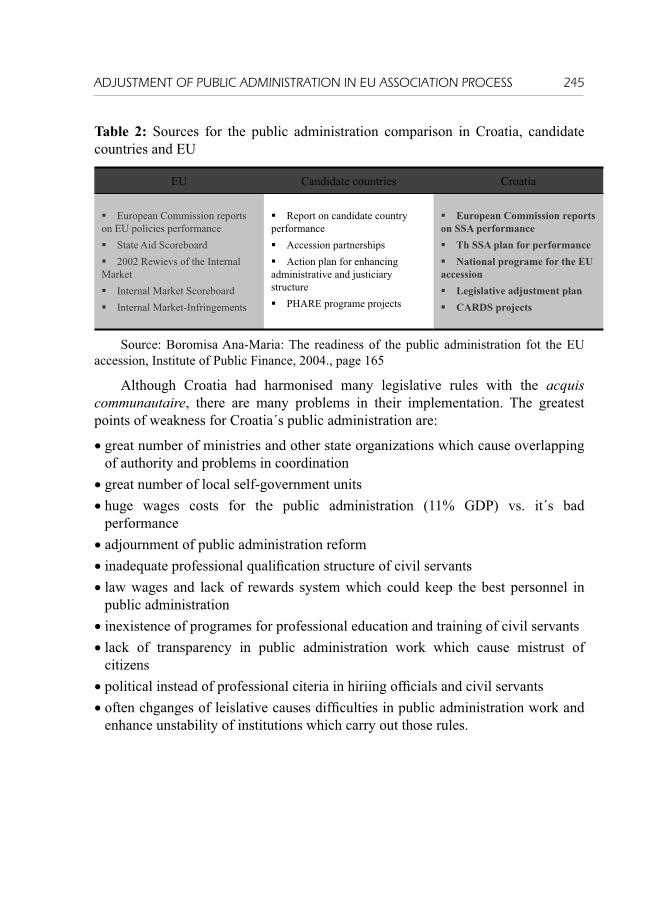
245
Table 2: Sources for the public administration comparison in Croatia, candidate countries and EU
EU Candidate countries Croatia
� European Commission reports on EU policies performance� State Aid Scoreboard� 2002 Rewievs of the Internal Market� Internal Market Scoreboard� Internal Market-Infringements
� Report on candidate country performance� Accession partnerships� Action plan for enhancing administrative and justiciary structure� PHARE programe projects
� European Commission reports on SSA performance� Th SSA plan for performance� National programe for the EU accession� Legislative adjustment plan� CARDS projects
Source: Boromisa Ana-Maria: The readiness of the public administration fot the EU accession, Institute of Public Finance, 2004., page 165
Although Croatia had harmonised many legislative rules with the acquis communautaire, there are many problems in their implementation. The greatest points of weakness for Croatia´s public administration are:
• great number of ministries and other state organizations which cause overlapping of authority and problems in coordination
• great number of local self-government units• huge wages costs for the public administration (11% GDP) vs. it´s bad
performance• adjournment of public administration reform• inadequate professional qualifi cation structure of civil servants• law wages and lack of rewards system which could keep the best personnel in
public administration• inexistence of programes for professional education and training of civil servants• lack of transparency in public administration work which cause mistrust of
citizens• political instead of professional citeria in hiriing offi cials and civil servants• often chganges of leislative causes diffi culties in public administration work and
enhance unstability of institutions which carry out those rules.
A

Keda~i} Anita • Kne`evi} Sandra • Maru{i} Marina • Medverec Hrvojka • Veir Zdenko246
3.4. Recommendations for public administration reform
Because of the SSA, deadlines for the ajustments are close. Need to conduct public administration´s reform is urgent. Although public admnistration reform ione of the most important in the whole process, it isn´t the only one. That means that all reforms have to be comprehensive and have to be carried out even without EU accession process. It is very important that the citizens of Croatia take part in the whole process in order to achive transparency and trust in rule of justice and public administration.
Institue of Public Finance, independent and professional research institution, observe accession process from the point of public fi nance and from the econimical, legal and institutional perspective. Intitute of Public Finance published recommendations for the public administration reform as a part of the Croatia´s monitornig project for the year 2004. 6
Recommendations consist of steps which have to be taken with the purpose to strenghten public administration, as follows7:
• "strenghtening the rule of law• depoliticisation of the public administration• opening up towards the public• increased motivaton of civil servants for their work• additional criteria for promotion in the civil service• suppression of corruption• development of new culture among civil servants• education and traininghigher quality work from offi cials• debureaucratisation• monitoring the quality of governance.“
It is importan to emphasize that previously stated recommendations are concerned with not only public administration but the all other sectors included in the SSA.
The whole accession process late in comprison with the other candidate countries. One of the reason for that is unexistence of clearly defi ned development strategy for the public administration. The second reason in in lack of instruments for measuring effectivness of public administration. Ther is also constantly present
6 Ott K.: Croatian Accession to the EU: institutional challenges, Institute of Public Finance, 2004.7 Bađun Marijana: Governance and public administration in the context of Croatian accession to the
European Union, Institute of Public Finance, 2004., page 150

247
problem with the fi nancial means. All this should be guideline for the Government and all the pople and institutions included and responsible fo the forthcomming public administration reform.
In a proceeding of this paper, examples from some sectors of public administration (health system, tax system and energy sector) will be represented in a consideration to the public administration reform.
4. Adjustment of the croatian tax system
Accession of Croatia to EU brings transfers from the EU budget, but it also brings the loss of customs revenue and the need to adjust the structure of tax revenue. Harmonisation of the Croatian tax system with EU guidelines could bring us new revenues from excises (on mineral oils), and due to the harmonisation of the customs system a reduction of revenue is expected because of payment one part of the customs duty in the EU budget.
A part of budget revenues from value added tax (further: VAT) and customs duty will be channelled off in the EU budget, and at the same time a space will be opened for the increase of certain kinds of revenues (excises). As a counterbalance to this net drain there will be transfers from the EU budget into our national budget.8
Croatian tax system is, after the achievement of independence of Croatia, comparable with tax systems of the EU members. All the essential taxes conceptually correspond to the same kinds of taxes of EU member countries. However, there is still space for adjustment, before all the adjustment of value added tax witch is desirable to be carried out as soon as possible. Income tax doesn’t need adjustments because it is allowed for the members to settle the taxation of income in their countries on their own but with respect to the fundamental principles of the single market (the free movement of goods, people, services and capital). In the area of profi t tax and some rates of excise duties, the maintenance of the current situation is in the interest of Croatia, therefore their adjustments should be postponed until the moment when they will have to be done because of the accession to the EU.
4.1. A share of tax revenues in GDP
A share of tax revenues (including contributions) in GDP, in most countries of the EU, during the 1990s, was continuously rising, and it rose from 39% of GDP in 1990 to 42% of GDP in 1999. Reasons for this tax increase are larger expenditures
8 Cuculić J., Faulend M., Šošić V.: Fiscal aspects of accession: Can we enter the European Union with a budgetary defi cit?, Institute of Public Finance, 2004, pages 47-73.
A

Keda~i} Anita • Kne`evi} Sandra • Maru{i} Marina • Medverec Hrvojka • Veir Zdenko248
for retirement and health insurance and for public welfare, and also an increase of interest rates and increased governmental aid for government owned corporations.
From 1994 to 1999, tax revenues in Croatia came on average about 44,3% of GDP. A large jump of a share of tax in GDP is in 1998 when VAT was introduced, as it’s shown in picture 1.
Picture 1: A share of tax revenues in GDP in Croatia in 1994-1999
4042444648
%
1994 1995 1996 1997 1998 1999
A share of taxrevenues in GDP
Source: Arbutina H., Kuliš D., Pitarević M.: Comparison and harmonisation of the Croatian tax system with the tax systems in the European Union , Institute of Public Finance, 2003., page 86.
Croatia was in the 1999 collecting 18,5% of GDP from turn-over tax, and only 7,6% of GDP from income tax and profi t tax. However, the problem is that Croatia is collecting a great percentage of GDP via contributions: in 1999 13,6% vs. 11,4% in EU in 1998.9
4.2. Income tax
In most of EU countries there is a cut in the highest rates of income tax and a reduction in the number of brackets for the taxation of the income of natural persons. Since a basic goal of the EU is reduction of tax burden, in comparison to the average of EU counties, Croatia has the lowest maximum rate of income tax and smaller number of tax brackets. From that, it can be concluded that the rates and the number of brackets of income tax in Croatia in harmony with the goals of the EU.
9 Arbutina H., Kuliš D., Pitarević M.: Comparison and harmonisation of the Croatian tax system with the tax systems in the European Union , Institute of Public Finance, 2003, page 87.

249
4.3. Profit tax
During 1990´s in the EU there was an expanding of a base in profi t tax because of abolition and reduction of some tax incentives and reduction of a basic rate of profi t tax.
In a period from 1994 until today in Croatia, the profi t tax rate has been reduced from 35% to 20%. Regarding the member counties, only Ireland within the EU has a lower rate of profi t tax (16%) than Croatia, so it seems that Croatia has achieved the basic goal of the EU-reduction of tax burden better than most countries in the EU, and even before she became a member.
With profi t tax, there are problems with corporate taxation. First problem is that dividends that a subsidiary company from one member country of the EU pays to its main company in another member county are taxed twice because both countries are taxing it. Second problem is a double taxation burden as a consequence of corporative restructuring of companies which are tax payers in different member countries. Both problems are resolved on the EU level with two directives: The parent – subsidiary directive and Merger directive10.
4.4. Value added tax
During the 1990s in the EU there is an increase of standard rates of VAT. In Croatia VAT was introduced in 1998 and there was no changes in amount of the standard rate, but there was changes in a zero rate taxation. Standard rate of VAT in Croatia (22%) was in 2002 higher than the unweighted average of 15 EU countries (19,47%).
The key regulation of the EU in the area of the harmonisation of taxation of consumption with implementation of a general consumption tax is so-called the Sixth directive which prescribes three levels of tax rates: a standard rate which may not be lower than 15%, one or two reduced rates for good that are stated in annex (H) which may not be lower than 5% and the zero rate. The original concept of Croatian rules in regulating tax rates – one-rate system with a zero rate and refunding of pre-payment of tax only for export, and even with today’s regulations on tax rates, Croatia is fi tting into regulations of the Sixth directive.
However, there must be certain harmonisation regarding the tax exemptions. The comparison with the provisions of the Sixth directive shows that there are three groups of exemptions:
10 Arbutina H., Kuliš D., Pitarević M.: Comparison and harmonisation of the Croatian tax system with the tax systems in the European Union , Institute of Public Finance, 2003, pages 90-93.
A

Keda~i} Anita • Kne`evi} Sandra • Maru{i} Marina • Medverec Hrvojka • Veir Zdenko250
1. tax exemption which is consistent with the provisions of the Sixth directive (a rent of the residential property)
2. tax exemptions which aren’t consistent with the provisions of the Sixth directive (banking services and insurance services)
3. tax exemptions which are partially consistent with the provisions of the Sixth directive (other exemptions inside the country).
The Sixth directive prescribes that banking and insurance services are exempted from VAT irrespective of who performs them, while Croatian VAT law prescribes that exemption exists only if those services are carried out by given institutions (banks, savings banks, saving and loan organisations, insurance and reinsurance companies) and that is discriminatory towards the companies that also carry out these services but they aren’t exempted from the tax by the law. Further, the Sixth directive prescribes the right to be exempted to all institutions that carry out activities of organising special games of chance, preschool education, elementary, secondary and tertiary education, culture, health care, welfare and religious services, while in Croatia that right has only those subjects that are founded according to the Institutions Act and if they are fi nanced from the Budget.
So it’s obvious that those exemptions should be harmonised with the solutions from the Sixth directive.
4.5. Excise duties (special taxes)
In the EU counties a various number of products are taxed by excise duties, but common for all countries is the taxation of alcoholic beverages and beer, tobacco products and mineral oils. From 1994 to 1999 in Croatia were introduced eight excises, but the number of excises is still smaller from the number of excises in most of the countries in the EU, where in some countries up to 20 various products are taxed by excises.
A share of excise revenues in tax revenues in Croatia is almost 80% bigger than the average in EU counties. In Croatia producers and importers are paying excises duties. Excises which are common defi ned for the EU countries have been introduced into Croatia too, and they are representing the most important excises that collect almost 90% of excise revenues.
There are some differences from the EU regulations due to excise taxing, and they are: lower rates (except for beer) then those in EU, and unharmonised categorisation of products (alcohol and mineral oils) which should be harmonised with the EU directives.11
11 Arbutina H., Kuliš D., Pitarević M.: Comparison and harmonisation of the Croatian tax system with the tax systems in the European Union, Institute of Public Finance, 2003, pages 95-101.

251
4.6. Refferences
It can be stated that the total tax burden in Croatia is greater than in EU countries. It means that it should be reduced by reducing the contributions which are greater in Croatia than in EU countries or in the OECD countries. A basic condition for continuous reduction of tax burden is a reduction of expenditure of the national budget, and that mostly refer to solving the problems in retirement and health funds. Reform of those funds has a big part in a reduction of national expenditure and that would allow a reduction of tax burden.
In the area of income tax and profi t tax, Croatian tax system is harmonised with the tax regulations and changes in the EU, so we shouldn’t introduce more income tax rates or lowering a profi t tax rate. For VAT some changes are necessary in connection with tax exemptions. Also, a standard VAT rate should be reduced and new VAT rates shouldn’t be introduced. The regulations regarding excises are mostly harmonised with the demands of the EU. Exemptions are some lower tax rates than the minimum EU tax rates, and that is also a problem within the Union itself because member counties apply different rates for same products. Croatia has established a system of excise taxation which with its concept equivalents with the EU, and it will be rather easy, when it is necessary, to harmonise to European standards.12
5. Adaptation of health system of Republic of Croatia
The health of citizen today can be taken as indicator of life standard of some country, that is, region, and the development of public health service becomes one of the most important goal of each economic developed economy. We live in the time when, for the reason of process of globalization arise different political and economic association which fundamental purpose is to enable to the members of such assotiation to achieve some common goals. One of this association which Croatia wants to reach is EU. To do the best preparations for admission to such integration, one of many reforms which has to be performed is surely the reform of public health service which is suported by United Nations through Health organization which health policy from 2000 was addpopted also by us in the frame of national health policy.
To direct the process of reform, the fi rst thing is to defi ne the organization of Croatian public health service and to show the fundamental problems of our public health system, and accordingy, to fi nd out the strategy for its settlement. A team of specialists is established for this purpose, and gathered the whole range of interdisciplined specialists concerning this area.
12 Ott K., Kesner-Škreb M., Bajo A., Bejaković P., Bubaš Z.: The Economy of Public sector-situation, problems and possible solutions, Institute of Public Finance, Newsletter, No. 4, 2000., pages 19-27.
A

Keda~i} Anita • Kne`evi} Sandra • Maru{i} Marina • Medverec Hrvojka • Veir Zdenko252
The vision of development of Croatia public health service, which has between others theoreticaly been organized in the process of apporaching to EU, has been described and offi cial accepted from Parliament in July 2000 under the title “Reforms of system of public health service and health insurance in Republic of Croatia”.
5.1 Organization of Cratian public health service
Health activity has been defi ned as activity of the interest for Republic of Croatia, which is performed as public service and is perfomed by health institutions in state and private ownership and health workers in private practice. According to the Law of health protection, health protection of the citizen will be performed according to the regulations of comprehensiveness, continuity, aproachability and complete approach in primary protection, and specialits approach in specialist-consiliar and hospital health protection without regard to age, sex, religion and ethic belonging. Service of health protection is organized on the way that is performed in united system of health protection through primary and secondary health
protection which includes polyclinic-consiliar and hospital protection. Primary health protection is organized inside District insistution for public health service, Health institution (Dom zdravlja), Insitutions of fi rst aid and simmilar. Polyclinic-cosiliar and hospital protection are organized in the frame of polyclinics, general hospitals and specialized hospitals, and in the frame of clinics, clinical hospitals and clinical hospital centers.
As one of the basic characteristics of croatian public health service and as one of important actor for organization and statemnt in croatian public health service is surely the fact that the institutions for performing health protection mostly are in state ownership and in the owenrship of the distirct and of the city of Zagreb. Prinipaly, the ownership of health institution has been organized on the way that in state ownership are clinics, clinical hospital, clinical state centers and state health institutions, and in the owenership of the district there are general and specialistic hospitals, health institutions “dom zdravlja”, polyclinics, institutions for fi rst aid, sanatorims, institutions for treatment at home and district institutions for public health.
5.2. Definition of actual problems of health system
Problems which are actual in the health system in Republic of Croatia can be specifi ed in 14 categories, as follows13:
13 http://www.hrvatska21.hr/zdravstvo.pdf

253
1. Former organization of health system is not coordinated to nacional health policy, and with recommendation of World health organization
2. The system of fi nancing in health service is bad3. The system of planning and management in health service does not correspond to
modern conception of organization and management of health system4. The controll system and promotion of the quality of health protection is
undeveloped5. Use of health protection is uneconomical and not enough effi cacious6. Defi cit of informatic and modern communication help in controll of business in
health service, controll od health statistic data and help in planning7. Existing of great regional difference of approachability of health protection, as
well as differences concerning economic possibilities of the citizen8. Unreal awaiting of insurers and health workers concerning niveau and volume of
health protection which the economy is able to pay9. Longtime defi cit of investing maintenace and capital investiment into health
service.10. Unplanned develoment of health service capacity, and as result unevently
concentration of specialists’ medicine in big towns, specially in Zagreb11. Unfavourable structure of the consts in health service12. Unfavourable structure of employs with to great part of personell who do not
belong to health service13. Finance insolvency of Croatian Institution of health insurance14. Longtime insuffi cient fi nancing of some parts of health service.
5.3 Strategy of reforms in health service
With the goal of solving problems in croatian health system, as mentioned before, the vision of development of health service in Republic of Croatia has been developed, and concerning its goals it is founded on european health policy14:
“The health system in Republic of Croatia will promote the quality of life through saving and promoting of the health for each person and the whole population. The measurements of protection and promoting will be carried out on effective and rational way, as well as treatment and rehabilitation of the patients. The system will put the patient into central and active position, and will be founded on high ethic and moral normas.”
14 http://www.hrvatska21.hr/zdravstvo.pdf
A
Keda~i} Anita • Kne`evi} Sandra • Maru{i} Marina • Medverec Hrvojka • Veir Zdenko254
Croatian national health policy has been accepted. One of the most important points of this policy is the effort on different ways to emphasize the importance of preventing actions in health service, as it is the case in developed economies, and not curative as it is in the moment in our practice.
Through preventve operating in health service there is the wish of promoting health way of life which end result is regulary decreasing or even removal of health risks, which for the citizens means prolonging duration and quality of life, and for health system it means the posibility for furher development and promotion of health service with lower costs, as result of such business phylisophy.
Inside national health policy we can differentiate 3 main goals15:
1. Decrease of differences in health and health service2. Prolonging of life3. Better quality of life concerning health.
Differences in health and accessibility to health services for different categories of population are mainly for the reason in differences of social-economic statement of some parts of population in society. Such statement is truly present in all countries, and for that reason as one of the goals of national policy is decreasing of such differences is emphasized. On this way each citizen will get the possibility of approaching better health protection without regard to which socioeconomic cathegorie he belongs, that means the differences between citizen in realization of their rights on health protection will be dicreased.
Prolonging of life and better quality of life concerning health is conected to promotion of measurements for decreasing the risk from early death and prevention, that is decreasing of lost in quality of life for the reason of helathproblems.
To achieve the goals defi ned inside the vision of reforms of Croatian health service and Croatian national health policy, it is neccesary to apply good defi ned strategy for reforms of health service.
The three fundamental direction of strategy are16:
1. Reestablishment of stable and quality health sistem
- performed through goals and measurements of national health policy with corresponding reorganization od healt institutions, planning and education of staff.
15 http://www.hrvatska21.hr/zdravstvo.pdf16 http://www.hrvatska21.hr/zdravstvo.pdf
255
2. Strategy of addopting and insurance of health life- concerning measurements of promotion of health, better quality and prolonging
of period of life
3. Strategy of promotion of health protection– concerning measurements of early discovery und quality treatment of illnes,
measurements for healing, prevention from consequences of illnes and better quality of life concerning health.
Goal od application of these strategies of compete system of heath service includeorganizations of health administration, system of fi nancing which is in this moment not satisfactory, and achieving of fi nancial stability of healt system. One of the fi rst step of reform of health service ist the reform paying system and the system of health services.
At the same time it is neccesary to approach the posible greater informatization of health system, by which greater efi eciency will be possible, and it is neccesary to emphasize further education and specialization of specialists’ stuff through coresponding institutional and personell strategy.
The goal of association to EU, inside the reforms of health service in Republic of Croatia, it is necessary to follow and adapt to regualtions of EU in health protection and its supplements and changes for the reason of establishing more effi ciently and successful system of health service with the goal to insure as greater grade of health insurance of citizen as well as more effi cient approach to EU.
6. Adjustments of Croatia’s energy sector
Adjustment of Croatian energy sector is conducted in harmonisation with the EU law legislative. It includes croatian electricity market setting up and HEP group recostruction. Process of reform is under croatian energy laws regulation. Adoptation to the EU system is a process of the gradual acceptance of it´s rules and standards. The membership criteria defi ne the necessary level of harmonisation with the EU system that must be attained by applicant states. In evaluation of fulfi lment of membership criteria, the European Commission takes into account, beside other, the conformity of the national political system in establishment of the market economy which energy sector is a part. In the energy sector, new requirements have been set up for states that wish to join EU. According to what has been achived to date by certain groups of countries, the mani diffi culties in meeting EU demands and measures that might help to solve them are identifi ed.
HEP Group is a part of the energy community and preconditions for the opened electricity market are taken.
A

Keda~i} Anita • Kne`evi} Sandra • Maru{i} Marina • Medverec Hrvojka • Veir Zdenko256
6.1. Memebership criteria
In each sector of the economy, fulfi lment of the membership conditions is evaluated according to how much the economic and legal criteria for membership are met. The fulfi lment of economic criteria for membership implies: a) the existence of a functioning market economy (liberalisation of prices and trade, demand and supply equilibrium established by market forces) and b) the capacity to cope with competitive pressure and market forces within the Union.
The legal conditions imply the acceptance and application of the acquis communautaire.
At the level of states members and at the level of the Union no effective market economy in energy has yet been set up. For example, the system of market laws at EU level is only just developing, and this is one of the elements for the estimation of whether there is an effective market economy. For this reason, in the energy sector the level to which membership conditions has been fulfi lled is monitored with respect to the degree of liberalisation achieved within the EU. Fulfi lment of conditions for membership in the energy sector is estimated above all according to the ability to accept and apply the acquis.
6.2. Current situation analysysIn this the key determinants for an estimation of the state of affairs are as
follows:
• decide on an overall energy policy with clear timetables for restructuring the sector;
• prepare for the internal energy market;• improve energy networks in order to create a real European market;• prepare for crisis situations, particularly through the constitution of 90 days of oil
stocks;• address the social, regional and environmental consequences of the restructuring
of mines;• waste less energy and increase the use of renewable energies such as wind, hydro,
solar and biomass in their energy balance;• ensure the safety of nuclear power plants in order for electricity to be produced
according to a high level of nuclear safety;• ensure that nuclear waste is handled in a responsible manner; and prepare for the
implementation of Euratom Safeguards on nuclear materials.The current level of the fulfi lment of membership conditions is evaluated
according to a comparative analysis of energy in the Republic of Croatia, in the

257
applicant countries and in the EU. Elements for an evaluation of the state of affairs are bounded on key defi nitions for the evaluation of the conformity of the applicants with the acquis and the results of previous negotiations Since during membership negotiations:
1. the capacity of an applicant to take part in the single market,2. adequacy of reserves and 3. nuclear safety have been defi ned as key points, the analysis is focused on
these determinants.
6.3. Current level of fulfilment of the requirement for the membership
The ability to take part in the single market is evaluated according to the institutional and technical capacities of a given country. Institutional capacity implies the acceptance and implementation of that part of the acquis that makes possible the establishment of a market economy in energy and technical readiness assumes an appropriate infrastructure and interoperability of systems.
The creation of a single market in energy and of the corresponding acquis started with the liberalisation of the 1990s, in phases as follow17:
- In the fi rst phase, transparent pricing was assured, and the access of third parties to the transport infrastructure was made possible,
- The second phase of liberalisation started in 1993. This made possible the allotment of licenses for the construction of transport capacities on a non-discriminatory basis, which thus enabled competition. Vertically integrated fi rms separated the accounts of individual activities (generation, transmission, distribution) and the approach of third parties to the greatest consumers of electricity and gas was made possible.
- I n the third phase, which started in 1996, common rules for the electricity market were adopted (Directive 96/92) and for gas (Directive 98/30), and the preconditions for the free moment of electricity and gas in the area of the Union were created. The progressive opening up of the national markets started in 1999 for electricity, when a minimum of 26% of the total annual consumption was opened up to foreign suppliers. The market opening plan anticipated that in 2003 33% of the electricity market should be liberalised, after which, by 2006, there should be a further consideration of market opening.18
17 Boromisa Ana-Maria (2003.): Energy in EU and in Croatia, Institute of Public Finance, Zagreb, pages 173-191
18 Samardžija V(edt.): Adaptations to the policy of the EU internal market: Expected effects, Ministry of Foreign Affairs and European Integration, Zagreb, July 2002.
A

Keda~i} Anita • Kne`evi} Sandra • Maru{i} Marina • Medverec Hrvojka • Veir Zdenko258
The European Council at its Lisbon summit (23-24 March, 2000) required gradual and total opening of the energy market. For this reason the European Commission in March 2001 proposed amendments to the directives for electricity and gas and the regulation on the conditions for access to the electricity network.
The proposals allow for the opening of national markets to electricity and gas by 2005, the supply of all consumers and the creation of a single energy market instead of 15 open national markets. The opening of the market means that in 2005 consumers will be able to choose which supplier of electricity and gas they want.
The applicants mainly successfully accept the basic principles of the EU system:
- transparency of market conditions and prices, - guaranteed freedom of exchange of energy in the internal market and the opening
of the electricity and gas market.
The main obstacles in the way of the liberalisation of the market (in the sense of limiting access to the market) are the same in both sectors. They are insuffi cient regulator power/delays, inadequate unbundling, high network tariffs, balancing regime, dominant incumbents, cross border issues.
In the Republic of Croatia the EU principles have been formally accepted, while the bases for harmonisation with the EU system, including the most recent proposals for market liberalisation, were created by the package of energy laws of July 2001 (the Energy Law19, the Law on the Electricity Market,20 the Law on the Gas Market, the Law on the Oil and Oil Derivatives Market, the Law on the Regulation of Energy Activities)21.
These laws allow for the achievement of the preconditions that the Commission considers essential for market liberalisation. The vertically integrated concerns should have unbundled up by 1 July 2002. In the area of electricity this fi rst of all means separating the generating, transmission and distribution fi rms, i.e., electricity supply, and the separation of the operation of the electricity system from generation and sales. Although the companies of the HEP group were founded within the statutory period, the unbundling did not take place. Hence it is still possible to shift resources from one activity to the other or to subsidise activities.
In the context of its enlargement, the EU has stressed the importance of nuclear safety. For the Republic of Croatia, the question of nuclear safety is linked with
19 ″Offi cial Gazete of Republic of Croatia″ Number 68/2001.20 ″Offi cial Gazete of Republic of Croatia″ Number 177/2004.21 Boromisa Ana-Maria (2003.): Enregy in EU and in Croatia, Institute of Public Finance, Zagreb,
pages 173-191
259
the Krško nuclear power plant. During negotiations with Slovenia, the Commission determined that Krško meets the safety standards of the EU. However, in line with the Nuclear Safety Report in the Context of Enlargement, seismic testing and the adoption of a national programme for emergency situations are required. Hence, unsettled matters in connection with Krško, especially those to do with the management of waste and the closure of the station, will have to be settled in line with EU regulations that, as Slovenia became a member in 2004., and will be obligatory and applicable to Krško power station.
6.4. Recommendations
Since the energy sector is state owned, and will, until EU accession, remain mainly state owned, it is mainly state or governmental bodies that are charged with implementation of the reform. For this reason, for successful reform of the energy sector, a successful state administration is also required, i.e., it has to be reformed, or some of its authorities have to be transferred to independent bodies. In order to strengthen competition and the creation of a single market, access to transmission and distribution networks will have to be assured without discrimination. In turn, in order to achieve this goal it is necessary for the network to be managed by an independent body, completely detached from generation and sales; that the national regulatory body, which has to be set up in all member states, determine, publish and approve charges for access to the network before they come into force. At the same time, the demand on the infrastructure is made that says the capacity of the transmission network to neighbouring countries must attain at least 10% of domestic generation. Although these proposals have not yet been adopted and are not applied in the EU, they could be looked upon as conditions for membership. The fulfi lment of obligations and implementation of the directives about liberalisation of the energy market in member states is monitored by the European Commission.
Since the energy sector is state owned, and will, until EU accession, remain mainly state ownedix, it is mainly state or governmental bodies that are charged with implementation of the reform. For this reason, for successful reform of the energy sector, a successful state administration is also required.
Energy sector in croatia is in a reform. The Croatian Energy Regulatory Council is founded as independent market operator. Inside HEP Group, main fi rms are separated: generating, transmission and distribution, as shown in fi gure 2. Operations for the services are separated from the HEP Group. Restructuring of the HEP Group should be fi nished at the end of 2005.
A

Keda~i} Anita • Kne`evi} Sandra • Maru{i} Marina • Medverec Hrvojka • Veir Zdenko260
Figure 2: Restructuring of the HEP-group
Source: www.hep.hr
As was already stated, HEP Group is sate owned and the success of the reform will depend on public administration effectivnes. Croatia has achieved a relatively

261
high level of formal conformity with EU regulations. Legislative is already adjustet with the EU, but still there are some rules that have to be carried out22.
Finally, the EU enlargement plan includes states neighbouring on the Republic of Croatia, and these states will have to implement EU regulations after accession. For this reason the acceptance and implementation of such regulations here is necessary not only for the sake of Croatia being able to join the EU, but also to make possible trade with the neighbouring states after the EU enlargement.
7. Conclusion
To adapt to european standards, Croatia starts the reforms of public administration. The goal of the reform is to ensure professional and effective public administration which will insure economic growth in land. Reform and modernization of public administration is strategic important in the context of european integration because of capability to fulfi ll the obligations taken by agreement of stabilization and association and better cocordination and administration policy. EU insures to the countries – candidates fi nancial and technical help in performing such reforms, and in the frame of pre-aproaching programs. In Croatia such help is insured by CARDS program. By project CARDS 2001 started the process of reforms of public administration in Croatia. The project is concentrated to regulations and process of managing structures which are responsible for administation and development of human potential ind public administration.
Success of present reforms and adoption of public administration can be discussed on two ways. In formal sense, Croatia has voated and chenged many laws and legal acts by which the work and constitution of public administration and other state institutions is regulated. It can be said that adapting of the law with legal acquest of EU is very successful and follows foreseen dynamics. But in changes of adopted laws there are still great incompletenesses. Even some of bodies and institutions are formally founded in the frame of public administration, they are not organized yet and did not started to work. Further, many and often changes of law and sub-law regulations in the frame of public administration result slow and unsure public administration.
The terms for public administration are foreseen till the end of 2006. In this term the efective functioning of public sector should be insured, and it becomes the bearer of all other reforms of the society. Even the formal conditions exist, each day
22 Boromisa Ana-Maria (2003.): Enregy in EU and in Croatia, Institute of Public Finance, Zagreb, pages 173-191
A

Keda~i} Anita • Kne`evi} Sandra • Maru{i} Marina • Medverec Hrvojka • Veir Zdenko262
practice is not present, and it is neccessery to make clear and charp measurements in the area of reforms of public sector, to fulfi ll the given terms, and to make possible further negotiation with EU.
Literature
Books:
1. Group of Authors (2003.): Croatian accession to the European Union-Economic and Legal Challenges, Institute of Public Finance, Zagreb
2. Group of Authors (2004.): Croatian accession to the European Union-Institutional challenges, Institute of Public Finance, Zagreb
Articles in journals:
1. Weiner M. Joann (2004.): Fearin EU from new members tax competition, Tax news (11) 58/66
2. Ott K., Kesner-Škreb M., Bajo A., Bejaković P., Bubaš Z.: The Economy of Public sector-situation, problems and possible solutions, Institute of Public Finance, Newsletter, No. 4, 2000, pages 19-27.
Publications:
1. Croatia on the Road to the EU: From Candidacy to Membership, Ministry of Foreign Affairs and European Integration, second extended edition, Zagreb, 2004.
2. Fifth enlargement of EU: 2004., Ministry of European Integration, Zagreb, 2005.3. Adaptations to the policy of the EU onternal market: Expected effects, Ministry of
Foreign Affairs and European Integration, Zagreb, July 2002.4. Croatia and EU: benefi ts and cost of integration, Institute of Foreign Affairs,
Zagreb, 2000.
Articles in Books:
1. Arbutina H., Kuliš D., Pitarević M. (2003): Comparison and harmonisation of the Croatian tax system with the tax systems in the European Union, in Group of Authors: Croatian accession to the European Union-Economic and Legal Challenges, Institute of Public Finance, Zagreb, pages 83-105
2. Bađun Marijana (2004.): Governance and public administration in context of the EU accession, in Group of Authors: Croatian accession to the European Union-Institutional challenges, Institute of Public Finance, Zagreb, pages 125-157
3. Boromisa Ana-Maria (2004.): The readiness of the public administration fot the EU accession, Institute of Public Finance, in Group of Authors: Croatian accession to the European Union-Institutional challenges, Institute of Public Finance, Zagreb, pages 159-189

263
5. Boromisa Ana-Maria (2003.): Energy in European Union and in Croatia in Group of Authors: Croatian accession to the European Union-Economic and Legal Challenges, Institute of Public Finance, Zagreb, pages 173-191
6. Cuculić J., Faulend M., Šošić V.(2004.): Fiscal aspects of accession: Can we enter the European Union with a budgetary defi cit?, Institute of Public Finance, Zagreb, 47-73
7. Ott Katarina (2004.): Croatian accession to the European Union-Institutional challenges in Group of Authors: Croatian accession to the European Union-Institutional challenges, Institute of Public Finance, Zagreb, pages 1-18
Web pages:
1. IMF: IMF World Economic Outlook, Growth and Institutions (online), Washington: International Monetary Fund, 2003, available from (http://www.imf.org/external/pubs/ft/weo/2003/01/index.htm)
2. (http://www.htnet.hr/fset.html)3. The vision of development of health service in Republic of Croatia, Group of
profesionalists, 2002., available from (http://www.hrvatska21.hr/zdravstvo.pdf)
Laws:
1. Energy law, ″Offi cial Gazete of Republic of Croatia″ No. 68/012. The Law on Elektricity market, ″Offi cial Gazete of Republic of Croatia" No.
177/043. Helath protection law, ″Offi cial Gazete of Republic of Croatia″ No. 121/034. Health insurance law, ″Offi cial Gazete of Republic of Croatia″ No. 94/01
A

Alka [ofi} • Sandra [piranovi} • Dalibor Bukvi} • Zdravko Dokuzovi} • Tadija Lovri}264
ACCOUNTING INFORMATION FOR PLANNING AND COST CONTROL
Alka [ofi}, Sandra [piranovi}, Dalibor Bukvi}, Zdravko Dokuzovi}, Tadija Lovri}Faculty of Economics
Postgraduate study: Management
1. Introduction
In modern business spheres, accounting information are becoming much more important, according to which the levels of management bring strategic and operational business decisions. Development of information technologies offers better quality of accounting information that can satisfy needs of all management levels for decision making process at the sphere of planning and cost control, income and profi tability of the companies business functions.
The goal in general for the Management is to bring the best quality business decisions that will improve the success in business and to increase the effi cacy of the company. So, in daily business of sales analysis, marketing, budget preparing, profi tability analysis, cost analysis, managers need help from sources of business applications of information technologies that will assure all necessary data’s for quality decision making, which could lower the risk and unknown facts that interferer in business life.
There are different ways of informatics use inside the companies, but today, the most popular one is introduction of ERP system (Enterprise Resource Planning).
ERP systems establish the integrated information systems (IIS) that enable collection and observations of all information about the company condition at the one place and moment because of its input processing from all levels of business at the moment when the business change (transactions) happens[1].
While the IIS systems analyses costs based upon the collected data’s from all company subsystems, EPR systems provide planning and managing (control) of costs.
For this work research we implemented the system for the cost management at the invented company „Izgradnja“, in other words, how the accounting informational subsystem as the part of the informational system of one company contributes to the companies managing resources.

ACCOUNTING INFORMATION FOR PLANNING AND COST CONTROL 265
2. The company ‘Izgradnja’ – organizational chart and the necessity for implementation of ERP system
Illustration 2.1 is showing the organizational chart of the ‘Izgradnja’ company.
Illustration 2.1 Organizational chart of ‘Izgradnja’ company
For the purpose of representing the organizational chart, the ERP systems are used for simple inputting, printing and controlling of organizational units and organizational structures of the company. Illustration 2.1 ERPINS systems [2] show the module for input of organizational units, where each organizational unit receives its unique code, name, supervision, and if the organizational unit is the place of cost or it has some other production characteristic.
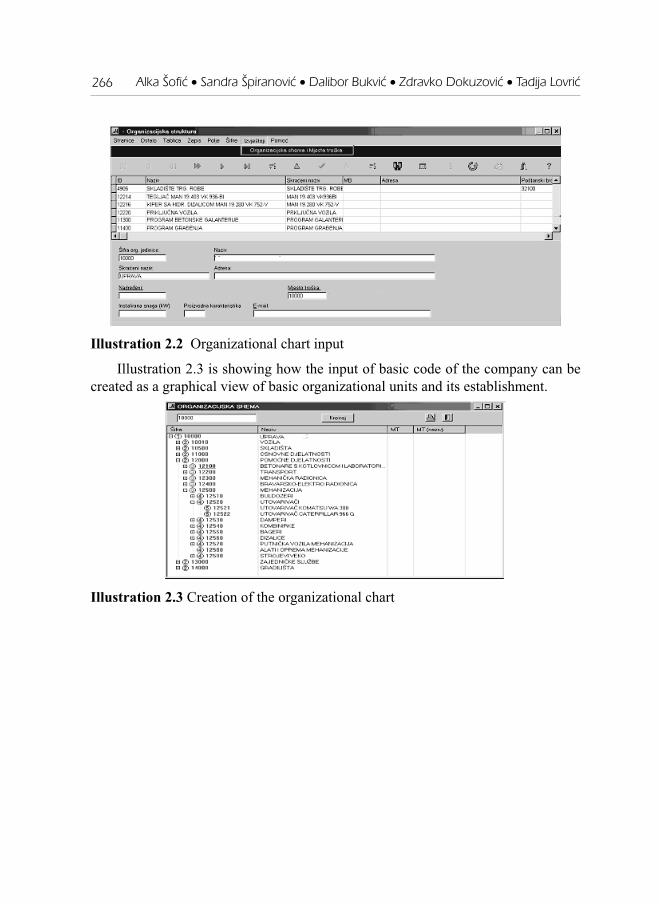
Alka [ofi} • Sandra [piranovi} • Dalibor Bukvi} • Zdravko Dokuzovi} • Tadija Lovri}266
Illustration 2.2 Organizational chart input
Illustration 2.3 is showing how the input of basic code of the company can be created as a graphical view of basic organizational units and its establishment.
Illustration 2.3 Creation of the organizational chart

ACCOUNTING INFORMATION FOR PLANNING AND COST CONTROL 267
Illustration 2.4 is showing the dialogue for organizational chart in form of report and the report itself illustration 2.5.
Illustration 2.4 Dialogue for input of the organizational chart report
Illustration 2.5 Organizational chart report

Alka [ofi} • Sandra [piranovi} • Dalibor Bukvi} • Zdravko Dokuzovi} • Tadija Lovri}268
3.Accounting and accounting information
3.1 Accounting as a business function
Accounting represents the subsystem of the companies informational systems, with informative and controlling function. The characteristic informative function is because it „produces“ accounting information which is a part of information according to which the decisions are brought, and the controlling function because it offers information on results of executing the business decisions. It also offers information to the management necessary for realization of planning and controlling.
Because of its valuable expressions, accounting connects all business systems (subsystems) of the company and helps developing of unique informational system, because it offers successive and comprehensive data’s based upon the documents of all changes and valuable effects in all subsystems of company (purchasing, sales, fi nance, production, development etc.).
3.2 Importance of accounting information
In modern business spheres, accounting information is becoming much more important, according to which the levels of management bring strategic and operational business decisions. Development of informational technologies offers better quality of accounting information that can satisfy needs of all management levels for decision making process at the sphere of planning and cost control, income and profi tability of the companies business functions
Quality information should consist of the following characteristics[3]:
• adequacy – should be adaptable to decision making process which means that creators and users of information should mutually be involved in its forming
• timeliness and correctness • intent - right information to the right people because different levels of
managing request different information• integrity
Accounting information outcome from fi nancial accounting, cost accounting and management accounting.
Financial accounting offers synthesized data’s in form of complexes accounting information registered at the fundamental fi nancial statements balance-sheets, profi t and loss account, cash fl ow report, report on changes in fi nancial conditions and notes along with fi nancial statements, and its goal is to offer information of the companies fi nancial condition, business success and changes in their fi nancial situations.

ACCOUNTING INFORMATION FOR PLANNING AND COST CONTROL 269
Even though the fi nancial accounting is used by internal and external users we could say that these types of reports are used by the external users more often (owners, banks, state) especially because of its prescribed institutional frame [4].
Cost accounting is internal accounting which is involved in collection of data’s on cost, accountings, observation, reporting and cost controlling[4]. In regards to the subject of this accounting of the cost inception, observation, reporting and its role in fi nancial results, we can say that it represents the connection between fi nancial and management accounting. It helps the fi nancial accounting to determine costs of products, stocks, fi nancial results, and to the management accounting it gives the data’s on costs for planning, decision making and creation of reports for management accounting.
Comprising the costs by its types, places and holders and observing costs provides the effi cacy control of certain business activities, among with the comparation of planned and realized costs and determining the cause of its aberration.
Management accounting prepares accounting information for internal use and decision making inside the company. In process of forming the management accounting information, elements of estimate and size comparison should be added to the process of forming the management accounting information of costs. Based upon the scores of the past situations and the future prognosis of business processes some new information are raising out that help management to bring the strategic decisions of their business [5].
Regarding to accounting information user for all levels of management and especially the managers for planning’s, control and coordination, some more detailed and frequent information are required than the ones recorded in semi-annual or annual fi nancial reports. Usually these information refer to the previous events.
Subject of management accounting information as well as its reports are not legally regulated, so the management can determine types, shapes and subject of information. This type of accounting is directioned to collection of purpose information for resolution of certain problems usually refereed to the future situations. The purpose of management reporting is to express business results for determined period of time, and which will be compared with the budget or standard sizes in reference to get the aberration analysis. Based upon those analysis a business projections will be made until the end of the budget year [6].
All levels of responsibility centers bring their plans (estimates) (company units performing a part of planned business activities), and estimate represents goals which the management plans to achieve. The difference between sales estimate, production estimate, production cost estimate (material costs, labour costs, indirect operational
Alka [ofi} • Sandra [piranovi} • Dalibor Bukvi} • Zdravko Dokuzovi} • Tadija Lovri}270
costs), expenses estimate (administrative costs and management, sale expenses), planned profi t and loss account, planned balance sheet.
Management of the company brings basic directions for creation of budget, and the individual budget are maid by each center of responsibilities by their executive managers at their levels of authorities. If the results of the company are not realized according to determined goals of companies master budget, reliable and relevant accounting information have responsibility to answer to the questions of management [7]
- who is responsible for aberrations from realization of plans,- what differences should be analyzed,- what measures should be undertaken.
To form the information for decision making process the necessary to know is the root of problem and information contents necessary for problem solutions, which requests human knowledge. Different professions with different knowledge’s are involved in formation of information for decision making (information technologists, accountants, planners, annalists, programmers etc.
4. Cost management
Because of dynamic production and fast changes of business conditions, cost management has meaningful role in today’s companies, which has developed together with information technologies and accounting system.
This fact outcomes from main goal of cost managing business system, which is to accomplish business results with the lowest costs as possible without long term consequences upon the business results and competition of companies at the market. Namely, company can not eliminate its costs but observing the costs by its activities and monitoring its benefi ts, a company can decide on which activities (businesses) should be eliminated and which should be left for other competitors.
Traditional cost management was related mainly to observation of production costs. However, to bring some decisions on products profi tability, management would have to collect information on costs that arise before and after production of certain product. These costs are maid of research and development, product designing, storaging, distribution, transportation, product marketing, additional customer services, etc.
Inception of costs is connected with some purpose well known as a cost holders. Each company has to decide on their cost holders, which depends of the information on costs that managers of the company need to make decisions and how the costs vary within their holders.

ACCOUNTING INFORMATION FOR PLANNING AND COST CONTROL 271
Companies often think they can only set products or units for cost holders. The important fact is to determine costs for individual buyers, if they cause different costs. The biggest buyer does not mean the most profi table one for which companies usually provide extra services as guarantees, special deliveries, covering repairing costs, prolonged payments, what causes extra costs for the company.[8].
Determining costs by its holders demands division of costs to direct and indirect costs.
4.1. Direct and indirect costs
Direct costs are the costs that can connect to its holders in period of its inception. Within the production that is a work order. It represents production instructions of what should be produced, what products and services and how many pieces. Work order presents the main and additional material issuing from warehouse to production, and the material consumption for production showed in work order is one of direct costs carried by its work order. Second cost which is directly connected to the work order is consumption of work capacities of product making, so the costs of work labour in production and all other costs that arrise from direct connection with the work orders.
Direct costs are controlled valuably by inputting of material prices and prices of work, which leads us to direct costs by processing through material accounting and processing salaries in fi nancial accounting, the way each item of direct costs consists of work order to which the cost refers to.
By the method of direct cost control, we can get information on raw materials used in production, work technologies which leads us to the time used for production. In this way, we can control and compare real consumption of materials from work orders. The same process can be used on technologies.
Comparation of planned and realized costs of materials, and planned and spend time of production can lead us to certain cognitions. If the factors and technologies of work are set, we can determine for example, how much materials or work is used over than predicted.
Indirect costs are caused by two or more holders and is not possible to devide them to individual cost holders. Managers in production manage and control work process of the whole system, not just the certain work order. Work order preparation directions and work technologies represent costs that are not connected to the one cost holder or specifi c work order.

Alka [ofi} • Sandra [piranovi} • Dalibor Bukvi} • Zdravko Dokuzovi} • Tadija Lovri}272
4.1.1. Direct and indirect costs of the ‘Izgradnja’ company
Direct costs of ‘Izgradnja’ arise by issuing of work orders for the production of concrete products, especially work orders for curb stones, work orders for sidewalks, work orders for production of construction elements, and work orders for construction of objects. In secondary services there are work orders for electricians and locksmiths, work orders for mechanics and work orders for transport.
Work orders help us to control the process of production and its costs (material costs from delivery notes, employees working hours).
Indirect costs rise from usage of fuels in production units, costs of equipment maintenance, purchasing costs, transport, sales, etc.
4.2. Holders and places of costs
Previously is mentioned that the company should decide on defi nition of cost holders. Usually, this decision refers to cost differences between individual cost holders. The work order represents one of the shapes.
Example of printed work order shown in illustration 4.2.1[2].
Illustration 4.2.1 Printed work order
This type of work orders defi ne company name, ordering party, type of order and the launch into the production.
There are some other data’s on products that are produced by the work orders, its quantities and production time, starting date and ending date of production and delivery of the products. It includes data’s on total time necessary to accomplish the work order. Since we follow the production by work orders, it gives us the possibility to run the process analysis of the production on certain products; realized production costs in relation to planned; direct costs of each work order; and indirect costs that have to be scheduled upon determined keys.

ACCOUNTING INFORMATION FOR PLANNING AND COST CONTROL 273
Costs are recorded after its place, and then scheduled on their holders, and for that reason named as a intercost objects. Place of cost can be determined as a functional, in terms of space, or part of the company where the costs are produced and can be organized to the cost holders [9].
Each production unit can have few places of cost dependant of organization of the production. This would connect cost holders to the direct costs, and the place of where this cost raised from (fundamental cost place ).
The fundamental cost place connects indirect costs that can not directly be collected at the fundamental cost place. Fundamental cost places are temporarily ones because they are organized by keys to their fundamental positions.
Example of cost places and its control can be showed at transportation process where each truck or other transportation vehicle represents the place of cost, because each fuel expense can be controlled on each vehicle. The same can be applied on machine maintenance.
4.2.1. Holders and places of costs in ‘Izgradnja’ company
Cost holders for the company ‘Izgradnja’ are all work orders previously described, while the places of costs are parts of the company that have or could be controlled as they are. The important is to recognize the difference of accounting unit and the place of cost.
Accounting units present places that have certain realization, to be followed by interest of their internal realization and costs. Accounting units of the company ‘Izgradnja’ represent main activities of the company. The important fact to know is if the production of curb stones or sidewalks contributes positive or negative business results. If the costs are higher than its realization, the company should wonder if the price calculations are too high, or the costs are really so high because of the uneffi cacy of work power and/or uneffi cient purchasing which makes material more expensive than it should be. In case of the second, the company must take measures to increase work power effi cacy and other production factors, otherwise the major activities should be abandoned and the politics should be directioned to some other activities that would lead the company to a positive results.
Additional and supporting activities represent unproductive activities in company having internal realization, and for those we follow only the costs. This type of activities are sales, marketing, accounting, purchasing, distribution, locksmith and mechanical workshops.
Places of cost will be followed within all units that have some meaning in matter of company costs and as such are important for controlling and planning of its costs, and which we are able to control.

Alka [ofi} • Sandra [piranovi} • Dalibor Bukvi} • Zdravko Dokuzovi} • Tadija Lovri}274
5. Indirect cost distributional keys and its distribution through the work units
Concept of the direct cost is connected to the concept of cost holders while the indirect costs represent connection with distributional keys.
The cost of common (non product) cost places appeared because of the high number of its holders. Indirect costs are placed on single cost object (as work orders) using the distributional keys or coeffi cient of additional common costs.
If object is the electric powers than one of the distributional keys can be amount of registered electric power or installed forces electric power in kW or which share does it take in total electric power. Also with the keys we can calculate the amount of electric power of the single work order.
Formula for calculating the cost of electric power in the facility.
IS(i)TEE(i) = ------------------- * TEE
n ∑ IS(i) i
There out::
TEE(i) - Electric power cost
IS(i) - Installed forces in facility in kW,
n ∑ IS(i) - Installed forces in all facilities in kW
and
TEE - The total cost of electric power usage.
After calculating the power of all facilities, we need to calculate the working hours of the facility and the time that refers to the single work order. Proportionally to that, electric power cost on all work orders should be divided.
There out::
VT(RN-i)TEE(RN-i) = ------------------- * TEE(i)
n ∑ VT(RN-i)i

ACCOUNTING INFORMATION FOR PLANNING AND COST CONTROL 275
where:
TEE(RN-i) - costs of the electric power which belong to work order,
VT(RN-i) - work order timing according to work technology,
n ∑ VT(RN-i) - timing of work orders in total, i
TEE(i) - total cost of certain facility electric power.
Administration costs can be distributed to the work orders the way that 50% of its costs divide according to men-power necessary for work order realization, and other 50% according to calculation values that work order has. This two-way distribution enables the more realistic distribution of costs within work orders.
There out:
BR(RN-i) VR(RN-i)TUP(RN-i) = ------------------- * TUP(1/2) + ------------------- * TUP(1/2)
n n ∑ BR(RN-i) ∑ VR(RN-i) i i
where:
TUP(RN-i) - administration costs of single work order,
BR(RN-i) - number of man-power necessary for realization of work order according to work technologies,
n ∑ BR(RN-i) - number of man-power necessary for all work orders, i
VR(RN-i) - value of work order according to its calculative price,
n ∑ VR(RN-i) - value of all work orders in total, i
TUP(1/2) - 50% of total admin costs.
In general, there are some different ways for determining the indirect cost distributional keys of the work units. Within this process it is necessary to control economy and base selection[10].

Alka [ofi} • Sandra [piranovi} • Dalibor Bukvi} • Zdravko Dokuzovi} • Tadija Lovri}276
The management arranges to schedule costs the way that direct costs takes the biggest share. The best rule is to schedule costs directly to its holders which makes correct information on product costs and quality information to the management.
The biggest problem represents the base selection for distribution of common cost to their holders. The base should be chosen in the way that refl ects the best connection between common costs with its genesis.
Each company, depending of its desirable level of control and politics of cost managing the work units, creates the individual model of indirect cost distribution to the work units and cost holders.
6. ERP system– module RINIS
This chapter will present module RINIS which is a part of ERPINS [2] and practical procedure for submitting data in accounting department. This module can be applied on ‘Izgradnja’ company.
Modules: - incoming invoices, - the inventory-material accounting, - capital assets, - salaries, - main book and balance-accounts
All these modules create data on cost, important for accounting department, and automatically transfer and process into the main book and balance-account module. This section is showing the importance of automatics in data collecting and transferring and afterwards the processing for the same. To receive information in time we would need a good support from the informational system. (ERP).
6.1. Incoming invoices module - URE
The incoming invoices module is serving for input of incoming invoices.[2] This module follows costs of external services and cost of basic and auxiliary materials.

ACCOUNTING INFORMATION FOR PLANNING AND COST CONTROL 277
Illustration 6.1.1
Module incoming invoices–domestic is designed for input of bills and afterwards automatically transfer to the main book. At the top of application window we input basic data of bill and amount (Picture 6.1.1). At the bottom of application window bill is classifi ed along accounts. After the fi rst entrance of bill, the programme will process further classifi cations on type and accounts. After that procedure application user can change class of account or amounts. Also in this module user can determine on which cost holder carry of current bill.
6.2 The inventory- material accounting module
The system works the way that the total quantity input data reduces to the minimum [2]. This happens if the data on quantities input only in warehousing, and automatically transfer into the inventory-material accounting to the determined class of stocks and costs. The material output from warehouse to production records along work orders and further calculates upon average price.
To start recording in inventory-material accounting it is necessary to carry out the following preliminary works:
Defi ne warehouse elements, defi ne stock class account, defi ne table for class account. Table class account defi nes contrary class account based on the warehouse, warehouse documents and stock class. (illustration 6.2.1).

Alka [ofi} • Sandra [piranovi} • Dalibor Bukvi} • Zdravko Dokuzovi} • Tadija Lovri}278
Illustration 6.2.1 Input for contrary
It is necessary to input all warehouse documents in the module so that subsystem of inventory- material accounting module works correctly.
After module is inputted, all documents should be examined and fi lled in with material prices from incoming bills (illustration 6.2.2.)
Illustration 6.2.2 Adding values on receipts
Data transferring into the fi nancial accounting presents creation of primary document (temeljnica) composed of subsections. At the primary document cost are grouping according to types of cost and work orders.

ACCOUNTING INFORMATION FOR PLANNING AND COST CONTROL 279
6.3. Module capital assets
This module follows replacement costs of capital assets.
The menu Amortizacijske skupine (illustration 6.3.1) defi ne replacement group annual rates, purchasing account class value and account class of adjusted values.
Picture 6.3.1 Input of replacement group
Picture 6.3.2 Input of inventory numbers
Input of inventory numbers along each capital asset, and related data’s as a place of cost; illustration 6.3.2.
The process is fully automatic, illustration 6.3.3.

Alka [ofi} • Sandra [piranovi} • Dalibor Bukvi} • Zdravko Dokuzovi} • Tadija Lovri}280
Illustration 6.12 Option in menu «Accounts»
All data originated from module of capital assets can be automatically recorded in fi nancial accounting with primary documents for monthly replacement, expenditure or sales of inventory numbers and according to places of costs.
6.4. Module salaries
The salaries module is designed for calculation of salaries and creates the primary document for cost following upon their places for employees not registered within the work orders (sick leave, r&r-s, board member salaries…) and for employees who work within the specifi c work orders
When all set, we input hours by sorting it, or automatically transfer data from time schedules module. (Picture 6.4.1).
Illustration 6.4.1 Salaries (hour input)

ACCOUNTING INFORMATION FOR PLANNING AND COST CONTROL 281
6.5. Main book and balance-accounts
The application makes possible to record the fi nancial documents, to provide its control and analysis through the reports.
Some accounting inputs are manual and some are automatically transferred from other modules. The whole automatic process in other modules offers the accounting department to receive data at the moment when it appears. Data’s are immediately available for following the cost along work orders or cost holders.
Upon these types of information, accounting is ready to react fast and to give fi rst information to the Controlling service.
7. ERP system – Information module controlling
7.1 Importance of module Controlling
Integral information system is composed of transactional and corporative information system [7]. Transactional system must satisfy some institutional norms. Its component parts are fi nancial accounting, material accounting, salaries accounting and other. Those represent the basis for essential fi nancial reports.
The corporative information system does not have the institutional frame, but it is used according to necessities of managers for different information depending on companies business character. This subsystem can not function separately, because the very same transactional system presents its basic database.
Information system Controlling tasks are:
• planning business results and following its realization• planning and following realization of planned indicators of business success.• determining deviations of planned business results and realized business
results• analysis on aberration causes
The object on the implementation of this system in company is to enable management to supervise business results and timely to start taking actions for business results and politics.
Creating the information system of Controlling demands the engagement of user who defi ned requests for informational system. This means that company has to act as a team and actively to participate in developing.

Alka [ofi} • Sandra [piranovi} • Dalibor Bukvi} • Zdravko Dokuzovi} • Tadija Lovri}282
7.2 Module controlling in «Izgradnja» company
It is not necessary to accent the importance of analysis possibilities for all companies costs in any moment. In the world of hi-tech informatics we use different applications to get that kind of information. One of those programmes for managing costs is ERP system - Controlling.
Module Controlling has two sections, Controlling codes and Controlling, illustration 7.2.1.
Illustration 7.2.1 Main menu module CONTROLLING.
In Controlling codes section we defi ne parameters necessary for work module Controlling. The main menu consist of input for cost places (MT), cost structures, distribution keys of cost and input window for group costs, illustration 7.2.2. In window Cost structures all costs which will be followed, for example, consumption feed and material, salaries, electric power, gas, water, administration cost, etc are defi ned. Each cost is assigned by the code which is used for control of the cost in application, cost name, module from which data is taken (fi nancial accounting, work orders), cost classifi cations and percentage of the cost input in this category. In bottom part of application window we input classes from which cost are processed into the application.

ACCOUNTING INFORMATION FOR PLANNING AND COST CONTROL 283
Illustration 7.2.2 Menu review
In window “Defi ne cost places” we defi ne cost places that we want to follow. The internal code MT defi nes for the controlling purpose, real MT at the company’s level, name, productivity, calculation of the productivity and keys of distribution, illustration 7.2.3.
Illustration 7.2.3 Input window for defi ning cost places
Window “Distribution keys” defi ne keys for cost distribution, illustration 7.2.4.

Alka [ofi} • Sandra [piranovi} • Dalibor Bukvi} • Zdravko Dokuzovi} • Tadija Lovri}284
Illustration 7.2.4 Input window for cost key distribution
This example, defi nes the installed power, insurance premiums for the property and number of employees for each calculation period.
One more ability is to group costs through the specifi c principles, illustration 7.2.5.
Illustration 7.2.5 Grouping of costs
Codes for the group costs and names defi nes here while the bottom part defi nes codes of certain cost.
In main menu is also menu item for accounting time necessary for correct and easy programming. All this should be defi ned before the work starting in part of Controlling.
The second part where the cost calculation and cost analysis is performed is called Controlling. It consists of the part which is processed by the cost calculation. According to costs processing there is an existing possibility for pulling the reports on “Review on cost placed by its terms”, according to cost codes and for period and cumulative review, illustration 7.2.6.

ACCOUNTING INFORMATION FOR PLANNING AND COST CONTROL 285
Illustration 7.2.6 Option – cost review
For detailed analysis the reports are used. The dialog form defi nes period for expected datas, place of costs for detailed report, illustration 7.2.7. Also, the report can be maid for executive unit or only for production cost places, illustration 7.2.8. The report “work units total” provides review on group cost divided on its cost place, illustration 7.2.9.
Illustration 7.2.7 Dialog on processing reports of cost review

Alka [ofi} • Sandra [piranovi} • Dalibor Bukvi} • Zdravko Dokuzovi} • Tadija Lovri}286
Illustration 7.2.8 Report ‘Cost structures by work units’

ACCOUNTING INFORMATION FOR PLANNING AND COST CONTROL 287
Illustration 7.2.9 Report ‘Costs by work units’
A special accent is placed on cost list - ANALYTICS, illustration 7.2.10.
Illustration 7.2.10 ‘Cost list - ANALYTICS’
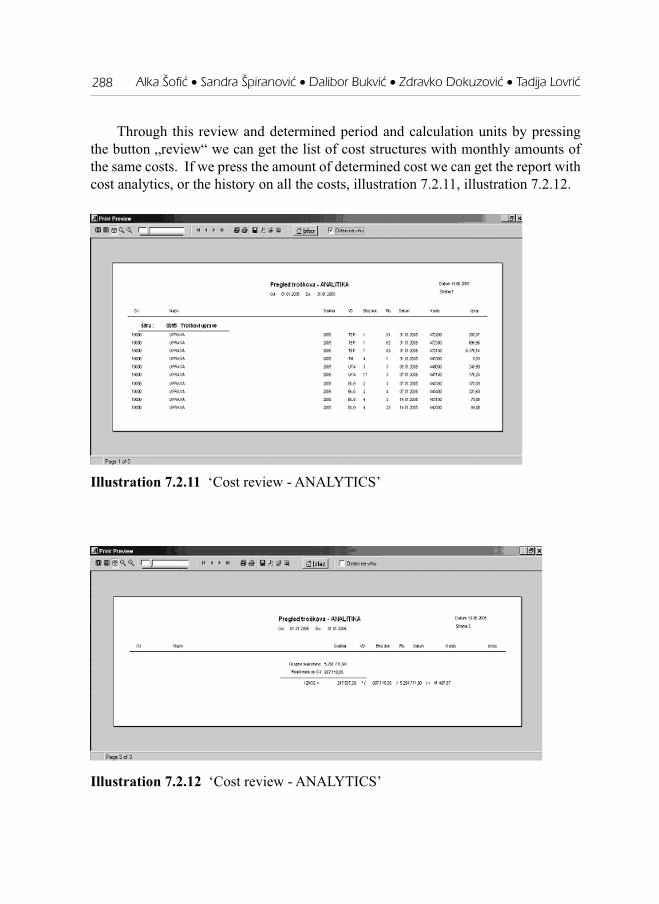
Alka [ofi} • Sandra [piranovi} • Dalibor Bukvi} • Zdravko Dokuzovi} • Tadija Lovri}288
Through this review and determined period and calculation units by pressing the button „review“ we can get the list of cost structures with monthly amounts of the same costs. If we press the amount of determined cost we can get the report with cost analytics, or the history on all the costs, illustration 7.2.11, illustration 7.2.12.
Illustration 7.2.11 ‘Cost review - ANALYTICS’
Illustration 7.2.12 ‘Cost review - ANALYTICS’
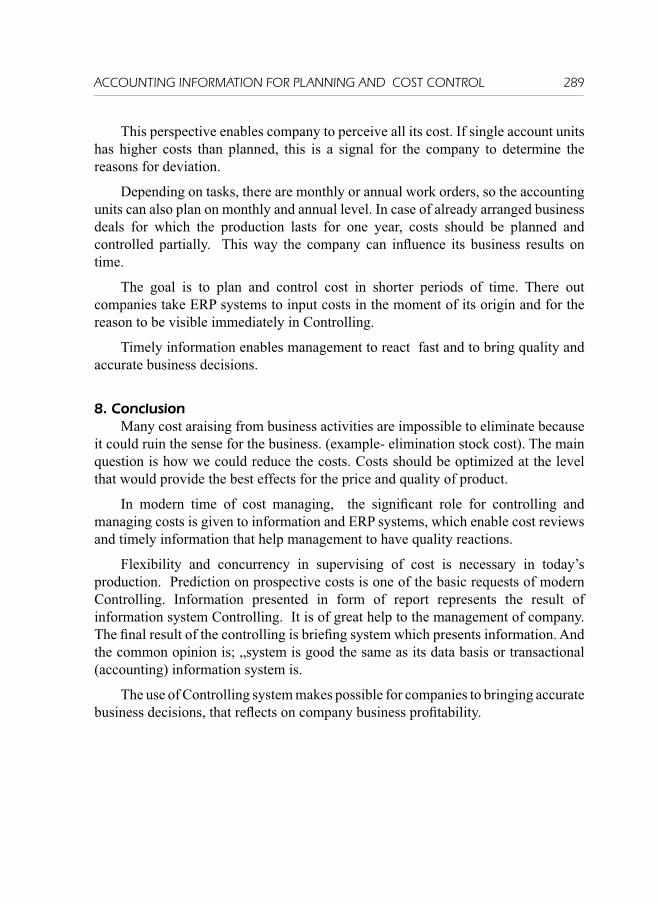
ACCOUNTING INFORMATION FOR PLANNING AND COST CONTROL 289
This perspective enables company to perceive all its cost. If single account units has higher costs than planned, this is a signal for the company to determine the reasons for deviation.
Depending on tasks, there are monthly or annual work orders, so the accounting units can also plan on monthly and annual level. In case of already arranged business deals for which the production lasts for one year, costs should be planned and controlled partially. This way the company can infl uence its business results on time.
The goal is to plan and control cost in shorter periods of time. There out companies take ERP systems to input costs in the moment of its origin and for the reason to be visible immediately in Controlling.
Timely information enables management to react fast and to bring quality and accurate business decisions.
8. Conclusion Many cost araising from business activities are impossible to eliminate because
it could ruin the sense for the business. (example- elimination stock cost). The main question is how we could reduce the costs. Costs should be optimized at the level that would provide the best effects for the price and quality of product.
In modern time of cost managing, the signifi cant role for controlling and managing costs is given to information and ERP systems, which enable cost reviews and timely information that help management to have quality reactions.
Flexibility and concurrency in supervising of cost is necessary in today’s production. Prediction on prospective costs is one of the basic requests of modern Controlling. Information presented in form of report represents the result of information system Controlling. It is of great help to the management of company. The fi nal result of the controlling is briefi ng system which presents information. And the common opinion is; „system is good the same as its data basis or transactional (accounting) information system is.
The use of Controlling system makes possible for companies to bringing accurate business decisions, that refl ects on company business profi tability.

Verica Jovanovski • Maja Horonitz • Branislav Ore{kovi}290
CROSS-CULTURAL MANAGEMENT IN PRIMARY SCHOOL THROUGH INTERNATIONAL PROGRAMMES AND
EDUCATIONAL METHODS
Verica Jovanovski, Maja Horonitz, Branislav Ore{kovi}Faculty of Economics
Postgraduate study: Management
SummaryKnowledge about value of investing into education had already been acquired in
Europe and throughout developed world. Globalization is present in all parts of life and business and therefore in formal, non-formal and informal education. In Europe, there is an effort to establish collective standards of public school systems.
Knowledge has become one of the most important economy resources. Attitude towards knowledge determines the future of the individual, the group and the society. Countries in transition (Croatia is also one of them) have necessity for structural changes of educational system. Knowledge is the factor on which Croatian citizens should build their welfare today, but also the factor on which they will create competition on European and world market in the future. The necessity of learning for the whole life shows that having only formal education is not enough – non-formal and informal education are needed as well. From present perspective, after fi nishing formal education student should expect several careers during his/her working life, and within one career several different jobs. In order to be successful, it would be necessary to study and improve one’s knowledge entire lifetime.
Indirectly, in Croatian school system are included more than 20% of citizens. When student’s parents, tutors, and adult education are added, we calculate that more than 50% of Croatian citizens are indirectly interested in quality education.
Throughout the world and Europe international knowledge standards and cooperation between schools are being developed. It is necessary to emphasize the importance of international cooperation in educational system of Croatia. Member States of the Europe cooperate through “open coordination method” – they have developed collective base of relevant statistic pieces of information. New educational programmes which enable students to integrate into the multicultural Europe have been developed. The importance is also given to the cross-cultural education which aims at understanding of differences, specifi c values, traditions, and some other features and characteristics of different societies and at opening human mind to cultural differences.

CROSS-CULTURAL MANAGEMENT IN PRIMARY SCHOOL THROUGH... 291
In this thesis there are two examples of international cooperation in education. The fi rst is European Studies Programme in “Druga osnovna škola” (“Second Primary School”) from Vukovar, and the second is UNESCO programme in primary school “Tin Ujević” from Osijek.
For the successful realization of modern educational concepts, the modern information-communication technology (ICT) is needed. ICT should be used for E-learning which requires developed global information infrastructure and high level of informatic literacy.
Croatian educational system needs permanent changing, adapting and innovating.
Introduction
In different civilizations education has had different history and it has been organized in different ways. The most effective and the most intensive way of spreading the use of technology are through education. Things are done very fast today. Modern aids of communication and circulation have overcome separation between civilizations. Today, there are no barriers to the exchange of ideas and technologies between civilizations. The most developed countries in the world invest into education which brings them immeasurable profi t – from prestige to the economic benefi t.
Today, education is different in each civilization. To be precise, high standards for pupil’s knowledge curriculum exist in Japan. At the beginning of the 21st century in Europe were established common standards of public school system. The United States are intensively working on modernizing the school system and they compare their own results to the results of other countries. For quite a long time it was believed that Russia had the most effective educational system. African countries are still searching for a system which will bring urban planning in underdeveloped areas and create developed centres.
Standpoint that education is a good investment is accepted worldwide which is evident from the amounts of money which governments give for formal education in all countries (between 5% and 6% of Gross Domestic Product) and extra budgetary amounts which different companies and organizations give for formal and non-formal education of their employees.
The standpoint of developed European countries is that Europe must invest in education that will develop employees’ basic skills during obligatory education and acquiring new knowledge during the whole lifetime (EU Commission, 1996, p. 55).

Verica Jovanovski • Maja Horonitz • Branislav Ore{kovi}292
In the European Union investments in education, researches and professional development are basic ‘intangible investments’ during which educational systems of the EU members are gradually unifi ed in order to make possible the transnational mobility of the European citizens and to develop European identity through sharing common values.
Countries in transition (including Croatia) have additional reasons for structural changes of their educational systems. They need to fi nd the way to transfer from planned to market economy, to develop democratic society and to join with European Union. Transition requires that people develop new skills which will guarantee success in fast-changing competitive society.
1. Globalization and modernization
Globalization is a process which affects the whole world. Many people see the process of globalization as the way to establish domination of the western civilization.
Modern media are based on computer technology in English which makes this language universal. America and Europe dominate over world’s technology and lead in many technological solutions which are becoming inevitable part of everyday life (mobile phones, computer technology, motor vehicle industry, etc.). Globalization is not only “westernization”; it is also “modernization”. In order to modernize themselves, some countries are asking for help from the Western countries. Elements of the supremacy of the Western countries are:
- possession and control over banking system- control over stability of currencies- the biggest consumers in the world- govern the international market- effi ciency in big military interventions- control over navigable lines - the most developed technological researches- supreme technological education- exploration of space and international communication
1. 2. Mega-nationThe result of modernization and globalization is creation of mega-nation. In
today’s fast-changing world the individual feels frustrated and tries to fi nd safety

CROSS-CULTURAL MANAGEMENT IN PRIMARY SCHOOL THROUGH... 293
in we-identity. As the we-identity is becoming more and more powerful, the feeling of safety and belonging somewhere is becoming stronger. Creation of we-identity would not be possible without the civilization. Only civilization provides needed conditions for development and spreading of power and infl uence. Due to uniting of several nations, the individual is able to fi nd power which is needed in today’s society.
2. Croatian place in new system
2. 1. Croatian orientation
Croatia is orientated towards Europe and developed countries and the future of the country depends on that orientation. The process of society orientation is based on educational system which must be future oriented. Croatia’s benefi t is in the knowledge of its citizens.
With the knowledge of its citizens Croatia can ensure its national identity. National treasure is in human potential and vision.
2. 2. Croatian plan for education development
Approaching European Union means that Croatia needs to have educational system which is equal in quality with the educational systems of the EU members. One of the guidelines is Lebanese Declaration which was established by European Council in the year 2000. Above mentioned Declaration invites EU members to modernize their educational systems in order to make the EU economy the most competitive and dynamic – the economy based on knowledge. Development plan is also based on the principles and goals of the Copenhagen Declaration from the year 2002, Declaration of European ministries in charge of professional education and European Commission for further cooperation on the fi eld of professional education, as well as on the Bologna Declaration. The Republic of Croatia signed Bologna declaration in the year 2001 and agreed to establish European standards of high education by the year 2010. This agreement is crucial and it has great importance for promoting territorial and professional mobility of the citizens and their employment.
3. Educational system
Educational system changes its goals depending on features of society development. The system contributes to the personal development of each individual, ensures quality life, active and responsible participation in common values of human

Verica Jovanovski • Maja Horonitz • Branislav Ore{kovi}294
lives, and fi nally it contributes to development of the country on scientifi c, social, economic, and cultural fi eld.
Modern educational system is based on the network of schools and other organizations which are joined into partnership. In today’s society, school is not the only educational institution and therefore we cannot reform only schools – we have to include all education participants.
3. 1. Educational system in developed countries
In developed countries educational systems include the education of the young people as well as non-formal education of the adults. More and more attention is being paid to self-education and informal education. Countries in transition that wish to join with the EU also follow this model. Modern national educational politics in developed countries are based on two concepts which have been developed by international organizations which deal with educational politics (UNESCO, OECD, ILO, the Council of Europe, European Commission). International organizations recommend these two concepts to all members and the concepts are: the concept of lifelong education and the concept of learning society.
The concept of lifelong education includes different learning strategies in all life stages. The strategies are: organized learning (education), which can be formal and non-formal, and unorganized or informal learning.
Since people need to learn all their lives but they cannot go to school all their lives, adult people educate themselves mostly in non-school organizations, i.e. in places where adults work and live. That is the reason why societies (especially developed societies) are becoming learning societies.
3. 2. Basic information about educational system in Croatia
In the Republic of Croatia there are 1 894 educational institutions (without district schools and institutions for adult education) attended by 850 722 students (children, pupils, students) and with 62 499 employees (teachers and professors).
The Republic of Croatia has 4 535 054 inhabitants. Indirectly, in school system are included more than 20% of citizens. When we add students and employees in institutions for adult education (372 institutions with 23 000 students) and more than 1 300 000 parents and guardians, there are at least 50% of Croatian citizens who are interested in quality school system. Besides being the biggest system, in developed countries educational system is also considered to be the most important one for the nation’s future.

CROSS-CULTURAL MANAGEMENT IN PRIMARY SCHOOL THROUGH... 295
3. 3. Education Development Plan in Croatia
The Republic of Croatia is developing its educational system within its own, European and world’s standards. The system should be based on our own rich educational and cultural tradition, modern social movements, and knowledge as the basic concept of the European Union.
3. 4. Priorities in developing educational system
It is very important for Croatian educational system to be based on clearly determined priorities and goals. There are four crucial development priorities:
1. Improving education quality and effi ciency 2. Stimulating teachers to improve professionally3. Developing management strategies in educational system4. Education for social connection and economic development
4. European dimension of education and intenational including
4. 1. International educational standards and school cooperation
Educational system needs at its disposal objective information / indicators of knowledge and skills acquired by students in order to evaluate knowledge and compare educational results on national and international level. In that way, the system accepts international education quality indicators, develops a model of national and international graduation and international schools, takes part in international programmes of student and teacher exchange, ensures conditions for learning two foreign languages, etc. During the process of Croatian preparation for admittance to the EU international cooperation has a very important role. International cooperation will help to examine experience and praxis of the OECD and EU member countries and useful experiences will be built in national plans. EU member countries cooperate on “open method of coordination”, which means they have joint base of statistical data, indicators, recognizing examples of good practice, expert opinions and pilot-projects. The existing list consists of 29 indicators and 5 European standards.
4. 2. New programme subsystemsDeveloping new educational programmes in compulsory education points out
preparations for living together by learning how to be tolerant which is extremely important for successful integration into multicultural Europe. When we talk about developing programme subsystem based on above mentioned principles and directives, the programme should necessarily be:
Verica Jovanovski • Maja Horonitz • Branislav Ore{kovi}296
OPEN - ensure that school and teachers have autonomy in realization of national curriculum contents and adapting them to the specifi c needs of the environment
DEMOCRATIC – to promote democratic values such as tolerance, multiculturalism, equality, protection of human rights, etc.
FOCUSED ON EUROPE – to ensure gaining knowledge about European culture and history, acquiring skills that enable communication with other European nations and developing the feeling of belonging to Europe by acquiring common values and accepting responsibility for Europe’s development
STANDARDIZED – education should be balanced, i. e. necessary skills, knowledge, and values should be represented in adequate way
4. 3. Cross-cultural educationCross-cultural education aims at developing understanding of cultural differences,
specifi c values, social rules, customs, business communication and other features characteristic of different societies. Developing awareness about essential cultural differences and prejudice people have towards other cultures is a very important part of developing cultural sensitivity and understanding. Very important task is developing cultural sensitivity and openness to cultural differences.
Levels of consciousness and cognition development (cultural differences):
Integration● Multicultural attitude● ability to integrate differences, cognitive behaviour
Adjustment● ability to think as a member of other culture● ability to change cultural standpoints
Acceptance● accepting differences in behaviour and values● to tolerate different ways of thinking
Minimizing differences● reducing cultural differences● focus on similarities between people
Defence● to believe that ones own culture is threatened

CROSS-CULTURAL MANAGEMENT IN PRIMARY SCHOOL THROUGH... 297
● to use negative stereotypes● to believe that ones own culture is superior
Denial● narrow-minded view on the world● being unaware of cultural differences● believing that some other culture is inhuman
In order to be prepared for international cooperation in the future and in order to have qualitative and educated personnel (who would be cosmopolitan, successful, intercultural), it is necessary to implement different forms of international cooperation into basic education.
5. Implementation of international cooperate programme in Druga osnovna {kola in Vukovar (Second primary school in Vukovar)
5. 1. European Studies Programme (ES)European Studies Programme promotes cooperative learning and communication
between pupils and teachers in several European countries (20 countries at the moment). The goal is to increase mutual understanding, awareness and tolerance among young people of Europe. Many educational units and themes should help pupils to exchange different interest areas. The aim is to broaden pupils’ knowledge and help them to understand their own position and human relations in Europe. Intention is to broaden pupils’ knowledge through ES programme and to develop abilities and skills which lead to better communication and awareness of benefi ts of exchange within Europe. The exchanges do not include commercial materials of local or regional interest. European Studies Programme is the antecedent of many European educational initiatives. ES is interesting to teachers because it provides them with the opportunity to use different methods which can easily be adapted to the individual needs of the pupil, the teacher, and the school. Furthermore, ES is easily used with pupils of all ages and it is the basic infrastructure of European contacts. During the course, pupils are encouraged to explore differences between European nations and to fi nd something more about the way their region contributes to European culture and identity. Pupils also develop skills needed for using modern technology and they are exposed to the foreign language (languages) which prepares them for active contribution in creating Europe’s future. Junior programme is based on curriculum (geography, history, religion, informatics, English) and it includes pupils from the age of 11 till the age of 15. Pupils are divided into 18 groups and there are pupils from 5 schools in each group (one school from the Republic of Ireland, two schools from Northern Ireland, and two schools from the rest of Europe).

Verica Jovanovski • Maja Horonitz • Branislav Ore{kovi}298
Senior programme is adapted to pupils from the age of 16 till the age of 19. In short, it is based on different educational units and themes, and it is based on curriculum (politics, culture, economy, technology).
5. 2. Aims and methods
Aims: ● to help young people to understand relationships between different cultures
and traditions in their region but also in the whole Europe● to make possible for pupils to realize their prospects through team work● to encourage young people to develop their communicational skills and skills
needed for using modern technology.
Methods:● direct work through connecting schools● programme based on curriculum● classroom methodology which emphasizes active learning● using ICT
6. Unesco programme in Primary school “Tin Ujevi}” in Osijek
6. 1. Goals of the programme in accord with UNESCO goals
»The child, for the full and harmonious development of his personality, needs love and understanding…The child is entitled to receive education, which shall be free and compulsory, at least in the elementary stages. He shall be given an education which will promote his general culture and enable him, on a basis of equal opportunity, to develop his abilities, his individual judgement, and his sense of moral and social responsibility, and to become a useful member of society.«
(Declaration of the Rights of the Child, 1959)● to promote education as the basic human right● to promote qualitative education● to encourage the use of innovative ways of teaching● to promote lifelong learning
Pupils learn about stories and legends from their region and they compare them to the stories from another countries (in this project school-partner was a primary school from Namibia). In project “Grandmother and Grandfather’s Day” pupils fi nd something more about the games their ancestors played and toys they had. In that

CROSS-CULTURAL MANAGEMENT IN PRIMARY SCHOOL THROUGH... 299
way, pupils deepen personal identity. Through project “Apple Day” pupils learn about healthy food, but they also learn about ecology.
6. 2. Long-life learning
Concept of long-life learning is based on the idea that ICT is constantly changing and therefore people need to learn all the time in order to be competitive on the European market. Fast science changes and technology progress are not always seen as a positive thing. Some people see the changes as a threat, the possibility of losing their existential base. Therefore, it is necessary to help the citizens to understand the changes and learn about them.
6. 3. Social partnership
All people who are in any way connected to education (economists, scientists, teachers, businessmen, etc.) have the responsibility to contribute to the educational process. Businessmen have great responsibility /mainly in vocational education) because they are the biggest suppliers and consumers of vocational education so it is necessary for them to invest in that kind of education. Postcomunistic countries must implement structural social changes in very bad conditions. They need to fi nd the way to transfer from planned to market economy, to develop institutions of civil society and modernize the country. These grand changes can be made only if adult citizens agree to learn. The big part of this kind of education implies self-education (informal learning of new values, attitudes and habits), or active learning (learning by doing). Still, there are many needs that cannot be satisfi ed by the means of formal and non-formal education. Because of the war, a part of the population has special social needs and it will be necessary to emphasize peaceful education. Approaching European Union means that society needs to be prepared to act according to European standards. This can be achieved by implementation of European educational politics and systematic informing about what the EU is. It is important in order to understand the way of life in the EU and to enable successful functioning of Croatian institutions within the EU. It is not enough only to harmonize regulations and institutions with European ones; it is necessary to prepare the “future Europeans” for living in the new Europe.
7. Informatization of the educational system
7. 1. ICT in education
ICT (Information and Communication Technology) is the centre of educational politics in the EU and transitional countries. The main goals are to supply schools with needed equipment, educating teachers to use ICT, purchasing and creating digital
Verica Jovanovski • Maja Horonitz • Branislav Ore{kovi}300
programmes and using Internet. Generally, the idea is to enable students to use ICT in primary schools and especially in secondary schools. Therefore, ICT is a part of educational curriculum in many countries. One of the indicators of qualitative school system is the number of pupils per one personal computer in the school. In Junior high schools of the EU countries (with the exception of Greece, Spain and Portugal) that number is less than 30. Funds for informatization of educational institutions are increasing in all the countries. In the most developed countries those funds are equal to the funds used for investing in human resources, somewhere even higher.
7. 2. Using ICT in education
New possibilities created by using ICT are of great importance. They are useful in developing all human activities and enables development of all operational systems. The use of ICT in the classroom is possible in the way of computer simulations, doing virtual experiments and self evaluation. Furthermore, by using ICT world’s knowledge on different subjects becomes easily available to pupils and teachers. At the same time, two-way communication on distance is possible, i. e. it is possible for pupils and teachers to communicate by using the means of electronic communication. In this context, teacher’s role is changing in a way that he/she becomes mentor and coordinator of the learning process. In order to exploit new technological possibilities in high education it is necessary to make ICT available to students and teachers and to teach them how to use it. In the future, after fi nishing secondary schools students will have informatical literacy, but today not even all the teachers have it. Information-communication training of teachers is a part of their life-long education.
7. 3. E-learning
ICT makes great amounts of information easily available to the society in a very short notice. Today, there is not a single education strategy document which does not mention the concept of E-learning or some of the terms like on-line education, virtual education, etc.
E-learning is extremely important for the process of globalization and for the concept of long-life learning. Microsoft, one of the most important corporations in the world, is thinking how to create the fi rst on-line university in the world. One of the main postulates is developing global informatical infrastructure. The defi nition of E-learning explains different ways of how to integrate ICT in educational process. Some modern researches show that E-learning (in comparison with traditional learning) cuts total costs in money and time. There are different models of E-learning: in the classroom, using the prepared materials individually on same other location or when

CROSS-CULTURAL MANAGEMENT IN PRIMARY SCHOOL THROUGH... 301
the whole programme is realized through Internet. The last model is the solution of modern age and is supported by LMS (Learning Management System).
Because of the great time and space distances between educational institutions from all around the world (European Studies Programme, UNESCO Programme) there is a necessity to use different models of E-learning in order to develop international educational cooperation and cross-cultural programmes. Informatical literacy of students and teachers needs to be developed constantly. It has already being done which can be seen from the curriculum of European Studies Programme. Globalization programmes in education help to develop awareness about the importance of knowing ICT and foreign languages (especially English) in order to be able to integrate successfully into the EU and world’s market.
Conclusion
There is a constant necessity to monitor changes in educational system of the EU countries as well as of the transitional countries. We should pay additional attention to realization of regulations from Bologna Declaration and documents about elementary and secondary education brought by European countries. This will enable us to plan changes of educational curriculum in due time and to schedule educational programmes.
By accepting suggestion as an open document we are deciding for constant evaluation of educational curriculum and educational system. We are aware that we have to make changes which will ensure that the system satisfi es individual needs according to economic and political system.
Economic and fi nancial development and possibilities of the country are closely connected. Our legacy and consequences of the war will be felt for a long time and they are already complicating investment into knowledge, human capital and modern technology. Due to the initiated processes dealing with fi nancial issues, continuation of development of macroeconomic politics can be expected (it should enlarge investments, reduce budget defi cit, etc.). According to all those changes, we can also expect changes in education and science.
Important condition for successful changes in education is establishing connection between the education and economy and accepting increased investing in order to develop educational system. Great technological changes refl ect on production and the way of working in many services. Informatical literacy of citizens is an important issue for development of educational system but also for development of the whole society. Therefore, informatical education of teachers and students, and investing in technological equipment is the main educational priority. Instead of

Verica Jovanovski • Maja Horonitz • Branislav Ore{kovi}302
sporadic reforms, we have to change, reform and modernize our educational system systematically and constantly.
References:
[1] Ured za strategiju razvitka RH, 2002., «Bijeli dokument o hrvatskom obrazovanju»
[2] Strategy for the Development of the Republic of Croatia, 2001. Croatia in 21st
CenturyEducation[online].
Available: [http://www.hrvatska21/inglese/public_administration.pdf]
[3] World Education Forum, 2001. The EFA 2000 Assessment: Croatia Country Report [online].
Available: [www.unesco.org/wef/countryreports/croatia]
[4] Okvirni nastavni plan i program za osnovne škole u Republici Hrvatskoj u 2004./05. školskoj godini, Zagreb: Ministarstvo kulture i prosvjete Republike Hrvatske i Zavod za školstvo.
[5] Projekt hrvatskog odgojno-obrazovnog sustava za 21. stoljeće, Ministarstvo znanosti, obrazovanja i športa Republike Hrvatske
www.mzos.hr
[6] Fikreta Baktijarević Šiber (1999.): Management ljudskih potencijala, Golden marketing, Zagreb
[7] Povjerenstvo Europske zajednice (1996.). Prema društvu koje uči (Bijeli dokument o obrazovanju) Zagreb: Educa.
[8] Budin, L. i sur. (2001.). Informacijska i komunikacijska tehnologija. Zagreb: Ured za strategiju razvitka Republike Hrvatske.

ANALYSIS OF FACTS AND DILEMMAS OF GLOBALIZATION ACTIVITIES 303
ANALYSIS OF FACTS AND DILEMMAS OF GLOBALIZATION ACTIVITIES
Linda Jurakovi}Rocco Art Gallery, Pore~, Croatia
Giorgio CadumGoran Fabris
Riviera Holding d.d., Pore~, Croatia
Summary
This paper critically analyzes the key elements (world trends, national identity, human resources, market) of the effects of globalization on the market, as well as the role of our country in the entire process, listing practical examples. Through comparison and analysis of the available literature and experience, it was concluded that there is a dual impact of globalization in the economic sphere and the need for including management into world trends is increasing. The turbulent environment demands increasingly rapid adaptation of outdated management methods towards more progressive and modern methods, for that which was new yesterday may already be old today.
KEY WORDS: globalization, economy, management, market
1 Introduction
The objective of this paper is to analytically and descriptively explain the existing global situation and the role of Croatia and ourselves in that system as a whole. Practical examples show the global activities of a tourism company, Riviera Holding d.d. Poreč, as well as its refl ection on the life and work of its employees. The advantage of systematization and selection of this company results from the fact that the authors are also employees of this company. They themselves directly impact the implementation of novelty in the tourism offer and the entire organization of operations without excluding themselves from the primary policies of the economic entity, which is quality, satisfaction of guests and employees and profi t. Globalization has brought many changes and dilemmas to the world market. Though adequate in many segments, it is often destructive in terms of issues of human values such as national dignity as a part of the tourism offer. The assimilation of young managers

Linda Jurakovi} • Giorgio Cadum • Goran Fabris304
in global activities is a demanding and dynamic process which requires constant change from human resources and employees to work technology and operations organization.
2 Globalization activities
When we speak of globalization, the question is often posed as to whether globalization needs to be adapted to people or whether the whole world population needs to adapt to the globalization effect. For years, globalization has impacted activities in politics on the international scene, thereby reducing the distance between nations, and the traditional generalization with the assumption of diversity among people has also changed. Based on that, globalization has connected the continents through communications (telephones, computers, satellites, Internet, etc.). The technology of transport is also based on rapid delivery, for example, “delivery of a 0.5 kg package from Zagreb to Tokyo takes 36 hours and costs 100 Euro”1. We could also refer to the increased transfer of resources. A large amount of money is available in only seconds to various recipients throughout the world. Credit cards have become an unavoidable means of payment, and stocks from throughout the world can be purchased in many places on any given day. The banking system, under constant competition pressures, has led its participants to strive to have better and cheaper services. “Globalization cannot be stopped or turned back. It is the result of the demanding market for better goods and services, and is drives its participants towards constant improvement”2.
However, for the market to function as a free market system, and for the consumer to become aware of the power of globalization, it is often necessary to seek the purpose of such a glamorous project from the perspective of the “anti-globalists”. To pose a question. Has globalization, in its great turbulence, created excessive social inequality, a rift between rich and poor and created large unemployment? It is obvious today that the big are “eating up” the small. Is work protection optimized and how can we respond to the increasing radical attacks by unions? Workers (and oftentimes among them children) are working in worse and worse conditions. Do the international corporations, responsible for the globalization process, hear the shouts of nature which has been poisoned with acid rains and other chemical derivatives and endless devastation, seeking help which is commonly lacking because fi nancing the reclamation process is so expensive that it could cause companies to go bankrupt?
Though we live in a world where change is fast and dynamic, we must understand and accept that unless we wish to incorporate these changes into a just
1 L. E. Andersen, Globalizacija, zašto ne uspjeva?, Stajer-graf d.o.o., Zagreb ,2003, p.212 L. E. Andersen, ibid, p. 22

ANALYSIS OF FACTS AND DILEMMAS OF GLOBALIZATION ACTIVITIES 305
world economic force, they must be based on the existing system of values, which includes man and nature as the main actors in Earth’s biological diversity. If we look back into the past, we could say that the words of the distinguished 18th century economist Adam Smith (author of ‘Wealth of the Nation’, 1776) in fact came true, stating that society would experience its maximal economic development only when the market could function independently and without the involvement of the state. Today’s massive privatization bears witness to the truth of his words, though there is also the public sector which, with its authority, infl uences the politics of public matters such as education and security. A second question must be posed. Are those countries which are less economically development prepared in terms of social and political organization for the invasion by large multinational corporations? If there is no international regulation for such a situation, is the priority to implement an international fund which would primarily work to protect citizens (consumers) from all the centripetal and centrifugal forces of economics, the likes of which our society for one has not yet seen. The issue of tax, profi t, value added tax and other contributions and tax breaks, can occasionally become a stumbling stone in which the host country, or “donor” of something that is not always easy to donate, is most often damaged, as everything revolves around profi t.
We will not and wish not to insinuate that the concentration on protecting national interests before global issues is superseded by nationalism or politics, but is instead a base of successful cooperation in which two entities such as importing mega companies and the domestic market would achieve a true blossoming with the right economic strategy, but only with the existence of mutual respect. The animosity which appears towards the press on the one hand or the curiosity towards foreign investments following the process of globalization can be reduced to the level of “healthy” thinking only through educative activities on the thought process and anticipation of the people. The extent to which advertising agencies, propaganda activities and more is obviously a part of the story which should be left to the experts, particularly interdisciplinary managers and other experts from the fi eld of globalization. If we look around us, we will see that thirty years olds in Australia, Italy or Croatia look about the same. The same or similar fashion, interests, desires – all this is closely related thanks to globalization. However, can this similarity reconcile other cultural differences among people? Isn’t the utopian ideal too bold, that globalization can change our cultural identity which did not only develop parallel to globalization but was built up over generations, independent of all the technological turmoil?
Is not the concept of globalization contradictory to the position of the standing theories of sociologists, pedagogs, culturologists, ethnologists, etc. that diversity is both lovely and desired? Where is the happy median and is that happy median

Linda Jurakovi} • Giorgio Cadum • Goran Fabris306
implemented into the Maslow hierarchy of needs and priorities, or will we have to set our own median in accepting globalization in terms of our own needs and desires? Excluding all dogmatism of various empirical or experiential theories, and with much progressive spirit and faith in the new world economy, we could conclude that the globalization process brings with it economic development, for the entire world market is accessible to manufacturers from around the world, and the cause of this is the rapid development of technology in the last few decades. The effi ciency of private companies in this process is seen in various contributions (value added tax, corporate taxes, employment…) and talented individuals can often infl uence fi scal policies of the ruling structures. The volatility of capital also infl uences the policies of the public sector. In Croatia, globalization could stimulate several regions in their developmental path, but in the manner that the exploitation of offered resources does not become extreme, for extremes often ended up defensive and mutually harmful. “Each individual has his breaking point, where his tolerance ends, as does each society”3.
The majority of would agree that globalization presents a process of economic, social, cultural and political activity and surpasses the boundaries of national states. Unlike modernization, globalization is a process which unfolds independent of the desires of all its participants. “Today’s communications and information links have eliminated the importance of space, which is an assumption of the globalization process”4. To a certain extent, this is a sort of threat to the cultural and national identity which give the world its diversity. Today’s modern economy is primarily based on knowledge and an interdisciplinary approach. The examples which best illustrate this are the products which leave many “uninformed” people speechless. Intelligent clothing, containing chips, credit and other cards, houses with special alarm devices, intelligent cars, microradios and TV, telephones with special additions and the like are now being manufactured. The new economy is becoming increasingly digitalized, for numerous data saved in bites can be forwarded anywhere at the speed of light. Such an economy is as virtual as it is innovative, and innovations today are livelier than ever.
It is though it has become normal to make our own new products obsolete today, for if we do not, someone else will. “In innovative companies, the life cycle of products is constantly being shortened. Japanese car makers change their product line every two years, while mass consumption electronics manufacturers change their lines every three months”5. Progress is unfolding exceptionally fast and what
3 L. E. Andersen, ibid, p. 884 A. Milardović (ed.), Globalizacija, Pan liber , Osijek-Zagreb-Split 2001, p. 145 A. Milardović , ibid, p. 90

ANALYSIS OF FACTS AND DILEMMAS OF GLOBALIZATION ACTIVITIES 307
was brand new this morning is already a thing of the past by evening, as something newer and better has taken its place.
The socio-economic development of Croatia in the 21st century is deeply linked to the issues of cultural and national identity. In creating its own independent state, Croatia had to free itself from a model of development based on the egalitarian communist ideology.
In the conditions of globalization trends and European integration and strengthened regionalism, a new development strategy has appeared. The new development system in Croatia was supposed to have been “gentle” development due to the deeply rooted ideology of the past, instead of rapid and radical changes, leaning on information and the cultural and social capital of the nation without neglecting the wealth of natural resources. Therefore, through the use of all available resources, with tolerance and maximum human potential, our country would become one of the centres of prosperity and beauty in this part of the continent. The process of such creation is neither long nor diffi cult, it is simply here, but the issue is whether or not we can recognize it as such. Of course, for this to be so, “a consensus in Croatian society must be established between the traditional religious and secular ideologies”6. If we allow ourselves to have a stable Croatian identity, we can then allow for thinking of a modern European identity as a part of us and us as a part of that whole. “Croatia is a country with a small internal market, and so the openness of its economy towards the world market is a developmental imperative”7. We could conclude that Croatia, as a small country, primarily needs to resolve its permanently safe position in the international movement and to harmonize global trends with the interests of its citizens.
3 Globalization and innovation
Globalization of the economy and large international competition are based on both fl exibility and innovativeness, the strength of which is increasingly incorporated in the fundamental education of many managers throughout the world. Today, innovators and managers are raised and taught under mentorships in this learning process.
The basis of innovation is creativity which anticipates new ideas, thoughts and is free from prejudice. Freedom from prejudice does not mean the absence of the ethnological identity, but implies a different and more open way of looking at
6 A. Milardović, ibid, p. 277 Restrukturiranje gospodarstva Rep. Hrv. i globalizacija, Znanstveni skup Susreti na dragom kamenu
1998, Pula, p. 45

Linda Jurakovi} • Giorgio Cadum • Goran Fabris308
considering that identity. Imagination is the driving force, the “turbo engine” which must act day and night (where possible) in order to adapt to the demands of the market. The antagonism which has arisen through our training or under infl uence of the environment, if we plan to enter the market battle, must be held on the sidelines or at a minimum. If we include all the steps into the phases of our creative process, such as: preparation, incubation, illumination and verifi cation of ideas with openness towards world trends, progress is on the horizon. Unlike earlier innovative creations which were directed at convergent thought, today’s divergent though is not only a trend but also necessary due to the increasing demands of the market. Fluency of team work has become the backbone of innovativeness in management, and the pseudo listening which was until recently a component of team work has become a thing of the past. Today, novelty is demanded from everyone. Traditional models of organization based on a hierarchical authority should also become a thing of the past. Instead of such “layering”, a new “information organization” is being formed, based on responsibility with a circular fl ow of information. In this process, the media certainly plays an important role for it is often easier to create an innovation than to sell it on the market. To be innovative and creative is today a part of strategic management in the global economy. Such a way of doing business and thinking if crossing boundaries or, what commonly happens in practice, is reduced to a single person bearing too many responsibilities (typical for Croatian managers), which can result in stressful situations. “It appears that the danger to health is greatest with those whose jobs cause great tension: large pressures and demands in carrying out tasks where we have little or no control”8. We need to know that creativity and innovativeness are not suffi cient in and of themselves in the creative and competitive process on the market unless we use the relevant scientifi c results with a special refl ection on the quantitative handling of studies. “The majority of quantitative data collection is conducted only when the need for that data arises, i.e. ad hoc (52%). Continuing studies (48%), on the other hand, are primarily of a quantitative character and use special instrument panels for compiling data”9.
Experience, observation and quantitative analysis today are not only necessary but also relevant as a means of existence on the global scene, where values are criteria change daily. Today, people change ideas and theories with exceptional speed and ease. The old has begun to die off slowly, while the new has not yet been fully born. That is why all we do or think needs to be more creative and different. The society that has been offered to us for co-habitation is a combination of intelligence, knowledge and creativity. The speed and “infallibility” of intelligence machines is complemented by intuition and invention of creative individuals or teams. Ideas are pulled forward and information is INNOVATION!
8 D. Goleman, Emocionalna inteligencija, Mozaik knjiga, Zagreb, 1997, p. 1819 Scientifi c expert journal ‘Ekonomska istraživanja’, Pula 1998, p. 105

ANALYSIS OF FACTS AND DILEMMAS OF GLOBALIZATION ACTIVITIES 309
“Simply put, creativity is the foundation for innovation, and innovation is the result of applied creativity”10. Though every creative idea need not become innovation, there is certainly no innovation without creativity. Unlike creative people thinking up something new, the innovator has both the knowledge and ability to bring these thoughts to life. Therefore a combination of creativity and innovation, if we can fi nd it in one person, is immeasurable wealth in today’s management and society. However, managerial psychological theory states that there are many blockades which hinder the creativity of the individual, organization or entire society. These are various molecules of stereotypes, conformism, ideological paradoxes and political insinuations. For example, the rejection of another’s ideas or fear of the unknown, bureaucratic barriers, overspecialization, fear of mistakes and responsibility, limited resources and routine. Why is inventiveness today the tendency for conquering the market and organization? Because creative organization directs its work towards quality, ensuring the free fl ow of information, decision-making by consensus and creation of an organizational synergy. In such an organization, the goal does not justify the means, and management is on the basis of a good example. Today, management needs to be more prepared than ever to eclecticism in its ranks. Or rather, to take value from anything and anyone. When we speak of a good manager, we often emphasize charisma. This can be defi ned as a special ability of the person to lead and inspire those under him. However caution is required with such individuals, as excessive certainty in one’s own abilities unfounded on experience and knowledge can lead the company into failure, instead of onto the pedestal.
The most important characteristic of inventive management is seen in the changes in conduct towards its employees. The manager becomes a coach, a team leader, a democratic motivator and not an autocratic leader trying to prove his power or heal his complexes at the expense of his staff. The path to self-realization and learning of the “new age” manager is a long road. Today – new, tomorrow – old, instead of becoming a stumbling block, they need to become the backbone of progress and motivation for more, better, faster and higher quality.
1.1 Organizational conduct in Riviera d. d. Pore~ (practical case)Riviera d. d., as the largest tourism company in these parts, began the restructuring
process at the beginning of this century. In a short timeframe, signifi cant personnel and organizational changes were made. Considering that large changes brought about daily by the EU economy, which are directly related to the standard of living of people where a large portion of the home budget is used to satisfy the primary existential needs, and only later secondary pleasures (such as holidays), Riviera has
10 V. Srića, Kako postati pun ideja, M.E.P. Consult, Zagreb, 1997., p.43

Linda Jurakovi} • Giorgio Cadum • Goran Fabris310
had to adapt its offer to such market demands, without excluding the factor of quality in its offer. Content such as wellness (spa), artistic workshops, Pilates recreation programs, rural excursions and more have been implemented. The uncertainty of taking vacations for both domestic and foreign guests led the company to implement Last Minute offers, which was also refl ects on the need for seasonal staff. Maximum booking of capacities, and with that maximum profi t, required a reorganization of the company such that its resources were adapted to market needs.
Phase 1: was characterized by the arrival of managers from other companies, occasionally without experience. Autocratic leadership and cost cutting were emphasized. For many managers, this approach was unacceptable and eminently lead to their transfer or retirement.
Phase 2: was the shift from an autocratic to a democratic manner of management. The tendency was to have as many middle level employees develop a desire to prove themselves. Efforts were made to create a positive climate in the organization, stimulating motivation in several ways:
- additional bonuses,- promotions in the hierarchy of middle management,- giving employees privileged status.
The hierarchy at the end of phase 2 was a matrix organization. Tasks were organized centrally for the profi t centre (PC), and teams formed for projects which included ambitious managers who would use their creativity and innovativeness to create attractive content.
Such projects are exceptionally important for transition societies such as ours, were activities are formed parallely to take over the work of earlier activities, without affecting company operations. In order to ensure the quality of the restructuring process, a group of managers in Riviera d.d. conducted a SWOT analysis which then formed the baseline for taking certain measures. As the organizational restructuring is not an independent process but is instead intertwined and dependent on other variables within itself and its environment, the SWOT analysis provided an initial overview of the situation.
Weaknesses:
- a poor image of the company- obsolete products which can no longer be sold on the market
Group of obsolete products leads the company to survive on the market at any costs, meaning dumping prices and not loyal competition

ANALYSIS OF FACTS AND DILEMMAS OF GLOBALIZATION ACTIVITIES 311
Opportunities:
- with new organization, administration costs could be reduced as the sectors would carryout the most expert work with the lowest costs for the PC
- unlike in the pyramidal hierarchy, responsibility is moved down to the middle management which runs the actual operations
- each PC, as a line of products, is viewed individually, which gives insight into the level of the life cycle for individual products and the need for their application and positioning on the market
- all this together leads to a greater market share with improved profi ts- consumers are satisfi ed as they feel as though they purchased the right products
on the market, in line with their abilities
Strengths:
- such an organization reduces administration costs- implementation of project teams leads to better quality ideas and their
realization, which advances and differentiates the product- a better quality product and its positioning substantially reduces promotion
costs- new organization implies the application of new technology, which allows us
to be more proactive on the market- implementation of innovations and other content for an active vacation
Threats:
- globalization has brought great competition (Turkey, Greece, Spain, Italy)- consumer expectation of always receiving added value for the money. As the
party offering value, Riviera d.d. needs to constantly improve the quality of its product (in hotels, apartments, camps)
- currency exchange differences against other national currencies not in the EU system (i.e. the value of the Pound against the Euro currently makes our destination up to 25% cheaper)
4 ConclusionsThough globalism sings the praises of free world trade and it is said that the
global economy is a means for increasing prosperity throughout the world and serving environmental protection, we get the impression that this same “economic power is changed into a political target of power towards the model of subordinate

Linda Jurakovi} • Giorgio Cadum • Goran Fabris312
consequences: the actors of the world economy are causing a turnabout in the world movement on the model of the policy of the subordinate consequence. This political game with its subordinate consequences of world economic activities is increasing the target power of capital”11.
It elegantly turns out that we are still living in a world far from the true model of freedom. “The high unemployment in the so-called Third World and post-Communist countries of Europe are forcing the governments of these countries to lead economic policies oriented at export, at the expense of social and ecological standards. With low salaries and frequently poor working conditions, these countries compete against each other and against wealthy countries for foreign capital”12. The theory that world trade has sharpened competition and led to a reduction of costs is somewhat cynical. Less is said about the fact that there are two models for cost reduction, and those are increased effi ciency through technology (organization) or, contrary to this, by the violation of proper labour and production standards. Obviously, there is no single defi nition of globalization for the overall conclusion is that there are varying ideas about what globalization truly is or should be. “This is not an issue of linguistic weakness, but of varying interpretation”13.
If global corporations change the world economy through the control of their basic sources of commerce, such as manufacturing technology, fi nancial capital and sales, even the managers of such corporations are “aware of the fact that ideology, like cookies, can only be well placed on the market if skilfully packaged”14. Today, many managers, economists, politicians and sociologists emphasize that world commerce cannot be achieved without thorough changes to the old national states. Regardless of the ideal of progression, we could ask what our role is in this game, and through our knowledge and experiences have we become worthy rivals and co-players that can play this game in front of a full stadium crowd? Successful management in the globalization process must detect changes in its environment in time to adapt to trends which it cannot infl uence for they have become a given condition in activities in world terms.
Literature:
1. Andersen, L. E. (2003): Globalizacija, zašto ne uspijeva?, Stajer-graf, Zagreb2. Cameron, J. (1999): Zlatni rudnik, Optima, Ljubljana
11 U. Beck, Moć protiv moći u doba globalizacije, Šk. Knjiga, Zagreb, 2003, p. 164-16512 U. Beck, ibid, p. 27413 A. Baricco, knjižica o globalizaciji i svijetu koji dolazi, AGM, Zagreb, 2004, b. 6914 R. J. Barnet, R. E. Muller, Globalni zahvat, Globus, Zagreb, 1974.

ANALYSIS OF FACTS AND DILEMMAS OF GLOBALIZATION ACTIVITIES 313
3. Collins, E. G. C., Devana, M. A. (1994): Izazovi menadžmenta u XXI. Stoljeću, Mate d.o.o., Zagreb
4. Baricco, A. (2004): Knjižica o globalizaciji i svijetu koji dolazi, AGM, Zagreb5. Barnet, R. J., Muller, R. E. (1974): Globalni zahvat, Globus, Zagreb6. Beck, U. (2004): Moć protiv moći u doba globalizacije, Školska knjiga, Zagreb7. Beck, U. (2003): Što je globalizacija?, Vizura, Zagreb8. Dujšin, U. (1998): Restrukturiranje gospodarstva Rep. Hrv. i globalizacija,
znanstveni skup «Susreti na dragom kamenu», Pula, vol. 11, no. 1-29. Ekonomska istraživanja (1998): znanstveno stručni časopis, Pula-prosinac, vol.11,
no. 1-210. Goleman, D. (1997): Emocionalna inteligencija, Mozaik knjiga, Zagreb11. Milardović, A. (2001): Globalizacija, Pan liber, Osijek-Zagreb-Split12. Srića, V. (1997): Kako postati pun ideja, M.E.P. Consult, Zagreb13. Srića, V. (1994): Upravljanje kreativnošću, Školska knjiga, Zagreb14. Stevanović, M. (1997): Edukacija za stvaralaštvo, Tonimir, Varaždinske Toplice


Finance


CONNEXIONS BETWEEN MOTOR LEASING AND INSURANCE IN ROMANIA 317
CONNEXIONS BETWEEN MOTOR LEASING AND INSURANCE IN ROMANIA
Marius Gavriletea, Ph.D.Babes Bolyai University, Faculty of Business
AbstractThe purpose of this paper is to show how important leasing is for companies and
individual persons. We will analyze the leasing market, the auto market (because a great part of the leasing fi nancing is for new vehicles) and present some real cases. Because every leasing contract involves an insurance policy, we will analyze the most important aspects of such a policy, the terms and some delicate problems. It will be presented how insurance differs from a leasing contract to a common insurance policy.
Keywords: leasing, insurance, risk assessment, loss handle
Is it known that leasing represent one of the fi nancing techniques for all kind of entities (companies and individuals)? Romanian leasing market includes a lot of companies, and the establishment requirements are not so restricted: the leasing activity is the only activity of the company, and a 50.000 Ron (Ron is the local currency) social capital (that means almost 14.000 euro). There is a local association called Romania Leasing Association (ASLR) that includes more than 40 leasing companies, from more than 200 active. The market share of this 40 leasing companies is almost 60%. The others leasing companies, are small leasing companies.
At the end of 2004 the leasing market in Romania has the following structure:
- Leasing companies that are affi liated to banks (10%);
- Leasing companies affi liated to some producers or product suppliers (15%);
- Independent leasing companies (75%).
Also the leasing market is a very dynamic one, if we take into account the evolution of the leasing contracts values in euro, for the companies in the interval 1998 – 2004:

Marius Gavriletea318
- mil.EuroYear 1998 1999 2000 2001 2002 2003 2004Members of ASLR 128,5 202,9 340,0 587,6 624,1 850 1029
Not members n/a 82,1 82,2 374,4 275,7 550 786
TOTAL - 285 422,2 962,0 899,8 1400 1815
So in the past 5 years, the leasing market has grown almost 7 times. There can be some explanations: in the local market appeared international companies with very good leasing experience and low rates, and the local competitors adjusted their offers to face the strengthen competition. The advantage of these policies is that a lot of companies decided to fi nance theirs activities by leasing. Once the market evolves itself, the companies get used with leasing operations.
In Romania there are 2 major leasing types: - operational and fi nancial (both are intern leasing), and cross border leasing.
Financial leasing is addressing to persons and to companies and has some advantages: low banking costs, only the depreciation is deductible, no need to obtain BNR (National Romanian Bank), import operations made by the leasing company, the leasing payments are in Euro and paid in Ron. Also the auto insurance is included in the monthly leasing payment.
The operational leasing has the following advantages: all the monthly leasing payment is deductible, the payment are in Euro, import operations made by the leasing company, auto insurance is included in monthly payment.
The major contracts are internal, and the cross border leasing is used only as international fi nancial leasing. Most of the results used in this research refer only to the members of ASLR, because the nonmembers don’t publish this facts, and the National Statistic Institute don’t have a special part for leasing companies.
Financial leasing- members ASLR
Operational leasing - non members ASLR
2003 2004 2003 2004cross-border
cross-border
cross-border
cross-border
Contracts 90.49% 2.16 % 94.96% 0.97 % 7.35 % - 4.07 % _Values 80.23% 5.8 % 90.91% 2.05% 13.97 % - 7.04% _
As we can notice since 1998 the numbers of transactions has continuously grown, so at the end of 2004 the total fi nanced goods were more than 1 billion euro that means more than 30% increase from 2003. These facts are emphasized by economical growth, companies’ organizational behavior.

CONNEXIONS BETWEEN MOTOR LEASING AND INSURANCE IN ROMANIA 319
The fi nancial leasing still remains the main orientation of the leasing contracts:
Financial Leasing - members ASLR Operational Leasing - members ASLR
2003 2004 2003 2004cross-border
cross-border
cross-border
cross-border
Contracts 90.49% 2.16 % 94.96% 0.97 % 7.35 % - 4.07 % _Values 80.23% 5.8 % 90.91% 2.05% 13.97 % - 7.04% _
The most important customers of the leasing companies are the commercial companies. In 2004 this segment enhanced a percent of 74.90 % from the total fi nancing, 17.40 % were NGO (Non Governmental Organization) and Public Entities and the rest of 7.70 % are individual entities.
In the next table we have the statistic of the contracts with commercial companies, taking into account the value of the assets and the number of the contracts:
Financial leasinglegal entities
Operational leasing legal entities Total
2003 2004 2003 2004 2003 2004Value of assets (mil Euro) 492.5 704.14 32.8 30.06 525.3 734.20
% of the total market 72.97 % 83.71 % 4.86 % 3.57 % 77.83 % 87.28%Contracts 28012 40963 2106 1948 30118 42911% of the total market 82.32% 82.98% 6.19% 3.94% 88.51% 86.92 %
The leasing contracts (for ASLR members) referring to the object of the contract, have the following structure:
% din total - 2003 % din total - 2004Auto vehicles, out of which : 87.84 % 92.67 %
Cars 56.25 % 61.06 %Utility vehicles &
31.61 %Commercial vehicles 31.59 %Buses
Industrial equipment 5.90 % 4.04 %Agricultural equipment 2.32 % 0.67 %Aircrafts, ships 0.03 % -Railway rolling stock 0.02 % -Others (medical technique) 2.19 % 2.36 %Real estate – offi ces 1.60 % 0.21 %Real estate – residential 0,10 % 0.05 %
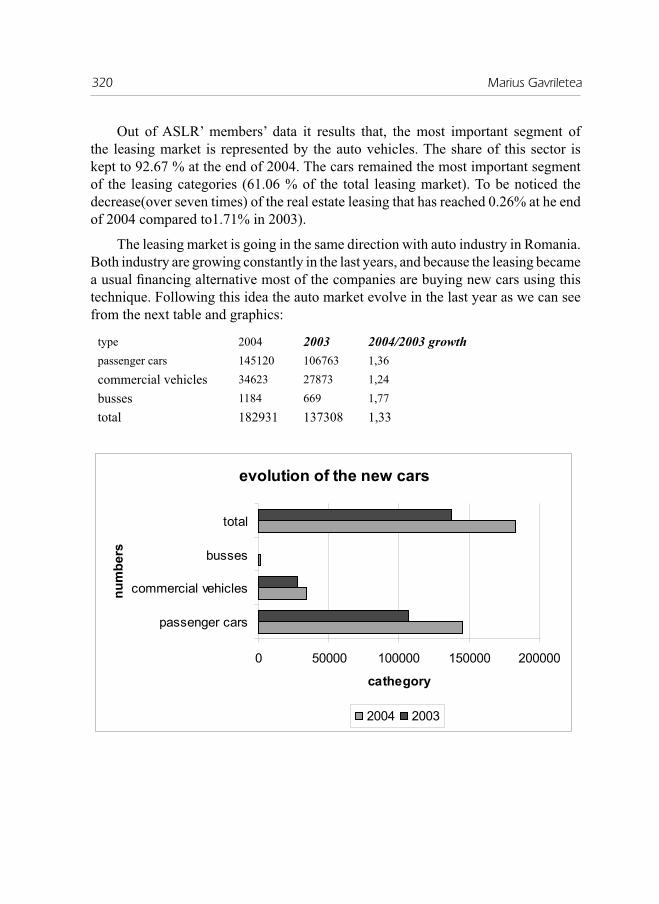
Marius Gavriletea320
Out of ASLR’ members’ data it results that, the most important segment of the leasing market is represented by the auto vehicles. The share of this sector is kept to 92.67 % at the end of 2004. The cars remained the most important segment of the leasing categories (61.06 % of the total leasing market). To be noticed the decrease(over seven times) of the real estate leasing that has reached 0.26% at he end of 2004 compared to1.71% in 2003).
The leasing market is going in the same direction with auto industry in Romania. Both industry are growing constantly in the last years, and because the leasing became a usual fi nancing alternative most of the companies are buying new cars using this technique. Following this idea the auto market evolve in the last year as we can see from the next table and graphics:
type 2004 2003 2004/2003 growthpassenger cars 145120 106763 1,36commercial vehicles 34623 27873 1,24busses 1184 669 1,77total 182931 137308 1,33
evolution of the new cars
0 50000 100000 150000 200000
passenger cars
commercial vehicles
busses
total
num
bers
cathegory
2004 2003

CONNEXIONS BETWEEN MOTOR LEASING AND INSURANCE IN ROMANIA 321
procentual growth
1,36 1,24
1,77
1,33
0
0,5
1
1,5
2
passenger cars commercialvehicles
busses total
type of the car
perc
enta
ge
2004/2003 growth
import2004 import2003passenger cars 59165 42144 1,403877commercial vehicles 13809 10297 1,34107busses 1184 663 1,785822total 74158 53104 1,396467
Because of the real competition with the leasing companies, the offer of the Romanian Commercial Bank – the biggest Romanian bank (BCR), the motor credit is a very simple one, without a real guaranty. For example, if a person wants to buy a new car, with 30,000 euro, the credit period is up to 7 years. All it is needed is a proof of income and a credit history.
So the Romanian people have to make a decision related to buying a car with credit or by leasing.
For this research, they gave us the following simulation, the credit for a new limousine. We assumed that this is a CIP price (in order to have an accurate comparing with the leasing simulation). In the credit case we have a bank commission of 3% of the CIP price, 20% the fi rst deposit, and the period of 3 years:

Marius Gavriletea322
CREDIT OFFER
Currency EUR Initial commission (3%): 720.00 CIP price: 30,000.00 First Payment: 6,000.00 20.00%Total Credit: 24,000.00 Auto insurance (4.7%/year) : 1,410.00Rates: 36 Interest (%): 9.75 Monthly payment: 771.60
Initial Sold Main payment Interest Monthly Payment Final Sold1 24,000.00 576.60 195.00 771.60 23,423.402 23,423.40 581.28 190.32 771.60 22,842.123 22,842.12 586.01 185.59 771.60 22,256.114 22,256.11 590.77 180.83 771.60 21,665.345 21,665.34 595.57 176.03 771.60 21,069.786 21,069.78 600.41 171.19 771.60 20,469.377 20,469.37 605.28 166.31 771.60 19,864.088 19,864.08 610.20 161.40 771.60 19,253.889 19,253.88 615.16 156.44 771.60 18,638.7210 18,638.72 620.16 151.44 771.60 18,018.5611 18,018.56 625.20 146.40 771.60 17,393.3612 17,393.36 630.28 141.32 771.60 16,763.0913 16,763.09 635.40 136.20 771.60 16,127.6914 16,127.69 640.56 131.04 771.60 15,487.1315 15,487.13 645.77 125.83 771.60 14,841.3616 14,841.36 651.01 120.59 771.60 14,190.3517 14,190.35 656.30 115.30 771.60 13,534.0518 13,534.05 661.63 109.96 771.60 12,872.4119 12,872.41 667.01 104.59 771.60 12,205.4020 12,205.40 672.43 99.17 771.60 11,532.9721 11,532.97 677.89 93.71 771.60 10,855.0822 10,855.08 683.40 88.20 771.60 10,171.6823 10,171.68 688.95 82.64 771.60 9,482.7224 9,482.72 694.55 77.05 771.60 8,788.1725 8,788.17 700.19 71.40 771.60 8,087.9826 8,087.98 705.88 65.71 771.60 7,382.0927 7,382.09 711.62 59.98 771.60 6,670.4828 6,670.48 717.40 54.20 771.60 5,953.0729 5,953.07 723.23 48.37 771.60 5,229.8430 5,229.84 729.11 42.49 771.60 4,500.7431 4,500.74 735.03 36.57 771.60 3,765.7132 3,765.71 741.00 30.60 771.60 3,024.7133 3,024.71 747.02 24.58 771.60 2,277.6834 2,277.68 753.09 18.51 771.60 1,524.5935 1,524.59 759.21 12.39 771.60 765.3836 765.38 765.38 6.22 771.60 0.00Total 24,000.00 3,777.57 27,777.60
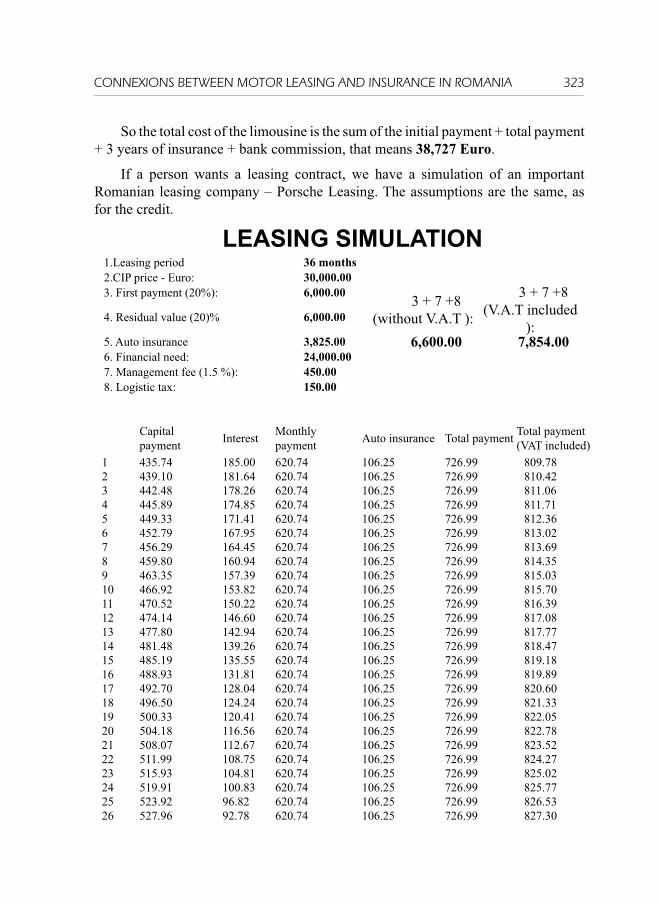
CONNEXIONS BETWEEN MOTOR LEASING AND INSURANCE IN ROMANIA 323
So the total cost of the limousine is the sum of the initial payment + total payment + 3 years of insurance + bank commission, that means 38,727 Euro.
If a person wants a leasing contract, we have a simulation of an important Romanian leasing company – Porsche Leasing. The assumptions are the same, as for the credit.
LEASING SIMULATION1.Leasing period 36 months2.CIP price - Euro: 30,000.003. First payment (20%): 6,000.00 3 + 7 +8
(without V.A.T ):
3 + 7 +8 (V.A.T included
):4. Residual value (20)% 6,000.00
5. Auto insurance 3,825.00 6,600.00 7,854.006. Financial need: 24,000.007. Management fee (1.5 %): 450.008. Logistic tax: 150.00
Capital payment Interest Monthly
payment Auto insurance Total payment Total payment (VAT included)
1 435.74 185.00 620.74 106.25 726.99 809.782 439.10 181.64 620.74 106.25 726.99 810.423 442.48 178.26 620.74 106.25 726.99 811.064 445.89 174.85 620.74 106.25 726.99 811.715 449.33 171.41 620.74 106.25 726.99 812.366 452.79 167.95 620.74 106.25 726.99 813.027 456.29 164.45 620.74 106.25 726.99 813.698 459.80 160.94 620.74 106.25 726.99 814.359 463.35 157.39 620.74 106.25 726.99 815.0310 466.92 153.82 620.74 106.25 726.99 815.7011 470.52 150.22 620.74 106.25 726.99 816.3912 474.14 146.60 620.74 106.25 726.99 817.0813 477.80 142.94 620.74 106.25 726.99 817.7714 481.48 139.26 620.74 106.25 726.99 818.4715 485.19 135.55 620.74 106.25 726.99 819.1816 488.93 131.81 620.74 106.25 726.99 819.8917 492.70 128.04 620.74 106.25 726.99 820.6018 496.50 124.24 620.74 106.25 726.99 821.3319 500.33 120.41 620.74 106.25 726.99 822.0520 504.18 116.56 620.74 106.25 726.99 822.7821 508.07 112.67 620.74 106.25 726.99 823.5222 511.99 108.75 620.74 106.25 726.99 824.2723 515.93 104.81 620.74 106.25 726.99 825.0224 519.91 100.83 620.74 106.25 726.99 825.7725 523.92 96.82 620.74 106.25 726.99 826.5326 527.96 92.78 620.74 106.25 726.99 827.30
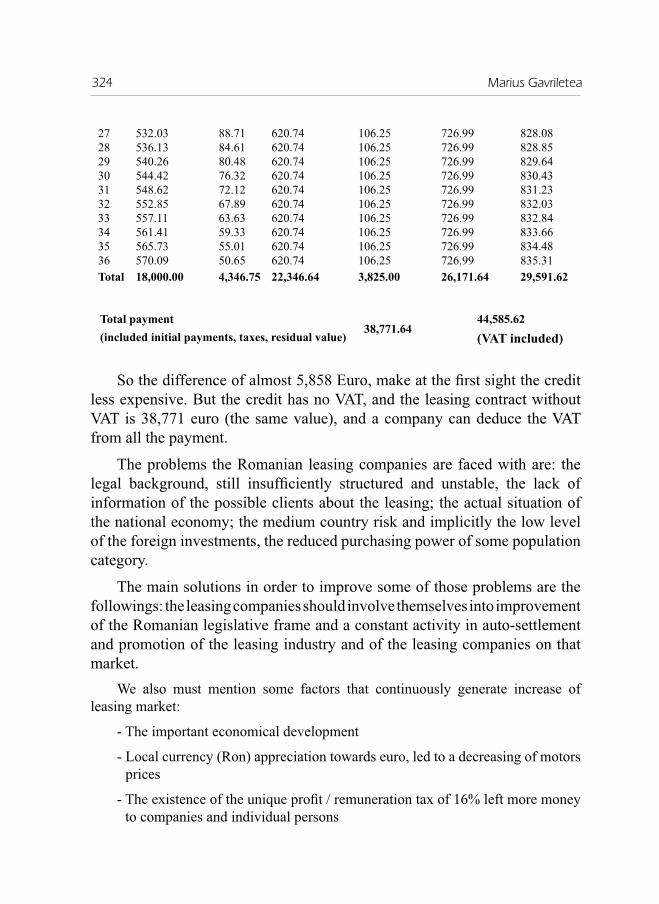
Marius Gavriletea324
27 532.03 88.71 620.74 106.25 726.99 828.0828 536.13 84.61 620.74 106.25 726.99 828.8529 540.26 80.48 620.74 106.25 726.99 829.6430 544.42 76.32 620.74 106.25 726.99 830.4331 548.62 72.12 620.74 106.25 726.99 831.2332 552.85 67.89 620.74 106.25 726.99 832.0333 557.11 63.63 620.74 106.25 726.99 832.8434 561.41 59.33 620.74 106.25 726.99 833.6635 565.73 55.01 620.74 106.25 726.99 834.4836 570.09 50.65 620.74 106.25 726.99 835.31Total 18,000.00 4,346.75 22,346.64 3,825.00 26,171.64 29,591.62
Total payment (included initial payments, taxes, residual value)
38,771.6444,585.62(VAT included)
So the difference of almost 5,858 Euro, make at the fi rst sight the credit less expensive. But the credit has no VAT, and the leasing contract without VAT is 38,771 euro (the same value), and a company can deduce the VAT from all the payment.
The problems the Romanian leasing companies are faced with are: the legal background, still insuffi ciently structured and unstable, the lack of information of the possible clients about the leasing; the actual situation of the national economy; the medium country risk and implicitly the low level of the foreign investments, the reduced purchasing power of some population category.
The main solutions in order to improve some of those problems are the followings: the leasing companies should involve themselves into improvement of the Romanian legislative frame and a constant activity in auto-settlement and promotion of the leasing industry and of the leasing companies on that market.
We also must mention some factors that continuously generate increase of leasing market:
- The important economical development
- Local currency (Ron) appreciation towards euro, led to a decreasing of motors prices
- The existence of the unique profi t / remuneration tax of 16% left more money to companies and individual persons

CONNEXIONS BETWEEN MOTOR LEASING AND INSURANCE IN ROMANIA 325
- The decreasing of credit rate and improving of credit conditions
- Romanian Govern offered a 1,000 euro for every motor older than 15 years, with the condition of buying a new motor
- Substantial discounts in some months of the year (discounts in money, or in free extra options)
- Huge publicity investments, luxury showrooms
- The increasing of domestic motor production
All these factors will create the premise of a leasing market very stable and dynamic
Using some statistics (unfortunately we received data only until the end of May 2004, and only for passenger cars and LCV<3.5t and minibuses) we can notice that an important part of new cars are bought by leasing system:
Leasing Cash & credit
Passenger cars 2460 16943
LCV<3.5t+minibuses 961 6612
leas
ing
cash
+cre
dit
passenger carsLCV<3.5t+minibuses
0
5000
10000
15000
20000
The structure of motors financing
passenger cars LCV<3.5t+minibuses

Marius Gavriletea326
Leasing market share for passenger car and LCV<3.5t and minibuses
13%
87%
leasing
cash+credit
As we can see from the following graphics, 13% of the new bought cars, LCV<3.5t and minibuses are fi nanced by leasing. If we consider the factors mention above is expected that this percent to grow every year.
It is usually known that the owner of a motor (and not only) fi nanced by leasing system, is the leasing company. So because the cars are used by other people or companies, the leasing company takes a safe measure for the car – insurance.
The locator will sign an auto insurance contract, full risks policy that will cover the entire leasing period. All the leasing costs related to insurance will be paid by the user. The insurance premium is paid in advance once with the other monthly payment to the leasing company. In this case is very important to be respected the monthly maturity.
When the client leave out Romania for a few days, he must pay a Green Card, in order to be covered the liability from motor driving. This insurance is valid throughout all Europe. The user must pay the Green Card to the same insurance company that insures his own car. In that case the insurance will offer – as a bonus - a free motor insurance, all risk policy outside the Romania, for the period the Green Card is issued.
The price of Green Card in Romania is unique, and it had been established by BAAR (Romanian Motor Insurance Bureau). For example, for a period between 1 – 15 days the price for an personal car is $60, for 1 month is $100. So, because the price is the same at the all insurers, the user is stimulated to pay it to his insurer in order to receive the bonus (free extension of the motor policy). There is another possibility;

CONNEXIONS BETWEEN MOTOR LEASING AND INSURANCE IN ROMANIA 327
the user will pay the same cost of the Green Card to the other insurer, and in order to receive risks covering outside Romania (the leasing company needs a proof of risks extension before to give the approval for the car to leave Romania) it will pay an international short term policy for motors outside of Romania. This second choice is more expensive than the fi rst, as we can notice from the next example:
- let assume that a user want to go outside of Romania for a month, in business purpose, and the motor policy is issued by “A” Insurance, the full risks policy costs 1200 euro per year, so we will have the next 2 cost choices:
Paying Green Card to “A” Insurance
Paying Green Card to Other Insurance
Cost of Green Card $60 = 50 euro $60 = 50 euro
Offi cial accept of the leasing company 20 euro 20 euro
Monthly motor insurance payment 1200 / 12 months = 100 euro 1200 / 12 months = 100 euro
Risk extension outside of Romania – for a month 0 100 euro
Total insurance costs for a months outside of Romania 170 euro 270 euro
Risk assessmentBecause every insurance policy has its risks exclusions the user is directly
involved to cover those risks. The most important risk is the deductible principle upon the policy. Most leasing policies include a deductible of 1% of Sum Insured of the car, for every partial loss, and a 10 – 20% deductible of Sum Insured for stolen risk.
As we have noticed, the leasing company receives the insurance payment once with the leasing one, and after this it will send the insurance sum to the insurance company. The user must pay the leasing total invoice at its term, because if there is just one day of delaying and a loss appears to the car the insurance company will refuse the payment of the loss. In that case the user will repair the car by itself.
All these mentions are included in the leasing and insurance contract.
No matter if the insurance policy is paid or not at the right term, the user must announce the locator and the insurance company of any loss, in a 5 days term. It is strongly recommended to respect this term, even if the car will be repaired at other time.

Marius Gavriletea328
A very delicate problem appears in the moment when a total loss appears, caused by a rutier event. In these cases the insurance company declare total loss if the loss exceeds 80% of the Sum Insured. The leasing contract mention, that in this case the next steps must be followed:
- because the leasing company is the owner of the car, it will receive the 80% of the Insured Sum and the motor wreck
- the leasing company will deduce from the 80% of the Insured Sum, the leasing payment until the end of the contract, and the rest of the money and the wreck will be given to the user.
The delicate problems reffers at the way of determining the amount to be retained by the leasing company. Some leasing companies calculate the value by adding all the payment to be done until the end of the leasing contract minus insurance (”A” variant). Other leasing companies just add the cost of the credit remained to be paid until the end of leasing contract (”B” variant).
We take an example to demonstrate what choice presents more advantages for the users. The leasing contracts is the one presented in the beginning of this paper, and we assume the total loss appears after 20 months :
”A” variant ”B” variantSum Insured in the fi rst year of the leasing 30.000 eur 30.000 eur
Sum Insured in the second year of the leasing 27.000 eur 27.000 eur
Total payment in the fi rst 20 months 16.322,66 eur 16.322,66 eur
Sum received (80% of the Sum Insured) from the insurer 21.600 eur 21.600 eur
Leasing payment for the next 16 months 13.268,96 eur 13.268,96 eur
- minus insurance 1.700 eur 1.700 eur- residual value 6.000 eur 6.000 eur- minus interest 0 euro 1.804,66 eurTotal payment to the user 4.031,04 eur + motor wreck 5.835,7 eur + motor wreck
We can notice that the second variant is more advantageous for the user, but is very important to be mentioned in the leasing contract at the beginning the way of payment in case of total loss.
Another aspect of the leasing contract and insurance, is that in leasing case the insurance premium is less than an ussual insurance for the same object.

CONNEXIONS BETWEEN MOTOR LEASING AND INSURANCE IN ROMANIA 329
In the next table we compare these aspects, for a new Mazda:Insurance elements LEASING WITHOUT LEASING1. Insurer Allianz-Ţiriac Insurance S:A. Allianz-Ţiriac Insurance S:A.
2. The insured The leasing company, with the name of the user (X company) X company
3. Risks covering (100% all risks) Losses to the car and stolen risks Losses to the car and stolen risks
4. Object insured Mazda 2 1,25 Klima Mazda 2 1,25 Klima5. Period of the
insurance policy 3 years 1 year
6. Sum InsuredFirst year: 11.429 EurSecond year: 10.286 EurThird year: 9.143 Eur
11.429 Eur
7. Yearly insurance payment 612 Eur 709 Eur
8. Yearly basis cota Fixed cota of 5,35% - for every year of leasing
6,2% in the fi rst year, but there appears bonus / malus clauses, for the next years
9. Total insurance payments 1836 Eur for 3 ani 709 Eur only in the fi rst year
Sum InsuredIn the leasing cases the Sum Insured for motors is the real value of the car. If
the car is a new one, the Sum Insured is the price on the invoice, and if there is a used car, the real value is calculated from the price of a new similar motor minus a percent of usage.
The value of a new car is established different:
- for Romanian motors: - fi nal invoice price, if the motors are new - taking into account prices lists given by Romanian motors producers, if the
motors are used
- for foreign motors: - invoive price plus all necessarly taxes for defi nitiv import, in case of a new motor - based on international catalogues (ex.Schwacke List, Nutz) for used cars
In leasing cases because the policy period is more than a year, the Sum Insured for the next years is established taking into account a usage coefi cient (10% for one year, 20% for two years, 30% for three years) applied to the new value (Sum Insured of the fi rst year).
This is a accurate example of determining the Sum Insured of a motor purchased by leasing: În cazul în care autoturismul face obiectul contractului de leasing, suma asigurată se calculează astfel [12]:

Marius Gavriletea330
- for the fi rst year of the insurance 1. C.I.P. (cost insurance price) value2. Customs Tax + supertaxes (% on the CIP value)3. Excise tax (% of the value din 1+2)4. Sum Insured for year I = sum of the above values, multiplied by VAT:
(1+2+3)*1,19
- for the year II, and year III (leasing cases with 18, 24, 36 months period) 5. Real Value (RV) = Usage percentage apllied on the CIP value (% of 1)6. Customs Tax + supertaxes (% on the Residul Value)7. Excise tax (% of the value Residual Value + 6)8. Sum Insured for the uear II/III = sum of the above values, multiplied by VAT: (5+6+7)*1,19
Residual Value is ussualy 20% of the CIP price, and custom taxes and excise.
Conclusions:This sthrenghten connexion between leasing and insurance is determined by the
fact that in leasing cases the insurance appears in two different ways: the insurance of the object fi nanced by leasing contract, and then tne leasing contract insurance that offer fi nancial stabilisation for the leasing company. In some cases, when the value of the leasing contract is a great one, the leasing company request collateral guaranties from the users. All these guaranties will make the object of another insurance, with an important mention – the leasing company is the assignee of the insured guaranties.
All the specialist in both domains (and auto industry also) expect that these sectors to grow constantly in the next years. Once with the leasing increasing, and if we take into account that all the fi nanced objects must be insured, the insurance sectors will add also the leasing percentage growth. But the insurer will have to work out for new insurance terms in order to eliminate the delicate problems we have mentioned.
Literature:- Romanian Leasing Market – 2004 report by ANSL- APIA- autoturisme anual report 2004- Customs Reglementation for vehicles- Technical condition of Porsche Leasing- Internal risk quantifi cation methodology of Allianz Tiriac Insurance- www.siab.ro

EMPIRICAL STUDIES OF LOOKBACK OPTIONS PRICE SENSITIVITY TO MARKET ... 331
EMPIRICAL STUDIES OF LOOKBACK OPTIONS PRICE SENSITIVITY TO MARKET FACTORS
Dr. Izabela Pruchnicka-GrabiasEconomic University in Warsaw
Summary
The author analyses the effect of changes of market conditions on option’s sensitivity which is measured by so called Greek letters. The attention is drawn to lookback options which are better hedging instruments than popular vanilla options. Examinations presented in the paper are based on literature and empirical studies.
Introduction
Lookback options are a type of path-dependent options which in turn are considered to be exotic options. Exotic options are instruments with non-standard conditions of exercise. They are often more expensive than standard options but usually their appliance is more effective. That is why their popularity grows gradually, especially on OTC markets which allow to create any instrument adjusted to investor’s needs, only if demand for it exists at the price that can be accepted by its seller.
The aim of the paper is to assess the infl uence of market parameters on lookback option’s value sensitivity, that is how it changes when volatility, time to maturity, risk-free interest rate and underlying asset price fl uctuate. The analysis is based on author’s own calculations and examinations as well as studies of literature.
Taxonomy and definitions
The payoffs from lookback options depend on the maximum or minimum asset price reached during the life of the option. The payoff from a European-style lookback call is the amount that the fi nal asset exceeds the minimum asset price achieved during the life of the option. The payoff from a European-style lookback put is the amount by which the maximum asset price achieved during the life of the option exceeds the fi nal asset price.1 Thus, a lookback European option entitles
1 J.C. Hull, Options, futures and other derivatives, Pearson Education, Upper Saddle River 2003, p. 441.
Izabela Pruchnicka-Grabias332
its holder to buy at maturity the specifi ed amount of the underlying asset for the minimum asset price reached during specifi ed period of time (for a call) or to sell at maturity the specifi ed amount of the underlying asset for the maximum asset price reached during specifi ed period of time(for a put). In other words, a lookback option allows to achieve the best price possible for an asset. The investor having a long position in it can buy cheapest and sell most expensive possible. One should buy these instruments when large moves on the underlying asset market are expected but it is hard to forecast when exactly they can take place. The only problem is to predict in which direction the market will go and choose the appropriate type of the lookback option. If the direction is wrongly assumed, the investor looses the premium paid for the option. Although the lookback option is more expensive than the standard option, these instruments are more advantageous to buyers. They offer higher strike rates for call options and lower strike prices for puts. There are different kinds of lookback options:
I. Call lookback options with the payoff equal to the difference between underlying asset price at maturity and the minimum value achieved by the underlying asset at sampling time.
II. Put lookback options with the payoff equal to the difference between the minimum value achieved by the underlying asset at sampling time and the underlying asset price at maturity.
III. Call lookback options with the payoff equal to the difference between underlying asset price at maturity and the maximum value achieved by the underlying asset at sampling time.
IV. Put lookback options with the payoff equal to the difference between the maximum value achieved by the underlying asset at sampling time and the underlying asset price at maturity.
V. Call lookback options with the payoff equal to the difference between the maximum value achieved by the underlying asset at sampling time and the strike price.
VI. Put lookback options with the payoff equal to the difference between the strike price and the maximum value achieved by the underlying asset at sampling time.
VII. Call lookback options with the payoff equal to the difference between the minimum value achieved by the underlying asset at sampling time and the strike price.
VIII. Put lookback options with the payoff equal to the difference between the strike price and the minimum value achieved by the underlying asset at sampling time.

EMPIRICAL STUDIES OF LOOKBACK OPTIONS PRICE SENSITIVITY TO MARKET ... 333
Notice that lookback options defi ned in the fi rst two points are always in-the-money. Otherwise, the underlying asset price would have to be constant during option’s life, which is impossible. However, lookback options are more expensive than standard options. The higher volatility of the underlying instrument, the more expensive lookback options are. They can be cheaper when discrete sampling of the underlying asset is applied instead of continuous or when monitoring takes place only for the part of option’s life.
We can also divide lookback options into:
1) fl oating strike call lookback options,2) fl oating strike put lookback options.3) fi xed strike call lookback options,4) fi xed strike put lookback options,
The beneath case-studies are based on the fi rst two kinds of lookback options.
Valuation model
The lookback option’s premium depends on such factors as: foreign risk-free rate (if the underlying asset is the currency rate), domestic risk-free rate, underlying asset value, strike value, volatility of asset value, frequency of exercise, life of contract, frequency of sampling and running value. Details concerning relations between these parameters and option’s premium are summarized in table 1. The fi rst valuation formula for European lookback options has been developed by Goldman, Sosin, Gatto.2 It can be presented as follows:3
• For a call option:
C = Se )( tT −−d -MinPe )( tTr −− N(t
tb−Τ
)−Τ(+−s
m)
+ MinPe )( tTr −− λe )− l/11(b N(t
tb−Τ
)−Τ(+−s
m)
- Se )( tT −−d (1+λ)N(t
tTtb−Τ
−−)−Τ(+− 2
ssm )(
)
2 B.Goldman, H.Sosin, M.A.Gatto, Path-Dependent Options: Buy at the Low, Sell at the High, Journal of Finance, 34, December 1979.
3 Compare: R.W. Kolb, Futures, Options, and Swaps, Blackwell Publishing, Padstow 2003, p. 605-606.

Izabela Pruchnicka-Grabias334
• For a put option:
P = Se )( tT −−d -MaxPe )( tTr −− N(t
tb−Τ
)−Τ(−−s
m)
- MaxPe )( tTr −− λe )− l/11(b N(ttb
−Τ)−Τ(−
sm
)
+ Se )( tT −−d (1+λ)N(t
tTtb−Τ
−+)−Τ(+ 2
ssm )(
)
where:
MinP – the minimum value of the underlying asset during the life of the optionMaxP – the maximum value of the underlying asset during the life of the optionS – underlying asset pricer – risk-free interest rateδ – continuous dividend yield σ – standard deviationT – life of the optiont – time of the option’s valuation
b = ln(MinP
S)
μ = r – δ – 0,5σ 2
λ = ds
−
2
r5,0
b = ln(MaxP
S)
μ = r – δ – 0,5σ 2
λ = ds
−
2
r5,0
The above formulas are true when: λ ≠ 0, which gives:

EMPIRICAL STUDIES OF LOOKBACK OPTIONS PRICE SENSITIVITY TO MARKET ... 335
ds
−
2
r5,0
≠ 0
It means that (r – δ) ≠ 0, thus r ≠ δ
Valuation formulas have been also presented by Conze and Viswanathan4, however after some modifi cations it can be proved that they are equal to those presented by previous authors.
Table 1. Effect of increase in value of underlying factors on lookback option premium.
FactorsTypes of option contracts
Type 1-2 Type 3-4 Type 5-6 Type 7-8Call Put Call Put Call Put Call Put
Foreign risk-free rate ↓ ↑ ↓ ↑ ↓ ↑ ↓ ↑Domestic risk-free rate ↑ ↓ ↑ ↓ ↑ ↓ ↑ ↓Underlying asset value ↑ ↕ ↑ ↕ ↑ ↓ ↑ ↓Strike value - - - - ↓ ↑ ↓ ↑Volatility of asset value ↑ ↑ ↑ ↑ ↑ ↑ ↑ ↑Frequency of exercise ↑ ↑ ↑ ↑ ↑ ↑ ↑ ↑Life of contract ↕ ↕ ↕ ↕ ↕ ↕ ↕ ↕Frequency of sampling ↑ ↓ ↓ ↑ ↑ ↓ ↓ ↑Running value ↓ ↑ ↓ ↑ ↑ ↓ ↑ ↓
Source: based on: Ravindran K., Customized Derivatives: A Step-by-Step Guide to Using Exotic Options, Swaps, and Other Customized Derivatives, McGraw-Hill, New York 1998, s. 157.
Interpretation of Greek letters
The Greeks measure the effect of alterations in different market parameters on the option value. However, they show the result of changing just one input data. In fact, if a few factors change, a different letter must be calculated every time when market conditions fl uctuate. The Greeks are defi ned in the beneath explained way.
Delta measures the sensitivity of the option’s price to changing stock prices.5 For example, if delta=0,798, it means that if the share price increases or decreases by
4 A. Conze, Viswanathan, Path-Dependent Options: The Case of Lookback Options, Journal of Finance vol. 46, nr 5, 1991, s. 1893-1907.5 R.W. Kolb, Futures, Options and Swaps, Blackwell Publishing, Padstow 2003, p. 472.

Izabela Pruchnicka-Grabias336
1 currency unit, the option price change will be equal to 0,798.
Delta = SP
∆∆
Gamma of an option is a measure of how much the delta value changes with changes in the underlying price.6 For instance, if gamma=0,07543, it means that if the share price increases or decreases by 1 currency unit, delta will change by 0,07543.
Gamma = S
delta∆
∆
Theta measures the change in the option price when there is a decrease in the time to maturity of 1 day.7 If theta= -5,137, it means that after one day, which is about 0,27% of a year, the option theoretical value will change by 0,014 [(0,27%× -5,137) : 100].
Theta = TP
∆∆
Rho shows the option price change when the risk free interest rate increases or decreases. If the risk free interest rate changes by 100 basic points and rho=8,255, the option price will change by 0,082 currency rates (0,01×8,255).
Rho = rP
∆∆
Vega measures how fast an option price changes with its volatility. Mathematically, an option’s vega is the fi rst-order partial derivative of the option price with respect to the volatility of its underlying asset.8 If vega=5,804 and the volatility changes by 1%, the option price will change by 0,0584 (0,01×5,804).
Vega = VP
∆∆
where:
6 Z.Bodie, A.Kane, A.J.Marcus, Investments, McGraw-Hill, New York 2002, p. 804.7 R.L. Mc Donald, Derivatives Markets, Pearson Education, Boston 2003, p. 373.8 P.G. Zahng, Exotic Options, World Scientifi c, Singapore 2001, p. 76-77.

EMPIRICAL STUDIES OF LOOKBACK OPTIONS PRICE SENSITIVITY TO MARKET ... 337
∆ - rate of increaseP – price of the optionT – time to maturityr – risk-free interest rateV – volatility of the underlying instrument
Empirical research
The following case-studies present calculations on the impact of volatility, time to maturity, risk-free rate and underlying asset price on option’s sensitivity to market changes. They prove that it fl uctuates depending on other factors that infl uence the option’s premium.
Case-study A.
Let’s examine how values of Greek letters change when the volatility of the underlying asset fl uctuates. Assume the following market data:
Stock price = 100$Risk-free interest rate = 5%Time to exercise = 30 daysMaximum to date = 102$Minimum to date = 98$
The results are presented in table 2.
Table 2. Effect of volatility increase on Greek measures and option price.
Volatility 7% 20% 30% 42% 54%Option type Call Put Call Put Call Put Call Put Call Put
Option price
2,64030 2,04327 4,98169 4,70765 7,05968 7,01430 9,56725 9,8867 12,0450 12,8416
Delta (per $)
0,75292 -0,6007 0,32942 -0,2165 0,25275 -0,1139 0,22205 -0,0376 0,21607 0,01904
Gamma (per $)
0,21523 0,26078 0,13097 0,12956 0,08842 0,09143 0,06223 0,06808 0,04737 0,05467
Vega (per %)
0,12691 0,16757 0,2051 0,22560 0,20936 0,23568 0,20792 0,24331 0,20461 0,24958
Theta (per day)
-0,0244 -0,0090 -0,0759 -0,0676 -0,1119 -0,1106 -0,1527 -0,1632 -0,1913 -0,2175
Rho (per %)
0,06527 -0,0577 0,04473 -0,0453 0,04113 -0,0447 0,03885 -0,0453 0,03727 -0,0463
Source: prepared by the author.

Izabela Pruchnicka-Grabias338
For a call lookback option delta decreases when the volatility increases, it is never lower than zero. For a put lookback option delta moves up together with the volatility going in the same direction. As far as gamma is concerned, it goes down while the volatility grows. The same tendency exists for a put option. Vega rises for a put and it also rises for a call but only to the certain volatility level. Next it starts to fall down. Theta diminishes when the volatility enlarges both for a call and for a put. Rho declines for a call and expands for a put.
Case-study B.
The next parameter to be analysed is time to maturity. Its infl uence on the Greeks is followed. We assume that volatility = 30% per year. The rest of parameters are the same as in case A. The results are depicted in table 3.
Table 3. Effect of time to maturity increase on Greek measures and option price.
Time to maturity 20 days 60 days 85 days 150 days 365 days
Option type Call Put Call Put Call Put Call Put Call Put
Option price
5,83923 5,80703 9,85106 9,76548 11,6750 11,5557 15,4251 15,2186 23,8404 23,3499
Delta (per $)
0,28053 -0,1669 0,22769 -0,0322 0,22523 0,00689 0,23557 0,07124 0,28945 0,18344
Gamma (per $)
0,10683 0,11076 0,06329 0,06512 0,05330 0,05456 0,04006 0,04076 0,02521 0,02527
Vega (per %)
0,17043 0,1884 0,29274 0,34400 0,34396 0,41592 0,44244 0,56784 0,63282 0,93163
Theta (per day)
-0,1355 -0,1342 -0,0799 -0,0786 -0,06728 -0,0659 -0,0505 -0,0492 -0,0318 -0,0305
Rho (per %)
0,02822 -0,0302 0,07887 -0,0886 0,10946 -0,1257 0,18608 -0,2235 0,41700 -0,5552
Source: prepared by the author.
When time to maturity grows, delta quickly decreases and next grows fast for a call option while for a put option it moves up from minus to plus values. For a call, gamma is always more than zero but it goes down whereas for a put it diminishes, then rises and decreases again. Both for a put and for a call vega increases and is above zero for the whole option’s life. Rho grows for a call and is always above zero while for a put rho goes down and is lower than zero.
Case-study C.
The effect of risk-free interest rate alterations on Greek measures is the subject of examinations in this example. We assume that volatility = 30% and time to maturity

EMPIRICAL STUDIES OF LOOKBACK OPTIONS PRICE SENSITIVITY TO MARKET ... 339
= 0,5 year. Other market data from case A remain unchanged. The results are shown in table 4.
Table 4. Effect of risk-free interest rate increase on Greek measures and option price.
Risk-free rate 3% 6% 9% 12% 15%
Option type Call Put Call Put Call Put Call Put Call Put
Option price
16,5441 17,2939 17,2074 16,4614 17,8879 15,669 18,5852 14,9147 19,2983 14,1983
Delta (per $)
0,23572 0,09509 0,24723 0,09398 0,25902 0,09277 0,27107 0,09149 0,28336 0,09013
Gamma (per $)
0,03481 0,03905 0,03697 0,03567 0,03916 0,0325 0,04137 0,02950 0,04359 0,02670
Vega (per %)
0,48431 0,63651 0,47898 0,63080 0,47282 0,62426 0,46588 0,61691 0,45820 0,60880
Theta (per day)
-0,0435 -0,0476 -0,0468 -0,0429 -0,0503 -0,0385 -0,0538 -0,0345 -0,0575 -0,0308
Rho (per %)
0,21911 -0,2819 0,22496 -0,2686 0,2306 -0,2556 0,23598 -0,2429 0,24111 -0,2306
Source: prepared by the author.
When the risk-free interest rate moves up, for a call lookback option delta and gamma grow and they are above zero all the time. For a put option delta and gamma decrease and they are also above zero for the whole option’s life. Both for a call and for a put, vega decreases and it is always more than zero. Theta is lower than zero for both types of options, however it moves down for a call and up for a put. Rho increases for both kinds of options but for a call it is higher than zero whereas for a put it is lower.
Case-study D.
Another factor to be considered is the underlying asset value and its infl uence on the Greeks. We assume volatility = 30% and time to maturity = 0,5 year.

Izabela Pruchnicka-Grabias340
Table 5. Effect of underlying asset price increase on Greek measures and option price.
Underlying asset price ($)
80 85 95 105 120
Option type
Call Put Call Put Call Put Call Put Call Put
Option price
13,5276 22,4481 14,3731 19,6283 16,0640 16,7333 18,6339 17,4957 27,7164 19,9951
Delta (per $)
0,16907 -0,6452 0,16907 -0,4783 0,16907 -0,0957 0,41219 0,16660 0,75992 0,16660
Gamma (per $)
0,04654 0,03054 0,04380 0,03586 0,03919 0,03890 0,03116 0,03443 0,01577 0,03012
Vega (per %)
0,38711 0,30893 0,41131 0,41194 0,45969 0,58085 0,47373 0,66622 0,33387 0,76140
Theta (per day)
-0,0367 -0,0139 -0,0390 -0,0237 -0,0436 -0,0398 -0,0458 -0,0468 -0,0367 -0,0535
Rho (per %)
0,17705 -0,3975 0,18811 -0,3549 0,21024 -0,2837 0,24961 -0,2842 0,35442 -0,3248
Source: prepared by the author.
Together with the underlying asset price increase, for a call option delta is constant up to a certain level of this asset’s value and next starts to grow, it is above zero. For a put, delta grows fi rst and then it stabilizes at a certain level of the underlying instrument. As far as gamma is concerned, it diminishes but it is more than zero during the option’s life whereas for a put option it grows at the beginning in order to start falling down at a certain underlying asset level. Vega increases for a call but next it begins to decrease. It does not reach minus values. For a put vega is always more than zero and it moves up. For a call, theta goes down and then up but it is always minus. For a put, theta is minus and it diminishes. For a call rho is plus and it grows whereas for a put rho is minus: it moves up to a certain underlying asset level and next falls down.
The overall conclusions of changes of such factors as volatility, time to maturity, risk-free interest rate and underlying asset value are summarized in table 6.

EMPIRICAL STUDIES OF LOOKBACK OPTIONS PRICE SENSITIVITY TO MARKET ... 341
Table 6. Effect of increase in value of market factors on Greek measures for lookback options.
Greek letters
Factors
Volatility Time to maturity
Risk-free interest rate
Underlying asset price
Call Put Call Put Call Put Call PutDelta ↓ ↑ ↓↑ ↑ ↑ ↓ −↑ ↑−Gamma ↓ ↓ ↓ ↓↑↓ ↑ ↓ ↓ ↑Vega ↑↓ ↑ ↑ ↑ ↓ ↓ ↑↓ ↑Theta ↓ ↓ ↑ ↑ ↓ ↑ ↑↓ ↓Rho ↓ ↑ ↑ ↓ ↑ ↑ ↑ ↑↓
Source: prepared by the author.
Final conclusions
Lookback options are a very useful tool in hedging, however they are expensive in comparison with vanilla options. Therefore they are not used very often in practice. In order to reduce costs investors create partial lookback options like early ending options or forward-start options. It means that they are not tested for the whole life but until the specifi ed moment or from the specifi ed time in the future. They can also include discrete testing every few days or weeks, etc. This technique enables to reduce premium and if the time when these options are tested is chosen correctly, they are as effective as full lookback options.
The analysis conducted in the paper proves that the Greek letters which are measures of option’s sensitivity to market factors are volatile and move in different directions during lookback option’s life. Some of them can even change direction depending on the price level of the underlying instrument. It has consequences for trading and hedging strategies and makes the discussed instruments more complicated and more expensive.
Literature:
1. Z.Bodie, A.Kane, A.J.Marcus, Investments, McGraw-Hill, New York 2002.2. A. Conze, Viswanathan, Path-Dependent Options: The Case of Lookback Options,
Journal of Finance vol. 46, nr 5, 1991.3. R.L. Mc Donald, Derivatives Markets, Pearson Education, Boston 2003.4. B.Goldman, H.Sosin, M.A.Gatto, Path-Dependent Options: Buy at the Low, Sell
at the High, Journal of Finance, 34, December 1979.

Izabela Pruchnicka-Grabias342
5. J.C. Hull, Options, futures and other derivatives, Pearson Education, Upper Saddle River 2003.
6. R.W. Kolb, Futures, Options and Swaps, Blackwell Publishing, Padstow 2003.7. I. Nelken, Handbook of Exotic Options, Irwin, Chicago, 1996.8. K. Ravindran, Customized Derivatives: A Step-by-Step Guide to Using Exotic
Options, Swaps, and Other Customized Derivatives, McGraw-Hill, New York 1998.
9. P.G. Zahng, Exotic Options, World Scientifi c, Singapore 2001.

THE PROCESS OF TRANSITION AND THE CAPITAL MARKET ... 343
THE PROCESS OF TRANSITION AND THE CAPITAL MARKET IN THE REPUBLIC OF CROATIA
Branimir Markovi}, ProfessorBranko Mati}, Professor
Faculty of Economics in Osijek
SummaryAs a transition country, Croatia is confronted with fundamental changes in the
segment of capital transactions. These changes are the result of the country’s market orientation, of its position in the globalization (integration) processes, but especially of its needs.
The limiting framework of a more signifi cant development of the capital market is set by the reached level of development of the Croatian economy, by the underdevelopment of the entire fi nancial market, by, until recently, inadequate legal regulation and, partially, by the specifi c tradition and conservatism in this segment.
The present situation in the segment of capital transactions indicates the comprehensiveness of the changes regarding the development of the capital market, but at the same time the extreme sensitivity of this market to changes of the economic activity in the country, as well as in its surrounding, and high sensibility relating to the political decision about the initiation of negotiations with the European Union concerning the membership of Croatia in this association.
Key words: fi nancial system, capital market, transition, the European Union
1. Introduction The changes in the fi nancial sector, especially in the segment of capital
transactions, in the Republic of Croatia are very explicit. The frameworks for these changes are set by: the condition of the economy, the level of the market openness, the size of the Croatian market, the development of other segments of the fi nancial system, by legal regulation, but also by political requirements relating to the beginning of aaccession negotiations between the Republic of Croatia and the European Union (EU)1. Precisely this fact indicates the extreme importance of stability, but also of membership in such an association. The reasons for this are the standards that apply to all member states, resulting in the safety for investors.
1 The Republic of Croatia has been a candidate for membership in the EU since 18th June 2004.

Branimir Markovi} • Branko Mati}344
2. Capital Market in the Republic of Croatia
Croatian capital market, as a part of the fi nancial system, is determined by the types and number of fi nancial instruments used to trade on the market, by institutional frameworks and by legal regulation. In spite of its specifi c characteristics, capital market can not be considered as separate and isolated. The reason for this lies in the fact that all fi nancial markets are connected through binding factors – credit, the existence of speculation and arbitration, as well as perfection and effi ciency of the market (Novak, 1999:19); these circumstances must therefore necessarily be accepted.
2.1. Financial Instruments on the Capital Market in the Republic of Croatia
In business operations in which fi nancial instruments have the date of expiry longer than one year, we speak of long-term fi nancial instruments, and these are trade objects on the capital market. In the Republic of Croatia, practically all “classical” fi nancial institutions: deposit, contracting (insurance companies and pension funds) and investment institutions can participate on the capital market (Novak, 1999:38).
Long-term fi nancial property can usually be classifi ed into two categories:
- equity securities- debt securities
2.1.1. Equity Securities Market
Equity securities market in the Republic of Croatia consists of the purchase and sales of securities through the stock exchange. In Croatia there are two stock exchanges – the Zagreb Stock Exchange and the Varaždin Stock Exchange.
At the end of 2004, the Zagreb Stock Exchange had 183 shares of stock and 153 of those were actively traded with. On this stock exchange, transactions were made on three markets: on the offi cial market, on the public limited companies market, and on the parallel market.
In terms of the turnover volume on this stock exchange, most dominant were the shares of a business conglomerate largely dealing in the production of tobacco products, shares of food processing, pharmaceutical and tourist industry, and shares of insurance companies and banks.
Market capitalization of stock2 in 2004 was 30.4% of the estimated of the gross domestic product (GDP) for that year.
2 Market capitalization of stock consists of the close price of each share multiplied by the number of issued shares and corrected by the share’s solvency.
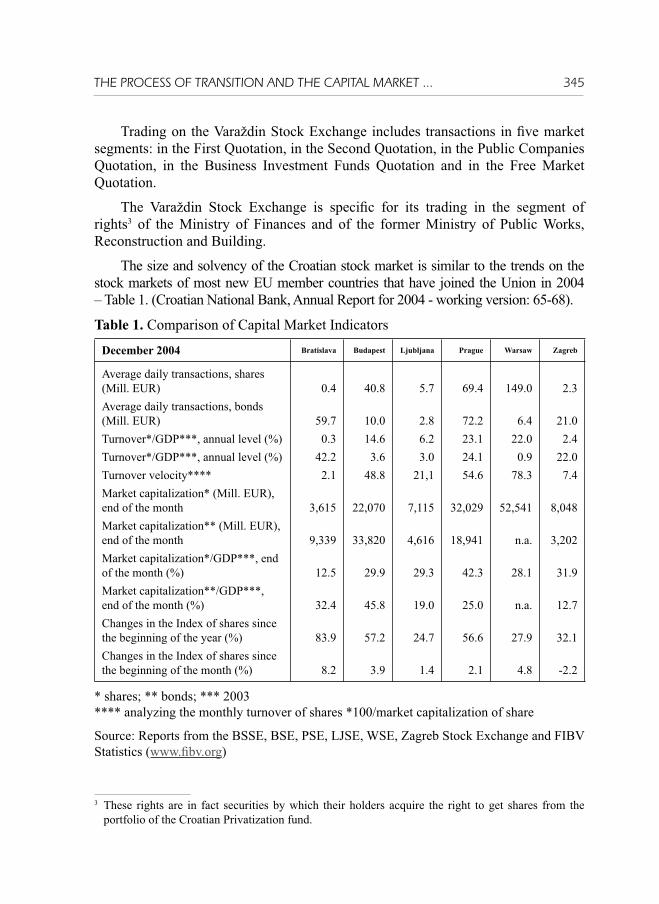
THE PROCESS OF TRANSITION AND THE CAPITAL MARKET ... 345
Trading on the Varaždin Stock Exchange includes transactions in fi ve market segments: in the First Quotation, in the Second Quotation, in the Public Companies Quotation, in the Business Investment Funds Quotation and in the Free Market Quotation.
The Varaždin Stock Exchange is specifi c for its trading in the segment of rights3 of the Ministry of Finances and of the former Ministry of Public Works, Reconstruction and Building.
The size and solvency of the Croatian stock market is similar to the trends on the stock markets of most new EU member countries that have joined the Union in 2004 – Table 1. (Croatian National Bank, Annual Report for 2004 - working version: 65-68).
Table 1. Comparison of Capital Market Indicators
December 2004 Bratislava Budapest Ljubljana Prague Warsaw Zagreb
Average daily transactions, shares (Mill. EUR)Average daily transactions, bonds (Mill. EUR)Turnover*/GDP***, annual level (%)Turnover*/GDP***, annual level (%)Turnover velocity****Market capitalization* (Mill. EUR), end of the monthMarket capitalization** (Mill. EUR), end of the month Market capitalization*/GDP***, end of the month (%)Market capitalization**/GDP***, end of the month (%)Changes in the Index of shares since the beginning of the year (%)Changes in the Index of shares since the beginning of the month (%)
0.4
59.70.3
42.22.1
3,615
9,339
12.5
32.4
83.9
8.2
40.8
10.014.63.6
48.8
22,070
33,820
29.9
45.8
57.2
3.9
5.7
2.86.23.0
21,1
7,115
4,616
29.3
19.0
24.7
1.4
69.4
72.223.124.154.6
32,029
18,941
42.3
25.0
56.6
2.1
149.0
6.422.00.9
78.3
52,541
n.a.
28.1
n.a.
27.9
4.8
2.3
21.02.4
22.07.4
8,048
3,202
31.9
12.7
32.1
-2.2
* shares; ** bonds; *** 2003**** analyzing the monthly turnover of shares *100/market capitalization of share
Source: Reports from the BSSE, BSE, PSE, LJSE, WSE, Zagreb Stock Exchange and FIBV Statistics (www.fi bv.org)
3 These rights are in fact securities by which their holders acquire the right to get shares from the portfolio of the Croatian Privatization fund.

Branimir Markovi} • Branko Mati}346
2.1.2. Debt Securities Market
Debt securities market in Croatia gives an excellent illustration of the connection between the fi scal policy and the market itself. Thus the state, following the directives of the fi scal policy, incurs debts on the home capital market by issuing bonds. Also, for the fi rst time in Croatia, local government and self-government in two towns (Koprivnica and Zadar) have issued bonds for the purpose of securing new funding sources.
On the Croatian debt securities market there are state, corporate and municipal bonds, as well as the bonds of the State Agency for Insurance of Savings Deposits and Bank Rehabilitation and the bonds of the Croatian Bank for Reconstruction and Development – Table 2.
Table 2. Bond Issues on the Home Market at the End of February of 2005
Symbol Issuer Date of Issue Expiration Cur-
rencyFace value of the issue
Nominal
Interest rate
Close price*
Current yield
Feb. 28 2005
DAB-05CARHMF-O-O8CARHMF-O-125ARHMF-O-085ARHMF-O-142ARHMF-O-077ARHMF-O-198A
GDKC-O-116A
GDZD-O-119A
HBOR-O-112ABLSC-O-091AHYBA-O-086A
BNAI-O-22CA
PODR-O-072AAGRK-O-074APLVA-O-115AATGR-O-077A
Savings Deposits Insurance AgencyRepublic of CroatiaRepublic of CroatiaRepublic of CroatiaRepublic of Croatia Republic of Croatia Republic of Croatia The Town of KoprivnicaThe Town of ZadarCroatian Bank for Reconstruction and Development
Belišće Co.Hypo-Alpe.Adria BankBina Istra Co.Podravka Co.Agrokor Co.Pliva Co.Atlantic Grupe Ltd.
19/12/200014/12/200123/05/200228/05/200310/02/200407/07/200429/11/2004
29/06/2004
01/09/2004
11/02/200414/01/200506/06/2003
15/12/2002
20/02/200403/04/200212/05/200415/07/2004
19/12/200514/12/200823/05/201226/05/200810/02/201407/07/200729/11/2019
29/06/2011
01/09/2011
11/02/201114/01/200906/06/2008
15/12/2002
20/02/200703/04/200712/05/201115/07/2007
EUREUREURHRKEUREUREUR
HRK
EUR
EUREURHRK
EUR
EUREUREUREUR
225,000,000200,000,000500,000,000
1,000,000,000650,000,000400,000,000200,000,000
60,000,000
18,500,000
300,000,0008,000,000
150,000,000
210,000,000
27,000,000230,000,00075,000,00015,000,000
8.375%6.875%6.875%6.125%5.500%3.875%5.375%
6.500%
5.500%
4.875%5.500%6.500%
8.000%
5.000%11.000%5.750%5.750%
104,80111.35115.80100.90108.00101.55105.45
--
--
100.90
-
-108.1099.65-
7.991%6.174%5.937%6.070%5.093%3.816%5.097%
--
--
6.442%
-
-10.176%5.770%-
* in regular exchange
Source: Zagreb Stock Exchange, Monthly Report for February 2005

THE PROCESS OF TRANSITION AND THE CAPITAL MARKET ... 347
The coupon interest rate ranges between 3.875 and 11%. Most of the bonds are denominated in Euros.
From the point of view of solvency, government bonds are on the top of the list, whereas corporate bonds are the least solvent.
Total market capitalization on the home market by the end of 2004 amounted to 14.9 % of the estimated GDP.
In the same period 12 Croatian state bonds have been admitted on foreign capital markets and their total nominal value was 4.94 billion Euros.
All bonds are denominated in Euros, except one which is denominated in Japanese Yens (Croatian National Bank, Annual Report 2004 – working version: 69-74).
2.2. Financial Institutions in the Segment of Capital Business
On the Croatian capital market there are brokerage houses (26); stock exchanges (2); banks authorized to deal with securities (16); pension companies (4); voluntary pension funds (6); closed voluntary pension funds (9) and pension insurance company (1).
3. Pension Insurance
Croatia as a transition state has been confronted with the necessity of coordination of a larger part of its fi nancial system with the achievements of the free market and with the standards in the European Union, regarding its commitment to becoming a member of this association.
A special segment within this process of adjustment is the reform of the pension insurance which was until 2002 based on generational solidarity.
Pension insurance resulting from the pension reform in Croatia is turning into an exceptionally rapidly growing capital market. This appearance fact will have important infl uence on the trends in the entire fi nancial sector; therefore special attention will have to be paid to this segment in the future.
4. Limitations in Capital Transactions
Following the Agreement about Stabilization and Accession, which Croatia has signed with the EU (it entered into force in 2005), and its particular provisions, i.e. based on the coordination of Croatian legislature with the Acquis Communautaire of the EU, it became possible to gradually liberalize some capital business transactions.

Branimir Markovi} • Branko Mati}348
When it joins the EU, Croatia will have to completely repeal all limitations relating to capital transactions.
5. Conclusion
As a state in transition, Croatia is facing the necessity of implementation of a series of reforms of its economic and fi nancial system.
Globalization and integration processes additionally emphasize this requirement.
Inheritance, tradition as well as, to some extent, habits condition certain behavior and expectations hamper the development of the capital market.
The reached level of development of the capital market in Croatia is the result and the consequence of the openness of Croatian economy, but it is also, partly, the result of actual needs connected with the effi ciency of this segment of the fi nancial system.
Legal regulation of this area, which is to a great extent harmonized with the Acquis Communautaire of the EU, can and should additionally provide new breaks through, both in the development of the capital market and on the institutional plan.
The changes to date in the segment of capital transactions in Croatia indicate a marked sensitivity of the capital market. Positive development of the relations between Croatia and the EU invigorates this market, and prolongation of the settled activities results in negative changes in capital transactions.
It can therefore be realistically expected that the opening of negotiations about the membership in the EU will result in signifi cant improvement in the development of the capital market in Croatia.
6. Literature
1. Novak, Branko (1999) Financijska tržišta i institucije, Osijek, Ekonomski fakultet u Osijeku (Financial Markets and Institutions, Osijek, Faculty of Economics in Osijek)
2. Hrvatska narodna banka, godišnje izvješće 2004 – radna verzija (Croatian National Ba nk, Annual Report for 2004 – working version)

BUCHAREST STOCK EXCHANGE EVOLUTION 349
BUCHAREST STOCK EXCHANGE EVOLUTIONNOVEMBER 1995 – NOVEMBER 2005
Cornelia Pop, PhDPartenie Dumbrava, PhDBabes-Bolyai University
Abstract: Bucharest Stock Exchange was opened for transactions at the end of November
1995. Since than 10 years have passed – and the end of November 2005 marked the fi rst decade of Bucharest Stock Exchange contemporaneous existence. But the event passed almost unnoticed, not even a press release on Bucharest Stock Exchange offi cial site could be found. Despite this silent anniversary, the main Romanian stock market could be proud of most of its achievements in these 10 years. This paper tries to present the Bucharest Stock Exchange evolution during a decade, along with its potential for development in the years to come.
Key words: stock exchange, evolution, capitalization, indexes
1. Bucharest Stock Exchange openingThe offi cial opening of Bucharest Stock Exchange (BVB)1 took place in April
21, 1995. But at that time only the administrative structures were formed and several months passed before BVB could host any transactions.
BVB was, at its beginnings, a public institution, non for profi t, managed by Bucharest Stock Exchange Association which included those Romanian brokerage companies fulfi lling the required conditions.
Compared with its neighboring countries, BVB was among the last to open during 1995. Budapest Stock Exchange was open in 1990 and the fi rst Bulgarian Stock Exchange opened in 19912. Prague Stock Exchange opened in November 1992 followed by Bratislava Stock Exchange which was open in April 1993.
1 We will use the abbreviation BVB (resulting from the Romanian name of the stock exchange – Bursa de Valori Bucuresti) to avoid any confusion with Budapest Stock Exchange.
2 The situation in Bulgaria was a special one: between 1991 and the beginning of 1995, 20 regional exchanges were opened. During 1995 all these exchanges were integrated under the name of Bulgarian Stock Exchange.
Cornelia Pop • Partenie Dumbrava350
Among the reasons for this delay we must mention:
• the slow pace of privatization process (accelerated by the end of 1995 under the pressure of international institutions like International Monetary Fund);
• the absence of managerial culture regarding the advantages of an incorporated and listed company;
• a small number of incorporated companies willing to list their shares on a stock market;
• almost all Romanian companies ignored the possibility of issuing bonds to fi nance their investments;
• the laws concerning the public administration prohibited the municipalities to issue bonds until 2001;
• the T-bills were available only on the inter-bank market (between 1994 and 2000 no T-notes or T-bonds were issued due to a very high infl ation rate);
• a proper law regulating the Romanian capital market was approved and enforced only in 1994 – and under this law the supervising authority for Romanian capital market - the Romanian National Securities Commission - was created. After this moment, the pace for BVB opening increased.
Despite the scarcity of securities on the market, BVB opened for transaction November 20, 1995 when 6 companies out of 8 listed companies were traded, generating 45 transactions, a volume of 905 shares and a value of 14.9 million ROL (5666.5 ECU).
Between November 20, 1995 and March 19, 1996 BVB was open for trades only one day every week. After that moment, the number of trading days increased at two per week until March 4, 1997. Between March 4, 1997 and May 5, 1997 the number of trading days at BVB was of three per week. Since May 5, 1997 BVB entered in a normal 5 trading days per week schedule. The small number of trading days per week is one of the reasons for the slow pace of BVB development during 1996.
2. Bucharest Stock Exchange evolution
Table and graphic no.1 present the evolution of BVB members and listed companies – by the end of each year.

BUCHAREST STOCK EXCHANGE EVOLUTION 351
Table no.1
1995 1996 1997 1998 1999 2000 2001 2002 2003 2004 2005*
Members of Bucharest Stock Exchange Association
28 62 133 173 150 120 110 75 73 67 n/a
Listed companies1 9 17 75 126 127 114 65 65 62 60 64
Listed bonds(municipal and corporative)
0 0 0 0 0 0 2 6 10 26 19
Note: * November 2005Source: BVB Annual reports for 2001, 2002, 2003 and 2004 and Summary of trades (www.bvb.ro)
The big number of brokerage fi rms registered between 1997 and 1999 was due to the privatization process. During the above mentioned period a lot of privatization coupon (which could be converted in shares) fl ooded the market. Those coupons were distributed for free for every Romanian citizen over 18 years old and the owners ignored their value. The brokerage fi rms tried to concentrate the coupons for their own benefi ts or for some (very few) educated and interested clients. When the number of coupons on the market dropped, the smaller brokerage fi rms were forced to close their doors. Other reasons for the decrease of brokerage fi rms’ number were:
- the penalties, activity suspension or termination of activity imposed by Romanian National Securities Commission due to the fact that a number of brokerage fi rms broke the regulations and fraud their clients;
- the enforcement of new regulations (during 1998) requiring a higher level of capital, which some brokerage fi rms could not fulfi ll.

Cornelia Pop • Partenie Dumbrava352
The number of listed companies grew to a maximum of 132 between November 1 and November 23, 1999. By the end of 1999, the BVB Board of Directors realized that the listed companies’ quality is not very high and despite this big number, the investors were not interested in many companies. In fact, during 1998 and 1999 the average number of traded companies per day was around 70. During 2000 new regulations were enforced, requiring new (higher) limits for capital level and a higher level of disclosure for the listed companies. In August 2001, a number of 36 companies – which did not fulfi ll those requirements – were eliminated from the Bucharest Stock Exchange trading system. It proved to be a good decision and the investors’ interest for those companies which remained in BVB list increased.
The evolution of Bucharest Stock Exchange capitalization is proving, also, that the decision to increase the listed companies’ quality was a good one, as table and graphic no.2 show.
Table no.2
1995
1996
1997
1998
1999
2000
2001
2002
2003
2004
2005
Market capitalization (million ECU/ EUR) 77
.61
48.5
3
560.
28
317.
32
298.
09
450.
51
1361
.08
2646
.45
2991
.02
8818
.82
1557
2.83
Source: BVB Annual reports for 2001, 2002, 2003 and 2004 and Summary of trades (www.bvb.ro)

BUCHAREST STOCK EXCHANGE EVOLUTION 353
Consistent with the situation presented above, BVB capitalization during 1997 registered an important increase, but due to the problems created by the brokerage fi rms (frauds in transactions - mainly connected with stolen shares) generated an overall feeling of mistrust toward the capital market as a whole.
The capitalization at BVB registered an important growth since 2000 due to a spectacular increase of listed company prices. It is true that for more than 3 years the Romanian companies were undervalued, as the graphic no.3 – plotting the market PER and price/ face value ratio – shows3.
Source: BVB Annual reports for 2001, 2002, 2003 and 2004 (www.bvb.ro)
The following graphics (no.4, 5 and 6) present the evolution of average number of transactions per day, the average volume per day and the average value per day (in million ECU/ EUR).
3 In Romania, the share face value is the approximation to book value for practical reasons.

Cornelia Pop • Partenie Dumbrava354
As it can be seen, the interest for the BVB listed companies increased slowly during 2000 and 2001. The year which marked the ‘return’ of investors was 2002, when Romania became a NATO member. The perspective of Romania’s accession to European Union only maintained the investors’ interest alive.
The fi rst company fulfi lling the conditions to be listed inside the Bucharest Stock Exchange fi rst category occurred only by the end of January 1997. But after the trading at the fi rst category started the importance of this category in BVB trading value grew as the following fi gures show (for the period: January 28, 1997- November 30, 2005):
� it concentrated 72.03% of total trades;� it concentrated 68.26% of total volume;� it concentrated 77.57% of total value.

BUCHAREST STOCK EXCHANGE EVOLUTION 355
November 1, 1999 was another important moment in BVB evolution. It market the listing – inside the fi rst category - of the fi ve former privatization funds (called Private Property Funds) transformed in investment funds (closed-end funds) for which we will use the Romanian abbreviation SIFs4. The SIFs situation is peculiar, they concentrate a big number of shareholders, their portfolios are interesting and they managed to pay dividends every year. Due to all these reasons, the investors’ interest for those investment funds increased as the years passed. Again, the fi gures speak for themselves (November 1, 1999 – November 30, 2005):
� SIFs concentrated 51.27% of total trades (64.81% of the fi rst category trades);
� SIFs concentrated 35.02% of total volume (48.83% of the fi rst category volume)
� SIFs concentrated 34.93% of total value (43.59% of the fi rst category value).
Unfortunately, the BVB trading platform was never used for the privatization process.
The public offerings using BVB trading system were scarce too, they managed to concentrate – since 1997, when data structure made the analyze possible – only 3.67% from the total value of traded shares.
Starting with November 26, 2001 BVB diversifi ed the listed securities by accepting to trade municipal bonds5. But, this market segment did not manage to attract the investors’ interest at the expected level. Some Romanian analysts consider that the interest rate paid by the municipal bonds is appreciated to be very good by the investors, so they choose to keep those bonds in their portfolio. But what many Romanian analysts seems to forget is the low liquidity of those bonds (no issue was bigger than 250.000 bonds and a small number of investors which underwrite those issues). The transparency regarding municipal bonds’ issues was very low due to the fact that between 2002 and 2004 the regulations concerning the public offerings was unclear and could be interpreted in various ways6. Only 6 municipal bond public offerings were made through BVB trading system.
4 The abbreviation SIF comes from Societate de Investitii Financiare, in English Financial Investment Company.
5 The law on public administration change and municipalities were allowed – starting with 2001 – to issue bonds.
6 Since 2004 a new law was issued and enforced for the Romanian capital market; it requires an increased level of transparency, but during 2005 a very low number of public offerings were made (only 5 compared with 12 during 2004).

Cornelia Pop • Partenie Dumbrava356
Another minus for the Romanian bond market is the absence of the yield curve and due to this situation it is almost impossible to establish the correct price for the traded bonds.
Other factor infl uencing the bond market at BVB is the lack of rating. There is no offi cial rating agency in Romania and the services offered by foreign agencies are not used (the idea of rating is either ignored or perceived as too expensive). The Romanian authorities recognized the need for a rating agency, but no important steps in the direction of creating one were made.
Despite the low level of interest for the municipal bond market segment, BVB Board decided to open the market segment for corporative bonds. These bonds seemed to attract a bigger number of investors, due to their issuers (considered to be good companies, despite the lack of rating).
Graphic no.7 plots the structure of BVB markets (using total value).
For the fi rst time – between January 17 and January 21, 2005 – rights were traded at BVB. Those rights were issued by Impact Inc. – a company regarded as a blue chip despite the fact it is traded inside the second category. During the above mentioned week, the value of traded rights concentrated around 0.75% from the total transactions’ value. Despite its limited success, through this initiative BVB increased the variety of traded securities and should be regarded as a positive development.
As it can be seen, BVB struggled to diversify its market segments and to attract investors. Clearly, the market registered an important growth7 in the last 4 years, but there is a lot of space for other improvements.
7 For those interested, we must mention that a part of BVB growth was due to the change of its trading systems. The fi rst system (and not very sophisticated) STEA was replaced by HORIZONTM between August and November 1999. The present trading system ARENA is an in-house built one.

BUCHAREST STOCK EXCHANGE EVOLUTION 357
However, some improvements are not on BVB Board hands. Since 1998 a lot of discussions and negotiations took place concerning the T-bonds listing (especially T-bills) at BVB, but year after year passed and no agreement was signed between the Ministry of Finance and Bucharest Stock Exchange. This situation only proves that the Romanian Ministry of Finance does not have a clear strategy for using the bonds and has no clear idea about the level interest rate it could pay for those bonds8.
Another problem for BVB is the diffi culty to attract new companies to be listed. It became clear by the end of 20039 that new entries are necessary. During May 2004, Romanian Government launched a program with the mission ‘A Strong Stock Exchange for the future EU integration processes10. One of this program’s objectives was the listing of 7 important Romanian utility companies, but by the end of November 2005 any of those companies was listed at BVB.
Due to all those problems, combined with a volatile economy, we can consider that BVB made important steps in the last 10 years.
3. Bucharest Stock Exchange indexes
The fi rst offi cial index of BVB was launched in September 1997. Its name is BET (Bucharest Exchange Trading) and included in its portfolio 10 of the most liquid companies listed in the fi rst category (concentrating over 70% of trading value). Since September 22, 1997 the BET index portfolio was modifi ed 9 times. The last change in BET portfolio brought something new: there were included two companies from the second category due to their impact on the total BVB transactions.
The second offi cial index of BVB is a composite one: BET-C (or Bucharest Exchange Trading – Composite) including all the traded companies (1st and 2nd category, exclusive SIFs). It was launched in April 1998. This index seems to be less popular that BET among analysts and investors.
A third offi cial index was launched November 1, 2000 to describe the evolu-tion of SIFs. It is the fi rst sector index at BVB. Its name is BET-FI (or BET-Financial).
The calculation method used for all the three indexes is a capitalization weighted
8 For years the Ministry of Finance used the interest rate as a tool to raise funds when it pleased, and due to this kind of action, the risk free rate was not the lowest but the highest Romania. And those responsible for establishing a strategy of using T-bonds almost ignore the fact that these instruments offer to their investors the risk free rate. With such an attitude it is diffi cult to develop a bond market in Romania.
9 By the end of 2003 two of the most interesting companies listed at the fi rst tier were redrew from BVB by their new owners, resulted from the privatization process.
10 www.bvb.ro/medianews

Cornelia Pop • Partenie Dumbrava358
price base one, using the same principle of computation: capitalization weighted chained Laspeyres formula11. Inside these indexes, the participation of any company participation is restricted to 25% of the total portfolio capitalization12.
A fourth index was launched in March 2005. The new index ROTX (Romanian Traded Index) is calculated in collaboration with Wiener Boerse AG and it become an underlying asset for a derivative contract in Wien. The index should include (as the document issued at its launching stated) the most liquid blue chip stocks traded at BVB13. It is a capitalization-weighted price index too.
The evolution of all those indexes is plotted in the graphics no.8, 9, 10 and 11. Due to the fact that the fi rst 3 indexes started to be calculated in EUR since February 2003, we present on the graphics only the indexes in ROL (Romanian Leu) and USD.
The evolution of BET and BET-C are consistent with the data presented above for the number of listed companies and BVB capitalization. After a good evolution at the end of 1997 and the fi rst three months of 1998 for BET, and a short positive evolution for BET-C after being launched, both indexes plunged due to overall pessimism which dominated Romanian capital market after the frauds and irregularities discovered at brokerage fi rms’ level. There were necessary 3 years, changes in laws and regulations and a proper enforcement of those laws and regulations to regain at least some of the investors’ trust and interest.
We must add that during 1998 and 2001, the pessimism was dominating not only the Romanian capital market, but the entire Romanian economy. The banking system was perceived as fragile, the economy was not growing, and the infl ation rate was high. In such an atmosphere, it is diffi cult for any stock exchange to function.
11 See www.bvb.ro/indicieng4.pdf 12 See www.bvb.ro/indicieng4.pdf 13 See www.bvb/ROTX_RULES_ENGLISH.pdf

BUCHAREST STOCK EXCHANGE EVOLUTION 359

Cornelia Pop • Partenie Dumbrava360
The correlation coeffi cient between the daily returns of BET and BET-C indexes14 is 0.840836. It could be considered a moderately strong relationship. R-squared is 70.7006% and the movement of BET return explains over 70% of the variability in BET-C return, which is not a surprise, due to the fact that BET portfolio is included in BET-C portfolio; it should not be forgotten that BET portfolio concentrates those companies responsible for around 70% of total trades at BVB.
The correlation coeffi cient between the daily returns of BET and BET-FI indexes15 is 0.440805, describing a relatively weak relationship between the indexes.
14 Using the BET and BET-C values calculated in ROL (Romanian national currency).15 Using the BET and BET-C values calculated in ROL (Romanian national currency).

BUCHAREST STOCK EXCHANGE EVOLUTION 361
R-squared indicates that BET return explains 19.4309% of the variability in BET-FI return. This result confi rms that SIFs prices’ evolution has a weak connection with the prices’ evolution of the other company prices listed inside the fi rst category.
As it could be expected, the correlation coeffi cient between the daily returns of BET-C and BET-FI indexes16 is 0.437000 and describes a relatively weak relationship between those indexes. R-squared indicates that BET-C return explains 19.0969% of the variability in BET-FI return. This result confi rms that SIFs prices’ evolution has a weak connection with the prices’ evolution listed at BVB.
For all the three indexes, using a confi dence level of 99%, the relationship is statistically signifi cant.
4. Bucharest Stock Exchange performances
Table no.3 shows the BVB performances (using indexes) in comparison with the average infl ation rate reported by Romanian National Bank and in comparison with the average interest rate for bank deposits. During 1998, 1999 and 2000 the performances registered by those who invested at BVB were poor. The return at BVB increased during 2001 and passed over – for the fi st time – the infl ation rate and the average interest rate for bank deposits. Exceptional returns were registered - for the fi rst category, through BET, and for both categories, through BET-C – during 2002 and 2004. For BET-FI – concentrating SIFs (investment funds) evolution – exceptional performances were registered for 2001, 2002, 2003 and 2004, confi rming investors’ great interest for these BVB listed companies.
Table no.3 1998 1999 2000 2001 2002 2003 2004 20052
Infl ation rate (%) 59.1 45.8 45.7 34.5 22.5 15.3 11.9 9.13
Market dividend yield (%) 10.66 7.84 7.48 6.7 4.97 2.00 1.45
n/a
Average interest rate for bank deposits (%) 38.3 45.4 32.4 26.2 18.4 10.8 11.3
6.9BET annual return (%) -49.4 15.21 18.25 35.71 117.52 27.13 93.15
34.60BET-C annual return (%) -4.99 7.39 -6.47 124.02 22.62 98.29
24.95BET-FI annual return (%) 109.92 113.14 24.72 106.94
99.63Source: BVB Annual reports for 2001, 2002, 2003 and 2004 (www.bvb.ro) and Romanian National Bank (www.bnro.ro)
16 Using the BET and BET-C values calculated in ROL (Romanian national currency).
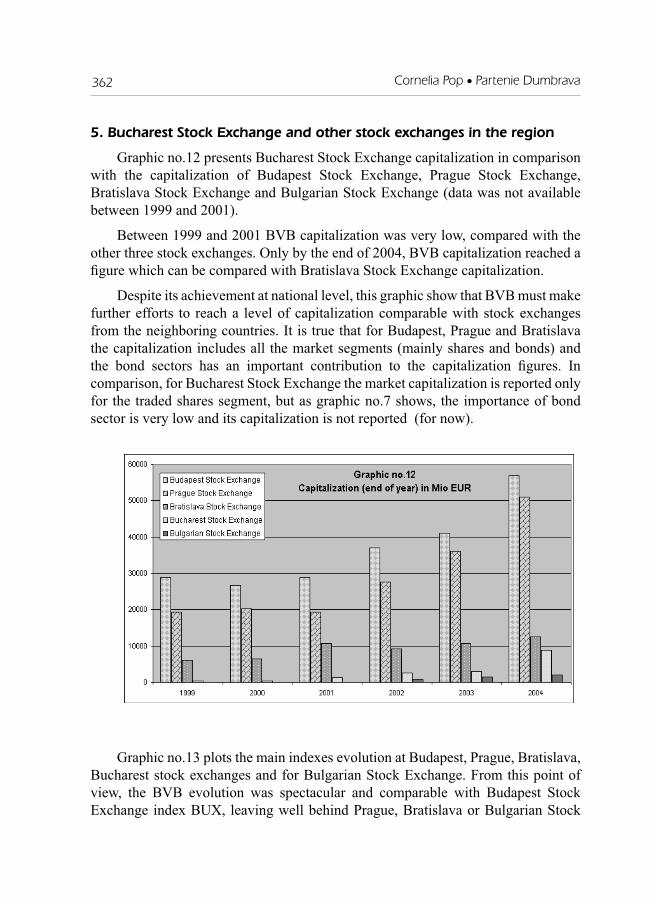
Cornelia Pop • Partenie Dumbrava362
5. Bucharest Stock Exchange and other stock exchanges in the region
Graphic no.12 presents Bucharest Stock Exchange capitalization in comparison with the capitalization of Budapest Stock Exchange, Prague Stock Exchange, Bratislava Stock Exchange and Bulgarian Stock Exchange (data was not available between 1999 and 2001).
Between 1999 and 2001 BVB capitalization was very low, compared with the other three stock exchanges. Only by the end of 2004, BVB capitalization reached a fi gure which can be compared with Bratislava Stock Exchange capitalization.
Despite its achievement at national level, this graphic show that BVB must make further efforts to reach a level of capitalization comparable with stock exchanges from the neighboring countries. It is true that for Budapest, Prague and Bratislava the capitalization includes all the market segments (mainly shares and bonds) and the bond sectors has an important contribution to the capitalization fi gures. In comparison, for Bucharest Stock Exchange the market capitalization is reported only for the traded shares segment, but as graphic no.7 shows, the importance of bond sector is very low and its capitalization is not reported (for now).
Graphic no.13 plots the main indexes evolution at Budapest, Prague, Bratislava, Bucharest stock exchanges and for Bulgarian Stock Exchange. From this point of view, the BVB evolution was spectacular and comparable with Budapest Stock Exchange index BUX, leaving well behind Prague, Bratislava or Bulgarian Stock

BUCHAREST STOCK EXCHANGE EVOLUTION 363
Exchange. From the performances point of view, BVB could become interesting for international investors.
We were not able to fi nd data about the market liquidity regarding all the above mentioned stock exchanges, so the comparison is incomplete. Indexes’ evolution describes Bucharest Stock Exchange as an interesting market, but the information offered by capitalization indicates caution for any investment on this stock exchange.
6. Problems faced by Bucharest Stock Exchange during its evolution
The main problems Bucharest Stock Exchange had to deal with – during those 10 years – were:
• The scarcity of good issuers mainly during 1996-2001. The problem of new entries is, still, not solved due to the fact that in many cases (utility companies and banks) the decision are taken at political level and the economic aspects are ignored in favor of individual or group interests. The privatization process of the last two banks owned by the Romanian state and for the utility companies should be completed in 2006 and a change in this situation should be expected.
• The lack of transparency and disclosure at listed companies’ level due to an inexplicable fear of listed companies’ boards to offer information. During 2001

Cornelia Pop • Partenie Dumbrava364
BVB started a campaign to encourage the transparency at listed companies’ level and created a virtual category17 –called ‘plus’ - where the companies with a high level of transparency could be included. To this category only one company was promoted during 2002; since than no other listed company fulfi ll the conditions for the virtual category indicating a higher level of transparency. The level of transparency for Romanian company is in a close correlation with the accounting system used at national level. In 1993 Romania switched from the old accounting system – in place before 1989 – to a new accounting system based on the French accounting model. By the end of 1990s it was clear that the implemented accounting system – adapted to many particularities of the Romanian economy – did not offer enough information. For several years the implementation of International Accounting Standards was taken into consideration, but the IAS no.29 Financial Reporting in Hyperinfl ationary Economies was ignored. Again, the information offered by the Romanian companies’ fi nancial statements was not accurate. Since 2004, due to the perspective of Romanian accession to European Union, new accounting regulations were issued in correlation European directives in this fi eld. Unfortunately, this new change would be slow, a lot of Romanian specialists in accounting are not familiar with the fi nancial securities and a lot of confusion is dominating the translation of European directives. Due to this situation, the transparency is – again – under question and will have to wait a little bit longer until it will reach the level required by international investors.
• The frauds made by brokerage companies during 1997 and 1999 which generated a lack of trust among investors. We must add that a lot of opportunist entered in the fi nancial service sector. Their level of knowledge regarding the intimate mechanisms of the capital market was very low, they gave bad advices (conscious or not) and a lot of small investors lost their money adding more momentum to the lack of trust generated by frauds.
• The legislative frame was relatively unstable between 1995 and 2004. The main law concerning the Romanian capital market between 1994 and 2002 (Law no.52/ 1994) was completed with many regulations issued by Romanian National Securities Commission. These regulations changed with a very rapid pace and it was diffi cult to keep track with the latest changes. In 2002 the old law was replaced with a series of laws which needed to be completed with supplementary regulations. But by the end of 2002 it was announced that the laws should be replaced by a new law – correlated with the European Union directives concerning capital markets and fi nancial services. As a
17 The companies included in ‘plus’ category are not listed separately, but in the summary of trade their symbol receive the sign (+) and the color for the data concerning them become blue.
BUCHAREST STOCK EXCHANGE EVOLUTION 365
consequence, between 2002 and 2004 the confusion regarding the legislative framework reached a high level. The actual law concerning Romanian capital market (Law no.297/ 2004) is working and the supplementary regulations were enforced since July 2005. It is supposed to ensure a more stable legal environment but only the years to come would confi rm this.
• The individual investors’ level of education in Romania is very low and their number on the market is estimated to be around 30.000 but no offi cial fi gure is available18. They tend to follow rumors and friend advices in search for a quick and easy gain. This situation it is not a surprise since the number of independent investment advisors is very low. Due to the change in regulations, by the end of 2004 only 5 independent investment advisors were certifi ed at national level. The advices offered by the brokers could be used, but the Romanian brokerage companies do not have the sophistication of their western counterparts. More than often these brokerage companies do not have analysts and account managers because they are expensive and because the number of clients do not justify their presence.
• The absence of the yield curve which did not (and still does not) allow the calculations of the risk premiums for the listed companies and for the portfolios which could be created by investing at BVB.
• The two crises which affected the Romanian mutual fund market in 1996 and 2000. In both cases big frauds were discovered and those crises had a big infl uence on small investors’ perception of Romanian capital market as a hole. Another effect – institutional investors like mutual fund management companies should redrew - for several years - from the Romanian capital market due to the lack of funds.
Despite these problems, Bucharest Stock Exchange managed to keep the quality of the listed companies, eliminated from its members those brokerage companies with problems and step by step diversifi ed its market segments, even if some of them did not reach – yet – the expected level of development.
The foreign investors’ interest toward Bucharest Stock Exchange was proven when the Memorandum of Understanding was signed between Bucharest Stock Exchange and Wiener Boerse AG for their future cooperation. It was establish, also, that the index ROTX (Romanian Traded Index) – on Romanian listed companies – would be launched in the fi rst quarter of 2005. The launching took place and the ROTX index evolution is presented in graphic no.11.
18 We must mention that the general trend among Romanian people is to spend their money for general goods and the investments are almost ignored.

Cornelia Pop • Partenie Dumbrava366
7. Bucharest Stock Exchange perspectives
May 22, 2003 Bucharest Stock Exchange and RASDAQ Electronic Exchange19 announce their future merger to form ‘the most performing capital market in the region for a successful integration process of Romania in European Union’20.
Due to change in regulations, the next important step toward the announced merger was made only in January 10, 2005 when the decision of Bucharest Stock Exchange incorporation was taken. The process was long and the fi nal decision about the merger between BVB and RASDAQ was reached November 30, 2005.
This merger would bring new market sectors at BVB – including a ‘new market’ sector for young small and medium sized companies. The future structure of the new BVB is still not clear (no public announcements were made). We hope that in the near future the investors would fi nd out the information they need.
During 2004 another announcement was made – BVB is supposed to include in its structure a derivative market which function in Sibiu. Again, it is not clear how and when this derivative market would become part of BVB.
The new Bucharest Stock Exchange21 which would emerge from these announced mergers should be a complex and diversifi ed market, offering a variety of shares, bonds and hedging instruments. Unfortunately, for the moment, the lack of transparency – concerning its future structure - is not in its favor.
In the years to come, in order to enhance its position, Bucharest Stock Exchange must launch a professional PR campaign – which was not among its goals in the last few years, despite several attempts to promote its services.
And to complete the picture, Bucharest Stock Exchange needs to develop its co-operation with the stock exchanges in the region, mainly with the stock exchanges in the neighboring countries because a common trading platform would only be a competitive advantage on the integrated European capital market.
Literature
Annual Report (1999) Bratislava Stock ExchangeAnnual Report (2000) Bratislava Stock Exchange
19 Rasdaq Electronic Exchange was created in November 1996 as an OTC market to allow the trading of privatized companies which did not fulfi ll the conditions to be listed at BVB. Unfortunately, due to a big number of companies admitted and its lack of transparency, this OTC market had a negative image in front of Romanian investors.
20 www.bvb.ro/medianews 21 Bucharest Stock Exchange would keep its name.

BUCHAREST STOCK EXCHANGE EVOLUTION 367
Annual Report (2001) Bratislava Stock ExchangeAnnual Report (2002) Bratislava Stock ExchangeAnnual Report (2003) Bratislava Stock ExchangeAnnual Report (2004) Bratislava Stock Exchange
Annual Report (2001) Bucharest Stock ExchangeAnnual Report (2002) Bucharest Stock ExchangeAnnual Report (2003) Bucharest Stock ExchangeAnnual Report (2004) Bucharest Stock Exchange
Annual Report (1999) Budapest Stock ExchangeAnnual Report (2000) Budapest Stock ExchangeAnnual Report (2001) Budapest Stock ExchangeAnnual Report (2002) Budapest Stock ExchangeAnnual Report (2003) Budapest Stock ExchangeAnnual Report (2004) Budapest Stock Exchange
Annual Report (2004) Bulgarian Stock Exchange
Annual Report (1999) Prague Stock ExchangeAnnual Report (2000) Prague Stock ExchangeAnnual Report (2001) Prague Stock ExchangeAnnual Report (2002) Prague Stock ExchangeAnnual Report (2003) Prague Stock ExchangeAnnual Report (2004) Prague Stock Exchange
www.bse.hu – the offi cial site of Budapest Stock Exchangewww.bsse.sk – the offi cial site of Bratislava Stock Exchangewww.bse-sofi a.bg – the offi cial site of Bulgarian Stock Exchangewww.bvb.ro – the offi cial site of Bucharest Stock Exchangewww.pse.cz – the offi cial site of Prague Stock Exchange
Miljenko Crnjac • Dominika Crnjac368
INVESTMENT PROJECT EFFICIENCY EVALUATION
Miljenko Crnjac, ProfessorFaculty of Economics
Dr.sc. Dominika CrnjacFaculty of Electrical Engineering Osijek
Summary
Financial effi ciency of investment project is being evaluated in this paper. It is showed that the net present value function is constant and that quota value is equal to c0 when i converges to the infi nite. Optimal rates i are analyzed in certain cases and everything is illustrated through examples.
Keywords: investment, effi ciency, project, investor, money fl ow, interest rate.
1. Introduction
Given that project justifi cation appraisal is carried out by measuring investments and the effects of these investments, and given that these effects can generally be different, we can observe them in different conditions and from different points of view.
In this paper we will concentrate on fi nancial effi ciency of investment project, which should answer the question how justifi ed it is to invest fi nancial assets into a certain project from the viewpoint of the company making the investment.
The project duration period is T(n). In time T(n) investments and expected investment effects are observed. For many business projects it is not possible to determine exact money fl ow, therefore statistical theory is used.
Assuming that ct is money difference between money income and money outlay in any time interval during the project.
ct = money income in moment t – money outlay in moment t.
If money fl ow is constant, then money fl ow net rate can be expressed as follows:
)()()( 21 tctctc −= ,
where c1(t) is income rate, and c2(t) is outlay rate of money assets in the project moment t.

INVESTMENT PROJECT EFFICIENCY EVALUATION 369
If the difference between income and outlay is larger then zero, then we talk about positive money fl ow, and if the difference is less then zero, then we talk about negative money fl ow.
For a particular investment project, let us assume that we know T(n) (economic duration of a project) and net effects ct.
It is not hard to conclude that the investment project value at its beginning is in a discrete case:
(0) 11 20 2 1( )
1 (1 ) (1 ) (1 )n n
n n
c cc cNVSV i ci i i i
−−= + + + + +
+ + + +K ,
i.e.:
(0)
0( ) (1 )
nk
kk
NVSV i c i −
=
= +∑Equation 1
Where:
NVSV(0)(i) net present value at the beginning of a projecti interest rateT(n) project duration (usually years)ck project net effect at the end of year k.
It is in investor’s best interest to measure investment profi tability with regard to other investments, as this will indicate whether it is advisable to enter the fi nancial business. The issue here is whether we can enrich the given capital better than creditors.
Similarly to the previous situation, at the time T when the project fi nishes, we have the following situation:
∑ ∫ −− +++t
TtTtT
t dtitcic0
)1)(()1( ,
thus the net present value dependent on interest rate i equals to:
0
( ) (1 ) ( )(1 )T
T t T tt
tNVSV i c i c t i dt− −= + + +∑ ∫
Equation 2

Miljenko Crnjac • Dominika Crnjac370
If we presume that c(t) = 0, then we get Equation (1).
By substituting q = (1 + i)-1, we get ( ) tt
tNVSV i c q= ∑ , i. e. (1).
Note 1.
If the project duration time is infi nite, accumulation is not defi ned, whereas net present value is defi ned by Equation (2). It is not hard to see that the function
NVSV(i) is a continuous function of interest rate and that 0lim ( )i
NVSV i c→∞
=1.
Assuming that the investment is with fi xed interest rate i1 , equation (2) leads to the conclusion that the project is profi table if and only if NVSV(i) > 0.
If NVSV(i) is moving from positive to negative values for i and around i0, then the project is profi table under these conditions if and only if i1 < i0.
Note 2.
Financial effi ciency evaluation of a project can be determined by mathematical analysis of a function graph NVSV(i). When using net present value criteria, the problem is how to choose optimal interest rate i , in which money fl ows are discounted.
2. Examples
Example 1
If there is one investment c0 at the beginning of the project duration, and if all effects are constant and greater than zero throughout the project, then net present value is:
(0)0 0
1( )( 1)
n
nrNVSV i c c
r r−
= +− 2
,
where r = 1+ i0, 1000
0p
i =
The investment project is:
1 M. Crnjac, Matematika za ekonomiste, Ekonomski fakultet, Osijek (2000)2 M. Crnjac, Matematika za ekonomiste, Ekonomski fakultet, Osijek (2000)

INVESTMENT PROJECT EFFICIENCY EVALUATION 371
1) effi cient if NVSV(0)(i0)>02) neutral if NVSV(0)(i0)=03) ineffi cient if NVSV(0)(i0)<0
Example 2Internal profi tability rate ir is the rate at which net present value of investment
project is equal to zero. So, NVSV(0)(ir)=0, i.e. ∑=
− =+n
k
krk ic
00)1( .
Given that i0 is the profi tability rate at which common enterprise projects are approved, it is not hard to conclude that the investment project is:
1. effi cient for ir > i0
2. neutral for ir = i0
3. ineffi cient for ir < i0
Using iterative methods it is not hard to calculate internal profi tability rate from the
equation ∑=
− =+n
k
krk ic
00)1( .
Example 3Asset return time T(ip) is the time necessary to return investments. It can be
calculated by the equation ( )
(0)
0( ) (1 ) 0
pT ik
k pk
NVSV t c i −
=
= + =∑ , where NVSV(0)(t) is
the function of time. If t0 is the return time for similar projects, the investment project is:
1. acceptable if T(ip) < t0,
2. neutral if T(ip) = t0,
3. unacceptable if T(ip) > t0,
Using the permanency principle we can calculate:

Miljenko Crnjac • Dominika Crnjac372
(0)0(0)NVSV c=
1(0)
0(1) (1 ) k
k pk
NVSV c i −
=
= +∑2
(0)
0(2) (1 ) k
k pk
NVSV c i −
=
= +∑3
(0)
0(3) (1 ) k
k pk
NVSV c i −
=
= +∑
: (0)
0( ) (1 )
tk
k pk
NVSV t c i −
=
= +∑until we get NVSV(0)(t)<0 and NVSV(0)(t+1)≥0 thus having return time T(ip) from the open interval (t, t+1).
By using linear interpolation3 we have:
(0)
(0) (0)
( )( )( ) ( 1)pNVSV tT i t
NVSV t NVSV t= +
− +
References:
1) J. Bedeković i koautori; Planiranje investicijskih projekata, Ekonomski institut, Zagreb (1993)
2) R. Scitovski, R. Galić i M. Šilac-Benšić; Numerička matematika, vjerojatnost i statistika, Elektrotehnički fakultet, Osijek (1993)
3) B. Novak, Odlučivanje u fi nancijskom upravljanju, Ekonomski fakultet, Osijek (2000)
4) M. Crnjac, Matematika za ekonomiste, Ekonomski fakultet, Osijek (2000)
3 R. Scitovski, R. Galić i M. Šilac-Benšić; Numerička matematika, vjerojatnost i statistika, Elektrotehnički fakultet, Osijek (1993)
REGULATION OF CONSUMER CREDIT IN POLISH LAW 373
REGULATION OF CONSUMER CREDIT IN POLISH LAW
Justyna Maliszewska-NienartowiczNicolaus Copernicus University in Torun, Poland
Abstract
The purpose of the paper is to present the most important Polish regulations concerning consumer credits. They are contained in the Act on Consumer Credit which was adopted on 20th July 2001. Its aim was to approximate Polish law with the EU requirements predicted in the Council Directive 87/102/EEC of 22 December 1986 on consumer credit.
As a result the Polish legislator regulates the most important aspects of such credit agreements. First of all, the credit agreement is defi ned. This defi nition is quite wide – “credit agreement means an agreement whereby a creditor grants or promises to grant to a consumer a credit in any form”. However, it is narrowed by the list of exceptions which are discussed in the paper. Secondly, the form and content of credit agreements are regulated (with special care of the questions of total credit costs and real annual percentage rate). Thirdly, consumers are protected in relation to bills of exchange and cheques and also in the case of the assignment of the creditor’s rights under a credit agreement to a third person. Fourthly, the Act predicts consumer rights to discharge his obligations under a credit agreement before the time fi xed by it and to withdraw from the agreement. Finally, the provisions of the Act are binding on the creditor and he cannot exclude or limit consumer rights in the agreement.
One the whole it can be said that Polish consumers are quite well protected against the unfair practices of different creditors. Now, everything depends on their readiness to use their rights as creditors can try to diminish the role of the provisions of the Act.
Key words: consumer credit, credit agreement, total costs of the credit, real annual percentage rate, consumer rights to withdraw from the agreement and to discharge his obligations under a credit agreement before the time fi xed by it,

Justyna Maliszewska-Nienartowicz374
1. Introduction
The consumer is a weaker party to the credit agreement. The creditor is usually a professional who has at his/her disposal fi nancial measures as well as suffi cient knowledge about market processes. Apart from that the consumer acts under a pressure as he enters the credit agreement in certain situations, connected with the lack of money. Thus, it can be easily seen that in credit relations both parties are in unequal situation. Therefore, the weaker party – consumer - has to be protected and the consumer credit needs special regulations.
In Poland this problem is regulated in the Act on Consumer Credit which was adopted on 20th July 2001 and entered into force on 19th September 20021. Its regulations have been infl uenced by the provisions of the European Union directive as Poland has been obliged to harmonize its law with the EU Law.
2. The parties of the credit agreement and its definition
2.1. Creditor and consumer
In art. 2 (1) it is predicted that the creditor is an entrepreneur who in the frames of his/her activity grants or promises to grant a credit to a consumer. This defi nition is quite general and includes not only banks and other credit institutions but also other kinds of entrepreneurs, which is benefi cial for consumers who borrow money not only from professional institutions.
The consumer means a natural person who enters a credit agreement for purposes which are not connected directly with his/her economic activity (art. 2 (4) of the Act). In other words legal persons cannot be treated as consumers even if they would enter a credit agreement for purposes not connected with their economic activity.
2.2. Credit agreement
According to art. 2 (1) of the Act the credit agreement means an agreement whereby a creditor grants or promises to grant a consumer a credit in any form. The fi nal phrase -“in any form” underlines that this term is quite wide. At the same time the Polish legislator tries to list the examples of such agreements (it is an open list). They include in particular:
1) loan agreements,
2) credit agreements according to the regulations of Polish bank law,
1 It is published in Polish Dz. U. 2001, no 100, position 1081. It was amended by the Act of 22 May 2003 (Dz. U 2003, no 109, position 1030)
REGULATION OF CONSUMER CREDIT IN POLISH LAW 375
3) agreements on deferment of the term for fulfi lment of monetary obligation,4) agreements according to which consumer’s monetary obligation is to be
fulfi lled later that creditor’s obligation,5) agreements according to which the creditor is obliged to undertake an
obligation from the third person and the consumer is obliged to give back this performance to the creditor.
All these agreements have the same economic function - granting the credit in the economic sense, independently of the juridical construction2. In other words these are the agreements in which obligations are not fulfi lled simultaneously, to be more precise: in which the date of payment was deferred.
There are also some exclusions from this defi nition. According to art. 3 (1) and (2) of the Act it does not apply to the following credit agreements:
a) involving amounts less than 500 PLN or more than 80 000 PLN or amounts equal to the given but in foreign currency;
b) under which the consumer is required to repay the credit within a period not exceeding three months;
c) under which the consumer is not obliged to pay interests or any other charges connected with credit;
d) in the form of the debit balance on a current account, unpredicted in the agreement but existing with the creditor’s consent for a period of at least three months (however, the provisions of art. 6, 9 and 10 of the Act shall apply to such credits);
e) hiring agreements if they do not provide that the title will pass ultimately to the consumer;
f) intended for the purpose of acquiring property rights in land or in an existing or projected building, intended for the purpose of renovating or improving a building as such3;
g) intended for the payment of credit incurred for purposes listed in point g; h) in the form of deferred payment for non-pecuniary performance which consist
of continuous delivery of electric energy, water, gas etc., if the consumer is obliged to pay for the performance in certain periods of time;
2 Compare E. Łętowska, Prawo umów konsumenckich (Consumer Contracts Law), Warszawa 2002, s. 465.
3 This point is formulated in the Act in a very detailed way. It predicts different forms of rights connected with land and buildings.

Justyna Maliszewska-Nienartowicz376
i) under which the limit of the credit on the current account or other savings accounts (other then credit accounts) is predicted (however, the provisions of art. 5a and 11 of the Act shall apply to such agreements).
It should be noticed that the exceptions predicted in points a-c are quite similar from the consumer’s point of view – they are not very risky for him/her (apart from the credit agreements which involve the amounts of more that 80.000 PLN). Maybe therefore, the Polish legislator decided to exclude these types of credit agreements from the general defi nition. As far as credits with the amounts of more that 80.000 PLN are concerned it should be underlined that they usually do not serve the consumption purposes. Thus, they differ from the usual credit agreements.
Polish legislator also decided to exclude from the defi nition of the credit agreement such types of them which aim at certain purposes e.g. acquiring of the land or building, usage of things and rights for certain amount of money, continuous delivery of certain non-pecuniary performances. Moreover, the Act does not generally apply to the debit balance on the current account as well as to the limit of the credit predicted in the agreements concerning current and savings accounts. However, there are some provisions which regulate these types of credit agreements (they will be presented in point 7.2. of the paper).
On the whole it can be seen that this broad defi nition of the consumer credit is limited by the list of exceptions. Different reasons dictated these exclusions. However, it should also be noticed that most of them are similar to the list of exceptions predicted in the art. 2 of the Council Directive 87/102/EEC of 22 December 1986 for the approximation of the laws, regulations and administrative provisions of the Member States concerning consumer credit4. This means that Polish legislator acted under the infl uence of these regulations.
3. The form and content of the credit agreement
The credit agreement should be made in writing, unless the more specifi c regulations predict another particular form (however, these forms are even stricter e.g. the agreement in the presence of a notary). The consumer shall receive a copy of the written agreement. This is a very important consumer right as he/she will be able to read all the terms of the agreement once again after the conclusion of contract. It should be noticed that this is necessary in order to exercise another right – to withdraw from the credit agreement (it will be presented in point 6 of the paper).
The written agreement should contain the following data:
4 O.J. of the European Union L 42, 10.02.1987, pages. 48-53.

REGULATION OF CONSUMER CREDIT IN POLISH LAW 377
1. the identity of both consumer and creditor such as the name, surname and address (if the creditor is a legal person also the information on the number in the register);
2. the amount of credit;
3. the rules and terms of its repayment;
4. the annual percentage rate of charge and a statement of the conditions under which the annual percentage rate of charge may be amended;
5. payments, commissions and other costs of credit;
6. information about total costs of the credit and real annual percentage rate (these terms will be explained in the next point of the paper);
7. the way of the credit security, if the agreement predicts it and the amount of payment connected with it;
8. information about any other costs connected with the agreement, which should be paid by the consumer;
9. information about total amount of all costs, payments and commissions which are to be paid by the consumer;
10. information about the consumer right to discharge his obligations under a credit agreement before the time fi xed by it and the consequences of such earlier repayment of the credit;
11. information about the time, way and consequences of the exercise of the consumer right to withdraw form the agreement;
12. information about the consequences of violation of these agreement terms which regulate the rules and terms of the credit repayment.
Thus, it can be seen that any credit agreement shall contain much inforamtion in order to be compatible with the provisions of the Act. The particular emphasis was put on a very detailed determination of different costs related to credits. Additionally, the total sum of these costs should be given in order to let a consumer know what kind of fi nancial burden he/she is going to take. It should also be added that fl agrant infringement of the requirements concerning the content of the credit agreement or omission of the obligation of delivery of its copy is connected with the fi nancial penalty – the fi ne (art. 19 of the Act).
Justyna Maliszewska-Nienartowicz378
4. The total cost of the credit and real annual percentage rate
These are new terms which were introduced by the Polish Act under the infl uence of the EU directive. Therefore, they are defi ned in a separate provision of art. 7. Total cost of the credit means all the costs of the credit including interest and other charges which should be paid by the consumer with the exception of certain costs e.g. connected with the account from which the repayment is realise; with the establishment, change and expiry of credit security and insurance; resulting from the changes of exchange rates.
Thus the Act obliges creditor to calculate this “total cost of credit” and include this information in the credit agreement. Apart form that, he is obliged to inform the consumer about “real annual percentage rate of charge”, expressed as an annual percentage of the amount of the credit granted and calculated according to mathematic formula contained in the Annex5. In this annex we can also fi nd the examples of calculations which should be helpful for the creditors
The calculation of these amounts is a very important task as the art. 16 of the Act predicts that in the advertisements concerning consumer credits creditors are obliged to inform about the real annual percentage rate of charge, calculated on the basis of the total cost of credit6. In this way the requirement to inform consumers in the broadest possible way is realized. This obligation is also predicted in order to fi ght against practice which is dangerous for consumers: offi cial announcement of percentage rate on a relative low level connected with burdening consumers with different charges and payments7.
5. Consumer protection in relation to bills of exchange and cheques and assignment of the creditor’s rights under a credit agreement to a third person
A bill of exchange or a cheque can be drafted by the consumer in order to secure the credit. In this situation there is a danger of infringement of his/her interests as the rules of liability predicted in the regulations on bills of exchange and cheques are strict e.g. the debtor cannot raise all objections to the following purchasers of the claim8. However, if the bill of exchange or a cheque can be acquired only by
5 Compare point 1 of the Annex attached to the Act.6 If this obligation is not fulfi lled, the creditor will be punished by fi ne (art. 19 of the Act).7 See E. Łętowska. op. cit., s. 466.8 Compare J. Pisuliński, G. Tracz, Ochrona interesów ekonomicznych konsumentów w stosunkach
kredytowych [w:] Ochrona konsumenta. Część I. (The Protection of Consumer Economic Interests in the Credit Relations [w:] Consumer Protection, Part I), edited by E. Traple, M. du Vall, Warszawa 1998, s. 31.

REGULATION OF CONSUMER CREDIT IN POLISH LAW 379
transfer (they should contain the clause „not for order” or its equivalent), these limits are not binding. Thus, only drafting of the bill of exchange or cheque „for order” is dangerous for the consumer9.
Therefore, the Act predicts that: „the bill of exchange or cheque given to the creditor in order to fulfi ll or secure the performance of the credit agreement should contain the clause „not for order” or its equivalent” (art. 9 (1)). In this way consumers are protected against strict liability connected with the drafting of bills of exchange or cheques. Moreover, the creditor is obliged to give back the bill of exchange to the consumer as soon as he fulfi ls his obligations connected with the credit agreement.
The other situation - assignment of the creditor’s rights under a credit agreement to a third person – is also dangerous for consumers as it can deprive them of the right to plead against that third person any defence which was available to him against the original creditor, e.g. set-off. Therefore, the Act predicts the protection of the consumer in this fi eld: in the case of assignment of the creditor’s rights to a third person, the exclusion or limitation of any defence which was available to consumer against the original creditor have no legal effects (art. 10 (1)). Thanks to this provision consumer is protected even if this „third person” does not meet the requirements predicted by the Act in relation to the creditor10.
6. Consumer rights to discharge his obligations under a credit agreement before the time fixed by it and to withdraw from the agreement
According to art. 8 of the Act consumers are entitled to discharge their obligations under a credit agreement before the time fi xed by it. However, the time of repayment should be the same as predicted for payment of the installments and the consumer should inform the creditor about his plans at least three days before making the earlier repayment.
As a result of earlier repayment the consumer is discharged from the obligation to pay interests for the period after the repayment of the credit. If the credit agreement did not predict the interests, then the consumer is entitled to the reduction of charges and payments connected with credit proportionally to the period, by which the time of usage of the credit was shortened. What is also important, the Act excludes a very common practice of predicting commissions for the earlier repayment of the credit. Art. 8 (3) predicts that creditors cannot require commission in this situation. They are also obliged to settle with the consumer within fourteen days since the earlier repayment.
9 Ibidem.10 Compare E. Łętowska, op. cit., s. 467.

Justyna Maliszewska-Nienartowicz380
The Act on Consumer Credit also predicts the consumer right to withdraw from the agreement (art. 11). He can exercise this right in the period of ten days since the conclusion of the agreement and he does not have to give reasons for his withdrawal11. This is a very important and far-reaching right. He has ten additional days to think everything over. If he thinks that the conclusion of the credit agreement was not good for him, he can withdraw from it.
If the credit agreement does not contain information about the right to withdraw from it, then the consumer can do it within ten days since he gets information about this rights. However, for the sake of stability of contractual relations this right can be exercised in the period of no more that three months since the conclusion of the agreement. These time limits are regarded as being kept, if the consumer before their expiration makes a statement on the withdrawal from the agreement (it is sent to the place which address is given by the creditor, also the pattern of such statement should be given during the conclusion of the agreement)
In can be concluded that Polish legislator improved the consumer position by recognition of his right to withdraw from the agreement without giving reasons. Consumers very often act under the creditor’s pressure and cannot evaluate his situation properly at the time of the conclusion of the agreement.
7. Particular types of the credit agreements
7.1. Agreements for financing the supply of particular goods or services
These types of agreements are regulated separately in the Act as they differ from the usual credit agreements. The fi rst group: credits for fi nancing the supply of goods and services are very common in practice. Thanks to them consumers can meet their personal needs, even if they do not have appropriate fi nancial measures. However, these agreements are not always benefi cial for them. Therefore, the Act regulates them in a detailed way, beginning with the requirements concerning their content.
Apart form the usual information, such agreements should contain:
• a description of the goods or services;
• the cash price and the price payable under the credit agreement ;
• the part of the price which should be paid in cash;
• the terms on which the consumer becomes the owner of goods, if the sale agreement was concluded with the reservation of the ownership;
11 This right is excluded only in these types of credit agreements which are concluded for fi nancing the supply of such goods or services which prices depend on prices on the fi nancial or stock exchange markets.

REGULATION OF CONSUMER CREDIT IN POLISH LAW 381
• information that the credit can be obtained only for the creditor indicated by the seller (this concerns the situation in which the seller concluded an agreement, according to which the credit for fi nancing the goods or services can be obtained only from this creditor).
Moreover, in the case of withdrawal from the sale agreement (because of non-performance or inappropriate performance) this withdrawal has also effects for the credit agreement. However, there must be an agreement between the seller and the creditor according to which the credit for fi nancing the goods or services can be obtained only from this creditor. In this situation the creditor is obliged to give back to the consumer the costs of the credit, apart from the preparatory and security charges.
It should be noticed that this protection is not full. There may be situations in which the seller and the creditor are not bound by the above-mentioned agreement. Therefore, the Act predicts additionally that if the person who conclude the sale agreement with the consumer, grants the credit in his own name, then the withdrawal from the sale agreement has also effects for the credit agreement. In this situation the creditor is obliged to give back to the consumer the costs of the credit, apart from the preparatory and security charges. Moreover, if the consumer credit was designed for the acquisition of goods or services on the basis of the agreement concluded away form business premises or the distance agreements, then thw withdrawal from such agreement has also effects for the credit agreements (art. 12 (1) of the Act). Thank to such detailed regulations the consumer is well protected in the situations when he buys goods or services on credit.
7.2. Agreements in the form of debit balance or predicting the limit of credit on the current account or other savings accounts
Unpredicted in the agreement debit balance on a current account is generally excluded from the scope of the Act (compare point 2.2.of the paper). However, some of its provisions should be used to this type of situation, in particular art. 6. It predicts that „if the unpredicted in the agreement debit balance on a current account exists with the creditor’s consent for a period of at least three months, then the creditor is obliged to inform the consumer in writing about the annual percentage rate ant other costs of credit and about their changes”. Moreover, the consumer is protected in relation to bills of exchange and cheques and in the case of assignment of the creditor’s rights under a credit agreement to a third person (art. 9 and 10 of the Act shall be applied also to debit balnce unpredicted in the agreement).
Similarly, the credit agreements under which the limit of credit on the current account or other savings accounts (other then credit accounts) was predicted are

Justyna Maliszewska-Nienartowicz382
generally excluded from the scope of the Act. However, its provisions concerning the right to withdraw from the agreement should apply to them. Moreover, art. 5a predicts that such credit agreements should be made in writing and the consumer shall receive its copy. The agreement should contain information on:
1. the identity of both consumer and creditor such as the name, surname and address (if the creditor is a legal person also the information on the number in the register);
2. the annual percentage rate of charge and a statement of the conditions under which the annual percentage rate of charge may be amended;
3. the way of the credit security, if the agreement predicts it and the amount of payment connected with it;
4. the credit limit if it is determined;
5. information about charges, commissions and other costs which should be covered by the consumer in the relation to the agreement;
6. the conditions of the repayment of the credit;
7. information about the time, way and consequences of the exercise of the consumer right to withdraw form the agreement.
This means that although these types of agreements (related to the current or saving accounts) are excluded from the scope of the Act, they have to meet the most basic requirements concerning their form and content. Apart form that, consumers can withdraw from these types of agreements.
8. Semi-imperative character of the provisions on consumer credits
Art. 17 of the Act predicts that agreements cannot exclude or limit the consumer rights predicted in the Act, also in the case of choice of any foreign law. In such situations the provisions of the Act shall be used.
This means that its regulations are binding on creditors to be more precise they have a semi-imperative character. In other words the creditor can include in the agreement such terms which are more benefi cial for the consumer than predicted in the Act but he cannot predict provisions which are stricter than predicted in the Act.
9. ConclusionIt should be noticed that there has been much change in recent years in the
types of credit available to and used by consumers. These new forms of consumer

REGULATION OF CONSUMER CREDIT IN POLISH LAW 383
credit will continue to develop. Therefore, consumers should be protected against any unfair practices of the creditors. This can be done in different ways.
First of all, the consumer should receive adequate information on the conditions and cost of credit and on his obligations (this information should include, inter alia, the annual percentage rate of charge for credit). The provision of information on the cost of credit in advertising and at the business premises of the creditor can also make it easier for the consumer to compare different offers. Consumer protection can be further improved if credit agreements are made in writing and contain certain minimum particulars concerning the contractual terms. Moreover certain consumer rights can be predicted in particular: to discharge his obligations before the due date (then he should be entitled to an equitable reduction in the total cost of the credit) and to withdraw from the agreement. Finally, consumers should be suitably protected in relations to the bills of exchange and cheques and in the case of the assignment of the creditor’s rights arising under a credit agreement.
All these ways of consumer protection are predicted in the Polish Act on Consumer Credit. Thus, it can be said that its regulations are benefi cial for consumers. The only problem is connected with the exclusion from its scope of credit agreements intended for the purpose of acquiring property rights in land or in an existing or projected building or intended for the purpose of renovating or improving a building as such. Such exclusion is also predicted in the Council Directive 87/102/EEC of 22 December 1986 on consumer credit. Unfortunately, Polish legislator repeated its regulations and did not take into account the fact that these types of agreements are very often concluded by Polish consumers. Thus, they are deprived of the protection predicted in the Act when they conclude the credit agreement connected with the purchase of a house or a fl at. Nowadays this is the biggest complain on the part of Polish consumers.
Literature:1. Łętowska E. (2002): Prawo umów konsumenckich (Consumer Contracts Law),
Warszawa;
2. Maliszewska-Nienartowicz J. (2002): Ustawa o kredycie konsumenckim – dostosowanie polskich regulacji do wymogów prawa wspólnotowego (The Act on Consumer Credit – the Adaptation of Polish Regulations to the Requirements of the Community Law), Przegląd Prawa Gospodarczego 9 (The Review of Economic Law);
3. Maliszewska-Nienartowicz J. (2003): Ochrona interesów konsumentów w stosunkach kredytowych po nowelizacji ustawy o kredycie konsumenckim (The

Justyna Maliszewska-Nienartowicz384
Protection of Consumer Interests in the Credit Relations after the Amendment of the Act on Consumer Credit), Przegląd Prawa Gospodarczego 11 (The Review of Economic Law);
4. Pisuliński J. (2001): Ustawa o kredycie konsumenckim (The Act on Consumer Credit), Prawo Bankowe 9 (Bank Law);
5. Pisuliński J., Tracz G. (1998): Ochrona interesów ekonomicznych konsumentów w stosunkach kredytowych (The Protection of Consumer Economic Interests in the Credit Relations) in E. Traple, M. du Vall, ed.: Ochrona konsumenta. Część I. (Consumer Protection, Part I), Warszawa.
6. Piś-Barganowska J. (2002): Prawne konsekwencje wystawienia weksla przez konsumenta-kredytobiorcę (Legal Consequences of Drafting a Bill of Exchange by the Consumer-Debtor), Prawo Bankowe 3 (Bank Law).

DETERMINANTS OF HOUSEHOLD CREDIT INDEBTEDNESS IN THE... 385
DETERMINANTS OF HOUSEHOLD CREDITINDEBTEDNESS IN THE REPUBLIC OF CROATIA
Gordana Duki}Darko Duki}
ABACUS tuition, research and business consultancy, Osijek, Croatia
1. Introduction
Credits and credit relations occupy a special position in modern economic processes. Economic systems of today are inconceivable without credit. Sensibly invested credits can be a generator of economic development, but inadequately used, they can contribute signifi cantly to macroeconomic instability and serious cyclical disturbances.
All the segments of society take out loans to help them realize certain projects and to satisfy the needs they could not normally afford. Debtors range from households and companies to the state sector and fi nancial institutions themselves. The basic motive for extending credit is receiving the interest, this being the compensation for the lenders. Taking credit, on the other hand, can be motivated by a variety of reasons. Some households are so short of money that they take out loans to satisfy some existential needs. Even so, this sector often uses credit to acquire some material goods or pay for the services which cannot be considered primary. Purchasing a better and more expensive car, jewellery, or the latest hi-fi equipment are just a few examples. Companies take credit in order to start or expand their operations, ensure an uninterrupted production process, fi nance research and development, or upgrade their marketing. By taking loans, companies also attempt to solve different problems that they encounter in business. State institutions at all levels frequently use credit to cover budgetary defi cits. Credits are also used to fi nance big infrastructural projects, as well as system reforms in areas of general interest, such as health care, judiciary and defence. A growing demand for credit results in growing debts of banks and other fi nancial institutions. This sector obtains scarce fi nancial resources, primarily on foreign fi nancial markets, and puts them then on the domestic market at higher interest rates, thus increasing its profi ts.
In the past few years there is a trend of increasing indebtedness for all sectors in Croatia. As a consequence of such developments, both internal and external

Gordana Duki} • Darko Duki}386
debts have increased signifi cantly. The share of debt in gross domestic product has come close to the level at which overall macroeconomic stability can be seriously disrupted. All these factors indicate how important it is to understand the dynamics of credit indebtedness in order to correctly comprehend macroeconomic movements in the economy as a whole.
This paper will attempt to determine the factors with the biggest infl uence on the level of household credit indebtedness in the Republic of Croatia over past ten years. Regression analysis will be used to defi ne the character of relationships existing between this sector’s indebtedness and individual economic variables assumed to have an infl uence on household debt. The results will be used to formulate an adequate macroeconomic model.
2. Model design process for household credit indebtedness in Croatia
When designing a model of household indebtedness in Croatia, it is fi rst necessary to identify all the relevant factors, specifying them as independent (predictor) and dependent (response) variables. A number of variables can be designated as independent. This research was limited to the phenomena with accessible values, i.e. the data that can be established in an uninterrupted time series. The dependent variable is represented by credits extended by banks to households, i.e. credit indebtedness of this sector.
After determining the research variables it is necessary to defi ne correctly the form of interdependence connecting those variables. The relationships between individual economic variables are generally defi ned as stochastic, but it is assumed that the deterministic component is an integral part of the model. The type of connection which best describes the relationship between the variables needs to be examined by adequate analytical instruments. In this way it will be determined whether the character of connection is linear or non-linear.
The relationship between the identifi ed response and predictor variables will be quantifi ed by defi ning an initial form of regression model. As this research attempts to examine the impact of a number of independent variables on the changes of the dependent variable, the basis for regression analysis will be the multiple regression model. Assuming that there is a linear connection between the examined variables, an adequate model of multiple linear regression has the following formulation:
yi=α + β1xi1 + β2xi2 + ... + βjxj + ... + βkxk + εi, i=1, 2, ..., n.
The value of dependent variable yi is thus determined as a linear combination of k values of independent variables xij, model parameters α and βj (j=1, 2, …, k), and

DETERMINANTS OF HOUSEHOLD CREDIT INDEBTEDNESS IN THE... 387
random error εi. It is here assumed that n values of the dependent and independent variables are known.
Regression analysis is conducted on the basis of the defi ned initial model. But, when identifying the determinants of credit indebtedness, one can also calculate the basic descriptive statistics of the dependent and independent variable set. By means of a correlation matrix it is necessary to determine the direction and strength of correlations existing between the examined variables. The signifi cance of the calculated correlation coeffi cients is verifi ed by testing.
The strength of correlation between the dependent and the set of independent variables is expressed by the coeffi cient of multiple correlation and the representative quality of the regression model by the coeffi cient of multiple determination. Apart from these indicators, it is necessary to determine the value of adjusted coeffi cient of multiple determination which is calculated taking into account the degree of freedom, as well as the standard error of estimate. Standard error of estimate measures the dispersion of the observed values from the predicted values.
In this part it is usual to present the Analysis of Variance (ANOVA) table which includes certain statistical-analytical values. Its elements are obtained by breaking down the variation sources in the dependent variable, whereby there is a difference between model-interpreted deviations and residual deviations. This table contains also the F-value, a test statistic used to test the regression signifi cance. The decision whether to accept or reject the assumption that there is at least one independent variable which has a signifi cant impact on the change of household credit indebtedness can be taken on the basis of p-level.
Once the regression coeffi cient values have been determined, it is possible to formulate the multiple linear regression model with estimated parameters:
y = α + β1x1 + β2x2 + ... + βjxj + ... + βkxk + εi, j=1, 2, ..., n.
In this model α is a parameter representing the value of dependent variable y when all the values of independent variable equal zero. The regression coeffi cient βj indicates the expected average change in the dependent variable y if the independent variable xj increases by one, and the remaining variables stay constant.
Next to assessed parameters there will be associated values of standard error of regression coeffi cient (SEE) and standardized coeffi cients of regression Β , which represent regression coeffi cients expressed in a standardized form. Such a transformation facilitates the comparison and understanding of their relative contribution in the prediction of the dependent variable. The signifi cance of each

Gordana Duki} • Darko Duki}388
regression coeffi cient will be determined by t-value and the associated p-level. Apart from this, the 95% confi dence interval for each regression coeffi cient will be determined.
Unique contributions of each independent variable to the prediction of the dependent variable can also be derived from partial correlation coeffi cients and semi-partial correlations. A partial correlation is a correlation between the observed independent and dependent variable, which remains after removing the correlations with other variables. A semi-partial correlation is a correlation between the observed independent variable, whose relations with other independent variables have been removed, and the dependent variable.
On the basis of the results obtained it will be possible to translate the model into a reduced form. However, the model obtained in this way needs to be checked continuously for adequacy. As required, it should be corrected and expanded by new variables.
3. Determining the factors of household credit indebtedness in Croatia
In order to determine the factors with the biggest infl uence on the changes in household credit indebtedness in Croatia, the following variables have been identifi ed as independent research variables:
� geometric mean of weighted averages of monthly banks' interest rates on kuna credits, indexed and not indexed to foreign currency, granted to households, in percentage on annual basis (IV1);
� state of time and savings deposits with banks (owned by households), including notice deposits, at the end of month, in millions of kuna (IV2);
� weighted average reserve requirement in percentage on reserve base (IV3);� average monthly net wages in current prices, in kuna (IV4);� month-on-month rate of change of retail price indices, i.e. consumer price
indices, in percentage (IV5);� midpoint exchange rates of the Croatian National Bank - monthly average
(IV6).
It should be noted that in determining the geometric mean of weighted averages of monthly interest rates we used their relative signifi cance as weights. Relative signifi cance is calculated as percentage shares of certain credit categories in total credits, according to the data from the last analyzed period. This means that because of lack of adequate data the relative signifi cance determined in the last analyzed period was projected on interest rate values for all the months covered by the research, and this can result in a certain amount of error.

DETERMINANTS OF HOUSEHOLD CREDIT INDEBTEDNESS IN THE... 389
The analysis until December 1997 covered the data referring to retail price indices, and after that, consumer price indices were used.
The amount of credit indebtedness of households in kuna at banks at the end of the month is defi ned as a dependent variable (DV). Loans to households in f/c have not been included in the analysis, since they have a very small share in the total amount of loans granted to households (in the last analyzed period the share of loans in f/c was less than 0.5%).
The research included data referring to the period from July 1995 to November 2005, in an uninterrupted time series. For each variable there are 125 known values, and, due to such volume, not all the data will be separately stated, only some of them will be itemized in Table 1.
MONTH/YEAR DV IV1 IV2 IV3 IV4 IV5 IV6
07/1995. 4216.00 18.02 943.09 29.87 1798 0.0 6.673312/1995. 4732.97 19.36 1044.87 30.90 1883 0.2 6.820412/1996. 6604.51 17.43 1843.59 35.91 2217 0.0 6.862312/1997. 12752.19 16.73 3077.72 32.02 2544 0.7 6.962212/1998. 17672.46 18.13 3116.21 29.57 2935 0.3 7.337112/1999. 19186.09 17.99 2698.99 30.50 3262 0.6 7.667712/2000. 23242.06 17.64 3138.14 23.22 3499 0.4 7.585612/2001. 30062.13 16.35 4266.37 19.67 3582 0.4 7.391212/2002. 42976.63 13.47 5790.11 19.00 3839 0.4 7.423412/2003. 54819.25 12.75 8483.26 19.00 4045 0.3 7.670212/2004. 64977.20 12.17 11511.88 18.00 4312 0.7 7.545011/2005. 76915.30 10.49 15167.58 18.00 4595 0.2 7.3750
Sources: “Distribution of Banks’ loans by domestic institutional sectors”, http://www.hnb.hr;“Banks’ Interest Rates on Kuna Credits Not Indexed to Foreign Currency”, http://www.hnb.hr;“Banks’ Interest Rates on Kuna Credits Indexed to Foreign Currency and on Credits in Euros”, http://www.hnb.hr;“Time and Savings Deposits with Banks”, http://www.hnb.hr;“Banks’ Reserve Requirements”, http://www.hnb.hr;“Average Monthly Net Wages”, http://www.hnb.hr;“Prosječne mjesečne isplaćene neto plaće zaposlenih za studeni 2005.”, http://dzs.hr;“Consumer Price and Producer Price Indices”, http://www.hnb.hr;“Midpoint Exchange Rates of the Croatian National Bank (period average)”, http://www.hnb.hr.
Table 1: Selected data about credit indebtedness of households in kuna and the set of variables whose impact on thus defi ned dependent variable will be tested
Correlation coeffi cients of predictor set of variables as well as related p-levels obtained when testing the hypothesis about signifi cance of calculated correlation coeffi cients are given in Table 2.

Gordana Duki} • Darko Duki}390
IV1 IV2 IV3 IV4 IV5 IV6
IV1 1.000-0.933 0.837 -0.852 0.115 -0.405p=0.000 p=0.000 p=0.000 p=0.201 p=0.000
IV2-0.933
1.000-0.790 0.841 -0.093 0.398
p=0.000 p=0.000 p=0.000 p=0.301 p=0.000
IV30.837 -0.790
1.000-0.900 0.185 -0.557
p=0.000 p=0.000 p=0.000 p=0.039 p=0.000
IV4-0.852 0.841 -0.900
1.000-0.143 0.765
p=0.000 p=0.000 p=0.000 p=0.113 p=0.000
IV50.115 -0.093 0.185 -0.143
1.000-0.032
p=0.201 p=0.301 p=0.039 p=0.113 p=0.723
IV6-0.405 0.398 -0.557 0.765 -0.032
1.000p=0.000 p=0.000 p=0.000 p=0.000 p=0.723
Table 2: Correlation coeffi cients between independent variables with related p-levels obtained in testing the hypothesis about their signifi cance
There is a very strong negative correlation between interest rates on kuna loans and deposits of households, which is in line with our expectations, since growth of savings and time deposits reduces the interest rate. The results indicate that such a correlation also characterizes the relation between interest rates and average monthly net wages as well as between reserve requirements and average monthly net wages. The strongest positive correlation has been determined between deposits of households and average monthly net wages. This means that the growth of net wages of employees signifi cantly refl ects in the increase in savings and time deposits of households. There is also quite a strong correlation between interest rates for kuna loans and reserve requirements. Such a character of the relation was also expected, since the growth of reserve requirements results in increased interest rates for loans. The rate of change of retail price indices, i.e. consumer price indices has showed the weakest relation with all the other predictor variables. Except those with reserve requirements, all other correlations of this and other variables cannot be considered statistically signifi cant. Marked correlations in the table are signifi cant at p <0.05.
Table 3 shows the values of correlation coeffi cients of all six predictors with response variable and p-levels obtained when testing their signifi cance.

DETERMINANTS OF HOUSEHOLD CREDIT INDEBTEDNESS IN THE... 391
VARIABLES CORRELATION COEFFICIENTS p-level
IV1 -0.950 0.000IV2 0.968 0.001IV3 -0.895 0.000IV4 0.933 0.000IV5 -0.131 0.146IV6 0.552 0.000
Table 3: Correlation coeffi cients between response and all predictor variables with related p-levels obtained when testing their signifi cance
A conclusion can be drawn from calculated correlation coeffi cients that credit indebtedness of households in kuna exhibits a very positive correlation with the level of savings and time deposits of that sector and amounts of average monthly net wages. Accordingly, the increase in the value of these two independent variables results in increased credit indebtedness. There is quite a strong negative correlation between the dependent variable and average interest rates for kuna loans and reserve requirements. As it could be expected, the growth of interest rate and reserve requirements infl uence credit indebtedness of households in kuna in the way that they reduce it. Positive correlation of medium strength is exhibited by the dependent variable with midpoint exchange rates HRK/EUR. Statistically signifi cant relation has not been determined only between credit indebtedness of households in kuna and rate of change of retail price indices, i.e. consumer price indices, but these rates recorded very small changes in the analyzed period.
The basic results of multiple regression analysis, which include the coeffi cient of multiple correlation, coeffi cient of multiple determination, adjusted coeffi cient of multiple determination, and standard error of estimate are given in Table 4.
MULTIPLE CORRELATION COEFFICIENT
(R)
MULTIPLE COEFFICIENT OF DETERMINATION
(R2)
ADJUSTEDMULTIPLE
COEFFICIENT OF DETERMINATION
(R2)
STANDARD ERROR OF ESTIMATE
0.998 0.995 0.995 1538.610Table 4: Basic results of multiple linear regression analysis of dependent variable presenting
credit indebtedness of households in kuna depending on six identifi ed independent variables
According to the coeffi cient of multiple correlation, there is a very strong correlation between the observed response variable and six predictor variables. The

Gordana Duki} • Darko Duki}392
coeffi cient of multiple determination shows that proportion of explained sample variability in the total sample variability is 0.995. Abbreviated to the third decimal place, adjusted coeffi cient of multiple determination has the same value. This leads to the conclusion that the selected model is very representative.
Analysis of Variance (ANOVA) table for the determined model of multiple linear regression consists of the following elements:
df SUM OF SQUARES MEAN SQUARE F-value
REGRESSION 6 54773591791.048 9128931965.1753856.228RESIDUAL 118 279343975.239 2367321.824
Total 124 55052935766.287
F-value, amounting to 3856.228 in this case, shows acceptable assumption at the signifi cance level p=0.000 that there is at least one independent variable that is signifi cant for explaining the variability of dependent variable.
Based on the data given in Analysis of Variance table, it is possible to calculate standard deviation of regression. Starting from regression equation as a descriptive-statistical expression, this measure shows that amounts of credit indebtedness of households in kuna make average deviations from predicted values by 1494.909 million kuna. According to coeffi cient of variation, such deviation relatively stated amounts to 5.043%. This result confi rms the conclusion that the selected regression model is suffi ciently representative.
The multiple regression summary for response variable (non-standardized coeffi cients of regression β, their standard errors of estimate (SEE), standardized coeffi cients of regression B, t-values with related p-levels and 95% confi dence interval of regression coeffi cients β) are listed in Table 5.
CONSTANTAND
VARIABLESβ SEE B t-value p-level
95% CONFIDENCE INTERVAL FOR β
LOWER BOUND
UPPER BOUND
CONSTANT -11519.787 6097.390 -1.889 0.061 -23594.278 554.704IV1 -1256.932 176.131 -0.154 -7.136 0.000 -1605.719 -908.146IV2 3.394 0.120 0.591 28.190 0.000 3.156 3.633IV3 -744.599 61.999 -0.215 -12.010 0.000 -867.374 -621.824IV4 0.447 1.027 0.017 0.436 0.664 -1.586 2.481IV5 -523.140 296.414 -0.012 -1.765 0.080 -1110.120 63.840IV6 8473.768 1254.832 0.121 6.753 0.000 5988.859 10958.677

DETERMINANTS OF HOUSEHOLD CREDIT INDEBTEDNESS IN THE... 393
Table 5: The multiple regression summary for response variable depending on six identifi ed predictor variables
The constant, whose value in the determined regression equation is 11519.787 million kuna, shows what predicted value of dependent variable would amount to if all independent variables had 0 value.
Regression coeffi cient standing next to the fi rst independent variable indicates that in the analyzed period, provided that all other independent variables remained constant, weighted average of monthly interest rates increased by 1%, expressed at annual level, resulted in average decrease in kuna indebtedness of households by 1256.932 million kuna. Under the same assumption, the growth of reserve requirements by 1% during the observed period reduced credit indebtedness in kuna on average by 744.599 million kuna. It can be concluded that reserve requirements proved as an effi cient instrument of monetary policy, having limiting effect on credit expansion.
However, the growth of savings and time deposits of households by 1 million kuna resulted in increased credit indebtedness in kuna by 3.394 million kuna on average, which leads to the conclusion that the banks directed funds collected from households to credits for this sector. Growth of midpoint exchange rates HRK/EUR in the period of the research by 1 kuna infl uenced the average increase of response variable by 8473.768 million kuna. According to this, with values of other predictor variables remaining the same, depreciation of local currency resulted in the growth of credit indebtedness of households in kuna. When explaining such trends, it is necessary to take into consideration that some of the credits taken by households were indexed to foreign currency. For such debtors depreciation of kuna value increases their debt toward banks.
According to standardized coeffi cients of regression, variable presenting savings and time deposits of households is the most important predictor of credit indebtedness of households in kuna in Croatia, and it is followed by variables defi ned as average rates of reserve requirements, weighted average of monthly interest rates for kuna credits granted to households by banks, and midpoint exchange rates HRK/EUR.
Based on calculated t-values and related p-levels, the conclusion is drawn that at the signifi cance level p=0.000 those regression coeffi cients can be considered statistically signifi cant that stand next to the stated four predictor variables. The results in the table referring to these variables are therefore marked. For variables representing average monthly net wages and individual rate of change in retail price indices, i.e. consumer price indices it can be assumed that they are redundant in the model.

Gordana Duki} • Darko Duki}394
Table 5 also contains data on 95% confi dence intervals for each regression coeffi cient. For example, the data referring to variable IV1 show that it can be expected with 95% confi dent that the increase in average interest rates for kuna credits, expressed at the annual level, by 1%, will result in an average decrease in credit indebtedness of households in kuna by more than 908.146, and less than 1605.719 million kuna. On the other hand, we can be 95% confi dent that the increase in savings and time deposits of households by 1 million kuna will lead to average increase in credit indebtedness of households in kuna by more than 3.156, and less than 3.633 million kuna. It is assumed that the observed independent variables will cause such changes of credit indebtedness in kuna if other variables included in this model remain the same.
It was earlier stated that individual contribution of each independent variable in predicting the dependent variable can also be determined by using partial and semi-partial correlation coeffi cients. Their values are given in Table 6.
VARIABLESPARTIALCORRELATIONCOEFFICIENTS
SEMI-PARTIAL CORRELATION COEFFICIENTS
IV1 -0.549 -0.047IV2 0.933 0.185IV3 -0.742 -0.079IV4 0.040 0.003IV5 -0.160 -0.012IV6 0.528 0.044Table 6: Partial and semi-partial correlation coeffi cients
Results from the Table 6 are also in agreement with previous conclusions. After removing the correlations with other variables, it becomes noticeable that the variable representing the state of savings and time deposits of households has had the highest impact on the changes of response variable. Coeffi cient of partial correlation pertaining to the savings and time deposits variable shows that the relation existing between this and the response variable, with fi xed infl uence of other variables, is very strong and positively directed. Observing the absolute amount, the largest values of coeffi cients of partial correlation were obtained exactly for the four predictor variables for which statistical signifi cance of related regression coeffi cient was determined.

DETERMINANTS OF HOUSEHOLD CREDIT INDEBTEDNESS IN THE... 395
4. CONCLUSIONIt is in the interest of banks to put the available fi nancial resources on the market
and thus make a profi t. Such a distribution of assets represents the active banking operation. Banks can put more assets on the market in the form of credits than they have received from other sectors, thus making a direct impact on the increase of money supply. In an attempt to stimulate economic activity through increased spending, the subjects of monetary policy can support such credit expansion by their measures. Gross domestic product will be increased if the loans taken by households, companies and state institutions are used to buy domestic products and services. Nevertheless, the subjects of monetary policy will have to restrain credit expansion if they estimate that the credit indebtedness level is threatening macroeconomic stability. Instability will arise if the majority of debtors become unable to settle their debts to the creditors.
Household credit indebtedness in Croatia analysed in this paper needs to be viewed not only as an economic, but also as a sensitive social category. In order to determine the factors with the biggest infl uence on this sector’s credit indebtedness in kuna, we have chosen six variables. Regression analysis has shown that in the period from July 1995 to November 2005 the dynamics of household credit indebtedness in kuna was statistically signifi cantly infl uenced by the changes in interest rates on kuna loans granted by banks to households, by the amounts of household time and savings deposits with banks, including time and notice deposits, and fl uctuations in reserve requirement and the midpoint exchange rates of the Croatian National Bank HRK/EUR. A negative correlation was found between variables representing weighted averages of monthly interest rates on kuna credits and household credit indebtedness in kuna. Another negative correlation was established between the dependent variable and the variable representing requirement reserve. The remaining two independent variables showed a positive correlation with household credit indebtedness in kuna.
The conducted tests indicate that the level of household credit indebtedness in Croatia was not determined by changes in average monthly net wages, or by month-on-month rate of change in retail price indices, i.e. consumer price indices. Among other things, it has been established what average change of dependent variable can be expected if the independent variable is increased by one.
The level of credit indebtedness is a crucial macroeconomic indicator in any economy. This paper attempts to lay the groundwork for future research on this topic. Different aspects of household credit indebtedness will have to be examined in more detail in the near future.
Gordana Duki} • Darko Duki}396
REFERENCES
� Blanchard, O.: Makroekonomija, Treće izdanje, prijevod, Mate, d.o.o., Zagreb, 2005.� McClave, J.T., Benson, P.G.: Statistics for Business and Economics, Fourth Edition, Dellen Publishing Company/Collier Macmillan Publishers, San Francisco, 1988.� Rose, P.S.: Money and Capital Markets, Third Edition, BPI/Irwin, Homewood, 1989.� Samuelson, P.A., Nordhaus, W.D.: Ekonomija, Četrnaesto izdanje, prijevod, Mate d.o.o., Zagreb, 1992.� Spiegel, M.R., Stephens, L.R.: Statistics, Third Edition, McGraw-Hill, New York, 1999.� Šošić, I.: Primijenjena statistika, Školska knjiga, Zagreb, 2004.� Van Horne, J.C.: Financijsko upravljanje i politika (Financijski menedžment), Deveto izdanje, prijevod, Mate d.o.o., Zagreb, 1993.� "Average Monthly Net Wages”, http://www.hnb.hr� "Banks' Interest Rates on Kuna Credits Indexed to Foreign Currency and on Credits in Euros", http://www.hnb.hr� "Banks' Interest Rates on Kuna Credits Not Indexed to Foreign Currency", http://www.hnb.hr� "Banks’ Reserve Requirements”, http://www.hnb.hr� "Consumer Price and Producer Price Indices”, http://www.hnb.hr� "Distribution of Banks' loans by domestic institutional sectors", http://www.hnb.hr� "Midpoint Exchange Rates of the Croatian National Bank (period average)", http://www.hnb.hr� "Prosječne mjesečne isplaćene neto plaće zaposlenih za studeni 2005.", http://dzs.hr� "Time and Savings Deposits with Banks", http://www.hnb.hr

Marketing


POLITICAL MARKETING MANAGEMENT 399
POLITICAL MARKETING MANAGEMENT
Dr. Bela Orosdy1
University of PécsProf.dr.sc. Mane Medi}2
Faculty of Economics in Osijek
1. Politics - politology - political marketing1.1. Complexity of the term ‘politics’
Politics, in public opinion, are all the actions and activities «performed» by professional politicians, and as such it is a frequent subject of daily news reports. Politics is, therefore, a matter of the elite; common man can exert no impact whatsoever on the high-level politics that such an elite represent. In return, common man takes no responsibility for it.
According to a more profound understanding of the concept, politics is a conscious activity aimed at reaching optimal decisions in public matters, the participation in which is not only a matter of democracy but also an obligation of citizens.
The key element of this multidimensional concept is power. The ultimate target of any political activity is to gain and maintain power, while promoting the interests of certain social groups as opposed to those of other groups.
The most important functional components of politics are:
- Conscious action steered by interest and social relations. The objective of political activity is to acquire, that is, keep the power which relies on the concept of social reproduction. It essence resides in the unity of the factors of interest, will and power.
- Politics is the relationship between social groups, layers, and classes which may happen to be in a confl ict of interest, and in which interests are expressed in a concentrated manner.
- The mainstay of politics is acquisition of power, that is of the state power, which incorporates public authority; its possession and use.
- Politics is also construed as a kind of content, frequently labelled politics, which imparts an overly political overtone or political content to otherwise nonpolitical activities and relations.
1 Bela Orosdy, Ph.D. Associate Profesor, Universiti of Pecs, Faculty of Business and Economics Department of Marketing, Hungary, e-mail: [email protected]
2 Mane Medić, Ph.D. Associate professor, J.J.Strossmayer University in Osijek, Faculty of Economics Osijek, Croatia, e-mail: mmedic©efos.hr.

Bela Orosdy • Mane Medi} 400
1.1. Political science and politology
Political science is characterised by its empirical orientation and academic balance, while politology (political theory) is theory-oriented, and revolves around analyses of current political affairs. Politology is thus a term narrower in scope and is interested in:
a. Political system, b. Essence of political processes and their fundamental interdependency, as well as c. Basic political institutions formed through these processes.
Politology is a basic science integrating different subfi elds of political science; it summarises in part the fi ndings of sociology, political philosophy, political history, etc., and pursues theoretical generalisations at higher, more abstract levels. An important feature of a politological analysis is that it:
• Aims to be objective,• «irrespective» of processes, which are observed from the outside and• Is based on certain values (research is done against an assumed system of values).
It is of utmost importance to gain an understanding of the functioning of the overall political system, and not to be rooted in or to depart from individual party ideologies.
1.2. Relationship between politology and political marketing
Political marketing, as opposed to politics, proceeds from the interests of political parties, i.e. politicians; it determines the «marketing» steps to be taken by a political party, i.e. a politician in order to arrive into a position of power. We fi nd here a perfect analogy to corporate practice; short-term and long-term corporate interests provide the guidelines in the process of strategic decision-making. Another important difference between political marketing and politology resides in the fact that:
• politology «merely» analyzes the phenomena and processes falling in the province of politics, whereas
• political marketing provides the complete tools to students of politics to achieve their objectives; in other words, it provides the means of political marketing to achieve the following ends:
o acquisition of powero maintenance of power o accomplishment of interests.

POLITICAL MARKETING MANAGEMENT 401
1.3. Fields of action in political marketing
Planning is the main fi eld of action in political marketing, which not unlike in business organisations, comprises the forming of a strategy and the development of programs at three different levels. This outstandingly complex process is based on three important activities of data acquisition and analysis (inputs), and three resulting strategic outputs.
FIGURE 1.: SYSTEM OF POLITICAL MARKETING
PARTY / CANDIDATE GOVERNMENT
MEASURE COALITION PARTNER OF INDEPENDENCE OPPOSITION
2. Information system of political marketing, public opinion polls on politics
2.1. Information system of political marketing
The marketing information system in the fi eld of business marketing is comprised of people, equipment and procedures engaged in collecting, systematising, analysing, evaluating, and delivering correct and up-to-date information needed by those who make marketing decisions. In the realm of politics, the methods and procedures of primary and secondary data acquisition and the methods of the functioning of information banks parallel the techniques of the marketing information system operative in the business realm.3 The very nature of politics, however, naturally implies differences in the process of data collection for purposes of political marketing. The reason lies, on the one hand, in the features of the political fi eld (market), and on the
3 More striking, mention-worthy differences between the two will be illustrated in section 4.2. within the discussion of the differences in the infl uence mechanisms in public opinion polls and of market experiences.
STRATEGIC PLANNING IN POLITICAL MARKETING PARTY STRATEGY, SPECIAL POLITICS, AND PROGRAMS AT THE LEVEL OF
CANDIDATES
SEGMENTATION –TARGET AUDIENCE
–POSITIONING
MARKETING INFORMATION SYSTEM
(POLLING)
MARKETING THE EXERCISE OF POWER
MARKETING CAMPAIGNS
MARKETING ORGANISATIONS AND ACTIVITIES
ANALYSIS OF ENVIRON. & COMPETIT.

Bela Orosdy • Mane Medi} 402
other, in the nature of participants in this particular fi eld. The key elements of the political marketing information system are the following:
• Field of survey: society and economy in general, i.e. particular social segments and particular segments of economy, as well as international politics.
• Subject of survey: political parties, citizens (voters), as well as some economic and civilian organisations, i.e. religious and other interest groups (e.g. trade unions).4
2.1. Public opinion polls on politics
Public opinion polls are an important indicator of political life, especially around election time when they play a profound role. Their results are relied on by parties, candidates, media, campaign headquarters, consultants, but also by voters themselves who often take those results as an aid in forming judgements about political processes, and in forming opinions and making choices. This fact stands, even though partiality is an unavoidable factor, and even though certain reliability criteria may not have been met in the performance of measurements.
Public opinion polls merit attention, for two reasons:
• On the one hand, they help develop the strategy of a given party, that is, of a given candidate, providing information on the status of public opinion; as such they help in the development of concrete programs of action.
• On the other hand, results of opinion polls may exert an impact on voters' opinion, on their «attitudes», and may be decisive in cases of narrow election results.
Such opinion polls mostly seek answers to general questions concerning matters of political life, like popularity of the prominent political parties and of leading politicians, however, they can also be geared towards providing more detailed analyses, towards the so-called target research, inquiring e.g. about voters' refl ections, motivation, ranking of preferences, or even their behavior. To be able to be absorbed by the media, such surveys must be in a compact format, must be easily comprehensible, illuminating, whereas for purposes of determining the strategies of political parties, they still have to have the features of marketing research at their root.
The parties which are conscious of public opinion are in the position to continually correct their political practice, their visions, they have room to change
4 The target groups of data acquisition will be mentioned below in Chapter 4,as pasrt of our discussion of the relevant elements of the political environment.

POLITICAL MARKETING MANAGEMENT 403
their «products», and to redeploy their forces. Besides, they are in a position to differentiate between matters of immediate concern and those which are not so important as they cannot have any further positive impact on public opinion.
Problems met by such surveys are manifold, but they can be stripped down to a common denominator, which is their greater or lesser degree of potential impact on public opinion. This especially holds true of public opinion polls on politics, which means that fi nal election results may end up signifi cantly departing from any forecasts. Other problems revolve around ethical concerns and problems of methodology, as well as problems deriving from social and psychological impact of such forecasts:
• The roots of the ethical issue lie in the common knowledge that certain research institutes have a strong bias toward some political parties over others. From the perspective of the political party this takes the form of selecting such an institute to perform the requisite survey as would seem more favourable for the party in question. That is, in choosing a reliable partner, intimacy and long-term cooperation seem almost guaranteed. However, such ties between a polling institution and a political party are problematic in two respects:
o On the one hand, one has reason to doubt, as analyses of false forecasts have confi rmed, the veracity of the data obtained from public opinion polls based on such premises, to doubt the objectivity of the polling methods applied and the objectivity in the application of such polling methods (see item below)
o On the other hand, there is the familiar kind of survey, the so-called Push-Poll survey, the goal of which is, as it is widely recognized, to exert pressure (push) on public opinion (which is condemned and considered an ethical sin by most experts on public opinion polls)5
• Regarding forecasts referring to candidates/parties, any clashes between the distribution of votes as predicted and the actual number of votes received may be based on several methodological fl aws. The main problems reside in:
o Determination of the size of the sample, of the degree of its representativeness, accuracy, i.e. lack of correct reports thereof. In the reports, the error margin is higher than that assumed. Instead of merely providing explanations of published data as they are, the practice of leaving out unclear statements only increases the range of previously mentioned ethical problems.
5 Extreme examples of such phenomena are research institutes which appear from time to time, out of nowhere, which only publish polling results, but have no management, experts or owners. In Hungary, for example, such questionable reputation is enjoyed by the Kontroll-group.

Bela Orosdy • Mane Medi} 404
o Technical fl aws; some technical conditions are frequently not met, like the opportunity to complete the polls in an undisturbed, intimate environment, anonymity of surveyees, pollsters’ empathy etc. (which is why many researchers have recently started providing laptops for purposes of completing such surveys).
• A further, partly methodological, but also unavoidable problem, is the fact that the opinions of those who have been included in the sample (predicted quasi votes) and their view of the future given social reality, do not keep the same value. Their temporal stability and the likelihood of an expected event actually happening are not carved in stone, partly because of discrepancies between the answers provided on the opinion polls and the real intention of actually going to the polls, and partly because of departures from their genuine beliefs and convictions. To alleviate these problems, there are several eliminiation questions in use nowadays, like for example, using the scale of determination to vote in the elections /I would defi nitely vote - maybe vote - maybe not vote– defi nitely would not vote/, or differentiated analyses of - all citizens – defi nite voters – defi nite voters who know how to vote – and analysis of defi nite voters.
• Research into social-psychological interdependencies has so far uncovered two important fi ndings:
o On the one hand, it has been discovered that measurement data and surveys may instill in less educated and less informed voters the illusion that there is such a thing as majority, i.e. public opinion (which the groups tends to share).
o On the other hand it has been shown that effects of polling results are inextricable from the fact that they have been published in the media, that they have been published in certain media, from their accessibility and the titles they receive
• A signifi cant group of problems pertaining to public opinion polls emerge as consequences of the Oedipus effect6 in the political sphere, which is deemed a general characteristic of all forecasts. These effects shape the outcome of a prophecy, such that forecasts end up in part refuting themselves or confi rming themselves; turning thereby some parties/politicians into winners, and others into loosers. Forecasts of expected victories or expected defeats are in essence
6 It has been ascertained for a number of types of prognoses, that creating a picture of the future situations may cause such reactions in participants, which later affect the true development of the events “predicted”, i.e. that such prognoses have a refl ex effect on the actual occurence of results predicted. Karl Popper thus proposed to “call Oedipus’ impact-effect, the impact-effect which forecasts have on predicted outcomes, whether in form of encouraging their actual occurence or in curbing them”.

POLITICAL MARKETING MANAGEMENT 405
liable to convey such messages as can have a signifi cant impact on the behavior of insuffi ciently motivated, i.e. uninterested voters, or those who are interested and have a sympathy with a certain party or politician. The main types of infl uence which may intersect from case to case are the following:
o “Winning effect” (in English expert literature this is labeled the “bandwagon” effect, a term which literally refers to a wagon carrying the band in a parade, but is also used in the sense of trailer or parade). The point is in “joining the winner”, i.e. a situation in which a voter with no personal preference for any party, who is insecure and uninformed fi nds it easiest to vote for those whose position, according to forecasts, seems the best; standing by the winner gives one a sense of success, and vice versa.7
o Turning away from the weak/from those who do not stand a chance (Underdog Effect). Polling results may afect voters in the negative direction too, such that a voter who is initially motivated to vote is diverted from voting, in case their party or candidate have no or have slim chances of winning (i.e. making it to the Parliament). Hungarian voting system is especially susceptible to this phenomenon.8
o Mobilizing Effect gives a boost to those passive voters who have no intention of going to the polls although they have made their choice, but in whom expected results eventually result in the emergence of an «in spite» voter attitude, contrary to the impact of the «Underdog» Effects.9
o Casualness effects. Due to its strong belief in electoral victory and in the achievement of its goals, the preferred party instills in its voters the sense of confi dence in its success and thus, the weaker commitment of voters or some other factors may distance the voter from the voter urn. (e.g. bad weather or good weather).
Despite that, marketing research and public opinion polls, links with researchers and with other parties seem to be unavoidable assets in the life of political parties.
7 A further form of this psychological phenomenon comes from foreign experience, where in the course several post-election months there comes to a signifi cant increase of those who are counted among voters for the winning party, in comparison to the actual number of such voters.
8 The treshold which small parties have to pass to enter the parliament is 5% of current votes won. Further, the position of small parties is weakening the system, as the total sum of percentage votes won by the parties who have not made it to the parliament is divided among the parliamentary parties in proportion to the votes received. These votes, originally given to parties which dropped out of the race, in fact end up being awarded to and supporting the parties that such voters had never voted for.
9 A nice example of this phenomenon can be found in France in 1980s, when a scandal broke out due to a fake public opinion poll conducted by the local Sonda. “Survey results” before the elections pointed at a huge popularity of Le Pen, and the goal, which was ultimately achieved, was to mobilize the voters who voted for the left-wing parties.

Bela Orosdy • Mane Medi} 406
Well-founded political marketing must not overlook popularity data or data on changes in voters’ opinions.
3. Segmentation, definition of the target group, positioning
3.1. STP in marketing
Segmentation, defi nition of the target group and positioning (based on the English abbreviation STP), form the basis for the drafting of marketing strategies in the business realm. The steps which constitute the key process, consisting of analysis, evaluation and communication elements, are the following:
• The market, i.e. the sum of customers is nowadays never homogenous, not even when a single product is concerned. Buyers differ from one another in multiple respects, which stems from their different requirements in relation to a product/or their reactions to marketing are different. Among the possibilities (ideas) for segmentation of customers into relatively homogenous groups there are always such criteria which to a large extent may have an impact on product creation, price formation, choice of distribution channels, that is on the market. Customers may be grouped into smaller units primarily on the basis of demographic features, geography, psychographic features, behavioral changes, as well as their relationship to the product.
• Companies rarely strive to corner the entire market, they mostly select one or two possibly signifi cant segments. They set those segments as their "targets", i.e. accord them a central place within their strategy.
• Positioning is an activity which is oriented at what is inside the customer's mind. The goal of positioning is to ascertain, with a specifi c purpose in mind, a range of insights about the consumers who rely on the company and devise methods to create good company image. The three positioning tasks are:
o Discovering potential competitive advantages (competitve advantage is created in cases when a company is capable of producing a marked value at realistic costs);
o Choosing a maximum of three competitive advantages;
o Effi cient marking of competitive advantages (values) for participants in the target market.
In other words, positioning allows the company to make readily recognizable, both to itself and to the customers at its target market, one or two, but no more than three characteristic features of its brand which they may fi nd most appealing. This is

POLITICAL MARKETING MANAGEMENT 407
what results in a differentiated competitive advantage. (E.g. high quality, reliability, quick service or low price.)
3.2. STP in political marketing
The segmentation of society, defi nition of target classes, layers, groups, i.e. political positioning at all three levels of the above mentioned marketing plan (party strategy, in comparison to expert political and individual political products) is of great importance. In what follows we present an example of the STP in the fi eld of political strategy.
The task of the highest planning level is strategy development. Its results make themselves visible in the very names of political parties (MSZP – Hungarian Socialist Party, SZDSZ, Alliance of Free Democrats, FKGP- Independent Small Holders Party, KNDP – Christian Democratic People’s Party, Labour Party, RMDSZ- Democratic Union of Hungarians in Romania), not necessarily (MDF, Hungarian Democratic Forum, Progressive Party). Political parties mostly attempt to defi ne themselves against such a linear scale, and so defi ne both themselves and their place in the political space, as representatives of different ideas, ideologies, (e.g. liberalism, conservatism, socialism), or as social groups or occupations (labour, small holders, (peasants) national minorities). With parties defi ned in terms of ideas and ideologies, there is further the possibility of arranging them along the scale of left-wing – right-wing orientation, which is subject to even more subtle differentiation into e.g. extreme left-wing; left-of-center; center; right-of-center; right-wing; extreme right-wing.
Table 1.: COMMON STAND OF LEFT-WING PARTIES AND RIGHT-WING PARTIES ON ECONOMIC AND IDEOLOGICAL PROJECTIONS
Dimension Left RightEconomic Increase of state role Decrease of state roleIdeological Anticlerical Clerical
Parties operating within modern societies, which have occupied positions within the space outlined by basic dimensions, frequently seek a multidimensional political approach. Such are for example the types of parties (mass parties) in the two-dimensional political space represented in Figure 2.

Bela Orosdy • Mane Medi} 408
Figure 2.: Two-dimensional conception & economic and ideological projection of left-wing and right-wing parties
Clerical
Christian socialists Christian democrats
Economy-wise Economy-wiseleft-wing right-wing
Socialdemocrats Liberals
Anticlerical
It is helpful in designing the marketing strategy if, on the one hand, the party simulatenously possesses some light (popular) ideological foundations, and a consistent unambiguous ideology. On the other hand, the party must project a strong ideological commitment, both in taking stands on strategic issues and in being quite limited in terms of freedom of taking particular stands on daily political events, which would not be so if such a party did not have an unambiguous ideological commitment.
The task of target group setting is to help determine the “personal measure” in defi ning the program for a political party and to help choose varied styles of the tools to be used, all within the permissible ideological-conceptual framework. The fi rst step is to ascertain what percentage of target voters can be deemed politically interested, i.e. how many of them are willing to vote in the elections. Identifi cation of target groups can be done:
• On the basis of demographic criteria (sex, age, family life cycle/the young, the elderly, the retired,/family size)
• On the basis of sociological characteristics (familial circumstances, /families with children, single parents,/ on the basis of income, education, occupation, type of residence, religious, national, ethnic groups,etc.)
• On the basis of geographical features (country, region, settlement size, economic character of settlement, micro surroundings of settlement – e.g. apartment buildings, family houses).
• On the basis of psychographic features (living style, type of personality).

POLITICAL MARKETING MANAGEMENT 409
• On the basis of type of interests /preferences (vocation, crime, public safety, wealth, life standard, health care, education, traffi c, global issues, ecology, etc.)• Other specifi cs singling out the remaining important features of the target audience.
In the positioning process the party wants to highlight those specifi c values in the consciousness of voters in general and the voters it deems its target group, which it believes are most appealing for them and which would allow it to assume the most favourable competitive position. Such have been the paroles of e.g. the Independent Peasant Party since its inception "God, Country and Family", and starting from 2005 MSZP's (Hungarian Socialist Party) "Courage, Safety and Justice", or FIDESZ-MPSZ's (Alliance of Young Democrats – Hungarian Civic Party Union) "Job, Home, Safety".
4. Analysis of political environment and competition
4.1. Political environment
A political environment is the wide, relatively permanent, social platform, which has an impact on all participants in politics. Its elements parallel those of business marketing:
• Macro environment: social, demographic, sociological, cultural, economic, political, legal, infrastructural, technical-technological factors and their international projections.
• In terms of the political macro environment:
o The corresponding subject is a party. Important components of the so-called internal environment of a party are the management, the political apparatus and membership (its composition, activities, level of satisafaction), management quality, moral state of the party, its organisation structure, marketing channels, as well as other infrastructure; quantity of available knowledge, its quality, (status of human resources); external and internal communicativeness, status of culture and the fi nancial situation....
o Suppliers correspond to politics experts and marketing consultants10, agencies for program implementation, publishers, printing houses.....
10 There are social researchers, politologists, marketing experts and other experts who are strongly associated with particular political directions, other organisations which bring together experts, mostly appear as background institutions. “This brain trust”, “intellectual background” is familiar in Western technical literature as “think-thank”. An example from Hungary is Delta school of politics Kht. (MSZP).

Bela Orosdy • Mane Medi} 410
o Political mediators are persons/organisations, which are meritorious in the political performance of a party, allied organisations (media, funds, civil organisations, trade unions, religious organisations....).
o Customers/consumers - citizens (voters) and participants in economic lifeo Company’s competitors, in place of products here there are other parties
(especially direct competitors, i.e. organisations supporting competitors) religions/ideas, ideologies, leading politicians, platforms, special politics, candidates, opinions and thematisations.
o Different voting segments (party members, sympathisers, the indifferent, i.e. opponents) are important members of public opinion groups, as are persons/groups which have the power to create opinions in others.
4.2. Analysis of competition and co-operation
In political marketing it makes sense to investigate competitive and cooperative relations; namely, in this fi eld forced cooperation between competitors – apart from competitive races – is a much stronger and much more pronounced feature than it is in business. A micro environment offers parties the possibility to assume more favorable positions than their competitors but through cooperation and building alliances. While fi erce competition exhausts resources, drains energy and divides voters, with co-operation – which in several different forms (e.g. cartels) is forbidden in the business world – all allies can win.
In marketing four different levels of competition can be differentiated – in terms of and on the basis of replaceability of products. Politics also admits of such differentiation of competition levels, but the content of individual levels only partly corresponds to market experience, as is evident from Table 2.
TABLE 2.: COMPETITION LEVELS ON THE MARKET AND IN POLITICS
Level of competition On the market In politics
General competition
Takes place at a general level of needs (competing for consumer money)
Needs at higher levels, e.g. belonging somewhere, -being recognized, self realization
Competition between forms of product
Between groups of product which may satisfy a certain need
Ideas, ideologies, directions, programs, and fi elds of electoral battles
Competition within industry
Between products from a group of products between different producers
Parties, programs, special politics, and tactical battles between candidates
Competition of brands
Between offerers of similar products to the same client base at similar prices
Within the party platform, i.e. struggle for position within the party
POLITICAL MARKETING MANAGEMENT 411
1. At the level of “general competition” politics and politicizing provide solutions that satisfy such higher needs as:
a. Sense of belonging somewhere (joining, identifi cation)b. recognition (of status, power, success, self-confi dence, prestige)c. self realization
Thus a competitor becomes any thing/activity, which is capable of providing for the same or similar needs, i.e. it appears as an alternative to politicizing. There is no co-operation at this level.
2. Competition between “forms of product” – a strategic fi eld of different ideas, philosophies, ideologies, directions, programs and politicians representing all this. Good representation can be provided given the positioning along the left-wing:right-wing scale. Here there is room for cooperation built on similarity of ideology, conceptual and other closeness, so that it is perfectly imaginable to strike upon common voting lists, coalitions, fraternal parties, all through virtual integrations into other parties to various extent. (cf. FIDESZ, MSZP).
3. Level of industry corresponds in politics to tactical competition and cooperation between parties, programs, special politics, and politicians. The role of this level increases especially around election time.
4. Competition of brands corresponds to competition within parties; primarily of platforms, strategic conceptions, i.e. struggles for position among politicians (the leading and those who want to make it to the top). (We must acknowledge that it is not only successes of a party which satisfy a political leader in the achievement of his goals, namely, the party may as well perform poorly as long as the leader remains in possession of signifi cant power).
The task of an analysis of political competition is to identify a party’s real competitors at all levels. The marketing practice offers several methods for achieving that; e.g.”market battlefi eld” or the method of compulsory substitute.
• The market battlefi eld can be used in politics as well and that in many concrete ways, e.g. in the form of a matrix whose one dimension is made up of certain target groups of voters, and the other of the fl ows of ideas or ideological directions or programs of expert politics (education, external affairs, etc.). Parties in competition form the center of the matrix.
• Method of compulsory substitute – is generally applied in political practice- it is based on opinion polls among potential voters, which are designed so as to ascertain which programs or which parties would receive the votes of those voters, in case the preferred party did not run for the elections. (A good example for this is the standard polling question which refers to the "preferred" or "rejected" parties,

Bela Orosdy • Mane Medi} 412
or the questions asked before the 2002 elections "who would you vote for in the second election round, if you were to choose only between MSZP or FIDESZ-MDF, a pure dichotomy.)
Having identifi ed the sources of competition, an analysis of the following is to be performed at the level of form of products and at industry level:
• principal objectives of competitive parties,• their political marketing strategy, that is, their marketing-mix,• their strenghts and weaknesses,• reactions to infl uencing and attacks, • t heir prominent leaders', i.e. candidates' personality, style of debate, readiness for,
and behavior in competition,• analysis of the steps likely to be taken by parties/candidates, between the fi rst and
second election rounds.
The information listed above allows a party to assess its candidates, form its strategy, decide which weapons to use against whom, how to form ties with competitors, i.e. it can assess with whom it would be good to enter into cooperation, or possibly an alliance. These experiences may be valuable in the development of a strategy aimed at winning different groups of voters.
In any electoral race, any party which is running is in theory competing against everyone else who is also running, everyone is a competitor of equal rank. However, the circle of fi erce competition is narrower. One of the features of electoral races is is that the same target group is often attacked by others with the same strategy; what are here opponents (who are also frequently potential allies), are placed by the marketing into one strategic group. It is inevitable, however, that there will be fi erce competition among parties which may be classed into different strategic groups, especially if their popularity (strength) is of similar rank, and if the fences between tagret voter groups are easily penetrable. The main reasons are:
• There is a signifi cant overlap between individual parties' target voter groups.
• Programs of individual parties rarely stand in diametrical opposition, and voters may fi nd it hard to keep similar ideas apart.
• Most parties strive to win over more and more of the wavering voters, passive voters, of those who do not know how (or possibly do not wish) to vote, and that by applying aggressive methods (negative campaigns, direct marketing).
In business it is frequently and generally the case that a newcomer appearing with new technology or innovations may turn out an even more dangerous adversary than the familiar opponents that have long been struggled against on the market. This

POLITICAL MARKETING MANAGEMENT 413
phenomenon is not a novelty in politics either, although the likelihood of its occurence is smaller. There is not much room for sweeping changes in a stable democracy, namely, there is less maneuvring space, voters' requests are less differentiated, and habits are in part rooted in people's tradition. Some social groups, which lend themselves to easy defi nitions in sociological terms, (primarily those with higher and medium income levels) have a tendency to inherit such strong convictions and ideologies that they have a precise idea who to vote for well in advance. Regarding the parties newly founded prior to elections, experience shows that most such projects fail. Successful are only those attempts, in which an already successful, charismatic politician, or more of them, establishes a new political party,11 or alternatively, when there is an expressive need for a new political initiative.12
Literature:
1. Butler, P. és Collins, N. (1999): „Conceptual Framework for Political Marketing” In: Handbook of Political Marketing, Thousand Oaks, Sage Publications, California
2. Dinya László – Farkas Ferenc – Hetesi Erzsébet – veres Zoltán (2004): Non-business marketing és menedzsment – KJK-Kerszöv, Bp.
3. Lock, Andrew és Harris, Phil (1996): „Political Marketing – Vive la difference!” European Journal of Marketing, Vol. 30., Issue 10-11.
4. Šiber, I. (2003): Politički marketing, Politička kultura, Zagreb5. Katona Edit (1993): „Politikai marketing és reklám” Marketing, 5-6.6. Newman, Bruce I. (2000): A politika tömegmarketingje. Demokrácia a gyártott
imázsok korában - Bagolyvár Könyvkiadó, Budapest7. Newman, Bruce I. (2000): Politikai marketing, mint kampánystratégia - Bagolyvár
Könyvkiadó, Budapest8. Orosdy Béla – Héder Sándor (1996): Politikai marketing – politikusi
(meta)kommunikáció - II. Országos Politológus Vándorgyűlés tanulmánykötete - Pécs (továbbá: Marketing & Menedzsment, 1997/4.)
11 Ariel Saron stepped out of the Likud, which he himself had founded, after which he founded a new center party Kadima. Simon Perez, who has recently failed to be reelected as head of the Labour Party, joined Saron’s new party. The new party immediately became the most likely winner of the March 2006 elections. However, bearing evidence to the non-universality of this phenomenon is Mr. Jörg Haider,- at least in short, one year’s retrospect – because he faced no success with his Das Bündnis Zukunft Österreichs (BZÖ), which he had formed jointly with the extremists that had been expelled from the Freiheitliche Partei Österreichs FPÖ
12 A common occurence at the turn of the millenium, when such situations develop at the poles of the political spectrum. The most recent example can be found in the Bulgarian July 2005 elections, following which an extremist party, which is hostile to foreigners and is against the NATO, the so called Ataka: National Union ’Attack’ (coalition) , made it to the Parliament as the fourth largest party, only four months after its foundation.

@eljka Zavi{i} • Mane Medi}414
THE MARKETING OF SMALL ENTERPRISES, GUERILLA MARKETING
Mr. sc. @eljka Zavi{i}Prof. dr. sc. Mane Medi}
Faculty of Economics in Osijek
Summary
The work is focused on approaches and techniques used by companies for identifying and fulfi lling of the consumers’ needs and expectations, while making profi t with little or limited resources in various stages of fi rm development (start-up stage) or in small enterprises. Basic marketing principles and categories of conventional marketing shall be compared with the demands of the unconventional one, which is focused on practical and fi nancially limited marketing (guerilla marketing). In this work, the accent will be put on direct marketing, new marketing paradigm, face-to-face marketing, relationship marketing, and most notably on guerilla marketing, which sole purpose is to achieve maximal goals with minimal resources.
Keywords: guerilla marketing, new marketing paradigm, direct marketing
1. Classical approach to marketing
Adam Smith declared in 1776 that the consumption was the soul and purpose of the production. As a matter of fact, he actually described something that would later on come to be known as the marketing concept.1
The main idea of marketing is the mediation between the possibilities of a company and consumers’ desires, in order to appease both sides.
According to Ph. Kotler2, marketing is social and managerial process in which individuals and groups, through making of an offer and exchange of valuable goods with others, get what they need or want. Therefore, the goal of the marketing is to satisfy the needs of the consumers, but also those of the economic subjects.
1 McDonald, M: Marketing plans, fi fth edition, Oxford, Burlington, 2002, p. 2.2 Kotler, Ph.: Upravljanje marketingom, 9., published by MATE d.o.o, Zagreb, 1997, p. 14.

THE MARKETING OF SMALL ENTERPRISES, GUERILLA MARKETING 415
The basis of the marketing concept must be:3
1. market focusing, 2. buyer orientation, 3. coordinated marketing, 4. product profi tability
As it is known, the market is most often defi ned as a total of the relationship between supply and demand in a certain place during a certain time. Because of that fact, it continually has to be researched, in order to have it serve as marketing.
To make the research more effi cient, it should be a part of the total marketing process, which consists of the fallowing phases:
1. data research, 2. the defi ning of the marketing goals, 3. the defi ning of the marketing strategy, 4. the draw-up of the coming-on-the-market program (marketing mix), 5. marketing control
The controlling of the marketing mix is concerned with the use of different tools and techniques available to managers, in order to implement the marketing concept. To keep it simple, they are often referred to as four Ps: product, price, place, promotion; although it is a tendency now days to use two more Ps: people and processes.
The classic approach to marketing puts stress on the company as an initiator of marketing communication. It developed on the presumptions that all the products were identical (and that the consumers were also believed to be as such), so the basic task of the marketing was to fi nd those that would like or could be convinced to buy those products.
With the rise of strong brand products, everything was aimed at the advertising activities connected to the brand, which led to putting the emphasis on the brand and neglecting the consumers’ desires. That traditional approach is still present in many places, and that is observable through mass communication and massive economic advertising, especially in the case of consumer goods.
The basis of this approach is an underlying assumption about the homogeneity of the market, and, by it self, also a belief, that the process of marketing, communication, promotion and economic propaganda, should be aimed at the “convincing” of the consumers.
Here we deal with the one-way fl aw of exchange of information and communication from the producer, or some other representative of the marketing activities, through the channels of distribution, to the consumer. This is based on the “propagation” of the production and distribution.
3 Kotler, Ph.: Upravljanje marketingom- Analiza, planiranje, primjena i kontrola, Informator, Zagreb 1994, p. 20.

@eljka Zavi{i} • Mane Medi}416
Linear model (going from their essence that consisted of the “ability to infl uence the awareness of the consumer”, by the use of even the very sophisticated scientifi c methods and marketing techniques) was used for the determination of the market profi les as the mechanisms of exchange, where the producers or the trade had the key information needed to decide on the purchases at their disposal. With the support of the advertising agencies, they became the subjects that were in direct contact with the potential consumers. The connection between them was the mass media as a middleman, so that the economic advertising interpolated in that context as the offensive way of realization of the communicative process. The activities in the area of public relations (PR), as a defensive way of communicating, also had their place with the ever more increasing degree of “interferences” that were present in the communicative process on the market, as a result of increased competitive struggle. However, in both cases some genuine problems crop up. The marketing concept and principles were put aside, so that the essence of the marketing communicative process of the company is very often omitted: the immediate consumer, that in the mean time has signifi cantly changed not only his/her profi le but also his/her position on the contemporary market, had been forgotten. Globally oriented companies were fi rst to comprehend that fact and they moved their focus considerably to consumers (and the products they need) during the internationalization, globalization and integration of world market in the late ’80s and in the ’90s. Marketing communication is a part of implementation of integral marketing concept of enterprises that must be in interrelation with other elements of marketing system functioning.4
2. New marketing paradigm
Under the infl uence of ever greater fragmentation of the world market and media, intensifying of the competitive struggle on the global level, technological progress in the area of telecommunications, traffi c, production and ways of doing international fi nancial and business operations, it has come to the signifi cant turn in the profi ling of the communicative aspect of marketing and in the repositioning of the relation of consumers and enterprises as representatives of marketing activities on the communicative level.
4 http://www.ien.bg.ac.yu/kip.htm

THE MARKETING OF SMALL ENTERPRISES, GUERILLA MARKETING 417
DYNAMICS OF MARKETING PARADIGMTraditional marketing strategy New approach to marketing strategy for
21st century
• Marketing led • Market led• Production capacity oriented • Demand oriented• Market share oriented • Oriented on building of a market• Mass production • Mass adjustment• Mass marketing • Face-to-face – relationship building• Insistence on existing buyers • Retaining of old costumers and acquisition
of new ones
What in the last few years became clear in the contemporary marketing activities has increased the importance of the concept of Integrated Marketing Communications (IMC). Namely from the point of view of communicative profi ling of marketing activities, i.e. politics and strategy of today’s marketing communicating, one can with certainty distinguish between two marketing models: the linear (traditional) one and the integrated (interactive) one. The possibilities, that Internet offers in the area of business and marketing, have greatly speeded up the separation of the two and made it more transparent.
The integrated marketing paradigm, signifi cantly and increasingly supported by the expansion of interactive communicating, has brought two key changes into the communicative aspect of marketing:
- the contemporary consumer will in the process of marketing communication act as a message sender that encodes his needs and wants, and not the other way around like it is the case with the traditional model
- the contemporary companies will increasingly invest in marketing qualifi cation based on the fl exibility of technology, knowledge and integrated marketing communication.5
3. Relationship building
Economist Peter Drucker said almost forty years ago, that the fi rst task of every company was establishing of client database. That database is now days, when one of the trends of today’s marketing is precisely the database building, considered to be the greatest asset of a company. Along with the database building, one of the most prevailing trends in market management is relationship building. Basic philosophy
5 http://www.ien.bg.ac.yu/kip.htm

@eljka Zavi{i} • Mane Medi}418
behind this trend can be deduced to a claim that companies do not profi t from selling their products and servicing but from their buyers and clients. Because of that, they are increasingly concentrating on the behavior of clients and development of friendly and cooperative relationship with them.6
3.1. The “face-to-face” concept
The main idea of this concept is that different clients need different approach. With that kind of approach, mutual cooperative relationship is formed, and it directly affects the loyalty of the clients toward the supplier. This idea is not directly connected to the Internet; it has been implemented much before it.
In some luxury chains of hotels, for example, guests’ special demands are carefully noted down. Therefore it shouldn’t come as a surprise that when these guests come the next time, they fi nd their favorite beverage in their mini-bar or just the right number of pillows and blankets on their bed. Today we come across this concept in banks and insurance companies, but also increasingly in car dealers.
However, only with the Internet has this concept got a new dimension. Not only that it is possible to directly track client’s behavior, by tracking his interest on the web pages of a face-to-face-conscious company, but it is also possible to actively support his/her personal interest. Such communication inevitably leads to the increase of client’s interest, not only in offered products, but also in the corporation that is behind that offer. Client’s interest is such that he/she is ready to make an additional effort by defi ning his desires, thus teaching his “partner” about his/hers own needs, while in the same time learning new rules of conduct. Mutual effort, from the client on one side and his partner, the corporation on the other, leads into a close cooperative relationship that can hardly be harmed by the simple lowering of prices from the part of the competition, which might try to break it.
What is more, global experiences are telling us that the companies which had successfully implemented the face-to-face concept have succeeded in raising their prices, thanks to clients that are prepared to pay more for that feeling of satisfaction and of being special, secured for them by their partner, while making business.7
Therefore, it is about abandoning of mass marketing and orientation on individual one, what would consequently result in greater satisfaction of the buyer on one side, and with greater business success on the other.
6 http://www.poslovna-znanja.hr/default.asp?ID=12277 http://infoprofi l.info/edu/extranet_edu1.htm

THE MARKETING OF SMALL ENTERPRISES, GUERILLA MARKETING 419
4. Guerilla marketing
Marketing is everything that we do in order to satisfy buyer-consumer’s needs, while at the same time we upgrade doing business.
Guerilla marketing is all that and much more.
It is the unconventional approach to marketing in the way that maximal goals are reached with minimal means. Therefore, it is an unconventional way of reaching conventional goals! Through it, one aspires to accomplish greater marketing effect with fewer resources.
Television, radio and other commercials have notably since long ago become a part of our life, so that they, in a way, represent a “background noise” that nobody notices anymore. Advanced salesmen, in order to attract attention of potential buyers, fi nd a way out in guerilla tactics. Due to such kind of promotion, the targeted market is sometimes unaware of being affected by marketing. Hence it is a kind of covert marketing.
It includes a number of decisions about which many people often aren’t aware that they are part of marketing domain.
Buyer psychology, conversation, outfi t, the relationship to oneself, to a buyer and to nature, the place in space and time, form and color of the product, name, understanding, planning, the visual, the auditory, the conscious and the unconscious, aiming and hitting, not missing the opportunities, overcoming of problems, motivation…
A person that is engaged in guerilla marketing (a guerilla marketer) ought to be creative and to develop unconventional methods of promotion. He/she must make use of all his/her connections, professional as well as personal, and he/she has to explore his/her company and products in order to fi nd the sources op publicity.
Some forms of publicity can be very cheap, while some can be even free of charge.
By using guerilla tactics, small companies are able to achieve publicity easier than the big companies. This is because the small companies are closer to an individual buyer and hence able to act faster.
The guerilla marketing is in the fi rst place meant for:
- small companies- new companies and- individuals

@eljka Zavi{i} • Mane Medi}420
It is not enough to be merely present on the market, nor merely price competitive, and at the same time to ignore the knowledge of the today’s buyer and consumer, for only a moment of inattention is all that is needed to be run down by the competition.
The mankind has never been progressing so fast, and solely classical methods and techniques are not enough for success anymore. What is satisfactory by today’s standards already tomorrow loses its edge and becomes obsolete.
One has to stay up-to-date and aspire to the top.
In order to succeed, it is imperative to present a quality product, for there is no such marketing or guerilla that will convince a buyer to purchase a defi cient product or service more than one time.
The guerilla marketing thoroughly explores every possibility and beyond, in order to implement the best possible business combination – the winning combination.
Personal sale, personal letters, telemarketing, circulars and brochures, ads on bulletin boards, section ads, external advertising, billboards, yellow pages, newspapers and magazines, radio and television, mail offers, promotional peculiarities like emblazoned pens, free samples, seminars and promotions, sponsor relationship, exhibitions and fairs, t-shirts with a company logo, public relations, word-of-mouth advertising…
Through selection of marketing strike, the guerilla follows in footsteps of the weapons that hit the target, and not the ones that miss it.
This way, it abandons failed or insuffi ciently good methods and stresses successful ones, by means of which it can boost the effi ciency of marketing budget many times over.
The guerilla often thinks back as to come to the needs and wants that invoke incentive.
The guerilla contemplates the trends, for the client dedicated businesses will be increasingly developed.
Free time, elderly persons, health and healthy life, recreation, women, time savings in industry, cheaper materials, pet care, vegetarian nutriment, help for those depressed, environmental protection, pregnancy prevention, diet beverages, babysitting, bold people… are just some of the opportunities.
Besides a better idea, one has to have a better argumentation and focused strategy.

THE MARKETING OF SMALL ENTERPRISES, GUERILLA MARKETING 421
The foundation of successful guerilla marketing is also control, correction and problem overcoming.
The guerilla marketing is not:
blasphemously expensive, easy, common, empty, schoolbook defi ned, recognized by the competition, ineffi cient, unserious, easily copied… and it is good to be so.
To be guerilla means to be present in consumer consciousness, to be able to understand it and infl uence it, and to be always close-at-hand for the buyer.
Levinson states the following facts as the basics of guerilla marketing:8
- guerilla marketing is especially suitable for small companies
- it should be based upon human psychology instead on experience, judgment and conjecture
- instead of money, the prime investments in marketing should be time, energy and imagination
- the measure of business success is benefi t, not sale
- marketer should also have in mind monthly number of new contacts made
- it is necessary to forget about competition and concentrate on cooperation with other companies
- guerilla marketers should always make use of combination of marketing methods for a campaign
- of great importance is also the use of modern technology as an instrument for improvement of company marketing
In order for the guerilla marketing to yield desired results, a plan should be devised fi rst:9
1. Select a strategy.
2. Focus on existing advantages.
3. Set the target market or markets.
4. Decide what marketing tools to use.
5. Determine the market share.
6. Establish the company’s identity
8 Levinson, J. C.:Marketing gerila, p. 369 Levinson, J. C.:Marketing gerila, p. 38.

@eljka Zavi{i} • Mane Medi}422
7. Work out the resources/budget for marketing.
The plan should not be too elaborate, but also not too simple. The more it is compressed, the easier it will be to follow as a manual in doing business.
Levinson also provides ten most important secrets of marketing, which are of great importance for the guerilla, and these are:10 obligation, investment, consistency, fait, patience, choice, sequence, suitability, surprise, gauging.
1. You have to be obliged to your marketing program.
2. You should look upon it as an investment.
3. You must make sure that your program is consistent.
4. You must have fait in your company’s future.
5. You must be patient in order to accomplish your mission.
6. You must fathom that marketing is a selection of various procedures.
7. You have to know that the profi t follows the sales.
8. You ought to manage the company in a manner that it is suited to buyers.
9. You must integrate the element of surprise in your marketing.
10. You must take measurement as to gauge the effi ciency of your methods.
The performance in a guerilla manner can also be seen through the so called minimedia and maximedia marketing as well as out-of-media marketing.
The minimedia marketing includes:11
- personal sale
- personal letters
- telemarketing
- circular letters and brochures
- indicator for advertising
- small and large messages
-yellow pages
Because the big companies seldom use minimedia marketing, there is little competition for the guerilla in this area.
10 Levinson, J. C.:Marketing gerila, p. 27.11 Medić, M: Bilješke s predavanja, Poduzetnički marketing – gerila marketing

THE MARKETING OF SMALL ENTERPRISES, GUERILLA MARKETING 423
It is of paramount importance for the guerilla marketing to be en sync with the marketing plan, talent and style.
The maximedia marketing refers to mass marketing media like:
- newspapers- weeklies, magazines, reviews- television- radio- mail promotion- external advertising
the “new media”
- cable mediacable TV
- emitting mediasatellite TV
- audiovisual mediavideo panels, plasma screens
Errors with that media are very expensive. However, maxi-marketing should not be perceived as an expensive one, for the expensive marketing is the one that does not work.12
The out-of-media marketing refers to business promotion without the presence of media, and that is mostly:
- own spokespersons- group programs- exhibitions- cooperation with dealers and entrepreneurs- sessions on the ways of trading for own dealers- education from the part of the supplierMethods such as these demand care for even the smallest details and that
makes them appear more complex than they really are. But success is possible even with the use of only out-of-media marketing. It affects people without investing money in media, but for the optimal results the combination of these methods is recommended.
With the guerilla marketing, psychology plays a very important role. It is useful to know that decisions about purchasing are made mostly unconsciously. But still,
12 Levinson, J. C.:Marketing gerila, p. 132

@eljka Zavi{i} • Mane Medi}424
both targets should be aimed at: the consumers that react on logical impulses as well as the ones that react on emotional appeal.
Basic emotional appeals that need to be considered are:
Success, satisfaction that comes from owning, security, self-improvement, status, style, comfort and ease of pressure, ambition, power, love.
Buyers also need to be educated (how to become more successful in their work), because the educative marketing is effi cient, powerful and exceptional, as well as suitable for the guerilla.
Nonverbal marketing is also of great importance (the right posture, the correct face expression, smile, etc.).
Persons involved in guerilla marketing should strive to make everyone feel important, and also to look upon themselves through the eyes of the others.
All of this says us that every person, be he/she a small entrepreneur, a businessperson, an auto-mechanic, a farmer, a doctor or a professor, can by all means fi nd the way to persona or business success, by playing in guerilla style.
- the applicable guerilla marketing
One of the best characteristics of guerilla marketing is its applicability. It is not a “visual” marketing where everything depends on the logo, slogan or image of the product. Instead, the guerilla marketing includes the search for fresh and original ways of luring new buyers, retaining the old ones, and infl uencing buyers to spread the word to others.
If buyers develop loyalty to our way of doing business, they will more probably choose us before any other new and exciting competitor. Long-term keeping of the customer is also cheaper than winning of the new one. Finally, to maintain the loyalty is the key to long-term success.
The consumer that will always use our services is invaluable. If our way of doing business pleases the buyer in every transaction, many of them will become lifelong clients.
Conculsion
Under the infl uence of ever greater fragmentation of the world market and media, of the build-up of competitive struggle on global level, of technological development in the area of telecommunication, traffi c, production and way of doing international fi nancial and business operation, it has come to massive turn in profi ling

THE MARKETING OF SMALL ENTERPRISES, GUERILLA MARKETING 425
the communicative aspect of marketing and in repositioning the relationship between the consumer and the fi rm as the bearer of activities on communicative level.
Basic philosophy behind the relationship marketing can be deduced to a claim that companies do not profi t from selling their products and servicing but from their buyers and clients. Because of that, they are increasingly concentrating on the behavior of clients and development of friendly and cooperative relationship with them.
The face-to-face approach is used for building of mutual cooperative relationship, and that in term directly affects customer’s loyalty toward his supplier.
The need for guerilla marketing today can be observed through three facts:
- Because of the decrease in large business deals, government’s decentralization of arrangement relief, low-cost technologies and a fact that the people in the world are more inclined to small businesses.
- The decay of the small businesses also reaches record fi gures and one of the main reasons for this decay is inability to understand marketing.
- The guerilla marketing has proven its suitability for small businesses all over the world. It works because it is easy to understand and apply and is of course inexpensive.
The guerilla marketing is needed, for it gives an advantage to small companies: defi nition in an undefi ned world, economy in a highly respected world, simplicity in a complicated world, marketing awareness in an idea-deprived world.
Literature
1. Levinson, J. C.:Marketing gerila, Naklada Edo, Zagreb, 1999.2. Kotler, Ph.: Upravljanje marketingom, 9. izdanje, MATE d.o.o, Zagreb, 1997.3. Kotler, Ph.: Upravljanje marketingom- Analiza, planiranje, primjena i kontrola,
Informator, Zagreb 1994.4. McDonald, M: Marketing plans, fi fth edition, Oxford, Burlington, 2002.5. Medić, M: Bilješke s predavanja, Poduzetnički marketing – gerila marketing, Osijek 2005.6. INTERNEThttp://www.ien.bg.ac.yu/kip.htmhttp://www.poslovna-znanja.hrhttp://infoprofi l.info/edu/extranet_edu1.htm

Gyöngyi Gergely426
IS IT POSSIBLE TO INTERPRET THE MARKETING CHANNEL IN THE PRACTICE OF POLITICS?
Gyöngyi GergelyUniversity of Pécs
Introduction
Research on political marketing has started long ago to adapt the marketing mix, more precisely the individual elements of the 4P defi ned by McCarthy, to the practice of politics.1 Experts generally agree that product and communication/promotion policy are those marketing methods that are used strongly in the fi eld of politics. Opinions about the use of pricing and channel policy in politics are far from being uniform; the role of these two marketing means is interpreted rather differently. Besides, this fi eld is rather underrepresented in the marketing literature. Veres (2004, p. 109) argues that “Pricing policy has not much meaning in political marketing; the fi nancing of political campaigns should be considered as part of the marketing communication. Marketing channels and decisions related to them, taking into account their special characteristics should also be discussed as part of the marketing communication.” This study aims to oppose this statement. The objectives of the paper is to discuss the most important theoretical and practical aspects of this issue based on the observation of the intensive competition to establish marketing channels by the leading leftist and rightist parties in Hungary.
American writers have been dealing with this issue for decades, exposing various examples all proving that effective logistic solutions are of key importance in the daily operations of a political party and of a successful campaign (Newman 2000).
1 Writings on political marketing used to work with the ‘analogy-adaptation’ approach. It means academics dealing with this subject have tried to adapt the terminology, the philosophy and the means of marketing to the politics (to political organizations, activities, relations, etc.). Beside the theoretical adaptation they try make a concrete analogy between marketing and fi rst line political practice. Maybe the fi rst promoter of the approach was Schumpeter who started out from the analogy between product and political markets, between purchasing and political decisions, thinking that methods and solutions of the two fi elds are rather similar. This opinion has been supported by others (O’Cass or Collins and Butler), who defi ned the framework of political marketing and tried to construct a model about the strategic roles of political parties based on their competitive positions. Anrew Lock and Phil Harris argue that political marketing is not more than a dialect of general marketing. Some of the Hungarian academics represent a similar approach (Balázs Kiss, Edit Katona, József Kandikó and Béla Orosdy.). It is also a very common approach to narrow down the use of political marketing to the periods of the political campaigns.

IS IT POSSIBLE TO INTERPRET THE MARKETING CHANNEL IN THE PRACTICE... 427
In 2002 the civil party (FIDESZ – Alliance of Young Democrats), known today as the Hungarian Civil Alliance (Fidesz-MPSZ) lost the elections. As a result of this it became clear that employing marketing channels, being present on the ‘fi eld’, gathering information, opinions from local communities is of vital importance for the success of any political party – stated Viktor Orbán, president of the party Analyzing the causes of the defeat, he says, not being on the ‘fi eld’ led us to being defeated in 2002. Having a well established ‘product-line’; a charismatic leader, a program suited for mass consumption, good communication during and between campaigns is still inadequate without having a well structured organizational system that is able to reach all the important target groups down to the smallest villages. Following the establishment of the so-called civil circles, witnessing its operating diffi culties led to the formation of an alliance, which leads to the understanding of the importance of marketing channels being used. The fi rst goal is to have a suffi cient number of regional organizations, which can function as aids to local politics, enforce local practice of power and increase the party’s social embededness.
The referendum held in December of 2004 on the nationality question for the neighboring Hungarians and on the issue of hospital privatization has proven the fact for the leaders of the Hungarian Socialist Party (MSZP), that the inherited network of party offi ces is outdated and is absolutely not functional to be used for fi eld work and for the distribution of a central product regionally. Nevertheless, not only did the MSZP need certain reforms, other participants of the political life such as the Hungarian Democratic Forum (MDF) and the Alliance of Free Democrats (SZDSZ) needed some reforms in their organizational structure in order to be more effective in communicating with their ‘customers’. They have all realized the importance of restructuring their resources to gain more popularity from their voters and thereby strengthening their positions for the upcoming 2006 elections.
1. Characteristic of marketing channels in politicsUsing the most accepted defi nition for marketing channels from the literature,
the political marketing channel can be understood as:
- a network within the organization- an organizational structure- a network of organizations and - a framework of external relations of the organizations.Looking at the structure a parallel can also be drawn from a classical approach,
meaning that political parties also have the ‘units’ such as manufacturer/supplier, wholesaler, retailer and consumers. These units serve as the backbone of the marketing

Gyöngyi Gergely428
channel. Connected to the backbone are the so-called satellite organizations, which are in permanent or occasional contact with the key participants.
In essence the political marketing channel is a network of organizations directly and indirectly connected to the political party, including the buildup of party. Furthermore, the channel is responsible for providing means to reach the potential voters, target groups. It enables a two-way communication that is crucial for the fl ow of propaganda and various polls.
The channel can serve an integrating role in the marketing strategy of the party, providing the marketing mix with structural support, thereby holding together the elements of ‘product development’, communication and pricing:
- Enables the party to reach the regionally dispersed population, most importantly the target groups, but all who are candidates to participate in the party’s operations, potential and present voters, and even those who are neutral or dismissive.
- From the perspective of the voters, it allows them easier access to services, programs and information.
- Its impact is felt on the success in the steps taken to infl uence the market
- Last, but not least it is able to incorporate in a cost-effi cient way the one and two-way fl ow of communication, information gathering and forwarding, and research and analysis.
The issue of distribution becomes especially articular when (1) it provides the most important precondition to satisfy the needs of the target market, and/or (2) the performance in other areas of the marketing mix is steady among competing parties, and/or (3) competitors neglect this fi eld, and/or (4) the channel as a USP differentiates the party, providing it with a competitive advantage. Out of these four criteria the second needs to be emphasized, because it is typical that the competing political parties during a campaign period make very similar ‘tangible’ promises such as new job opportunities, public safety, healthcare reforms, decreasing infl ation and tax, higher wages, building motorways etc. The only difference regardless of which party makes these promises is seen through the numbers and details regarding the listed examples. This is more or less a bidding process, which is becoming harder to follow; leading the public to formulate their beliefs and opinions based on other viewpoints.
Areas of decision-making in building marketing channels include the following: place of distribution among the aims of the party, the number of channels, their length, width, quality, perspectives, training and motivation of each member, evaluation of

IS IT POSSIBLE TO INTERPRET THE MARKETING CHANNEL IN THE PRACTICE... 429
their performance, etc. All other factors belong to the above category, which are needed for a party to operate the channels effectively and in the long run in order to achieve the strategies and even the daily plans.
The structure of the channel is infl uenced by the following factors: the size of the market, density (geographical distribution of voters), social composition of the given geographical area, aims and strategy of the party, size, fi nancial situation, leadership, characteristics of its wider environment, intended services and legal issues. The party needs to decide on the ‘place’, where it intends to operate its units within a particular settlement. Issues regarding physical appearance, infrastructure, customer service and the conditions need to be addressed. All of these have to be designed according to the party’s distinctiveness, refl ecting the party’s tone and frame of mind2.
There is also a need for organizational and operating rules along with administrative measures to help preserve a democratic functioning of the political parties. These measures reinforce the unity which is the most important during a campaign period. Further, they defi ne the organizational structure for the local party organizations, they infl uence leadership frame, the method of choosing offi cers and executives, decision-making, scope of authority, amount of responsibility and serve as a benchmark to hold open programs and gatherings. They help maintain human relationships, provide good atmosphere and reinforce proper two-way communication.
2. Characteristics of a modern political party’s organization
A modern, mature political party is rationally built up and has a hierarchical organization. It has four major structural elements3 (classical channel defi nitions in parentheses).
- The leadership of the party (manufacturer/supplier 1.) consists of chosen or appointed leaders, leading bodies.
- The party administration (manufacturer/supplier 2.) consist of members , who all work and receive remuneration according to their professions,
- The experts, counselors, activists (manufacturer/supplier 3. or wholesaler) do not fall into the administrative body of the party, without hierarchical dependence. They do not have direct work relations with the party. Their main job is concentrated onto two areas; one is preparing various reports,
2 It applies especially for those people with less commitment towards the party. For them the atmosphere of the place, level of burocracy are both important issues.
3 In depth analysis of the issue can be found in Bihari and Pokol (1998)

Gyöngyi Gergely430
evaluations, providing decision-making alternatives and secondly carrying out training programs. Most of them are not members of the party, however sympathetic to it. They are sponsors of the party and get compensation on an ad hoc basis.
Membership (retailer) is a sociological group of people, in itself not organized, however constituting the party’s national voters basis. Organized by individual intention, in other words membership is free and based on the individual’s right of decision making. It entails accepting the basic rules and documents of the party, but it is not directly related to any other terms and conditions. Membership can be direct or indirect, however due to certain legal restrictions collective membership is preferred, no secret membership is allowed. Its level of organization is directly linked to the party’s structure and ideological character. Membership fi les are kept classifi ed within the party. The only instance when they are carefully observed is when state funds from the budget are distributed according to the number of members a given party has (this usually is a temporary solution; however, there has been an example for this method in 1989-90 in Hungary. But in general, funds are distributed according to the results of the elections.) Members pay a membership fee, which is an important source of funds; however its role since the introduction of state fi nancing has been decreasing steadily. It is also an important channel for the personal relationship between the party and its voters. During the election campaigns this relationship can prove to be of utmost value for the party to mobilize their voters, nevertheless there is no direct contiguity between the number of members and the end results of an election. Besides the solid voters, political loyalty is another major form of sponsorship.
3. Channel-methods for maintaining relations with its public
For any given political party, the most important factor is the relationship it has with its voters and all others who are potential candidates sympathizing with the party. Their marketing role mainly is to increase the social embededdness, security and communication with their environment. The priority is to deliver the calling message (offer, supply) to all the potential customers, however, its role of information gathering and transmitting abilities can not be neglected.
The most important members for a party are those who are able to recognize their basic interest and besides being able to formulate it, they associate these issues directly with the party. They have a strong sense of public life and agree with the party’s ideology, value-system and socio-economical issues. They believe that the party can function as a foundation upon which they can realize their needs of belonging, self-appreciation and self-realization. They hope to receive fi nancial and

IS IT POSSIBLE TO INTERPRET THE MARKETING CHANNEL IN THE PRACTICE... 431
career advantages from this membership (this is true for other countries as well, where a large number of civil servant positions are distributed according to the outcome of the elections). Among the members a classical marketing phenomenon can be noticed. They are the Opinion Leaders, who are just well present in the political circulation as anywhere else in life. They have the ability to understand the world of politics and have defi nite opinion on politics in general. These people supposedly have a wide range of network and are well respected individuals. From the point of view of recruitment, it is vital to see what conditions and opportunities the membership entails. The possibilities and the advantages presented by the membership are also important for those who wish to move up in the hierarchy.
The key to success in attracting members to a party from the point of view of marketing is continuity. This ensures the right number of HR staff that can be mobilized. According to available literature, three groups of members can be distinguished based on their level of commitment:
- Very active. Those who join the party, but in many cases are committed to other social or business areas, therefore have limited time. They can be involved as professionals to help solve issues; however in many cases they may sooner or later become fully committed to attend the challenges of the party.
- Mobilize-able. They are not necessarily members of the party, but mostly belong to the inactive line (retired and youth). For this category, special motivating campaigns are necessary, such as trainings.
- The inactive. They are those candidates, who may join the party, pay a membership fee, but are hardly mobilize-able and if so only occasionally.
Other channel-related instruments used for public relations and contacting potential candidates include more direct methods such as forums for the public, recruitment gatherings and other public events (among the so-called ‘event-marketing’ options road-shows seem to be gaining popularity lately). Thus far the general components and related tasks of an organization such as a political party were discussed. The latter part of the discussion focuses on the two main political parties.
4. Fidesz- MPSZ
In the case of Fidesz-MPSZ, the channel’s backbone is built up in the following way:
- The Executive Board is the Coalition’s executive, governing and decision-making body (President: Viktor Orbán, Vice-presidents: Ildikó Gáll, Zoltán

Gyöngyi Gergely432
Pokorni, Pál Schmitt and Mihály Varga. President of the members of parliament: János Áder).
- Connected to this board there is an elected committee consisting of seven members headed by: László Kövér.
- Additional elected bodies are: the ethical, the mandate-verifi er, the accounting and auditing, and the procedural and the confl ict of interest committees.
- Conciliation boards (parochial, health care).
All of the above bodies can be associated with the ‘manufacturer-supplier’ analogy.
- The fraction and its members,- The representatives of the election districts and - the European Union parliament members, who play a double role; as
‘manufacturers-suppliers’ and as ‘traders’, while- the partner-organizations (Fidelitas, Lungo Drom, MKDSZ, KNP) account for
the ‘wholesaler’ category.- The Departments (presently eight of them are functioning) are ‘retailers’.
o The Village Department in villages and farms tries to pool inhabitants. Its aim is the development of the country which since the fall of the socialist regime has been continuously neglected. The number of its members account to 3.000-3.500, out of which there is number of intellectuals as well as those who live of agriculture.
o Farmer Department (KPE, GOSZ).
o Farmer Department (KPE – Union of Civil Smallholders, GOSZ – Country Federation of Farmer Circles) consisting of those people, who live in the countryside under similar surroundings and social status. These departments were established to serve those who live in such civil communities, where Christian and national values play an important role. Their main role is to strengthen national identity, preserve and keep Christian values. Another aim is to validate the principle of private property, increase the awareness of farmers and keep the national/traditional values of Hungarian culture alive. It strives to keep those together who believe in basic human rights and want to live their lives without fear or deprivation. Further it seeks to uphold co-operation with all Hungarians living transborder around Hungary. At present there are a few vocational councils operating within the department. They are animal health-care, food-safety and stock-raising. However, plans include the establishment of

IS IT POSSIBLE TO INTERPRET THE MARKETING CHANNEL IN THE PRACTICE... 433
further councils in the fi eld of social-politics, economics, farming and winery as well. The number of the membership in this department is around 3000.
o The Cultural Department seeks to join those together who are culturally active. Professional sections (educational, media) are included. Approximately, one thousand members are accounted.
o The Workers’ and Employees’ Department consists of those who live on salary. The department seeks to ‘elevate’ them in terms of their life-position.
o The Women’s Department’s primary objective is to guide women towards success both in their career and in the family life.
o The Department of the Retired is the one that expands at the highest rate counting presently about 4.500 members. This is due to the fact that most people leaving their jobs feel insecure and useless and need to fi nd something worthwhile to do and this department gives them various functions without remuneration to compensate the empty space they feel in their situations.
o The Local Municipality Department holds together those local self-governing bodies which are headed by a mayor being the member of the party.
o The Green Department’s aim is to work with civil organizations and the public on various professional matters (e.g.: water preservation) to protect nature and environment.
Between the two rounds of the 2002 elections the party called upon the “people gathering in the streets and receding to the party houses4” – in other words the ‘retailers’ also known as the civil circles. Thousands of groups have been formed to protect national values, home, family and Christian values. These colorful civil circles representing common values believe that only through the restoration and preservation of our national heritage and traditions can human values be enriched. Therefore, these are the main objectives of these groups. Their political leader, Viktor Orbán as member of the “Civil Circle of the Coalition for the Nation”, tries to integrate the system and its hidden opportunities (however, thus far not too successful in his attempts, furthermore, according to some fi eld experts he is trying to ‘back out’ of this campaign).
Up to the present, Fidesz-MPSZ is intensively and spectacularly building its network reaching out to more social groups in the name of a winning. New initials appear and new organizations are established, for example:
- Village Parliament for those living in villages or
4 Tamás Csapody (2005)

Gyöngyi Gergely434
- National Consultation Body for the intellectuals (also retailers). Sending out questionnaires known from direct marketing to many homes with questions on what the party has been doing and what it should do in the future. The voters (consumers) this way can express their feelings and opinions on the questions concerning them. However, it seems that this technique serves another purpose, namely to fi nd out the numbers of potential voters sympathizing with the party. (The technique is not new at all, in 2001, Péter Medgyessy wrote a letter to all telephone subscribers to ask for their opinions about the issues concerning the country. This technique was criticized then. Later this attempt was repeated using the database of the Ministry of Interior. Success of this campaign led Viktor Orbán to attempt the same in 2002 which led to a long debate with the Hungarian Post Offi ce.)
5. The Hungarian Socialist Party
The structure of the Hungarian Socialist Party (MSZP):
- 15 member of the National Presidium,- National Committee, - Central Financial and Controlling Committee, and- National Ethics and Conciliation Board Committee
These bodies function as ‘manufacturer-service providers’.
The ‘wholesalers’ group consists of eighteen fraction-workgroup (delivering assignments according to the ministries), youth organizations and County Boards. Departments have also been established by MSZP (their number is 29), however these departments are less successful in gathering potential voters. They also have the Department of Retired and the Department of Women, just as in the case of Fidesz-MPSZ, but they came out with new initiatives such as the Department of Artists.
The leftist party led by Péter Medgyessy and László Kovács has been searching for the solution to establish its own ‘civil circle base’, but with not much success. Attempts were later taken over by István Hiller with the establishment of the “Successful Hungary’ circles (or movement?)5, in case which, unlike Fidesz, MSZP had some know-how from the period before the change of regime in Hungary.
This ‘trend’ was later followed by Ferenc Gyurcsány, when in the beginning of his term as president; he established the counseling body of civil professionals
5 Both names are being used.

IS IT POSSIBLE TO INTERPRET THE MARKETING CHANNEL IN THE PRACTICE... 435
without payment. He appointed professional politicians to lead these bodies, which has been since a reason for debate.6 His newest network building idea is impressive. MSZP is trying to win those that are just about to reach the age of voting. For this purpose certain road-shows were held, fi rst in Győr and later in other university towns such as Pécs and Debrecen. The aim of the road-shows was to encourage youngsters to think and play together. The Internet game called ‘amőba’ invented and founded by Gyurcsány himself and handled by the party was to encourage the network-building attempts. Without much personal appearance, using the internet-given opportunities to spread virtually like a virus, this cost-effective attempt of MSZP can be a true competitor for the campaign of the civil circles.
6. Conclusions
The two major political parties, slowly, but in time are beginning their pre-fi ghting attempts to reach as many civil spheres as possible. This can be understood as the realization of the intensive distribution model, where the aim is to establish the widest possible social basis, using the existing network and creating new ones if necessary. The team led by Viktor Orbán has been implementing this strategy more consciously and tangibly.
Network-building creates such connecting points, which are capable of growing into a movement (departments, civil circles) reaching potential voters. Voters of those parties which do not make it into the parliament are also viewed as a potential target group for Fidesz’s quest of becoming a ‘collective-party’. This is due to their integrating ambitions of employing marketing channels. More and more potential voters fi nd themselves in the ever growing network of the party, changing them into party members from farmers, trade unions etc. A growing number of unions, clubs, banks, publishers and media are joining. These are the satellite-organizations mentioned earlier in the study. The circle is widened by various schools and churches, which can be observed during the 2002 elections (this fact is mentioned, however its ethical side is not discussed).
Two major functions of the networks seem to be apparent: their ‘simple’ ability to contacting voters and beyond infl uencing them, getting information from them (a political ‘market research’). The latter is becoming more dominant nowadays. This channel gathering information can be of use in preparation for the elections, as all information can prove helpful in designing strategies and action plans for the parties.
6 Various experts believe that the establishment of these bodies was nothing more than political maneuvering and not a progressive step. Whether this is true or not, these actions shed light on the importance of channel politics.

Gyöngyi Gergely436
Other smaller parties not reaching the 5% threshold to enter the parliament can fi nd it diffi cult not possessing these networks. In order to stay alive, they must fi nd alternative and effective ways towards the civil sphere. Thus for both SZDSZ and MDF have only been effective in strengthening their selective distribution channels. Attempts to reform their organizational (channel) networks can not be expected of them due to their nature of only appealing to certain groups of voters.
Literature
Békesi, László (2005): Félelem helyett fordulat (Nagy József interjúja) – 168 Óra, 21. sz.
Bihari, Mihály - Pokol Béla (1998): Politológia - Nemzeti Tankönyvkiadó, Bp.Butler, P. és Collins, N. (1999): „Conceptual Framework for Political Marketing” In: Handbook of Political Marketing, Thousand Oaks, Sage Publications, CaliforniaCsapody, Tamás (2005): Heti Világgazdaság március 26. Dinya, László – Farkas Ferenc – Hetesi Erzsébet – veres Zoltán (2004): Non-business marketing és menedzsment – KJK-Kerszöv, Bp.Lock, Andrew és Harris, Phil (1996): „Political Marketing – Vive la difference!” European Journal of Marketing, Vol. 30., Issue 10-11.Katona, Edit (1993): „Politikai marketing és reklám” Marketing, 5-6.Newman, Bruce I. (2000): A politika tömegmarketingje. Demokrácia a gyártott imázsok korában - Bagolyvár Könyvkiadó, BudapestNewman, Bruce I. (2000): Politikai marketing, mint kampánystratégia - Bagolyvár Könyvkiadó, BudapestO’Cass, A. (1996): „Political Marketing and the Marketing Concept” European Journal of Marketing, Vol. 30., Issue 10-11.Orosdy, Béla – Héder, Sándor (1996): Politikai marketing – politikusi (meta)kommunikáció - II. Országos Politológus Vándorgyűlés tanulmánykötete - Pécs (továbbá: Marketing & Menedzsment, 1997/4.)Schmidt, Lajos (1994): Önkormányzat és marketing - Marketing 3. sz. Schumpeter, J. (1943): Capitalism, Socialism and Democracy – London, Urwin

Miscellaneous


COMPETITION-COMPLIANCE-PROGRAMM ALS INSTRUMENT... 439
COMPETITION-COMPLIANCE-PROGRAMM ALS INSTRUMENT DES UNTERNEHMERISCHEN
RISIKOMANAGEMENTS1
Alexej SteinmarkHochschule Pforzheim
I. EG-Kartellrecht als Risikofaktor in der Unternehmenspraxis
Das Thema Kartellrecht wird in der Fachliteratur und in der Unternehmenspraxis zunehmend unter dem Gesichtspunkt Unternehmensrisiko diskutiert. Diese Sichtweise und die gestiegene Aufmerksamkeit der Unternehmen verwundert nicht, wenn man die umfassenden Reformen im Zuge der Modernisierung des EG-Wettbewerbsrechts und die Vielzahl der spektakulären Entscheidungen der Europäischen Kommission, der Europäischen Gerichte und der nationalen Kartellbehörden der EU-Mitgliedstaaten betrachtet. In der Unternehmenspraxis gibt es mittlerweile kaum eine Vereinbarung von strategischer Bedeutung, die nicht zugleich Fragestellungen im Hinblick auf ihre Vereinbarkeit mit dem EG-Kartellrecht aufwirft. Nicht abschließend sind hier insbesondere Liefer- und Bezugsverträge, Vertriebs- und Technologietransfervereinbarungen, Forschungs-/Entwicklungs- und Joint-Venture-Verträge zu nennen.
Durch den im Art. 3 VO (EG) Nr. 1/20032 kodifi zierten Vorrang des EG-Kartellrechts kommt dem nationalen Kartellrecht der 25 Mitgliedstaaten nur eine geringe Bedeutung zu.3 Vereinbarungen international tätiger Unternehmen müssen sich daher an den Vorgaben der Artt. 81 und 82 EG ausrichten. Art. 81 Abs. 1 EG verbietet Vereinbarungen zwischen Unternehmen, Beschlüsse und aufeinander abgestimmte Verhaltensweisen, die den Handel zwischen den Mitgliedstaaten zu beeinträchtigen geeignet sind und eine Verhinderung, Einschränkung oder Verfälschung des Wettbewerbs innerhalb des Gemeinsamen Marktes bezwecken oder bewirken. Dieses weit reichende Verbot wird durch die Ausnahmeregelung
1 Der nachfolgende Beitrag ist eine Kurzzusammenfassung der wirtschaftsjuristischen Diplomarbeit von Alexej Steinmark „Kartellrechtliche Selbstveranlagung in der unternehmerischen Vertragspraxis: Risikoprävention durch Compliance-Programme“, die von Prof. Dr. Rainer Gildeggen betreut wurde. Der Verfasser dankt Herrn Prof. Dr. Gildeggen für wertvolle und konstruktive Anregungen.
2 Verordnung (EG) Nr. 1/2003 des Rates vom 16. Dezember 2002 zur Durchführung der in den Artikeln 81 und 82 des Vertrages niedergelegten Wettbewerbsregeln, ABl. (EG) L 1/1 vom 4.1.2003.
3 Vgl. Schwarze/Weitbrecht, Europäisches Kartellverfahrensrecht, 2004, § 3, Rz. 12 f.

Alexej Steinmark440
des Art. 81 Abs. 3 EG eingeschränkt. Danach sind Vereinbarungen vom Verbot des Art. 81 Abs. 1 EG freigestellt, wenn sie die vier Voraussetzungen des Art. 81 Abs. 3 EG erfüllen. Gemäß Art. 81 Abs. 3 EG kann das Verbot des Art. 81 Abs. 1 EG auf Gruppen von Vereinbarungen für nicht anwendbar erklärt werden. Mit dem Erlass einer Reihe von Gruppenfreistellungsverordnungen (im Folgenden: GVO) hat die Kommission bestimmte Gruppen von Vereinbarungen vom Verbot des Art. 81 Abs. 1 EGV freigestellt. So werden z. B. wettbewerbsbeschränkende Vertriebs- und Technologietransfervereinbarungen durch die jeweils einschlägige GVO vom Verbot des Art. 81 Abs. 1 EG freigestellt, soweit die Vereinbarungen keine Kernbeschränkungen enthalten und bestimmte Marktanteilschwellen nicht überschritten werden.4 Fällt eine Vereinbarung unter das Verbot des Art. 81 Abs. 1 EG und erfüllt sie nicht die Voraussetzungen einer GVO bzw. der Legalausnahme des Art. 81 Abs. 3 EG, ist sie nach Art. 81 Abs. 2 EG nichtig. Über den Einwand der Nichtigkeit von Vereinbarungen hinaus können die Kartellgeschädigten Schadensersatzansprüche gegen die an Kartellen beteiligten Unternehmen geltend machen. Die Stärkung der zivilrechtlichen Durchsetzung von Schadensersatzansprüchen wird sowohl auf europäischer als auch auf der Ebene der nationalen Rechtsordnungen angestrebt. Besonders schwere Verstöße gegen Art. 81 EG werden gem. Art. 23 VO (EG) 1/2003 mit erheblichen Geldbußen geahndet.
Schließlich sind Verstöße gegen Art. 81 EG für Unternehmen mit kostenintensiven Verfahren vor Kartellbehörden und Gerichten sowie mit einem nicht zu unterschätzenden Imageschaden verbunden. Die dargestellten Folgen von Kartellrechtsverstößen in der Unternehmenspraxis führen dazu, dass kartellrechtswidrige Vereinbarungen zu einem erheblichen wirtschaftlichen Risikofaktor werden können. Zugleich verlangt der Gesetzgeber von Unternehmen ein hohes Maß an Selbstverantwortung für kartellrechtskonformes Verhalten auf dem Markt. Die Verantwortung für eine zutreffende kartellrechtliche Beurteilung wurde seit Inkrafttreten der VO (EG) 1/2003 weitgehend auf die Unternehmen verlagert. Zugleich wurde eine verschärfte Durchsetzung der europäischen Wettbewerbsregeln durch die nationalen und die europäischen Kartellbehörden und Gerichte angekündigt. Diese Entwicklungen und damit einhergehende gestiegene Risiken erfordern von Unternehmen einer adäquaten Reaktion. Als mögliches Instrument wurde das im anglo-amerikanischen Rechtskreis bereits seit langem bewährtes Instrument der Compliance-Programme diskutiert. Dieser Beitrag hat zum Ziel, den Gegenstand
4 Vgl. VO (EG) der Kommission Nr. 2790/1999 über die Anwendung von Art. 81 Abs. 3 des Vertrages auf Gruppen von vertikalen Vereinbarungen und aufeinander abgestimmten Verhaltensweisen, AblEG. 1999 Nr. L 336/21; VO (EG) Nr. 772/2004 der Kommission v. 27.4.2004 über die Anwendung von Artikel 81 Abs. 3 EG-Vertrag auf Gruppen von Technologietransfer-Vereinbarungen, ABlEG. L 123/11.

COMPETITION-COMPLIANCE-PROGRAMM ALS INSTRUMENT... 441
und die grundlegenden rechtlichen Anforderungen eines Compliance-Programms unter dem Gesichtspunkt des aktiven Risikomanagements zu untersuchen und Erkenntnisse für die Gestaltung und Umsetzung von Compliance-Programmen in der Unternehmenspraxis zu gewinnen.
II. Competition-Compliance-Programm als Insrument des Risikomanagements
1. Begriff und Zielsetzung
Der Begriff Compliance im rechtlichen Sinne stammt aus dem anglo-amerikanischen Rechtskreis und hat sich zum festen Begriff der internationalen Wirtschafts- und Rechtssprache entwickelt. Allgemein wird unter Compliance „die Beachtung rechtlicher Anforderungen, die in Form von Geboten oder Verboten aus einem Gesetz, aus Vollzugsakten aufgrund von Gesetzen oder aus Rechtsprechungsgrundsätzen folgen“5 verstanden.6 Der Grundgedanke der Compliance ist vordergründig auf die praktische Umsetzung des rechtskonformen Verhaltens gerichtet. In diesem Kontext wird Compliance als Gesamtheit aller Maßnahmen, um das rechtmäßige Verhalten der Unternehmen, der Organmitglieder und der Mitarbeiter im Blick auf alle gesetzlichen Gebote und Verbote zu gewährleisten, defi niert.7 Durch die Einhaltung der rechtlicher Restriktionen werden die aus der Verletzung der Rechtsnormen resultierenden Risiken minimiert, so dass Compliance als Teil des umfassenden unternehmensinternen Risikomanagements zu verstehen ist.8
Der Überbegriff Compliance umfasst zunächst sämtliche Rechtsgebiete.9 Im Bereich des Kartellrechts umfasst die Kartellrechtscompliance sämtliche gezielte Maßnahmen in Unternehmen zur Einhaltung des materiellen Kartellrechts und der darauf bezogenen vor- und nachgelagerten Verhaltensanforderungen.10 Die praktische Umsetzung der Compliance erfolgt in der Praxis durch sog. Compliance-Programme. Als „Programm für rechtskonformes Verhalten“ wird das Compliance-Programm von der EG-Kommission als interne „Politik eines Unternehmens zur Gewährleistung der vollständigen Einhaltung der Wettbewerbsregeln bei allen
5 Dreher, ZWeR, 2004, 75, 78. 6 Vgl. auch Hauschka, NJW 2004, 257, 261. 7 Vgl. Schneider, ZIP 2003, 645. 8 Vgl. Schneider, ZIP 2003, 645, 647 f. 9 Vgl. Hauschka, NJW 2004, 257, 258.10 Vgl. Dreher, VersR 2004, 1.

Alexej Steinmark442
geschäftlichen Handlungen“ defi niert.11 Die primäre Aufgabe und Zielsetzung eines Compliance-Programms besteht damit in der Sicherstellung der Befolgung der kartellrechtlichen Regeln durch das Unternehmen in seiner Vertragspraxis wie auch in sonstigem Verhalten auf dem Markt.
2. Rechtliche Anforderungen an die Kartellrechtscompliance
a) Der allgemeine rechtliche RahmenAusgangspunkt für die Bestimmung des rechtlichen Rahmens für die
Compliance ist die Frage, ob und in welchem Umfang Unternehmen über die allgemein geltende Verpfl ichtung zur Einhaltung des geltenden Rechts hinaus aktiv werden müssen, um die Befolgung der Gesetze sicher zu stellen. Zunächst ist das Augenmerk auf das allgemeine rechtliche Umfeld im deutschen Rechtssystem zu richten. Nach §§ 93 Abs. 1 S. 1 AktG und 43 Abs. 1 GmbHG haben Vorstände einer Aktiengesellschaft und GmbH-Geschäftsführer im Rahmen der Geschäftsführung die Sorgfalt eines ordentlichen und gewissenhaften Geschäftsmannes anzuwenden. Diese Verpfl ichtung umfasst auch die Sicherstellung der Einhaltung des geltenden Rechts.12 Nichtbeachtung dieser Verpfl ichtung kann zur persönlichen Haftung der Unternehmensleitung führen. Im deutschen Ordnungswidrigkeitsrecht fi nden sich darüber hinaus Regelungen der §§ 30, 130 OWiG, aus denen sich eine Verpfl ichtung der Unternehmensleitung zur organisatorischen Sicherstellung der Befolgung des geltenden Kartellrechts Rechts zumindest mittelbar herleiten lässt.13
Aus den kartellrechtlichen Normen lässt sich bislang keine unmittelbare Verpfl ichtung zur Einführung von Compliance-Programmen herleiten. Die Nichtigkeit einer gegen Art. 81 Abs. 1 und 3 EG verstoßenden Vereinbarung tritt nach Art. 81 Abs. 2 EG unabhängig davon ein, ob das Unternehmen bzw. die Unternehmensleitung interne Vorkehrungen zur Einhaltung des Kartellrechts getroffen hat oder nicht. Das subjektive Tatbestandsmerkmal des Verschuldens wird allerdings bei der Sanktionierung der Kartellrechtsverstöße vorausgesetzt. Ein Verstoß gegen das Verbot des Art. 81 EG kann gem. Art. 23 Abs. 2 lit. a VO (EG) 1/2003 mit Geldbußen geahndet werden, soweit ein Unternehmen vorsätzlich oder fahrlässig gegen das Verbot des Art. 81 EG verstößt. Zwischen Vorsatz und Fahrlässigkeit wird im EG-Kartellrecht keine klare Abgrenzung vorgenommen, so
11 Kommission der Europäischen Gemeinschaften, Glossar der Wettbewerbspolitik der EU, S. 12, http://europa.eu.int/comm/competition/publications/glossary_de.pdf.
12 Vgl. Rodewald/Unger, BB 2006, 113.13 Vgl. Schneider, ZIP 2003, 645, 649; Dreher, ZWeR 2004, 75, 89 ff.

COMPETITION-COMPLIANCE-PROGRAMM ALS INSTRUMENT... 443
dass vorsätzliche und fahrlässige Verletzungen praktisch gleichgestellt werden.14 Von Bedeutung für die Praxis ist vielmehr die Frage nach dem Sorgfaltspfl ichtmaßstab, dem Unternehmen genügen müssen, um den Vorwurf des Verschuldens auszuräumen. Nach vorherrschender Auffassung in der Literatur kann ein Unternehmen vom Vorwurf des Verschuldens nur befreit werden, „wenn es in eigener Verantwortung die relevanten Tatsachen und die rechtlichen Aspekte des Falls mit den ihm zur Verfügung stehenden Mitteln umfassend geprüft und infolgedessen im guten Glauben an die Rechtmäßigkeit seines Verhaltens gehandelt hat.“15Montag/Rosenfeld plädieren dafür, dass den Unternehmen, die Rechtsrat eines unabhängigen Kartellrechtsexperten eingeholt und danach gehandelt haben, zumindest nicht Vorsatz oder grobe Fahrlässigkeit vorgeworfen wird.16 Es besteht weitgehend Einigkeit darüber, dass die Meinung der unabhängigen Rechtsberater und Ökonomen sowohl in zivilrechtlichen Streitigkeiten als auch im Verwaltungsverfahren von großem Gewicht sein wird.17 Eine frühzeitige Beauftragung externer unabhängiger Experten und die Erstellung von Rechtsgutachten oder sonstigen Bewertungen durch Experten zeigt nicht nur die Absicht des Unternehmens, die Vorschriften des europäischen Kartellrechts einzuhalten, sondern liefert auch wertvolles Argumentationsmaterial bei der Diskussion mit der Kommission und den nationalen Kartellbehörden.18 Im Hinblick auf die von Unternehmen einzuleitenden Compliance-Maßnahmen ist damit festzuhalten, dass Unternehmen eine umfassende kartellrechtliche Prüfung der kartellrechtsrelevanten Vereinbarungen durch einen auf das Kartellrecht spezialisierten Rechtsberater auf einer vollständigen und zutreffenden Tatsachengrundlage sicherstellen müssen, um im Falle eines Rechtsstreits den Vorwurf des Verschuldens auszuräumen und die damit einhergehende Sanktionierung zu vermeiden.
b) Entscheidungspraxis der EG-Kommission und der nationalen KartellbehördenVon großem Erkenntniswert für die Praxis sind die Entscheidungen der EG-
Kommission, in denen die Kommission ihre Beurteilung der unternehmensinternen Compliance-Programmen mitteilt.19 In einer Reihe von Entscheidungen hat die Kommission die Einführung von Compliance-Programmen bei der Festsetzung von
14 Vgl. Schütz in: Müller-Henneberg/Schwartz/Hootz, Gemeinschaftskommentar, 9. Lief., 2004, Art. 23, Rz. 16.
15 Dreher/Thomas, WuW 2004, 8, 12; zust. vgl. Schütz in: Müller-Henneberg/Schwartz/Hootz, Gemeinschaftskommentar, 9. Lief., 2004, Art. 23, Rz. 16; Schnelle/Barotsch/Hübner, Das neue EU-Kartellverfahrensrecht, 2004, 119 f.
16 Vgl. Montag/Rosenfeld, ZWeR 2003, 107, 116 ff.17 Vgl. Montag/Rosenfeld, ZWeR 2003, 107, 117. 18 Vgl. Schnelle/Barotsch/Hübner, Das neue EU-Kartellverfahrensrecht, 2004, 120. 19 Eine umfangreiche Aufl istung der Entscheidungspraxis der Kommission im Zusammenhang mit
Compliance-Programmen vgl. Dreher, ZWeR 2004, 75, 84, (Fn. 34).

Alexej Steinmark444
Geldbußen als einen mildernden Umstand berücksichtigt und die Höhe der verhängten Geldbußen reduziert. Diese Praxis wird auf die den Leitlinien der Kommission über die Festsetzung von Geldbußen20 gestützt, wonach die Höhe der verhängten Geldbuße reduziert werden kann, wenn ein mildernder Umstand vorliegt. Hierbei stellt die Kommission jedoch nicht auf die bloße Existenz eines Compliance-Programms ab. Beurteilt werden vielmehr der Zeitpunkt, der Inhalt und die Wirksamkeit der Maßnahmen. Die Kommission stellte zwar in der Sache Viho/Toshiba fest, dass sich „Art und Umfang“ der Compliance-Programme „von Unternehmen zu Unternehmen und auch von einem Unternehmensteil zum anderen“ unterscheiden müssen.21 Dennoch lassen sich in den Einzelfallbewertungen Gemeinsamkeiten erkennen, die über die Anforderungen an ein effektives Compliance-Programm Aufschluss geben können.
Wiederholt wurde die zentrale Rolle der Unternehmensleitung bei der Einführung und der Umsetzung des Compliance-Programms hervorgehoben. „Die Kommission ist generell der Ansicht, daß die Unternehmensleitung dafür verantwortlich ist, wirksame interne Regeln für die Befolgung des EWG-Wettbewerbsrechts aufzustellen.“22 Als positiv gewertet wurde ferner ein Compliance-Programm, das darauf abzielte, sicherzustellen, dass „die obere Führungsebene in der Lage ist, das Marktverhalten des gesamten Konzerns zu überwachen und damit wirksame interne Regeln für die Einhaltung des EWG-Wettbewerbsrechts aufzustellen.“23
Ferner hat die Kommission eine gezielte Durchführung der kartellrechtlichen Überprüfung der Vertragspraxis in der EG und Aufstellung eines Verhaltenskodex für alle Tochtergesellschaften eines Unternehmens in der EG, der eine unmittelbare verbindliche Anweisung der Muttergesellschaft darstellt, als positiv gewertet.24 In der Sache Yamaha hat die Kommission unternehmensinterne Maßnahmen zur rechtlichen Überprüfung und Restrukturierung des Vertriebssystems des Unternehmens im Einklang mit EG-Wettbewerbsregeln als mildernden Umstand berücksichtigt.25In den einschlägigen Fällen hat sich die Kommission offenbar eingehend mit dem Aufbau und den Inhalten des jeweiligen Compliance-Programms befasst. Darauf lässt insbesondere die Entscheindung in der Sache Narional Panasonic schließen, in der die Kommission ein „umfassendes, praktikables, detailliertes und sorgfältig
20 Leitlinien für das Verfahren zur Festsetzung von Geldbußen, die gemäß Art.15 Abs. 2 der VO Nr. 17 und gemäß Art. 65 Abs. 5 EGKSV festgesetzt werden, ABl. 1998 Nr. C9/3.
21 Entscheidung der Kommission, ABl. 1991 Nr. L 287, S. 39-43, Rz. 30. – Viho/Toshiba. 22 Entscheidung der Kommission, ABl. 1991 Nr. L 287, S. 39-43, Rz. 30 – Viho/Toshiba.23 Entscheidung der Kommission, ABl. Nr. L 354 v. 16.12.1982, S. 28-35, Rz. 68 – National
Panasonic. 24 Entscheidung der Kommission, ABl. Nr. L 354 v. 16.12.1982, S. 28-35, Rz. 67 – National
Panasonic.25 Vgl. Pressemitteilung der Kommission v. 16.07.2003, IP/03/1028- Yamaha.

COMPETITION-COMPLIANCE-PROGRAMM ALS INSTRUMENT... 445
abgewogenes Programm zur Einhaltung der Wettbewerbsregeln“26 positiv gewertet hatte. Eine wirksame Durchführung und Überwachung des Compliance-Programms wurden schließlich als wesentlich angesehen, „um das erklärte Konformitätsziel zu erreichen.“27
Die Entscheidungspraxis hat sich bislang überwiegend mit den Fällen befasst, in denen Compliance-Programme erst nach Beanstandung schwerwiegender Zuwiderhandlungen durch die Kartellbehörden eingeführt wurden. Auf der einen Seite könnte dieser Umstand als ein Indiz für die präventive Wirkung bereits bestehender Programme zu deuten sein. Auf der anderen Seite lässt die Praxis der Kommission die Neigung der Unternehmen erkennen, Compliance-Maßnahmen erst nach dem Einschreiten der Kartellbehörden zu ergreifen. Dieser Tendenz begegnet die Kommission in den neueren Entscheidungen mit einer restriktiveren Haltung. Im Verfahren Zinkphosphat begrüßt die Kommission zwar, dass die betroffenen Unternehmen Compliance-Programme eingeführt haben, macht jedoch deutlich, „dass diese Maßnahmen zu spät kamen und nicht als Handhabe dienen können, um die Kommission von ihrer Pfl icht zu entbinden, die Verletzung von Wettbewerbsregeln zu ahnden“28, die von den Unternehmen in der Vergangenheit begangen wurden. Die gleiche restriktive Handhabung wurde von der Kommission in der Sache Nintendo29 praktiziert. Insbesondere vor dem Hintergrund der negativen Erfahrungen der Kommission mit Compliance-Programmen erscheint diese Praxis einleuchtend. Im Verfahren British Sugar30 hat die Kommission die Einführung eines Compliance-Programms als mildernden Umstand berücksichtigt und das verhängte Bußgeld ermäßigt. Einige Jahre später wurde gegen dasselbe Unternehmen erneut ein Verfahren eingeleitet. Dabei wurden erneut schwerwiegende Verstöße und die mangelnde Effektivität des Compliance-Programms festgestellt.31 In diesem Fall führte die Zuwiderhandlung gegen das Compliance-Programm als erschwerender Umstand zur Erhöhung der verhängten Geldbußen. Erfüllt das Compliance-Programm seine präventive Funktion nicht oder handelt ein Unternehmen sogar bewusst entgegen den im Compliance-Programm niedergelegten Regeln, kann dies zur Verschärfung der Sanktionen führen.
26 Entscheidung der Kommission, ABl. Nr. L 354 v. 16.12.1982, S. 28-35, Rz. 68 – National Panasonic.
27 Entscheidung der Kommission, ABl. 1991 Nr. L 287, S. 39-43, Rz. 30 – Viho/Toshiba.28 Entscheidung der Kommission, ABl. 2003 Nr. L 153, S. 1-39, Rz. 332 – Zinkphosphat.29 Entscheidung der Kommission, ABl. 2003 Nr. L 255, S. 33-100, Rz. 451 – Nintendo.30 Entscheidung der Kommission, ABl. 1988 Nr. L 284, S. 41-59, Rz. 85, 86 – Napier Brown-British
Sugar.31 „British Sugar hat sich auf eine Weise verhalten, die in klarem Widerspruch zu dem Wortlaut ihres
Erfüllungsprogramms steht.“, Entscheidung der Kommission, ABl. 1999 Nr. L 076, S. 1-66, Rz. 208.

Alexej Steinmark446
Da gemäß Art. 5 DVO 1/2003 auch Kartellbehörden der Mitgliedstaaten zur Ahndung der Verstöße gegen Art. 81 EGV ermächtigt sind, liegt es nahe, auch die Praxis der nationalen Kartellbehörden der Mitgliedstaaten zu berücksichtigen. Exemplarisch sind hier die Compliance-Leitlinien32 des britischen Offi ce of Fair Traiding (OFT) zu nennen. Darin werden Unternehmen zur Einführung von Competition-Compliance-Programmen ausdrücklich aufgerufen. Im Einklang mit der Praxis der Europäischen Kommission wird den Unternehmen in Aussicht gestellt, dass Compliance-Maßnahmen bei der Sanktionierung der Verstöße als mildernder Umstand berücksichtigt werden können.33 Hierbei werden vom OFT vier Mindestanforderungen an ein effektives Compliance-Programm aufgestellt: Aktive Einbindung der Unternehmensleitung, entsprechende Compliance-Politik und Maßnahmen, Mitarbeiter-Training und Evaluierung.34
Die bisher gewonnenen Erkenntnisse über die Art der Risiken und die rechtlichen Anforderungen lassen sich zu den Grundanforderungen eines effektiven Compliance-Programms zusammenfassen:
1. Unternehmensinterne Compliance-Politik2. Aktive Einbindung der Unternehmensführung 3. Aufbau eines risikoorientierten Vertragsmanagements 4. Mitarbeiter-Training 5. Frühzeitige Einführung, Praktikabilität, wirksame Durchführung und
Überwachung.
III. Umsetzung des Competition Compliance Programms in der Praxis
1. Compliance-Politik und -Organisation Die Tatsache, dass sich die Kommission nach Inkrafttreten der VO (EG)
1/2003 aus dem präventiven Kontrollbereich weitgehend zurückgezogen hat, könnte für viele Unternehmen das Problembewusstsein schwächen. Als realistisch wird die Gefahr eingeschätzt, dass das System der Selbstveranlagung den Anreiz für die Unternehmen stärken könnte, die kartellrechtliche Überprüfung ihrer Vertragspraxis zu vernachlässigen, „es darauf ankommen zu lassen“35 und wettbewerbsbeschränkende Vereinbarungen auch dann zu praktizieren, wenn die
32 Vgl. Offi ce of Fair Trading, How your business can achieve compliance – A guide to achieving compliance with the competition act 1998.
33 Vgl. Offi ce of Fair Trading, How your business can achieve compliance, S. 13.34 (a) support of senior management, (b) appropriate policy and procedures, (c) training, (d) evaluation,
vgl. Offi ce of Fair Traiding: How your business can achieve compliance, S. 8.35 Koenigs, DB 2003, 755, 758.

COMPETITION-COMPLIANCE-PROGRAMM ALS INSTRUMENT... 447
Ausnahme des Art. 81 Abs. 3 EGV eindeutig nicht in Betracht kommt.36 Hierbei sind Parallelen zu den Entwicklungen in den USA feststellbar. Von der US-Kartellbehörde wird die Einstellung vieler Unternehmen in den USA zum Kartellrecht kritisiert: “Our staffs tell me they have been surprised at how sloppy many large, publicly traded companies have become about antitrust compliance. It appears that as companies have downsized their legal and auditing staffs, and turned their attention more and more to deal-making, one of the fi rst places they cut is antitrust (and, I suspect, other) compliance. And we’ve all now seen the results. It’s time for in-house counsel to return to practising preventive law.”37Die Situation in der EU dürfte der Aussage von Wettbewerbskommissar Mario Monti im Zusammenhang mit der Sanktionierung kartellrechtswidriger Vertriebsvertragspraxis zufolge nicht viel anders sein. Er war nach eigenen Angaben „schockiert“, „dass in sämtlichen Mitgliedstaaten vertretene bedeutende Unternehmen immer noch die wesentlichen grundlegenden Prinzipien zu unterwandern versuchen und damit den Vertriebshändlern und letzten Endes den Verbrauchern schweren Schaden zufügen“38. Auf der anderen Seite führte die erhöhte Wachsamkeit der Kartellbehörden und die gestiegenen Haftungsrisiken für Mitglieder der Unternehmensleitung dazu, dass Unternehmen und ihre Organmitglieder „fast über Nacht ein erhebliches Problembewusstsein“ hinsichtlich der Compliance entwickelten.39
Die Entwicklung des kartellrechtlichen Problembewusstseins im Unternehmen setzt voraus, dass sich in erster Linie die Unternehmensführung zur Einhaltung des Kartellrechts bekennt und dies den Mitarbeitern und der Öffentlichkeit kommuniziert. Dies erfordert zunächst, dass die Unternehmensleitung unternehmenseigene Compliance-Politik formuliert, in der sie sich zur Einhaltung des Kartellrechts bekennt. Ein solches Bekenntnis erfolgt in der Praxis durch das sog „Mission Statement“.40Das aus dem anglo-amerikanischen Rechtsraum stammende Instrument wird zunehmend von europäischen Unternehmen übernommen, um ihre Einstellung zur Compliance an Mitarbeiter des Unternehmens und die Öffentlichkeit zum Ausdruck zu bringen. Der Inhalt des Mission Statements besteht im wesentlichen aus dem Bekenntnis des Unternehmens zum rechtskonformen Verhalten.41 Ein
36 Vgl. Schröter in: von der Groeben/Schwarze, Art. 81 EG, Einf., Rz. 47. 37 Kolasky, William J, “Antitrust Compliance Programs: The Government Perspective”, Corpora te
Compliance 2002 Conference, Practicing Law Institute (PLI), San Francisco, CA; 12. July 2002, zitiert nach Desai, The European Antitrust Review 2005, 15, 16.
38 Vgl. Pressemitteilung der Kommission v. 21.12.2000, IP/00/1526.39 Vgl. Hauschka, ZIP 2004, 877.40 Vgl. Lampert, BB 2002, 2237, 2240. Vgl. z. B. Mission Statements im Rahmen der Corporate
Compliance Programme der Bayer AG (www.bayer.de) und der BASF AG (www.corporate.basf.com).
41 Vgl. Lampert, BB 2002, 2240; Hauschka, BB 2004, 1179.

Alexej Steinmark448
aussagekräftiges Mission Statement kann grundsätzlich als geeignet angesehen werden, die Akzeptanz durch eigene Mitarbeiter zu erhöhen und damit zum Erfolg des Compliance-Programms beizutragen. Dieses Bekenntnis bildet jedoch erst den Ausgangspunkt, der durch weitere entsprechende Schritte und Maßnahmen untermauert werden muss. Entscheidend ist insbesondere eine aktive Einbeziehung der Unternehmensleitung. Zum einen hängt es von der Unternehmensleitung ab, ob die zum Aufbau des Compliance-Programms erforderlichen zeitlichen, personellen und fi nanziellen Ressourcen bereit gestellt werden. Zum anderen wird ein Compliance-Programm nur dann sein Ziel erreichen, wenn Unternehmensleitung ihr volles Engagement und Glaubwürdigkeit signalisiert und praktisch durch aktive Unterstützung umsetzt.42 Die primäre Aufgabe der Unternehmensleitung bei der Einführung der Compliance-Organisation besteht damit in der Verlautbarung der Compliance-Politik und in der Ausweisung des Verantwortungsbereichs „Compliance“ durch Zuweisung der operativen Zuständigkeit an einen bestimmten Mitglied der Unternehmensführung.43
Da jedes Unternehmen ihrem Aufbau und ihrem Ablauf nach seine eigene unternehmensspezifi sche Organisation aufweist, wird sich jedes Unternehmen über die organisatorische Einbindung des Competition Compliance-Programms entscheiden müssen. Der Umfang der erforderlichen Maßnahmen wird in erster Linie von der Größe und Struktur des Unternehmens, von der Anzahl und vom Umfang der bestehenden Vertragsbeziehungen sowie von den identifi zierten kartellrechtlichen Risikobereiche abhängen. Es lässt sich damit keine generelle Aussage über die für die Compliance-Organisation erforderlichen personellen und fi nanziellen Ressourcen machen. Vorschläge in der Praxis reichen von der Ernennung eines Compliance-Beauftragten in einem mittelständischen oder kleinen Unternehmen44 bis hin zur Errichtung eines Geschäftsbereichs Compliance mit mehreren Mitarbeitern in einem Großunternehmen.45
2. Risikoorientiertes Vertragsmanagement Die gestiegene Verantwortung von Unternehmen für eine kartellrechtskonforme
Vertragspraxis führt dazu, dass Unternehmen bereits vor Vertragsabschluss verstärkt Vorsorge treffen und ihre Vertragsgestaltung unter kartellrechtlichen Gesichtspunkten optimieren müssen.46 Bei der rechtlichen Beurteilung Vorfeld des Vertragsabschlusses
42 Vgl. Dreher, ZWeR, 75, 94; Lampert, BB 2002, 2237, 2239. 43 Vgl. Hauschka, NJW 2004, 257, 259.44 Vgl. Hauschka, BB 2004, 1178 ff.45 So verfügt z. B. BASF AG über ein ganzes Netzwerk von Compliance-Beauftragten, vgl. unter
<www.corporate.basf.com/de/sustainability/grundwerte/>.46 Vgl. Polley/Seeliger, WRP 2000, 1203, 1210; Kamann/Bergmann, BB 2003, 1743, 1747; Zöttl, WRP
2005, 33, 47.

COMPETITION-COMPLIANCE-PROGRAMM ALS INSTRUMENT... 449
ist auf die sog. statischen Risiken zu achten. Als statisches Risiko wird ein Subsumtionsrisiko bezeichnet, das aus einer fehlerhaften rechtlichen Beurteilung der Vereinbarung im Zeitpunkt des Vertragsabschlusses resultiert.47 Im Bereich der GVO wird vor allem die Abgrenzung der relevanten Märkte und eine zutreffende Ermittlung der Marktanteile problematisiert.48 Im Bereich der Legalausnahme nach Art. 81 Abs. 3 EGV stellt insbesondere die Problematik der Auslegung des außerordentlich weitgefassten Ausnahmetatbestandes und damit verbundene Rechtsunsicherheit eine der größten Schwierigkeiten bei der Selbsteinschätzung der Unternehmen.49 Viele Unternehmen benötigen daher in dem durch die VO (EG) 1/2003 herbeigeführten System der Selbstveranlagung eine erhebliche externe beratende Unterstützung.50
Bei der Selbsteinschätzung vor Vertragsabschluss handelt es sich um eine punktuelle Prüfung, die eine Momentaufnahme bei Vertragsabschluss darstellt. Eine Vereinbarung, der bei ihrem Abschluss als wirksam beurteilt werden konnte, kann im Laufe der Vertragsdurchführung aus verschiedenen Gründen unwirksam werden. Hierbei handelt es sich um sog. dynamische Risiken, die sich im Zeitverlauf ergeben.51 Im Falle eines Rechtsstreits wird nicht der Inhalt der Vereinbarung im Zeitpunkt des Vertragsschusses, sondern der status quo der Vereinbarung im Zeitpunkt des Rechtsstreits beurteilt.52 Eine bei Vertragsschluss kartellrechtlich zulässige Vereinbarung kann zum einen im Laufe der Vertragsdurchführung Veränderungen erfahren, wie etwa nachträgliche Vereinbarungen von Kernbeschränkungen wie etwa Preisfestsetzungen und Exportverboten. Zum anderen kann sich das ökonomische Umfeld, in dem die Vereinbarung praktiziert wird, derart verändern, dass eine anfangs nach Art. 81 EG unbedenkliche Vereinbarung im Laufe der Zeit den Wettbewerb auf dem relevanten Markt soweit einschränkt, dass die Vorgaben des Art. 81 EG nicht mehr erfüllt sind. Problematisch sind vor allem Fallgestaltungen, bei denen die Freistellungsvoraussetzungen, wie etwa die der GVO, bei Vertragsschluss vorliegen und erst im Laufe der Vertragsdurchführung wegfallen.53
Damit sowohl die sog. statischen als auch die dynamischen Risiken rechtzeitig erkannt und beherrscht werden, ist ein systematisches risikorientiertes Vertragsmanagement im Rahmen des Compliance-Programms unabdingbar.54
47 Vgl. Zöttl, WRP 2005, 33, 44.48 Vgl. Polley/Seeliger, WRP 2000, Schütz in: Müller-Henneberg/Schwartz/Hootz,
Gemeinschaftskommentar, 9. Lief., 2004, Art. 29, Rz. 23; Dreher/Thomas, WuW 2004, 8, 14. 49 Vgl. Dreher, WuW 2004, 8, 15; Bechtold, WuW 2003, 343. 50 Vgl. Montag/Rosenfeld, ZWeR 2003, 107, 117.51 Vgl. Zöttl, WRP 2005, 33, 45. 52 Vgl. Bekanntmachung der Kommission: Leitlinien zur Anwendung von Art. 81 Absatz 3 EG-Vertrag,
ABl. 2004, C 101/97, Rz. 44. 53 Vgl. Kamann/Bergmann, BB 2003, 1743, 1745.54 Vgl. Desai, The European Antitrust Review 2005, 15.

Alexej Steinmark450
Desai schlägt für die Praxis ein Verfahren zum Aufbau eines risikoorientierten Vertragsmanagements vor.55 Demnach handelt es sich im wesentlichen um folgende fünf Schritte: Zunächst müssen alle im Unternehmen bestehenden Vereinbarungen mit kartellrechtlicher Relevanz vollständig erfasst und einer kartellrechtlichen Überprüfung unterzogen werden, (1). Darauf hin muss einer konkreten Person operative Zuständigkeit für das kartellrechtliches Risikomanagement im Bereich dieser Vereinbarungen zugewiesen werden, (2). Im dritten Schritt ist ein klares Procedere und ein Zeitplan zur regelmäßigen Überprüfung von Vereinbarungen festzulegen, (3). Viertens ist der jeweilige Unternehmensbereich zu verpfl ichten, eng mit Rechtsexperten zusammen zu arbeiten und zu kommunizieren, (4). Schließlich muss eine regelmäßige Überprüfung der Vereinbarungen auf ihre Vereinbarkeit mit dem EG-Kartellrecht sichergestellt werden, (5).
a) Einführender Legal Audit und Festlegung der operativen Zuständigkeit
Zentrales Element eines risikoorientierten Vertragsmanagement ist die Identifi kation und Klassifi zierung der unternehmensspezifi schen Risiken. Die Identifi kation der kartellrechtlichen Risiken setzt eine systematische Erfassung aller im Unternehmen bestehenden Vertragsbeziehungen und der operativen Zuständigkeiten für deren Durchführung im Rahmen eines sog. Legal Audits voraus.56 Berücksichtigt sollten hierbei nicht nur die neueren, sondern auch die seit langem praktizierten Vereinbarungen. Um die Risiken möglichst lückenlos zu erfassen, sollten deshalb grundsätzlich alle kartellrechtlich relevanten Vereinbarungen im Rahmen des Compliance-Programms berücksichtigt werden.57
Nachdem alle relevanten Verträge im Rahmen des Legal Audits identifi ziert wurden, sind sie einer eingehenden kartellrechtlichen Überprüfung zu unterziehen. Werden im Rahmen dieser Überprüfung kartellrechtliche Schwachpunkte identifi ziert, müssen entsprechende Maßnahmen ergriffen werden, um diese zu beseitigen und für die Zukunft zu unterbinden. Als Ergebnis des Audits kann eine Attestierung durch einen im Kartellrecht erfahrenen Anwalt erfolgen, der in einem Rechtsgutachten bestätigt, dass die der Überprüfung unterzogenen Vereinbarungen keine kartellrechtlichen Bedenken aufwerfen. Gegebenenfalls sind unzulässige Vereinbarungen so zu modifi zieren, dass sie den Anforderungen des Art. 81 EGV entsprechen. Diese Vorgehensweise entspricht der oben gewonnenen Erkenntnis,
55 Vgl. Desai, The European Antitrust Review 2005, 15 f.56 Lampert umschreibt diesen Schritt als Standortbestimmung, vgl. Lampert, BB 2002, 2237, 2239. 57 Vgl. z. B. Sachverhalt im Fall Viho/Parker Pen, in dem eine alte Exportverbotsklausel vom
umfassenden unternehmensinternen Compliance-Programm nicht erfasst wurde, Entscheidung der Kommission, ABl. Nr. L 233 v.15.8.1992, S. 27-32, Rz. 24.

COMPETITION-COMPLIANCE-PROGRAMM ALS INSTRUMENT... 451
dass Unternehmen dem Vorwurf des Verschuldens nur eine ordnungsgemäße Überprüfung ihrer Vereinbarungen durch einen kartellrechtlich spezialisierten Rechtsberater entgegenhalten können.
b) Legal Audit der dynamischen Risiken
Die gestiegene Bedeutung der dynamischen Risiken führt in der Praxis dazu, dass die Vereinbarungen einer regelmäßigen Überprüfung auf ihre Kartellrechtskonformität unterzogen werden müssen.58 Damit soll gewährleistet werden, dass die kartellrechtlichen Risiken im Laufe der Vertragsbeziehung rechtzeitig erkannt und vermieden werden. Im Falle der Freistellung nach der GVO wird eine regelmäßige Überprüfung der Marktanteile erforderlich. Dies setzt eine fortlaufende Marktbeobachtung und Verfolgung der Entwicklung des Marktanteils voraus.59 Im Fall der Legalausnahme des Art. 81 Abs. 3 EG muss in regelmäßigen Abständen geprüft und dokumentiert werden, ob die Prognosen über das Vorliegen der Voraussetzungen des Art. 81 Abs. 3 EGV, die zu einem positiven rechtlichen Urteil geführt haben, auch eingetreten sind. Stellt sich bei der Überprüfung heraus, dass sich die Prognosen abweichend entwickeln und die Freistellungsvoraussetzungen demzufolge nicht erfüllt werden, kann ggf. Anpassungsbedarf entstehen.
Darüber hinaus soll durch regelmäßige Audits sichergestellt werden, dass die Vereinbarungen im Laufe der Vertragsbeziehung keine Änderungen erfahren haben, die zur Unwirksamkeit der Vereinbarung führen könnten. Von eminent großer Bedeutung ist die Gefahr, dass die verbotenen Kernbeschränkungen (sog. „schwarze Klauseln“) in eine Vertragsbeziehung Eingang fi nden. Um dies zu vermeiden, müssen in regelmäßigen Abständen sowohl der Bestand der Vereinbarungen als auch die mit ihrer Durchführung zusammenhängender Umstände überprüft werden. Zu den potentiellen Gefahrenquellen in diesem Bereich gehören sämtliche mit der Vertragsdurchführung zusammenhängenden Umstände bis hin zu den Rechnungen über einzelne Lieferungen.60 Die Kommunikation mit Vertragspartnern über Internet und E-Mail-Verkehr hat in den letzten Jahren erheblich an Bedeutung gewonnen. Es leuchtet jedoch ein, dass sich eine umfassende Überwachung der gesamten Kommunikation praktisch kaum umsetzen lassen würde. Die Problematik kann teilweise dadurch gelöst werden, dass periodisch stichprobeartige Prüfungen vorgenommen werden. Diese Maßnahmen sollten jedoch auf ein akzeptables und angemessenes Maß reduziert werden. Zur effektiven Risikoerkennung und -
58 Vgl. Polley/Seeliger, WRP 2000, 1203,1217; Zöttl, WRP 2005, 33, 48. 59 Vgl. Polley/Seeliger, WRP 2000, 1211;Zöttl, WRP 2005, 33, 47.60 Vgl. z. B. den Sachverhalt in der Entscheidung der Kommission, ABl.1987, L 222, S. 28-39, Rz.
20 - Sandoz, in dem systematisch und dauerhaft verbotene Exportverbotsklauseln als Aufdruck auf Rechnungen verwendet wurden.

Alexej Steinmark452
vermeidung in diesem Bereich werden vielmehr entsprechende Maßnahmen im Personalbereich erforderlich sein.61
c) Informations- und Dokumentationssystem Eine hinreichend verlässliche kartellrechtliche Beurteilung
wettbewerbsbeschränkender Vereinbarungen kann nur auf einer vollständigen und zutreffenden Tatsachengrundlage erfolgen. An betroffene Unternehmen werden hohe Anforderungen hinsichtlich der den Vereinbarungen zugrunde liegenden Tatsachengrundlage gestellt.62 Während bei vorliegen der Kernbeschränkungen der GVO eine negative Freistellungsprognose auch ohne eine eingehende Marktanalyse mit hinreichender Sicherheit getroffen werden kann, werden Wettbewerbsbeschränkungen außerhalb der Kernbeschränkungen zumeist nur unter Auswertung der Markt- und Produktinformationen möglich sein. Insofern ist eine „gründliche Sachverhaltsdiagnose vor Vertragsschluss“63 erforderlich. Die Tatsachengrundlage bei der Beurteilung nach den GVO besteht hauptsächlich aus den für die Abgrenzung des relevanten Marktes und für die Ermittlung der Marktanteile relevanten Informationen. Weitaus größer ist der Informationsbedarf in den Fällen, in denen die GVO aufgrund der hohen Marktanteile nicht greift und daher eine umfassende Einzelfallanalyse erforderlich wird. Ohne eine präzise Beschreibung der Marktsituation, der Marktanteile und sonstiger relevanter Informationen wird der Rechtsberater kaum in der Lage sein, die Rechtslage mit hinreichender Sicherheit festzustellen. Für die Selbsteinschätzung der Unternehmen bleibt die Tatsachenermittlung ein erhebliches Problem.64 Die Beschaffung der erforderlichen Informationen kann einen zeit- und kostenintensiven Prozess darstellen und die Durchlaufzeit bei der Bearbeitung der Verträge erheblich verzögern. Aus diesem Grund bietet sich Aufbau eines unternehmensinternen Informationssystems an. Das Informationssystem erfüllt die Funktion, ein ausreichendes Tatsachenmaterial zur Verfügung zu stellen, um den wirtschaftlichen Kontext sowohl hinsichtlich der Marktanteilsschwellen der GVO als auch gegebenenfalls in Bezug auf die Einzelfallprüfung der Vereinbarungen zu beurteilen.
Eine wertvolle Orientierungshilfe für die Ermittlung des Informationsbedarfs bieten die Leitlinien zur Anwendung des Art. 81 Abs. 3 EG65 sowie bereichsspezifi sche Leitlinien wie z. B. Leitlinien für Vertikalvereinbarungen
61 s. dazu unten zu III. 62 Vgl. Dreher/Thomas, WuW 2004, 8.63 Vgl. Zöttl, WRP 2005, 33, 47; Kamann/Bergmann, BB 2003, 1743, 1747.64 Vgl. Kamann/Bergmann, BB 2003, 1743, 1747.65 Bekanntmachung der Kommission: Leitlinien zur Anwendung von Art. 81 Abs. 3 EG-Vertrag, ABl.
(EG) v. 27.4.2004, C 101/97.

COMPETITION-COMPLIANCE-PROGRAMM ALS INSTRUMENT... 453
für Technologietransfervereinbarungen.66 Für die Beurteilung der wettbewerbsbeschränkenden Wirkung einer Vertriebsvereinbarung müssen etwa die Marktstellung des Lieferanten, seiner Wettbewerber und seiner Kunden, Marktzutrittsschranken, Marktreife etc. berücksichtigt werden.67 Bei der Prüfung der Anwendbarkeit der Legalausnahme des Art. 81 Abs. 3 EGV müssen vor allem Informationen über die zu erwartenden Effi zienzgewinne in Gestalt der Kosteneinsparungen und/oder der qualitativen Effi zienzgewinne und eine ganze Reihe anderer Informationen vorliegen.
Nachdem der Informationsbedarf bestimmt wurde, müssen die erforderlichen Informationen beschafft werden. In der Informationsbeschaffung ist eine der größten Schwierigkeiten zu sehen. Die Beschaffung grundsätzlicher Informationen sollte deshalb bereits im Vorfeld der Vertragsverhandlungen beginnen. Hinsichtlich der geeigneten Informationsquellen sind in den Leitlinien der Kommission keine klaren Vorgaben enthalten. In der Bekanntmachung über die Defi nition des relevanten Marktes68 konkretisiert die Kommission ihre Anforderungen an die Informationsquellen bei der Abgrenzung der relevanten Märkte: „Die Kommission ist allen Formen des empirischen Nachweises gegenüber offen; sie ist bestrebt, alle verfügbaren Angaben zu nutzen, die im Einzelfall von Bedeutung sein können. Sie folgt also keiner starren Rangordnung für die verschiedenen Informationsquellen und Nachweisformen.“ Als geeignete Informationsquellen zur Ermittlung der Marktverhältnisse bieten sich damit sowohl interne als auch externe Quellen an: Zu internen Informationsquellen zählen Marktdaten, die unternehmensinterne Marketing- und Marktforschung liefern kann. Als externe Informationsquellen werden vor allem veröffentlichte Statistiken des statistischen Bundesamtes, Verbandsstatistiken, Kunden- und Wettbewerberbefragungen, Marketingstudien sowie Studien, mit denen Wirtschaftsberater und Wirtschaftsverbände beauftragt werden, genannt.69 Eine weitere Informationsquelle sind die Vertragspartner des Unternehmens. Für die Vertragspraxis wird angeraten, vertragliche Dokumentations- und Informationspfl ichten hinsichtlich der Marktstruktur und Marktanteile sowie anderer Marktdaten zu intensivieren und eine vertragliche Marktbeobachtungs- und Berichtspfl icht in die Vereinbarungen aufzunehmen, um anhand dieser Informationen die Vereinbarungen einer regelmäßigen Überprüfung unterziehen zu können.70
66 Mitteilung der Kommission: Leitlinien für vertikale Beschränkungen, ABl. (EG) v. 13.10.2000, C 291/1; Bekanntmachung der Kommission: Leitlinien zur Anwendung von Artikel 81 EG-Vertrag auf Technologietransfer-Vereinbarungen, ABl. (EG) v. 27.4.2004 C 101/02.
67 Vertikal-Leitlinien (Fn. 66), Rz. 121. 68 Bekanntmachung der Kommission über die Defi nition des relevanten Marktes im Sinne des
Wettbewerbsrechts der Gemeinschaft, ABl. 1997 Nr. C 372/5.69 Vgl. Polley/Seeliger, WRP 2000, 1210; Bueren, WRP 2004, 567, 571.70 Vgl. Kamann/Bergmann, BB 2003, 1743, 1747; Zöttl, WRP 2005, 33, 47.

Alexej Steinmark454
Periodische Informationsaktualisierung und -auswertung ermöglicht eine präventive Berücksichtigung eventueller Änderungen und kann damit als Frühwarnsystem zur Risikoprävention dienen. Dadurch wird sichergestellt, dass stets ein unmittelbarer Zugriff auf alle aktuellen vertragsrelevanten Informationen ohne größere Verzögerung durch zeitintensive Informationsgewinnungsprozesse möglich ist. So kann beispielsweise die im Bereich der GVO wichtige fortlaufende Beobachtung der Entwicklung des Marktanteils praktisch umgesetzt werden.
Um eine ständige Verfügbarkeit und Verwendung im Rechtsstreit zu gewährleisten, müssen die im Informationssystem enthaltenen Informationen gespeichert und aufbewahrt werden. Hierzu ist ein Dokumentationssystem erforderlich. Eine sachgerechte Dokumentation ermöglicht zum einen eine fortlaufende unternehmensinterne Überprüfung der Vereinbarungen im Rahmen des Legal Audits. Zum anderen stellt sie sicher, dass die Rechtslage auch zu einem späteren Zeitpunkt nachvollziehbar ist und sichert damit im Rechtsstreit bzw. bei der Kommunikation mit Behörden wertvolles Argumentationsmaterial und Beweismittel. Es wird daher empfohlen, die Informationen über die Abgrenzung der relevanten Märkte und sonstige Grundlagen für die Marktanteilsberechnung sorgfältig zu dokumentieren und aufzubewahren.71 Die gleiche Regel muss auch in Bezug auf andere im Einzelfall relevante Informationen gelten. Bei Nichteingreifen der GVO muss eine detaillierte, der Substantiierungspfl icht genügende Dokumentation zu den Voraussetzungen des Art. 81 Abs. 3 EGV vorliegen. Die Dokumentation muss so organisiert werden, dass die Rechtslage und ihr zugrundeliegende Tatsachengrundlage samt der erforderlichen empirischen Belege klar ersichtlich sind und sie im Falle eines Rechtsstreits als Argumentations- und Beweismaterial vorgelegt werden kann.72 Bei Unternehmen mit umfangreichen und komplexen Dokumentationssystemen können konkrete Regeln zur Speicherung und Aufbewahrung von Dokumenten notwendig sein. Diese Regeln können in entsprechenden Dokumentationsrichtlinien schriftlich niedergelegt werden.73
3. Compliance-Programm im Personalbereich Unternehmensinterne Verhaltensregeln für Mitarbeiter des Unternehmens zur
Einhaltung kartellrechtlicher Bestimmungen bilden einen wesentlichen Bestandteil des Compliance-Programms.74 Aus der Entscheidungspraxis der Kommission und der nationalen Kartellbehörden geht hervor, dass viele schwerwiegende Verstöße gegen
71 Vgl. Polley/Seeliger, WRP 2000, 1203, 1210. 72 Vgl. Schnelle/Barotsch/Hübner, Das neue Kartellverfahrensrecht, 2004, 68.73 Vgl. Lampert, BB 2002, 2237, 2240 f. 74 So auch Schneider, ZIP 2003, 645, 649; Lampert, BB 2002, 2237, 2241.

COMPETITION-COMPLIANCE-PROGRAMM ALS INSTRUMENT... 455
Art. 81 EG nicht durch fehlerhafte Vertragsgestaltung oder fehlerhafte rechtliche Beratung, sondern durch Mitarbeiter des Unternehmens vorsätzlich oder infolge der Unkenntnis begangen werden. So werden häufi g unter Verzicht auf Rechtsrat eines Kartellrechtsexperten unzulässige Klauseln in Vereinbarungen aufgenommen.75 Das primäre Ziel des Compliance-Programms in diesem Bereich ist es daher, das von der Kommission geforderte „Bewusstsein für die sich täglich manifestierende Bedeutung der Wettbewerbspolitik auf allen Ebenen“76 des Unternehmens zu entwickeln. Compliance-Maßnahmen im Personalbereich zielen darauf ab, dass Mitarbeiter die kartellrechtlichen Rahmenbedingungen kennen, diese während der Vertragsbeziehung im Blick behalten und sich kartellrechtskonform verhalten. Den Praxisvorschlägen in der Literatur folgend kann dieses Ziel erreicht werden, indem drei wesentliche Elemente in das Compliance-Programm aufgenommen werden: Instruktion, präventive Kontrolle und Sanktionierung.77
a) Compliance-Trainingsprogramm
Die Effektivität des Compliance-Programms basiert entscheidend auf der Kenntnis der einzelnen Mitarbeiter über die kartellrechtlichen Rahmensbedingungen des jeweiligen Verantwortungsbereichs. Es wird in diesem Zusammenhang zutreffend darauf hingewiesen, dass die schwierigsten Haftungssachverhalte aus mangelnder Rechtskenntnis entstehen.78 Dieses Risiko soll nach Auffassung der Kommission dadurch Vermieden werden, dass im Rahmen des Compliace-Programms den Mitarbeitern des Unternehmens Wissen über die Wettbewerbsregeln vermittelt und Orientierungshilfen für die Vermeidung von wettbewerbswidrigen Vereinbarungen oder Verhaltensweisen im Geschäftsverkehr und in Kontakten zu Wettbewerbern gegeben werden.79 Das deutsche Bundeskartellamt bringt seine Haltung ebenfalls unmissverständlich zum Ausdruck:„Wenn Unternehmen nicht ungewollt in unzulässige Absprachen durch Mitarbeiter verwickelt werden wollen, liegt es in ihrer eigenen Verantwortung, durch intensive Mitarbeiterschulung in kartellrechtlichen Fragen – auch auf Ebene der Unternehmensleitung – dieses Risiko zu reduzieren.“80 Das Ziel der Schulungsmaßnahmen ist damit Sensibilisierung der Mitarbeiter für kartellrechtliche Problemstellungen. Ein Mindestmaß an Kenntnis des Kartellrechts und seiner Rechtsfolgen soll dazu führen, dass kartellrechtliche
75 Vgl. z. B. Entscheidung der Kommission, ABl. 1992 Nr. L 233, 27-32, Rz. 16 – Viho/Parker Pen.76 Entscheidung der Kommission, ABl. Nr. L 354 v. 16.12.1982, S. 28-35, Rz. 68 – National
Panasonicnic.77 Vgl. Dreher, ZWeR 2004, 75, 95; Lampert, BB 2002, 2237, 2241. 78 Vgl. Hauschka, NJW 2004, 257, 260.79 Vgl. Kommission der Europäischen Gemeinschaften, Glossar der Wettbewerbspolitik der EU, 12. 80 Bundeskartellamt, Presseerklärung vom 5. März 2002.

Alexej Steinmark456
Problemstellungen überhaupt erst erkannt werden und darauf hin den Rechtsberater oder den Compliance-Beauftragten81 erreichen.
In einem ersten Schritt muss ermittelt werden, welche Personen im Unternehmen mit kartellrechtlichen Fragestellungen konfrontiert werden.82 Hierbei sind insbesondere Mitarbeiter zu berücksichtigen, die bevollmächtigt sind, Vertragsverhandlungen zu führen und Verträge abzuschließen sowie jene Mitarbeiter, die im laufenden Kontakt mit den Vertragspartnern des Unternehmens stehen. Besonders bei langfristigen und komplex strukturierten Vertragsbeziehungen, wie diese z. B. bei vertraglichen Vertriebs- und Lizenzsystemen regelmäßig vorliegen, kann in Erwägung gezogen werden, auch Vertragspartner des Unternehmens in die Schulungsmaßnahmen einzubeziehen.83 Damit kann sichergestellt werden, dass auch die Vertragspartner über die Compliance-Politik des Unternehmens informiert sind und sich während der Vertragsbeziehung kartellrechtskonform verhalten.
In einem zweiten Schritt ist eine einführende Erläuterung der allgemeinen Grundlagen des Kartellrechts für alle betroffenen Mitarbeiter durchzuführen. Allgemeine Darstellungen zum EG-Kartellrecht sind jedoch nicht ausreichend. Erforderlich ist vielmehr eine eingehende Darstellung der konkreten branchen- und bereichsspezifi schen Inhalte.84 Daher sind die Mitarbeiter in bereichspezifi schen Gruppen an die unternehmens- und bereichsspezifi schen Besonderheiten heranzuführen.85 Die theoretischen Darstellungen sollten mit möglichst praxisnahen Beispielen und Fallstudien untermauert werden.86 So sollten beispielsweise Mitarbeiter, die im Vertriebsbereich tätig sind, in erster Linie mit den Grundlagen des europäischen Vertriebskartellrechts vertraut gemacht werden. Insbesondere die unbedingt zu vermeidenden Kernbeschränkungen der Vertikal-GVO müssen die Mitarbeiter beherrschen. Zudem müssen sie auf typische kartellrechtliche Gefahrenquellen in ihrem speziellen Tätigkeitsumfeld hingewiesen und mit konkreten Handlungsanweisungen in Zweifelsfällen ausgestattet werden.87 Eine interessante und praktikable Alternative zu herkömmlichen Schulungsmaßnahmen in Form von Seminaren bieten in der jüngeren Zeit computergestützte Lernprogramme, die ein
81 s. unten unter V. in diesem Beitrag.82 sog. Standortbestimmung, vgl. Lampert, BB 2002, 2237, 2239, 2241.83 So hat z. B. Nintendo nicht nur ihre Tochtergesellschaften, sondern auch ihre Alleinvertriebshändler in
das Compliance-Programm mit einbezogen und gemeinsame kartellrechtliche Schulungsmaßnahmen durchgeführt, vgl. Entscheidung der Kommission, ABl. 2003 Nr. L 255/33, Rz. 95 – Nintendo; s. auch Entscheidung der Kommission, ABl. 1992 Nr. L 233/27, Rz. 14 – Viho/Parker Pen.
84 Vgl. Dreher, ZWeR 2004, 75, 97 mit Verw. auf Rspr.; Hauschka, BB 2004, 1178, 1180. 85 Vgl. Lampert, BB 2002, 2239, 2241.86 Vgl. Lampert, BB 2002, 2239, 2240; Insofern besteht u. U. eine „Belehrungspfl icht“, Vgl. Dreher,
ZWeR 2004, 75, 97.87 Vgl. z. B. zur Kartellrechtscompliance in der Versicherungsbranche, Dreher, VersR 2004, 1 ff.

COMPETITION-COMPLIANCE-PROGRAMM ALS INSTRUMENT... 457
aktives bzw. interaktives Lernen ermöglichen.88 Diese Lernprogramme ermöglichen darüber hinaus eine regelmäßige Aktualisierung und übersichtliche Auswertung des Kenntnisstandes der Unternehmensmitarbeiter im EG-Kartellrecht, was wiederum als wirksames Instrument der Risikoerkennung und Überwachung hilfreich sein kann.
Dem Bereich der Instruktion ist neben den Schulungen auch die Erstellung des unternehmensinternen Handbuchs zuzuordnen. Das sog. Compliance-Manual gehört zu den Mindestanforderungen an ein effektives Compliance-Programm.89 Über die Vermittlung von Grundwissen in Kartellrecht hinaus, erfüllt das Compliance-Handbuch die Funktion eines Leitfadens, nach dem alle Mitarbeiter ihre Handlungen auszurichten haben.90 Für jeden Bereich muss ein Handbuch mit den auf die jeweiligen Problemstellungen zugeschnittenen Inhalten erstellt werden. Das Handbuch muss im wesentlichen in klarer und verständlicher Sprache Antworten auf folgende Antworten enthalten: Was ist verboten? Was ist zulässig? Was ist näher zu prüfen? Damit werden die Mitarbeiter auf typische kartellrechtliche Gefahrenquellen im jeweiligen Geschäftsbereich hingewiesen und mit konkreten Handlungsanweisungen ausgestattet.91 So sind z. B. die angesprochenen Mitarbeiter anzuweisen, die im Rahmen des Legal Audits als kartellrechtlich relevant eingestuften Vereinbarungen vor ihrem Abschluss oder Änderung der Überprüfung durch auf Kartellrecht spezialisierte interne oder externe Berater zu unterziehen. Erforderlich ist insofern eine klare Festlegung von Richtlinien und Ansprechpartner, die den angesprochenen Mitarbeitern ermöglichen, sich kartellrechtskonform zu verhalten. Um eine effektive kartellrechtliche Beratung sicherzustellen, muss das Compliance-Handbuch durch einen laufenden Kontakt (hot-line) zu einem kartellrechtlich spezialisierten Rechtsberater ergänzt werden. Um dem Compliance-Handbuch über die schriftliche Fixierung hinaus einen höheren Verbindlichkeitsgrad zu verleihen, kann das Handbuch als eine unmittelbare verbindliche Anweisung der Unternehmensleitung in Form eines Verhalteskodex ausgestaltet werden.92 Es sind jedoch keine überhöhten Erwartungen an das Handbuch zu stellen. Zum einen kann ein Handbuch eine qualifi zierte rechtliche Beratung nicht ersetzen. Zum anderen muss sichergestellt werden, dass die Mitarbeiter das Handbuch verstehen und in ihrer täglichen Arbeit effektiv nutzen.
88 Vgl. z. B. das Online Competition Compliance Programm „altis“, siehe unter: www.idcomply.com. 89 Vgl. Schneider, ZIP 2003, 645, 649.90 Vgl. Hauschka, BB 2004, 1178, 1179.91 Zum Inhalt des Competition Compliance-Handbuchs vgl. z. B. Lampert, BB 2002, 2237, 2240. 92 So von der Kommission in der Sache Panasonic als positiv gewertet, vgl. Entscheidung der
Kommission ABl. 1982 Nr. L 354, Rn. 67 – National Panasonic.

Alexej Steinmark458
b) Präventive Kontrolle
Um sicherzustellen, dass die in den Schulungen, in dem Compliance-Handbuch und in den Verhaltensrichtlinien gegebenen Anweisungen auch befolgt werden, ist eine Überwachung in Form der präventiven Kontrolle notwendig. Wie oft und wie umfangreich solche Kontrollen durchzuführen sind, hängt vom Einzelfall ab. Aufschlussreiche Erkenntnisse können hier die Auswertung der Ergebnisse der oben dargestellten regelmäßigen Legal Audits und gegebenenfalls der EDV-gestützten Schulungs- und Testverfahren liefern.
c) Sanktionierung Um die im Rahmen der präventiven Kontrollmaßnahmen entdeckten
Verstöße, die durch die Mitarbeiter des Unternehmens begangen wurden, für die Zukunft zu unterbinden und Schwachstellen zu beseitigen, können entsprechende Sanktionsmaßnahmen erforderlich sein.93 Dadurch soll in erster Linie die sog. „zero-tolerance-policy“94 des Unternehmens praktisch umgesetzt und die Glaubwürdigkeit des Compliance-Programms insgesamt aufrechterhalten werden.95 Das Ausmaß der erforderlichen Sanktionen muss sich nach dem Einzelfall und der Schwere der Zuwiderhandlung richten. In der Literatur werden Androhung und Umsetzung arbeitsrechtlicher Konsequenzen wie etwa Abmahnung und Kündigung sowie Schadensersatzansprüche des Unternehmens gegen die verantwortlichen Mitglieder der Unternehmensleitung diskutiert.96 Diese drastischen Maßnahmen kommen jedoch nur bei schweren Verstößen in Betracht und sollten auch für solche Verstöße angedroht und umgesetzt werden. Bei erstmaligen, leicht fahrlässigen Verstößen, die keine schweren Zuwiderhandlungen zur Folge haben, kann eine Belehrung verbunden mit der Androhung disziplinarischer Maßnahmen vorgenommen werden. Allerdings müssen die Androhungen im Falle des Nichtbefolgens der Belehrung auch realisiert werden, um die Glaubwürdigkeit des Compliance-Programms nicht zu gefährden und den Abschreckungseffekt aufrechtzuerhalten.97
4. Monitoring des Compliance-Programms Ob durch das Compliance-Programm das Ziel der Kartellrechtskonformität
erreicht wird, muss durch laufende Überwachung der Wirksamkeit des Compliance-
93 Vgl. Schneider, ZIP 2003, 645, 649; Hauschka, BB 2004, 1178, 1182; Dreher, ZWeR, 2004, 75, 100 f.; Lampert, BB 2002, 1178, 1182.
94 Vgl. Schneider, ZIP 2003, 645, 649. 95 Vgl. Hauschka, BB, 1178, 1182; Lampert, BB 2002, 2237, 2242.96 Vgl. Dreher ZWeR 2004, 75, 101; Hauschka, BB 2004, 1178, 1182; Lampert, BB 2002, 2237,
2242.97 Vgl. Dreher, ZWeR 2004, 75, 101; Hauschka, BB 2004, 1178, 1182.

COMPETITION-COMPLIANCE-PROGRAMM ALS INSTRUMENT... 459
Programms sichergestellt werden. „Eine wirksame Durchführung und Überwachung sind wesentlich, um das erklärte Konformitätsziel zu erreichen.“98 Börsennotierte Aktiengesellschaften sind nach Art. 91 Abs. 2 AktG, KonTraG oder – soweit anwendbar – nach dem Sarbanes-Oxley-Act ohnehin zur Einrichtung eines internen Kontrollsystems (IKS), das u. a. die Einhaltung der gesetzlichen Vorschriften überwachen soll, verpfl ichtet.99 Es liegt daher nahe, den Überwachungsmechanismus zur Überwachung der Einhaltung des EG-Kartellrechts in ein eventuell bereits bestehendes IKS zu integrieren.100
Es sind verschiedene Möglichkeiten und Instrumente der Kontrolle denkbar. In der Praxis werden regelmäßige Compliance-Audits, Monitorings und unangekündigte Prüfungen (sog. dawn-raids) als geeignete Instrumente genannt.101 Die Ergebnisse der Kontrolle liefern wertvolle Anhaltspunkte für die Schwachstellen des Programms und ermöglichen so dessen laufende Optimierung. Zu einer effektiven Überwachung gehört schließlich ein funktionierendes Berichtswesen, das die Unternehmensleitung über die Umsetzung des Compliance-Programms sowie über die Ergebnisse der Überwachung regelmäßig informiert. Damit wird sowohl die von der Kommission bereits früh geforderte Überwachung durch die Unternehmensleitung102 als auch die allgemeine Aufsichtspfl icht der Unternehmensführung im deutschen Recht103 praktisch umgesetzt.
5. Der Compliance-Beauftragte
Es leuchtet ein, dass die Unternehmensführung die umfassende Aufgabe der Compliance nicht persönlich übernehmen und erfüllen kann. Es wird vielmehr erforderlich sein, die operative Verantwortung für effektive Erarbeitung und Durchführung des Compliance-Programms an eine hierfür geeignete Person zu übertragen. Die mit der Compliance beauftragte Person ist insofern Ausdruck der Delegation der Aufsichtspfl icht der Unternehmensleitung.104 und muss daher von der Unternehmensleitung bestellt werden und dieser direkt unterstellt sein.105 Der Compliance-Beauftragte (auch: Compliance Offi cer) nimmt als verantwortliche und koordinierende Person eine Schlüsselstellung im Compliance-Programm ein.
98 Entscheidung der Kommission, Viho/Toshiba, Rz. 30. 99 Bestandteil der von Unternehmen nach Sarbanes-Oxley-Act einzurichtenden IKS sind die sog.
Compliance-Controls, vgl. Menzies, Sarbanes-Oxley-Act, 2004, S. 96 f. 100 Vgl. Desai, The European Antitrust Review 2005, 15, 16. 101 Vgl. Lampert, BB 2002, 2237, 2242; Dreher, ZWeR 2004, 75, 99 f. 102 Vgl. Entscheidung der Kommission, ABl. 1982, Nr. L 354, S. 28-35, Rz. 68- National Panasonic.103 Vgl. Dreher, ZWeR 2004, 75, 100; Hauschka, BB 2004, 1178, 1180.104 Vgl. Hauschka, NJW 2004, 257, 259.105 Vgl. Hauschka, BB 2004, 1178, 1181; Rodewald/Unger, BB 2006, 113, 114 f.

Alexej Steinmark460
Unter Bezugnahme auf Rechtsprechung und Praxiserfahrungen wird die Bestellung eines Compliance-Beauftragten für die einzelnen Bereiche im Unternehmen zu den Mindestanforderungen an eine ordnungsgemäße Compliance-Organisation gezählt.106
Zum Aufgabenbereich des Compliance-Beauftragten gehören sämtliche Aufgaben, die mit der Erarbeitung, Implementierung, Durchführung und Überwachung des Compliance-Programms anfallen. Es beideutet jedoch nicht, dass er die umfassende Aufgabe alleine wahrnehmen muss. Hierzu wird ihm in vielen Fällen die nötige fachliche Kompetenz fehlen. Der Compliance-Beauftragte muss vielmehr für die Koordination der Zusammenarbeit mit verschiedenen Abteilungen und mit externen Experten zuständig sein. Er ist ferner der Ansprechpartner für kartellrechtliche Zweifelsfragen, die sich in der täglichen Vertragspraxis stellen. Um seine Funktion als Ansprechpartner ausüben zu können, müssen die Mitarbeiter des Unternehmens über seine Existenz informiert werden.107 Hierzu gehört insbesondere eine effektive Kommunikation zwischen den Beteiligten. Diese setzt wiederum gut funktionierende Kommunikationswege im gesamten Unternehmen voraus. Schließlich ist der Compliance-Beauftragte für die Überwachung des Compliance-Programms und für regelmäßige Berichterstattung über die Einhaltung der unternehmensinternen Standards und die Wirksamkeit des Compliance-Programms an die Geschäftsleitung zuständig.
Angesichts des anspruchs- und verantwortungsvollen Aufgabenspektrums ist es offenkundig, dass die Person des Compliance-Beauftragten bestimmte persönliche und fachliche Anforderungen erfüllen muss. Ob der Compliance-Beauftragte ein Mitarbeiter der Rechtsabteilung oder Mitglied der Geschäftsführung ist, ist von zweitrangiger Bedeutung. Die Bezeichnung als Compliance-Beauftragter ist ebenfalls nicht entscheidend, sondern vielmehr die Aufgaben- und Verantwortungsregelung.108 Um seine Aufgaben effektiv durchführen zu können, muss der Compliance-Beauftragte über eine Reihe persönlicher und fachlicher Kompetenzen verfügen. Er muss nicht zwingend ein spezialisierter Kartellrechtsexperte sein. Vielmehr ist Verständnis für interne Geschäftsabläufe und Strukturen, für die diesen Geschäftsabläufen zugrunde liegenden Prozesse sowie für die damit verbundenen rechtlichen Risiken gefragt. Der Compliance-Beauftragte für den Vertriebsbereich muss zumindest das für Vertriebsvereinbarungen maßgebliche EG-Kartellrecht kennen und mit den relevanten Märkten, der Vertriebspolitik, den Vertriebswegen und den Vertriebspartnern des Unternehmens vertraut sein. Entscheidend ist schließlich,
106 Vgl. Schneider, ZIP 2003, 645, 650; Hauschka, BB 2004, 1178 ff.; Dreher, ZWeR 2004, 75, 99.107 Vgl. Hauschka, BB 2004, 1178, 1179.108 Vgl. Dreher, ZWeR 2004, 75, 99.

COMPETITION-COMPLIANCE-PROGRAMM ALS INSTRUMENT... 461
dass dem Compliance-Beauftragten zur Erfüllung seiner Aufgaben ausreichend zeitlicher und personeller Ressourcen zur Verfügung stehen und seine Arbeit von der Unternehmensleitung unterstützt wird.
Zusammenfassung
Compliance wird von Unternehmen und der Öffentlichkeit zunehmend als ein wichtiger Bestandteil guter Corporate Governance angesehen.109 Die aus der Verletzung der kartellrechtlichen Rechtsnrmen resultierenden Risiken und damit einhergehender Schaden für die betroffenen Unternehmen können durch gezielte interne Maßnahmen weitgehend minimiert werden. Ein bewährtes Instrument zur Risikoprävention in diesem Bereich stellen sog. Compliance-Programme dar. Für die Ausgestaltung, Implementierung und Durchführung eines effektiven Compliance-Programms gibt es keine Standardlösungen. Jedes Compliance-Programm muss vielmehr auf der Basis der unternehmensspezifi schen Gegebenheiten und Risiken entwickelt und umgesetzt werden. In vielerlei Hinsicht ist entscheidend, dass die Compliance-Maßnahmen von der Unternehmensführung veranlasst und mitgetragen werden. Von großer Bedeutung sind ferner regelmäßige Kontrollen und fortlaufende Optimierung des Compliance-Programms.
109 Vgl. Schneider, ZIP 2003, 645, 647.

Djula Borozan462
UPWARD MOBILITY CRITERIA FROM CROATIAN WOMEN’S POINT OF VIEW
Djula Borozan, ProfessorFaculty of Economics in Osijek
Abstract
Little is generally known about the factors affecting the career advancement of women in the world of work. This is especially true for Croatia. Formally and legally, women should have equal opportunities for employment and advancement as their male counterparts have. However, in practice, situations are often different due to socio-cultural, support systems, self imposed barriers and the like. This paper examines factors facilitating and hindering career advancement from the Croatian women’s point of view. Differences between female managers and workers related to the career advancement criteria, which give them an edge in today’s global workplace, are discussed as well.
While the top female managers pointed out the personnel competence and soft factors as the most important in climbing the managerial ladder, the other working women did not assign the greatest importance to these factors. This can be explained in the social-cultural context that has been developing in Croatia. Unfavorable consequences of the transition process, the war as well as a decrease in trust in the most of institutions in Croatia jeopardized social and working norms making the personnel competence, self-initiative, pro-activity, responsibility and the similar characteristics without consequent reward in terms of better and higher job positions. But, many Croatian fi rms faced with global competition and necessity of following transparent business behavior norms have been forced to conduct a proper career advancement policy. Consequently, women employed in such fi rms stressed above mentioned factors as the most important for career advancement.
Key words: career advancement, working women, female managers, factory analysis

UPWARD MOBILITY CRITERIA FROM CROATIAN WOMEN’S POINT OF VIEW 463
1. Introduction
Although the statistics in most countries indicate that women make up the majority of the human population, the statistics on how women fare in the labor market indicate the gender asymmetry, i.e. the gender inequality at work. The fact that there are numerically less working women than working men, and that they are signifi cantly less employed at the top executive positions is known and is also conformed by statistics from developing and transitional countries, as well as from industrialized or advanced economies. A numerous studies stand out discriminative relations toward women in business and in society (Alder and Izraeli, 1988; Snayder, 1993; Large and Saunders, 1995; Hersch and Viscusi, 1996; Alder, 1997; McDowel et al., 1999; Jackson, 2001; Bell et al., 2002; Elmuti et al., 2003). Women all over the world suffer from unequal treatment and a lack of business opportunities. However, the improvement in equality of opportunities exists as a trend since couple of years ago; regardless if it is measured by a woman number entering the labor market, women’s employment choices, salaries, percentage of working women at the top executive positions, women’s start-ups, and the like. However, progress seems to be more evolutionary than revolutionary. It still seems to be a glass ceiling, and the exact dimension of it varies according to the country, industry and organization.
The term designed to amalgamate the visible and invisible barriers preventing the upward mobility of women in corporative world is known under the name glass ceiling. Although the term is relatively new,1 it has been extensively researched, providing evidences from countries around the world. A number of different barriers have been identifi ed that fall under the broad categories of corporate culture and corporate practice. Among them, child care and family responsibilities, awareness of success, perception problems, cultural attitudes toward women, stress, dating and marriage, involvement of professional associations are usually emphasized (AICPA, 1988).
In today’s global and highly competitive world, the business, state authorities and the whole society are especially interested in overcoming the glass ceiling. Only the human organizations deprived from any kinds of discrimination can be effective and sustain competitiveness and growth. From that standpoint, women are slowly but steadily becoming a more signifi cant component in the study of Croatian economic development in general and business in particular (Dezeljin et al., 1999).
Gaining a greater understanding of who the business women are and with which
1 The term “glass ceiling” was fi rst used in a 1986 Wall Street Journal special report on the corporate women (Hymowitz and Schellhardt, 1986). It described a corporative world in which achieving the certain level in corporation for women was blocked by individual or corporate tradition and prejudices.

Djula Borozan464
barriers they are facing in business world is a fi rst step toward better addressing how the women’s work potential networks, maximizes and transforms to be benefi cial for the whole society. The main purpose of this paper is to provide that fi rst step. The paper explores the business challenges which Croatian women have been facing; especially those connected to the career advancement. The career advancement can be defi ned as one person’s commitment to personal development, occupational choices, continuous education and building a professional image and reputation valuable to overtake greater responsibilities in the area of her/his professional interest. It represents a climbing the organizational ladders in order to increase power, responsibility and incomes (Borozan, et al., 2003). Little is generally known about the factors affecting the career advancement of women in the world of work in Croatia. This paper examines factors facilitating and hindering career advancement from the Croatian women’s point of view. Differences between female managers and workers regarding factors important in career advancement are also discussed.
The paper is based on the secondary source of information (opinions and experiences of working women published in different journals and daily press) and additional statistical analysis of data collected by research performed in the second half of 2002 in the frame of the University Fellows International Research Consortium, international organization directed to research of business operations.
2. Factors in career advancement: the Croatian female top managers’ point of view
Studies about the position and career advancement possibilities of Croatian women are extremely rare, sporadic and uncoordinated. There is a great uncertainty and lack of knowledge about these issues. This can be explained particularly by the fact that the offi cial statistics does not have an obligation to systemically monitor and report gender differences consistent with different working characteristics. At the same time, a network of organizations or associations exploring women issues in business and societies does not exist. Consequently, the unique and compressive data base aiming to provide the analytic basis for sophisticated analysis concerning women issues also lacks.
As a topic, working women and particularly women as managers or entrepreneurs are gaining increasing attention around the world. This is simultaneous with increasing consciousness about the idea that insuffi cient involvement of women in business and policy is a signifi cant barrier to sustainable development. In recent time, a special research attention is given to women in the frame of entrepreneurship in Croatia. Researchers of entrepreneurship have looking on women entrepreneurship in Croatia as a phenomenon being in early stage which should be fostered in a different ways.

UPWARD MOBILITY CRITERIA FROM CROATIAN WOMEN’S POINT OF VIEW 465
Wertheimer-Baletic analyzed in numerous papers changes in economic and social structure of Croatian population and of women particularly (e.g. Wertheimer-Baletic, 1991). Valdevit (2003) analyzed determinants of economic activities of women population during the last 50 years and compared them with the European countries. She documented changes in economic activities between men and women and indicated several trends, such as aging of Croatian population, increase in women’s educational level, decrease in women’s share in agriculture, i.e. in primary sector and simultaneously increase in tertiary sector (mostly in trade, education and medical care). She found out the same gender tendencies in Croatia and in developed economies. Mildrag Smid (2005) questioned the economic status of women in Croatia. She indicated the inequality in employment access (at the expense of women), little chances for full-time employment for women, especially in private fi rms, and that work of women is less valued than the work of men. Kerovac (2005) studied the position of women on Croatian and European labor markets. She stated that women in Croatia on the average wait longer for employment, that the concentration of women in so-called typically women’s professions is still remarkably high, etc. Singer and Grgic (2003) analyzed the level of women involvement in Croatian economy and found out, using the data from the Commercial court, that women in economy, especially in management positions participate disproportionally less than in the Croatian population. At the executive positions women accounted for only 27% in 2003 and in the list of 100 the most powerful enterprises, i.e. in their executive boards for only 14%. The empirically based results of research conducted by Poloski (2002) suggested that there is a difference between the masculine, traditional and feminine, modern leadership style in Croatia and that women are those who are the primary holders of the feminine leadership style. She concluded that Croatian enterprises that want to use the advantages of the feminine leadership style characterized by democratic leadership style, cooperation, highly developed interpersonal skills, encouraging participation, charismatic power, sharing of power and information, enhancing self-worth of others, energizing others, setting positive examples and teamwork, have to employ more women in management positions because they are familiar with it. Barkovic and Borozan (2004) identifi ed constraints to advancement of female entrepreneurship in Croatia and defi ned suggestions for promoting and advancing female entrepreneurship in Croatia at the policy and research level.
Contrary to Croatian practice, the researches exploring the women issues in the world of work have been extensively conducted in developed countries two decade ago. Among them, the increasing attention is given to the study of advancement and mobility of women in business world (Tharenon et al., 1994; Wentling, 1996; Adler and Izraeli, 1998; Adler, 1997; Still, 1997; Williams, 2000; Wood and Lindorf, 2001; Van Vianen and Fischer, 2002).

Djula Borozan466
In business world, as workers, managers or as entrepreneurs, Croatian women have been facing not only visible barriers registered in working practice (despite the legal prohibition of any kind of gender discrimination on the occasion of employment, in the work process and career advancement2), such as signing the part-time work contract in which the obligation that woman will not have children fi ve years is stated,3 but also numerous and different invisible barriers that blocks women, among others, from rising to the top. Breaking through the glass ceiling and fostering women entrepreneurship is a goal of women entrepreneurship association “Krug”. “Krug”, in cooperation with the Institute of international affairs conducted a survey under the name “Business Women” aimed to detect the opinions and attitudes of Croatian female managers and entrepreneurs in 2003. That was the fi rst survey of such kind performed in Croatia. Unfortunately, its details remained mostly unknown to the public.
The same purpose had the editorial of the monthly publication “Business Magazine” which dedicated the number in 2003 (5/2003) to successful top female managers. Based on the content analysis of many published interviews in it, as well as interviews published in other business journals, career patterns and characteristics of Croatian female managers, which enabled them to climb over the top management positions, can be identifi ed.
Firstly, the most of interviewed female managers highlighted that a woman has to be more competent than a man at the same level of organizational ladder if she want to be noticed and rewarded as well as if she want to go upward.4 Such opinion has been sharing also by Croatian women participated in the survey of “Krug”. 78% of surveyed women found out that they have to work more and be better than their male counterparts if they want to go upward. 5 This percentage is even less than the percentage calculated by Ragins et al. (1998). They said that 99% of the surveyed female executives face the need to prove their ability repeatedly and over-performed in order to counter negative assumptions. And even if they are really competent, upward mobility is not granted. They found the reasons for poor upward mobility in glass ceiling.
Barriers noted by Croatian top business women and being identifi ed from different sources can be sorted in fi ve groups:
2 In the frame of Croatian laws regulating the area of work any kind of gender discrimination is prohibit.
3 More about this can be red on web site www.babe.hr/zakoni/status3.htm 4 Competence could be defi ned as possessing a specifi c range of skills, abilities, or knowledge (Elmuti,
et al., 2003).5 More details about this survey is given in croatiabiz.com/magazine/index.php?what=article&ID=473&this_broj=10

UPWARD MOBILITY CRITERIA FROM CROATIAN WOMEN’S POINT OF VIEW 467
• Socio-cultural attitudes toward women - include the whole range of outdated and negative ideas about women in working places, such as women are less competent than men, or for woman is better not to be a leader in organizations but a supportive follower;
• Support system barriers - such as the existence of unclear and vague career advancement criteria which can lead to biased decisions in the processes of making promotion and judgment of women's career potential, etc;
• Perception problem – occurs when working women or men ignore the existence of obstacles to the career advancement of women;
• Need to achieve and sustain balance between private and business life – leaves them less time to develop new competences;
• Self-imposed barriers – are related to the struggles with the pressures of family responsibilities and management, cultural prejudice, and the perception that to succeed women must outperform their male counterparts.
Barriers noticed by Croatian top female managers are general in nature. They are not remarkably different from barriers facing the female managers in other culture like in the USA, Europe or Australia (for example see Baxter et al., 2000).
"To be better" according to successful Croatian business women means, besides to be competitive, to possess also:
• certain characteristics defi ned by experts as biological determined (Moir and Jessel, 1989), such as sensible women intuition and ability to understand the emotional states of others;
Successful business women pointed out also the following characteristics: pushiness, persistence, endurance and fearlessness as their biological advantages. They found out that biological characteristics enabled them to gain better positions in inverbal communications, to have multiple perspectives and to expand the context for evaluation and decision-making,
• genetic congenital and by education potentated interest for people and relationship developing among them which experts call psychological characteristics (Heim and Golant, 1992). These characteristics contributed to sensible feeling for formulation and effective operation of work teams, social networks and for creation balance between private and business life.
Biological and physiological characteristics determine mostly individuality of women in working place. In working place, successful female managers pointed out especially the following characteristics which enabled them to reach the top executive positions:
Djula Borozan468
• vision and ability to ensure sustain and innovative development of the fi rm;• hard belief that this what they are doing is necessary and correct, as well as that it
is useful in long-run, not only for the fi rm, but also for the society;• honest and responsible relationship to herself and to work, persistence and
commitment to work, systematically doing on goals, synchronization to a vision; • following the moral principles in behavior, decision-making and requirements
toward subordinates;• developed emotional intelligence;• developed real optimism;• self-confi dence, courageousness, pushiness, persistence, risk openness, readiness
to confrontation with authorities and untactfulness in a sense of consequences of today's moves to future career;
• openness to business challenges, new people, ideas, solutions, approaches and learning;
• fl exibility and intelligence;• balance between private and business life;• developed interpersonal skills and high involvement approach; ability to create
good interpersonal relationships, sensitivity to the needs of others, empathy, ability to motivate others to express his/her ideas, feelings, approaches, and business solutions;
• ability to manage a team and to motivate the team members, expressed organizational abilities, patience, commitment and loyalty to team, respect and understanding the other in team, developed feeling of fairness, good sense and feeling to recognize experts, honest and responsible people and choosing such people for associates;
• enjoying in business, partiality toward dialogue and consensus, expressed tolerance;
• decision-making based on logic, experience, knowledge, business ethics, but also on intuition and emotions.
Successful Croatian female managers pointed out especially the soft characteristics which enabled them (besides personal competence) to take over and keep the top executive positions. Although the above mentioned characteristics are not the only and exclusive characteristics of these women, underlining the soft characteristics as the main characteristics of their management and leadership style is closer to women than to men. But, some researchers fi nd out that personal and professional style of women described as soft or feminine can presents barrier to upward mobility; especially in masculine corporate value system, as for example is American (Ragins et al., 1998; Jackson, 2001) or Croatian (Poloski, 2003).

UPWARD MOBILITY CRITERIA FROM CROATIAN WOMEN’S POINT OF VIEW 469
It should be noted that some of interviewed women explained insuffi cient involvement of women in Croatian society, i.e. in political and business world, not only and exclusively with existence of patriarchal relationship in society, conservatism of business world, outdated and negative ideas, but fi rst of all as "… insuffi cient initiatives of women to prove themselves through their knowledge, expertise and experiences as persons who can cope with the most complex tasks" (S. Krasic, the main state inspector, Business Magazine, 5/2003, p. 18). Marceta Racanovic (executive of Varazdin stock exchange, Business Magazine 5/2003, p. 21) highlighted that "the greatest potential and barrier for achievement a success in business world lies in a woman herself. One expects a lot from women, in private and in business life. Therefore, a woman needs to determine by herself her goals and limits in her attendances and sacrifi ces."
It seems that when business woman accepts as normal the fact that not only her results, knowledge and skills are exposed to external evaluation, but also her look, dressing style and private life,6 and when she starts to continuously work on herself, than she transforms deceptive disadvantages in her advantages, potential and power.
Knowledge, skills, abilities and individuality necessary for promotion to the top positions underlined by Croatian top female managers are similar to those noted by females around the world. Elmuti et al. (2003) pointed out that advancement is infl uenced by human capital, individual, interpersonal, relational and family determinants. But, by researching career patterns and characteristics of top management women, attitudes, opinions and experiences regarding career advancement criteria of those women who did not manage (or not yet) to claim to the top are neglected. Therefore, examination of attitudes and behaviors, i.e. factors that ensure upward mobility of Croatian women is the primary task of this paper. But, are there differences in perception between women in management and non-management position related to skills and traits that give them an edge in today’s global workplace is also research priority of this paper.
6 This is also evidenced and researched in other culture (e.g. Klenke, 1996).

Djula Borozan470
3. Difference between women in management and non-management position about career advancement criteria
Based on surveying 158 women7 in the frame of the University Fellows International Research Consortium, Borozan et al. (2003) found out the following:
• While women have clearly articulated what they found ultimately unacceptable criteria for career advancement, it still has remained unclear what is the most acceptable criterion for career advancement. They ranked criteria (according to the median) and got the hierarchical structured criteria for career advancement (Table 1).8 Women have evaluated criteria associated with emphasizing personal competitiveness and fi tting into company’s working atmosphere as exceptionally acceptable for career advancement. They found the less acceptable criteria in activities that could be described as non-ethical behavior.
• More educated the women are, more they are willing to accept responsibility for any important project; they also want that important people within the company are familiar with their results and achievements compared. Opposite holds for older women in Croatia who tend to be more of the fatalistic nature, not believing that their own abilities and knowledge, as well as past achievements, are signifi cant for career advancement.
• More educated women consider reputation, social acknowledgment and admiration of others as an acceptable criterion for career advancement. Also, they believe that their career advancement will be more achievable if they demonstrate that they possess the right knowledge and skills (e.g. particular technical knowledge) that their fi rm is scarce of.
• Only women from a bigger company (more then 1000 employees) fi nd a stronger correlation between the personal achievements and success, as well as competencies and career advancement.
• Self-initiativeness as a working value and factor in career advancement is related to the position within the organization.
7 The sample encompassed 158 surveyed women from 20 – 59 years old. Since majority of surveyed women have completed in between 13-16 years of education, they were highly educated women with 13 years on average of working experience. Surveyed women were mainly employed as non-management personnel or low-level manager in enterprises with up to 1000 employees. They were mainly employed in service sector (fi nance, insurance, real estate business).
8 Women respondents have had to grade from 1 (exceptionally acceptable) to 8 (ultimately unacceptable) what they fi nd acceptable for career advancement.

UPWARD MOBILITY CRITERIA FROM CROATIAN WOMEN’S POINT OF VIEW 471
Table 1: Criteria ranks for career advancement at work
Grade 2
(exceptionally acceptable)
� leaving a company for better work (SUI38)� expressing abilities
(SUI16)� working overtime
(SUI37) � studying well work
assignments (SUI28)� behaving according
to business norms (SUI27)
Grade 3
(acceptable)
� good relationship with all employees (SUI34)� developing mentor
relationship with a peer (SUI35)� self-promotion
(SUI31)� self-initiativeness
(SUI30)� continued education
(SUI01)
Grade 4
(somewhat acceptablee)
� working for prosperous person (SUI12)� getting admiration
through particular behavior (SUI13)� learning likes and
dislikes of important people in a company to prevent from insulting them (SUI06)� using own technical
skills to make the peer dependent on them (SUI15)� volunteering
for unpopular assignments (SUI03)� become known
in a company by volunteering for special projects (SUI08)� helping subordinates
to develop their own skills for future support (SUI20)� respecting hierarchy
(SUI32)� dress code (SUI23)
Grade 5
(in between acceptable and unacceptable)
� condition-less support of important people’s stand (SUI09)� blaming someone
else for one’s own mistakes (SUI22)� t hreatening to
leave (SUI17)� falsifi cation of
results (SUI14)
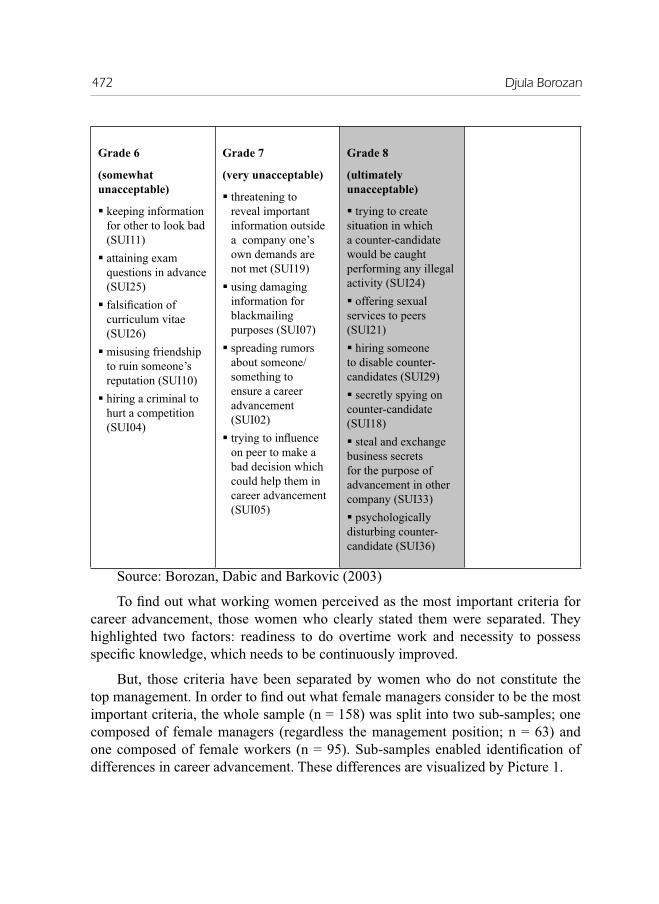
Djula Borozan472
Grade 6
(somewhat unacceptable)
� keeping information for other to look bad (SUI11) � attaining exam
questions in advance (SUI25)� falsifi cation of
curriculum vitae (SUI26)� misusing friendship
to ruin someone’s reputation (SUI10)� hiring a criminal to
hurt a competition (SUI04)
Grade 7
(very unacceptable)
� threatening to reveal important information outside a company one’s own demands are not met (SUI19)� using damaging
information for blackmailing purposes (SUI07)� spreading rumors
about someone/ something to ensure a career advancement (SUI02)� trying to infl uence
on peer to make a bad decision which could help them in career advancement (SUI05)
Grade 8
(ultimately unacceptable)
� trying to create situation in which a counter-candidate would be caught performing any illegal activity (SUI24)� offering sexual services to peers (SUI21)� hiring someone to disable counter-candidates (SUI29)� secretly spying on counter-candidate (SUI18)� steal and exchange business secrets for the purpose of advancement in other company (SUI33)� psychologically disturbing counter-candidate (SUI36)
Source: Borozan, Dabic and Barkovic (2003)
To fi nd out what working women perceived as the most important criteria for career advancement, those women who clearly stated them were separated. They highlighted two factors: readiness to do overtime work and necessity to possess specifi c knowledge, which needs to be continuously improved.
But, those criteria have been separated by women who do not constitute the top management. In order to fi nd out what female managers consider to be the most important criteria, the whole sample (n = 158) was split into two sub-samples; one composed of female managers (regardless the management position; n = 63) and one composed of female workers (n = 95). Sub-samples enabled identifi cation of differences in career advancement. These differences are visualized by Picture 1.
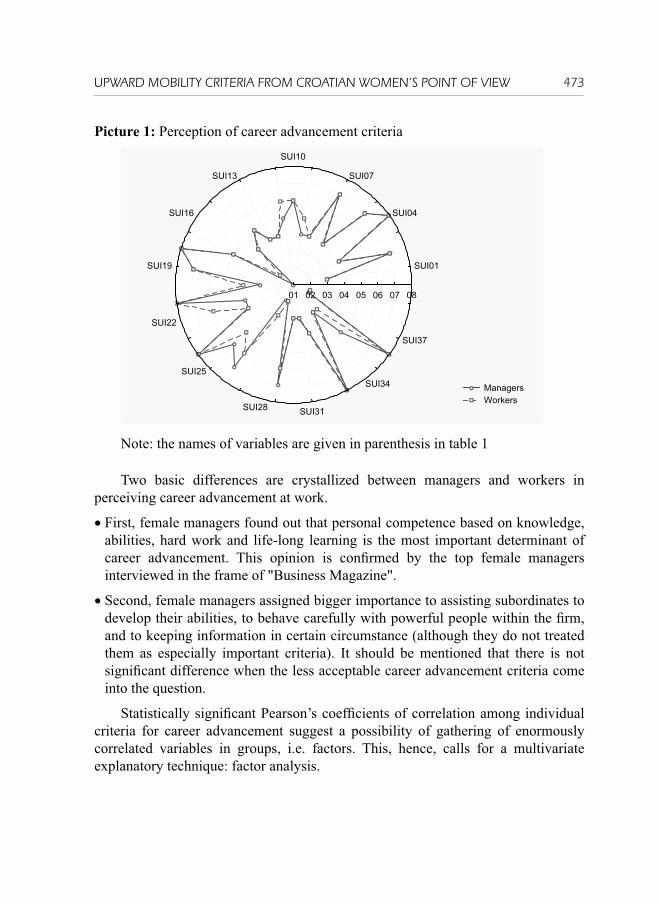
UPWARD MOBILITY CRITERIA FROM CROATIAN WOMEN’S POINT OF VIEW 473
Picture 1: Perception of career advancement criteria
Managers Workers
01 02 03 04 05 06 07 08
SUI01
SUI04
SUI07
SUI10
SUI13
SUI16
SUI19
SUI22
SUI25
SUI28 SUI31
SUI34
SUI37
Note: the names of variables are given in parenthesis in table 1
Two basic differences are crystallized between managers and workers in perceiving career advancement at work.
• First, female managers found out that personal competence based on knowledge, abilities, hard work and life-long learning is the most important determinant of career advancement. This opinion is confi rmed by the top female managers interviewed in the frame of "Business Magazine".
• Second, female managers assigned bigger importance to assisting subordinates to develop their abilities, to behave carefully with powerful people within the fi rm, and to keeping information in certain circumstance (although they do not treated them as especially important criteria). It should be mentioned that there is not signifi cant difference when the less acceptable career advancement criteria come into the question.
Statistically signifi cant Pearson’s coeffi cients of correlation among individual criteria for career advancement suggest a possibility of gathering of enormously correlated variables in groups, i.e. factors. This, hence, calls for a multivariate explanatory technique: factor analysis.

Djula Borozan474
4. Structure detection in the relationships between factors in career advancement
For the purpose of (i) reducing criteria upon which depends career advancement to those women who emphasis them as relevant and which can be connected into factors and (ii) detecting the structure in the relationships between criteria for career advancement, i.e. classifying those criteria, the factor analysis has been conducted. The factor analysis has included 38 variables, the same ones which have been related to variables that respondents identifi ed as criteria relevant for career advancement.
For the purpose of extracting factors, the method of principal components has been applied. That method enables a combination of correlated variables into factors and consecutive pulling out of statistically signifi cant factors. It is necessary to point out that consecutive factors are uncorrelated or orthogonal to each other and that each extracted consecutive factor account for less and less variability. Concerning the fact that theoretically speaking one can extract as many factors as there are variables, it is necessary to decide when to stop extracting factors. Although the question of how many factors to retain is an arbitrary decision, we have applied the Kaiser’s guideline being probably the most widely used since it seems that the best results yields it in practice. The application of Kaiser’s criterion has enabled the extraction of nine statistically relevant factors. They explain together approximately 67% of variance, which can be seen in the table 2.
Table 2: Eigenvalues for extracted factors
Factor Eigenvalue % Total Variance
Cumulative Eigenvalue
Cumulative %
1. Condemnation 10.88329 28.64025 10.88329 28.64025
2. Building self-image and networking 4.93450 12.98553 15.81779 41.62578
3. Initiativeness and openes to business challenges 1.86431 4.90608 17.68211 46.53186
4. Dressing code 1.58505 4.17118 19.26715 50.703045. Flexibility and savvy 1.41759 3.73050 20.68475 54.433546. Target orientation 1.33427 3.51123 22.01901 57.944787. Specifi c knowledge guarding 1.16607 3.06860 23.18508 61.013378. Poltroonance and slandernance 1.10784 2.91537 24.29292 63.92874
9. Competence (personal and interpersonal) 1.02111 2.68713 25.31403 66.61587
The fi rst column shows variances, i.e. eigenvalues, of nine factors which have

UPWARD MOBILITY CRITERIA FROM CROATIAN WOMEN’S POINT OF VIEW 475
been successfully extracted. As it is typical for the factor analysis, the order of factors refl ects their percentage share in the variance explanation. Those values have been expressed as percentages of total variance (38.00) in the third column. It is noticeable that factor 1 accounts for 28.64% of the variance, factor 2 for 12.99% up to factor 9 that accounts for 2.68%. The fourth column contents the cumulative variance extracted.
Disclosure of the structure of each individual factor has been done based upon the matrix of factor loadings, that is the correlations between variables and the factors (or so-called “new” variables). Placing manifested variables into particular factors has been done based upon coeffi cients greater than 0.3 from the matrix of factor loadings obtained by the application of varimax normalized rotation. Taking into consideration that some variables have had statistically signifi cant coeffi cients in several factors, they are placed in that factor where they had the greatest coeffi cient of factor loading.
FACTOR 1: Condemnation - is the most powerful factor (prime factor) because it explains the most of career advancement criteria variance. It collects those variables related to perceptions of respondents what is the most unacceptable in career advancement (see criteria assessed by grade 7 and 8 in table 1).
Transition processes followed in general by transformation of value system, have been additional loaded by different kinds of deviant behaviors provoked by war in Croatia. All of them contribute to development of unhealthy culture and atmosphere in many Croatian fi rms as well as to the creation of such value system in these fi rms in which personal competence do not represent basic career advancement criteria, but social contacts, connections, and money.9 However, those criteria for upward mobility faced with the global competence and transparency, requirements of modern business and Croatian authorities attempting to build highly competitive and knowledge-based economy provoke criticism among respondents.
FACTOR 2: Building self-image and networking – is based on those variables which are related to the need of building an image as a person who proves herself with her knowledge, expertise and experiences, who is open to new
9 According to the research results (conducted in those part of Croatia which was especially exposed to the war activities, and which belongs to underdeveloped Croatian parts) in 2004, degradation of thrust in most Croatian social institutions was followed by transformation of culture, i.e. value system from the system in which the values such as hard work, continuous learning, specialization and honesty have primary importance in private and business relationship to system in which social connections, mutual services and bribe are treated as primer. For successful career, according to the respondents (n = 402) of which are 80% in age 16 – 25, the most important are connections, social contacts and money (see Borozan, 2005).
Djula Borozan476
business challenges, who gives initiatives and is creative, and who does not disturb interpersonal relationships. The factor is related also to development of informal networks being useful for information exchange, cooperation, full participation, and to helping subordinates to develop themselves, as well as to career planning and strategizing, professional support and encouragement.
The most of working women in Croatia have been facing with stereotypes regarding their work and management abilities. This is confi rmed not only by interviewed top female managers (by Business Magazine), but also by results collected by surveying (by Krug), and according to 53% of women respondents stated that they face with gender discrimination in work place.10
The most of working women in Croatia (especially in management positions) do not share traditional “old boy” networks which are very important in business and also to upward mobility because of family responsibility, different personnel and professional style. This is not unique for Croatian women. A numerous studies showed that women in other countries have been largely excluded from these “old boy” networks (for example, Klenke, 1996; Jackson, 2001). Informal networking in Croatia is frequently family and/or ethnic determined and went a little further than networking as it is normally viewed in Western literature (see Ball, 2002 for description of its role in American society). Such networking supposes giving higher positions to a person who is not qualifi ed for this position, but who belongs to that network, or to design the new work position (without real business bases) for a particular person.
FACTOR 3: Initiativeness and openness to business challenges - is related to self-initiatively conduction of those activities in which knowledge, skills, persistence, potential and readiness to life-long learning come into expression and which are oriented to promotion of personal competence and positionating herself within organizational structure. Initiativeness through volunteerism, especially for project being challenge or unwishfull from others presents “small door” through which women try to prove themselves and to climb to the top management positions.
FACTOR 4: Dressing code – is related to fi tting of women’s dressing style to existed business dressing norms. This factor explains 4.17% of variance, and is positively correlated to business behavior norms.
In business world is appreciated not only if a person has knowledge, expertise, fl exibility, innovativeness and creativity, ability to solve problems and make decisions, but also if she/he does not create unnecessary burdens. Such unnecessary
10 Surveying was conducted in Croatia in 2002 in the frame of Croatian Association of Business Women. The sample encompassed about 100 business women (according to Vulić, 2003).

UPWARD MOBILITY CRITERIA FROM CROATIAN WOMEN’S POINT OF VIEW 477
burdens can be potentiated by disturbing business dressing and in general behavior code (T. Holjevac, Business Magazine, 5/2003, p. 16).
FACTOR 5: Flexibility and savvy – is related to “change-able” with a practical understanding of the dynamics of an organization and business, and the ability to effectively present and position oneself and one’s work within it, as is explained by Williams (2000). Savvy suppose the knowledge of own limits, and also the limits of other associates, capacity to start-up new business out of fi rm if the overbridging of existed limits in fi rm is not valuable.
FACTOR 6: Target orientation – is related to willingness to conduct different, but legal activities, in order to achieve business targets. If they could not be realized, women do not need to accept compromise and they have to conform with supervisions.
FACTOR 7: Specifi c knowledge guarding – is related to development and keeping special knowledge and abilities aiming to create dependence in organization. Because the criteria “using own technical knowledge and skills to make the supervisions dependent on them” perceived in the level of acceptability and nonacceptability (see Table 1), and because it is positively correlated with the criteria such as spreading rumours about someone/something to ensure a career advancement and attaining exam questions in advance, and negatively correlated with the criteria helping to subordinate and keeping good relationship with all employees, it is the unacceptable criterion factor.
FACTOR 8: Poltroonance and slandernance – is related to fawning to powerful people in organization and slandering the other people in order to achieve personal benefi ts. The factor is composed of criteria perceived as unacceptable in career advancement (grade 4 to 6 from Table 1).
FACTOR 9: Competence (personal and interpersonal) – is related to building personal competence through work and learning, readiness to helping coworkers, ability to develop and sustain good relationships with other employees. Although the factor explains the least variance, interviewed top business women pointed out primarily on it as the basic career advancement criterion. This provided a motivation for additional analysis; conducting factor analysis on sub-sample – female managers (n = 63). The following conclusions were drawn from this analysis.
• Accepting the Kaiser's criterion, 10 relevant factors are extracted;
• The structure of extracted factor indicates the difference in comparison to structure gained from full sample. This indicates the relatively instability of full sample which could be improved by taking a bigger sample.

Djula Borozan478
• It is conformed that female managers articulate also more easily the most unacceptable career advancement criteria. Unacceptable criteria were split into four independent factors: factor 1 which explains 29% of variance, and gathers mostly items grouped in factor 8 of full sample, factor 2 gathers items involved in factor 1 of full sample (it explains 13.71% of variance), and factors 6 to 8 explain together about 11% of variance.
• Acceptation of business behavior code also formed separate factor (factor 3). It includes also dressing code.
• Especially acceptable criteria are arranged into three independent factors: factor 4: competence (personal and interpersonal), factor 5: fl exibility in business, savvy, initiativeness and business openness, and factor 9: need for life-long learning and self-actualization. These factors explain together about 11.5% of variance.
• The most important difference is that female managers found out that personal and interpersonal competence is very important career advancement criteria. While this factor explains 4.81% of variance in the sample of female managers, in the full sample it explains only 2.69% of variance.
5. Concluding remarks
In most countries around the world, the proportion of women who occupy the top management positions is noticeably small. In this context the situation in Croatia is not unique. According to the statistics, women in Croatia account 52% of total population, but representing approximately 48.3% employed and 53.9% of unemployed inhabitants. Taking into question their share in the top executive positions the statistics is disastrous. According to the research conducted in 2003, on the top management positions there are only 27% of women, while in supervision committee of fi rms there are only 19% of women (Singer and Grgic, 2003). In investigating why women are having diffi culties going up the managerial ladder, researchers created the term glass ceiling. It relates to the visible and invisible barriers that keep women and minorities from rising above a certain level in corporation. Although the term is in some sense fuzzy and not precisely operationalized, similar barriers exist in different more or less sophisticated forms in Croatia, as they exist in other countries.
Little is generally known about the factors affecting the career advancement of women in the world of work. This is especially true for Croatia. Formally and legally, women and minorities should have equal opportunities for employment and advancement. But, in practice, situations are often different due to socio-cultural barriers, support systems barriers or self imposed barriers, etc.

UPWARD MOBILITY CRITERIA FROM CROATIAN WOMEN’S POINT OF VIEW 479
Regarding the main aim of this paper, to examine factors facilitating and hindering working values and career advancement, as well as to fi nd what skills and traits give women an edge in today’s global workplace from Croatian women’s point of view, the analysis in this paper was based on data collected from secondary source of information (opinions and experience primarily of the top female managers published in different journals and daily press) and from research conducted in the second half of 2002 in the frame of the University Fellows International Research Consortium.
The most of business women highlighted that a woman has to be more competent than a man at the same level of organizational ladder in order to satisfy prerequisites for going up. “To be better” according to successful female managers (besides to be competitive) means that a woman has to possess also biological determined characteristics, genetic congenital and many others characteristics which can be portrayed as soft or feminine. Knowledge, skills, abilities, individuality and leaning on feminine characteristics having crucial importance in career advancement, and underlined by Croatian top female managers are similar to those noted by female managers worldwide. Some of interviewed top female managers explained insuffi cient involvement of women in Croatian society, i.e. in political and business work, not only and exclusively with existence of patriarchal relationship in society, conservatism of business world, outdated and negative ideas which prevent women to going up, but fi rst of all by insuffi cient self-initiatives of women.
It seems that when a business woman accepts as normal the fact that not only her results, knowledge and skills are exposed to external evaluation, but also her look, dressing style and private life, and when she starts to continuously work on herself, than she transforms deceptive disadvantages in her advantages, potential and power.
The results of research conducted in 2002 showed that women have clearly articulated what they found ultimately unacceptable criteria for career advancement, but it remained unclear what is the most acceptable criteria for career advancement. To fi nd out what working women perceived as the most important criteria for career advancement, women who clearly stated the most important criteria were separated. They highlighted two factors: readiness to do overtime work and necessity to possess specifi c knowledge, which needs to be continuously improved. But, those criteria have been separated by women who do not constitute the top management. In order to fi nd out what female managers consider to be the most important criteria, the whole sample was split into two sub-samples; one composed of female managers and one composed of female workers. Among others, female managers found out that personal competence is the most important factor in career advancement.

Djula Borozan480
This opinion is confi rmed by the top female managers interviewed in the frame of “Business Magazine”.
The structure of factor analysis loaded the items into nine factors: condemnation, building self-image and networking, initiativeness and openness to business challenges, dressing code, fl exibility and savvy, target orientation, specifi c knowledge guarding, pooltronance and sladernance and competence (personal and interpersonal). The fi ndings of factor analysis do not confi rm completely previous mention empirical observations and conclusions drown by content analysis of interviewed top business women. While the top female managers treated the personal competence as prerequisite for upward mobility, in factor analysis this criterion explained the least of variance (only 1%). Therefore, factor analysis on sub-sample – female managers was conducted. This analysis confi rmed that female managers recognize in personal and interpersonal competence very important career advancement criterion.
Identifi ed factors of career advancement could not be explained well without understanding socio-cultural context within which they were formed. The socialistic heritage (expressed through moderation, subordination, servitude, keeping a low profi le and similar behavior) has been implicitly felt in the answers of respondents and thus infl uencing attitudes towards career advancement (Borozan et al, 2003). The criteria are also infl uenced by consequences of transition processes followed in general by transformation of value system, being additional loaded by different kinds of deviant behaviors provoked by war in Croatia. Many unfavorable processes developed in transitional context contribute to development of unhealthy culture and atmosphere in many Croatian fi rms as well as to the creation of such value system in these fi rms in which personal competence does not represent basic career advancement criterion, than social contacts, connections, and money. Many research conducted in Croatia indicate a degradation of socio-cultural capital in terms of a decrease of trust in the most of institutions in Croatia (e.g. legal system, Parliament, public services), negative trend in networking of people with various institutions (e.g. membership in political parties, non-government and non-profi t organizations, religious associations) and jeopardized social norms (e.g. cheating of the state through tax evasions and corruption).11 Such socio-economic context has produced uncertain and vague criteria for career advancement. In many work situations criteria for professional development and career advancement such as competitiveness, responsibility, self-initiative and achievements, risk taking behavior, often remain without a proper reaction in the sense of better and higher job position. This is important reason why respondents were not able to articulate the most important criteria for career advancement.
11 See Report on social development of Croatia 2001, the Agency of United Nations UMDP and UN/DESA and the Economic Institute in Zagreb.

UPWARD MOBILITY CRITERIA FROM CROATIAN WOMEN’S POINT OF VIEW 481
But global competition, impacting directly on local fi rms which are faced not only with increasing global competition on foreign market but also with direct competition from foreign fi rms in their own domestic markets, has been imposing the need of more transparency, certainty and order in this area. The interviewed top female managers, being employed in fi rms which have to play according to market criteria, pointed out the new values such as self-initiative and pro-activity, responsibility, competence, independence, ambition, risk taking, successfulness as the most important criteria for career advancement. They assigned also the greatest importance to the soft or feminine characteristics.
Literature:
AICPA, Upward mobility of women, American Institute of Certifi ed Public Accountants, March 1988
Alder, N.: Global Leadership: Women Leaders, Management International Review, Vol. 37, 1997
Adler, N.J. and Izraeli, D.N.: Women in Management Worldwide, in Adler, N.J. and Izraeli, D.N. (Eds): Women in Management Worldwide, Sharpe Inc., New York, NY, 1988, pp. 3-15
Ball, P.: Soon It Could Take More Than Just a Secret Handshake to Swing Boards’ Decisions, 2002, http://www.nature.com/nsu_pf/021001-12.html
Barkovic, I. and Borozan, Dj.: Supporting Female Entrepreneurship in Transitional Economies: the Croatian Experience, presented at the 13th Nordic Conference on Small Business Research, June 10–12, 2004, Tromso, Norway
Baxter, J. and Wright, E.: The Glass Ceiling Hypothesis: A Comparative Study of the United States, Sweden and Australia, Genderand Society, Vol.14, No. 2, April 2000, pp.275-294
Bell, M., McLaughlin, M. and Sequeira J.: Discrimination Harassment, and the Glass Ceiling: Women Executives as Change Agents, Journal of Business Ethics, Vol. 37, 2002, pp.65-76
Borozan, Dj., Dabic, M. and Barkovic, I.: The Meaning of Differences: Working Values of Croatian Women, in: Advancing Entrepreneurship and Small Business, 48th international conference, Belfast, July 15–18, 2003
Borozan, Đ.: Percepcija javnosti o drustveno-ekonomskom stanju Osjecko-baranjske zupanije: je li to stvarnost?, Pravni vjesnik, 2, 2005
Business Magazine (Poslovni magazin): Uspjesne zene Hrvatske, 5, Vol. 1, 2003
Djula Borozan482
Davidson, M. and Cooper, C.: Shattering the Glass Ceiling. The Woman Manager, Paul Chapman, London., 1992
Dezeljin, J. et al.: Poduzetnicki management, Alinea, Zagreb, 2002
Hersch, J. and Viscusi, W.K.: Gender Differences in Promotions And Wages, Industrial Relations, Vol. 35 No. 4, 1996, pp. 461-73.
Elmuti, D., Lehman, J., Harmon, B., Lu, X.., Pape, A., Zhang, R., Zimmerle, T.: Inequality Between Genders in the Executive Suite in Corporate America: Moral and Ethical Issues, Equal Opportunities International, Vol. 22, No. 2, 2003, pp. 40-58
Heim, P. and Golant, S.K.: Winning at the Game of Business, Lowell House, 1992
Hymowitz, C. and Schellhardt, T.D.: The Glass Ceiling: Why Women Can’t Seem to Break the Invisible Barrier That Blocks Them From the Top Jobs, The Wall Street Journal, March 24, 1986
Jackson, J. C.: Women Middle Managers’ Perception of the Glass Ceilling, Women in Management Review, Vol. 16, No. 1, 2001
Kerovac, N.: (Ne)jednakost zena na trzistu rada, K&R, 26, 2005, pp. 19-34
Klenke, K.: Women and Leadership: A Contextual Perspective, Springer, New York, NY, 1996
Moir, A. and Jessel, D.: Brain Sex: The Real Difference Between Men & Women, Delta, 1989
Large, M., Saunders, M.N.K.: A Decision-Making Model For Analyzing How the Glass Ceiling Is Maintained: Unblocking Equal Promotion Opportunities, The International Journal of Career Management, Vol. 7, No. 2, 1995, pp. 21–28
McDowell, J., Singell, L. and Ziliak, J.: Cracks in the Glass Ceiling: Gender and Promotion in the Economics Profession, American Economic Review, Vol. 89, No. 2, May 1999, pp.392-396
Mildrag Smid, J.: Ekonomski polozaj zena u Hrvatskoj, K&R, 26, 2005, pp. 5-18
Poloski, N.: Zenski stil vodjenja – empirijsko istrazivanje primarnih nositelja u hrvatskim poduzecima, Ekonomski pregled, Vol. 54, No. 1-2, 2003, pp. 38-54
Ragins, B.R., Townsend, B. and Mattis, M.: Gender Gap in the Executive Suite: CEOs And Female Executives Report on Breaking the Glass Ceiling, Academy of Management Executive, Vol. 12, No. 1, 1998, pp. 28-42
Report on social development of Croatia 2001, the Agency of United Nations UMDP and UN/DESA and the Economic Institute in Zagreb.

UPWARD MOBILITY CRITERIA FROM CROATIAN WOMEN’S POINT OF VIEW 483
Singer, S., Grgić, S.: Zene dolaze, Zavod za poslovna istrazivanja, 2003
Snyder, R.A.: The Glass Ceiling For Women: Things That Don’t Cause It And Things That Won’t Break It, Human Resource Development Quarterly, Vol. 4, 1993, pp. 97-107
Still, L.V.: Women As Leaders, Women And Leadership Series, Paper No. 4. Edith Cowan University, Churchlands, WA, 1996
Tharenou, P., Latimer, S. and Conroy, D.: How Do You Make It to the Top? An Examination of Infl uences on Women’s And Men’s Managerial Advancement, Academy of Management Journal, Vol. 37, 1994, pp. 899-931
Van Vianen, A. and Fischer, A.: Illuminating the Glass Ceiling: The Role of Organizational Culture Preferences, Journal of Occupational & Organizational Psychology, Sep. 2002, pp.315-337
Valdevit, M.: Ekonomska aktivnost zenskog stanovnistva Hrvatske, Ekonomski pregled, Vol. 54, No. 9-10, 2003, pp. 760-786
Vulic, M: Jos uvijek ruse zidove, Croatiabiz, December 18th, 2003
Wertheimer-Baletic, A.: Promjene u ekonomsko-socijalnoj strukturi stanovnistva Hrvatske u poslijeratnom razdoblju, Ekonomski fakultet, Zagreb, 1991
Wentling, R.M.: A Study of the Career Development And Aspirations of Women in Middle Management’’, Human Resource Development Quarterly, Vol. 7, 1996, pp. 253-70
Williams, C.P.: Helping Women Shape a Career Path and a Life That Works, presented at the International Career Development ConferenceYear 2000, 17th Annual California Career Conference, November 2000, http://icdl.uncg.edu/ft/031401-15.html
, G.J., Lindorff, M.: Sex Differences in Explanations For Career Progress, Women in Management Review, Vol. 16, No. 4, 2001, pp. 152-162

Ivana Barkovi} • Mario Vinkovi}484
GENDER INEQUALITY IN THE CROATIAN LABOUR MARKET – LEGAL AND ECONOMIC ASPECTS
Ivana Barkovi}, Assistant ProfessorMario Vinkovi}, LLB.
Faculty of Law in Osijek
AbstractThe normative analysis of solutions contained in the Croatian labor-regulative
system prima facie does not fi nd fl agrant defi ciences of legal provisions or their signifi cant discrepancies from comparative national systems of European states or international labour standards, but anti-discrimination measures in the conditions of inadequate level of court protection and ineffi ciency of labour inspectors in protecting substance rights often result in further refl ections of discrimination arising from the anti-discrimination basis.
The gender analysis of the labor market in Croatia suffers from a lack of statistical information and research, limiting analysis and leading to the use of prior estimates and hypothesis. Therefore, scant statistical information and research about women in the labour market hinders their effectiveness with policymakers in the implementation of government procurement laws or policies that promote women in the labour community.
In the circumstances of negative transitional changes, signifi cant impact of the Church on all spheres of the social and political life, unemployment, poverty and disallowed practice that makes a women undesirabile work force, a prevention of multiple forms of discrimination and genuine affi rmation of the equal distribution of gender roles in social and family life has to become a permanent imperative in the society that is pursuing values and principles of equality
The paper discusses women’s position in the Croatian labour market within transitional context, especially from legal, economic and political point of view. The pupose of this paper is to promote women position in the labour market as equal part of labour force.
Key words: gender inequality, labour market, gender roles, legal and economic aspects
GENDER INEQUALITY IN THE CROATIAN LABOUR MARKET... 485
1. IntroductionThe Republic of Croatia, being a typical country of Central and Eastern Europe
(CEE), has been facing for more than a decade now striking challenges of two parallel processes - transition to the market economy and democratic society and globalization, both causing tremendous changes in economic, political and social spheres of people’s life. While both processes have been offering opportunities beyond expectations, their threats have been equally challenging. In the line with the experiences in other CEE countries documented in the vast body of research (e.g. Kantor 2004, Thomson 2002, Nowicka 2004, Ruminska-Zimny 2002), the costs of globalization and complicated transitional process in terms of raising inequalities in distribution of opportunities and resources have been affecting more women than men in Croatia.
Women in Croatia have been adversely affected by male-dominated privatization process and male-biased technological modernization, discriminated at the labor market in terms of age, wages and career advancement possibilities, faced with greater and long-term unemployment especially when middle-aged or older, marginalized in terms of participation in decision-making and policy creation, confi ned to “feminine” professions with low pay and low skills and the like, hindered by the lack of resources and opportunities in their potential entrepreneurial venturing, etc. Considering the fact that 52% of Croatian population is women (Census 2001), it is distressing that Croatia does not fully capitalize on more than a half of its human resources thus undermining their competitive potential.
In the light of growing international awareness of the role of women in economic and social development, its efforts to become a member of the European Union (EU) which is committed to achieve gender equality and its endeavors to increase national competitiveness and to ensure sustainable growth and development in the highly dynamic and globalized world, Croatia must increase the awareness of the need to empower women to realize their full potential in their political, economic and social participation in overall national development.
2. Gender and gender equality The main goal of the development process is to advance the life of every person
regardless of their ethnicity, race, age, abilities and naturally gender. Advancement of life includes not only basic rights to secure basic needs of every person such as food, shelter, clean water or clothing but also rights to have a gainful employment, to exercise religion, to obtain education, to maintain health and the like. However, the experiences across the world show that there is a difference in economic, social and political activities of women and men that often make women less equitable in attempt to ensure the full use of their potential.

Ivana Barkovi} • Mario Vinkovi}486
For the purpose of this paper, gender is a culturally-based concept that defi nes womanhood and manhood by social perceptions whereas sex is a biologically-based concept that defi nes male and female by genetic composition.1 In another words, gender is an analytical tool for understanding social processes, i.e. identifi es the social behavior of women and men and the relationship between them. Identifying gender issues in the international context is complex because the defi nition of gender varies in different cultures with age, race and socio-economic status. It represents a dynamic concept that changes over time and location. The focus in this paper is on women in Croatia, i.e. their economic and legal status in the Croatian society.
According to the World Economic Forum (WIF, 2005), gender equality refers to that stage of human social development at which the rights, responsibilities and opportunities of individuals are not determined by the fact of being born male or female. Despite of the efforts to heighten the awareness of gender issues, the reality remains that no country has managed yet to eliminate the gender gap in terms of economic participation of women in the workforce, economic opportunity of women in economic involvement, political empowerment of women in decision-making and policy creating structures, educational attainment of women, and health and well being related to the equal possibility of women ranging from suffi cient nutrition to the fundamental safety and integrity of a person. Croatia does not differ regarding such gender asymmetries.
There are two indices measuring the building capacities of women and their empowerment in human development - gender development index (GDI) and gender empowerment index (GEM). The GDI measures achievement in the same dimensions as the Human Development Index (HDI)2 but adjusts the results in life expectancy, educational attainment and income for gender inequality. The GEM captures gender inequality in key areas of economic and political participation and decision-making in both public and private sectors, including: women’s and men’s shares of administrative and managerial positions, of professional and technical jobs, their shares of the national income and their shares of parliamentary seats.
3. Gender (in)equality in CroatiaCroatia does not differ in terms of experiencing gender asymmetries described
above. According to the Human Development Report (2004), Croatia ranks 43rd of 144 countries in terms of GDI, and 36th in terms of GEM. This places it among
1 More detailed explanation of the difference between sex and gender can be found in Blau, F. et al. (2001).
2 HDI focuses on three measurable dimensions of human development - long and healthy life of a person, education and standard of living.

GENDER INEQUALITY IN THE CROATIAN LABOUR MARKET... 487
countries with high human development.3 However, the women in Croatia are still considered the minority in terms of their economic, social and political potential. Even tough the situation has been changing and more and more women are entering the labor market or Parliament, there contribution to the overall national development is still a story of expectations unmet.
3.1. Women in political arenaPre-socialist time had been tough on women in Croatia who were economically,
politically and socially deprived of the same rights like men. The year of 1945 when the women got the right to vote and socialism as an order meant a signifi cant change in women’s position within the system. It had introduced the principles of gender’s equality and parity that legally granted women rights equal to those of men in their economic, social and political lives. However, those changes did not translate into reality. In socialistic system, women were not proportionally represented at higher levels of decision-making bodies. This is vividly illustrated by the data on women’s participation in Croatian Parliament (Sabor) in table 1.
Table 1 Participation of women in the Croatian Parliament, 1958-1990
Phases Period Women delegates octroyed phase 1958-1965 24.1%competition phase 1965-1984 7.9%key phase 1984- democratic changes 18%
Source: Lovrin-Grgic, 2002.
Women’s participation in political life has been increasing since the 1990s. Women have been accounting for 21.7% of Croatia’s Parliament. Compared to women representation in the national parliaments of the 45 members of the Council of Europe, Croatia is above the European average of 18%. Croatia had adopted a number of provisional special measures to achieve gender equality in the electoral lists of the various political parties. Such measures, however, had not increased women’s representation at the local government level, which stood at about 14%.4
3 Regarding GDI in world, the best performer is Norway and the worst performer is Niger. Regarding GEM, the best performer is Sweden and the worst Saudi Arabia. Other countries’ statistics available from Lopez-Carlos, A., Zahidi, S.: Women’s Empowerment: Measuring the Global Gender Gap, World Economic Forum, 2005 at www.weforum.org
4 Data obtained from www.stopvaw.org/Croatia.html (Accessed on 18th July 2005)

Ivana Barkovi} • Mario Vinkovi}488
3.2. Women in economic arena
Even tough socialism has introduced the principle of gender equality and parity that legally granted women rights equal to those of men, the gender specifi c legislation typical for socialistic countries enacted in the 1960-70’s prevented women from certain careers especially highly paid occupations (Bliss and Garratt 2001). Such legislation worked in favor of Croatian families making women more oriented towards the functions of mothering and homemakers, while at the same time causing disruption in the equality of women. The lack of a developed service sector and evident socio-political structure that has been marked by the separation of male and female roles ensured that women with full time jobs were responsible for the majority of the housework. According to Sroda (1992) and Bishop (1990) Eastern European women performed 60% more housework than Western women. Also, they held majority of lowest paying and often monotonous and unsafe jobs concentrated in textile and food industry, educational and health services, earning 65% of the average man’s wages.
The era of transition has put Croatian women in yet another hardship causing their unfavorable position in society and workplace. As a result, they are often under-represented in well-paid positions, improperly trained for careers in the new economy and lacking institutional and policy support to activate more in labor market while handling demanding role in the family.
Croatian women had a signifi cant role in the process of transition, however the benefi ts from it have not been equally distributed. According to the Government statistics (2005) the share of women in the total number of unemployed reaches 54%, in informal economy 65% and part-time employment up to 86%. Among long-term unemployed persons in Croatia 60% are women. They were often among the fi rst to be laid off in times of corporate restructuring. Women are holding the majority of jobs in public sector, 52% and only 39% of jobs in private sector. It has been estimated that only 30% of total entrepreneurs in Croatia are women. They are also trailing men when it comes to self-employment (28%). At the level of management within organizations, top management positions belong to only 27% of total employed.5 Women tend to earn less then their men counterparts up to 75% of average salary men earn which is found similar to such experiences in other CEE countries. To
5 In March 2003, the Croatian State Institute for the Protection of the Family, Maternity, and Youth released a study that showed half the companies surveyed did not have a single woman in a senior managerial position and less than 3 percent of companies had more than four women in such positions. Data obtained from Croatia, Country Reports on Human Rights Practices - 2004, Released by the Bureau of Democracy, Human Rights, and Labor, February 28, 2005 www.state.gov (Accessed 18th July 2005)

GENDER INEQUALITY IN THE CROATIAN LABOUR MARKET... 489
summarize it, women are signifi cantly constrained to developed careers as men in many aspects of business life.6
Even tough the transition of Croatia has not been gender neutral, it has created new opportunities for women to improve their chances on the labor market through entrepreneurship and self-employment. These opportunities are not yet fully realized by Croatian women but they have been viewed as a way of empowering women in economic, social and political sense since entrepreneurship is not just a business form but the way of behaving as well.
3.3. Female entrepreneurship
In spite of all problems encountered or maybe because of them, more Croatian women are increasingly interested in entrepreneurship. This is supported by the fact that 27% of all employers in Croatia are women, as managers or as entrepreneurs. Even tough more and more women are «pushed into» the labor market, larger number of women in labor force did not translate into an increased number of women in entrepreneurship. Similar to the case of female entrepreneurship around globe in general and transitional economies in particular, Croatian men start their own business more often than women.
Entrepreneurial climate within a country has signifi cant impact on propensity of women for entrepreneurial activities. The research at Babson College supports this thesis (Echeverri-Carrol and Brandazza 2002). Based upon the survey on a representative sample of 1,000 adults, the rate of new business creations has been estimated. The results suggested signifi cant difference among countries in new start-ups. When diversifi ed by gender, the data showed relatively similar start-up participation rates for women and men in the USA and Canada, both countries having high levels of entrepreneurial activities measured by TEA (Total Entrepreneurial Activity) index7 - 11.94 and 8.01 respectively. Opposite showed to be true for countries with low levels of entrepreneurial activities where start-up participation rates were
6 American scientists state three factors that constrain women to achieve career similar to their men counterparts: (i) absenteeism of women from work place (e.g. maternity leave); (ii) communication-al climate which suffers from stereotypes (e.g. woman as sexual object, woman as mother, etc.); (iii) invisible barriers as products of those stereotypes and which operate through “glass ceilings”, keep-ing women in so called women areas or women activities (Wood, 1993). See in Leinert-Novosel, S.: Politika zapošljavanja žena, Politička misao, vol. XL, br.3,, 2003, p. 113
7 The TEA index is uniquely created indicator by GEM which measures a total entrepreneurial activity within a country. It combines the number of persons active in start-up process or managing business not older than 42 months. The identifi cation of those persons is obtained by survey on random sample of at least 2000 adults in country participating in GEM project. More on TEA indexes on the offi cial GEM site, www.gemconsortium.org

Ivana Barkovi} • Mario Vinkovi}490
signifi cantly disproportionate for women and men.8 The case of Croatia follows this line of reasoning. Croatian TEA index of 3.69 in 2003 (all participating countries’ average is 6.878) has been lower than in countries with similar socio-cultural and economic heritage such as Hungary or Slovenia. This has been refl ecting on women engaged in entrepreneurial activities where men become more than two times often entrepreneurs than their female counterparts (table 2). It is evident that men are more entrepreneurial inclined whether entrepreneurship is seen as an opportunity or threat which is in congruence with world statistics - in 39 GEM countries men are 1.8 times more engaged in entrepreneurship than women.
Table 2 TEA index by gender in Croatia, 2003
Gender TEAtotal
TEAopportunity
TEAnecessity
2002 2003 2002 2003 2002 2003Female 1.58 1.42 0.74 0.53 0.64 0.72Male 5.12 3.69 3.20 2.95 1.05 0.42
Source of data for 2002: GEM for Croatia, Singer e. al., 2003 Source of data for 2003: Singer et al, 2004, working materials
Constraints affecting women entrepreneurs in Croatia range from various perceptions and social norms that are institutionalized in various aspects of socio-economic life in the country. Most common problems cited as major constraints to greater female entrepreneurship development in Croatia are similar to those world-wide (RRIF 5/2003): diffi cult access to fi nancing, information; insuffi cient skills and knowledge and education opportunities; overburden by work and child/household responsibilities; gender division of labor and gender role socialization.
Women in Croatia experience less opportunity then men to gain access to credit for various reasons. Mostly it is due to weak collateral position since women often are not owners of real estates or they show greater unwillingness to use household assets as collateral. In some cases, women complain that some loan offi cers show a bias against female entrepreneurs.
Access to information is a general problem of SMEs due to the competition over information with larger companies which have more power and resources to access it. Information is best obtained in Croatia through informal networks, membership in
8 According to GEM (2003), the highest levels of entrepreneurship among women has been noted in Thailand where 18.5% of women surveyed are entrepreneurs, India 14.1%, Argentina 11.5%, China 11.0%, New Zealand 10.6%, Mexico 10.3%, Chile 9.5%, Korea 8.6% and the United States (8.1%). The lowest levels of female entrepreneurship has been recorded in Japan 0.6%, Belgium 1.5%, Russia 1.6%, France 2.1%, Hong Kong 2.3%, Spain 2.6%, Sweden 2.6%, Singapore 2.7% and Slovenia 2.9%.

GENDER INEQUALITY IN THE CROATIAN LABOUR MARKET... 491
various associations and engagement in various activities and events. Women have greater diffi culties to engage in such activities and events, that often take place after working hours, than men due to their additional work as homemakers.
Gaining relevant and additional knowledge and skills for women is also more diffi cult since their responsibilities and work at home leave them less time available for attending formal and informal trainings. Also, trainings and educational programs tailored to women’s need both professional-wise and organization- wise are currently insuffi cient in Croatia although they have been emerging lately (e.g. seminars and workshop organized by regional Centers for entrepreneurship across the country).
Noted problems are concerning the fact that women tend to engage in entrepreneurial activities which are of lesser value markets implying less innovation as well. Namely, many women entrepreneurs engage in low value markets where barriers to enter are less in number but in turn such sector is more crowded and thus offering less opportunity to further grow and develop especially using innovations.
The common denominator to some of problems stated is the fact that women do need to cope with work and family. Petrović (2002) states that women are overburden by the responsibilities at work and home. Croatian women have it more diffi cult than women in more developed countries to combine their duties as homemakers and workers; they have it more diffi cult compared to men which proves to be true for all transitional economies.9 It seems that women of transitional economies have been victims of generating new roles in economy while not having traditional roles in family revisited.
This is partly due to general economic conditions (e.g. lower incomes buy less help in the house, for example housekeeper or electric appliances or less free time in general) but to society’s perception of woman’s role in the household where women typically do most of the housework and child care themselves. Vučinić-Palašek (1995) states most of the women in Croatia are employed while being housekeepers at the same time at home (44%) being responsible for most, if not all, housework and family care; more rare cases are successful employed women with career who share their housework and family care with other members of the family (9%).
Also, society is less informed about successful businesswomen, particularly entrepreneurs. According to the results of MediaNet (RRIF 5/2003), familiarity to
9 For example, women in world, e.g. Australia, work 38 hours at home alone doing housekeeping and providing childcare compared to 16 hours of man’s engagement at home activities. Combined with working hours at work, women work 1.5 months more than men. The more dramatic results come from Central and Eastern Europe where women work 85 hours at work and home together compared to men who work 70.6. Twenty years ago women in transitional economies worked 70 hours per week which represented a signifi cant difference compared to 55 working hours of women from Western countries (Petrovic 2002).
Ivana Barkovi} • Mario Vinkovi}492
business women of Croatia is much less than familiarity to women in politics or media. Out of 406 people surveyed (18 years and older), 80% could not name a single business woman in Croatia while only 1.7% surveyed could name only three business women. On question about women in politics, surveyed people named spontaneously 30 various names. These results imply that there is a serious lack of awareness of economic activities and successes of Croatian women in the business community. Less women’s contribution to the national economy is known, less is the possibility to develop and fully utilized women’s potential as economic agents.
4. Women and labor market in CroatiaThe offi cial statistical data show that women constitute 58% of unemployed
population in the Republic of Croatia although they are participating with 52% in the total number of population. At the same time, as it has been mentioned earlier, only 30% of women are entrepreneurs and only 6% occupy managerial positions.10 Therefore, stated data unquestionably point at the fact that the female sex has been jeopardized in the sphere of work and employment and thus evidently under-represented in a domain of jobs which are characterized by the leading positions and high earnings. Data also reveal that the women in Croatia are well educated, but despite that feebly represented at the leading positions in the bodies of the state administration and public enterprises while the proportion of female sex is particularly high in less professional, industrial, commercial and offi ce work11 as well as in the sphere of service sector which is generally known to have low salaries and inadequate possibilities of professional advancement and training. Stated statistics in the European context do not represent unexpected deviations since the level of female unemployment is only smaller in the Baltic states. Globally speaking, this is also the case in some parts of East Asia and in developed countries such as Australia, Canada, Japan, New Zealand and the United Kingdom.12 However, experts see the reasons for such “positive” statistics for women in the fact that women are more and often willing to accept jobs with signifi cantly unfavorable conditions of employment and work that it is case with male population. Women are ready to accept shorter working hours instead of not working at all, thus conscientiously but inevitably become underemployed. Furthermore, it makes them in the context of the present
10 Cf. web site of the Croatian Employment Service at http://www.hzz.hr/docslike/statistike/tablica%201.xls and web site of the Central Bureau of Statistics at http://www.dzs.hr/StateInfo/SIFrameH.htm
11 Nacionalni akcijski plan zapošljavanja 2004, Republika Hrvatska, Vol. 1, Uvod, zbirne analize i mjere, p. 24.
12 Time for Equality at Work, Global Report under the Follow- up to the ILO Declaration on fundamental Principles and Rights at Work, International Labour Conference 91st Session 2003, International Labour Offi ce, Geneva, p. 42.

GENDER INEQUALITY IN THE CROATIAN LABOUR MARKET... 493
discrimination long-term discouraged, often leaving their active role in the search for job.13
Croatian endeavors for the full membership in the European Union, the process of harmonization of the legislation which started long time ago and the geographical location, i.e. immediate state border with the member states on the North (Hungary), West (Slovenia), and south (maritime border with Italy) and the neighborhood with the West Balkan, states of the Central European province and those established after the break up of ex-Yugoslavia, which are troubled by the same problems of political and economic transitions, building of societies based upon the rule of law and equality of each individual, the domain of sex/gender equality has been justly and necessary positioned at the heart of the professional and multidisciplinary discussions.
In such a context, the European Employment Strategy and by it formulated equal employment possibilities, confi rmed at the Lisbon summit in 1997 and the directives of European Council, that emerged from the Amsterdam Treaty14, on decreasing a gender segregation gap on the labor market deserve a full attention in the case of Croatia which statistics, despite de iure equality between women and men, portray ever present de facto inequality and everyday discrimination of women on the labor market, but in the social life in general.
5. Gender equality – legal and institutional form of protectionThe composition of the labor force in the countries of EU shows similar trends
known to the Croatian society as well. It represents inter alia gender division, then 35-48% (Sweden) participation of women in the active population, their higher level of educational attainment and further great responsibility for the unpaid work at home.15
Elaborated data are witnessing about generally present and widely spread gender segregation, but also about the unquestionable necessity of effective and full integration of women on the labor market, not only in the context of promoting gender
13 Cf. Ibid.14 The purpose of European integration according to the Treaties: ‘’The Community shall have as its
task [...] to promote throughout the Community a harmonius, balanced and sustainable development of economic activities, a high level of employment and social protection, equality between men and women, sustainble and non-infl ationary growth, a high degree of competitiveness and covergence of economic performance...’’ , Article 2 of the Treaty establishing the European Community, OJ C 325/40 , 24. 12. 2002.
15 Gonäs, L. , Gender Segregation and the European Employment Strategy: Levels and Divisions, European Journal of Industrial Relations, Vol. 10, No. 2, 2004, p. 139-159
Ivana Barkovi} • Mario Vinkovi}494
equality but also in the context of mentioned, necessary and inevitable economic independency of women. Focusing on such an approach and goals are leading to the reduction of their proportion in poverty, which makes diffi cult for women to become fi nancially independent in the case of divorce, single parenting and family violence as legal and social categories. That will consequently, and not less important, change gradually a rooted perception and stereotypes of the woman’s role in the family and society, and increasingly expressed economic independence will strengthen her position in all spheres of life.
The role of legal and institutional forms in protection of gender equality, i.e. in the majority of cases the equality of women in working and social environment, requires short analysis of the legislation and responsible bodies.
5.1. Constitution, laws and institutionsCroatian Constitution has promoted the gender equality as one of the highest
values of the constitutional order and as such made it a basis for its interpretation16, and thus has unquestionably made a step further than the future Constitution of Europe. Namely, the latter has promoted the gender equality as objective not a higher-order value17, even tough the equality of women and men has been formerly incorporated in the article 2 of the Amsterdam Treaty (1997), instead of previous article 141 (ex 119) of the Treaty of Rome (1952). Hence, the establishing agreements at the end of 1990s have incontestably expressed the great value of the gender equality strategy.18 However, what has happened that the support to gender equality in the European Constitution has decreased, maybe best explained Shaw through a conclusion that only a few women have been included in the work of Convention to establish a Constitution for Europe.19 Croatian constitutional maker, from contemporary perspective, has not been as much dedicated to the idea of gender equality during the last changes of the Constitution, its declarative promotion in the
16 ‘’Freedom, equal rights, national equality and equality of genders, love of peace, social justice, respect of human rightsinviolability of ownership, conservations of nature and the environment, the rule of law an democratic multiparty system are the highest values of the constitutional order of the Republic of Croatia and the ground for the interpretation of the constitution.’’ Article 3 of the Constitution of Republic of Croatia, Narodne novine, No. 41, 2001.
17 Article 3 ‘’The Union’s Objectives’’ paragraph 3 [...]’’It shall combat social exclusion and discrimination, and shall promote social justice and protection, equality between women and men, solidarity between generations and protection of the rights of the child.’’ Treaty establishing a Constitution for Europe, OJ C 310/11, 16. 12. 2004.
18 Walby, S. , The European Union and Gender Equality: Emergent Varieties of Gender Regime, Social Politics, Vol. 11, No. 1, Spring 2004, p. 7.
19 Shaw, J. , The European Union and GenderMainstreaming: Constitutionally Embedded or Comprehensively Marginalised ? Feminist Legal Studies 10, 2002, p. 213-226.

GENDER INEQUALITY IN THE CROATIAN LABOUR MARKET... 495
highest constitutional value as to a desire to integrate European requirements and values in the national legislation. Daily discriminatory practice at all levels of work and employment, as well as within the family itself, points out that Croatian women have no more luck with changes in the Constitution of the Republic of Croatia that the female citizens of EU even tough the expression of the constitutional acts could indicate otherwise.
The position of women in the Croatian labor market has been mostly determined by the provisions of the Labor Act passed in 1995, which after lengthy vacatio legis, started to be implemented at the beginning of 1996. The same law lived through signifi cant changes and appendices in 2001, 2003 and 200420 when in its corpus became mutatis mutandis integrated solutions of the relevant directives of the Union from the domain of gender equality. After the initial slip in 1995, the law-make has fi nally defi ned the direct and indirect discrimination, introduced the institute of harassment and sexual harassment (which are being recognized as the form of sexual discrimination), by which he unquestionably created a necessary legal framework for the protection of women in working environment and in the process of employment. However, the process of harmonization of the legislation also contains signifi cant failures in terms of introducing and then rapidly abolishing the provision on positive discrimination of under-represented sex in employment. The previous provision of the article 3(2) of the Labor Act was enabling, in the case of two candidates both meeting the same requirements for employment, that the employer gives an advantage to the sex which is under-represented in his case. That is, the provision was undoubtedly too generally formulated and could easily become an introduction to new forms of discrimination. However, the explication of the Government, that the relevant solution has not brought adequate results so it should be eliminated, is not acceptable from any of the standpoints. We believe that abolished provision is only suffi cient legal basis in the fi ght against gender segregation in access to occupation and employment, including promotion21 and has represented de iure the provision which would in the majority of cases protect women.
Social norms and stereotyped view on the gender roles in the family life and business environment, as well as the real relationships between genders at the labor market whereat men dominate, only deepen the problems of segregation which is denoted even in the European Employment Strategy as a signifi cant problem. Thus, sex-dominated occupations and sex segregation could be overcome only if one notices the discriminatory practice and unacceptable treatment. The European
20 Zakon o radu, (pročišćeni tekst), Narodne novine (Nn.), No. 137, 2004.21 Vinković, M. , Gender Equality and the Process of Harmonisation of the Croatian Labour Law,
Croatian Yearbook of European Law and Policy (CYELP), Vol. 1, 2005, p. 6; Herman, V. , Vinković, M., Ravnopravnost spolova – ogledi o izabranim pitanjima europskog i hrvatskog radnoga prava, Zbornik Pravnog fakulteta u Zagrebu, 3-4, 2003, p. 837.

Ivana Barkovi} • Mario Vinkovi}496
Court of Justice had earlier treated segregation as acceptable and interpreted it as an exception of the equality principle22. However, we believe that the gender segregation represents a form of indirect sex discrimination23 and its further issues could be observed only from that aspect. Implications it causes in the everyday life of women incontestably point at such a conclusion because it is rather impossible to exclude its relationship with common perception about the height of costs related to employing a woman, including the period of motherhood and absence from work as well as often pointed low level of readiness for overtime work and motivation during the work as well as limited mobility compared to men.24
Working hours/time are one more part of the labor relations which deepens the problems of gender segregation on the labor market and has a negative impact on the treatment of women and mothers. Croatian lawmaker has limited working time to maximum of 40 hours per week coupled with the obligation that the employee in time vis maior, an extra amount of work and other cases of urgent situation, upon the request of an employer works longer than working hours but most 10 hours per week (overtime work).25 Mutatis mutandis, this is relatively common time limit of the full time duration, but in the case of motherhood and parenthood, it becomes a problem. Moreover, a distribution of the care for children and family confi rms absolute inequality between women and men. For a man, more children almost always mean greater activity at the labor market while a woman is always put in the worse position with long and anti-social working hours, especially in the countries burdened by the transitional problems. The substantive equality concept implies that it is not enough to work on banning such forms of indirect discrimination but use positive action, i.e. positive discrimination, eliminate past and future failures which make women suffer on the labor market in the time of motherhood.26
The protection of motherhood in the Croatian labor legislation27 notes down solutions which are at glance more favorable for the mother and father of a child than it is case in other European countries (long period of maternity or parental leave) but only with the intention to increase population births and without adequate material compensation. It is more a political than legal measure, which using populist methods additionally made the role of woman more paternal and reduced it to the level entirely unacceptable for the concept of gender equality. Croatian model, even
22 Herman, Vinković, op. cit. , p. 820.23 Vinković, op. cit. (CYELP) , p. 206.24 Cf. ILO Report, op. cit. (n. 3), p. 50.25 Cf. Article 38(1) and 41(1) of the Croatian Labour Act.26 Cf. Bell, M. , Equality and the European Union Constitution, Industrial Law Journal, Vol. 33, No. 3,
September 2004, p. 247.27 See for exemple Vinković, M . , The Motherhood in the Republic of Croatia – Protection of biological
condition or discrimination?, CYELP, Vol. 2, 2006 (to be published).

GENDER INEQUALITY IN THE CROATIAN LABOUR MARKET... 497
tough it is the case of positive discrimination of the special biological state of a woman and of a period of child rearing to which a woman is almost completely dedicated, has resulted in further problems for women in the labor market. Protective legislation has made her in everyday life an adverse part of the labor force. That is, the discriminatory practice has actually emerged from the anti-discriminatory basis.28 The woman becomes a working subject who should be avoided and who is daily exposed to the discrimination at work and in the process of employment; in family, intention to give birth or to further increase her family by being forced to sign illegal contract clauses which obliged her not to have children at the particular time upon obtaining employment contract, etc.29 This is a practice that men most defi nitely do not go through in the process of employment, work or advancement, but it is applied to the opposite sex. Herewith it is still seen, as Olson notices, that the work today is less strictly gender divided but there is no clear transition to some new, post-industrial order of relationship between sexes.30 We dare to add that there is no shift in the family and wider social environment, so that any attempt to change perceptions and to reconstruct present defi ciencies of unconscious mentality and rooted stereotypes is turned into the Sisyphus work.
Besides that, the time women spend doing house work not only in the time of motherhood but later too, additionally jeopardizes a possibility of their full time employment. The system of part-time work, that is almost completely immanent to the female population on the labor market, additionally discriminates women if it is not adequately applied and institutionally protected. It cannot be said that the part-time work is not regulated in Croatia31, but one notices its extremely low level of employment. This is partly due to the provisions of the Pension Insurance Act related to the part-time work employment32 that have been up till recently quite discouraging, complete absence of the transition from fi xed to fl exible working hours, high rate of unemployment and extremely big illegal labor market.
Women are today both homemakers and breadwinners, constantly traversing the boundary between unpaid and paid work.33 Their work in the family and household is invisible, it takes place during the time foreseen for rest and leisure and demands the continuous balance between paid and unpaid duties.34 Croatian circumstances and insuffi ciently developed protective mechanisms do not know atypical forms of
28 Ibid.29 Ibid.30 Olson, K. , Recognizing Gender, Redistributing Labor, Social politics, Fall 2002, p. 381.31 Croatian Labour Act, article 39.32 Nacionalni akcijski plan zapošljavanja, op. cit. (n. 2), p. 17.33 Fredman, S. , Women at Work: The Broken Promise of Flexicurity, Industrial Law Journal, Vol. 33,
No. 4, p. 300.34 Supiot, A. , Beyond Employment, Oxford University Press, 2001, p. 54.

Ivana Barkovi} • Mario Vinkovi}498
employment with the possibility of adequate application of the various forms of part-time work, i.e. part-time employment, temporary or occasional work, etc. However, these are precisely the types of employment which could greatly synchronize family and business duties of women and men in the time of motherhood and parenting as well as to more equally distribute responsibilities between both sexes. Women in Europe work part-time in all phases of life35, but they are still non-standard workers marginalized and mostly excluded from the employment protection rights.36 Because of the atypical relation with the employer courts have it diffi cult to protect their rights and obligations that emerge from such an employment relation37, but one expects signifi cant changes in that fi eld and more intense degree of protection, which mutatis mutandis enable existing directives of the EU. Establishment, i.e. more adequate legal regulation of such forms of work in Croatia must not fail to take place because they exist in a signifi cant degree on the black labor market and mostly affect younger population and women. Better quality of legislation will most defi nitely contribute to the fl exibility of the labor market and labor force in general. Moreover, the right to part-time work will contribute to the creation of own employment and promotion of equal opportunities, particularly for younger people and women. That process will not be fast when it comes to increasing the proportion of male population in part-time work because the increasing trend will be infl uenced by the diversity of each society as well as by the system of values that each society promotes. However, a data that 26% of men who use this type of work in the Netherlands is quite encouraging.38
Integration of women on the labor market is most evidently noticed through the increasing rate of their employment and the policy of interrupting career, maternal leave and signifi cance of work in different forms of part-time work are of equal importance for both sexes.39 In such a context, a cooperation of social partners is necessary to solve the issues of gender discrimination and segregation at all levels of social life as well as active social policy directed towards the care for children so that greater part of women could participate more actively on the labor market.40
The issue of the equal pay for the equal work and the work of equal value, emerged from the article 141 EC Treaty, has found its position in the Croatian labor legislation which precisely defi nes what is the equal work and the work of equal
35 Fredmpan, op. cit. , p. 302.36 Ibid. , p. 305.37 Ibid. , p. 311.38 Cf. Schmidt, M. , The Right to Part-Time Work under German Law: Progress in or a Boomerang for
Equal Employment Opportunities? Industrial Law Journal, Vol. 30, No. 4, December 2001, p. 351.39 Adamović, M. , Komparativna analiza Europske strategije zapošljavanja, nacionalnih akcijskih
planova zemalja članica Europske unije, i nacionalnog Akcijskog plana zapošljavanja Republike Hrvatske za 2004., Zagreb, 2004, p. 9.
40 Ibid. , p. 22-23.

GENDER INEQUALITY IN THE CROATIAN LABOUR MARKET... 499
value as well as hat is the notion of the pay in such a context. Latter mentioned is of extreme importance for the Croatian legal corpus and courts in the time to come even tough they neither understand such interpretations of pay, ad verbum copied from EC Treaty, nor long-term consequences which they will produce in the context of rulings of the European Court of Justice (ECJ). The Croatian reality is characterized by the gap between legal norms and every day realities in respect of equal pay for women and men. Due to the lack of data in Croatia, it is not possible to make an analysis of pay according to gender, but it has been indirectly proven that professions and work performed by mostly women are lately much less paid.41 One should not live in illusion that the situation is idealistic in the EU despite the casualty of the ECJ and the fact that almost 30 years42 have passed by since the case Defrenne vs. SABENA43and acceptance of Equal Pay Directive44, since the statistics point out that women earn 84% of men’s pay.45 Stated data, however, must not be used as a justifi cation but as a pointer to the necessity of permanent promotion and full implementation of the equality principle in the sphere of pay at the national level.
The issue of gender equality in Croatia is also regulated by the provision of the equally named law –Gender Equality Act46 which denotes the same presence of women and men in the all spheres of pubic and private life, their equal status, equal possibilities in realization of all their rights as well as the equal benefi ts of achieved results.47 Even tough the Law has defi ned basic notions, emphasized the role and obligation of media, political parties and education in promotion of gender equality and established the obligation of founding the Offi ce for gender equality of the Government of the Republic of Croatia as well as the Ombudsman for the gender equality, its main failure is that it has been accepted in the form of common not constitutional, i.e. organ law. Such a status in the hierarchy of legal regulations is at least surprising since the gender equality is denoted as the higher value of the constitutional order of the country. Thus, passing that law in the inadequate procedure actually represents a step backward in the promotion of the gender equality, a
41 Milidrag-Šmid, J. , Kokanović, M. , Položaj žene na tržištu rada in: Diskriminacija žena u Hrvatskoj, ICFTU CEE Women’s Network & Ženska sekcija sindikata SSSH, Zagreb, 2000; Zaborski-Čunović, K. , Žene na tržištu rada, Nestaje li jaz u dohotku između muškaraca i žena, tzv. Gender pay gap (1), Kruh i ruže, No. 21, 2004, at http://www.zinfo.hr/hrvatski/stranice/izdavastvo/kruhiruze/kir21/21trzisterada.htm
42 Case 43/75 Defrenne v SABENA [1976] ECR 455.43 Directive 75/117/EC on the approximation of the laws of the Member States relating to the application
of the principle of equal pay for men and women,[1975 ] OJ L 45/19. 44 Bell, op. cit. , p. 251.45 Ibid. ; Commision Annual Report on Equal Opportunities for Women and Men in the European
Union 2002, COM (2002), p. 19.46 Zakon o ravnopravnosti spolova, Nn. , No. 116, 2003.47 Article 5 of the Gender Equality Act.

Ivana Barkovi} • Mario Vinkovi}500
conscience attempt to legally lessen the highest constitutional values, as well as an example of its fundamental ignorance. Unfortunately, wider social discussion that was lead at that time, as well as extremely nomotechnical and content qualitative suggestions of the Constitutional law on the gender equality of the Rodin’s work group and the female Association B.a.b.e. have not resulted in its acceptance due to the lack of political will. Thus, the Croatia has lost a possibility for a constitutional law of the working group of the Faculty of Law to become one of the best laws related to the issues of the gender equality in Europe and wider.
The problem of Croatian national Gender Mainstreaming concept, as well as the one in EU, is its “soft law” character and counseling nature of provisions48, what together with the loss of its focus limits the effectiveness of the interventions.49 By that, it actually loses the legal nature and necessary function in the fi ght against gender inequality and shows its primary necessary political function.
In the context of the protection and surveillance of the Constitution- and laws- promoted gender equality one should not underestimate the founding of the Government offi ce and the Ombudsman, but the transitional circumstances and limited outreach of their work place the greatest responsibilities on the Croatian courts themselves. However, court practices in this domain are almost missing. Not because the situation is ideal in one transitional country like Croatia but because of the unquestionable fear for own job and existence, as well as the lack of faith in the possibility to ensure institutional protection of the woman’s right in the face of court. Signifi cant is the lack of lawyers who know the subject materials and relevant European law, and at the wider level the infl uence of media and Church on all spheres of social life in Croatia and thus on mentioned situation. We can hold against media their insuffi cient activity in this fi eld and paternalistic, sexist portray of a woman and against the Church its eclectic promotion of the gender segregation in its own structures and thus indirectly promoting the inequality between women and men in the family as a traditional value of a society and consequently in wider social and business environment.
6. Conclusion
Elaborated and exposed problems of the gender inequality on the labor market in the Republic of Croatia are the consequence of social stereotypes and institutional protection which does not provide adequate protection. Legal and political framework is essentially similar to the problems in the EU, but the subordinated position of a
48 Cf. Walby, op. cit. (n. 9), p. 749 Cf. Beveridge, F. , Nott, S. , Mainstreaming: A Case for Optimism and Cynicism, Feminist Legal
Studies, Vol. 10, 2002, 299-311.

GENDER INEQUALITY IN THE CROATIAN LABOUR MARKET... 501
woman in the working environment and family is the result of the multifaceted forms of discrimination emerged from the anti-discriminatory legal basis.
We believe that the gender segregation is the form of indirect discrimination because it is a consequence of social stereotypes about the perception on gender roles. Present and expressed psychological element, i.e. traditional understanding of female and male jobs and obligations in the family, infl uences the attitudes of employers, but on individuals as well, and results in subjective favoring of one gender enabling it advantages through, so to seem, neutral practice, criteria or provision.
Croatian society, in the manners of own and European dilemmas in the area of gender equality, must strengthen institutional protection of women’s rights, encourage the work of women’s think-tank associations, develop atypical forms of employment contracts, initiate transition from fi xed to fl exible working hours and give greater attention to feminist activities. Such an approach, coupled with changing educational policy, education of judges and work inspectors in the domain of gender equality and fi nal acknowledgment of informal forms of education as well as more intensive and more responsible role of media, can lead to realization of modus for breaking down stereotypes and achieving equal distribution of responsibilities in family and working environment, affi rming the principles and values of equality as inseparable parts of individual’s integrity in general.
References:• Adamović, M. , Komparativna analiza Europske strategije zapošljavanja,
nacionalnih akcijskih planova zemalja članica Europske unije, i nacionalnog Akcijskog plana zapošljavanja Republike Hrvatske za 2004., Zagreb, 2004.
• Bell, M. , Equality and the European Union Constitution, Industrial Law Journal, Vol. 33, No. 3, September 2004.
• Beveridge, F. , Nott, S. , Mainstreaming: A Case for Optimism and Cynicism, Feminist Legal Studies, Vol. 10, 2002.
• Bishop, B.S. 1990. From Women’s Rights to Feminist Politics: The Developing Struggle for Women’s Liberation in Poland. Monthly Review. November.
• Blackburn, R. , Jarman, J. , Brooks, B. , The Puzzle of Gender Segregation and Inequality: A Cross-National Analysis, European Sociological Review, Vol. 16, No. 2, 2000.
• Blau, F.D, Ferber, M.A., Winkler, A.E.: The Economics of Women, Men, and Work, Prentice Hall, New Jersey, 2001
• Bliss, R., Garratt, N. 2001. Supporting Women Entrepreneurs in Transitioning

Ivana Barkovi} • Mario Vinkovi}502
Economies. Journal of Small Business Management, 39, 4.
• Commision Annual Report on Equal Opportunities for Women and Men in the European Union 2002, COM (2002).
• Directive 75/117/EC on the approximation of the laws of the Member States relating to the application of the principle of equal pay for men and women,[1975 ] OJ L 45/19.
• Fredman, S. , Women at Work: The Broken Promise of Flexicurity, Industrial Law Journal, Vol. 33, No. 4, December 2004.
• Gonäs, L. , Gender Segregation and the European Employment Strategy: Levels and Divisions, European Journal of Industrial Relations, Vol. 10, No. 2, 2004.
• Hannett, S. , Equality and the Intersections: The Legislative and Judical Failure to Tackle Multiple Discrimination, Oxford Journal of Legal Studies, Vol. 23, no. 1, 2003.
• Herman, V. , Vinković, M., Ravnopravnost spolova – ogledi o izabranim pitanjima europskog i hrvatskog radnoga prava, Zbornik Pravnog fakulteta u Zagrebu, 3-4, 2003.
• Kantor, P. 2000. Promoting Women's Entrepreneurship Development based on Good Practice Programmes: Some Experiences from the North to the South. Working paper No. 9. International Labour Organization, www.ilo.org., (Accessed April 2004)
• Kenney, S. J. , Equal Opprotunity and Representation: Extending the Frame to Courts, Social Politics, Vol. 11, no. 1, Spring 2004.
• Leinert-Novosel, S. 2003. Politika zapošljavanja žena (eng. Women employment policy), Politička misao, vol. XL, br.3.
• Lopez-Carlos, A., Zahidi, S.: Women’s empowerment: Measuring the Global Gender Gap, World Economic Forum, 2005, www.weforum.org (Accessed July 2005)
• Lovrin-Grgic, S. 2002. Women in Transition - the Case of Croatia, Environment Protection & Health - What Can UWE Do in 21st century, Croatian Association of University Women. Dubrovnik. October 11-13.
• Milidrag-Šmid, J. , Kokanović, M. , Položaj žene na tržištu rada in: Diskriminacija žena u Hrvatskoj, ICFTU CEE Women’s Network & Ženska sekcija sindikata SSSH, Zagreb, 2000.
• Morris, G. S. , Employment in Public Services: The Case for Special treatment,

GENDER INEQUALITY IN THE CROATIAN LABOUR MARKET... 503
Oxford Journal of Legal Studies, Vol. 20, No. 2, 2000.
• Nacionalni akcijski plan zapošljavanja 2004, Republika Hrvatska, Vol. 1, Uvod, zbirne analize i mjere, 2004.
• Nowicka, W. The Position of Women and Demographic Processes in the Countries in Transition, www.waw.pdi.net, Accessed July, 2004.
• Olson, K. , Recognizing Gender, Redistributing Labor, Social politics, Fall 2002.
• Petrović, J.A. 2002. Diskriminacija žena u Hrvatskoj (eng. Discrimination of Women in Croatia). ICFTU CEE Women’s Network, Ženska sekcija SSSH, Zagreb.
• RRIF (2003). Uspješne žene Hrvatske, (eng. Successful Women of Croatia) Poslovni magazin, posebni prilog, Računovodstvo Revizija i Financije (RRIF), no. 5
• Ruminska-Zimny, E. 2002. Gender and Transition: Ten Years Later, UNECE, UN Special, March.
• Schmidt, M. , The Right to Part-Time Work under German Law: Progress in or a Boomerang for Equal Employment Opportunities? Industrial Law Journal, Vol. 30, No. 4, December 2001.
• Shaw, J. , The European Union and GenderMainstreaming: Constitutionally Embedded or Comprehensively Marginalised ? Feminist Legal Studies 10, 2002.
• Supiot, A. , Beyond Employment, Oxford University Press, 2001.
• Time for Equality at Work, Global Report under the Follow- up to the ILO Declaration on fundamental Principles and Rights at Work, Intrenational Labour Conference 91st Session 2003, International Labour Offi ce, Geneva, 2003.
• Treaty establishing a Constitution for Europe, OJ C 310/11, 16. 12. 2004. • Treaty establishing the European Community, OJ C 325/40 , 24. 12. 2002. • Ustav Republike Hrvatske ( Constitution of Republic of Croatia), Narodne
novine, No. 41, 2001. • Vinković, M . , The Motherhood in the Republic of Croatia – Protection of biological
condition or discrimination?, CYELP, Vol. 2, 2006 (to be published).
• Vinković, M. , Gender Equality and the Process of Harmonisation of the Croatian Labour Law, Croatian Yearbook of European Law and Policy (CYELP), Vol. 1, 2005.
• Vučinić-Palašek, G. 1995. Stavovi prema ženama (eng. Attitudes Towards Women),

Ivana Barkovi} • Mario Vinkovi}504
rezultati istraživanja, Zagreb.
• Walby, S. , The European Union and Gender Equality: Emergent Varieties of Gender Regime, Social Politics, Vol. 11, No. 1, Spring 2004.
• Zaborski-Čunović, K. , Žene na tržištu rada, Nestaje li jaz u dohotku između muškaraca i žena, tzv. Gender pay gap (1), Kruh i ruže, No. 21, 2004, at http://www.zinfo.hr/hrvatski/stranice/izdavastvo/kruhiruze/kir21/21trzisterada.htm .
• Zakon o radu, (pročišćeni tekst), Narodne novine (Nn.), No. 137, 2004. • Zippel, K . , Transnational Advocacy Networks and Policy Cycles in the European
Union: The Case of Sexual Harassment, Social Politics, Vol. 11, No. 1, Spring 2004.

ANTIGLOBALISIERUNG DIE ANDERE GLOBALISIERUNG 505
ANTIGLOBALISIERUNG DIE ANDERE GLOBALISIERUNG
Ljiljana CroceFaculty of Economics
Postgraduate study: Management
Zusammenfassung
Das Ziel der Arbeit ist, ein je größeres Interesse an diesem Thema zu erwecken und auf die Gefahren hinzuweisen, denen wir alle verlaufen, wie die Armen, sowie auch die Reichen und die kleine Gruppe der zum mittleren Stand gehörenden, die immer mehr in die offene Armut versinken. Es wäre zu viel, in einer Welt solcher Globalisierung, die soziale Empfi ndlichkeit der Menschen zueinander zu erwarten. In Wirklichkeit geht sie immer mehr verloren. Der Mensch als Einzelperson, sowie auch die Völker verlieren an seiner erkennbaren Identität und versinken in dem Kampf um das reine Überleben. Der Menschenfaktor als bedeutende Komponente verliert immer mehr seine Lage in der Wirtschaft und wird zum sozialen Problem. Wem gehören die Arbeitskräfte, wenn diese aus den Fabrikhallen auf die Strasse geliefert werden? Geschweige denn, dass hinter fast jedem solchen Fall mehrköpfi ge Familien stecken.
Die zahlreichen positiven Seiten und die riesigen Vorteile der Globalisierung sind nicht der Gegenstand dieser Arbeit.
Im Vordergrund der Arbeit stehen die negativen Einfl üsse der Globalisierung auf die Demokratie, Menschenrechte, Rechte der Minderheiten, Weltfrieden, soziale Gerechtigkeit, Armut und Hunger, Naturschutz, Fortdauer der biologischen Verschiedenartigkeit.
In der Arbeit wurde ausschließlich die reine Literatur benutzt, mit Verzicht auf die Probleme aus der Praxis, die solchartige Globalisierung mit sich bringt, weil diese Probleme ohnehin zu traurig und hoffnungslos sind. Wie sieht die Zukunft des Menschen und der Gesellschaft aus, wo diese Erscheinungen aktuell sind? In den Staaten gibt es keine Programme, die die negativen Seiten der Globalisierung kontrollieren und mildern würden. Können diese Probleme, die vom Wirtschaftlichen immer mehr ins Soziale übergehen, von den gegenwärtigen Mächtigen – der Herrscher der Welt und der einzelnen Staaten – mit einem humaneren Umgang oder durch den Wiederstand der mit der Globalisierung betroffenen Bevölkerung, gelöst werden?
Ljiljana Croce506
Hiermit kommt die Schlussfolgerung, dass wir alle zusammen der Erhaltung und der Existenz der Welt beitragen sollen, wenn es schon nicht zu spät ist. Die Menschen haben sich somit schon apathisch mit dem Zustand der Zerstörung des Lebens auf der Erde abgefunden, weil es wirklich so aussieht, als ob es sich schon anfangs um einen Kampf um die schon im Voraus verlorene Schlacht handelte. Wenn wir zu kämpfen versuchten, könnten wir vielleicht auch gewinnen, aber wenn wir gar nicht kämpfen, verlieren wir mit Sicherheit. Tun wir das für die zukünftigen Generationen. Es ist schließlich unsere Pfl icht.
Der Appell an die Regierungen im Kampf gegen Korporationen ist: global denken, lokal wirken.
Schlüsselwörter: Globalisierung, Antiglobalisierung, IWF, Weltbank, WTO
Einführung
Diese Arbeit besteht aus zwei Teilen. Der Gegenstand des ersten Teils sind die Begriffe der Globalisierung, mit Betonung auf deren negativen Seiten und des zweiten Teils die Antiglobalisierungsaktionen, -bewegungen und -gruppen.
1. Globalisierung
„Diese Welt ist der Wille zur Macht – und nichts außer ihr“ – Nietzsche
Globalisierung ist das wirtschaftliche, technologische, politische, soziologische, kulturelle und psychologische Phänomen. Die Evolution jedes einzelnen Phänomens fordert die Transformierungen aller anderen. Die Gesellschaft ist voneinander abhängig. Nicht ein einziges Land kann sich von den anderen isolieren. Heute ist es möglich, in einem Land zu leben, für einen Arbeitgeber in einem anderen Land zu arbeiten, wobei der Arbeitgeber aus einem dritten Land herkommt ...
Informatiktechnologie und -kommunikationen ermöglichen es, dass wir derzeitige Zeugen der Ereignisse aus egal welchem Teil der Welt sind.
Anfangsformen der Globalisierung könnte man mit den Anfangsformen der Intensivierung des Waren- und Kapitalverkehrs und der Menschenbewegungen aus der Mitte des 19. Jh. verbinden.
In der Phase des Kapitalismus, die durch Freihandel, Massenkultur und neue Technologien gekennzeichnet ist, erscheint der Ausdruck „Globalisierung“, wie wir ihn heute vorfi nden. Der Globalisierungsprozess beginnt in den sechziger Jahren des vorigen Jahrhunderts und nimmt seinen Anlauf in den achtziger Jahren, in der Zeit von Ronald Reagan in den USA und Margaret Thatcher in Großbritannien, die auf

ANTIGLOBALISIERUNG DIE ANDERE GLOBALISIERUNG 507
der sog. „Deregulierung“ des Verhältnisses zwischen Staat und Wirtschaft bestanden hatten.
Die Globalisierung wurde durch die Krise in Asien ’97 und des Sturzes der russischen Wirtschaft ’98 gekennzeichnet.
Diese Phase des Kapitalismus hat unumgänglich die Entstehung neuer Organisationen für wirtschaftliche und politische Zusammenarbeit (Kooperation) verursacht, und das sind:
- NAFTA ( die Länder von Nordamerika ) - EU - MERCOSUR( Südamerika )- ASEAN ( Südöstliches Asien ) und andere
1.1. Globalisierung – Internationalisierung
Kommt in der globalisierten Gesellschaft das Dasein der nationalen Kulturen in Frage? Ja, denn die nationalen Kulturen und Identitäten sind gefährdet. Auf deren Stelle drängt sich die Massenkultur auf. Die nationalstaatlichen Autoritäten verlieren an Macht und unterwerfen sich den mächtigeren, wodurch die Macht der Nationalstaaten selbst begrenzt wird oder verloren geht. Es verschwinden die erkennbaren nationalen Produkte, Technologie, nationale Körperschaften, Industrien. An deren Stelle treten internationale Körperschaften auf, über die die großen Staaten neben dem wirtschaftlichen auch den politischen Einfl uss ausüben können. Oft vermindern die multinationalen Unternehmen und die internationalen Organisationen die politische Macht eines Staates. Anstelle der nationalen Werte, werden die Standardwerte für die ganze Welt aufgedrängt. Das stellt einen Angriff auf die Verschiedenartigkeit der Welt dar, bzw. es ist die Uniformierung der Gesellschaft.
Die nationalen Wirtschaften werden statt produktions- immer mehr konsumorientiert. Kleine Länder machen sich Gedanken über die Sinnlosigkeit eigener Produktionsbetrieben, wenn schon alles irgendwo anders produziert wird und vernachlässigen dabei ihre eigenen Fachleute und eigene Ideen. Die ganzen Nationen übergeben sich solchem Denken und statt sich als schöpfende Gesellschaft zu entwickeln, verwandeln sie sich unumgänglich in die Konsumgesellschaften. Auf diese Weise helfen sie den großen Produktionsländern, ihr Ziel zu erreichen, je mehr Weltmarkt zu erobern, je mehr Profi t erzielen und dabei noch ein armes Land zu schaffen, das sie später mit allen verfügbaren Mitteln noch ärmer machen. Mit jedem Tag sind wir dessen bewusster, dass die arme Welt immer ärmer und die reiche Welt immer reicher wird. Und keiner unternimmt etwas dagegen, um dieses aufzuhalten.

Ljiljana Croce508
Wer stellt sich eigentlich die Frage, wie weit die Grenze der Bereicherung ist. Auch hier wird die Natur durch die Globalisierung vernachlässigt – der menschliche Körper, sowie auch der tierische wird bis zu der Grenze der Sättigung verseht.
Die freie Bewegung der Produktionsfaktoren durch die Welt ermöglicht den Spekulanten, in den billigsten Teilen der Welt zu produzieren, um die Produkte dann in den anderen Teilen der Welt mit bestem Gewinn zu verkaufen und sich den Verdienst so zu maximalisieren. Der Liberalismus hat mit sich den Marktfundamentalismus gebracht.
Die Naturressourcen der Welt werden auf solche Weise benutzt, dass dabei nicht die Bedürfnisse aller Menschen beachtet werden, insbesondere nicht die der kommenden Generationen. Sorgenerregend ist die Verlegung von Abfall und veralterten Technologien in unentwickelte Länder.
Die Reichen zeigen viel Unmenschlichkeit und all dies im Namen des Wirtschaftswachstums. Die Rohstoffpreise aus den armen Ländern werden gesenkt. Die Missverhältnisse und Ungerechtigkeiten werden immer tiefer, die echte Demokratie gibt es nicht mehr, es kommt zur Anarchie in Form von Armut, Kriminal, Krankheit vor. Die Menschen hungern nicht deswegen, weil es in der Welt keine Nahrung gibt, sondern weil sie keine Zahlungsmittel haben. Der Hunger erscheint auch dann, wenn Lager voll mit Nahrung sind. Bringt die bereits hergestellte Nahrung keinen Verdienst, lässt man sie lieber verfaulen. Es geschieht auch, dass auch diejenigen hungern, die diese Nahrung unter schweren und ungenügend bezahlten Bedingungen hergestellt haben. Trotz dem Hunger wird der Wachstum der Einwohnerzahl in den armen Ländern, bzw. die Senkung der Einwohnerzahl in den reichen Ländern erwartet.
In letzter Zeit kann man merken, dass die armen Länder immer mehr die Zufl ucht für Terroristen anbieten.
“In der Globalisierung wird ein Staat zu klein, um die großen Probleme lösen zu können, und er wird zu groß, um die kleinen lösen zu können“ – Daniel Bell
Ist die Globalisierung eine neue Form der Kolonialisierung?
1.2. Globalisierung – Wirtschaft
Die heutige globale Wirtschaft zeigt immer mehr Neigung zur neoliberalen Ordnung und entwickelt sich auf dem Weg: Nordamerika – Europäische Union – Ostasien. Dabei werden die weniger entwickelten Länder zur Quelle billiger Arbeitskräfte. Die Mobilität des Kapitals und der Arbeitskräfte entspricht den internationalen Maßstäben. In den Produktionszonen für Export ( IPZ ) wird die Ware für die führenden Weltkörperschaften hergestellt.

ANTIGLOBALISIERUNG DIE ANDERE GLOBALISIERUNG 509
Die zwei größten Länder der Welt - China und Indien (sie bilden ein Drittel der Weltbevölkerung) öffnen ihre Märkte mit dem Ziel, den Lebensstandard seiner Bürger zu verbessern.
In Kroatien könnte man manche Geschehnisse in der Wirtschaft, wie z.B. den Ausverkauf der nationalen Werte und die Verschuldung, mit dem Einfl uss der Globalisierung verbinden. Über die Verschuldung hinaus, produzieren wir immer weniger und kaufen alles ein, was die anderen produzieren.
1.3. Neoklassische Wirtschaftstheorie – das neoliberale Konzept des Kapitalismus
Das neoliberale Konzept des Kapitalismus beruht auf der Tatsache, dass alle Menschen im Grunde genommen, rationale und egoistische Individuen sind, die danach streben, ihren materiellen Wohlstand zu maximalisieren und denken erst danach ( oder nicht ) an die Gesellschaft, der sie gehören. Durch die Orientierung auf das Ratio des Individuellen und nicht an die Gesellschaft erzielt sich die bessere Wirtschaftseffi zienz. Für den Individuellen ist es nicht nur gestattet, sondern es wird sogar erwünscht, sich egoistisch zu benehmen, d. h. in allen Bereichen je größeren Eigennutz zu erzielen. Die Unternehmer haben auf diese Weise nur ein primäres Ziel und dieses Ziel ist der Eigennutz.
Die Wirtschaft ist konsumorientiert. Die Kultur des Gebens ist vernachlässigt. Es entwickelt sich nur die Konsum- und die Vermögensgesellschaft. Der Marktfundamentalismus ist der einzige Entwicklungsweg. In der Wirtschaftswissenschaft gewinnt die individualistische Sichtart die Oberhand.
Den moderne Neoliberalismus betrachtet Prof. Kulić als Neodarwinismus, Überleben nach den Gesetzen und Rechten des Stärkeren, nach den Regeln des Lebensspiels.
1.4. Bretton-Wood-Zwillinge, WTO und KörperschaftenIn Bretton Woods, in den USA, wird 1944 das Internationale Währungsfond
(IWF) und die Weltbank mit dem Ziel gegründet, die internationalen Zahlungen und Strömungen von Waren und Kapital zu kontrollieren.
IWF und die Weltbank befürworten den Standpunkt, dass der einzige Entwicklungsweg für die Armen vollständiges Öffnen ihrer Märkte ist. Dieses halten jedoch viele für unrichtig. Besonders bestehen sie auf der Privatisierung von öffentlichen Unternehmen. Sie handeln nach den Bedürfnissen der Länder ihrer Hauptaktieninhaber. Es werden ihnen an Demokratie und Transparenz fehlen, Ausgleich von allen, ohne Rücksicht auf die Unterschiede, Verursachen von Finanzkrisen anstatt ihrer Bekämpfung, der neoliberale Prozess bei dem Treffen von

Ljiljana Croce510
Entscheidungen, die für Öffentlichkeit geschlossen gehaltene Türen, Missbeachten der Opponenten, fehlende Neigung zu lokalen Programmen, vorgeworfen.
In ihrem Verhältnis zu manchen Nationen benehmen sie sich wie übernationale Institutionen. Manche Regierungen sind nur Provinzbüros dieser Weltinstitutionen geworden (es wird das Beispiel von den armen Ländern in Afrika aufgeführt).
Mit ihrem Benehmen lassen sie die Wirtschaft der Gewalt ohne Recht auf Auswahl und Verschiedenheit zu. Die Kritiken der Länder, die Nutzer der IWF-Arrangements sind, ignorieren sie vollständig.
Die Verschuldungen der Länder in der Entwicklung wachsen progressiv an. Die Restrukturierung der Schulden bedeutet für die entwickelnden Länder eigentlich eine Lockspeise zur neuen Verschuldung unter bestimmten Bedingungen, die als “strukturelle Anpassungsprogramme” bekannt sind, mit denen diese Institutionen den westlichen Körperschaften ermöglicht haben, die Wirtschaft in diesen Ländern, ihr Finanz- und Bankensystem und die Kontrolle von Naturrohstoffen und Produktion, zu übernehmen.
Im Jahr 1947 wurde durch die Gründung von GATT der Zollschutz gemindert und die Barrieren für den internationalen Handel wurden aufgehoben, Damit wurde der internationale Warenhandel zwischen den Mitgliedländern GATT liberalisiert. Anstelle von GATT wird im Jahr 1995 WTO gegründet, mit der Aufgabe, den internationalen Handel zu regulieren. WTO ist heute, mit ihren 134 Mitgliedsländern, darunter die wichtigsten Kanada, Japan, die USA und EU, und den 33 Ländern mit Beobachterstatus, die mächtigste Weltorganisation.
IWF, die Weltbank und WTO sind Gegenstand der öffentlichen Kritik. Es werden immer lauter die Meinungen geäußert, dass es die neue Weltregierung ist, die von NIEMANDEN gewählt wurde.
Die globalen Körperschaften oder Verwalter der Welt, wie sie von manchen genannt werden, haben von der Globalisierung den größten Nutzen. Manche unter ihnen werden bedeutender und mächtiger als die demokratisch gewählte Regierungen. Jedoch, die Körperschaften hätten die Grenze der Nationalstaaten nicht einmal überschritten, wenn dies von denselben Staaten nicht gestattet und unterstützt worden wäre. Manche lokale Regierungen sind die verlängerte Arme der Körperschaften.
Die Körperschaften produzieren da wo die Produktionskosten am niedrigsten sind, sie melden den Profi t in dem Land an, wo die Steuer am niedrigsten ist, und verkaufen da wo sie die höchsten Preise erreichen.
Für die Verwirklichung ihrer eigenen Ziele bedienen sie sich mit allen möglichen Mitteln, ohne Rücksicht auf den globalen Schaden zu nehmen, den sie mit ihrer Präsenz in irgendeinem Teil der Welt, anrichten. Nirgends übereinstimmen sie mit den

ANTIGLOBALISIERUNG DIE ANDERE GLOBALISIERUNG 511
lokalen Bedürfnissen. Ihr Ziel ist natürlich, je größeren Profi t anhand je niedrigeren Kosten zu erzielen, und ihre Mittel sind skrupellos, wie z.B. die Beschäftigung von Kindern in der Dritten Welt, der Arbeitstag in der Dauer von 12-16 Stunden, die zum Überleben ungenügende Tageslöhne, unmenschliche Arbeitsbedingungen, lästige Routinearbeit die keine spezielle Kenntnisse erfordert, Arbeitsverletzungsrisikos, schlechte hygienische Arbeitsbedingungen... Also, im Mittelpunkt solcher Unternehmen stehen Kapital und Profi t, keinesfalls der Mensch.
Falls sie auf lokale Missgunst stoßen, machen sie sich davon und ziehen dann in die für den Profi t günstigere Gebiete; dabei lassen sie hinter sich Probleme, die sie mit ihrer Ankunft verursacht haben, wie z.B. Verschmutzungsindustrie, das genetische Engineering und ähnliches.
Beim Aufdrängen ihrer globalen Produkte in der ganzen Welt bedienen sie sich mit globalen Promotions-Kampagnen, in denen sie ihre große Nichtloyalität zu Konkurrenz zeigen. Sie begegnen jedoch dabei auf die Unterstützung lokaler Regierungen und der von ihnen abhängigen Medien.
Manche Forschungen zeigen, dass die zehn größten transnationalen Körperschaften ( TNK ) größere Gesamteinnahmen als die 100 ärmsten Länder der Welt haben.
1.5. Globalisierung – Amerikanisierung
Die meisten multinationalen Gesellschaften haben ihren Sitz in den USA. Über diese ist es möglich, auf manchen Länder und ihre Regierungen Einfl uss auszuüben. Die Gehorchenden erhalten Belohnungen, meistens in Form von Kreditbewilligung, und die Ungehorchenden erhalten Sanktionen.
Die USA als Weltmacht tut was sie vorhat, ohne die internationale Gesellschaft Miteinzuschließen. Ein solches Beispiel ist der Krieg in Irak ohne Unterstützung und Genehmigung der UN, die Ablehnung der Unterzeichnung von dem Kyoto-Protokoll u. a.
Amerika trachtet danach, ihre Werte, wie die Realisierung des amerikanischem Traums durch eigene Bemühung und Einsatz vom Boden auf bis zu den Sternen zu kommen, anderen aufzudrängen, ohne dabei annehmen zu wollen, dass nicht alle dieselbe Startposition haben. Größere Chancen für die Realisierung des amerikanischen Traums haben die reicheren, während die Armen arm bleiben oder noch ärmer werden.
Der globale Gebrauch der englischen Sprache ermöglicht die Erweiterung der globalen (amerikanischen) Kultur. Das deklarierte Ziel der USA ist, die stellvertretende Position der Weltregierung für sich zu behalten.

Ljiljana Croce512
„Sie fragen sich, was für eine Rolle Amerika haben sollte? Ich sage, dass sie allein führen muss wenn das nötig ist und immer mit den anderen wenn das möglich ist, in eine sicherere, demokratischere und prosperitätsvollere Welt.“
(aus der Äußerung von Madeleine K. Albright am Globalen Forum der Journalisten 2000 Welthandelszentrum, New York, 24. April 2000)
1.6. Globalisierung – DefinitionenDas Wirtschaftssystem, dessen Motor des Kapitalismus den Ist-Profi t zu
maximalisieren ist (I. Wallerstein)
Die Institution des Welthandels (I. Wallerstein)
Unordnung und Chaos (Zygmunt Bauman)
Das wirtschaftliche, soziale, kulturelle und politische Wirken, das die Grenzen von nationalen Staaten übersteigt (Ulrich Beck)
Der Prozess, in dem Körperschaften Geld, Fabriken und Produkte mit noch größerer Geschwindigkeit bewegen auf der Suche nach billiger Arbeitskraft und Rohstoffen, und den Regierungen die bereit sind, Gesetze für den Schutz von Verbrauchern, Arbeitern und Natur zu vernachlässigen (M. Ritchie)
Das Laufband, das die Welt umkreist, während es noch mehr 3D (dirty, dangerous, diffi cult) Geschäfte produziert und vergrößert die Kluft zwischen den Reichen und den Armen (J.Feffer)
Ein Versuch, die Welt in einen großen Supermarkt umzuwandeln, wo man Indianer, Frauen, Kinder, Emigranten, Arbeiter, und sogar auch das ganze Land wie Mexiko vorfi ndet (der Lautsprecher von den aufgelehnten Zapatisten im Süden von Mexiko)
Phänomen mit dem überterritorialen Charakter (Scholte)
Der Prozess, der soziale Ungerechtigkeit anregt und verbreitet.
Der ökologisch unaufhaltbare Prozess.
Globalisierung ist der Krieg gegen das Lebende und das Leben, der Krieg gegen die Natur, mit dem Ziel, Profi t zu ziehen.( Prof. Dr. Slavko Kulić, 28.06.2003, Slobodna Dalmacija )
2. Antiglobalisierung oder die Andere Globalisierung
„Die Welt steht nicht zum Verkauf“

ANTIGLOBALISIERUNG DIE ANDERE GLOBALISIERUNG 513
Die Antiglobalisierungsbewegungen entstanden und entwickelten sich parallel mit der Entstehung und der Entwicklung der Globalisierung. Ihre Akteure wurden Antiglobalisten genannt, was diese aber verneinen und beharrlich behaupten, sie seien nicht die Gegner der Globalisierung. Sie sind für die Globalisierung, aber eine andere. Sie setzen sich für die Globalisierung der Freiheit und Toleranz, der Arbeiterrechte, der Akzeptanz von Verschiedenartigkeit, Globalisierung der ökologischen Standards ein. Sie wollen ein besseres Verhältnis zu den Menschen und der Natur. Sie versuchen die schlechten Seiten der Globalisierung zu ändern und aufzuhalten und die guten Seiten zu verbreiten und zu entwickeln.
Sie bestehen schon immer von verschiedenen organisierten Bewegungen und Vereinen, aus den einheimischen Stämmen, Völkern und Gesellschaften, Bauern- und Farmervereinen, Bewegungen für Frauenrechte, Arbeitergewerkschaften u. a. In der letzten Zeit beginnen auch die politischen Parteien, ihr Interesse für globale Probleme zu zeigen.
2.1. Wer sind die Aktivisten – die Antiglobalisten?
ONG ( non – governmental organizations ) oder Nichtregierungsvereine sind politisch unabhängige Organisationen. Sie sind Vermittler zwischen dem Lokalen und dem Globalen, und die besten Resultate werden erzielt, wenn es ihnen gelingt, mit den Regierungen und lokalen Autoritäten zusammenzuarbeiten. Sie kommunizieren erfolgreich untereinander von einem zum anderen Weltende.
WEF - World Economic Forum ( Das Weltwirtschaftsforum ) ist die unabhängige internationale Organisation, deren Aufgabe es ist, die bestehende Situation in der Welt zu verbessern. Es existiert seit 1970 mit seinem Sitz in Davos – der Schweiz. Das Forum bietet den Rahmen für die Zusammenarbeit der Weltleader mit dem Ziel, die globalen Fragen zu behandeln, und setzen sich somit für die globale Bürgerschaft ein. Auf dem Forum treffen sich die führenden Vertreter aus der Politik- und Wirtschaftswelt, um ihre Meinungen auszutauschen.
WSF - World Social Forum (Das Weltsozialforum) wurde im Jahr 2001 gegründet, im brasilianischen Porto Alegre, als Alternative zu der Versammlung der politischen Weltführer im schweizerischen Davos. Es kämpft um eine sozial gerechtere Welt unter dem Slogan „Die andere Welt ist möglich“. Sie widersetzen sich dem Neoliberalismus und der Welt, in der Kapital oder irgendeine andere Form von Imperialismus herrscht. Sie setzen sich für den Ausbau einer planetaren Gesellschaft ein, in deren Zentrum sich der Mensch befi ndet.
Friends of the Earth – entsteht in der USA Ende der 60-er Jahre, sie hat ihre Abzweige in vielen Staaten. Sie wirkt unter dem Slogan: „Denke global, tue lokal“.

Ljiljana Croce514
In Europa wurde sie im Jahr 1971 seitens Großbritannien gegründet.
Greenpeace – Die Organisation, die Kampagnen und Aktionen führt, um die ökologischen Weltprobleme der Öffentlichkeit vorzutragen. Sie wurde von den Kriegsgegnern und Naturschützern im kanadischem Vancouver 1970 gegründet.
Indymedia – Medien der neuen Bewegung. Es ist ein unabhängiges und profi tloses Medienzentrum. Sie gehen davon aus, dass die stärkste Waffe die Information ist. Sie wollen unabhängig von den klassischen Medien informieren. Sie meinen, dass am besten die Teilnehmer selbst informieren. Sie wurden für die Bedürfnisse des Protests gegen WTO in Seattle gegründet, den die Medien verfälscht darstellen wollten .
Indymedia Croatia – ist das unkommerzielle, demokratische Kollektiv unabhängiger kroatischer Medienarbeiter und -reporter das als lokale Einheit des Globalnetzes von Indymedia wirkt
Amnesty International – ist die unabhängige Nichtregierungsorganisation für Menschenrechtschutz. Sie wurde durch den englischen Rechtsanwalt Peter Benenson im Jahr 1961 in London gegründet.
Ya Basta – Die italienische SozialbewegungATTAC – Die französische und europäische SozialbewegungIn der Welt sind noch sehr viele Organisationen und Bewegungen tätig wie:International Forum for Globalization (IFG), Global Exchange, Globalise Resistance, Fifty Years is Enough, Black Block, Food not bombs, Ruckus society, Zapatisten,Tute Biance,Anarchistenfront von Zadar, und andere
2.2. Was fordern die Antiglobalisten? Wen halten sie für schuldig?
Die Antiglobalisten fordern ein besseres Verhältnis zur Umwelt und Wirtschaftsentwicklung, mehr Rücksicht auf die Natur, die Freiheit der Welthandelsdominierung Nein sagen zu dürfen, dass man weiß, wer die Spielregeln

ANTIGLOBALISIERUNG DIE ANDERE GLOBALISIERUNG 515
macht und zu wessen Schaden es getan wird, sie wollen Schuldenabschreibung mit der Begründung, dass die unverantwortlichen Regierungen ihrem Volk die Schulden gebracht haben, Handelsliberalisierung, größere Hilfe für die Entwicklungsländer, etc. Sie behaupten, dass die Reichen auf Kosten der Armen reich wurden.
Sie fordern Reformierung des IWF, der Weltbank, WTO, UN. Für sie ist selbst der Sinn der weiteren Existenz vom IWF und der Weltbank fraglich.
2.3. Manifestierungen, Proteste, Initiativen, Kampagnen
Seit Seattle 1999 ...
Der Protest in Seattle war weder groß noch massenhaft, dennoch ist er bedeutend, da er sich im Zentrum der Globalmacht der USA ( “Volk von Seattle” ) ereignet hat. Danach erfolgten auch weitere Proteste nacheinander, als eine Antwort der Globalisierung von unten auf die Globalisierung von oben.
Die Initiativen und Kampagnen der Antiglobalisten oder Alterglobalisten sind zahlreich. Sie sind alle auf die Aktionen die den Kampf gegen die negativen Einfl üsse der Globalisierung auf sich nehmen gerichtet. Sie werden die Globalisierung von unten genannt. Im Gegensatz dazu, die Globalisierung von oben wird von den Mächtigen durchgeführt, die von oben über das Schicksal der Welt entscheiden.
Manche Antiglobalisierungsproteste münden in Unruhen, und sie lenken dadurch in letzter Zeit die Aufmerksamkeit der Öffentlichkeit auf sich. Die Organisatoren solcher Unruhen richten einen Schaden den richtigen Befürwortern der anderen Globalisierung an.
Schlussfolgerung
Der Wirkungsweg in Richtung der Milderung von negativen Einfl üssen der Globalisierung auf das Leben auf der Erde ist eigentlich der Weg zur Existenz des Lebens auf der Erde. Der Mensch, wenn er durch sein Tun irgend etwas Lebendes auf der Erde gefährdet, soll dessen bewusst sein, dass er damit vor allem sich selbst gefährdet. Wir Menschen sind ein Teil der Natur und sind von ihr abhängig. Jeden Tag, jeder Mensch tauscht etwas mit der Natur aus, d. h. mit den Tieren, Pfl anzen, durch die Luft, Wasser, Land ... Wenn wir irgend etwas in der Natur gefährden, haben wir direkt dem Mensch geschadet.
Wir können nicht die Angst des Menschen vor manchen Krankheiten verneinen, die durch immer krankhaftere Tierarten verursacht werden, die Angst des Menschen vor der heutigen genetisch modifi zierten Nahrung, vor der Atmosphärenverschmutzung, vor der Beschädigung des Ozonmantels ...
Ljiljana Croce516
Wer denn und warum will die Natur „verbessern“? Die Antworten liegen überall um uns herum, und auch in den mit der genetisch modifi zierten Nahrung vollen Märkten. Es reicht völlig aus, sich selbst mal die Frage zu stellen, wem bringt es den Nutzen, und wem schadet solche Nahrung? Und wer weiß es noch überhaupt, außer dem Hersteller selbst, welche Nahrung ist nun genetisch modifi ziert?
Bibliographie
Klein, Naomi, No logo, V.B.Z., Zagreb, 2002.Ritzer, George, McDonaldisierung der Gesellschaft, Verlag Jesenski i Turk, Zagreb, 1999Milardović A., Globalisierung, Pan Liber, Osijek, 1999.Fox Jeremy, Chomsky und Globalisierung, Verlag Jesenski i Turk, Zagreb, 2001.Fromm, Erich, Haben oder sein, Naprijed, Zagreb,1986.Friedman, Thomas L., Lexus und Olive, Izvori, Zagreb, 2003. Srb V.; Matić B., Bankgeschäftsführung, Wirtschaftsfakultät, Osijek, 2003.Novak, B.: Finanzmarkt und -institutionen, Wirtschaftsfakultät, Osijek, 1999.
Internet-Seiten:www.world.bank http://fbc.binghamton.edu/commentr.htm http://www.usembassy.hr/tp/w000504.htm http://www.greenpeace.org/international/about http://www.forumsocialmundial.org.br www.indymedia.orghttp://croatia.indymedia.org/http://www.amnesty.org http://www.yabasta.it http://www.attac.org/indexde/index.html http://www.ifg.org/http://www.50years.org/