Embed Size (px)
Citation preview
INTERFERENCE MITIGATION IN 4G LTE-A
HETEROGENOUS NETWORKS
by
ROHAN NAG KUMMITHE
Presented to the Faculty of the Graduate School of
The University of Texas at Arlington in Partial Fulfillment
of the Requirements
for the Degree of
MASTER OF SCIENCE IN ELECTRICAL ENGINEERING
THE UNIVERSITY OF TEXAS AT ARLINGTON
December 2012

Copyright © by Rohan N Kummithe 2012
ii
Copyright © by Rohan N Kummithe 2012
All Rights Reserved

iii
Acknowledgements
It is with immense pleasure that I acknowledge the guidance of my professor Dr.
Qilian Liang for his continuous support during my thesis. His expertise, patience and
understanding have added considerable value to my graduate experience and have
made the research a very memorable and a knowledgeable experience.
I would also like to extend my appreciation to Dr. Shu-Shaw Wang who
introduced me to LTE, which gave me an invaluable insight into the present wireless
communications industry.
This is a perfect opportunity to thank my parents who have helped me overcome
many tough challenges and for showing immense trust in my abilities, without whom my
Master’s degree and the research would have been a distant possibility.
Last but never the less, I would like to thank all my friends who have supported
me during the course of my Master’s degree and thesis. Special thanks to Priyadarshini
who has been a constant source of strength and support.
December 11, 2012
iv
Abstract
INTERFERENCE MITIGATION IN 4G LTE-A
HETEROGENOUS NETWORKS
Rohan Nag Kummithe, M.S.
The University of Texas at Arlington, 2012
Supervising Professor: Qilian Liang
Long Term Evolution (LTE) complements 3G networks with high data rates, low
latency and a flat, IP-based architecture. It also allows operators to use a new and a
much wider spectrum when compared to the previous standards. To further enhance this
and to achieve the constraints set by the International Mobile Telecommunication-Union
(IMT-U), 3GPP has been working on various aspects of the LTE-Advance standard which
has been officially termed as 4G network.
Apart from the enhancements in the radio link, the next performance leap in
wireless networks will come from an evolved network topology. The concept is to improve
spectral efficiency per unit area. Using different combinations of femto cells, relays and
pico cells, heterogeneous networks can provide the optimal experience to the user.
The drawback to all this is that there will be severe interference between various
components in the heterogeneous networks. Furthermore, as the femtocells are user
deployed, the interference management schemes become even more important. These
interference mitigation techniques also need to counter the interference between network
components macrocell and femtocell in a heterogonous network. To counter the above
mentioned problems, to increase the throughput and to meet the data rates set by the
v
standard, technologies such as Carrier Aggregation (CA) and Coordinated Multipoint
transmission/reception (CoMP) have been defined.
In this thesis an implementation of the technologies CA and CoMP have been
proposed to target the performance of 4G networks. This has been implemented in a
macrocell-femtocell network for the downlink transmission. This coordination improves
the quality of the received signal and also increases the capacity of each user thus
increasing the capacity of the entire system.
vi
Table of Contents
Acknowledgements .............................................................................................................iii
Abstract .............................................................................................................................. iv
List of Acronyms ................................................................................................................. ix
List of Illustrations ..............................................................................................................xii
List of Tables .....................................................................................................................xiv
Chapter 1 Long Term Evolution .......................................................................................... 1
1.1 Introduction ............................................................................................................... 1
1.2 Requirements & Targets for the LTE ........................................................................ 2
1.3 System Performance Requirements......................................................................... 2
1.4 LTE System Architecture .......................................................................................... 3
1.5 Technologies Used ................................................................................................... 6
1.5.1 Antenna Technology - MIMO ............................................................................ 6
1.5.2 Air Interface - OFDM ......................................................................................... 9
Chapter 2 Long Term Evolution - Advanced ..................................................................... 11
2.1 Introduction ............................................................................................................. 11
2.2 Femtocells .............................................................................................................. 12
2.3 Carrier Aggregation ................................................................................................ 13
2.4 Co-Ordinated Multipoint Transmission/Reception .................................................. 15
2.4.1 Introduction ...................................................................................................... 15
2.4.2 The CoMP Architecture ................................................................................... 17
2.4.2.1 Centralized Architecture ........................................................................... 18
2.4.2.2 Distributed Architecture ............................................................................ 18
2.4.3 CoMP Schemes............................................................................................... 19
2.4.3.1 Coordinated Scheduling/Beamforming .................................................... 19
vii
2.4.3.2 Joint processing ....................................................................................... 20
Chapter 3 Femto Cells ...................................................................................................... 23
3.1 Introduction ............................................................................................................. 23
3.2 FemtoCell Architecture ........................................................................................... 24
3.3 Deployment of Femtocells & their Challenges ....................................................... 25
3.4 Industry Activity....................................................................................................... 27
3.5 Radio Issues for Femtocells ................................................................................... 27
Chapter 4 Interference Scenarios ..................................................................................... 29
4.1 Introduction ............................................................................................................. 29
4.1.1 Co-Layer Interference ..................................................................................... 29
4.1.2 Cross-Layer Interference ................................................................................. 31
Chapter 5 System Simulator ............................................................................................. 33
5.1 System Architecture ............................................................................................... 33
5.1.1 User Input Module: .......................................................................................... 34
5.1.2 Path loss Estimation Module: .......................................................................... 34
5.1.3 SINR Estimation Module: ................................................................................ 35
5.1.4 Capacity Calculation Module: .......................................................................... 35
5.1.5 User Output Module: ....................................................................................... 35
5.2 Analysis and Parameters ........................................................................................ 36
5.2.1 Path Loss Model .............................................................................................. 36
5.2.2 SINR Estimation .............................................................................................. 37
5.2.3 Throughput Calculation ................................................................................... 37
5.2.4 Using the Simulator ......................................................................................... 38
5.3 Frequency Reuse Schemes ................................................................................... 40
5.3.1 Proposed Frequency Reuse Scheme ............................................................. 41
viii
5.4 Implemented Algorithm ........................................................................................... 41
5.5 Parameters Considered .......................................................................................... 43
Chapter 6 Simulation & Results ........................................................................................ 44
6.1 Schemes Used ....................................................................................................... 44
6.1.1 Conventional Scheme ..................................................................................... 44
6.1.2 Proposed Scheme ........................................................................................... 44
6.1.2.1 Carrier Aggregation .................................................................................. 44
6.1.2.2 CA along with Co-Ordinated Multipoint Tx/Rx ......................................... 45
6.2 Topology Used........................................................................................................ 46
6.3 Results .................................................................................................................... 48
6.3.1 CDF of Throughput (bps) ................................................................................ 48
6.3.2 Throughput (bps) vs. Distance (m) .................................................................. 51
6.3.3 SNR (dB) vs. Throughput (bps) ....................................................................... 54
6.3.4 Bandwidth efficiency (�� .................................................................................. 56
Chapter 7 Conclusion and Futurework ............................................................................. 59
7.1 Conclusion .............................................................................................................. 59
7.2 Futurework .............................................................................................................. 60
References ........................................................................................................................ 61
Biographical Information ................................................................................................... 63
ix
List of Acronyms
3G Third Generation
3GPP Third Generation Partnership project
AMPS Advanced Mobile Phone Service
ARQ Automatic Repeat Request
BS Base Station
bps Bits per second
CAPEX Capital Expense
CA Carrier Aggregation
CDF Cumulative Distribution Function
CCU Cell Center User
CEU Cell Edge User
CCI Co-Channel Interference
CDMA Code Division Multiple Access
CoMP Coordinated MultiPoint transmission/reception
CP Control Plane
CS/CB Coordinated Scheduling / Coordinated Beamforming
CSG Closed Subscriber Group
DFT Discrete Fourier Transform
DL DownLink
eICIC Enhanced InterCell Interference Coordination
EPC Evolved Packet Core
E-UTRAN Evolved Universal Terrestrial Radio Access Network
FAP Femtocell Access Point
GGSN Gateway GPRS Support Node

x
GPRS General Packet Radio Service
GSM Global System for Mobile telephony
HeNB Home enhanced Node – Basestation
HSPA High Speed Packet Access
HSS Home Subscriber Service
ICI Inter-Cell Interference
IP Internet Protocol
ITU International Telecommunication Union
LTE Long Term Evolution
LTE - A LTE – Advanced
MIMO Multiple Input Multiple Output
MME Mobile Management Entity
MSC Mobile Switching Center
OFDM Orthogonal Frequency Division Multiplexing
PAPR Peak to Average power Ratio
PCRF Policy and Charging Rules Function
PDN Public Data Network
PDSCH Physical Downlink Shared Channel
P-GW PDN Gateway
PL Path Loss
PUSCH Physical Uplink Shared Channel
QoS Quality of Service
RAN Radio Access Network
RNC Radio Network Controller
SAE System Architecture Evolution
xi
SC-FDMA Single Carrier – Frequency Division Multiple Access
S-GW Serving Gateway
SINR Signal to Interference and Nose Ratio
UE User Equipment
UL UpLink
UMTS Universal Mobile Telecommunication System
xii
List of Illustrations
Fig 1-1 LTE Radio Access Network Architecture ................................................................ 4
Fig 1-2 LTE/SAE Architecture ............................................................................................. 5
Fig 1-3 Multiple Antenna Techniques ................................................................................. 7
Fig 2-1 Typical Femtocell .................................................................................................. 12
Fig 2-2 Carrier Aggregation .............................................................................................. 15
Fig 2-3 Illustration of CoMP .............................................................................................. 17
Fig 2-4 Co-Ordinated Scheduling/BeamForming .............................................................. 19
Fig 2-5 System model of two interfered users .................................................................. 20
Fig 2-6 Joint processing Techniques: Joint Transmission & Dynamic Cell Selection ...... 21
Fig 3-1 Comparison of cell sized for different cells ........................................................... 23
Fig 3-2 Simplified Diagram of LTE Femtocell Network ..................................................... 25
Fig 5-1 System Architecture .............................................................................................. 33
Fig 5-2 Analytical results of a sample macro user & a femto user ................................... 35
Fig 5-3 Initial Simulator Screen ......................................................................................... 38
Fig 5-4 Sample illustration after the deployment is completed ......................................... 40
Fig 6-1 Topology with 30 Femtocells ................................................................................ 47
Fig 6-2 Topology with 50 Femtocells ................................................................................ 47
Fig 6-3 CDF of Throughput (BW – 20MHz, Femtocells - 30)............................................ 48
Fig 6-4 CDF of Throughput (BW – 20MHz, Femtocells - 50)............................................ 49
Fig 6-5 CDF of Throughput (BW – 100MHz, Femtocells - 30).......................................... 49
Fig 6-6 CDF of Throughput (BW – 100MHz, Femtocells - 50).......................................... 50
Fig 6-7 Throughput vs. Distance (BW – 20MHz, Femtocells - 30) ................................... 51
Fig 6-8 Throughput vs. Distance (BW – 20MHz, Femtocells - 50) ................................... 52
Fig 6-9 Throughput vs. Distance (BW – 100MHz, Femtocells - 30 .................................. 52
xiii
Fig 6-10 Throughput vs. Distance (BW – 100MHz, Femtocells - 50) ............................... 53
Fig 6-11 SNR vs. Throughput (BW – 20MHz, Femtocells - 30) ........................................ 54
Fig 6-12 SNR vs. Throughput (BW – 20MHz, Femtocells - 50) ........................................ 54
Fig 6-13 SNR vs. Throughput (BW – 100MHz, Femtocells - 30) ...................................... 55
Fig 6-14 SNR vs. Throughput (BW – 100MHz, Femtocells - 50) ...................................... 55
Fig 6-15 Bandwidth Efficiency (BW – 20MHz, Femtocells - 30) ....................................... 56
Fig 6-16 Bandwidth Efficiency (BW – 20MHz, Femtocells – 50) ..................................... 57
Fig 6-17 Bandwidth Efficiency (BW – 100MHz, Femtocells - 30) ..................................... 57
Fig 6-18 Bandwidth Efficiency (BW – 100MHz, Femtocells - 50) ..................................... 58

xiv
List of Tables
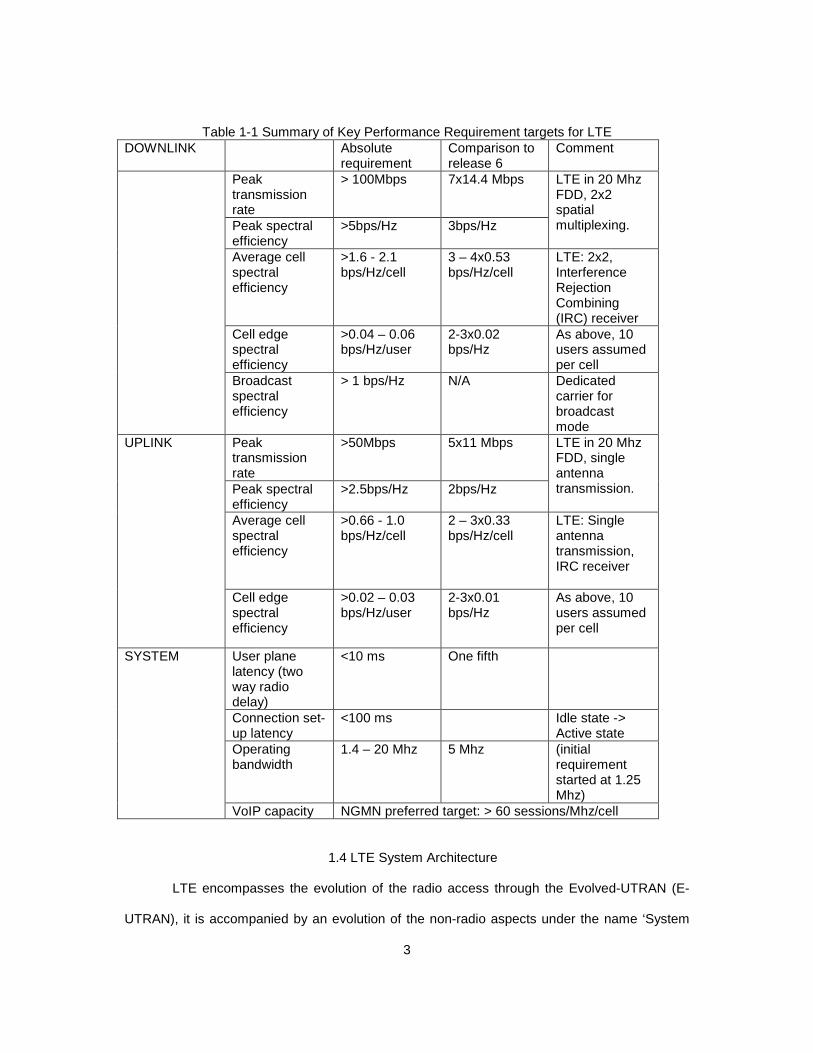
Table 1-1 Summary of Key Performance Requirement targets for LTE ............................. 3
Table 5-1 System Level Simulation Parameters ............................................................... 43
1
Chapter 1
Long Term Evolution
1.1 Introduction
High speeds, lightening connectivity & uninterrupted connection; these are the
requirements for every single user when asked about what they expect from a good data
connection. Adding to that, with the more than exponential growth of the Internet, network
suppliers have been asked to come up with something which meets all the above requirements.
Since the advent of the ‘Third Generation’ (3G) cellular technology a decade ago, users have
been promised a full mobile internet experience, which as of yet has not been completely
fulfilled. Long Term Evolution (LTE) is a cellular standard which goes a long way in fulfilling the
promise. The Long Term Evolution (LTE) of UMTS is just one of the latest steps in the
advancing series of mobile telecommunications systems. It is marketed as 4G-LTE which is a
standard for high-speed data and reduced latencies for the mobile phone users. LTE does not
satisfy the standard set by the International Telecommunication Union-Radio Communication
Sector (ITU-T), but, due to several other reasons, it has been declared as ‘4G’ (Fourth
Generation) by the ITU-T.
The 3rd Generation Partnership Project (3GPP) is currently the dominant standards
development group for mobile radio systems. Within 3GPP, three multiple access techniques
are evident: GSM/GPRS/EDGE which is marked as a ‘Second Generation’ evolution track. This
has given way to the ‘Third Generation’ mainly known as the UMTS family which paved the way
for Code Division Multiple Access (CDMA) technology and became known as Wideband CDMA
or simply WCDMA. Finally, LTE has adopted Orthogonal Frequency-Division Multiplexing
(OFDM), which is the access technology dominating the latest evolution of all the mobile
standards.
The goal of LTE is to increase data rates, reduce the latencies and to increase the
capacity of wireless data networks using various wireless technologies which were developed in
2
the recent past. It also intends to redesign and simplify the network architecture to an IP based
system. A large amount of work is aimed at simplifying the architecture from the existing UMTS
circuit + packet switching combined network, to an all IP flat based architecture. The expected
downlink speeds are up to 100Mbps with latencies of less than 10ms. The evolution to an all IP
based architecture promises significant cost saving and network efficiencies, while end to end
usage of IP enables a multiplicity of services such as voice, video, data and gaming to be
flexibly deployed under a single network architecture.
1.2 Requirements & Targets for the LTE
Discussion of the key requirements for the new LTE system led to the creation of a formal
‘Study Item’ in 3GPP with the specific aim of ‘evolving’ the 3GPP radio access technology to
ensure competitiveness over a 10-year time frame. These requirements can be summarized as:
• Reduced delays, in terms of both connection establishment & transmission latency
• Increased user data rates
• Increased cell-edge bit-rate, for uniformity of service protection;
• Reduced cost per bit, implying improved spectral efficiency;
• Greater flexibility of spectrum usage, in both new and pre-existing bands
• Simplified network architecture
• Seamless mobility, including between different radio-access technologies
• Reasonable power consumption for the mobile terminal
To address these objectives, the LTE system design covers both the radio interface and
the radio network architecture.
1.3 System Performance Requirements
Improved system performance compared to existing systems is one of the main
requirements from network operators, to ensure the competiveness of LTE. The table below
summarizes the main performance requirements to which the first release of LTE was designed.
3
Table 1-1 Summary of Key Performance Requirement targets for LTE DOWNLINK Absolute
requirement Comparison to release 6
Comment
Peak transmission rate
> 100Mbps 7x14.4 Mbps LTE in 20 Mhz FDD, 2x2 spatial multiplexing. Peak spectral
efficiency >5bps/Hz 3bps/Hz
Average cell spectral efficiency
>1.6 - 2.1 bps/Hz/cell
3 – 4x0.53 bps/Hz/cell
LTE: 2x2, Interference Rejection Combining (IRC) receiver
Cell edge spectral efficiency
>0.04 – 0.06 bps/Hz/user
2-3x0.02 bps/Hz
As above, 10 users assumed per cell
Broadcast spectral efficiency
> 1 bps/Hz N/A Dedicated carrier for broadcast mode
UPLINK Peak transmission rate
>50Mbps 5x11 Mbps LTE in 20 Mhz FDD, single antenna transmission. Peak spectral
efficiency >2.5bps/Hz 2bps/Hz
Average cell spectral efficiency
>0.66 - 1.0 bps/Hz/cell
2 – 3x0.33 bps/Hz/cell
LTE: Single antenna transmission, IRC receiver
Cell edge spectral efficiency
>0.02 – 0.03 bps/Hz/user
2-3x0.01 bps/Hz
As above, 10 users assumed per cell
SYSTEM User plane latency (two way radio delay)
<10 ms One fifth
Connection set-up latency
<100 ms Idle state -> Active state
Operating bandwidth
1.4 – 20 Mhz 5 Mhz (initial requirement started at 1.25 Mhz)
VoIP capacity NGMN preferred target: > 60 sessions/Mhz/cell
1.4 LTE System Architecture
LTE encompasses the evolution of the radio access through the Evolved-UTRAN (E-
UTRAN), it is accompanied by an evolution of the non-radio aspects under the name ‘System
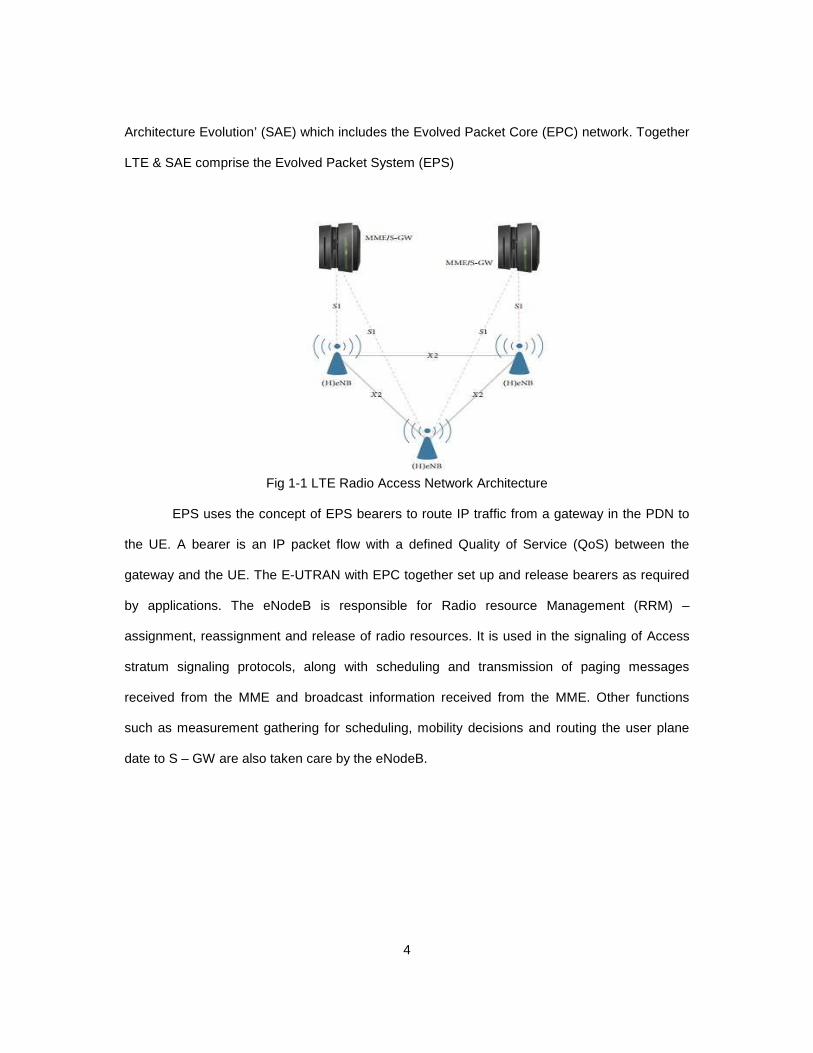
4
Architecture Evolution’ (SAE) which includes the Evolved Packet Core (EPC) network. Together
LTE & SAE comprise the Evolved Packet System (EPS)
Fig 1-1 LTE Radio Access Network Architecture
EPS uses the concept of EPS bearers to route IP traffic from a gateway in the PDN to
the UE. A bearer is an IP packet flow with a defined Quality of Service (QoS) between the
gateway and the UE. The E-UTRAN with EPC together set up and release bearers as required
by applications. The eNodeB is responsible for Radio resource Management (RRM) –
assignment, reassignment and release of radio resources. It is used in the signaling of Access
stratum signaling protocols, along with scheduling and transmission of paging messages
received from the MME and broadcast information received from the MME. Other functions
such as measurement gathering for scheduling, mobility decisions and routing the user plane
date to S – GW are also taken care by the eNodeB.
5
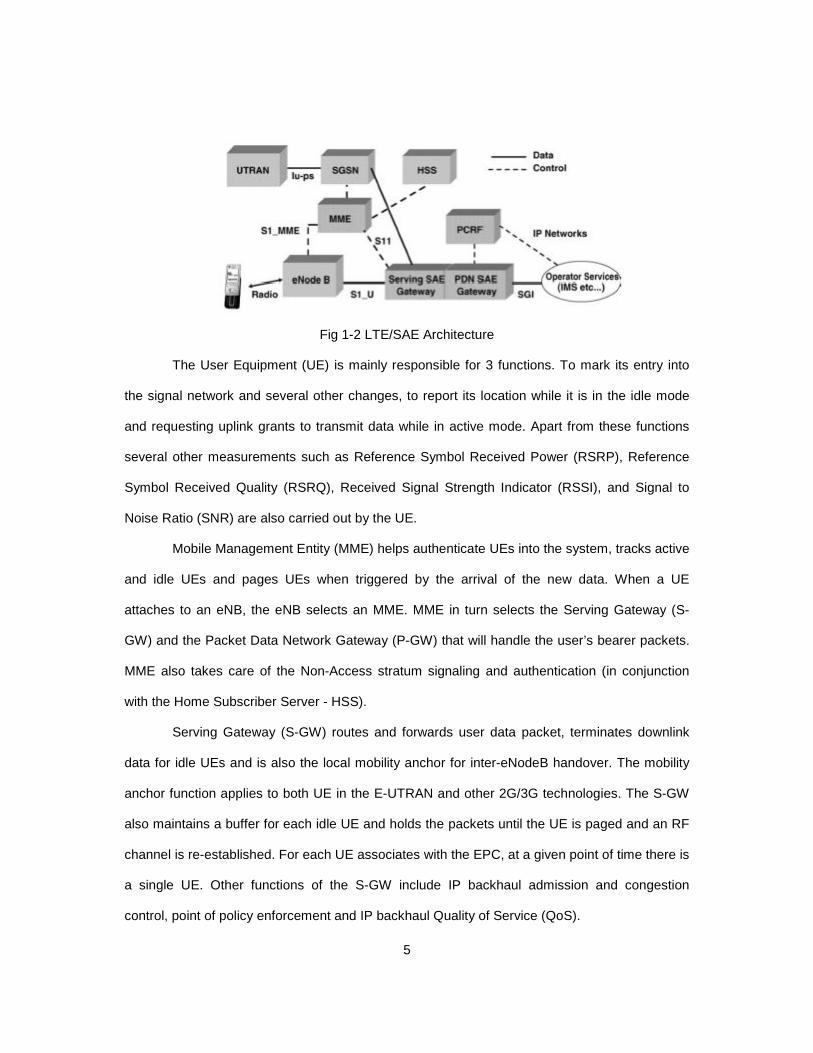
Fig 1-2 LTE/SAE Architecture
The User Equipment (UE) is mainly responsible for 3 functions. To mark its entry into
the signal network and several other changes, to report its location while it is in the idle mode
and requesting uplink grants to transmit data while in active mode. Apart from these functions
several other measurements such as Reference Symbol Received Power (RSRP), Reference
Symbol Received Quality (RSRQ), Received Signal Strength Indicator (RSSI), and Signal to
Noise Ratio (SNR) are also carried out by the UE.
Mobile Management Entity (MME) helps authenticate UEs into the system, tracks active
and idle UEs and pages UEs when triggered by the arrival of the new data. When a UE
attaches to an eNB, the eNB selects an MME. MME in turn selects the Serving Gateway (S-
GW) and the Packet Data Network Gateway (P-GW) that will handle the user’s bearer packets.
MME also takes care of the Non-Access stratum signaling and authentication (in conjunction
with the Home Subscriber Server - HSS).
Serving Gateway (S-GW) routes and forwards user data packet, terminates downlink
data for idle UEs and is also the local mobility anchor for inter-eNodeB handover. The mobility
anchor function applies to both UE in the E-UTRAN and other 2G/3G technologies. The S-GW
also maintains a buffer for each idle UE and holds the packets until the UE is paged and an RF
channel is re-established. For each UE associates with the EPC, at a given point of time there is
a single UE. Other functions of the S-GW include IP backhaul admission and congestion
control, point of policy enforcement and IP backhaul Quality of Service (QoS).
6
Packet Gateway (P-GW) is responsible for the UE Internet Protocol (IP) address
assignment and provides connectivity to the external packet data networks. The P-GW provides
charging (billing) support, packet filtering/screening, policy enforcement and lawful intercept. If a
UE is accessing multiple packet data networks, it may have connectivity to more than 1 P-GW.
Home Subscriber Server (HSS) is the master database that contains the UE profiles
and authentication data used by the MME for authenticating and authorizing UEs. It also stores
the location information of the UE which is used for user mobility and inter-technology
handovers. The HSS communicates with the MME using Diameter protocol.
Policy and Charging Rules Function (PCRF) creates rules for setting policy and
charging rules for the UE. It provides network control for service data flow detection, gating,
QoS authorization and flow based charging. It applies security procedures, as required by the
operator, before accepting service information. Decides how a certain service data flow will be
treated in the P-GW and ensures that the P-GW user plane traffic mapping and treatment
matches the user’s subscription profile.
Serving GPRS (General Packet Radio System) Support Node (SGSN) is responsible
for the delivery of data packets to and from UEs within its geographical service area. The SGSN
provides the interfaces between the MME and S-GW in the Evolved Packet Core (EPC).
1.5 Technologies Used
1.5.1 Antenna Technology - MIMO
The value of multiple antenna systems as a means to improve communications was
recognized in the very early ages of wireless communications. However, most of the scientific
progress has happened only in the last two decades with MIMO being a key milestone.
While traditional wireless communications (Single-Input Single-Output (SISO)) exploit
the time or frequency domain pre-processing and decoding of the transmitted and received data
respectively, the use of additional antenna elements at either the eNodeB or UE (User
Equipment) side opens up an extra spatial dimension to signal decoding and detection. Space-
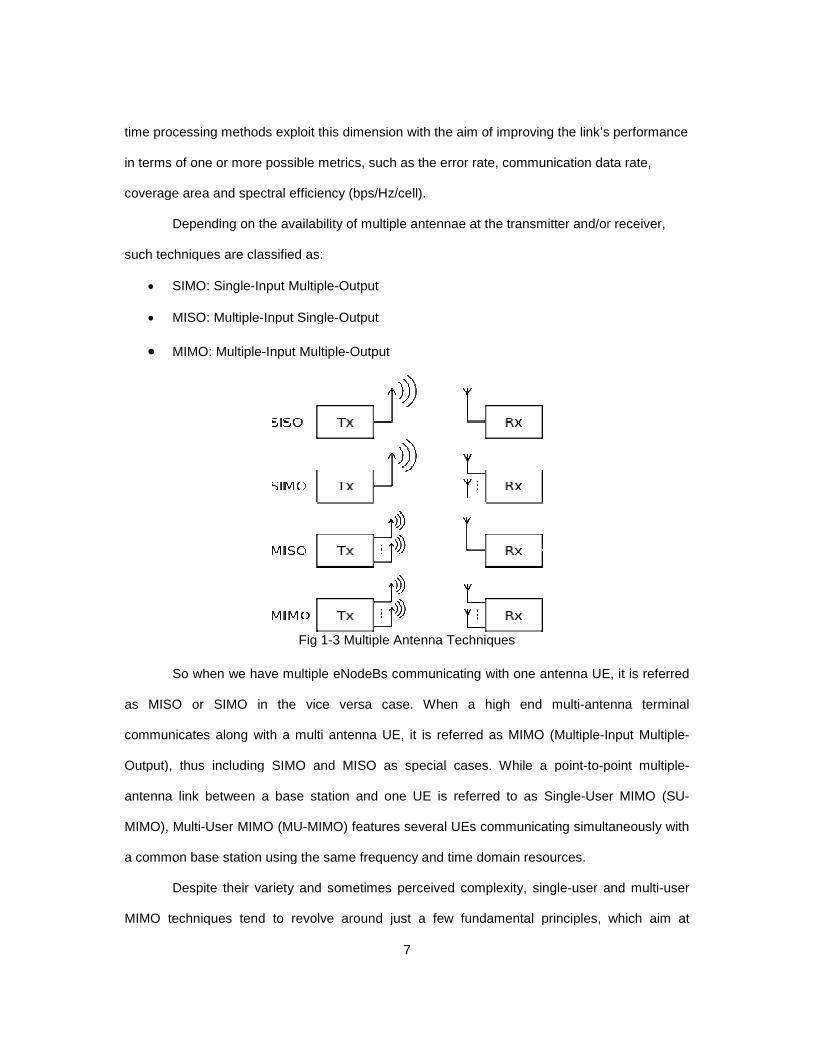
time processing methods exploit this dimension with the aim of improving the link’s performance
in terms of one or more possible metrics, such as the error rate, communication data rate,
coverage area and spectral eff
Depending on the availability of multiple antennae
such techniques are classified as:
• SIMO: Single-Input Multiple
• MISO: Multiple-Input Single
• MIMO: Multiple-Input Multiple
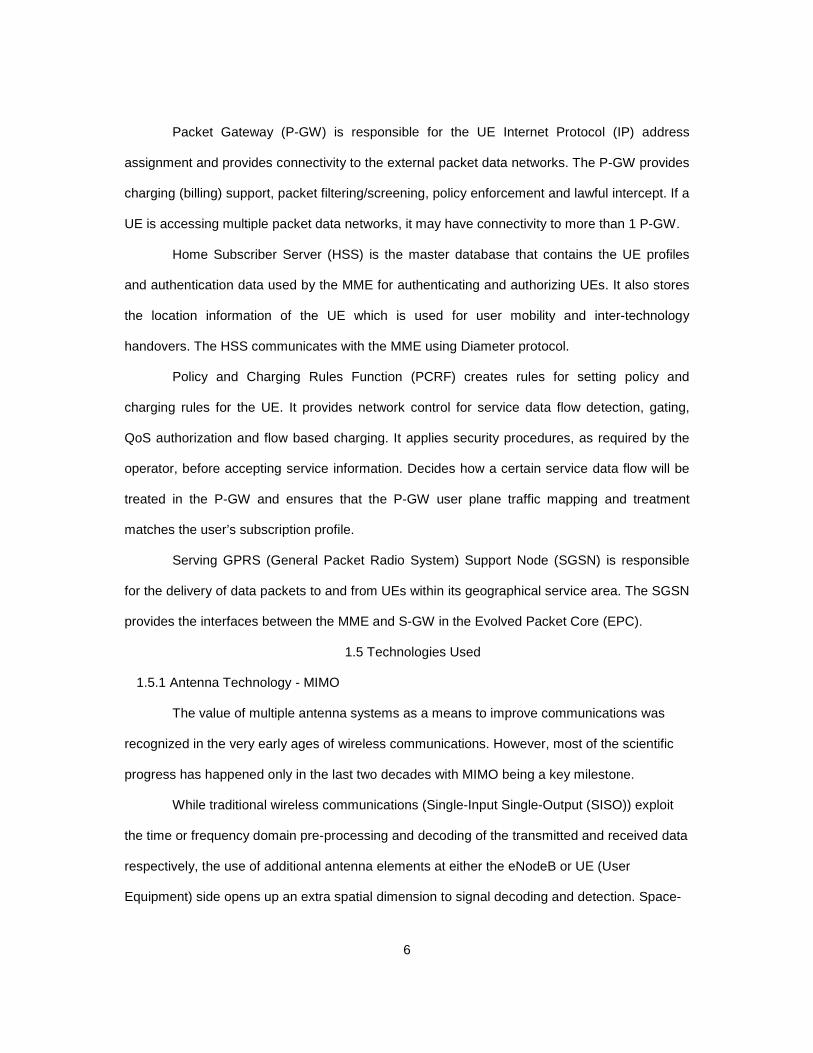
Fig
So when we have multiple eNodeBs communicating with one antenna UE, it is referred
as MISO or SIMO in the vice versa case. When a high end multi
communicates along with a multi antenna UE
Output), thus including SIMO and MISO as special cases. While a point
antenna link between a base station and one UE is referred to as Single
MIMO), Multi-User MIMO (MU-
a common base station using the same frequency and time domain resources.
Despite their variety and sometimes perceived complexity, single
MIMO techniques tend to revolve around just a few fundamental principles, which aim at
7
time processing methods exploit this dimension with the aim of improving the link’s performance
in terms of one or more possible metrics, such as the error rate, communication data rate,
coverage area and spectral efficiency (bps/Hz/cell).
vailability of multiple antennae at the transmitter and/or receiver,
such techniques are classified as:
Input Multiple-Output
Input Single-Output
Input Multiple-Output
Fig 1-3 Multiple Antenna Techniques
So when we have multiple eNodeBs communicating with one antenna UE, it is referred
as MISO or SIMO in the vice versa case. When a high end multi-antenna terminal
multi antenna UE, it is referred as MIMO (Multiple-Input Multiple
Output), thus including SIMO and MISO as special cases. While a point-to-point multiple
antenna link between a base station and one UE is referred to as Single-User MIMO (SU
-MIMO) features several UEs communicating simultaneously with
a common base station using the same frequency and time domain resources.
Despite their variety and sometimes perceived complexity, single-user and multi
iques tend to revolve around just a few fundamental principles, which aim at
time processing methods exploit this dimension with the aim of improving the link’s performance
in terms of one or more possible metrics, such as the error rate, communication data rate,
at the transmitter and/or receiver,
So when we have multiple eNodeBs communicating with one antenna UE, it is referred
antenna terminal
Input Multiple-
point multiple-
User MIMO (SU-
MIMO) features several UEs communicating simultaneously with
user and multi-user
iques tend to revolve around just a few fundamental principles, which aim at
8
leveraging some key properties of multi-antenna radio propagation channels. The three
advantages associated with such channels are Diversity gain, Array gain and Spatial
multiplexing gain.
Diversity gain corresponds to the mitigation of the effect of multipath fading by means of
transmitting or receiving over multiple antennae at which the fading is sufficiently de-correlated.
It is typically expressed in terms of an order, referring either to the number of effective
independent diversity branches or to the slope of the bit error rate curve as a function of the
Signal-to-Noise Ratio (SNR). While diversity gain is fundamentally related to the improvement of
the statistics of instantaneous SNR in a fading channel, array gain and multiplexing gain are of
a different nature. Array gain corresponds to a spatial version of a well-known matched-filter
gain in time-domain receivers, while multiplexing gain refers to the ability to send multiple data
streams in parallel and to separate them on the basis of spatial signature.
1.5.1.1 MIMO signal model
Let Y be a matrix of size N x T denoting the set of (possibly pre-coded) signals being
transmitted from N distinct antennae over T symbol durations, where T is a parameter of the
MIMO algorithm. Thus the ��� row of Y corresponds to the signal emitted from the ��� transmit
antenna. Let H denote the M x N channel matrix modeling the propagation effects from each of
the N transmit antennas to any one of M receive antennas, over an arbitrary subcarrier. We
assume H to be invariant over T symbol durations. Then the M x T signal R received over T
symbol durations over the subcarrier can be conveniently written as
R = HY + N,
where N is the additive noise matrix of dimension M x T over all M receiving antennae. We will
use �� to denote the ��� column of H, which will be referred to as the ‘receive’ spatial signature
of the ��� transmitting antenna. Likewise the �� row of H can be termed as the spatial signature
of the �� receiving antenna.
9
1.5.2 Air Interface - OFDM
The choice of an appropriate modulation and multiple-access technique for mobile
wireless data communications is critical to achieving good system performance. In particular,
typical mobile radio channels tend to be time variant and dispersive, so this has generated
interest in multi-carrier modulation.
Orthogonal Frequency Division Multiplexing (OFDM) is a special case of multi-carrier
transmission which is highly attractive for implementation. In OFDM, the non-frequency
selective narrowband sub-channels into which the frequency-selective wideband channels are
divided are overlapping but orthogonal. This avoids the need to separate the carriers by means
of guard bands, and therefore makes OFDM highly spectrally efficient. The spacing between the
sub-channels in OFDM is such that they can be perfectly separated at the receiver. This allows
for a low-complexity receiver implementation, which makes OFDM attractive for high-rate
mobile data transmission such as the LTE downlink. The LTE downlink combines OFDM with
channel coding and Hybrid Automatic Repeat reQuest (HARQ) to overcome deep fading which
may be encountered on the individual sub channels.
In OFDM, the high-rate stream of data symbols is first serial-to-parallel converted for
modulation onto M parallel subcarriers. This increases the symbol duration on each subcarrier
by a factor of approximately M, such that it becomes significantly longer than the channel delay
spread. This operation has an important advantage of requiring a much less complex
equalization procedure in the receiver, under the assumption that the time-varying channel
impulse response remains substantially constant during the transmission of each modulated
OFDM symbol.
A key operation in the generation of an OFDM signal is the creation of a guard period at
the beginning of each OFDM symbol to eliminate the remaining impact of ISI caused by
multipath propagation. The guard period is obtained by adding a Cyclic Prefix (CP) at the
10
beginning of the symbol. The CP is generated by duplicating the last G samples of the IFFT
output and appending them at the beginning of the respective symbol.
To avoid ISI completely, the CP length G must be chosen to be longer than the longest
channel impulse response to be supported. The CP converts the linear convolution of the
channel into a circular one which is suitable for DFT processing. The output of the IFFT is then
Parallel-to-Serial P/S converted for transmission through the frequency-selective channel. At the
receiver, the reverse operations are performed to demodulate the OFDM signal.
11
Chapter 2
Long Term Evolution - Advanced
2.1 Introduction
LTE-Advanced is intended to support further evolution of LTE and to establish E-
UTRAN as an IMT-Advanced technology. LTE-A also known as LTE release 10 is set to provide
higher bitrates in a cost efficient way and at the same time also focus on higher capacity:
• Increased peak data rate DL 3Gbps, UL 1.5Gbps
• Increased number of simultaneously active subscribers
• Improved performance and higher spectral efficiency
• Worldwide functionality and roaming
• Compatibility of services
• Inter working with other radio access systems
To achieve these goals, several enhancements are being considered. At the physical
layer, LTE is expected to provide substantial improvement in peak, average and cell-edge
spectral efficiencies, under the assumption of 8x8 antenna configuration in the downlink and
4x4 in the uplink. Under the same assumptions, peak spectral efficiency of 30 and 15bps/Hz
should be met for the downlink and uplink respectively. Some of the physical layer
enhancement techniques are Carrier Aggregation, Co-Ordinated Multipoint, Relays, uplink and
downlink spatial multiplexing up to 4 and 8 transmit antennae respectively.
Small cells such as picocells and femtocells bring the network closer to users and
provide a big leap in performance. But LTE-Advanced optimizes small cell performance through
features such as ‘Range Expansion’ to make the leap even more significant. Simply adding
small cells to a network only benefits users close to the cell, but LTE-A enhances the users
experience for all the users including those on the cell edge with higher data rates, even when
the small cells are not positioned in optimal locations. Additionally, the advanced receivers allow
devices to discover small cells early and further increase performance of range expansion.
12
To achieve the requirements set by LTE-A, support for wider transmission bandwidths,
other than the 20Mhz bandwidth set aside for LTE specified in 3GPP release 8/9, is required.
The preferred solution to this is Carrier Aggregation (CA). It is one of the most distinct features
of LTE-A. CA allows the expansion of effective bandwidth delivered to a user terminal through
concurrent utilization of radio resources across multiple carriers. Multiple component carriers
are then aggregated to form a larger transmission bandwidth. LTE-A can aggregate up to 5
carriers (up to 100MHz) to increase user data rates and capacity for busty applications. The
Aggregation(s) when combined with higher order MIMO can provide extremely high data rates.
2.2 Femtocells
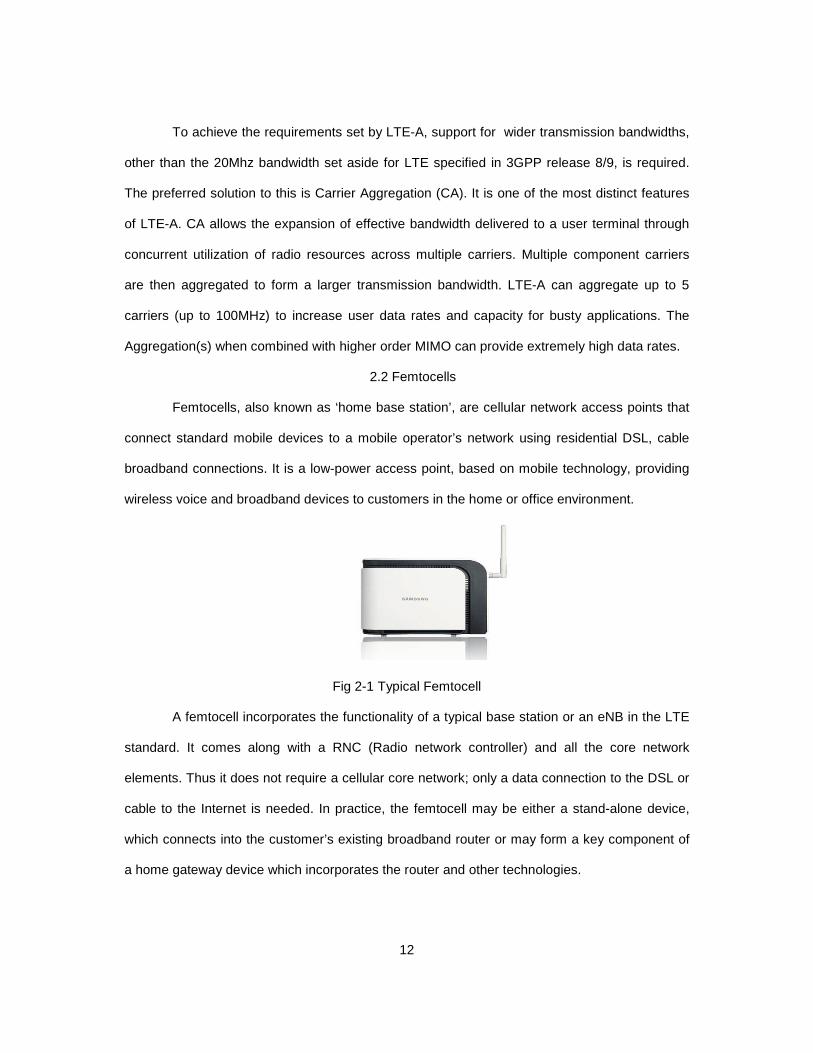
Femtocells, also known as ‘home base station’, are cellular network access points that
connect standard mobile devices to a mobile operator’s network using residential DSL, cable
broadband connections. It is a low-power access point, based on mobile technology, providing
wireless voice and broadband devices to customers in the home or office environment.
Fig 2-1 Typical Femtocell
A femtocell incorporates the functionality of a typical base station or an eNB in the LTE
standard. It comes along with a RNC (Radio network controller) and all the core network
elements. Thus it does not require a cellular core network; only a data connection to the DSL or
cable to the Internet is needed. In practice, the femtocell may be either a stand-alone device,
which connects into the customer’s existing broadband router or may form a key component of
a home gateway device which incorporates the router and other technologies.
13
Typically, a single femtocell will deliver voice services simultaneously to at least 4 users
(at the same time-means the same as simultaneously). Additionally they will also deliver data
services to multiple users, typically at the full peak rate supported by the relevant air interface
technology.
Femtocells use fully standard wireless protocols over the air to communicate with
standard mobile devices, including mobile phones and a wide range of other mobile-enabled
devices. They operate in spectrum licensed to the service provider, allowing operators to
provide assured QoS (Quality of Service) to customers over the air. They have a high degree of
intelligence to automatically ensure that they operate at power levels and frequencies that are
unlikely to create interference.
2.3 Carrier Aggregation
To achieve LTE-Advanced requirements, support of wider transmission bandwidths,
other than the 20MHz bandwidth specified in 3GPP release 8/9, is required. The preferred
solution to this is the use of Carrier Aggregation (CA) technology. Since LTE-A must provide
spectrum compatibility to legacy users, support for wider bandwidth in LTE-A is provided
through aggregation of multiple component carriers.
3GPP specifies carrier aggregation in LTE as follows:
• Rel-8/9 backward compatible carriers are the basic building blocks and are to be
supported
• Rel-10 signaling to support aggregation of up-to 5 downlink of component carriers and 5
uplink component carriers, irrespective of inter- or intra-band
• Rel-10 to support both intra- and inter-band aggregation for both DL and UL in FDD
• Rel-10 to support inter-band aggregation with different signal reception timings across
component carriers of different bands for FDD DL
• UE-specific asymmetric number of component carriers in DL and UL
• Component Carriers can have any of the bandwidths supported in Rel-8
14
In addition to the increase in spectral efficiency, substantial reduction in latency is also
targeted. The goals are to reduce the transition time from idle to connected mode in less than
100ms in LTE to 50ms. Similarly, the transition from dormant to active should be reduced from
50ms in LTE to 10ms.
Three types of CA technique have been proposed for the LTE-Advanced mobile
systems and are introduced as follows:
• Continuous Carriers when multiple available component carriers are adjacent to each
other
• Non-Continuous Intra-band carriers when multiple available component carriers are
separated in the same band
• Non-Continuous Inter-band carriers when multiple available carriers belong to different
frequency bands
Each component carrier may appear as a LTE carrier to legacy users while LTE-A
users are able to transmit and receive on several component carriers simultaneously. Three
possible aggregation scenarios are possible: contiguous and non-contiguous aggregation of
component carriers in a single band and non-contiguous aggregation of component carriers
over multiple bands. Prioritized deployment scenarios for LTE-A are proposed. In case of
aggregation over multiple bands, they should be in a similar frequency range so that the
hardware can be compatible.
For aggregation of non-contiguous component carriers, each carrier should meet
existing LTE spectrum requirements such as emission mask, adjacent channel leakage and
spurious emission to provide backward compatibility and to ensure minimal interference to
adjacent carriers. In case of contiguous carriers, however, a large guard band is not necessary.
By removing or relaxing the guard band, a much more efficient usage of the spectrum can be
attained.

15
Since OFDM has a good spectral efficiency and robustness to highly dispersive fading
channels, the LTE advanced systems adopted the OFDMA as downlink multiple access
method. OFDMA takes modulation format as OFDM and the data to each user is passed
simultaneously in different sub-carriers in each OFDM symbol. This exploits the multi-user
diversity by means of dynamically scheduling users on frequencies with good channels.
Fig 2-2 Carrier Aggregation
2.4 Co-Ordinated Multipoint Transmission/Reception
2.4.1 Introduction
Recently, the academic institutions have put in great effort to improve the spectral
efficiency and data throughput of LTE systems. In many cases, the achievable cell spectral
efficiency is limited by the inter-cell interference. Therefore Co-Ordinated multipoint
Transmission (CoMP) was introduced in the LTE-A technology to relax performance limitations.
Many of the facilities are still under development and may change as the standards define the
different elements of CoMP more specifically.
This technology is essentially a range of different techniques that enable the dynamic
coordination of transmission and reception over a variety of different base stations. The aim is
to improve the overall quality for the user as well as improve the utilization of the network.
Essentially, the LTE Advanced CoMP turns the Inter-Cell Interference (ICI) into a useful signal,
especially at the borders where performance may be degraded.
16
Although this technique is a complex one, it has a lot of benefits:
• Makes better utilization of the network: By providing connections to several base
stations at once, using CoMP, data can be passed through the least loaded base
stations for better resource utilization.
• Provides enhanced reception performance: Using several cell sites for each connection
means that the overall reception will be improved and the number of dropped calls
should be reduced.
• Interference reduction: By using specialized combining techniques, it is possible to
utilize the interference constructively rather than destructively thereby reducing
interference levels.
• Multiple site reception increases power: The joint reception from multiple base stations
or sites using LTE CoMP enables the overall received power at the handset to be
increased.
CoMP can to some extent be seen as an extension of the inter-cell interference
coordination, which is already present in LTE Rel-8. In LTE-A, the coordination can be in terms
of the scheduling at different cell sites, thereby achieving an even more dynamic and adaptive
inter-cell interference coordination. Alternatively, or as a complement, transmissions can be
carried out to a mobile terminal jointly from several cell sites, thereby not only reducing the
interference but also increasing the received power. The transmission from the cell sites can
also take the instantaneous channel conditions into account, thereby achieving multi-cell beam-
forming or precoding gains.
The basic idea behind CoMP is to apply tight coordination between the transmissions at
different cell sites, thereby achieving higher system capacity and, more importantly, improved
cell-edge data rates. Coordination schemes can be divided into two categories, used either
alone or in combination. Dynamic scheduling coordination between multiple cells: Joint
17
processing occurs where there is coordination between multiple entities – base stations – that
are simultaneously transmitting or receiving to or from UEs.
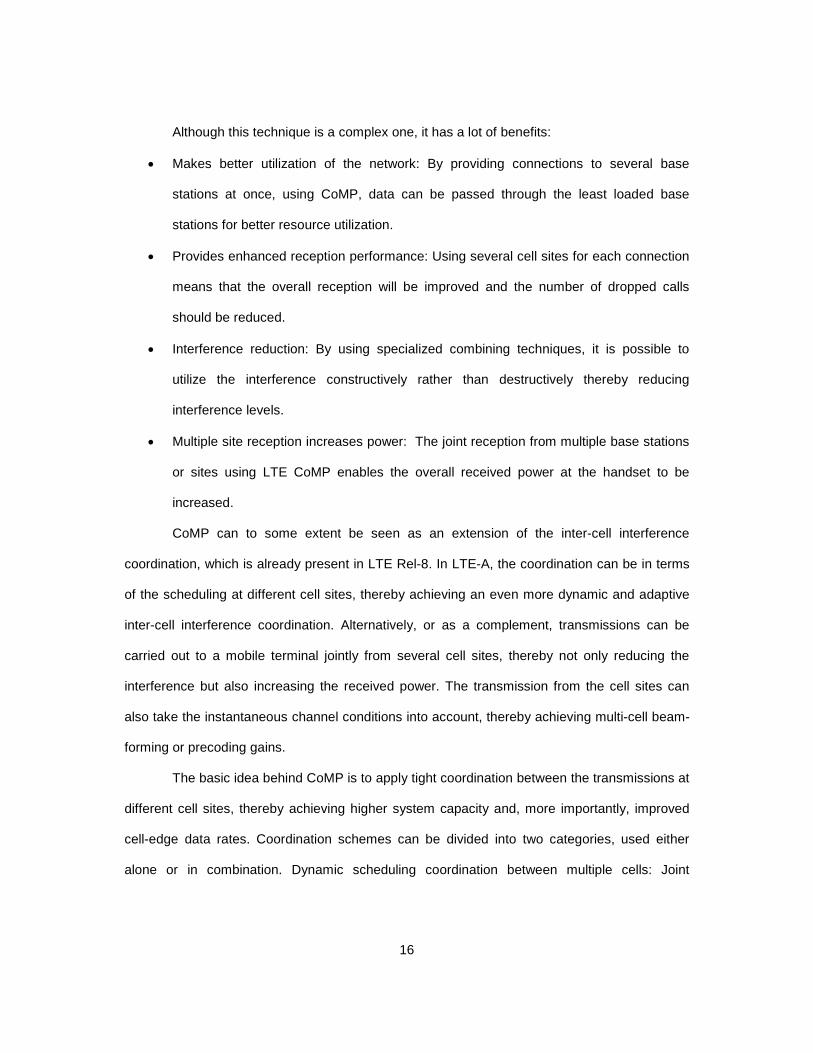
Joint transmission/reception from multiple cells: is a form of coordination where a UE
is transmitting with a single transmission or reception point – base station. However the
communication is made with an exchange of control among several coordinated entities.
Fig 2-3 Illustration of CoMP
2.4.2 The CoMP Architecture
Coordinated multipoint transmission and reception refers to transmission/reception of
the data to/from user equipments located at multiple cells. CoMP coordinates base station
antennae deployed at a number of sites which are in feasible proximity to each other [4]. CoMP
in LTE-A context includes various possible coordinating schemes among access points. The
3GPP technical report on further enhancements of E-UTRA physical layer aspects offer two
major categories in CoMP scheme which are namely Coordinated Scheduling/Beamforming
(CS/CB) and Joint Processing (JP) [6] which are explained below. eNBs should be in
coordination to reduce the inter-cell interference in the system for both uplink and downlink. LTE
requires the information of radio resource allocation, related to the reference UE to be available
at all base stations in the coordination cluster. Therefore the latency of the links should be very
18
low so that the necessary coordination information can be exchanged in a very short time
frame. There are two kinds of architecture described in [11], each of which can be combined
with any of the transmission schemes mentioned above.
2.4.2.1 Centralized Architecture
A central unit is required to gather the information of all the UEs in the area covered by
the base stations, eNBs in this case. The unit is also responsible for signal processing
operations such as precoding and user scheduling. Moreover, what is crucial in centralized
approach is the requirement of tight time synchronization among eNBs. At FDD systems such
as 4G femtocell network, the downlink channel is known by the UE so that the UE can feed
back the channel coherent or non-coherent indicators (CSI/CQI) in order to help eNB. The
communication links between the central unit and the eNBs are the main challenges of this
architecture. The links have to support low latency data transmissions and the protocols should
be well designed for information exchange.
2.4.2.2 Distributed Architecture
Distributed architecture is another method to establish the coordination among eNBs,
lessening the requirements of centralized approach. Assuming all the eNBs are identical in
terms of scheduling and the channel information within the entire coordination set, cooperation
does not need the wireless communication links between the nodes any longer. Thereby, the
signaling protocol drawback and infrastructure load related to these links are minimized. The
channels from all nodes are estimated by the users as in a centralized design. Then the
scheduling is independently executed after these estimations are sent back to the cooperating
nodes. Since the eNBs are identical in terms of scheduling, the same input parameters that will
control the cooperation algorithm produce the same output decisions and therefore the same
UEs are selected in the entire eNB cluster.
The main disadvantage of this approach is the reduction in the efficiency of CoMP
algorithm when the eNBs are not cooperating via a wired backhaul. A lot of time could be spent
19
in reaching the state of convergence for the femtocells. Another drawback can be stated as the
difficulty in error handling on different feedback links.
2.4.3 CoMP Schemes
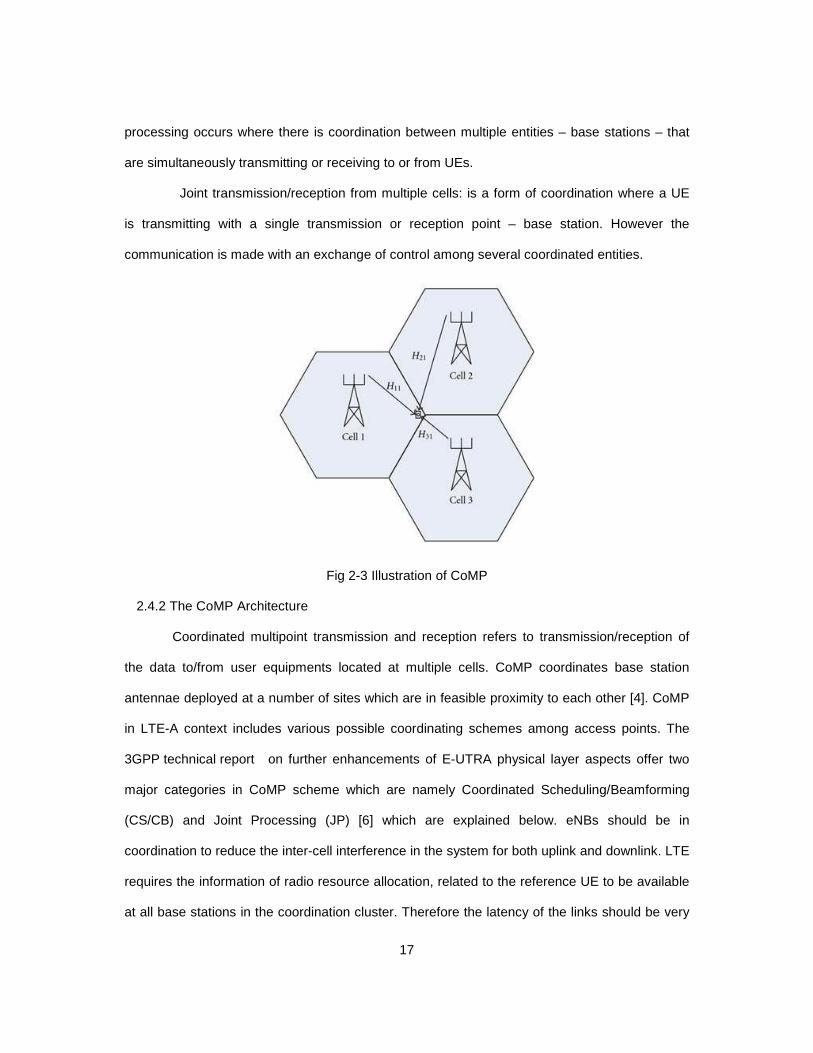
2.4.3.1 Coordinated Scheduling/Beamforming
In coordinated scheduling /beamforming scheme, the data at the terminal is received
from one of the base stations and coordination takes place among a set of base stations in
order to control and coordinate the interference at the terminal. The coordinated scheduling is
achieved by silencing the base stations with critical interference towards the victim UE and only
allows transmission from serving BS. In other words, mobile station MS1 receives the intended
data from only one base station, say BS1; however, another base station, say BS2, selects its
own UEs in such a way that it causes little interference to the MS1. This method is known as an
Interference mitigation method.
Fig 2-4 Co-Ordinated Scheduling/BeamForming
The method can be described analytically in the following scenario [12]. Assume there
exists two mobile terminals, �� and � and they are served by �� & � . The received
signals by ��� and �� are denoted as �� & � . ��� is the channel gain from ��� to �� and
�� is the precoding matrix at ���. �� is the signal transmitted and �� is the additive white noise.
20
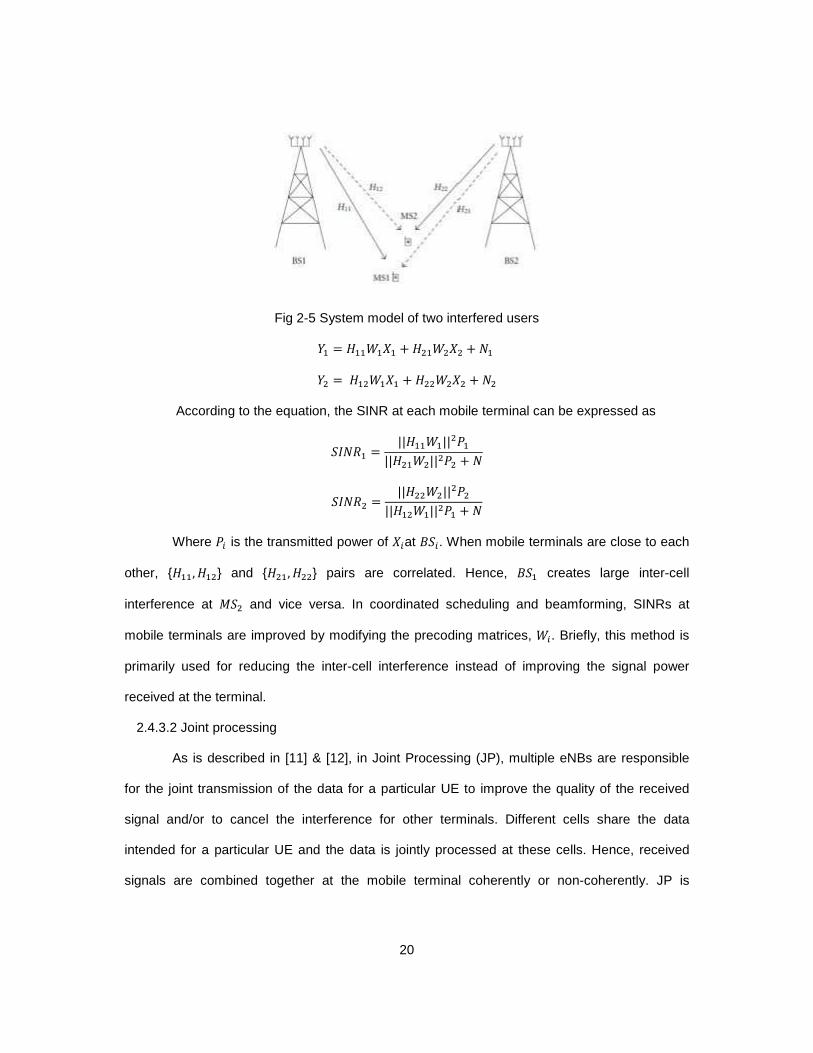
Fig 2-5 System model of two interfered users
�� � ������� � � �� � � �� � � �� ���� � � � � � �
According to the equation, the SINR at each mobile terminal can be expressed as
����� � ||�����|| ��||� �� || � � �
���� � ||� � || � ||�� ��|| �� � �
Where �� is the transmitted power of ��at ���. When mobile terminals are close to each
other, {���, �� } and {� �, � } pairs are correlated. Hence, ��� creates large inter-cell
interference at � and vice versa. In coordinated scheduling and beamforming, SINRs at
mobile terminals are improved by modifying the precoding matrices, ��. Briefly, this method is
primarily used for reducing the inter-cell interference instead of improving the signal power
received at the terminal.
2.4.3.2 Joint processing
As is described in [11] & [12], in Joint Processing (JP), multiple eNBs are responsible
for the joint transmission of the data for a particular UE to improve the quality of the received
signal and/or to cancel the interference for other terminals. Different cells share the data
intended for a particular UE and the data is jointly processed at these cells. Hence, received
signals are combined together at the mobile terminal coherently or non-coherently. JP is
21
categorized into two subcategories which are namely, Joint Transmission (JT) & Dynamic Cell
Selection (DCS).
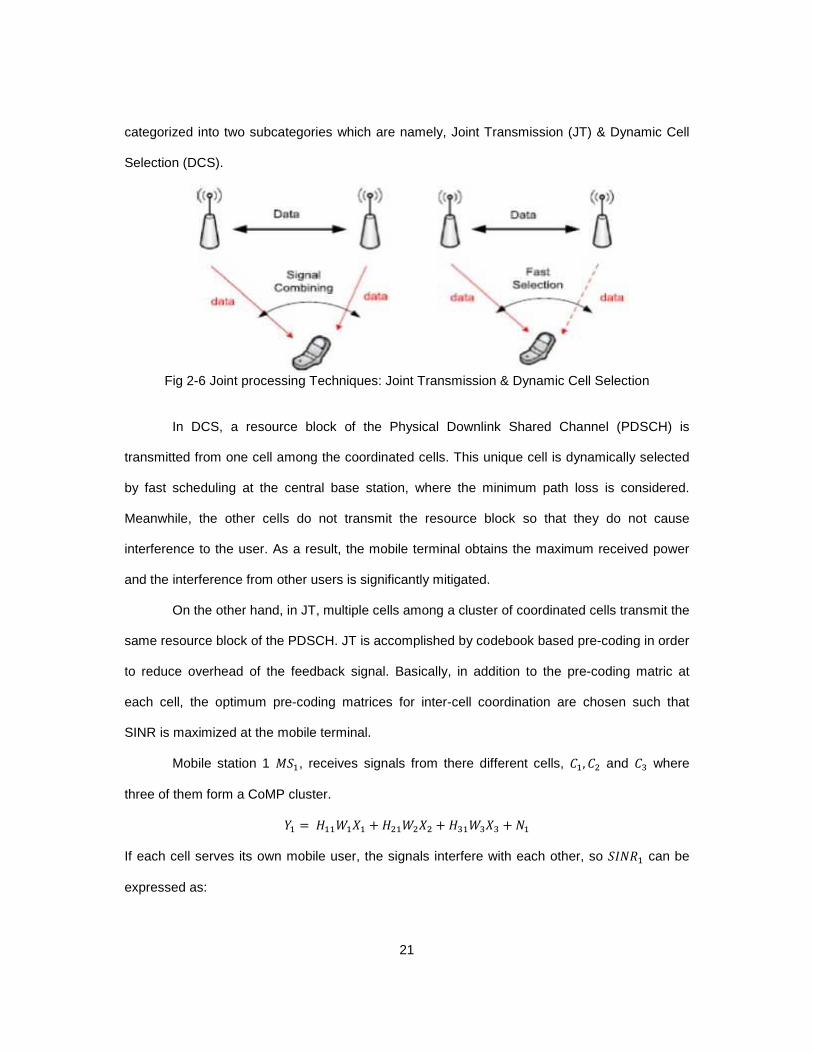
Fig 2-6 Joint processing Techniques: Joint Transmission & Dynamic Cell Selection
In DCS, a resource block of the Physical Downlink Shared Channel (PDSCH) is
transmitted from one cell among the coordinated cells. This unique cell is dynamically selected
by fast scheduling at the central base station, where the minimum path loss is considered.
Meanwhile, the other cells do not transmit the resource block so that they do not cause
interference to the user. As a result, the mobile terminal obtains the maximum received power
and the interference from other users is significantly mitigated.
On the other hand, in JT, multiple cells among a cluster of coordinated cells transmit the
same resource block of the PDSCH. JT is accomplished by codebook based pre-coding in order
to reduce overhead of the feedback signal. Basically, in addition to the pre-coding matric at
each cell, the optimum pre-coding matrices for inter-cell coordination are chosen such that
SINR is maximized at the mobile terminal.
Mobile station 1 ��, receives signals from there different cells, ��, � and �� where
three of them form a CoMP cluster.
�� � ������� � � �� � � ������� � ��
If each cell serves its own mobile user, the signals interfere with each other, so ����� can be
expressed as:
22
���� � ||�����|| ��||� �� || � � ||�����|| �� � �
In a CoMP joint processing system, the mobile user is served by three of the cells in the CoMP
cluster. Thus, X = �� � � � �� and consequently;
�� � ������+� �� � ����� � � � ��
Then the SINR for �� is:
�����! � "�����#�� � � �� #� � �����#��" �
It is clear that �����! is an upper bound of ����� and CoMP induces & SINR gain
compared to a single cell operation [13]. Even though, cooperation of the cells has a positive
impact on the user SINR, it also has an important drawback. ����� is the result of a single cell
operation; however, �����! is obtained under the assumption that three cells are serving one
mobile terminal. Therefore, mobile terminals under CoMP joint processing occupy more system
resources than the single cell ones. This is the most important cost of joint processing in CoMP.
23
Chapter 3
Femto Cells
3.1 Introduction
A typical approach to provide indoor coverage is to use outdoor macrocells. But this is
very expensive using an ‘outside in’ approach. An indoor user with high penetration loss will
need very high power from the base station; this will lead to less power allocation to other users
thus reducing the overall capacity of the network. Hence the cost per Mb will become higher
and more expensive. Also, the high capacity network needs to have lot of outdoor base stations,
the acquisition of which has become very costly in highly populated areas. Due to the high cost,
interference and also the power drain from base stations, this kind of architecture is not very
feasible.
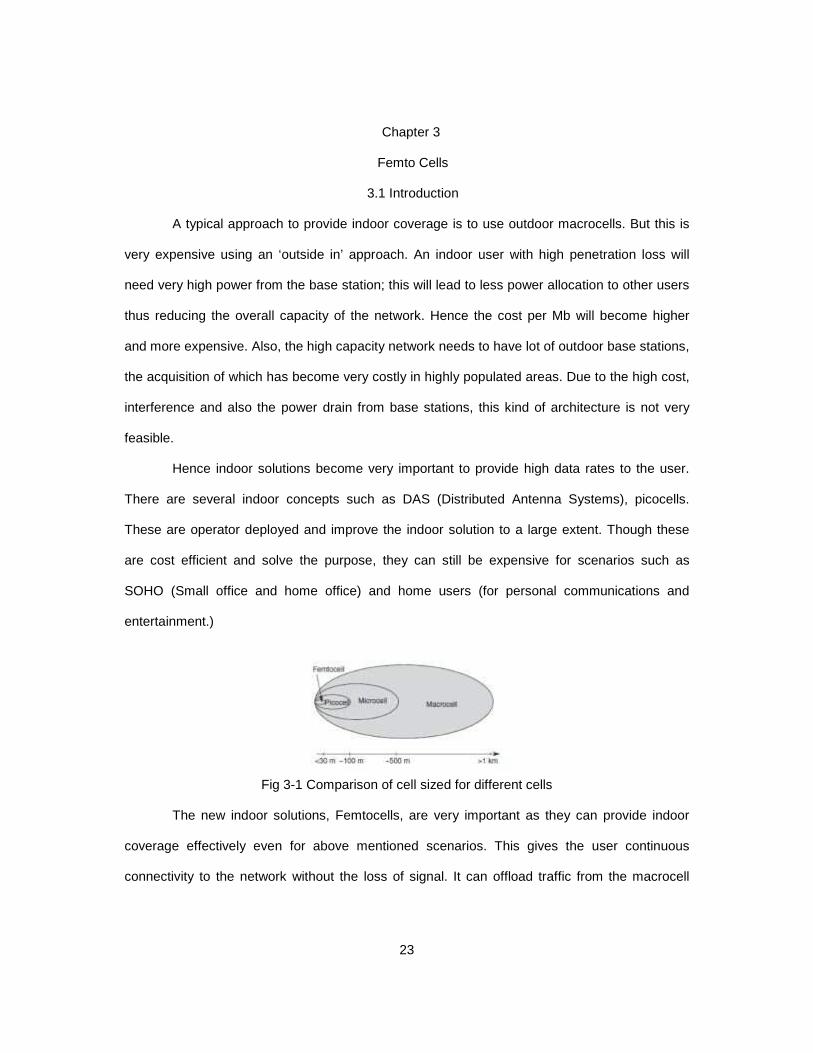
Hence indoor solutions become very important to provide high data rates to the user.
There are several indoor concepts such as DAS (Distributed Antenna Systems), picocells.
These are operator deployed and improve the indoor solution to a large extent. Though these
are cost efficient and solve the purpose, they can still be expensive for scenarios such as
SOHO (Small office and home office) and home users (for personal communications and
entertainment.)
Fig 3-1 Comparison of cell sized for different cells
The new indoor solutions, Femtocells, are very important as they can provide indoor
coverage effectively even for above mentioned scenarios. This gives the user continuous
connectivity to the network without the loss of signal. It can offload traffic from the macrocell
24
layer and improve the macrocell capacity thus saving the need to compensate for high
penetration loss and more power from the macro base station.
There is a growing need for higher and higher data rates. Due to high penetration loss,
high data rate services cannot be provided at indoor environments barring a few scenarios. This
is because the high data rate requires high performance RF links. High data services such as
those facilitated by HSDPA and LTE are the key drive of femtocells. They can provide
significant power saving to the UEs. Battery life is one of the biggest bottlenecks for providing
high speed data services to mobile terminals.
The power consumption of the base stations accounts for the considerable amount of
an operator’s OPEX. A base station consumes far more power than that used for transmitting
and receiving signals. Femtocell provides an ideal solution for FMC (Fixed Mobile
Convergence). It represents a major paradigm shift; users will pay to install femtocells. Hence,
the first phase of the rollout of high data rate networks such as LTE can start from indoor where
the high data rates are needed most.
3.2 FemtoCell Architecture
The current 3G architecture is hierarchical. It consists of the macrocell node connected
to the Radio Network Controller (RNC). The RNC is connected to tens to hundreds of base
stations. The RNC performs radio resource management and handovers between base stations
and also is connected to the Mobile Switching Center (MSC), the Serving GPRS Support Node
(SGSN) and the Gateway GPRS Support Node (GGSN). The MSC is connected to the Public
Switched Telephone Network (PSTN) and to several RNCs. The SGSN and GGSN support
mobile data services, routing protocols and security issues in a typical 3G system. Consider
LTE case, the developments also necessitates a reduction in the network architecture of
femtocell systems.
The standardization of femtocells / Home ENodeBs (H-eNB) in LTE networks is
conducted by 3GPP with TR R3.020 Rel-8. Regarding the different demands of different
25
operators, the initial Radio Access Network (RAN) centric solution is evolved along with
developments in LTE. The standardization processes try to integrate femtocells into the Evolved
Packet Core (EPC) infrastructure using the same EPC. The LTE EPC is based on flat IP
architecture and so are the femtocell’s and microcell’s’ architecture and interface. New
interfaces between LTE femtocells and EPC elements are redundant.
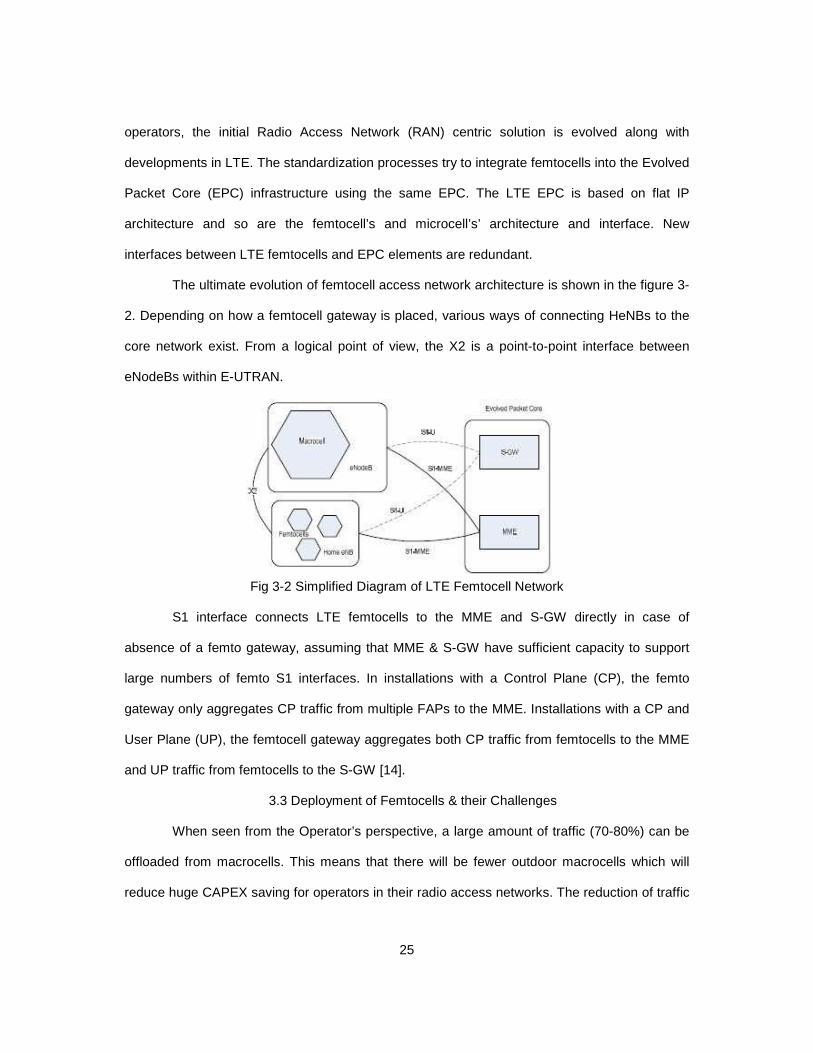
The ultimate evolution of femtocell access network architecture is shown in the figure 3-
2. Depending on how a femtocell gateway is placed, various ways of connecting HeNBs to the
core network exist. From a logical point of view, the X2 is a point-to-point interface between
eNodeBs within E-UTRAN.
Fig 3-2 Simplified Diagram of LTE Femtocell Network
S1 interface connects LTE femtocells to the MME and S-GW directly in case of
absence of a femto gateway, assuming that MME & S-GW have sufficient capacity to support
large numbers of femto S1 interfaces. In installations with a Control Plane (CP), the femto
gateway only aggregates CP traffic from multiple FAPs to the MME. Installations with a CP and
User Plane (UP), the femtocell gateway aggregates both CP traffic from femtocells to the MME
and UP traffic from femtocells to the S-GW [14].
3.3 Deployment of Femtocells & their Challenges
When seen from the Operator’s perspective, a large amount of traffic (70-80%) can be
offloaded from macrocells. This means that there will be fewer outdoor macrocells which will
reduce huge CAPEX saving for operators in their radio access networks. The reduction of traffic
26
from macrocell sites will also result in significant saving in the backhauling. This will also lead to
associated saving on the OPEX. Additionally this will simplify the site survey and planning
process; it also means less rent will be paid for the usage of base station sites. Femtocells are
low cost indoor solutions when compared to the outdoor macrocells. Secondly users will share a
substantial amount of the installation, thus reducing cost in the larger picture by manually
installing them at their homes. Femtocells also will improve the network coverage and service
quality; hence it will improve customer churn.
From the Subscriber’s perspective, femtocells can provide indoor coverage to those
users who have poor coverage or no coverage at their home. In addition to voice service,
multimedia, video and high data services will also become available. Femtocells also offer using
a single address book and one billing account for landline, broadband and mobile phone. Users
can benefit from such a scheme and it will turn out to be a lot more cost effective than using
services from more than one provider. They will deliver converged services (video, voice and
data services) at home and enable users to have a seamless user experience across both
outdoor and indoor environments with personalized converged services for UEs.
As we have seen, there are many reasons why customers and operators are
demanding femtocells, the services and economies that can be provided by using them. Yet
there are some challenges posed by them.
Radio Challenges:
• Interference between femto- and macro cells;
• Radio resource and mobility management.
Network Challenges:
• Architecture and Interfaces;
• Scalability;
• Security.
Market Challenges:
27
• Public Awareness, public concerns regarding service, tariffs;
Support for a wide range of use cases.
3.4 Industry Activity
Femto forum is a non – profit organization founded in 2007 to encourage the
deployment of femtocells worldwide. Service providers, mobile operators, hardware and
software vendors and start-ups are the associates of this community. Femto forum has strong
connections with other industrial communities such as GSM Association, 3GPP, 3GPP2 and
Wimax forum.
In conventional 2G & 3G systems, femtocells are implemented on top of existing
cellular networks. In WiMAX forum, service providers have started working on the requirements
for femtocells from perspective of network operators together with the improvements in 4G
systems. Several service providers are planning to introduce femtocells into their networks to
improve the throughput of the current users.
In 2002, Motorola evolved the world’s smallest full – function UMTS femtocell base
station. In 2005, providers such as Samsung, Alcatel-Lucent, Airwalk, picoChip, etc. widely
acknowledged the idea of femtocells. Femtocell systems were demonstrated at the cellular
industry 3GSM conference in 2007. Sprint Nextel initiated a limited rollout of femtocells
deployed by Samsung which operate with any Sprint handset. Ericsson, NEC, Samsung, Nokia
Siemens Networks, Airvana, Qualcomm are the companies that have launched 3G femtocell
base stations [14].
3.5 Radio Issues for Femtocells
One of the defining characteristics of a femtocell is its use of licensed spectrum.
Typically this spectrum is already in use for delivering services using the existing macrocells.
So, operators may need to have the confidence that femtocells can operate without creating
harmful interference with the existing network, even when deployed entirely by the end-user.
28
One of the issues to be considered is that of CSG (closed subscriber group) versus
open access. Open access is the normal manner in which macrocells operate, where all
subscribers registered with an operator can access all base stations. Thus all subscribers are
subject to power control to ensure that they do not transmit at excessive power levels, and all
receive service from multiple base stations when they are in areas of overlapping coverage,
thereby avoiding interference between macrocells. CSG is the most common approach used in
femtocell technology. Other users will potentially be subject to interference from femtocells
when they are in poor coverage areas from macrocells but close to femtocell. They may also
cause interference with/in the femtocell, when they are transmitting at high power to reach a
distant macrocell, but are standing close to a femtocell, thereby drowning out a weak femtocell
user. There is also interference between macro and femto cells; given that there are so few
distinct carriers, operators may not have the opportunity to deploy femtocells in a dedicated
spectrum.
In order to analyze the performance of a femtocell, it is important to determine models
of radiowave propagation in typical femtocell environments. Most studies of indoor propagation
have focused on larger buildings, such as public buildings and large offices, rather than on the
home or small office locations, which will be the main environments for femtocells. The model
recommended by ITU-R for the path loss between indoor terminals, known as ITU-R P.1238 is
given as
$%&�'� � 20 log -. � 10� log ' � $01�02 3 28
where n is the path loss exponent and $01�02 is the floor penetration loss, which varies with the
number of penetrated floors �0 .
29
Chapter 4
Interference Scenarios
4.1 Introduction
Femtocells will provide higher spectral efficiency, spatial frequency reuse and better
coverage in areas not fully covered by macrocells. However, if interference cancellation or
avoidance techniques are not applied, dead zones can appear within the macrocell, disrupting
its service in the proximity of a femtocell.
4.1.1 Co-Layer Interference
Co-Layer interference is described as the unwanted signal received at a femtocell and
sent from other femtocells, decreasing the quality of its communication. The name co-layer
makes reference to the fact that all femtocells belong to the same network layer, unlike other
elements like base stations, NodeBs and so on, which belongs to the macrocell layer. Co-Layer
interference occurs mainly between immediate neighbors due to low isolation between houses.
This problem is independent of the problem caused at macrocell layer.
Since the deployment of femtocells is opportunistic, it is likely that several femtocells
would be installed in locations close to each other. Let us assume that a Global System Mobile
(GSM) femtocell -6 illuminates an arbitrary location $6. It can be said that $6 belongs to the
coverage area of -6. If there are additional signals from surrounding femtocells using the same
frequency, location $6 is said to suffer from co-channel interference and the system’s
performance suffers. Furthermore, when signals from several femtocells are present at a given
location, the overall interference can be higher than any of the independent femtocell power
levels. The degradation of the communication varies between RF technologies due to their
different performances in the presence of interference.
The femtocells can be deployed in Closed Subscriber Group (CSG), open-access or in
a hybrid mode, the impact of the co-layer interference will be different depending on the access
method. If all the femtocells within the same area are synchronized, the aggressors (another
30
name for interfering sources according to 3GPP standards) at an interfered femtocell user are
the neighboring FAPs during downlink. This means that transmissions coming from a FAP will
cause interference to UEs of neighboring femtocells in downlink only. In the case that no
synchronization existed between femtocells, the source of interference in TDD would be
undetermined. The uplink and downlink periods of different femtocells would overlap and
introduce heterogeneous sources of interference. This way, neighboring femtocells would
overrun each other’s transmission time slots and make interference harder to control. Since all
MBS belong to the same network layer, the interference between different macrocells is also a
cause of co-layer interference. However, the deployment of macrocells is planned by the
operator, with interference being dealt with by means of planning schemes. This problem is thus
independent of the deployment of femtocells.
In downlink co-layer interference, the FAPs are the aggressors or sources of
interference, while UEs of neighboring femtocells are the victims. Co-channel downlink
interference is one of the main sources of impairment for femtocells. Since femtocells will be
deployed in close positions relative to each other, they are very likely to interfere with one
another by means of power leaks from windows, doors and poorly isolated walls. The signals of
several femtocells within the same area contribute to raising the interference. Hence in CDMA
systems, the noise level increases and creates dead zones where downlink connectivity
becomes impossible. To prevent femtocells from causing interference in the downlink to UEs of
nearby femtocells, the most commonly used method is to be careful about the transmitting
power levels by using adaptive power control techniques. This is necessary especially in CSG
femtocells as the UEs are not necessarily served by the strongest FAP but by the one to which
they are subscribed. A case of co-layer downlink interference occurs when a given femtocell
user is located in an area within FAP premises, where the signal coming from its own femtocell
is not high enough compared to the interference coming from surrounding femtocells.
31
However in OFDMA systems, the allocation of the sub-channels at each femtocell plays
a decisive role in the final impact of the interference. Dead zones in OFDMA femtocells depend
on the spectrum occupancy at a given location. Two femtocell users could be at the same
geographic position and only one of them would suffer interference from surrounding femtocells.
The allocation of frequency resources is thus extremely important in OFDMA femtocells.
4.1.2 Cross-Layer Interference
In two-layer networks, an interfering signal is assumed to produce cross-layer
interference if the aggressor and the victim systems belong to different layers of the network.
For example, the distortion caused by an emitting FAP at the downlink of one or several
macrocells is a clear case of cross-layer interference. Likewise, it can also be considered as
cross-layer interference if the distortion is caused by a macrocell user at the uplink of a nearby
FAP. Cross-layer interference is a problem especially in CDMA co-channel deployed two-layer
networks, due to the fact that both femtocells and macrocells use the same frequency band.
Besides, due to power control, sudden high transmitting powers can cause the appearance of
dead zones, thus reducing the feasibility of these networks.
Spectrum splitting has been proposed as a means of coping with the cross-layer
interference. However, given the cost and scarcity of the electromagnetic spectrum, this would
lead to a less efficient frequency reuse. Spectrum splitting would almost remove all the cross-
layer interference. However, when both bands are adjacent in the frequency domain, the
adjacent channel can also introduce interference, which is why the Adjacent Channel
Interference Rejection Ratio (ACIR) needs to be minimized when designing the transmit power
limits. The ACIR is defined as the ratio of the total power transmitted from the aggressor to the
total interference power affecting the victim. It is mathematically expressed as:
7��� � 117�$� � 17��
32
where the Adjacent Channel Leakage Ratio (ACLR) measures the ratio of the average power
sent into adjacent channels by the transmitter due to imperfect filters, to the average power
actually sent into the assigned channel. Furthermore, the Adjacent Channel Selectivity (ACS)
measures the ratio of the receiving filter attenuation on the assigned band to the attenuation on
the adjacent channel. Even in split-spectrum deployments, the achievable ACIR is limited.
Hence, the power of the FAP and the UEs must be regulated to limit the impact on the
macrocell.
In OFDMA systems, the spectrum is divided into subcarriers, so OFDMA based
femtocells are a desirable solution, offering high versatility for the handling of cross and also co-
layer interference. However, OFDMA systems can also suffer other types of problem such as
frequency and time synchronization issues. Interference from other elements of the network
could introduce inter-carrier interference due to frequency offsets, thus resulting in the loss of
orthogonality between subcarriers and so bringing down the entire system.
33
Chapter 5
System Simulator
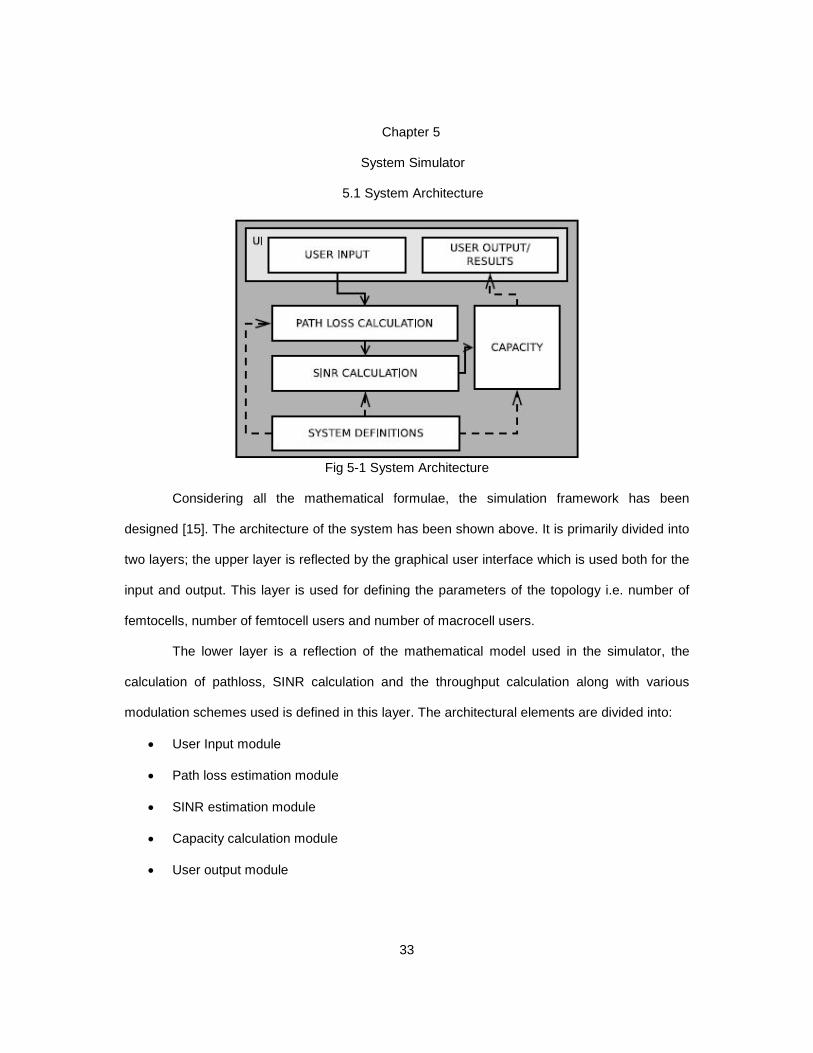
5.1 System Architecture
Fig 5-1 System Architecture
Considering all the mathematical formulae, the simulation framework has been
designed [15]. The architecture of the system has been shown above. It is primarily divided into
two layers; the upper layer is reflected by the graphical user interface which is used both for the
input and output. This layer is used for defining the parameters of the topology i.e. number of
femtocells, number of femtocell users and number of macrocell users.
The lower layer is a reflection of the mathematical model used in the simulator, the
calculation of pathloss, SINR calculation and the throughput calculation along with various
modulation schemes used is defined in this layer. The architectural elements are divided into:
• User Input module
• Path loss estimation module
• SINR estimation module
• Capacity calculation module
• User output module
34
5.1.1 User Input Module:
The user communicates with the system via a graphical user interface. For appropriate
calculations to be made, the frame work needs the following user input such as:
• Location coordinates of the femto BSs in a macrocell area
• Total number of femto and macro users and the femto BSs the users attached to.
Due to multiple configuration modes available in the LTE-A the total base station
bandwidth and the modulation scheme parameters are necessary. Based on the given local co-
ordinates, the distance between UE’s and respective antenna spots are calculated, resulting
estimation of the channel path loss. The topology considers only the case of an urban area
since the deployment of femto BS in other types of areas is not common and therefore due to
their density they do not present scientific interest.
5.1.2 Path loss Estimation Module:
The analysis and modeling performed by this module is described in the further
sections. This module implements the mathematical models provided by 3GPP – TR 36.814
V9.00 standard, corresponding to all possible cross-tier and intra-tier interference and
deployment scenarios that can take place in an urban area. Those cases include:
• Outdoor macro user interfered by femto BS
• Indoor macro user interfered by femto BS
• Outdoor femto user interfered by macro BS
• Indoor femto user interfered by macro BS
The selection of the appropriate model is made, based on the user input of the previous
module. Irrespective of the scenario selected, the result of this module, expressed in dB, is
forwarded as input to the next module.
35
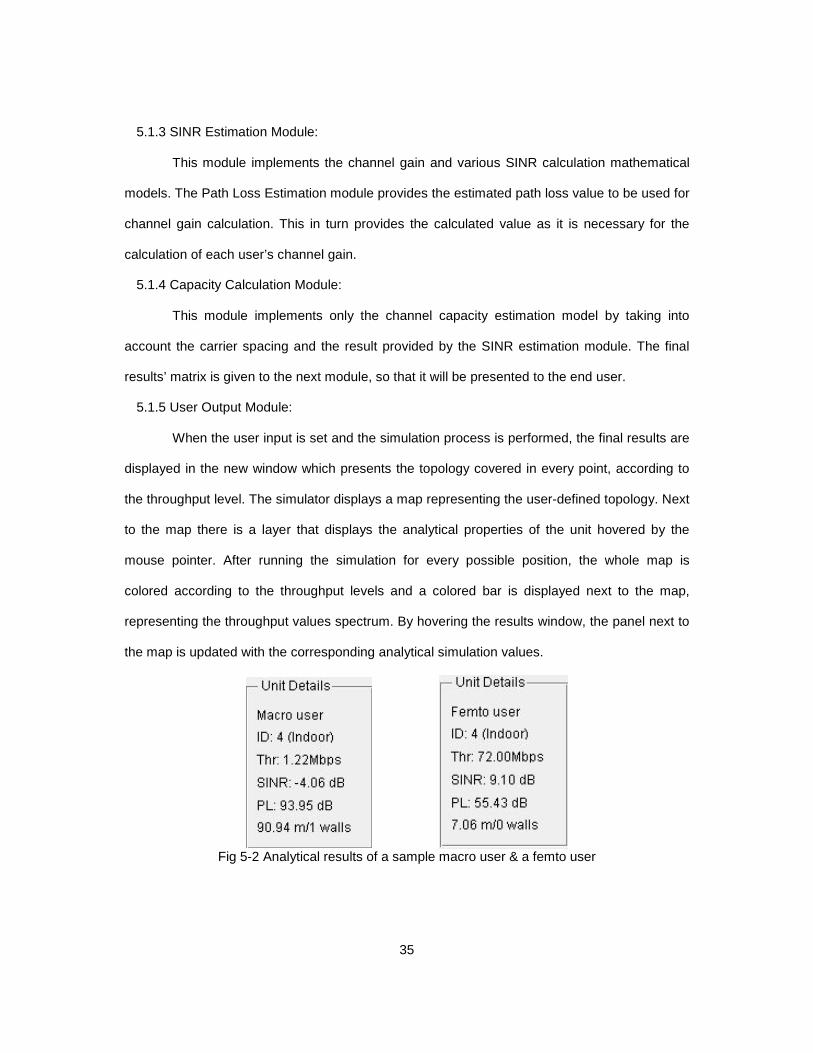
5.1.3 SINR Estimation Module:
This module implements the channel gain and various SINR calculation mathematical
models. The Path Loss Estimation module provides the estimated path loss value to be used for
channel gain calculation. This in turn provides the calculated value as it is necessary for the
calculation of each user’s channel gain.
5.1.4 Capacity Calculation Module:
This module implements only the channel capacity estimation model by taking into
account the carrier spacing and the result provided by the SINR estimation module. The final
results’ matrix is given to the next module, so that it will be presented to the end user.
5.1.5 User Output Module:
When the user input is set and the simulation process is performed, the final results are
displayed in the new window which presents the topology covered in every point, according to
the throughput level. The simulator displays a map representing the user-defined topology. Next
to the map there is a layer that displays the analytical properties of the unit hovered by the
mouse pointer. After running the simulation for every possible position, the whole map is
colored according to the throughput levels and a colored bar is displayed next to the map,
representing the throughput values spectrum. By hovering the results window, the panel next to
the map is updated with the corresponding analytical simulation values.
Fig 5-2 Analytical results of a sample macro user & a femto user
36
5.2 Analysis and Parameters
Channel models are one of the most important perspectives in the system design. All
the possible scenarios are considered and mathematically formulated. This section presents the
analysis that estimates the interference and throughput in every point of the LTE-A system
consisting of macrocells and femtocells.
5.2.1 Path Loss Model
In order to estimate the SINR, first we need to calculate the path loss between a macro
eNB and a UE that are in the same apartment stripe and between a femto eNB and a UE. The
path loss for the first case and for a macro user roaming outdoor in the urban area, can be
determined as:
�$�8�� � 15.3 � 37.6 =>?�&� (1)
Whereas, for the case of an indoor macro user the path loss is given by:
�$�8�� � 15.3 � 37.6 =>?�&� � $@A (2)
Where R is the distance between the transmitter (BC) and the receiver (�C) in meters
and $@A is the penetration loss of an outdoor wall. The path loss between a femto base station
and a UE is calculated by the following equation:
�$�8�� � 38.46 � 20 =>?�&� � 0.78 E,�FG@@H � I $�A � 18.3���FJ � �FJ��K&.LM⁄ � (3)
where, n is the number of penetrated floors, q is the number of walls separating the apartments
between femto BS and the UE, and $�A is the penetration loss of the wall separating
apartments. Also the term 0.78 E,�FG@@H takes account of penetration loss due to walls inside an
apartment and is expressed in m.
Finally, the case of an outdoor femto user associated to an indoor femto eNB. In this
case the outdoor wall loss is also considered as:
�$�8�� � max�15.3 � 37.6 =>?�&� , 38.46 � 20=>?�&��
� 0.78 E,�FG@@H � I $�A � $@A � 18.3���FJ � �FJ��K&.LM⁄ � (4)
37
5.2.2 SINR Estimation
The estimation of the received SINR of a macro user m on subcarrier k, when the
macro user is interfered from neighboring macrocells and all the adjacent femtocells, is
expressed as:
���� R,S � �T,SUR,T,S�&∆- � ∑ �TX ,SUR,TX ,S � ∑ �Y,SUR,Y,SYTX �5�
where �T,S and �TX ,S is transmit power of serving macrocell M and neighboring macrocell ! on
subcarrier k, respectively. UR,T,S is channel gain between macro user m and serving macrocell
M on subcarrier k. Channel gain from neighboring femtocell are denoted as UR,TX,S. Similarly,
�Y,S is transmit power of neighboring femtocell F on sub-carrier k. UR,Y,S is channel gain between
macro user m and neighboring femtocell F on subcarrier k. �& is white noise power spectral
density, and ∆- is the subcarrier spacing.
In case of a femto user f on subcarrier k interfered by all macrocells and adjacent
femtocells, the received SINR can be given as:
���� 0,S � �0,SU0,Y,S�&∆- � ∑ �YX,SU0,YX,S � ∑ �T,SU0,T,STYX �6�
The channel gain G is dominantly affected by path loss, which is different for outdoor
and indoor scenarios (1), (2), (3) and (4). So it can be expressed, as:
U � 10KZ[ �&\ �7�
5.2.3 Throughput Calculation
After obtaining the SINR, throughput can be calculated. The practical capacity of macro
user m on subcarrier k can be given as:
�R,S � ∆- =>? 11 � ]����R,S2 �8�
where ] is a constant for target Bit Error Rate (BER), and defined by ] � 31.5 ln �5�_��\ . In
this analysis BER is set to 10KM. Finally, the throughput of serving macrocell M can be
expressed as:
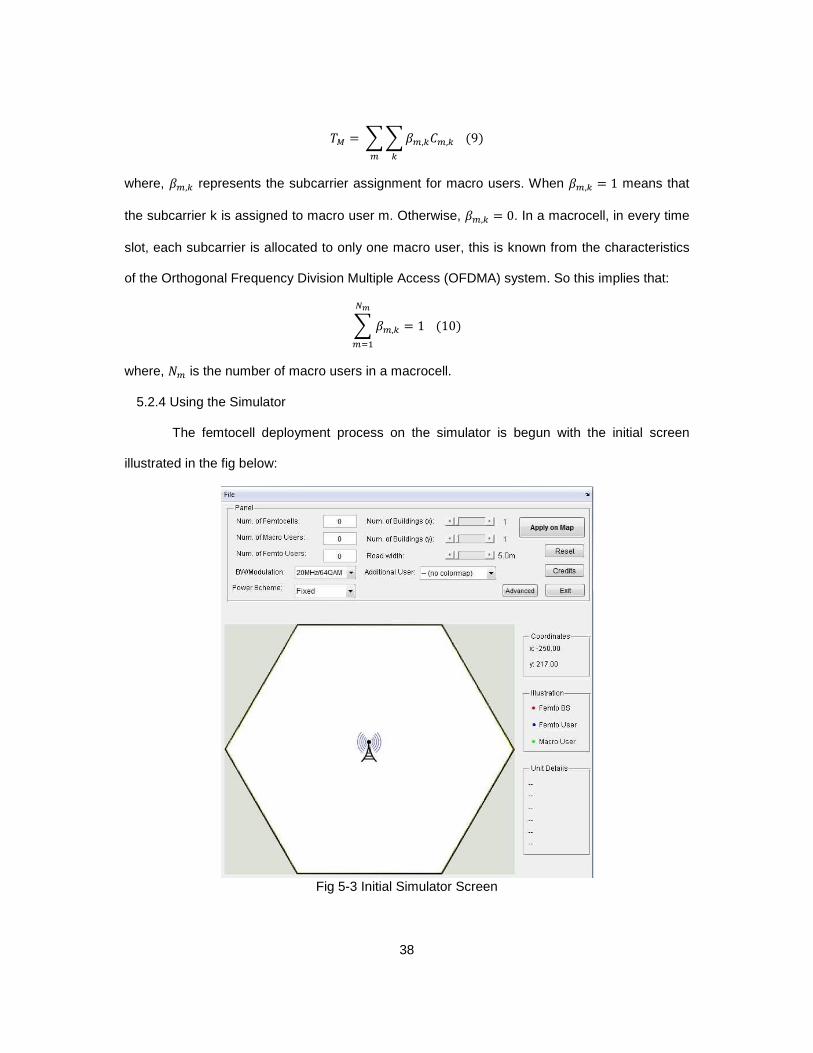
38
BT � ` ` aR,S�R,SSR
�9�
where, aR,S represents the subcarrier assignment for macro users. When aR,S � 1 means that
the subcarrier k is assigned to macro user m. Otherwise, aR,S � 0. In a macrocell, in every time
slot, each subcarrier is allocated to only one macro user, this is known from the characteristics
of the Orthogonal Frequency Division Multiple Access (OFDMA) system. So this implies that:
` aR,S � 1cd
Re� �10�
where, �R is the number of macro users in a macrocell.
5.2.4 Using the Simulator
The femtocell deployment process on the simulator is begun with the initial screen
illustrated in the fig below:
Fig 5-3 Initial Simulator Screen
39
The number of macro users, femto users and the number of femtocells deployed has to
be entered. Apart from these parameters, number of building both long x axis, y axis and the
preferred channel bandwidth according the current LTE-A standards (1.4, 3, 5, 10, 15 or 20
Mhz) needs to be provided. Also, because of the applied urban environment the user has to
define the width of the map’s streets, in meters. By clicking “Applying to Map”, the buildings are
set up accordingly. A manual femtocell deployment and femto/macro user placement takes
place by clicking onto specific points in the macrocell’s area. The deployment is considered
completed when the end-user has placed the last macro user on the map. After this event, one
can view the simulation statistics for every placed unit, by hovering that with the mouse pointer.
A sample scenario is presented in fig. 4 where I have considered 10 femtocells, 14
femtocell users and 8 macrocell users. The Bandwidth is chosen as 20Mhz and the modulation
as 64QAM. The numbers of buildings are 16, with 4 in x axis and 4 in y axis. The road width is
assumed to be default as 5.0m.
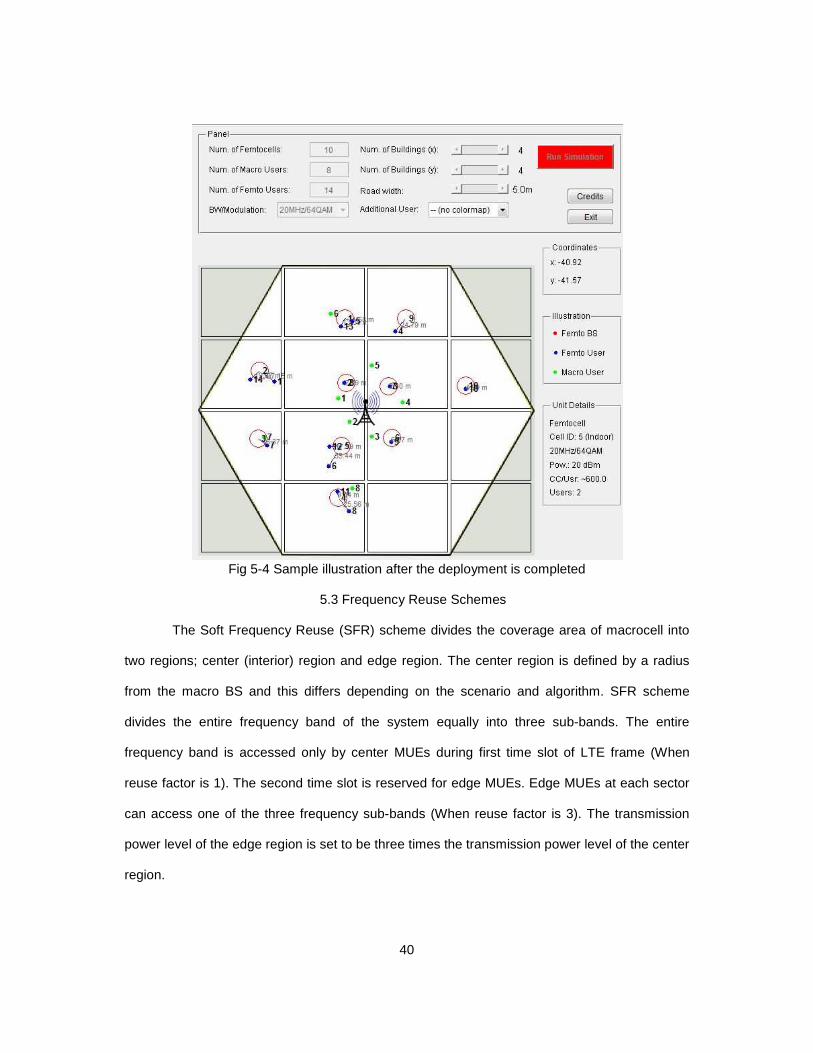
40
Fig 5-4 Sample illustration after the deployment is completed
5.3 Frequency Reuse Schemes
The Soft Frequency Reuse (SFR) scheme divides the coverage area of macrocell into
two regions; center (interior) region and edge region. The center region is defined by a radius
from the macro BS and this differs depending on the scenario and algorithm. SFR scheme
divides the entire frequency band of the system equally into three sub-bands. The entire
frequency band is accessed only by center MUEs during first time slot of LTE frame (When
reuse factor is 1). The second time slot is reserved for edge MUEs. Edge MUEs at each sector
can access one of the three frequency sub-bands (When reuse factor is 3). The transmission
power level of the edge region is set to be three times the transmission power level of the center
region.
41
Similarly to SFR, Partial Frequency Reuse (PFR) divides the coverage area into center
and edge regions. PFR scheme divides the entire system bandwidth into 6 sub-bands. The first
3 sub-bands are reserved for center MUEs at any sector. These sub-bands are called Common
Sub-bands. Each of the three remaining sub-bands is reserved for edge MUEs at different
sectors. The transmission power level for sub-bands of the edge region is set to be 2/3 of the
total transmission power. The transmission power level for sub-bands of center region is set to
be 1/3 of total transmission power
Soft Fractional Frequency Reuse (SFFR) scheme can be considered a generalized
case of the PFR scheme. The only difference between PFR and SFFR schemes is the available
sub-bands accessed by center MUEs at each sector. Unlike PFR scheme, center MUEs in
SFFR scheme can access all available sub-bands except the one reserved for edge MUEs of
that sector.
5.3.1 Proposed Frequency Reuse Scheme
In the proposed scheme, the femtocell is characterized into center femtocell or edge
femtocell. Depending on the above defined category the sub-bands are allocated. The center
femtocells will be able to access all sub-bands except, those sub-bands which are utilized for
the cell edge users in the current sector and the edge femtocells will be able to access all sub-
bands, other than whose which are utilized by the cell center users. The interference between
femto user and macro user can be highly reduced, as at any given point of time the channel
allocated to them are different, so this way the interference between these users if any will be
kept to minimum. This way the sub-bands are not reserved and change dynamically according
to the environment and will provide high spectral efficiency compared to other static and semi-
static schemes.
5.4 Implemented Algorithm
When a H-UE is turned ON, it starts measuring the received signal from all the
neighboring H-eNB’s. After this it determines those H-eNB’s from which it is most likely to have
42
interference. These values are sent back to the serving femto eNB and thus the femto eNB
collects the information about all the allocated sub-bands and thus will allocated a sub-band
which has not been used or the one on which it is experiencing the least interference. If all the
sub-bands are not used up by the neighboring eNB’s, then the non-overlapping orthogonal sub-
band is allocated to the H-UE by the serving femto base station. The Received Signal Strength
Indicator (RSSI) is used by the H-UE to determine the signal strength from various femto base
stations. RSRP is a combination of Reference Signal Received Power (RSRP) and Reference
Signal Received Quality (RSRQ). On the other hand, if no sub-band is available, the sub-band
on which the highest interference is experienced is allocated to the H-UE. Highest interference
means that the signal strength obtained by the neighboring H-eNB is very strong, so instead of
trying to mitigate it, using CoMP it can be converted to the user’s benefit, thus jointly
coordinating to provide high throughput to the H-UE.
By using the above mentioned technique, the same sub-channel is allocated to the UE
from which he is experiencing high interference; this mitigates the femto-femto interference to a
large extent. As mentioned earlier, the user is allocated an unused sub-channel if available, the
throughput of the user is maintained high in this case as he does not any interference from the
neighboring H-eNB’s.
Though the H-UE is allocated a sub-channel, the H-UE continuously measures the
RSSI from the neighboring femtocells at various time intervals and these values are
simultaneously fed back to the serving H-eNB. This way the serving H-eNB allocates more than
1 sub-carrier to the user, if the sub-carrier is not used by the neighboring cells, thus bringing CA
into place. CA is used only when more than 1 sub-carrier is available at the femto base station’s
disposal.
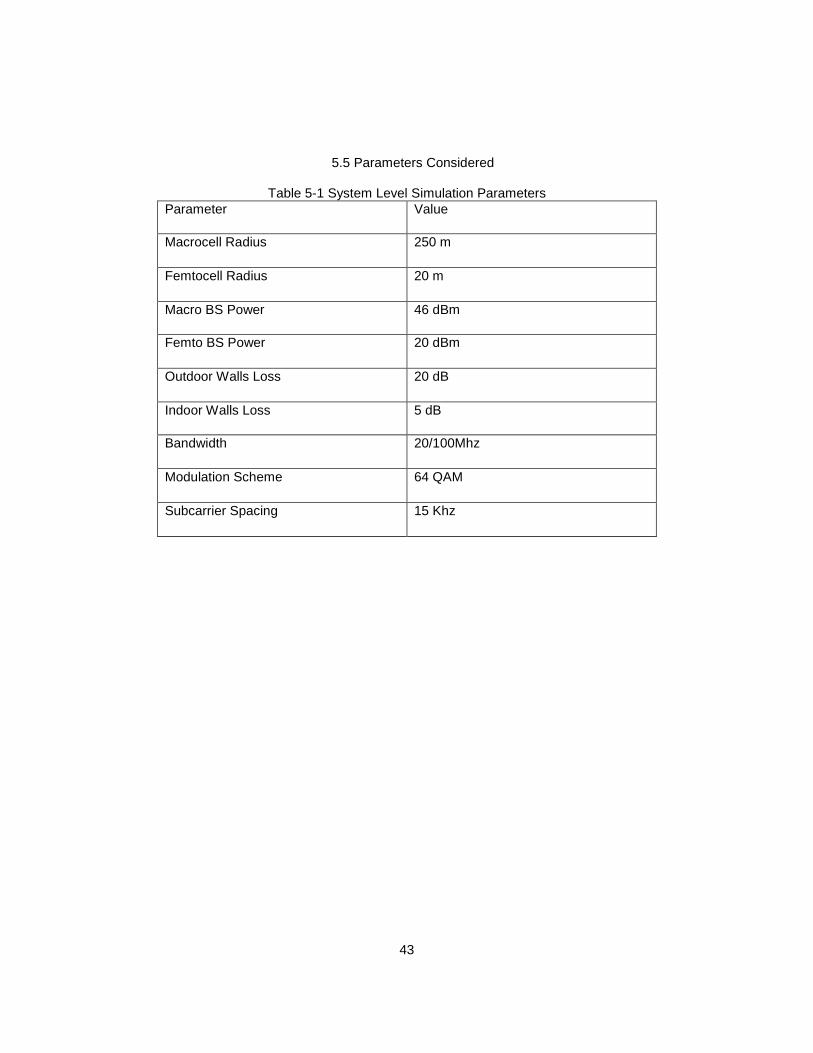
43
5.5 Parameters Considered
Table 5-1 System Level Simulation Parameters Parameter Value
Macrocell Radius 250 m
Femtocell Radius 20 m
Macro BS Power 46 dBm
Femto BS Power 20 dBm
Outdoor Walls Loss 20 dB
Indoor Walls Loss 5 dB
Bandwidth 20/100Mhz
Modulation Scheme 64 QAM
Subcarrier Spacing 15 Khz
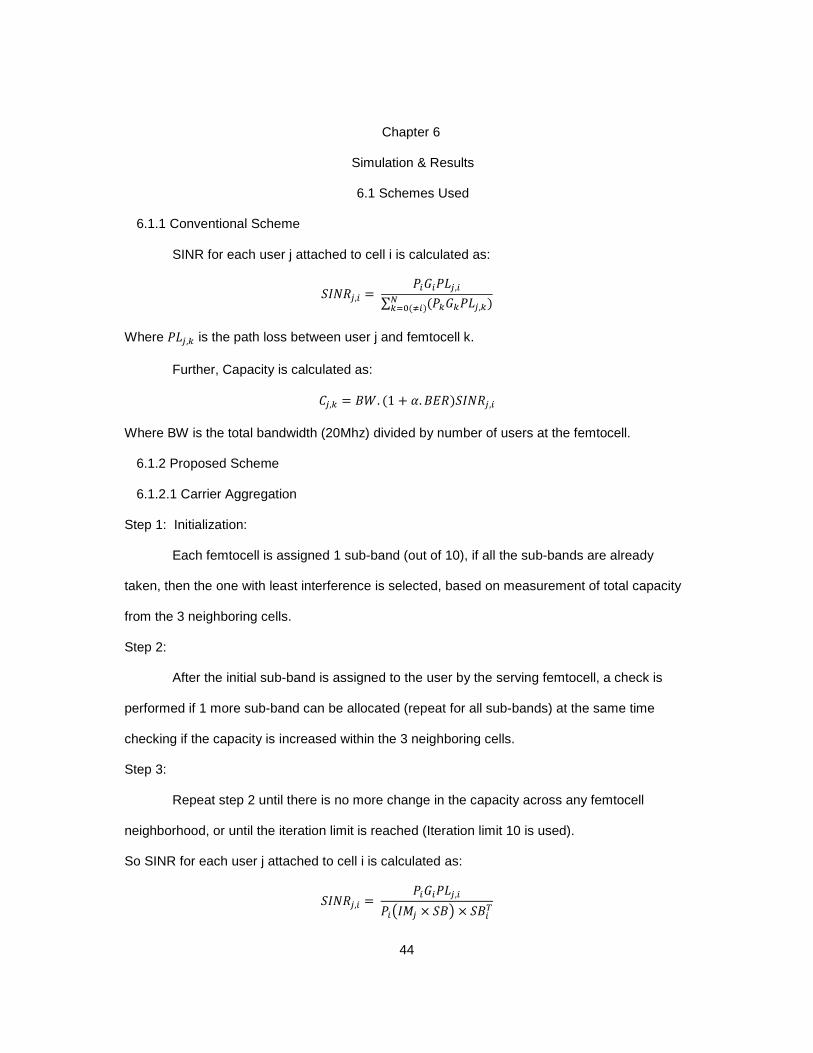
44
Chapter 6
Simulation & Results
6.1 Schemes Used
6.1.1 Conventional Scheme
SINR for each user j attached to cell i is calculated as:
�����,� � ��U��$�,�∑ ��SUS�$�,S�cSe&�f��
Where �$�,S is the path loss between user j and femtocell k.
Further, Capacity is calculated as:
��,S � ��. �1 � ]. �_�������,� Where BW is the total bandwidth (20Mhz) divided by number of users at the femtocell.
6.1.2 Proposed Scheme
6.1.2.1 Carrier Aggregation
Step 1: Initialization:
Each femtocell is assigned 1 sub-band (out of 10), if all the sub-bands are already
taken, then the one with least interference is selected, based on measurement of total capacity
from the 3 neighboring cells.
Step 2:
After the initial sub-band is assigned to the user by the serving femtocell, a check is
performed if 1 more sub-band can be allocated (repeat for all sub-bands) at the same time
checking if the capacity is increased within the 3 neighboring cells.
Step 3:
Repeat step 2 until there is no more change in the capacity across any femtocell
neighborhood, or until the iteration limit is reached (Iteration limit 10 is used).
So SINR for each user j attached to cell i is calculated as:
�����,� � ��U��$�,���1�� g ��2 g ���h
45
Where SB is the sub-band matrix having a value 1 where a particular sub-band is used
by particular femtocell and a value 0 when that femtocell is not using that band. The matrix is
shown as:
�� � i1 … . 0k l k0 … 0m The number of rows represents femtocell IDs (1…Number of femtocells) & the number of
columns represent band IDs (1…Number of bands).
IM is an interference matrix defined as:
� � iU. �$ … .k l k… m The number of rows represent femtcell user IDs (1…Number of femtocell users) & the number
of columns represent femtocell IDs (1…Number of femtocells).
In 1�� g ��2 g ���h the first multiplication produces a vector of sums over all interfering
femtocells at user j as:
noU1 �$1 ���1,1� � U2 �$2 ���2,1� � p q, oU1 �$1 ���1,2� � U2 �$2 ���2,2� � p qr Thus every element in the array produced by the first multiplication is a summation of
interferences at a particular band. This is multiplied by a transposed band vector at the present
femtocell i, producing sum of only those interferences which are using the same band as the
present femtocell i.The capacity is thus calculated as:
��,� � ���1 � ]�����,�� where ] � 31.5 log�5 �_��\ s�8 �_� �t 10KM.
6.1.2.2 CA along with Co-Ordinated Multipoint Tx/Rx
To model the CoMP, the most interfering components of the Interference Matrix (IM)
are removed. One value is removed for each femtocell, so that each femtocell supports 1 CoMP
user. In reality more CoMP users per femtocell can be supported, but for the simplicity case 1
CoMP user per femtocell is considered. For each femtocell, a maximum value of interference is
found across all the users. This femtocell and the user form a CoMP pair, which adds to the
46
throughput of that user, only at those points where the sub-bands coincide. SINR for each user j
attached to cell i is calculated as:
�����,� � �� · U� · �$�,�1��,: g ��2 g ���h� ` �. · U. · �$�,.1��,: g ��2 g ��.h
c.���
.e�
where, c index represent those femtocells that provide CoMP to the user j. Nc(j) represents the
number of femtocells that can provide CoMP to user j. Nc(j) is found by counting elements of
another matrix, called CoMP-matrix, which is same dimension as the Interference Matrix, but
has a value of either 1 or 0, representing yes or no scenario for particular user-femtocell
combination if they form CoMP pair.
The Interference Matrix, IM, is modified from the one used in CA by zeroing the
elements which correspond to the CoMP user-femtocell pair. The zeroed elements are chosen
based on maximum value of interference, as calculated along all the users per each femtocell
i.e. one zero for each femto cell, at the place of worst interference. Capacity is later calculated
in the same way as for Carrier Aggregation.
6.2 Topology Used
Shown below in the fig 6.1 and fig 6.2 are the topologies used in the simulation. The Fig
6.1 represents 30 femtocells, along with 50 femtocell users and 5 macrocell users. There are 25
buildings, with 5 along the x axis and 5 along the y axis. The road width is taken approximately
as 10 m. The modulation scheme used is 64 Quadrature Amplitude Modulation (QAM) and the
bandwidth is 20MHz/ 100 MHz.
Fig 6.2 represents higher number of femtocell users, i.e. 50 femtocells, 120 femtocell
users and 10 macro users. The numbers of buildings, road width, modulation scheme and the
associated bandwidth parameters have been kept the same.
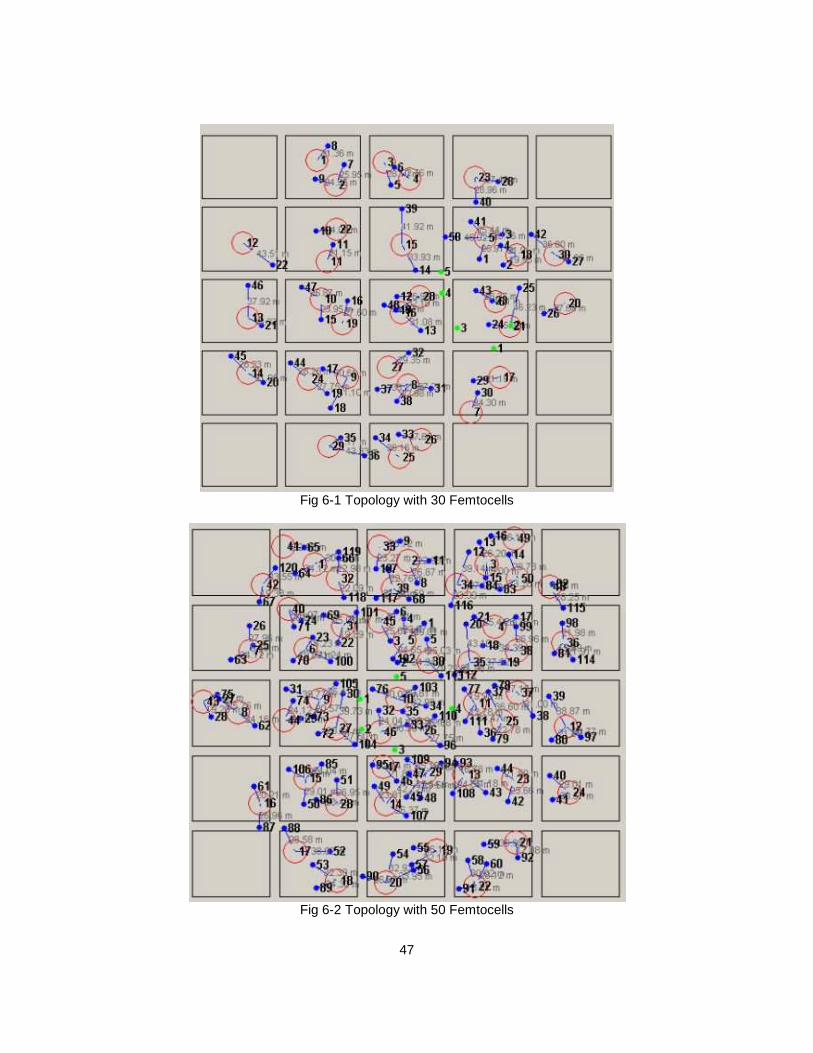
47
Fig 6-1 Topology with 30 Femtocells
Fig 6-2 Topology with 50 Femtocells
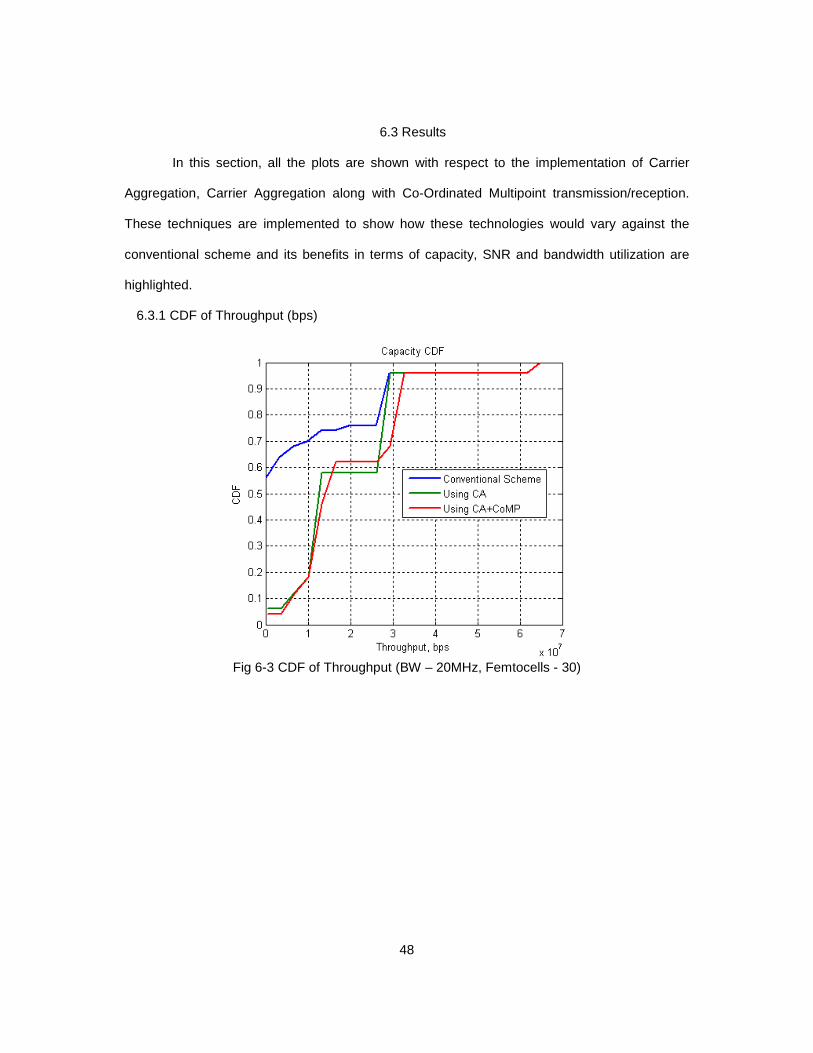
48
6.3 Results
In this section, all the plots are shown with respect to the implementation of Carrier
Aggregation, Carrier Aggregation along with Co-Ordinated Multipoint transmission/reception.
These techniques are implemented to show how these technologies would vary against the
conventional scheme and its benefits in terms of capacity, SNR and bandwidth utilization are
highlighted.
6.3.1 CDF of Throughput (bps)
Fig 6-3 CDF of Throughput (BW – 20MHz, Femtocells - 30)
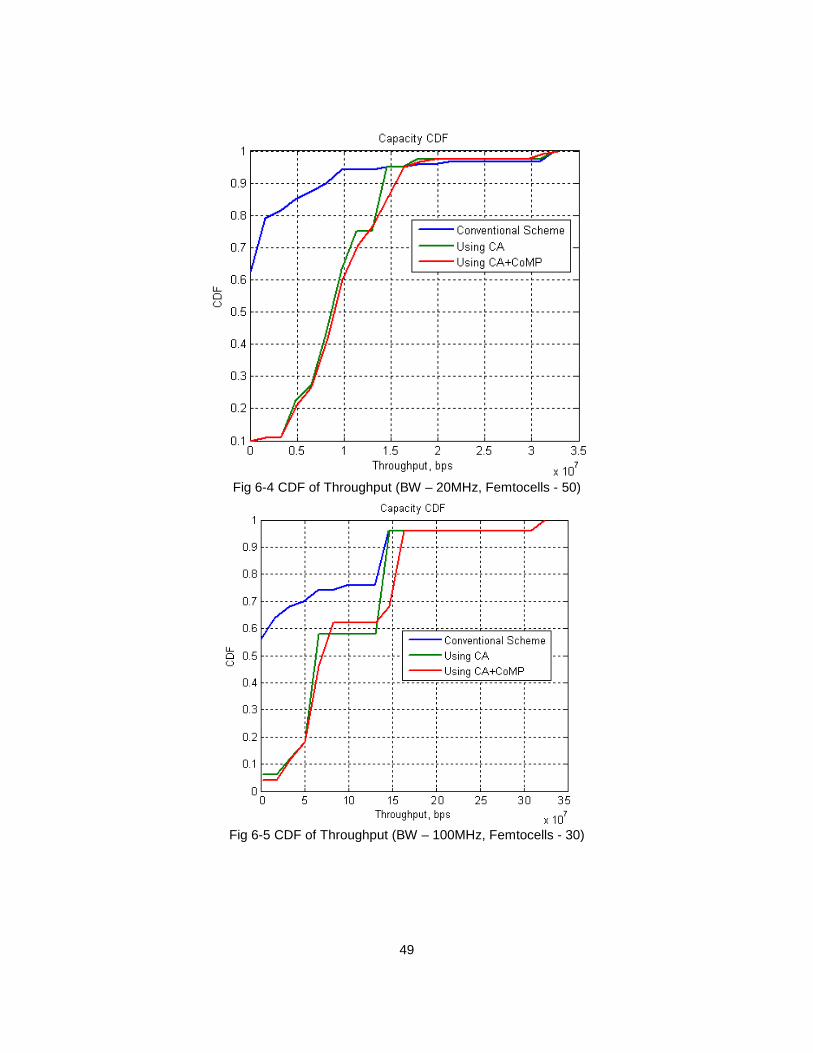
49
Fig 6-4 CDF of Throughput (BW – 20MHz, Femtocells - 50)
Fig 6-5 CDF of Throughput (BW – 100MHz, Femtocells - 30)
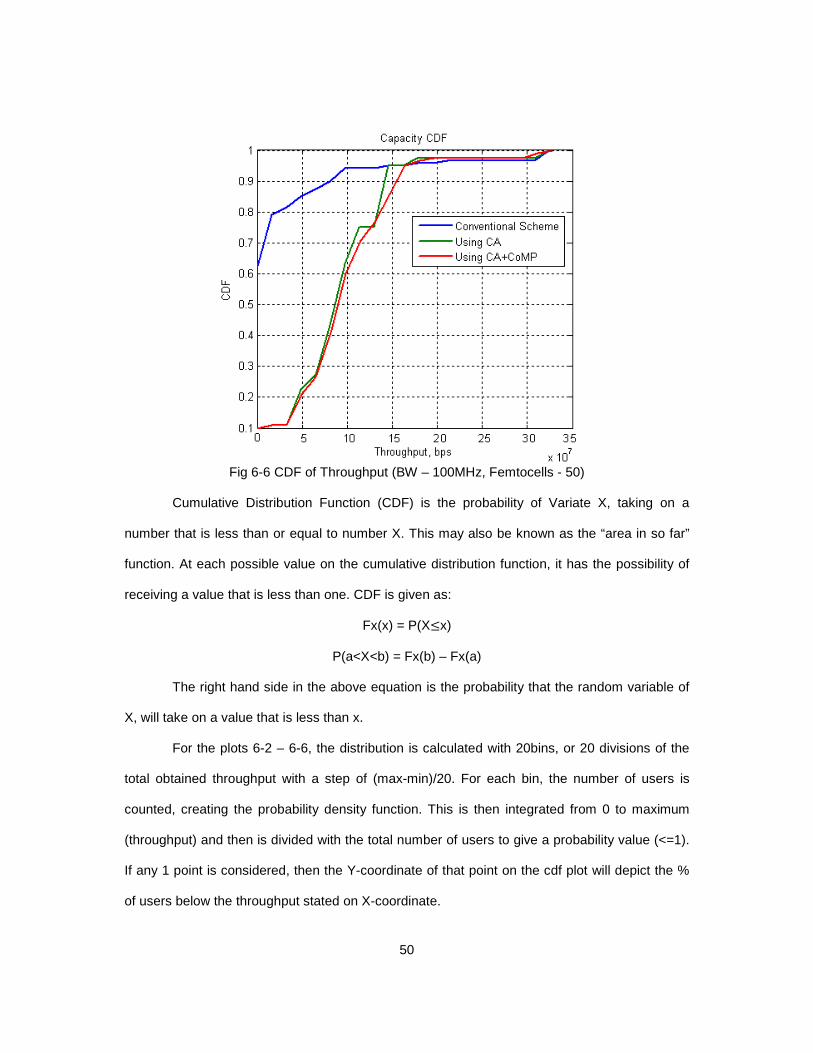
50
Fig 6-6 CDF of Throughput (BW – 100MHz, Femtocells - 50)
Cumulative Distribution Function (CDF) is the probability of Variate X, taking on a
number that is less than or equal to number X. This may also be known as the “area in so far”
function. At each possible value on the cumulative distribution function, it has the possibility of
receiving a value that is less than one. CDF is given as:
Fx(x) = P(Xwx)
P(a<X<b) = Fx(b) – Fx(a)
The right hand side in the above equation is the probability that the random variable of
X, will take on a value that is less than x.
For the plots 6-2 – 6-6, the distribution is calculated with 20bins, or 20 divisions of the
total obtained throughput with a step of (max-min)/20. For each bin, the number of users is
counted, creating the probability density function. This is then integrated from 0 to maximum
(throughput) and then is divided with the total number of users to give a probability value (<=1).
If any 1 point is considered, then the Y-coordinate of that point on the cdf plot will depict the %
of users below the throughput stated on X-coordinate.
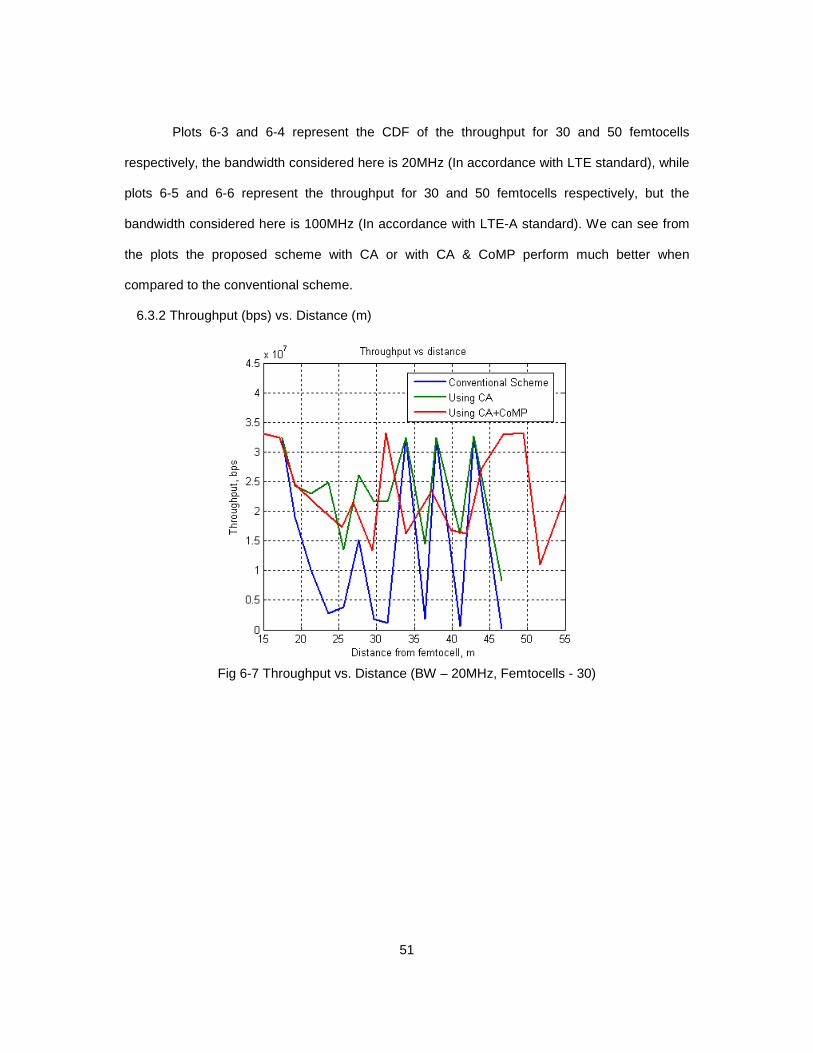
51
Plots 6-3 and 6-4 represent the CDF of the throughput for 30 and 50 femtocells
respectively, the bandwidth considered here is 20MHz (In accordance with LTE standard), while
plots 6-5 and 6-6 represent the throughput for 30 and 50 femtocells respectively, but the
bandwidth considered here is 100MHz (In accordance with LTE-A standard). We can see from
the plots the proposed scheme with CA or with CA & CoMP perform much better when
compared to the conventional scheme.
6.3.2 Throughput (bps) vs. Distance (m)
Fig 6-7 Throughput vs. Distance (BW – 20MHz, Femtocells - 30)
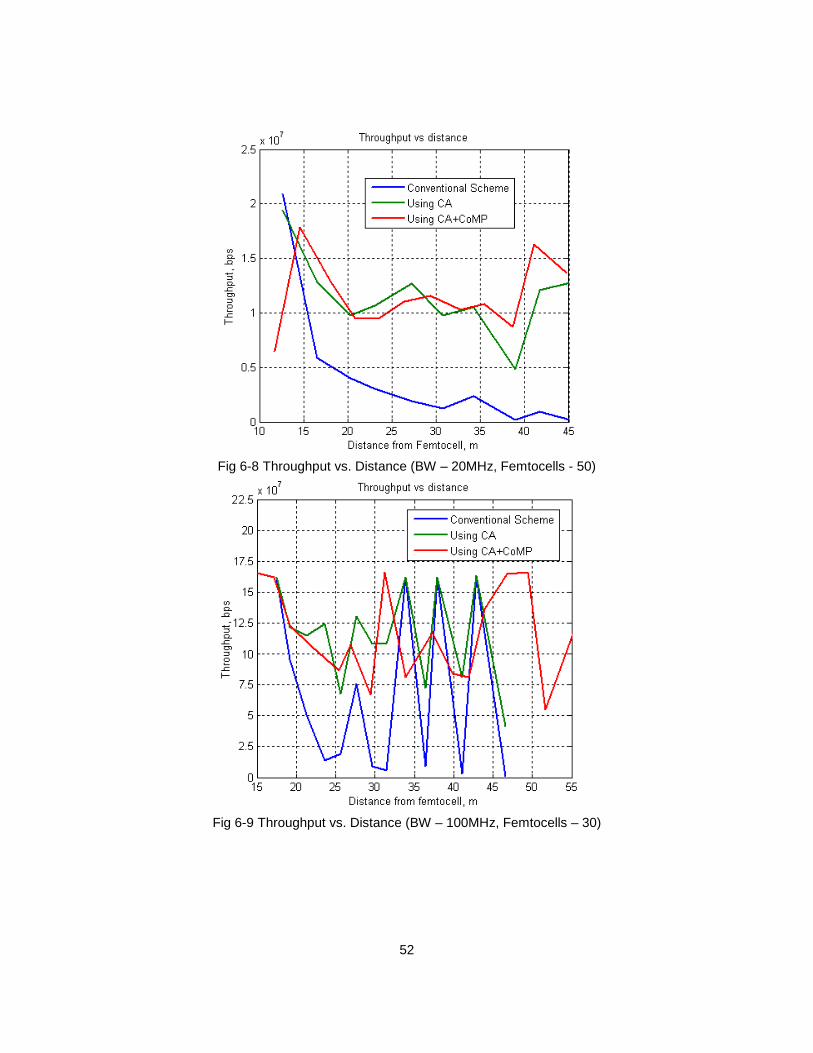
52
Fig 6-8 Throughput vs. Distance (BW – 20MHz, Femtocells - 50)
Fig 6-9 Throughput vs. Distance (BW – 100MHz, Femtocells – 30)
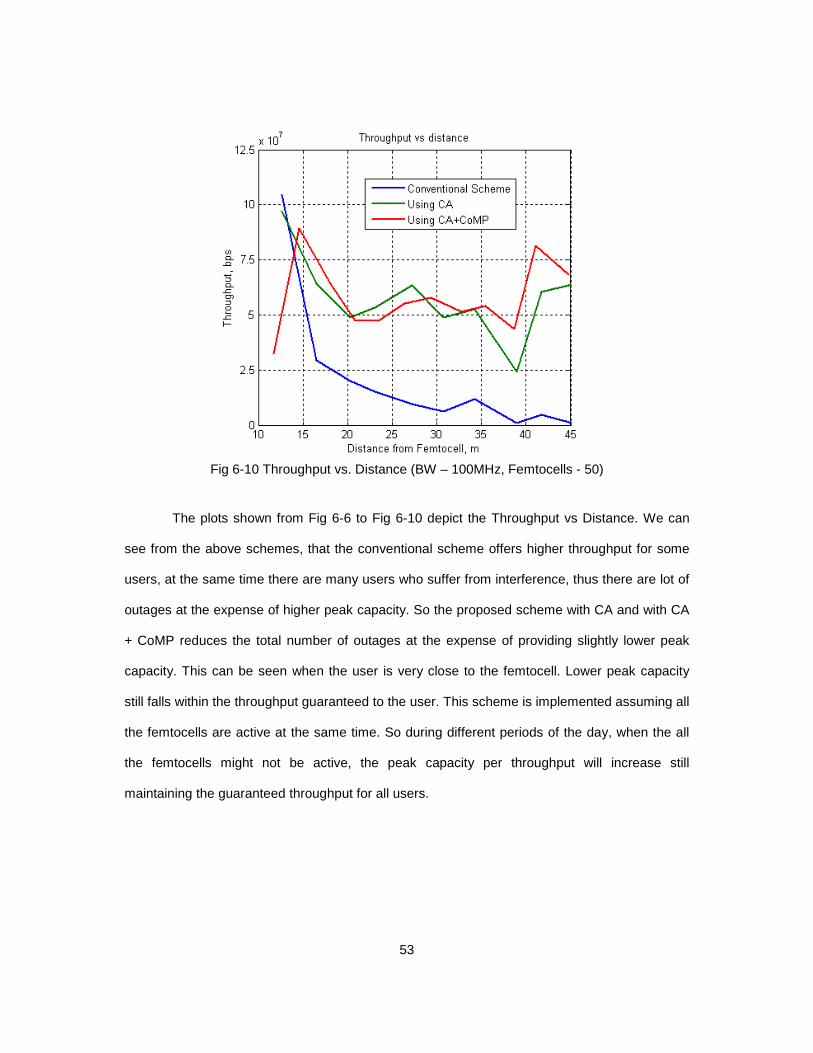
53
Fig 6-10 Throughput vs. Distance (BW – 100MHz, Femtocells - 50)
The plots shown from Fig 6-6 to Fig 6-10 depict the Throughput vs Distance. We can
see from the above schemes, that the conventional scheme offers higher throughput for some
users, at the same time there are many users who suffer from interference, thus there are lot of
outages at the expense of higher peak capacity. So the proposed scheme with CA and with CA
+ CoMP reduces the total number of outages at the expense of providing slightly lower peak
capacity. This can be seen when the user is very close to the femtocell. Lower peak capacity
still falls within the throughput guaranteed to the user. This scheme is implemented assuming all
the femtocells are active at the same time. So during different periods of the day, when the all
the femtocells might not be active, the peak capacity per throughput will increase still
maintaining the guaranteed throughput for all users.
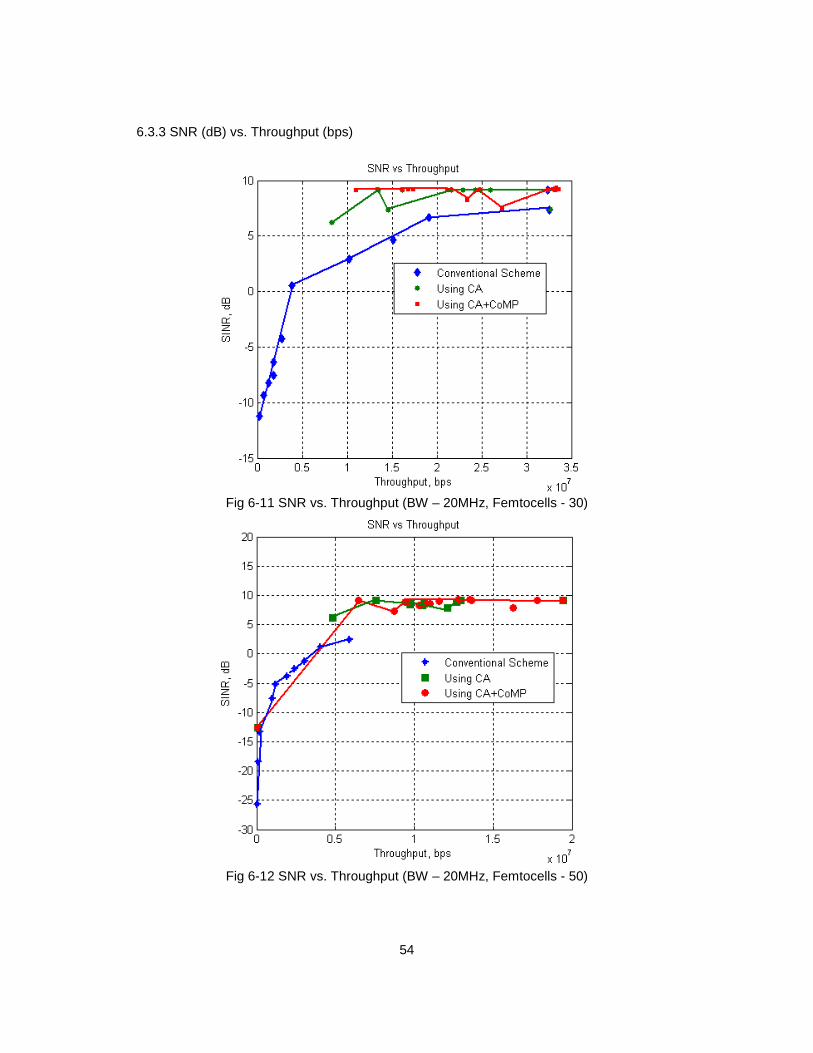
54
6.3.3 SNR (dB) vs. Throughput (bps)
Fig 6-11 SNR vs. Throughput (BW – 20MHz, Femtocells - 30)
Fig 6-12 SNR vs. Throughput (BW – 20MHz, Femtocells - 50)
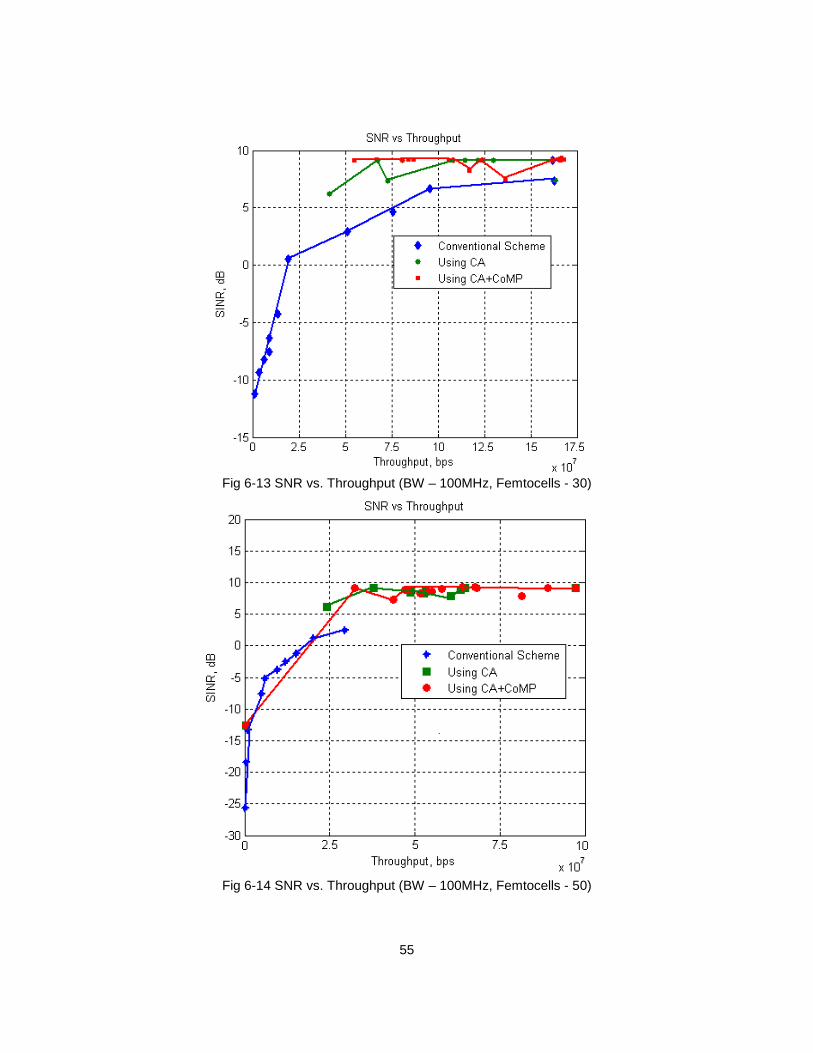
55
Fig 6-13 SNR vs. Throughput (BW – 100MHz, Femtocells - 30)
Fig 6-14 SNR vs. Throughput (BW – 100MHz, Femtocells - 50)
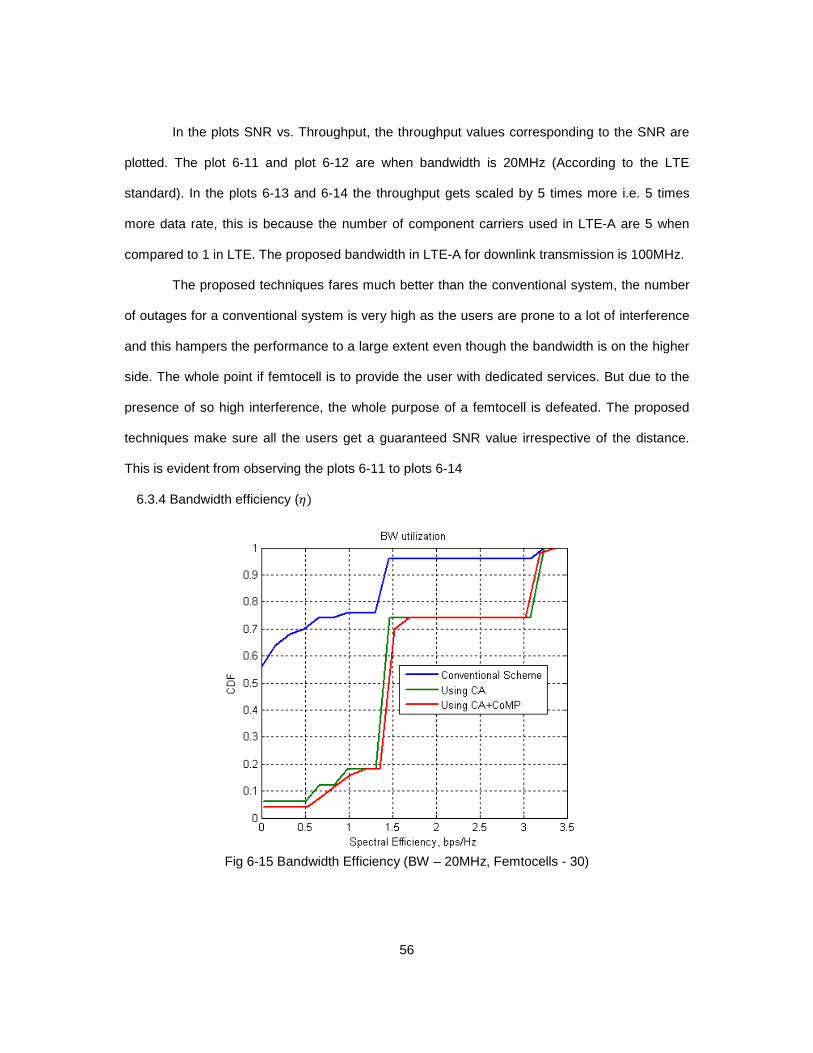
56
In the plots SNR vs. Throughput, the throughput values corresponding to the SNR are
plotted. The plot 6-11 and plot 6-12 are when bandwidth is 20MHz (According to the LTE
standard). In the plots 6-13 and 6-14 the throughput gets scaled by 5 times more i.e. 5 times
more data rate, this is because the number of component carriers used in LTE-A are 5 when
compared to 1 in LTE. The proposed bandwidth in LTE-A for downlink transmission is 100MHz.
The proposed techniques fares much better than the conventional system, the number
of outages for a conventional system is very high as the users are prone to a lot of interference
and this hampers the performance to a large extent even though the bandwidth is on the higher
side. The whole point if femtocell is to provide the user with dedicated services. But due to the
presence of so high interference, the whole purpose of a femtocell is defeated. The proposed
techniques make sure all the users get a guaranteed SNR value irrespective of the distance.
This is evident from observing the plots 6-11 to plots 6-14
6.3.4 Bandwidth efficiency (��
Fig 6-15 Bandwidth Efficiency (BW – 20MHz, Femtocells - 30)
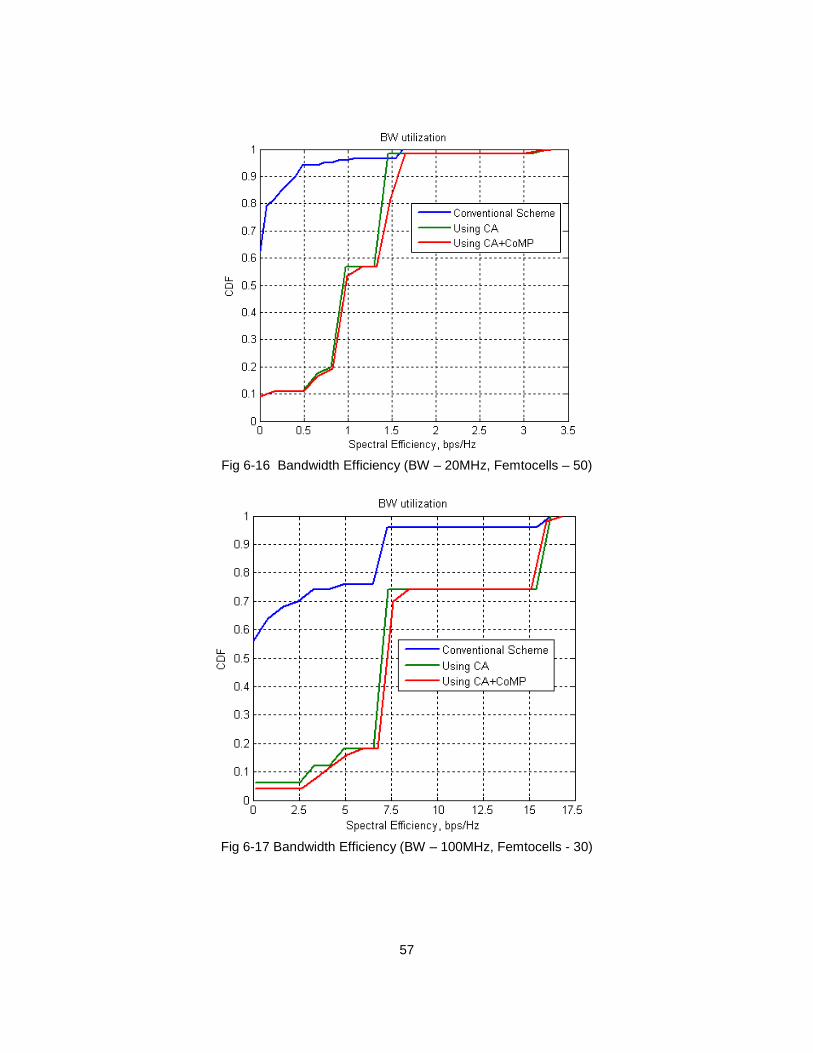
57
Fig 6-16 Bandwidth Efficiency (BW – 20MHz, Femtocells – 50)
Fig 6-17 Bandwidth Efficiency (BW – 100MHz, Femtocells - 30)
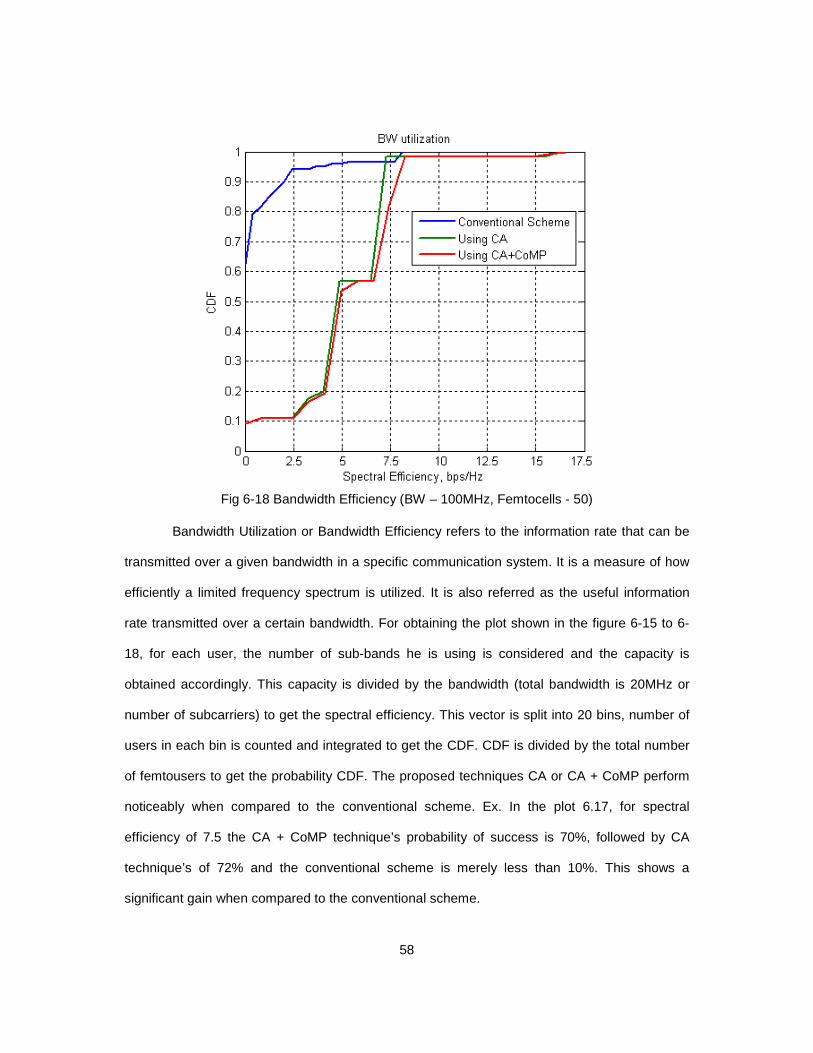
58
Fig 6-18 Bandwidth Efficiency (BW – 100MHz, Femtocells - 50)
Bandwidth Utilization or Bandwidth Efficiency refers to the information rate that can be
transmitted over a given bandwidth in a specific communication system. It is a measure of how
efficiently a limited frequency spectrum is utilized. It is also referred as the useful information
rate transmitted over a certain bandwidth. For obtaining the plot shown in the figure 6-15 to 6-
18, for each user, the number of sub-bands he is using is considered and the capacity is
obtained accordingly. This capacity is divided by the bandwidth (total bandwidth is 20MHz or
number of subcarriers) to get the spectral efficiency. This vector is split into 20 bins, number of
users in each bin is counted and integrated to get the CDF. CDF is divided by the total number
of femtousers to get the probability CDF. The proposed techniques CA or CA + CoMP perform
noticeably when compared to the conventional scheme. Ex. In the plot 6.17, for spectral
efficiency of 7.5 the CA + CoMP technique’s probability of success is 70%, followed by CA
technique’s of 72% and the conventional scheme is merely less than 10%. This shows a
significant gain when compared to the conventional scheme.
59
Chapter 7
Conclusion and Futurework
7.1 Conclusion
Femtocells are an integral part of the LTE-A heterogeneous networks as documented
according to LTE-A standards. They promise superior increase in the throughput and reduced
latencies to the customers. These however come at a risk of high interference due to which
indoor users observe lot of outage. In such a scenario, the whole purpose of providing indoor
base stations is defeated.
The main purpose of this thesis was to design a scheme where this interference is
mitigated, providing the user favorable signal to noise ratio values thus giving the user high
throughput, which in turn increases the overall capacity. To achieve the required, Carrier
Aggregation (CA along with Co-Ordinated Multipoint transmission/reception (CoMP)
technologies as described in the LTE-Advanced features specified by IMT-A are used.
An open source system level simulator is used. The simulator’s framework consists of a
macrocell with multiple femtocells embedded in it. The user has the freedom to place these
femtocells, macro users, femto users at any point in the topology. Various other factors such as
the modulation scheme, the road width, number of buildings in the x and y axis are also to be
entered by the user in the provided graphical user interface. Metrics such as SNR, throughput,
distance from the femtocell, CDF are considered to highlight the difference in the performance
between the conventional scheme and the scheme proposed in this thesis. The plots in the
chapter “Results & Analysis” show a significant performance increase when compared with the
conventional scheme. The conventional scheme provides higher throughput to those users who
are not affected by any interference and very low throughput and outage for many users who
are affected by interference. The proposed scheme reduces these outages by carefully
allocating the sub-channels to all the users, thus providing a guaranteed throughput irrespective
of their distances from femtocell.

60
CA in collaboration with CoMP fares slightly better when CA is used alone, however CA
used with CoMP will show better results when there are more than 1 CoMP users per H-eNB.
For simplicity purpose only one CoMP user per H-eNB is considered. To conclude Carrier
Aggregation along with Co-Ordinated Multipoint transmission/reception show superior
performance and these are illustrated by the help of performance metrics.
7.2 Futurework
With reference to the future work, more macro cells along with higher number of
macrocell users should be considered and schemes need to be designed to reduce these
cross-layer interferences. MIMO increases the throughput considerably, by exploring the
advantages of the space time coding schemes. These multiple antennas have to be
incorporated into these femtocell networks, to see how the performance increases.
The downside to this technology is the increase in overall complexity due to CA and
CoMP. Due to dynamic allocation of subcarriers, the complexity involved will be on the higher
side. Future studies can also be focused on lowering this complexity, reducing the overhead
and making the process even simpler thus exerting less pressure/lower strain on overall
resources. With the rapid increase in the usage of smartphones and due to need for higher data
rates, even more enhanced techniques would be needed to reach higher speeds and reduce
latency.
.
61
References
[1] Stefania Sesia, Issam Toufik and Matthew Baker. LTE - The UMTS Long term
Evolution from Theory to Practice, 2009
[2] John G. Proakis, Masoud Salehi and Gerhard bauch. Contemporary Communications
using Matlab, 2004
[3] Jie Zhang and Guillaume de le Roche. Femtocells - Technologies and Deployment,
2010
[4] Simon R Saunders and Stuart Carlaw. Femtocells - Opportunities and Challenges for
Business and Technology, 2009
[5] Bo Li, An effective Inter-Cell Interference Interference Coordination Scheme for
Heterogeneous network. IEEE 2011
[6] Stefan Brueck, Heterogeneous Networks in LTE - Advanced, 8th International
Symposium on Wireless Communication Systems, Aachen IEEE 2011
[7] Liya Yi and Tao Cui, Interference Mitigation between Femtocell and Macrocell (The
Coming of Attocell). 2011 International Conference on Electronics and
Optoelectronics (ICEOE 2011)
[8] Su Huan, Kuang Linling and Lu Jianhua, Interference Avoidance in OFDMA - Based
Femtocell Network. IEEE 2009
[9] Avani Dalal, Hailong Li and Dharma P. Agawal, Fractional Frequency Reuse to
Mitigate Interference in Self-Configuring LTE-Femtocells Network, 8th IEEE
International Conference on Mobile Ad-Hoc and Sensor Systems, 2011
[10] Noriaki Miyazaki, Xiaoqiu Wang, Masashi Fushiki and Satoshi Konishi, Interference
Coordination of the Downlink Control Channel under Macro-Femto Deployment
in Long Term Evolution, 8th International Symposium on Wireless Communication
Syatems, Aachen 2011
62
[11] Hyung G. Myung, Junsung Lim, and David J. Goodman, "Single Carrier FDMA for
Uplink Wireless Transmission," IEEE Vehicular Magazine, vol. 1, no. 3,
September 2006.
[12] C. Gessner, "UMTS Long Term Evolution LTE Technology Introduction," Rohde &
Schwarz, 2007.
[13] 3GPP LTE - Long Term Evolution. [Online]. http://3gppltelongtermevolution.
blogspot.com/2010/06/introduction-to-lte.html
[14] v8.5.0 3GPP TS 36.300, "E-UTRA and E-UTRAN, Overall Description; Stage 2
(Release 8)," 2008.
[15] LTE-A Femto-Macro Throughput Simulator.
http://ru6.cti.gr/ru6/femtomacro_throughput_simulator.zip
63
Biographical Information
Rohan Nag Kummithe completed his Bachelor of Engineering from Visvesvaraya
Technological University, Karnataka, India in 2009. He then chose to pursue his graduate
studies in the Department of Electrical Engineering at The University of Texas at
Arlington in Fall 2010. During the course of his graduate studies he worked under the
guidance of Dr. Qilian Liang in the Wireless Communication and Networking Lab. He
interned at Motorola Mobility at Libertyville, Illinois during Fall 2011 and Spring 2012.