Embed Size (px)
Citation preview

1
Intergenerational Mobility and the Role of Education in Korea
Hisam Kim
Fellow, Korea Development Institute
Ⅰ. Introduction
It is well known that one’s parents matter when it comes to his/her life trajectory. But the degree of
parental influence differs across countries and over time. A good knowledge on the strength of the
intergenerational transmission of socio-economic status (hereafter SES) in a society illuminates the
opportunity of upward mobility for the next generation, specifically for underprivileged children. In
addition, investigation on the main paths through which both intergenerational transmission and
intergenerational mobility occur, will hint at policy measures that ensure equal opportunity and
prevent talent loss.
In this study, we examine social mobility focusing on intergenerational mobility and evaluate the role
of education in the rise and fall of such mobility. The reasons why we pay special attention to the role
of education are as follows. First, education can be a ladder for upward mobility if the rate of return to
schooling (particularly higher education) is sufficiently high, which is a necessary condition for
children from humble families to rise. Second, education, however, can only be a conduit of passing
down parents’ SES if the quantity and quality of children’s educational attainments are largely
influenced by parental wealth. Then, the high educational return is appropriated by children from
affluent families. Third, education policy is a qualified measure of enhancing social mobility. In
Finland, for example, intergenerational mobility was increased by the 1950s baby-boomers’ widening
participation in secondary education (Pekkala and Lucas, 2007) and the 1972-1977 education reform
that provided homogenous education until age 15 with postponing academic-vocational tracking age
from 11 to 16 (Pekkarinen, Uusitalo, and Kerr, 2003). Fourth, governmental intervention via
education policy, specifically reducing educational gap in the early childhood to strengthen social
cohesion is politically easier as well as economically more efficient compared with income
redistribution in adulthood.
We use various datasets for this study. Among others, the following two datasets merit special notice.
I conducted an Internet-based survey of 3,000 Koreans in the name of “KDI Happiness Study

2
(hereafter KHS) 2013,” of which the purpose is stemmed from the commitment of Korea
Development Institute (KDI), to improve the happiness among Koreans.1 We included a special set of
questions about intergenerational mobility for this study in the questionnaire of KHS 2013. For
international comparison, we also incorporate some questions contained in Osaka University Global
COE (The 21st Century Center of Excellence Program) data (hereafter GCOE data), which allow us
to compare Korea with Japan, the United States of America, China, and India on selected question
items.
We obtained data for estimating intergenerational mobility from the Korean Labor and Income Panel
Study (hereafter KLIPS). The KLIPS is an annual survey of 5,000 households and their members
(aged fifteen and over) from the seven metropolitan cities and urban areas in eight provinces
(excluding Jeju Island). Since its second-year survey in 1999, the KLIPS has surveyed split-off
children’s households that include ex-members of the original 5,000 households. The most frequent
reason of split-off is the children’s marriage and startup of their own new families. By matching split-
off children’s economic standings with their parents’ we can acquire father-son pairs (or father-
daughter pairs) to be used in estimation of intergenerational mobility. Now that the KLIPS has 15-
wave panel data as of 2014, we have nearly 700 father-son pairs (and 700 father-daughter pairs)
although the valid sample size is smaller depending on the variable of economic standings. We
observe individual wage and earning as well as household income and net worth (i.e., total wealth
minus total debt). Multiple wave observations of each economic variable enable us to reduce
measurement errors and temporary shocks in the variables of our interest by averaging them using real
terms.
The remainders are organized as follows. Section II delivers growing pessimism among Koreans
regarding their children’s upward mobility. Section III empirically analyzes intergenerational mobility
1 We selected Macromill-Embrain Inc., the top web survey agency in Korea, which boasts a database of
980,380 people (as of the end of July 2013) of Korean panel respondents nationwide. We obtained 3,000 Korean
respondents aged 20 through 69 using stratified random sampling from the panel. The company executed our
survey under the direction of the authors and the survey experts of KDI Economic Information and Education
Center from October 17 to November 13, 2013. We used payment incentives and e-mail/SNS to encourage
participation and made additional efforts of phone calls and follow-up surveys to assure whether previous web
responses were accurate. Researchers often have concerns about the potential selection bias of a web survey
because of the possibility of excluding those who only have limited access to the Internet such as elderly people
or those living in rural areas. However, Korea’s world-class Internet penetration rate (e.g. as of December 2011,
Korea’s high speed wireless Internet penetration rate reached 100.6%, the first in the world owing to its well-
established IT infrastructure and rapid increase of smartphone users nationwide, while OECD average is 54.3%)
partially relieves our concerns about selection bias.

3
and the role of education, examines people’s mobility expectation for the next generation, and shows
evidence for a growing divide in education. In section IV, we discuss policy directions for enhancing
social mobility, which include preventing talent loss, strengthening social inclusion, and helping in
opening multiple routes to success. And the last chapter concludes.
Ⅱ. Backgrounds
Many Korean parents devoted themselves in improving their children’s future by investing heavily in
education even when poverty prevailed. At least, they were optimistic about the future and believed
that their children would be better off. Does such optimism still exist among Koreans?
<Figure 1> Changes in Expectation about Child’s Upward Mobility
Q. What is your expectation on the chance that your children will fare better than you?
Note: The question was asked to the household head. Changes in the answer choice set before 2006 resulted in
the non-existence of a specific answer in a certain year.
Source: Statistics Korea, Social Survey, each year.
Statistics Korea, the governmental statistical agency, has conducted social survey, which includes a
question about people’s expectation on the upward mobility of their children. <Figure 1> shows the
0.8 2.2 5.5 5.6 6.3 9.6 9.8 4.3 8.9
14.3 23.4 24.5
33.4 34.0
11.0
16.8
31.2 20.9
15.4 16.4
34.6
36.6 17.9
52.0
36.1 40.4 34.0 43.8
37.7 36.3
8.4 5.1 5.1 5.9 4.6 4.0 3.6
0%
10%
20%
30%
40%
50%
60%
70%
80%
90%
100%
1994 1999 2003 2006 2009 2011 2013
Very High
Relatively high
Neither high nor low
Don't know
Relatively low
Very low
4
changes in their responses to the relevant question, “What is your expectation on the chance that your
children will fare better than you?” for the recent two decades. All respondents were household heads
of representative families. The proportion of negative answers (“relatively low” plus “very low”) has
shown a monotonous increase (’94: 5.1%→’99: 11.2%→’03: 19.8%→’06: 29.0%→’09: 30.8%→’11:
42.9%→’13: 43.7%).
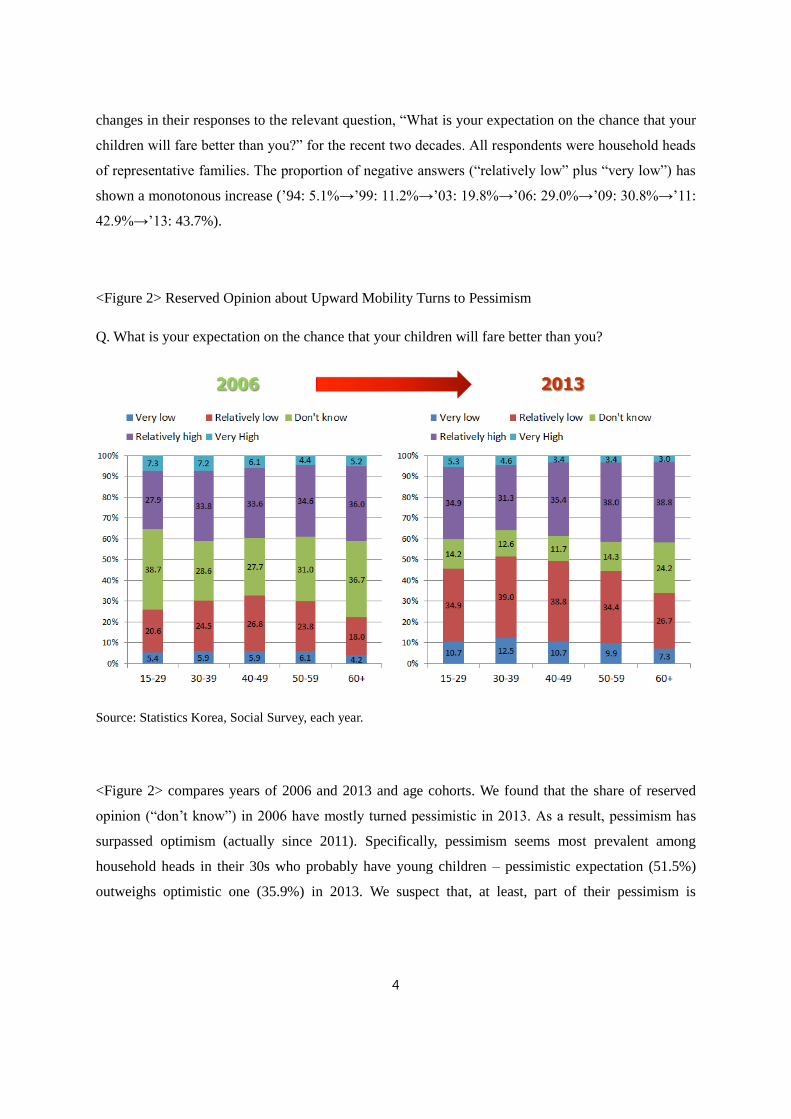
<Figure 2> Reserved Opinion about Upward Mobility Turns to Pessimism
Q. What is your expectation on the chance that your children will fare better than you?
Source: Statistics Korea, Social Survey, each year.
<Figure 2> compares years of 2006 and 2013 and age cohorts. We found that the share of reserved
opinion (“don’t know”) in 2006 have mostly turned pessimistic in 2013. As a result, pessimism has
surpassed optimism (actually since 2011). Specifically, pessimism seems most prevalent among
household heads in their 30s who probably have young children – pessimistic expectation (51.5%)
outweighs optimistic one (35.9%) in 2013. We suspect that, at least, part of their pessimism is

5
attributed to their despair of catching up with affluent families’ investment for their young children.3
<Figure 3> Do Diligence and Effort Still Pay?
Q. What do you think is the most important factor for success in Korea?
Note: The responses were from 1,500 (1,200 in 2006 and 2008) adults (aged 19 to 64) of nationwide household
surveys.
Source: Korean Educational Development Institute, Public Opinion Survey on Education, each year.
<Figure 3> reports a growing skepticism toward diligence and effort as the most important factor for
success in Korea. In 2006, 41.3% of Koreans considered diligence and effort to be the most important
factor, followed by educational background and connections (33.8%). Just four years later, however,
diligence and effort (29.7%) yielded the top position to educational background and connections
3 For example, so-called “English divide” appears between kindergarten children. Koreans tend to value
English proficiency because they believe it helps them get better jobs. According to data from the Ministry of
Education reported to the National Assembly, the number of private English daycare centers where children are
given English-only lessons has increased from 181 in 2009 to 235 in 2014. Among them, the number of
expensive ones that receive more than 1 million won per month from each child also increased from 20 in 2009
to 133 in 2014. As English is a foreign language that requires deliberately huge investment to acquire
proficiency in Korea, more salient income-based differences were observed in English scores on the KSAT than
in math or Korean scores (Kim, 2012).
41.3 38.0 29.7
33.8 39.5 48.1
14.8 9.5 11.5
7.4 10.3 6.8 2.7 2.7 3.9
0%
20%
40%
60%
80%
100%
2006 2008 2010
Luck and opportunity
Innate ability
Family background
Educational background and
connections
Diligence and effort

6
(48.1%) which are generally considered as the obstacle to meritocracy or fairness.
This weakening belief in the power of hard work as the key success factor in recent years is confirmed
by age cohort comparison using survey data from KHS 2013. The corresponding statement in the
survey is “The most important factor for success in life is hard work rather than luck and personal
connections.” Since the same question was contained in Osaka University’s GCOE 2012 survey, we
can also compare across countries.
As panel A of <Figure 4> shows, the fraction of people who think that hard work is the most
important factor for success is systematically diminishing as respondents are younger. Optimism
(agree plus completely agree) dominates among 60s (75.5%) but considerably shrinks among 20s
(51.2%) in contemporary Korea. In other countries, however, such a growing pessimism among the
young is not observed. Panels B through E do not show any evident pattern that younger generation
are less apt to believe that hard work pays in the USA, Japan, China, and India. Instead, we can find a
positive outlook among American 20s comparable to 50s and 60s, and overall optimism in China and
India (people in urban areas were surveyed for this item in both countries) whose people are currently
experiencing rapid economic growth.

7
<Figure 4> Opinion on the Key Success Factor (“The most important factor for success in life is hard
work rather than luck and personal connections”) by Age Cohort
A. Korea (n=3,000)
B. USA (n=2,960)
C. Japan (n=4,142)
D. China (n=1,370)
E. India (n=797)
Source: KHS 2013 for Korea, GCOE 2012 for other countries.
17.6 14.7 19.7 27.1 31.0
33.6 41.0 43.4
43.2 44.5
34.6 32.6 27.2
24.5 18.6 12.6 9.9 8.6 4.2 5.1 1.6 1.9 1.2 1.0 0.7
0%
20%
40%
60%
80%
100%
20s 30s 40s 50s 60s
Completely disagree
Disagree
Neither agree nor disagree
Agree
Completely agree
29.6 23.6 22.8 28.4 33.1
34.3 33.7 35.3
34.4 34.3
24.5 29.2 28.5 24.7 20.9
8.2 10.1 10.1 10.1 9.0 3.5 3.4 3.3 2.4 2.7
0%
20%
40%
60%
80%
100%
20s 30s 40s 50s 60s
15.5 12.3 11.6 11.6 19.1
40.4 41.1 42.0 43.7 45.5
31.5 39.7 39.2 39.7 31.9
12.2 5.8 6.4 4.1 3.3 0.5 1.2 0.8 0.8 0.3
0%
20%
40%
60%
80%
100%
20s 30s 40s 50s 60s
23.6 22.8 18.1 22.1 24.8
43.8 44.6 47.1 46.4 45.1
23.6 22.1 27.2 23.2 21.4
8.0 10.1 6.2 7.6 8.6 1.1 0.4 1.4 0.7 0.0
0%
20%
40%
60%
80%
100%
20s 30s 40s 50s 60s
54.7 53.1 53.1 48.8 55.4
40.0 40.8 38.6 43.1 36.7
3.2 4.6 3.9 6.9 5.8 2.1 1.0 2.9 0.6 1.4 0.0 0.5 1.4 0.6 0.7
0%
20%
40%
60%
80%
100%
20s 30s 40s 50s 60s

8
<Figure 5> Opinion on Market Economy (“Although an economy driven by market forces widens the
income gap between the rich and the poor, it makes people wealthier in general; so in total, they are
better off”) by Age Cohort
A. Korea (n=3,000)
B. USA (n=2,956)
C. Japan (n=4,130)
D. China (n=1,370)
E. India (n=797)
Source: KHS 2013 for Korea, GCOE 2012 for other countries.
4.2 2.9 2.4 5.1 6.9
25.2 27.6 35.0 39.5
46.4
44.4 44.5 40.5
38.2 31.8
20.3 19.6 17.0 12.7 14.2 5.9 5.4 5.0 4.5 0.7
0%
20%
40%
60%
80%
100%
20s 30s 40s 50s 60s
Completely disagree
Disagree
Neither agree nor disagree
Agree
Completely agree
7.5 6.1 6.5 8.4 9.3
14.7 13.2 14.1 15.7 12.6
43.9 41.9 41.9 36.3 38.1
20.8 20.8 19.4 20.4 19.4
13.1 17.9 18.1 19.1 20.5
0%
20%
40%
60%
80%
100%
20s 30s 40s 50s 60s
4.2 1.8 1.7 1.2 2.0
17.4 19.9 19.6 19.6 19.7
61.5 61.9 63.5 64.0 62.7
12.2 13.9 13.3 12.9 12.1 4.7 2.5 2.0 2.3 3.5
0%
20%
40%
60%
80%
100%
20s 30s 40s 50s 60s
9.8 10.9 13.0 13.4 13.5
44.9 45.7 44.9 46.4 49.2
34.4 34.4 27.5 30.8 32.0
10.1 7.6 13.4 9.4 4.1 0.7 1.4 1.1 0.0 1.1
0%
20%
40%
60%
80%
100%
20s 30s 40s 50s 60s
25.3 28.1 26.6 30.0 26.6
42.1 39.8 37.2 43.8
34.5
16.8 17.3 21.3 13.1
22.3
12.6 10.7 10.1 10.0 10.8
3.2 4.1 4.8 3.1 5.8
0%
20%
40%
60%
80%
100%
20s 30s 40s 50s 60s

9
Growing negative opinion about the payoff of hard work seems to appear in widening criticism of
market economy. <Figure 5> shows age-specific opinion about the capability of market economy in
making the pie bigger, suggested as the statement, “Although an economy driven by market forces
widens the income gap between the rich and the poor, it makes people wealthier in general; so in total,
they are better off.” The KHS 2013 survey provides striking evidence for growing skepticism about
market economy among the young. The proportion of pro-market economy supporters is more than
half (53.3%) among Koreans in their 60s but only 29.4% among Korean 20s, and it decreases
monotonically as the respondent is younger.
According to GCOE 2012 data, other countries do not show such a systematic difference by age
cohort in their opinion about market economy. Although people from stabilized advanced economies
such as the USA and Japan seem to hold market economy in low regards as the measurement of
making themselves wealthier, their opinions are quite similar regardless of their age. In China and
India, people have very positive view on market economy reflected by the high economic growth
rates and the absence of conspicuous differences in their opinion by age cohort.
Ⅲ. Analyses
1. Intergenerational Mobility and Education
A. Intergenerational Persistence of Economic Standings and the Role of Education
The degree of intergenerational persistence of economic standing is usually gauged by the
intergenerational elasticity using the following regression model.
(1)
,
where is child (usually son) i’s economic variable (usually wage or income), is the
economic variable of the parent (usually father) of the child i, and are respectively
child i’s and his parent’s age, and is an error term. To reduce measurement errors and adjust
temporary shocks of the economic variable, we use multi-year average instead of an observation of a
specific year. As the measure of economic standings, we use wage, earning, household income, and
net worth. Our preferred measure is wage because we are interested in how an individual’s labor
market outcome is influenced by his father via investment in education.

10
As mentioned earlier, we use split-off children sample from the KLIPS data for empirical
implementation. Since the KLIPS data provide father’s economic variables from 1998 to 2012 (not
every year though in case of retirement), we use 1998~2012 real value average for valid observations
as to approximate father’s permanent income. As for children’s economic variables, , we use
2008~2012 real value average for valid observations to exclude split-off children’s immature labor
market outcomes as well as reduce measurement errors and temporary shocks more likely to be
included when a single year’s observation is used. We control for fathers’ and children’s average ages
(and their squares) when their economic variables were observed in the data considering age profile of
economic standings (and potential no-linearity).4
The estimate of in equation (1) represents the intergenerational elasticity, which answers “By what
percent will one’s wage increase compared with the average wage of his generation when the wage of
his father was 1 percent higher than the average wage of the father’s generation?” Lower
intergenerational elasticity means higher intergenerational mobility.
Following Solon (2004) and Blanden (2005), we consider the role of education in underpinning
intergenerational persistence by extracting the component that can be explained by educational
investment from the overall intergenerational elasticity. First, parental affluence can affect the
educational attainment of children both through inherited ability (“nature”) that is associated with
parental income and influences children’s learning performance and through parental investment in
the quantity and quality of children’s human capital (“nurture”).
(2) ,
where is the child i’s educational attainment and is parental income, and is an error term.
To consider the heterogeneity of fathers’ age when their incomes were observed, we control for the
average age when the father’s income variables were observed in the data and its square. The degree
of influence of father’s affluence on child’s education is measured by the magnitude of estimated .
Next, the benefit of the child’s educational attainment on his economic standing can be estimated by
the rate of return to schooling in a Mincerian wage equation:
4 In our sample of son-father pairs, and in the case of the subsample for analyzing intergenerational wage
elasticity, the average birth years of father and son are 1946 and 1976 respectively and their average ages
(standard errors) when wages were observed are 57 (6 years) and 34 (4 years) respectively. In the corresponding
subsample, the average birth years of father and daughter are 1947 and 1977 respectively and their average ages
(standard errors) when wages were observed are 56 (6 years) and 33 (4 years) respectively.

11
(3) .
Now, the overall intergenerational elasticity can be decomposed into the influence of parental income
on the child’s education ( ) multiplied by the rate of return to education ( ), plus the remaining
intergenerational persistence that is not transmitted through education and represented by the
influence of parental income on the residual in equation (3). Therefore, we can rewrite as the
sum of two components as follows:
(4)
.
We should note that captures the component of intergenerational elasticity explained only by the
quantity of education because the data available only allows education to be measured by the years of
completed final education. Thus, the quality of education such as the prestige of college education
(i.e., university ranking that affects labor market outcomes) as well as many other unobserved factors,
will be included in the unexplained component. Consequently, the whole role of education in
intergenerational persistence would be bigger than measured by the magnitude of .
<Table 1> reports our estimates of intergenerational elasticity and its component explained by
children’s education level. According to panel A, father-son elasticity varies in the range of 0.122 to
0.328 depending on the variable used to measure the father’s and the son’s economic standing. Our
preferred estimate of father-son wage elasticity is 0.225, which means when a father’s wage was
double (i.e. 100% higher), his son will have 22.5% higher wage.5
Here we reserve our judgment of a large or small amount of mobility and will discuss it later in
<Figure 6> through making comparisons of the extent of intergenerational mobility across countries.
The rate of return to education ranges 6.1% to 18.2% depending on the measure of economic
standings. The influence of father’s affluence on son’s education has the largest estimate when we
look at the association of son’s education level with father’s wage, which confirms our hypothesis that
wage is an appropriate measure that reflects the labor market performance of both generations and
5 Other studies that used data from the KLIPS also produced the similar estimates of intergenerational income
elasticity (Kim, Kim, and Ha, 2009; Choi and Hong, 2011). The magnitudes of the elasticity estimates are higher
when instrumental variables (e.g. education level) are used for father’s income (Kim, Kim, and Ha, 2009; Choi
and Hong, 2011; Yang, 2012) or when children who live with their parents are included in the sample (Yang,
2012). For international comparison, however, we do not use instrumental variables but use averaged real
earnings observed in the data and confine the children sample to adults who do not live with their parents as
most studies do for other countries.

12
well capture parental influence on child’s human capital via differing endowments and differing
investments across families.
<Table 1> Intergenerational Elasticity of Economic Standings and the Component Explained by
Education Level
A. Father and Son
Number of
matched father-
son pairs
Father-son
elasticity
Rate of return to
education in
son’s generation
Influence of
father’s affluence
on son’s education
Component
explained by
education
n
Wage
(monthly average) 356
0.225
(0.034)
0.063
(0.007)
1.463
(0.195)
0.092
[40.9]
Earning
(monthly average) 606
0.130
(0.025)
0.061
(0.007)
0.930
(0.132)
0.057
[43.8]
Household income
(yearly) 693
0.122
(0.028)
0.078
(0.008)
0.702
(0.129)
0.055
[45.1]
Net worth 603 0.328
(0.039)
0.182
(0.021)
0.454
(0.069)
0.083
[25.3]
B. Father and Daughter
Number of
matched father-
daughter pairs
Father-
daughter
elasticity
Rate of return to
education in
daughter’s
generation
Influence of
father’s affluence
on daughter’s
education
Component
explained by
education
n
Wage
(monthly average) 259
0.205
(0.061)
0.069
(0.012)
1.279
(0.165)
0.088
[42.9]
Earning
(monthly average) 413
0.160
(0.048)
0.062
(0.013)
1.099
(0.136)
0.068
[42.5]
Household income
(yearly) 690
0.117
(0.028)
0.071
(0.009)
0.501
(0.115)
0.036
[30.8]
Net worth 625 0.219
(0.039)
0.096
(0.020)
0.493
(0.070)
0.047
[21.5]
Note: Standard errors are in parentheses. Percentage shares of explained components are in brackets. Fathers’
economic variables are 1998~2012 average and children’s economic variables are 2008~2012 average.
Considering age profile of economic standings, we control for fathers’ and children’s average ages (and their
squares) when their economic variables were observed.
Source: Estimated by the author using KLIPS data.

13
Now we can gauge the share of father-son elasticity explained by father’s influence on son’s
education and son’s return on education by calculating the ratio of to . In the case of
intergenerational wage persistence of father-son pairs, 40.9% of intergenerational elasticity can be
attributed to the role of education (to be more specific, the quantity of education). Such an educational
path explains 43.8% of their earning elasticity, 45.1% of their household income elasticity, and 25.3%
of their net worth.
Similarly, we also estimated father-daughter elasticity as reported in panel B of <Table 1>. Their wage
elasticity estimate is 0.205, of which 42.9% can be explained by the role of education. The number of
father-daughter pairs is smaller than that of father-son pairs in the case of individual wage and earning
as labor market participation rate is lower for daughters. Their intergenerational elasticity and the
share of explained component by education are, however, quite comparable to the son-father pairs.’ A
noticeable difference in net worth elasticity by the child’s gender probably reflects Korean customs of
groom preparing the house with the financial support from his parents, which leads to higher net
worth elasticity for son-father pairs than for daughter-father pairs.
<Table 2> Intergenerational Transition Matrix of Wage
Son’s wage
Total 1
st quartile 2
nd quartile 3
rd quartile 4
th quartile
Father’s
wage
1st quartile 0.36 0.25 0.21 0.18 1
2nd
quartile 0.30 0.27 0.20 0.23 1
3rd
quartile 0.22 0.26 0.29 0.23 1
4th quartile 0.12 0.22 0.29 0.36 1
Note: Fathers’ wage is 1998~2012 average and son’s 2008~2012 average. Number of matched father-son pairs
is 356.
Source: Calculated by the author using KLIPS data.
Using intergenerational transition matrix, we can figure out how parental income classes change into
the next generation. <Table 2> shows a transition matrix between father’s wage quintile and son’s.
The intergenerational persistence rate defined by the share of the sum of diagonal elements (trace) is
32.3%. We note that 36% of sons whose fathers had the bottom (top) quintile wages also the bottom
(top) quintile wages in their generation. Regarding a success story of rising from humble family, 18%

14
of sons who had fathers with the bottom quintile wages climbed up to the top quintile wages. We also
note that men of the second quartile low wage fathers seem vulnerable to downward risk in their
generation.
B. International Comparison
The intergenerational economic mobility of Korea is relatively high. Even when using the highest
intergenerational elasticity estimate of 0.225, which is found between father’s wage and son’s wage,
Korea belongs to a low elasticity group that includes Norway, Finland, and Canada.
<Figure 6> “The Great Gatsby Curve”
Source: Intergenerational earnings elasticity (between father and son) estimates are in Corak (2012) except
Korea calculated by the author using KLIPS 1998~2012 data. Gini coefficients for market income are
1990~2000 averages calculated by the author using UNU-WIDER’s World Income Inequality Database.
We add Korea into “The Great Gatsby Curve” that represents the relationship between income
inequality and intergenerational economic persistence.6 <Figure 6> shows that Korea falls on a
6 Considering that the sample average of Korean sons’ birth year is 1976 and that parental enrichment
investment in children’s human capital used to be concentrated in their secondary and postsecondary education
via providing private tutoring or tuitions in those days, we use the average of Gini coefficients during
Brazil
Chile United Kingdom Argentina
United States Switzerland Singapore
France Japan Germany
New Zealand Sweden
Australia
Canada
Finland Norway
Korea
0.0
0.1
0.2
0.3
0.4
0.5
0.6
20 30 40 50 60
Intergenerational earnings elasticity
Inequality (Gini coefficient)

15
relatively good spot on which intergenerational mobility is fairly high and income inequality is not
that high.
When observing intergenerational transition matrix, we also find that the intergenerational
transmission of economic standings in Korea is not as severe as in the United States or in the United
Kingdom. Rather, Korea is more like Canada, where parental income distribution among the sons
belonging to the top-income is quite similar to Korea. Comparing Korea with the United States,
intergenerational mobility difference appears to come from both differential upward mobility of the
least advantaged and differential probability that children of top-earning parents become top earners
in their turn.
<Table 3> International Comparison of Intergenerational Transition Matrix
A. Korea
1st quartile 2
nd quartile 3
rd quartile 4
th quartile Total
1st quartile 0.34 0.23 0.26 0.17 1
2nd
quartile 0.30 0.27 0.19 0.24 1
3rd
quartile 0.22 0.25 0.28 0.26 1
4th quartile 0.14 0.26 0.26 0.34 1
B. USA
1st quartile 2
nd quartile 3
rd quartile 4
th quartile Total
1st quartile 0.42 0.30 0.19 0.09 1
2nd
quartile 0.27 0.28 0.29 0.16 1
3rd
quartile 0.19 0.25 0.24 0.32 1
4th quartile 0.13 0.16 0.28 0.43 1
C. UK
1st quartile 2
nd quartile 3
rd quartile 4
th quartile Total
1st quartile 0.37 0.22 0.25 0.16 1
2nd
quartile 0.29 0.31 0.24 0.16 1
3rd
quartile 0.22 0.25 0.26 0.27 1
4th quartile 0.12 0.22 0.25 0.41 1
1990~2000 while they were 14~24 years old. The intergenerational earnings elasticity estimates of other
countries used data on a cohort of children born during the early to mid-1960s whose adult outcomes were
measured in the mid to late-1990s (Corak, 2013, p.81).

16
D. Canada
1st quartile 2
nd quartile 3
rd quartile 4
th quartile Total
1st quartile 0.33 0.29 0.22 0.16 1
2nd
quartile 0.25 0.27 0.26 0.22 1
3rd
quartile 0.21 0.24 0.27 0.28 1
4th quartile 0.21 0.20 0.25 0.34 1
Note: Column quartiles indicate the standings of annual household income of parents and row quartiles indicate
the standings of average monthly earnings of sons.
Source: Korean matrix is adopted from Kim (2009) using 427 parent-son pairs from the Korean Labor and
Income Study. Other countries’ matrices are borrowed from Blanden (2005) and data sources are 526 pairs from
the Panel Study of Income Dynamics in the USA, 1,707 pairs from the British Cohort Study in the UK, and
428,022 pairs from the Canadian Longitudinal Tax Records.
C. Intergenerational Correlation of Education
Education can be a “great equalizer” in society if parental influence on children’s educational
attainments is small. To examine whether education was indeed an equalizer in Korea, we look into
the intergenerational correlations of education of different generations using the KHS 2013 data. We
asked 3,000 respondents about the education levels of their grandparents and parents, themselves, and
their first children who completed school and are no longer students.
<Figure 7> Average Years of Schooling of Four Generations
Note: The grownup child is the first son or daughter who completed school and is no longer a student.
Source: Calculated by the author using KHS 2013 data.
6.4
10.5
15.2 15.7
4.9
8.7
14.3 15.4
0
5
10
15
20
Grandparent Parent Self Child (grownup)
Male Female

17
<Figure 7> shows the average years of schooling of these four generations. We divide the sample by
gender and then observe male lineage (i.e., the grandfather, the father, the male respondent, and his
eldest son) and female lineage (i.e., the grandmother, the mother, the female respondent, and her
eldest daughter) separately. Owing to rapid educational expansion, the average years of men’s formal
education have increased remarkably from 6.4 years in the grandfather’s generation to 10.5 years in
the father’s generation, and to 15.2 in the male respondent’s own generation. Their adult children’s
educational attainments are, however, quite similar to their own because Korean education including
tertiary education already approached a saturation point in terms of quantity within their own
generation. Women’s education has also increased significantly over generations. And gender gap in
educational attainment has narrowed in the respondents’ generation and even more in their children’s
generation.
Before we observe the intergenerational correlation of educational attainment (years of schooling), we
divide the KHS 2013 respondents into three age cohorts which reflects potential differences between
age groups. Young, middle-aged, and old cohort respondents are divided into age 20-35, age 36-49,
and age 50-69 respectively, which produce similar numbers for the three age cohorts.
<Figure 8> Intergenerational Correlation of Educational Attainment by Age Cohort of Male
Note: Number of male observations: old (age 50-69) 509, middle-aged (age 36-49) 501, young (age 20-35) 515.
Source: Calculated by the author using KHS 2013 data.
0.625
0.212
0.585
0.202
0.633
0.136
0.0
0.1
0.2
0.3
0.4
0.5
0.6
0.7
Grandparent & Parent Parent & Self
Old male Middle-aged male Young male

18
<Figure 8> reports the intergenerational correlation of educational attainment by age cohort of men.
The educational correlation between the grandfather and the father was 0.59~0.63. However, the
educational correlation between the father and the male respondent was only 0.14~0.21, which shows
the remarkable decrease of parental influence on children’s education in the respondents’ generation,
specifically for the young.
<Figure 9> Intergenerational Correlation of Educational Attainment by Age Cohort of Female
Note: Number of female observations: old (age 50-69) 474, middle-aged (age 36-49) 492, young (age 20-35)
509.
Source: Calculated by the author using KHS 2013 data.
Women’s intergenerational correlation of educational attainment has also weakened substantially as
shown in <Figure 9>. In particular, the young female’s educational correlation with her mother is
fairly minimal, plausibly reflecting the recent change of social norm regarding gender role into
encouraging investment in daughters’ human capital. Therefore, we can say that Korean parents had a
strong enthusiasm for their children’s education irrespective of their own education levels, which
resulted in a weak correlation of educational attainments between adult Koreans and their parents.
0.634
0.308
0.610
0.269
0.573
0.065
0.0
0.1
0.2
0.3
0.4
0.5
0.6
0.7
Grandparent & Parent Parent & Self
Old female Middle-aged female Young female

19
<Figure 10> Intergenerational Correlation of Educational Attainment across Four Generations
Note: Number of grownup child observations: first sons 229, first daughters 256.
Source: Calculated by the author using KHS 2013 data.
In <Figure 10>, we also report the educational correlation between the male (female) respondent and
his (her) eldest son (daughter) who has completed formal education and is no longer a student. In the
case of men, intergenerational correlation of educational attainment resembles a U-shape. Educational
correlation between the male respondent and his father is far less than that between his father and his
grandfather, but intergenerational correlation seems to rise again between his eldest son and himself.
On the other hand, women’s intergenerational correlation do not take a distinct U-shape across the
four generations.8
2. Mobility Expectation for the Next Generation
8 When we confine the sample to those who have adult children who completed all education, the educational
correlation between the grandfather and the father is 0.589 and father and the male respondent, 0.256, which still
show a U-shape intergenerational correlation across four generations of men. In the case of women, the
subsample of those who have grownup daughters produces the educational correlation of 0.582 between the
grandmother and the mother and 0.411 between the mother and the female respondent. Therefore, the U-shape is
only found in men’s intergenerational correlation, which may hint at the possibility that “like father, like son” is
coming again.
0.656
0.165
0.398
0.647
0.268 0.275
0.0
0.1
0.2
0.3
0.4
0.5
0.6
0.7
Grandparent & Parent Parent & Self Self & Child (grownup)
Male Female

20
Educational attainment is a good predictor of socioeconomic status. In addition, we use a subjective
measure of SES, which was included in the KHS 2013 survey. That was an imaginary ladder similar
to the “Cantril ladder.” The survey question is: “How high or low do you think your family’s social
status is? Please circle the number that corresponds to the estimated status that each family member
might be in their mid-ages (40s~50s) compared to the entire Koreans in the same age group? If your
eldest child is very young or you do not have any children yet, please make a best guess of their future
and circle the number that matches. (Socio-economic status is based on comprehensive consideration of
income, wealth, social status, living standard, etc.)
<Figure 11> Average Socio-economic Status of Four Generations
Note: SES is a 10-point scale subjective measure answered by respondents who were asked to place or expect
each generation’s status in their mid-age (40s-50s) compared with other Koreans of their generation.
Source: Calculated by the author using KHS 2013 data
Respondents (both male and female) were asked to evaluate or expect the SES of their grandfathers
(fathers’ line), fathers, themselves, and their eldest sons. The SES is a 10-point scale measure (the
lowest=1~10=the highest). <Figure 11> shows the average SES of each family member, reported by the
respondents. We report male respondents’ subsample average as well as the whole sample average in the
figure.
4.79 5.11 5.17
5.96
4.87 5.12 5.17
5.86
0
1
2
3
4
5
6
7
Grandfather Father Self Son
All Male

21
<Figure 12> Intergenerational Correlation of SES across Four Generations
Source: Calculated by the author using KHS 2013 data.
<Figure 12> shows the intergenerational correlation of subjective SES across the four generations.
Again, we find a U-shape, a result of rise in SES correlation between the respondents and their sons.
As such, respondents tend to report that the socioeconomic similarity between parents and children
would be higher for the next generation (0.6) than for their own generation (0.45~0.48).
<Figure 13> Intergenerational Correlation of SES across Four Generations by Age Cohort
Note: Number of observations: old (age 50-69) 983, middle-aged (age 36-49) 993, young (age 20-35) 1,024.
Source: Calculated by the author using KHS 2013 data.
0.579
0.484
0.603 0.599
0.449
0.600
0.0
0.2
0.4
0.6
0.8
Grandfather & Father Father & Self Self & Son
All Male
0.646
0.450
0.570 0.604
0.505 0.558
0.473 0.490
0.671
0.0
0.2
0.4
0.6
0.8
Grandfather & Father Father & Self Self & Son
Old Middle-age Young

22
In order to see the potential differences in respondents’ evaluation of intergenerational SES correlation
by their age, we split the sample into three age cohorts again. Indeed, <Figure 13> shows that the
young cohort (age 20-35) reports a relatively low SES correlation between their grandfathers and
fathers but a higher SES correlation between themselves and their sons than older age cohorts.
<Figure 14> Intergenerational Correlation of SES across Four Generations by Age Cohort of Male
Note: Number of male observations: old (age 50-69) 509, middle-aged (age 36-49) 501, young (age 20-35) 515.
Source: Calculated by the author using KHS 2013 data.
In order to observe men’s intergenerational SES correlation only, we drop the female respondents’
report in <Figure 14>. The improvement of intergenerational SES mobility in the previous generation
and the growing pessimism (or fatalism) for the next generation’s SES mobility can be clearly seen
from the figure.
Education could play the ladder role for social mobility across generations or a conduit for passing down
parents’ social class position. In the KHS 2013 survey, we asked respondents “How high do you
estimate the probability of social mobility that generations of your grandparents, parents, your own and
your child would have through education? Please, circle the number that corresponds most closely to
your level of agreement as to the role of education. The answer format is given as an 11-point (A
conduit for passing down parents’ social class position=0 ~ 10=A ladder for social mobility across
0.695
0.372
0.554 0.603
0.478
0.564
0.490 0.497
0.674
0.0
0.2
0.4
0.6
0.8
Grandfather & Father Father & Self Self & Son
Old male Middle-age male Young male

23
generations) measure so that the average over 5 means that respondents are more likely to believe in the
role of education as a ladder for intergenerational mobility. <Figure 15> reports the sample mean of the
responses for each generation. Respondents are more likely to consider education as a ladder for upward
mobility for later generations. But we should take respondents’ age variation into account.
<Figure 15> Is Education a Ladder for Upward Mobility in Each Generation? (Higher score means
stronger belief in such a role.)
Source: Calculated by the author using KHS 2013 data.
In <Figure 16>, we compare respondents’ opinion about the role of education regarding
intergenerational mobility by their age cohort. Panel A shows sample mean comparison of the three
age cohorts. The old (age 50-69) respondents have the steepest gradient representing that Korea had
become a land of opportunity for educated people thanks to rapid economic growth during the
developing era. Thus they take a more positive view on the role of education for upward mobility for
the later generation. The gradient, however, looks lower for younger cohorts.
In examining whether the differences between age cohorts are statistically significant, we regress the
11-point measure answers on the dummy variables of age cohorts with the middle-aged (age 36-49)
being the reference category. Panel B confirms the different views of the respondents by each age
group on the role of education as a ladder for upward mobility. Compared with the middle-aged
respondents, the old have lower evaluations for their grandparents and parents but higher evaluations
for themselves and their children. The young respondents, however, have consistently lower
evaluations on the equalizing role of education for their parents, themselves, and their children
4.62 5.06
5.45 5.68
0
2
4
6
Grandparent Parent Self Child

24
although they have a similar evaluation for their grandparents to their middle-aged counterparts. As
such, the KHS 2013 survey also suggests that social belief in the role of education for
intergenerational mobility has been weakening.
<Figure 16> Different Beliefs in the Role of Education as the Ladder for Upward Mobility in Each
Generation by Age Cohort
A. Sample Mean
B. Regression Coefficients
Note: Number of observations: old (age 50-69) 983, middle-aged (age 36-49) 993, young (age 20-35) 1,024.
Source: Calculated by the author using KHS 2013 data.
4
5
6
7
Grandparent Parent Self Child
Old
Middle-aged
Young
-0.6
-0.4
-0.2
0.0
0.2
0.4
0.6
Grandparent Parent Self Child
Old
Middle-aged
Young

25
3. A Growing Divide in Education
Korea’s tertiary educational institutions are ranked by the average KSAT scores of the newly entering
students. Most 2-year colleges are ranked lower than 4-year universities. Among 4-year universities,
the most prestigious universities are located in Seoul or in the metropolitan of Seoul with the
exception of a few out-of-Seoul elite institutions on science or engineering field and local medical
schools that admit high school graduates.
<Figure 17> College Entrance Results by SES Quintile in the 9th Grade (the 3
rd Year of Middle School)
Note: SES index = (1/3)*(household income decile/10) + (1/3)*(father’s education level category/6) +
(1/3)*(father’s occupation prestige category/5). These family background variables were measured in the third
grade of middle school.
Source: Recalculated by the author using <Table 2-4> of Kim (2011, p.15) who examined the college entrance
results of 1,731 students (3rd
grade of middle school in 2004) sample from Korean Education and Employment
Panel (hereafter KEEP) data.
39.8 44.2
56.7
69.2
75.2
4.3 5.7 8.0
14.1 19.0
0.4 1.3 0.3 3.7
10.0
0
10
20
30
40
50
60
70
80
1st quintile 2nd quintile 3rd quintile 4th quintile 5th quintile
4-year universtity entrance rate
Top 30 university entrance rate
Top 9 and medical school entrance rate

26
<Figure 17> shows that family backgrounds influence college entrance results. Parents’ SES index
that incorporates household income and father’s education level and occupation prestige reported in
the ninth grade of children is positively correlated with their subsequent outcomes in college entrance.
For instance, three out of four students with the family background of the top quintile SES entered 4-
year universities, of which 19% of them were admitted to the top 30 universities, and 10% to the top 9
universities or medical schools. On the contrary, among underprivileged students from the bottom
quintile SES, two out of five entered 4-year universities, of which 4.3% entered the top 30 universities,
and only 0.4% found themselves in the top 9 universities or medical schools.
According to an online survey of 492 teachers or education professionals, conducted by Korean
Educational Development Institute in February 2011, the majority of respondents were skeptical about
the possibility of being admitted to prestigious universities by individual ability and effort. In
answering the question, “Do you think that one can enter prestigious schools by one’s own ability and
effort regardless of familial economic level?” 68% of education experts including teachers answered
“No.” Moreover, younger respondents tended to be more pessimistic. The proportion of negative
answers was 83% among 20s and 30s, 71% among 40s, and 58% among 50s.
Seoul National University (hereafter SNU) conveys a symbolic meaning to Koreans as the most
prestigious university that guarantees a decent life. During the 1980s, a period when out-of-school
private tutoring was banned by the authoritative government and nationwide equalization of high
schools had already taken place, finding freshmen who came from underdeveloped rural area or
islands in the SNU campus was not difficult.9 However, SNU got disproportionately represented by
students from affluent families and from metropolitan cities like Seoul. Kim et al. (2003) examined
the family background of freshmen at the college of social science of SNU and found that the entrance
ratio of students whose fathers belonged to the highest paying occupations in comparison with other
students had increased from 1.3 in 1985 to 16.6 in 2000.
Moreover, the regional distribution of SNU entrance ratio has been concentrated in Seoul. <Figure
18> shows that since 2010 when the government ban of private tutoring was declared unconstitutional,
Seoul and its surrounding Gyeonggi province have outperformed other regions in term of SNU
entrance ratio adjusted by the number of high school graduates in each region. Meanwhile, the SNU
entrance ratio of non-Seoul metropolitan cities has been decreasing. People suspect that the high
9 In 1974 Korea introduced a “high school equalization” policy that abolished entrance tests and introduced a
lottery system to assign middle school students to high school. The purpose of the equalization policy was to
ease overheated competition for admission to the better high schools.

27
performance of Seoul in entering prestigious university owes at least partially to its booming market
of high-quality private tutors.
<Figure 18> Trends in SNU Entrance Ratio (100=Nationwide Average) by Region
Note: The SNU entrance ratio is adjusted by the number of high school graduates in each region.
Source: The number of SNU entrants by high school, reported to the National Assembly by SNU.
Even within Seoul, the type of high school one goes matters increasingly for being admitted into
prestigious universities. Special-purpose high schools are regarded as better high schools that provide
competitive advantage in entering prestigious universities owing to their privilege of selecting high-
performing students, enhanced peer effects, and better study environments than general high
schools.10
As <Figure 19> shows, the proportion of special-purpose high school graduates among
10
Special-purpose high schools have been introduced as a modification to the equalization policy, beginning
from science high schools (1983), foreign language high schools (1992), and international high schools (1998).
These schools have their own purpose of educating students with special aptitude. They, however, have hosted
parents’ envy as well as public criticism because the purpose of their establishment has been diluted when they
have focused on the prestigious university entrance of their students. For example, only a very small fraction of
foreign language high school graduates actually choose corresponding majors in college, and some students
even enter medical schools.
0
20
40
60
80
100
120
140
160
180
200
2000 2001 2002 2003 2004 2005 2006 2007 2008 2009 2010 2011
Seoul 6 metropolitan cities Gyeonggi province 8 local provinces

28
SNU entrants who graduated from high schools in Seoul has increased from 22.8% in 2002 to 40.5%
in 2011. In the meantime, general high schools even including Gangnam districts have lost their
shares in SNU entrance.
<Figure 19> Composition of SNU Entrants Who Graduated from High Schools in Seoul
Source: The number of SNU entrants by high school, reported to the National Assembly by SNU.
As a part of high school diversification policy, government introduced 50 autonomous private high
schools that have more autonomy in curriculum in return for each school foundation’s obliged
financial transfer. These autonomous schools have attracted high-performing middle schoolers from
broader region because the top 50% grade students in their middle schools are entitled to apply for
autonomous high schools. According to <Table 4>, autonomous high schools have revealed their
competitive advantage in college entrance. Considering that the proportion of autonomous private
29.7 24.9 27.8 22.6
2.8 3.6 2.9
2.9
11.1 12.2 10.4
8.6
33.4 30.7 27.4
25.2
22.8 28.5 31.5
40.5
0%
20%
40%
60%
80%
100%
2002 2005 2008 2011
High schools in the other 14 districts
High schools in 5 weak districts: Guro, Geumcheon, Joong, Seongdong, Joongrang
High schools in 3 strong non-Gangnam districts: Yangcheon, Gwangjin, Gangdong
High schools in 3 Gangnam districts: Gangnam, Seocho, Songpa
15 special-purpose high schools in Seoul

29
high schools among all high schools nationwide is just 2.1%, their shares in 4-year college entrants, 4-
year national/public college entrants, and 4-year Seoul metropolitan area college entrants are
disproportionately high and even increasing between 2013 and 2014.11
The reason for their superior
performance needs an empirical investigation. It may result from value-added instruction that
autonomous schools provide, or from a mere selection effect that depends on students’ higher abilities.
When we find that the shares of general high schools in 4-year college entrants and other criteria have
substantially decreased with the introduction of autonomous high schools, we may suspect that
autonomous schools’ high performance can be largely attributed to “cream skimming” that
monopolizes high-performing middle schoolers who might have entered general high schools without
autonomous high schools.
<Table 4> Changes in Share (%) in 4-year College Entrants by Type of High School
2011 2012 2013 2014
Share in 4-year college entrants
General high school 83.4 85.7 79.4 78.0
Vocational high school 9.0 6.6 4.4 4.2
Special-purpose high school 4.0 4.0 4.6 4.5
Autonomous high school
7.5 9.2
Share in 4-year national/public college entrants
General high school 87.0 89.4 81.9 79.9
Vocational high school 6.9 4.5 3.2 2.7
Special-purpose high school 3.6 3.6 3.7 3.8
Autonomous high school
8.0 11.0
Share in 4-year Seoul metropolitan area college entrants
General high school 80.8 81.5 74.1 72.5
Vocational high school 5.7 4.7 3.3 3.3
Special-purpose high school 8.4 8.4 9.1 8.7
Autonomous high school
7.7 9.8
Note: The number of 4-year colleges is 181 in 2011~2012 and 174 in 2013~2014. Among them, the number of
national/public colleges is 26 and that of Seoul metropolitan area colleges is 67 in 2011~2012 and 66 in
2013~2014.
Source: Ministry of Education and Korean Council for University Education, each year.
11
Autonomous high schools in <Table 4> include 58 autonomous public high schools appointed and supported
by government to improve their disadvantageous educational environments. Therefore, most of superior
performance of autonomous high schools in college entrance probably comes from autonomous private high
schools.

30
<Figure 20> Family Backgrounds of the 1st Year High School Students in Seoul by Type of School
A. Father’s Education Level
B. Father’s Occupational Prestige
C. Household Income
Source: Calculated by the author using Seoul Educational Longitudinal Study (SELS) 2010 data.
11.0 4.2 0.9 0.4
62.1
35.8 22.1
7.5
24.0
50.0
55.0
58.4
2.8 10.0 22.1
33.8
0%
20%
40%
60%
80%
100%
Vocational General Autonomous Special-purpose
Middle school or less High school College Graduate school or more
59.3 36.6
21.7 8.5
35.4
48.4 55.9
62.6
5.3 15.0 22.4 28.9
0%
20%
40%
60%
80%
100%
Vocational General Autonomous Special-purpose
Low Middle High
57.0
28.8 16.3 15.0
25.1
22.0
14.2 4.7
13.0
30.0
27.7 29.9
4.8 19.2
41.9 50.4
0%
20%
40%
60%
80%
100%
Vocational General Autonomous Special-purpose
2 mil. or less 2.01-3.5 mil. 3.51-5 mil. more than 5 mil.

31
The existence of outperforming high schools and their increasing superiority in college entrance
results are closely related to the issue of intergenerational mobility because high schools are
differentiated by students’ family backgrounds. <Figure 20> shows the systematic differences of
father’s education level and occupational prestige and household income by the type of high school in
Seoul. Vocational high school students have the poorest background. General high school students are
underprivileged compared with the autonomous private high school students. Special-purpose high
schools appear to select the most privileged, richest students.
Korea’s Income Inequality was not that severe until the late 1990s. As <Figure 21> shows, however,
inequality has increased particularly since the economic crisis of 1997. We suspect that aggravated
income distribution affected educational inequality because poor families could not afford their
children’s private tutoring or other enrichment investment and an economic crisis often shattered low-
income families.
<Figure 21> Income Inequality in Korea (1990~2013)
Source: Data are from Statistics Korea, Household Survey, each year.12
12
We thank Dr. Gyeongjoon Yoo at Korea Development Institute, who kindly shared data for this figure.
0.22
0.24
0.26
0.28
0.30
0.32
0.34
0.36
1990
1991
1992
1993
1994
1995
1996
1997
1998
1999
2000
2001
2002
2003
2004
2005
2006
2007
2008
2009
2010
2011
2012
2013
Market income Gini (2+ person urban households)
Disposable income Gini (2+ person urban households)
Market income Gini (total non-agriculture households)
Disposable income Gini (total non-agriculture households)

32
In this regard, Byeon and Kim (2010) provide evidence for our suspicion. Using three cohorts (1999,
2003, and 2007) of the eighth grade Korean students from TIMSS (Trends in International
Mathematics and Science Study), they examine trends in the relationship between socioeconomic
background and test score. The magnitude of the impact of socioeconomic background on student
achievement has increased over time between 1999 and 2007. Meanwhile, American students’ test
score has improved regardless of socioeconomic backgrounds.
Educational achievement inequality results from, at least in part, educational expenditure gap between
income groups. Most Korean parents take part in the outrageous arms race of private tutoring, which
accounts for the main reasons of abysmally low birth rate. As <Figure 22> shows, private tutoring
cost has continuously increased until 2009, to the extent that it has doubled the public education cost
for primary and secondary schooling. In particular, the current trend of sumptuous private tutoring
including English daycare service for very young children is prevalent among rich families. As a
result, private tutoring inequality, measured by the expenditure gap (ratio) between the top and the
bottom income quintile households, has also increased (the gap reached tenfold in 2009).
<Figure 22> Changes in Child Education Expenditure Share and Private Tutoring Inequality
Note: Cost (%) is the share in total household expenditure. Private tutoring excludes that for adult. Public
education is for primary/secondary education. Private tutoring inequality = private tutoring expenditure of the
5th
quintile income household / that of the 1st quintile income household.
Data: Urban households with 2+ unmarried children from the Household Survey of Statistics Korea.

33
Ⅳ. Policy Directions
1. Preventing Talent Loss
When it comes to equal opportunity, as Corak (2013, p.98) noted, “people tend to support policies that
would assure a level playing field in access to jobs and education, and are less willing to take steps to
offset genetic advantages.” Therefore, we need to examine the potential ability gap at the beginning
birth between children from different income groups.
At the earliest ages, there is no significant difference in cognitive ability between high- and low-
income individuals. Using data from the Early Childhood Longitudinal Survey Fryer and Levitt (2013)
find that the standardized mental function composite score of infants (8~12 months of age) has almost
no correlation with parental SES (a combination of income, education, and occupation) quintile.
Instead, other factors such as age, gender, and birth order have a stronger correlation with the infant’s
cognitive ability.
Thus, the children of high- and low-income families are born with similar abilities on average but
rapidly diverge in outcomes by differential circumstances. The evidence suggests that even cognitive
ability per se develops differently under the influence of parental SES. By examining the sample of
British children born in 1970, Feinstein (2003) found that, in cognitive ability (IQ) distribution, the
average position of low-income children who were near the top 90 percentile at 22 months of age
continued to drop until age 10 when they were overtaken by high-income children whose IQ was near
the bottom 10 percentile at 22 months.
Student achievement gap tended to widen in the higher grades of schooling as insufficient
development of literacy and numeracy skills hindered further studies in the next stage of education.
Carneiro and Heckman (2002) find that long term factors that promote cognitive and noncognitive
ability are much more important determinants of the family income-college enrolment relationship in
the United States than short run liquidity constraints to pay college tuition and fees. Similarly, using
data from the Korean Education and Employment Panel, Lee and Kim (2012) show that most of the
higher education gap by family background can be attributed to the long term accumulation of
disadvantages from underprivileged home environment, not the short term constraint. In light of these
findings, policies involving early intervention to prevent widening developmental gap of children will

34
be more effective in alleviating educational and subsequent income inequality than providing college
loan or reducing tuition costs.
However, the existing achievement gap often depicted in KSAT scores should also be addressed to
prevent talent loss. In fact, standardized test scores show only partial information on students’ ability
and can be affected by private tutoring that is tailored specifically to solve the test problems.
Therefore, we should provide an opportunity for underprivileged students by taking affirmative action
(hereafter AA) in admission process so that they can flourish in better environment such as good
colleges.
In an effort to enhance the student diversity and regional representation, Seoul National University
first introduced the “regional balanced admission in 2005 for high-performing students from rural
high schools, which gave special consideration of the potentials not exhibited in the KSAT scores but
recognized by their teachers and principals. How were they doing after being admitted to SNU? A
four-year examination of those regional balance admission students shows that “a hidden gem will
soon sparkle.”
<Figure 23> reports the changes in GPA of the SNU students in the freshman class of 2005 until
graduation by the type of admission. Three types of students were compared: (1) AA (regional
balanced admission) entrants comprised mostly of rural high schools; (2) specialty entrants comprised
mostly of special-purpose high schools; (3) regular entrants. In their first semester as a freshman,
specialty entrants’ GPA was higher than the other entrants, which may reflect their superiority and
readiness for higher education. After four semesters’ of catchup and adjustment process, however, AA
entrants outperformed specialty entrants and finished their senior year with the highest GPA.
In 2008, with the encouragement and financial support of the government, Korean universities
introduced the admissions officer (hereafter AO) system in their admission process. The main purpose
is to find “a gem in the haystack” by the comprehensive consideration of a student’s school record,
letter of self-introduction, KSAT score, and so on. In spite of its potential to enhance social mobility,
the AO system often faces suspicion or criticism that it only leads to heavier burden for students’ (and
parents’) in preparing various specification packages to apply for college and that it mainly serves the
interests of students from rich families because out-of-school curricular activities are believed to be
necessary to prepare for an AO admission which often require parental support and social network.
Therefore, the AO system needs to be developed more explicitly as the AA admission process and
requires more effort to outreach underprivileged students with the potential to flourish, not to select
decent students at the moment.

35
<Figure 23> SNU Students’ GPA Changes until Graduation by Type of Admission
Note: SNU admitted 3,224 students in total in March 2005, which consisted of 659 (20.4%) AA (affirmative
action) entrants based on rural area quota, 426 (13.2%) specialty entrants mostly from special-purpose high
schools, and 2,139 (66.3%) regular entrants. Among them, 702 students graduated in February 2009, composed
of 84 AA entrants, 102 specialty entrants, and 516 regular entrants.
Source: Baek and Yang (2009).
2. Strengthening Social Inclusion
Individuals from well-to-do backgrounds have various advantages in the labor market. The luckiest of
them inherit firm ownership which could be well observed in the cases of family-owned Korean
conglomerates “chaebol.” Also, their backgrounds provide them with information about the labor
market or connections that help search decent jobs. Loury (2006) suggests that, in the United States,
up to half of jobs are found through family, friends, or acquaintances.
In light of this, it is worth paying attention to the social network support perceived by Koreans and the
3.24
3.48 3.47 3.48
3.60
3.70
3.76
3.65
3.47
3.51
3.57 3.54
3.57
3.66 3.65
3.50
3.23
3.29 3.31 3.31
3.41 3.40
3.53
3.40
3.1
3.2
3.3
3.4
3.5
3.6
3.7
3.8
Spring
2005
Fall
2005
Spring
2006
Fall
2006
Spring
2007
Fall
2007
Spring
2008
Fall
2008
AA (regional balance)
entrants
Speciality (elite HS) entrants
Regular entrants

36
difference by educational attainment. According to OECD (2013), the percentage of people reporting
to have relatives or friends they can count on is relatively low in Korea compared with other OECD
countries. In particular, only 41.6% of the less educated Koreans without a college diploma, reported
that they have someone to count on. Although highly educated Koreans also feel weaker social
network support than their foreign counterparts with similar educational background, the feeling gap
by education level is the greatest in Korea. This gap may reflect the relative deprivation of the less
educated individuals’ and explain people’s obsession over (select) college diploma in recognition of
the power of school connections in Korean society.
As Korean people, particularly the young, have become highly educated to the point where scholars
are concerned about over-education or education bubble, the marginalization or social exclusion of
less educated people can be more severe than ever before. In this vein, we need to take a closer look at
the young people who are less educated.
<Figure 24> High School Graduates’ Paths by Type of School
A. Academic (General, Special Purpose) High School
B. Vocational High School
89.8 88.3 87.5 87.1 87.9 84.9 81.5 75.2 76.2 77.5
8.7 10.2 11.2 11.9 11.3 14.2 17.5 23.6 22.7 21.3
0%
20%
40%
60%
80%
100%
2004 2005 2006 2007 2008 2009 2010 2011 2012 2013
Others
Enlisted
Employed
College

37
Source: Calculated by the author using data from Statistical Yearbook of Education by Statistics Korea.
<Figure 24> shows the path of the high school graduates by type of school and their year-by-year
changes. The expansion of higher education also affected those in a vocational track, so that the
proportion of vocational high school graduates who went to college right after their graduation hit 70%
between 2008 and 2010. However, their college enrolment rate has been decreasing since 2010 as the
government encouraged getting jobs right after high school graduation and applying to college later if
needed. Also, it may be possible that the poor performance of many college graduates’ in the labor
market might have influenced the high schoolers’ decision to directly enter labor markets. In this
figure, we note that 21% of academic high school graduates and 17% of vocational high school
graduates were left as non-students, non-employees, or non-soldiers.
As a matter of fact, the proportion of the young who are not in education, employment, or training
(hereafter NEET) has been increasing. As <Figure 25> shows, the proportion of NEETs among young
men aged 25-29 has increased from 2.4% in 1995 to 11.8% in 2013. Meanwhile, the proportion of
NEETs has also increased from 1.0% in 1995 to 5.9% in 2013 among men aged 30-34 who are in their
prime working ages.
62.3 67.6 68.6 71.5 72.9 73.5 71.1 63.7
54.9 47.4
32.9 27.7 25.9 20.2 19.0 16.7 19.2 23.4
32.8 35.4
4.6 4.4 5.2 8.0 7.6 9.1 9.1 12.0 11.6 16.7
0%
20%
40%
60%
80%
100%
2004 2005 2006 2007 2008 2009 2010 2011 2012 2013
Others
Enlisted
Employed
College

38
<Figure 25> Proportion of NEETs among the Population of Korean Young Men
A. Men aged 25-29
B. Men aged 30-34
Note: The NEET herein indicates unmarried young men who do not participate in education, employment or
training. We exclude men who mainly participate in housekeeping from the NEET.
Source: Calculated by the author using data from Economically Active Population Survey of Statistics Korea.
0
2
4
6
8
10
12
14
1995
1996
1997
1998
1999
2000
2001
2002
2003
2004
2005
2006
2007
2008
2009
2010
2011
2012
2013
Unemployment Education or training NEET
0
2
4
6
8
10
12
14
1995
1996
1997
1998
1999
2000
2001
2002
2003
2004
2005
2006
2007
2008
2009
2010
2011
2012
2013
Unemployment Education or training NEET

39
Moreover, as <Figure 26> shows, the employment rate of the least educated (less than high school)
men aged 30-34 has remarkably dropped from 84.9% in 2000 to 60.4% in 2013. They have become
more and more marginalized as the average level of education has increased, which is reminiscent of
Lester Thurow’s “job competition” theory. In fact, as a result of over-education, highly educated
young people currently take jobs that were conventionally taken by the less educated. For example,
we can hardly find a young bank teller currently who graduated from high school despite the fact that
majority of employees in the banking industry were just high school graduates a few decades ago. In
this fashion, the least educated young (specifically, high school dropouts) have lost employment
opportunities.
Therefore, we need to pay a special attention to the unemployed young people, specifically the least
educated because they are the weakest group in job competition and face the risk of falling into
poverty or turning to crime. Preventing dropouts in secondary schooling and providing vocational
education and training for these vulnerable young people should be listed in policy agendas for
strengthening social cohesion.
<Figure 26> Recent Changes in Employment Rate of Male Aged 30-34 by Education Level
Source: Calculated by the author using data from Economically Active Population Survey of Statistics Korea.

40
3. Helping Open Multiple Routes to Success
As Kim and Ohtake (2014) mentioned, most Koreans have shared a common definition of success –
working in the government and its allied enterprises, the banks or large enterprises that provide secure,
well-paid and prestigious jobs. Thus they compete too narrowly for established routes of success,
which should be a zero-sum game that makes the vast majority of people feel like losers.
In the context of contemporary Korea where education bubble has burst which is implied by the
recent drop in enrolment rates (Figure 24), a college degree is not always, not for everyone, a gateway
to decent jobs. Therefore, we should open multiple routes to success for those who choose not to go to
college. Korean vocational education, however, has failed to attract an adequate number of students
needed in the industry and degraded in the era of expansion of higher education. Despite the existence
of the excessive supply of college graduates and increasing numbers of the highly educated jobless in
the labor market, parents have continued to encourage their children to enter colleges because they
have not been made aware of the existence of other paths to good-paying jobs.
In order to raise the attractiveness of vocational education and the employability skills of vocational
high school graduates, we need to develop vocational education programs in collaboration with
leading firms. In this vein, Korea has recently introduced the German vocational education system to
some pilot schools under the so-called Meister (Master in English) high school program, which
combines academic content with apprenticeships. It is a part of a new dual-track system for secondary
education in Korea, which benefits firms by supplying relatively low-cost, entry-level workers with
firm-specific skills and, at the same time, helps the graduates of the Meister program pursue advanced
degrees if they later choose to by the support of employers.
Of course we should improve the employability skills of high school graduates from common
vocational high schools other than Meister high schools and general high schools. Also, young
entrepreneurs’ business startup and overseas job searchers need to be supported, especially if they
have ideas and skills but do not have resources or networks.
Ⅴ. Conclusion
Korea is often regarded as an exemplary model of achieving both remarkable economic growth and

41
social equity in terms of inequality, on par with the average OECD countries, from the ashes in the
1950s. Furthermore, we find that Korea’s intergenerational economic mobility measured by
intergenerational elasticity and intergenerational transition matrix is also fairly high comparable to
Canada or Nordic countries.’
The reasons why the intergenerational persistence of SES has been low in Korea are at least threefold.
First, rapid economic growth has created many jobs in modern sectors that require skilled or semi-
skilled labor.
Second, after the abrupt abolition of the pre-modern social stratification in Japanese colonial era, most
Korean parents earnestly invested in their children’s education regardless of their SES to help their
next generation take new opportunities in the process of modernization and industrialization. The
merit-based personnel practices such as hiring and promotion of government officials stimulated the
demand for education.
Third, education policies also contributed to social mobility. In line with the pace of economic
development, Korean government developed educational capacity sequentially – initial emphasis was
placed on universal primary education and then secondary and subsequently expanded to tertiary
education. And school finance was nationalized for private schools as well as public schools and up to
secondary education, which equalized educational resource for each school. Also the government
introduced equalization policy for secondary education (for middle schools in 1969 and for high
schools in 1973) by using lottery-based assignment of students in place of school exams, which have
indeed reduced achievement gaps between schools and enhanced students’ diversity in select
universities. Moreover, the government banned out-of-school private tutoring in 1980 and curbed the
expansion of private tutoring market to some degree until the ban was declared unconstitutional in
2000. Anyway, all those policies countervailed the influence of family background on student
achievement, and, therefore, contributed to social equity including intergenerational mobility. In this
vein, Jang and Han (2011) find that banning private tutoring and equalizing middle schools actually
enhanced intergenerational mobility of the treated cohort compared with the previous age cohort.
Now, however, Korea faces different situation. Economic growth has slowed down since the Asian
crisis of 1997 and the pressure of international competition has become stronger with the rise of
Chinese economy. Both low-skilled and high-skilled labor has been losing their jobs due to the
increasing import of cheap goods and labor and the offshoring of large enterprises as well as labor-
saving technology. Income inequality has increased since the 1997 crisis and, in the meantime, labor
income share has decreased because wage has not caught up with labor productivity.

42
Educational environment has also changed against social mobility. Heated private tutoring begins at
the very early stage of life even when a child is a toddler. High schools are no longer equalized but
vertically differentiated due to the introduction and expansion of prestigious high schools that absorb
high-performing middle schoolers. A college degree is less promising than before and college
premium is concentrated in a few select universities. The NEETs are increasing and the least educated
young (high school dropouts) are being marginalized in society.
Considering the above circumstances, younger people may well have much more pessimistic
expectation of their children’s upward mobility compared with the old generation that experienced
high growth and mobility. Growing pessimism among the young exacerbates the abysmal birth rate of
Korea which is increasingly become a serious problem. Coupling of rising income inequality and
falling social mobility are bound to undermine social cohesion and sustainable economic growth.13
Focusing on the role of education in the rise and fall of social mobility, we suggest three policy
directions. First, we should prevent talent loss by early intervention as well as school loans or
scholarships. Pro-mobility education policies include enhancing the quality of school lessons
specifically in underprivileged regions and providing low-price high-quality enrichment class such as
after-school programs proved effective (Kim, 2011) in place of private tutoring.
Second, we need to take care of the less educated young to prevent them from becoming NEETs.
Their deficiency in employable skills and social network needs to be addressed by giving them public
support. And to prevent dropouts before high school graduation, schools should bear more
responsibility in guaranteeing the minimum level of achievement for every student and provide
special care to vulnerable students in cooperation with local government and regional community.
Third, opening multiple routes to success other than a narrowly defined route (e.g. from select
universities to decent jobs) should be encouraged and supported. Limited public resource must be
given to people who will deploy their talents and energy in pursuit of innovation, production and job
creation.
13
According to Chetty et al. (2014), intergenerational mobility has not changed appreciably in the last 20 years
in the United States, although income inequality has increased. They suspect that improved civil rights for
minorities or greater access to higher education played a huge role as to why such a plunge in mobility has not
occurred. In Korea, however, situation is different. Nowadays, college admission does not guarantee upward
mobility for the underprivileged young. And ordinary Korean parents are now more discouraged about the
chance of their children’s upward mobility because the odds of moving up the income ladder was fairly high in
their own (or the previous according to the parents’ age) generation. This anchoring effect that made them have
high expectation about their children’s future may exacerbate pessimism in current circumstances.

43
References
Baek, Soonkeun and Jungho Yang, “The Achievements and Challenges of Regional Balanced
Admission,” The 27th Higher Education Policy Forum Proceedings, Korean Council for
University Education, 2009 (in Korean).
Blanden, Jo, “International Evidence on Intergenerational Mobility,” Working Paper, Centre for
Economic Performance, London School of Economics, May 2005.
Byun, Soo-yong and Kyung-keun Kim, “Educational Inequality in South Korea: The Widening
Socioeconomic Gap in Student Achievement,” Research in Sociology of Education, 17, 2010,
pp.155~ 182.
Carneiro, Pedro and James J. Heckman, “The Evidence on Credit Constraints in Post-Secondary
Schooling,” Economic Journal, 112, October 2002, pp.989~1018.
Chetty, Raj, Nathaniel Hendren, Patrick Kline, Emmanuel Saez, and Nicholas Turner, “Is the United
States Still a Land of Opportunity? Recent Trends in Intergenerational Mobility,” American
Economic Review: Papers & Proceedings, 104(5), 2014, pp.141~147.
Choi, Jieun and Kiseok Hong, “An Analysis of Intergenerational Earnings Mobility in Korea: Father-
Son Correlation in Labor Earnings,” Korean Social Security Studies, 27(3), 2011, pp.143~163
(in Korean).
Corak, Miles, “Income Inequality, Equality of Opportunity, and Intergenerational Mobility,” Journal
of Economic Perspectives, 27(3), Summer 2013, pp.79~102.
Feinstein, Leon, “Inequality in the Early Cognitive Development of British Children in the 1970
Cohort,” Economica, 70(277), 2003, pp.73~97.
Fryer, Roland, and Steven Levitt, “Testing for Racial Differences in the Mental Ability of Young
Children,” American Economic Review, 103 (2), 2013, pp.981~1005.

44
Greenston, Michael, Adam Looney, Jeremy Patashnik, and Muxin Yu, Thirteen Economic Facts
about Social Mobility and the Role of Education, The Hamilton Project, Policy Memo,| June
2013.
Jang, Soomyung and Chirok Han, “Education Policy and Social Mobility,” Changing Society and
Social Mobility, Research Monograph 2011-20, Korea Institute for Health and Social Affairs,
2011, pp.103~169 (in Korean).
Kim, Bonggeun, Jae Eun Seok, and Eun Ju Hyun, “Intergenerational Income Elasticities in Korea and
Their Trend,” Korean Journal of Labor Economics, 35(2), 2002, pp.25~41 (in Korean).
Kim, Hisam and Fumio Ohtake, Status Race and Happiness: What Experimental Surveys Tell Us,
Policy Study 2014-01, Korea Development Institute, 2014.
Kim, Hisam, “Equity and Efficiency of Koreans’ English Education Investments,” KDI Policy Forum
Vol. 245, August 22, 2012.
Kim, Hisam, “The Effects of After-School Class on the Demand for Private Tutoring and Academic
Performance of Korean Students,” EWC-KDI Conference Proceedings, 2011.
Kim, Hisam, Analysis on Intergenerational Economic Mobility in Korea, KDI Policy Study, 2009-03,
Korea Development Institute, 2009 (in Korean).
Kim, Kwang Ok, Dae-il Kim, Yi Jong Suh, and Chang Yong Rhee, “Who Enters Seoul National
University?” Korean Social Science, 25(1&2), 2003 (in Korean).
Kim, Minseong, Bonggeun Kim, and Tae-wook Ha, “Intergenerational Income Elasticity in Korea,”
KUKJE KYUNGJE YONGU, 15(2), 2009, pp.87~102 (in Korean).
Kim, Youngchul, Improving Equal Opportunity in Admission to Higher Education, KDI Policy Study,
2011-06, Korea Development Institute, 2011 (in Korean).
Lee, Seungeun and Taejong Kim, “What Causes the College Entrance Gap in Korea?” Korean
Journal of Labor Economics, 35 (3), 2012, pp.51~81.
Loury, Linda Datcher, “Some Contacts Are More Equal than Others: Informal Networks, Job Tenure,
and Wages,” Journal of Labor Economics, 24(2), April 2006, pp.299~318.

45
Pekkala, Sari and Robert E. B. Lucas, “Differences across Cohorts in Finnish Intergenerational
Income Mobility,” Industrial Relations, 46(1), 2007, pp.81~111.
Pekkarinen, Tuomas, Roope Uusitalo, and Sari Kerr, “School Tracking and Intergenerational Income
Mobility: Evidence from the Finnish Comprehensive School Reform,” Journal of Public
Economics, 93, 2003, pp.965~973.
Solon, Gary R., “A Model of Intergenerational Mobility Variation over Time and Place,” in Miles
Corak (ed.), Generational Income mobility in North America and Europe, Cambridge
University Press, 2004.
Yang, Jung-Seung, “Estimating the Intergenerational Income Mobility in Korea,” Korean Journal of
Labor Economics, 35(2), 2002, pp.25~41 (in Korean).