Embed Size (px)
Citation preview
Intergenerational mobility of housework time in the UK
J. Ignacio Gimenez-Nadal1, J. Alberto Molina1 and Yu Zhu2
1Departament of Economic Analysis, University of Zaragoza
2School of Business, University of Dundee (Scotland)
SOLE/EALE 2015 World Meeting, 26th June, Montreal
Outline
• Introduction
• Literature review
• UK Time Use Survey 2000
• British Household Panel Survey, 1992-2008
• Conclusions & final thoughts
2

Why intergenerational transmission of housework time
Importance in Economics:– Gender economic inequality: housework reduces wages of
women (e.g. Hersch and Stratton, 1997 2002; Bryan andSevilla, 2011).
– Work-life balance: women deal with a “double burden” or“second shift” (Hochschild and Machung 1989; Schor 199;:Gimenez-Nadal and Sevilla, 2011).
– Experienced utility: housework ranks among the worstactivities in terms of the utility obtained by individuals(Kahneman et al. 2004; Kahneman and Krueger, 2006;Krueger; 2007; Gimenez-Nadal and Molina, forthcoming).
– Measurement of GDP/well-being: contribution of householdtasks to GDP (Krueger, 2009).
3
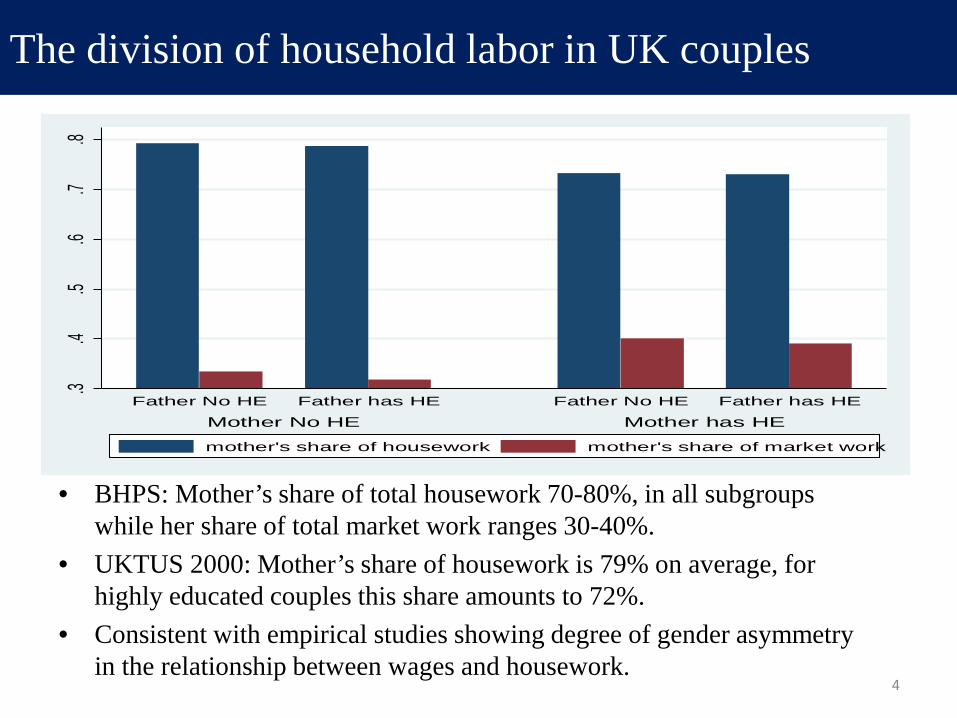
• BHPS: Mother’s share of total housework 70-80%, in all subgroups while her share of total market work ranges 30-40%.
• UKTUS 2000: Mother’s share of housework is 79% on average, for highly educated couples this share amounts to 72%.
• Consistent with empirical studies showing degree of gender asymmetry in the relationship between wages and housework.
4
.3.4
.5.6
.7.8
Mother No HE Mother has HEFather No HE Father has HE Father No HE Father has HE
mother's share of housework mother's share of market work
The division of household labor in UK couples

• Examine the relationship between housework time of children and thatof their parents in the UK.
• Combine two data sources for the UK:– The UK Time Use Survey (2000).– British Household Panel Survey (BHPS).
• The time use data suggests a positive effect of both parents’ houseworktime, consistent with other studies.
• Fixed-effect (FE) using BHPS indicate that only father’s houseworktime is significant.– However, FE estimates are likely to be a lower bound due to exacerbated
measurement error
• Endogenize father-mother housework ratio using both parents’ laggedworking hours or their difference:– IV estimates fully support the FE results.– IV results indicative rather than conclusive.
5
In this paper:

• Intergenerational transmission of attitudes and preferences in theuses of time:– Cunningham (2001) shows that the parental division of labor when
a son was growing up affects the adult son’s participation in routinehousework once he marries.
– Cardoso, Fontainha and Monfardini (2012) find positive evidencein France, Germany and Italy for the link between time allocationby parents and by youngsters.
– Alvarez and Miles (2012) find in Spain a significant positivecorrelation between a more egalitarian parents’ allocation ofhousework and a less asymmetrical distribution of domestic choresbetween sons and daughters.
– Solaz and Wolff (2015) find for a sample of French couples apositive relationship between child’s and parents’ housework time.
6
Literature Review: transmission in the uses of time

• Mechanisms to explain the associations between parents’ andchildren’s uses of time:
– Intergenerational transmission of preferences: parents influencepreference formation of the child (Wolfinger, 2000; Amato andDeBoer, 2001; Booth and Kee, 2009), in many cases through theculture of the country (Carroll, Rhee and Rhee, 1994; Fernandez,Fogli and Olivetti, 2004; Fernandez and Fogli, 2006).
– Parental role model: there are gender norms about what a man or awoman should or should not do, with a social cost of deviating fromthe behaviors expected under these norms (Akerlof and Kranton,2000). Under these circumstances, parents may try to transmit theseroles to their children so that they will conform to these gendernorms of the society in the future.
– Imitation: “doing by watching” attitude.• Disentangling any of the channels is very complicated (Solaz and
Wolf, 2015) 7
The intergenerational transmission of the uses of time
• The UK Time Use Survey 2000– Only time use survey with information on all HH members
from the UK.– Part of the Multinational Time Use Survey (MTUS).– Constructed from nationally representative time-diary studies.– Diary questionnaire on individual activities throughout the 24-
hour day.– 2 diaries for each respondent, 1 weekend and 1 weekday.– We consider housework as primary activities: total number of
hours devoted to cooking, washing up, housework, odd jobs anddomestic travel per day.
• We select children aged 11-18 living with two heterosexual parentsaged 60 or below (N=1,771)
8
Data: The UKTUS 2000
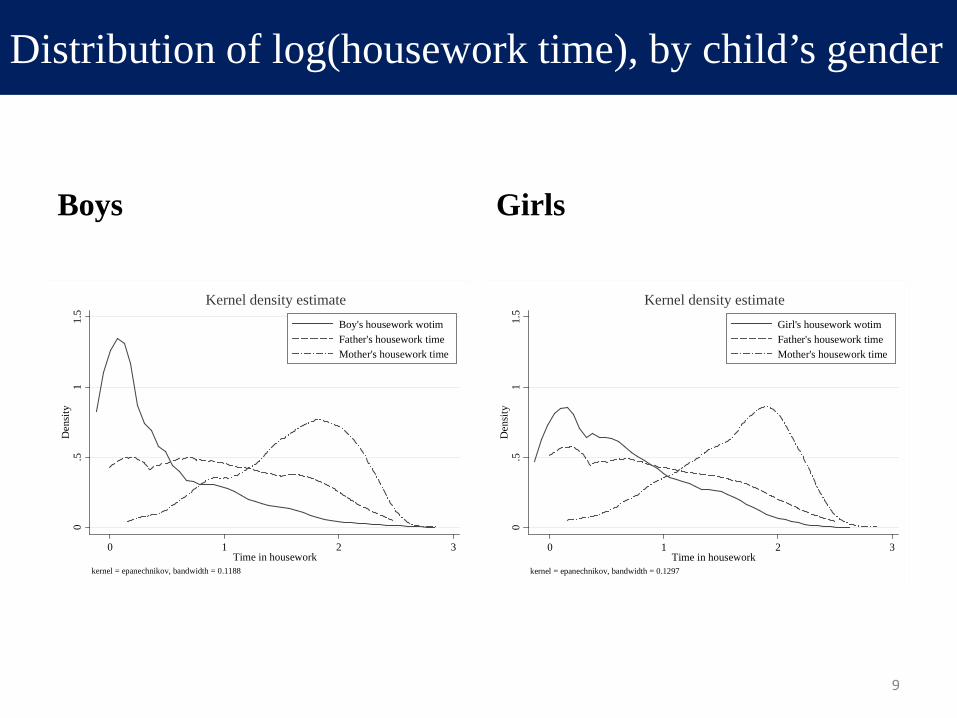
Boys
0.5
11.
5D
ensi
ty
0 1 2 3Time in housework
Boy's housework wotimFather's housework timeMother's housework time
kernel = epanechnikov, bandwidth = 0.1188
Kernel density estimate
Girls
0.5
11.
5D
ensi
ty
0 1 2 3Time in housework
Girl's housework wotimFather's housework timeMother's housework time
kernel = epanechnikov, bandwidth = 0.1297
Kernel density estimate
9
Distribution of log(housework time), by child’s gender
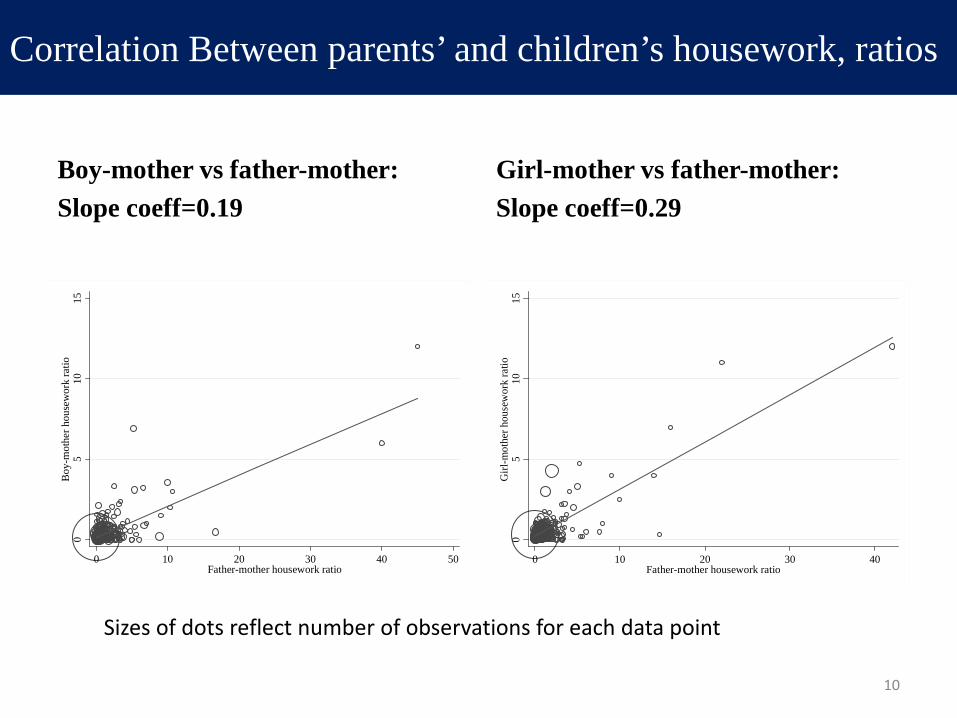
Boy-mother vs father-mother:Slope coeff=0.19
05
1015
Boy
-mot
her h
ouse
wor
k ra
tio
0 10 20 30 40 50Father-mother housework ratio
Girl-mother vs father-mother:Slope coeff=0.29
05
1015
Girl
-mot
her h
ouse
wor
k ra
tio
0 10 20 30 40Father-mother housework ratio
10
Correlation Between parents’ and children’s housework, ratios
Sizes of dots reflect number of observations for each data point

11
Empirical strategy• OLS as benchmark:
lnkid’sTimeih = α+β1lnDad’sTimeih+ β2lnMum’sTimeih+γXih+εih
for child “i” in household “h” and X denotes demographics.• Regression controls for:
– Parents: employment status (ref.: not-working), education (ref.: primaryeducation) , and age.
– Child: age, gender (male), student or unemployed.– Household: household size, number of children<18, household owns
dwelling.
• Fixed-effects (FE) to address (permanent) individual/householdheterogeneity in preferences (2 diaries per respondent):
D.lnkid’sTimeih =α+β1D.lnDad’sTimeih+β2D.lnMum’sTimeih+δDayih+υih
where D. is the difference operator.

12
The ratio form
• We also estimate the ratio-form where the child-motherhousework ratio depends on the father-mother housework ratio,separately for boys and girls– Parsimonious way of allowing for permanent heterogeneity of
individuals/households preferences for housework
• Male/female (stereotypical) tasks– Typical male tasks: lawn care, house maintenance.– Typical female tasks: physical care, food preparation or cleanup.– Mumsnet survey of 1000 working mothers: men and women take
primary responsibility of 3/36 chores respectively (men only empty thebins, change light bulbs and do a spot of DIY).
• Suggesting that housework can be seen as regular behaviour formothers, but more sporadic for fathers.
• Father’s involvement could be more important at the margin.

13
Analysis of UK Time Use Survey 2000
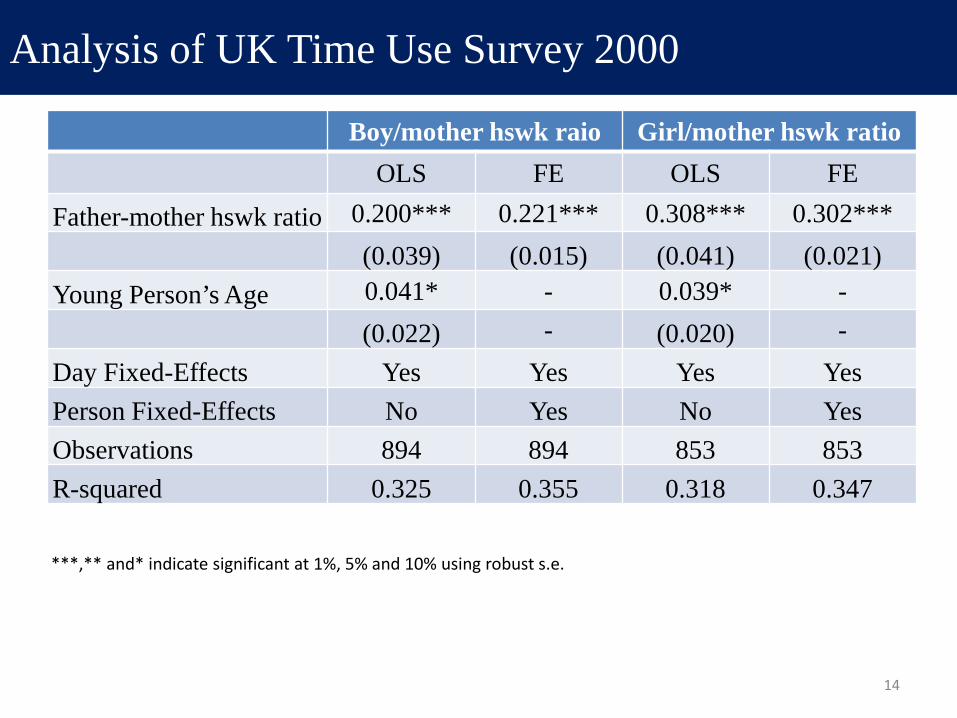
***,** and* indicate significant at 1%, 5% and 10% using robust s.e.
Log (boy’s hswk+1) Log (girl’s hswk+1)OLS FE OLS FE
Log(Father's housework+1) 0.124*** 0.208*** 0.084** 0.074*(0.035) (0.040) (0.033) (0.043)
Log(Mother's housework+1) 0.100** 0.091* 0.097** 0.142**(0.039) (0.049) (0.046) (0.056)
Young Person’s Age 0.005 - 0.031** -(0.013) - (0.014) -
Day Fixed-Effects Yes Yes Yes YesPerson Fixed-Effects No Yes No YesObservations 894 894 853 853R-squared 0.109 0.156 0.128 0.211
14
Analysis of UK Time Use Survey 2000
***,** and* indicate significant at 1%, 5% and 10% using robust s.e.
Boy/mother hswk raio Girl/mother hswk ratioOLS FE OLS FE
Father-mother hswk ratio 0.200*** 0.221*** 0.308*** 0.302***(0.039) (0.015) (0.041) (0.021)
Young Person’s Age 0.041* - 0.039* -(0.022) - (0.020) -
Day Fixed-Effects Yes Yes Yes YesPerson Fixed-Effects No Yes No YesObservations 894 894 853 853R-squared 0.325 0.355 0.318 0.347

15
British Household Panel Survey (BHPS)
• The longest longitudinal survey of HHs in the UK in 1991-2008
• All individuals aged 16+ are interviewed annually
• Information on family composition, education, labour marketexperience, earnings, incomes and benefit receipts
• In W2+, “About how many hours do you spend on houseworkin an average week, such as time spent cooking, cleaning anddoing the laundry?”
• We construct a sample of young people aged 16-18, who areliving with both parents aged 60 or below, in waves 2-18.
01
23
male female
child's housework hour father's housework hourmother's housework hour
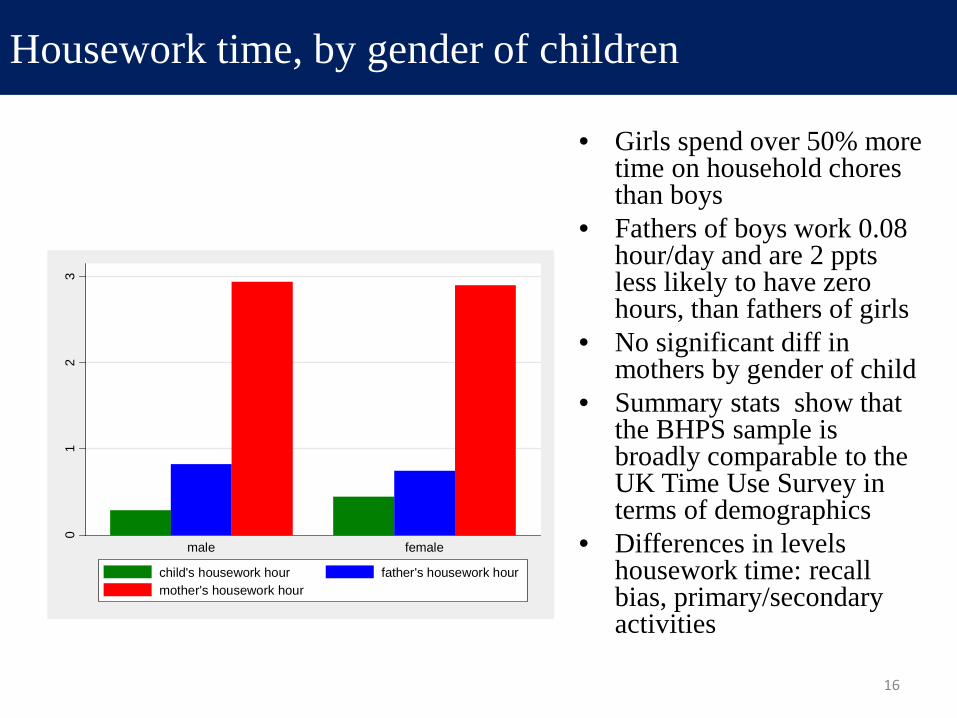
• Girls spend over 50% more time on household chores than boys
• Fathers of boys work 0.08 hour/day and are 2 pptsless likely to have zero hours, than fathers of girls
• No significant diff in mothers by gender of child
• Summary stats show that the BHPS sample is broadly comparable to the UK Time Use Survey in terms of demographics
• Differences in levels housework time: recall bias, primary/secondary activities
16
Housework time, by gender of children
17
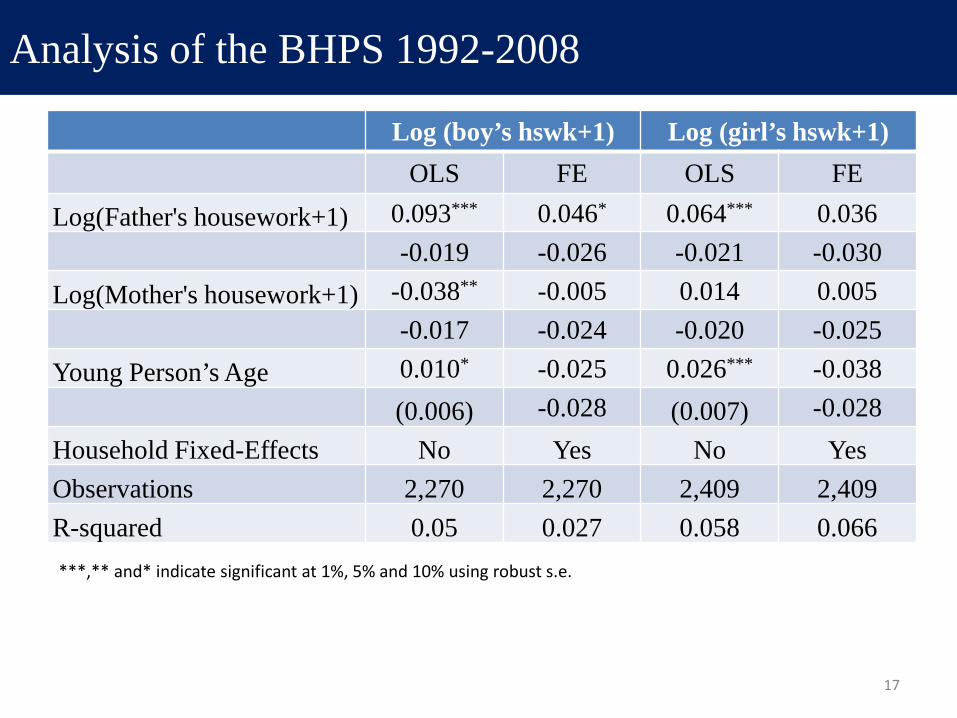
Analysis of the BHPS 1992-2008
***,** and* indicate significant at 1%, 5% and 10% using robust s.e.
Log (boy’s hswk+1) Log (girl’s hswk+1)OLS FE OLS FE
Log(Father's housework+1) 0.093*** 0.046* 0.064*** 0.036-0.019 -0.026 -0.021 -0.030
Log(Mother's housework+1) -0.038** -0.005 0.014 0.005-0.017 -0.024 -0.020 -0.025
Young Person’s Age 0.010* -0.025 0.026*** -0.038(0.006) -0.028 (0.007) -0.028
Household Fixed-Effects No Yes No YesObservations 2,270 2,270 2,409 2,409R-squared 0.05 0.027 0.058 0.066

18
Analysis of the BHPS 1992-2008
***,** and* indicate significant at 1%, 5% and 10% using robust s.e.
Boy/mother hswk raio Girl/mother hswk ratioOLS FE OLS FE
Father-mother hswk ratio 0.121*** 0.086*** 0.095*** 0.101*
(0.028) (0.015) (0.019) (0.059)Young Person’s Age 0.014 0.003 0.027*** -0.024
(0.009) -0.036 (0.009) -0.043Household Fixed-Effects No Yes No YesObservations 2,270 2,270 2,409 2,409R-squared 0.222 0.098 0.18 0.117
19
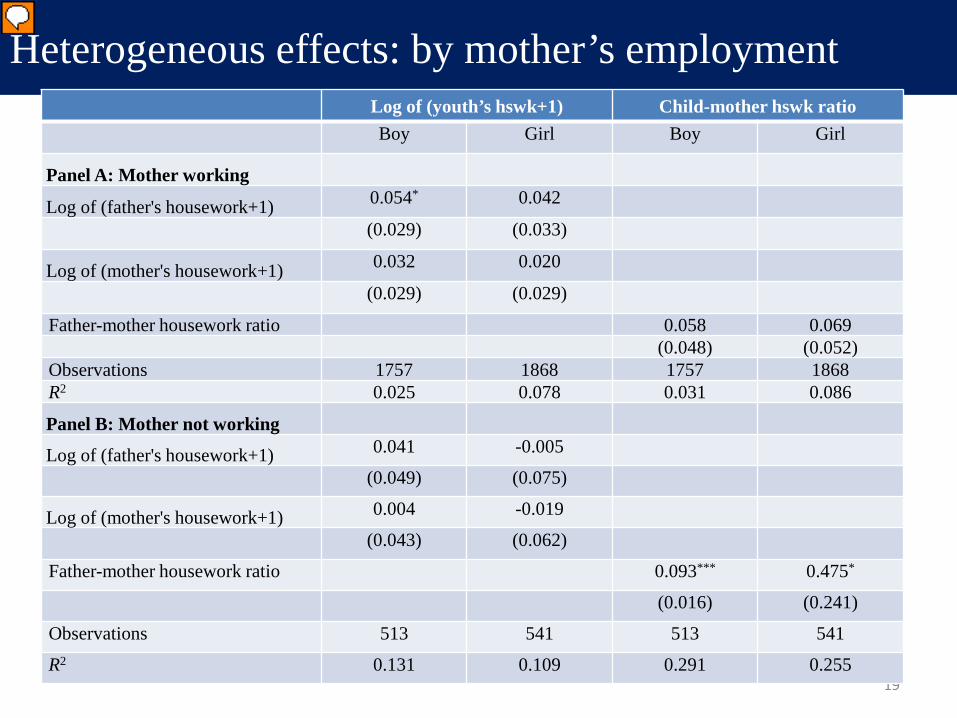
Heterogeneous effects: by mother’s employment
***,** and* indicate significant at 1%, 5% and 10% using robust s.e.
Log of (youth’s hswk+1) Child-mother hswk ratioBoy Girl Boy Girl
Panel A: Mother working
Log of (father's housework+1) 0.054* 0.042
(0.029) (0.033)
Log of (mother's housework+1) 0.032 0.020
(0.029) (0.029)
Father-mother housework ratio 0.058 0.069(0.048) (0.052)
Observations 1757 1868 1757 1868R2 0.025 0.078 0.031 0.086
Panel B: Mother not working
Log of (father's housework+1) 0.041 -0.005
(0.049) (0.075)
Log of (mother's housework+1) 0.004 -0.019
(0.043) (0.062)
Father-mother housework ratio 0.093*** 0.475*
(0.016) (0.241)
Observations 513 541 513 541
R2 0.131 0.109 0.291 0.255
20
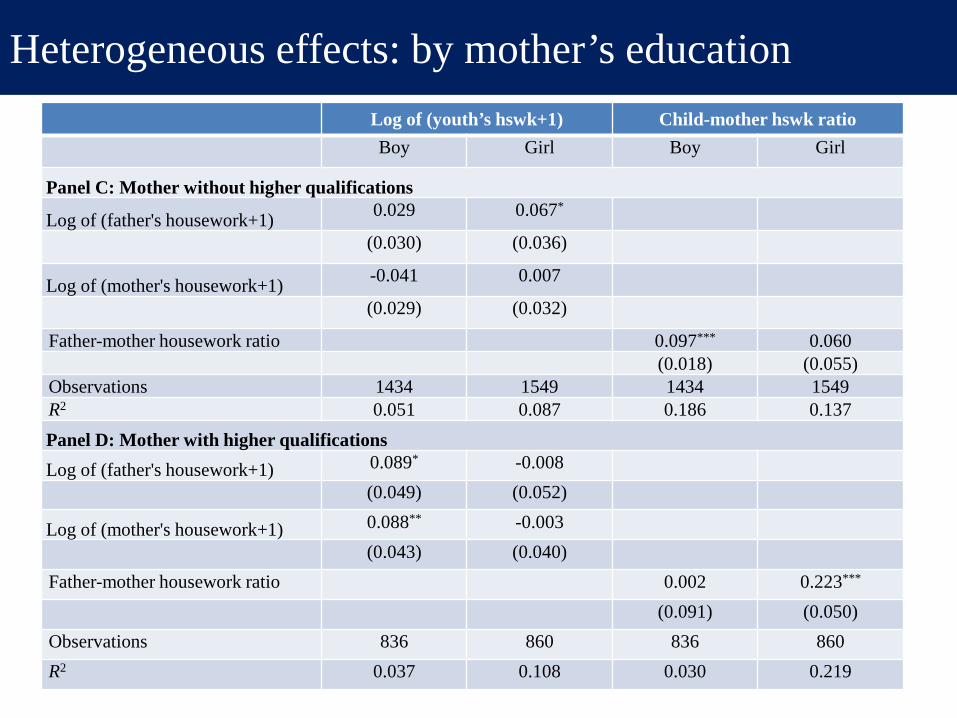
Heterogeneous effects: by mother’s education
***,** and* indicate significant at 1%, 5% and 10% using robust s.e.
Log of (youth’s hswk+1) Child-mother hswk ratioBoy Girl Boy Girl
Panel C: Mother without higher qualifications
Log of (father's housework+1) 0.029 0.067*
(0.030) (0.036)
Log of (mother's housework+1) -0.041 0.007
(0.029) (0.032)
Father-mother housework ratio 0.097*** 0.060(0.018) (0.055)
Observations 1434 1549 1434 1549R2 0.051 0.087 0.186 0.137Panel D: Mother with higher qualificationsLog of (father's housework+1) 0.089* -0.008
(0.049) (0.052)
Log of (mother's housework+1) 0.088** -0.003(0.043) (0.040)
Father-mother housework ratio 0.002 0.223***
(0.091) (0.050)Observations 836 860 836 860R2 0.037 0.108 0.030 0.219
21
Commenting on the BHPS Results
• Use the same specification as for the UK Time Use Survey and convert housework time from weekly to daily, and add unity before taking logs
• In OLS, only father’s housework is significantly positive for both boys and girls
• In FE, father’s housework significant for both boys and girls in the ratio form specification
• Significant finding: only father’s housework matters.• Effect of father’s housework time more pronounced:
– For boys: if mother is working or has higher education qualifications– For girls: if mother does not have higher education qualifications– Lack of precision due to small samples (only around 800 distinct young
persons with at least two observations)

Dep var=child-mother hswk ratio Boys Boys Girls Girls
Exact-id Over-id Exact-id Over-idFather-mother housework ratio 0.194*** 0.202*** 0.276*** 0.289***
(0.037) (0.038) (0.073) (0.072)
Hansen J statistic χ2(1)(p-value)
- 0.346(0.557)
- 0.600(0.439)
First-stage: dep var = father-mother housework ratio
Difference in Father and mother’s lagged weekly working hours
-0.0083***(0.0011)
-0.0059***(0.0014)
Father’s lagged weekly working hours
-0.0057***(0.0016)
-0.0045***(0.0014)
Mother’s lagged weekly working hours
0.1217***(0.0015)
0.0081***(0.0021)
F-test of excluded instruments(p-value)
51.94(0.0000)
37.07(0.0000)
17.60(0.0000)
9.06(0.0001)
Observations 2160 2160 2291 2291
• Short-panel estimates likely to suffer from exacerbated measurement error problem leading to downward biased estimates (see e.g. Buddelmeyer et al.)
– FE could be regarded as a lower bound.
– Address the measurement error problem using IV.
– Only look at the ratio form with one endogenous variable
22
IV Results
***,** and* indicate significant at 1%, 5% and 10% using robust s.e.
• Instrumented by the father and mother’s lagged weekly working hours, or their difference
• F-stat>10 in the first stage in 3 specifications, and all IVs are individually significant and have the expected signs
• P-values for the Hansen J-statistic are equal to 0.35 or above• The fact that 2SLS estimates are 2-3 times as large as FE
estimates consistent with the view that the latter are lower bounds.
• Few studies on housework time have applied both FE and IV methods (Hersch & Statton 1997, 2002; Bryan & Sevilla 2011)– All conclude that housework is effectively exogenous in FE, hence no
need to further apply IV.
23
IV strategy

• Find positive correlations between parents’ and children’s houseworktime in the UK Time Use Survey:
• Use BHPS to deal with time-invariant unobserved heterogeneity.• Find only father’s housework has a positive and significant effect on
child’s housework, once we allow for permanent household unobservedheterogeneity.
• Suggestive evidence points to the importance of parental role modelsand the intergenerational transmission of preferences (gender roleattitudes) in the intergenerational transmission of housework.
• Public policy towards greater gender equality in domestic work –multiplier effect on future generations.
24
Conclusions