Embed Size (px)
Citation preview
Intergenerational Social Mobility in the UK
Franz Buscha, University of WestminsterPatrick Sturgis, University of Southampton
“The ONS Longitudinal Study - 40 years old and going strong”Royal Statistical Society, 3rd February 2015

AcknowledgementsFunded under ESRC secondary data analysis initiative (round 1)
Joint work with Patrick Sturgis, University of Southampton
The permission of the Office for National Statistics to use the Longitudinal Study is gratefully acknowledged, as is the help provided by staff of the Centre for Longitudinal Study Information & User Support (CeLSIUS). CeLSIUS is supported by the ESRC Census of Population Programme (Award Ref: RES-348-25-0004). Census output is Crown copyright and is reproduced with the permission of the Controller of HMSO and the Queen's Printer for Scotland.


7
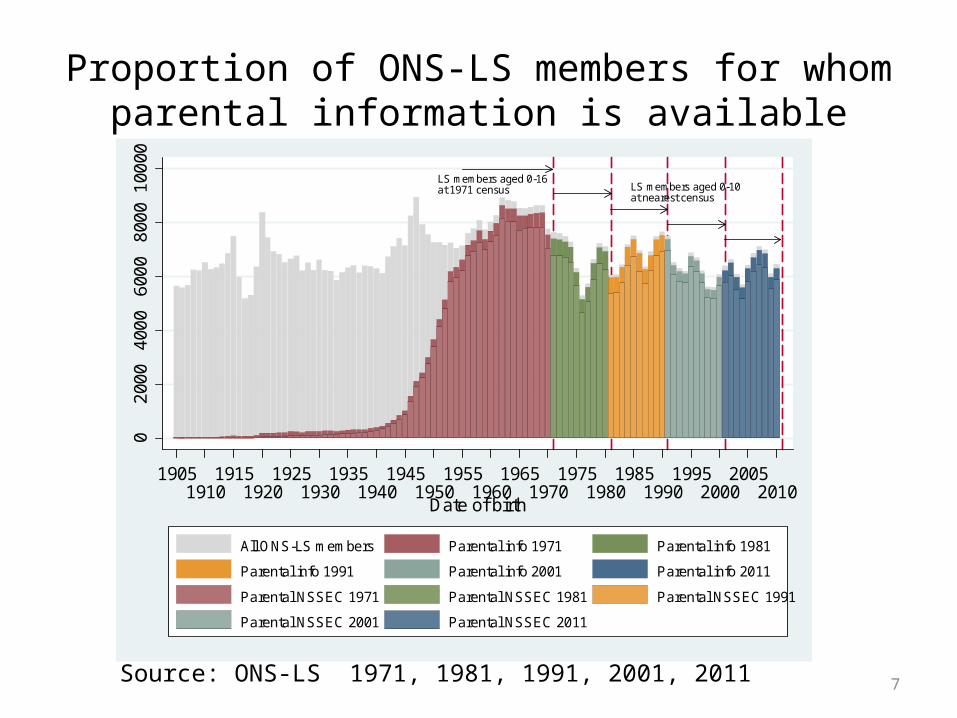
Proportion of ONS-LS members for whom parental information is available
Source: ONS-LS 1971, 1981, 1991, 2001, 2011
LS members aged 0-16at 1971 census LS members aged 0-10
at nearest census
020
0040
0060
0080
0010
000
19051910
19151920
19251930
19351940
19451950
19551960
19651970
19751980
19851990
19952000
20052010
Date of birth
All ONS-LS members Parental info 1971 Parental info 1981
Parental info 1991 Parental info 2001 Parental info 2011
Parental NSSEC 1971 Parental NSSEC 1981 Parental NSSEC 1991
Parental NSSEC 2001 Parental NSSEC 2011

8
1971
1981
1991
2001
2011
1981
1991
2001
Parental Status
Child Status
Intergenerational correlation estimates, r
Child age 10-16
Child age 10-16
Child age 10-16
Child age
Child age
Child age 30-36
Child age 30-36
Child age 30-36
Child agein cohort
Child agein cohort
Estimating intergenerational correlation using the ONS-LS

9
How to socio-economic position?
• CAMSISCambridge Social Interaction and Stratification Scale
Derived from correspondence analysis of marriage/cohabitation frequencies
Measure of occupational social status
• NS-SECNational Statistics Socio-Economic Status
Occupation-based measure of social class based on employment relationsContinuous service contract, salary based, career progressionVShort-term/fixed contract to sell labour for wages based on time worked/output
• INCOMENot available in census
Requires imputation from ‘donor’ data sets.
Requires accurate income prediction models. Limited variables in ONS LS which are in potential donor surveys

NS-SEC Distributions 1971-2011

11
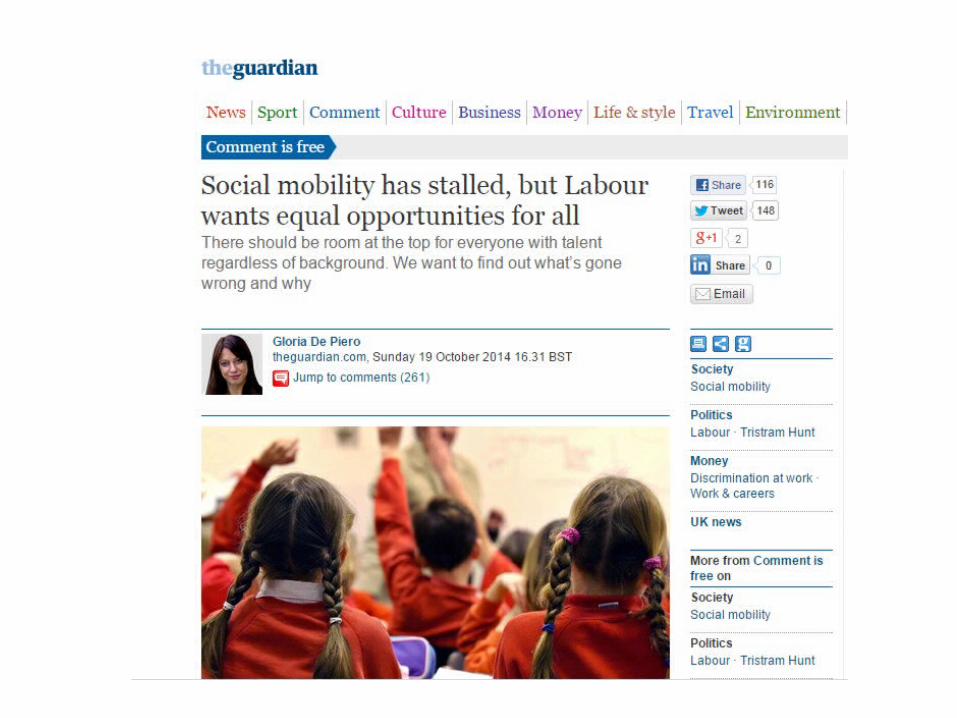
Absolute vs relative mobility
• Absolute = % of people reaching higher/lower social position than their parents– Affected by changes in occupational structure over time– E.g. move from agricultural/industrial to service
economy in 20th Century– But says little about inequality of opportunity or
outcomes• Relative = Adjusts for changes in distribution of
occupation structure over time– Speaks more to issues of equality than absolute mobility
12
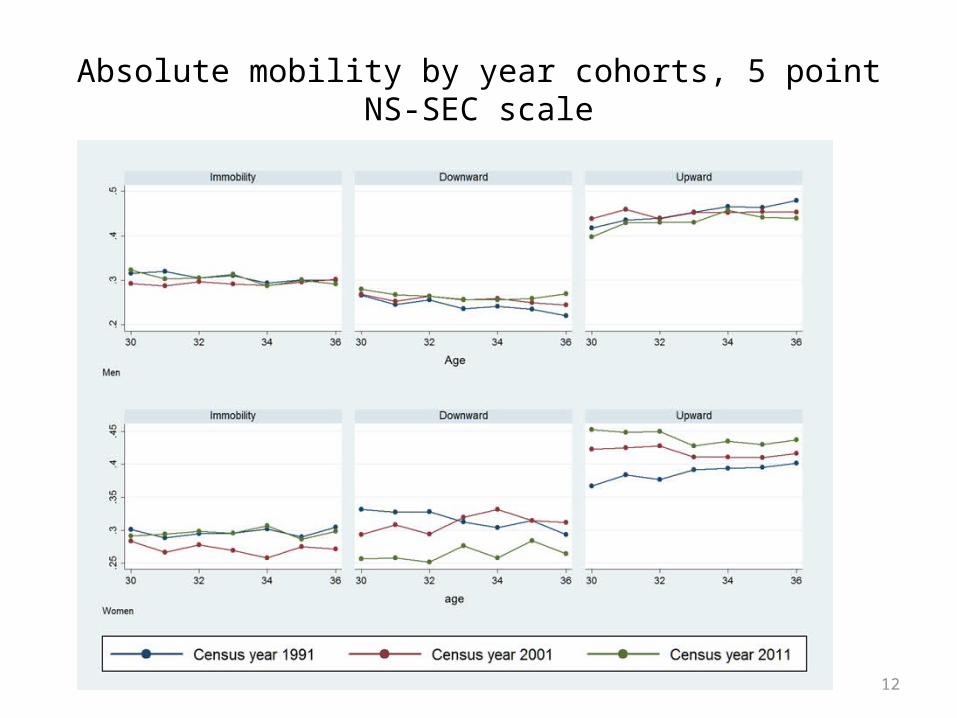
Absolute mobility by year cohorts, 5 point NS-SEC scale
13
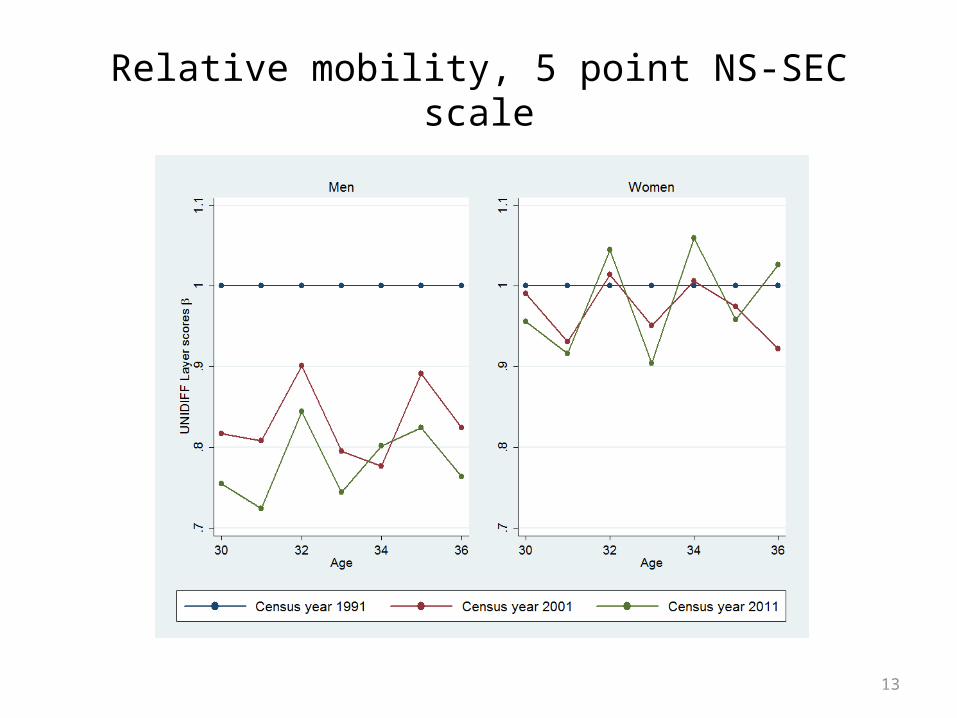
Relative mobility, 5 point NS-SEC scale

14
Relative mobility, CAMSIS correlations, age 30 to 36

We also looked at the impact of education reforms on social mobility
0.2
.4.6
0.2
.4.6
1950 1955 1960 1965 1970 1950 1955 1960 1965 1970 1950 1955 1960 1965 1970
1950 1955 1960 1965 1970 1950 1955 1960 1965 1970
Parent Quintile 1 Parent Quintile 2 Parent Quintile 3
Parent Quintile 4 Parent Quintile 5
Pro
po
rtio
n
Proportion with GCSE/O-levelas highest qualification in 2001
Proportion with noqualifications in 2001
Date of birth of 1971 LS memberGraphs by parent 1971 CAMSIS quintile. 1 Year averages

Figure 1 The impact of 1972 RoSLA on intergenerational mobility
Source: ONS-LS 1971 to 2001. Scatter plot is jittered to degree 2

Absent fathers

Working Mothers
Discussion• The ONS-LS is an excellent data source for social
mobility analysis• Our own results suggests that:
– There has been an increase in absolute mobility for women over successive cohorts. Rates now equal men.
– Mixed evidence on Relative mobility rates (fluidity)• Increase for men using NS-SEC, stable for women using NS-SEC• Increase for men and women using CAMSIS• Stable for men and women using income mobility (constant flux)• Notable variation in results from year to year
– There is no evidence that additional schooling causally impacted occupation-based social mobility
Future of the ONS-LS in mobility analysis?
• The ONS-LS still has a lot to offer on social mobility– There is the question of getting a better measure of
income included? Merging other administrative data sources?
– Determinants of; who are the upwardly, downwardly mobile, how do they change over time?
– Regional mobility?– Mobility by ethnic group (Platt) / immigration status?– 2021 will allow insight into the generation born in the
1990s.

Thanks for your attention