Embed Size (px)
Citation preview
Interim Broadband Master Plan
Prepared for the Fairhaven Board of Selectmen
September 2020
– Prepared By –
www.entpnt.com
Fairhaven Broadband Master Plan – Prepared by EntryPoint Networks Page | 1 Page | 1
Broadband Master Plan
Sep
tem
ber
202
0
Contents
I. Executive Summary
II. Strategy
III. SWOT Analysis
IV. Infrastructure
V. Assessment of Existing Broadband Infrastructure
VI. Market Analysis
VII. Community Engagement Plan
VIII. Broadband Survey Results
IX. Municipal Broadband Models Comparison
X. Network Design
XI. Project Partners
XII. Cost Analysis & Phasing
XIII. Financing Considerations
XIV. Risk Analysis
Fairhaven Broadband Master Plan – Prepared by EntryPoint Networks Page | 2 Page | 2
Broadband Master Plan
Sep
tem
ber
202
0
Executive Summary The Fairhaven Broadband Study Committee (BSC) has worked with EntryPoint Networks to develop this Broadband Master Plan to assist with a planning and decision-making process to assist the Fairhaven Select Board in determining whether it is feasible to deploy and operate broadband infrastructure for the residents, businesses and anchor institutions in the Town of Fairhaven. The information in this report will be used to assist in the planning and evaluation of feasibility for implementation of a network that can lower broadband costs and increase network value for all stakeholders in Fairhaven. Additionally, this report is designed to assist Town leaders in understanding the operational implications, important risk factors, and a realistic cost framework for developing and operating Town owned fiber optic infrastructure. The Broadband Master Plan is a living document that will first be used to analyze feasibility. If the Select Board determines that the project has sufficient merit, the planning process will continue toward a formal RFP process for Engineering, Construction, and Network Management Tools. The specific steps to this process are covered at the end of this document in the Next Steps section. The primary drivers for this analysis include an interest by the Board of Selectmen in lowering costs and improving network speed and reliability. This project also seeks to understand the potential for a high capacity broadband network to positively impact economic development, livability, public safety, education, healthcare, emergency communications, smart grid capabilities, efficient government services, universal access, environmental stewardship and smart city applications. This report seeks to provide the data needed for Town leaders to thoughtfully plan and implement a communications infrastructure strategy that will benefit residents, businesses, and anchor institutions for years to come. Town leaders will be able to use this document to lay the groundwork to address the challenges of a project of this size and scope. The key focus of the report is on the following primary activities:
1) Network Design & Architecture 2) Cost Analysis for Construction 3) Cost Analysis Network Operations 4) Customer Acquisition 5) Risk Management
Strategy Deploying a large-scale fiber optic network is a significant public works and information technology project. Key Strategic Ideas guiding this Plan were established by the Broadband Study Committee and include the following: 1. Improve Affordability – The Town of Fairhaven seeks to promote policies and initiatives that
will make internet access universally available and affordable throughout Town limits.
In addition to lowering
costs and delivering
significant improvements
in network speeds,
additional objectives for
the network include
positively impacting
economic development,
livability, public safety,
education, healthcare,
emergency
communications, smart
grid, efficient
government services,
universal access,
environmental
stewardship and smart
Town initiatives.
Fairhaven Broadband Master Plan – Prepared by EntryPoint Networks Page | 3 Page | 3
Broadband Master Plan
Sep
tem
ber
202
0
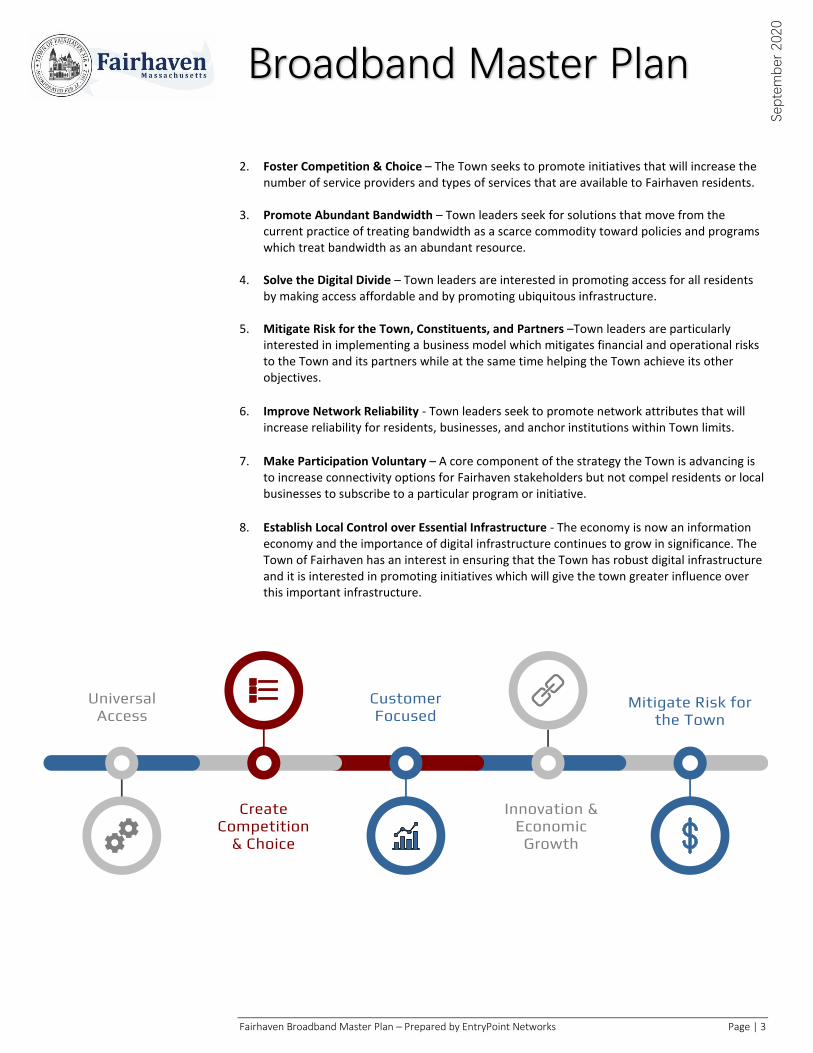
2. Foster Competition & Choice – The Town seeks to promote initiatives that will increase the number of service providers and types of services that are available to Fairhaven residents.
3. Promote Abundant Bandwidth – Town leaders seek for solutions that move from the current practice of treating bandwidth as a scarce commodity toward policies and programs which treat bandwidth as an abundant resource.
4. Solve the Digital Divide – Town leaders are interested in promoting access for all residents
by making access affordable and by promoting ubiquitous infrastructure.
5. Mitigate Risk for the Town, Constituents, and Partners –Town leaders are particularly interested in implementing a business model which mitigates financial and operational risks to the Town and its partners while at the same time helping the Town achieve its other objectives.
6. Improve Network Reliability - Town leaders seek to promote network attributes that will increase reliability for residents, businesses, and anchor institutions within Town limits.
7. Make Participation Voluntary – A core component of the strategy the Town is advancing is to increase connectivity options for Fairhaven stakeholders but not compel residents or local businesses to subscribe to a particular program or initiative.
8. Establish Local Control over Essential Infrastructure - The economy is now an information economy and the importance of digital infrastructure continues to grow in significance. The Town of Fairhaven has an interest in ensuring that the Town has robust digital infrastructure and it is interested in promoting initiatives which will give the town greater influence over this important infrastructure.
UniversalAccess
Customer Focused
Mitigate Risk for the Town
Create Competition
& Choice
Innovation & Economic
Growth
Fairhaven Broadband Master Plan – Prepared by EntryPoint Networks Page | 4 Page | 4
Broadband Master Plan
Sep
tem
ber
202
0
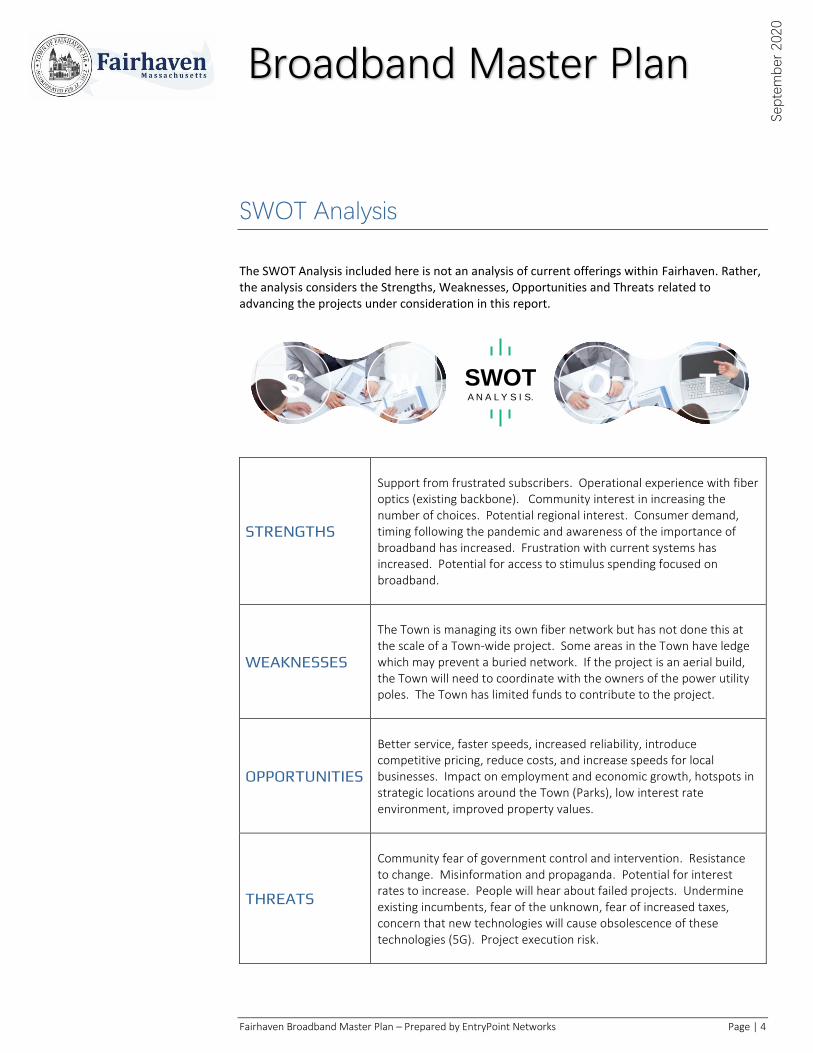
SWOT Analysis The SWOT Analysis included here is not an analysis of current offerings within Fairhaven. Rather, the analysis considers the Strengths, Weaknesses, Opportunities and Threats related to advancing the projects under consideration in this report.
STRENGTHS
Support from frustrated subscribers. Operational experience with fiber optics (existing backbone). Community interest in increasing the number of choices. Potential regional interest. Consumer demand, timing following the pandemic and awareness of the importance of broadband has increased. Frustration with current systems has increased. Potential for access to stimulus spending focused on broadband.
WEAKNESSES
The Town is managing its own fiber network but has not done this at the scale of a Town-wide project. Some areas in the Town have ledge which may prevent a buried network. If the project is an aerial build, the Town will need to coordinate with the owners of the power utility poles. The Town has limited funds to contribute to the project.
OPPORTUNITIES
Better service, faster speeds, increased reliability, introduce competitive pricing, reduce costs, and increase speeds for local businesses. Impact on employment and economic growth, hotspots in strategic locations around the Town (Parks), low interest rate environment, improved property values.
THREATS
Community fear of government control and intervention. Resistance to change. Misinformation and propaganda. Potential for interest rates to increase. People will hear about failed projects. Undermine existing incumbents, fear of the unknown, fear of increased taxes, concern that new technologies will cause obsolescence of these technologies (5G). Project execution risk.
WS TOSWOTA N A L Y S I S.
Fairhaven Broadband Master Plan – Prepared by EntryPoint Networks Page | 5 Page | 5
Broadband Master Plan
Sep
tem
ber
202
0
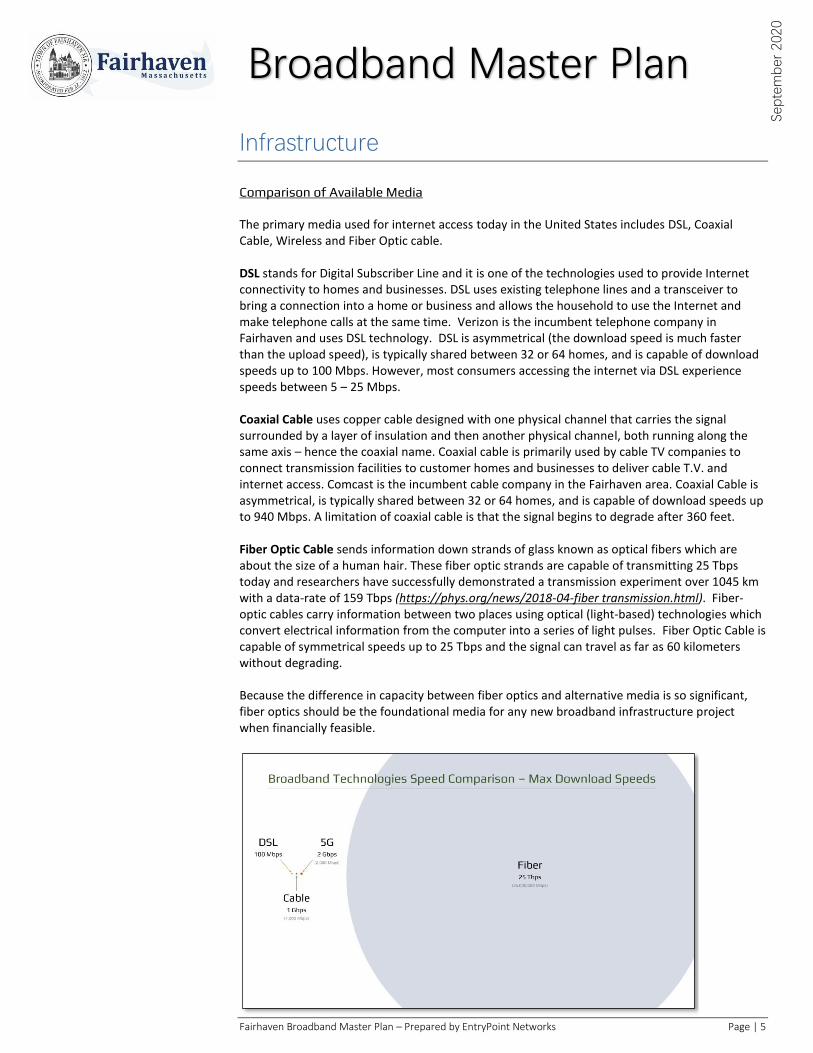
Infrastructure Comparison of Available Media The primary media used for internet access today in the United States includes DSL, Coaxial Cable, Wireless and Fiber Optic cable. DSL stands for Digital Subscriber Line and it is one of the technologies used to provide Internet connectivity to homes and businesses. DSL uses existing telephone lines and a transceiver to bring a connection into a home or business and allows the household to use the Internet and make telephone calls at the same time. Verizon is the incumbent telephone company in Fairhaven and uses DSL technology. DSL is asymmetrical (the download speed is much faster than the upload speed), is typically shared between 32 or 64 homes, and is capable of download speeds up to 100 Mbps. However, most consumers accessing the internet via DSL experience speeds between 5 – 25 Mbps. Coaxial Cable uses copper cable designed with one physical channel that carries the signal surrounded by a layer of insulation and then another physical channel, both running along the same axis – hence the coaxial name. Coaxial cable is primarily used by cable TV companies to connect transmission facilities to customer homes and businesses to deliver cable T.V. and internet access. Comcast is the incumbent cable company in the Fairhaven area. Coaxial Cable is asymmetrical, is typically shared between 32 or 64 homes, and is capable of download speeds up to 940 Mbps. A limitation of coaxial cable is that the signal begins to degrade after 360 feet. Fiber Optic Cable sends information down strands of glass known as optical fibers which are about the size of a human hair. These fiber optic strands are capable of transmitting 25 Tbps today and researchers have successfully demonstrated a transmission experiment over 1045 km with a data-rate of 159 Tbps (https://phys.org/news/2018-04-fiber transmission.html). Fiber-optic cables carry information between two places using optical (light-based) technologies which convert electrical information from the computer into a series of light pulses. Fiber Optic Cable is capable of symmetrical speeds up to 25 Tbps and the signal can travel as far as 60 kilometers without degrading. Because the difference in capacity between fiber optics and alternative media is so significant, fiber optics should be the foundational media for any new broadband infrastructure project when financially feasible.
Fairhaven Broadband Master Plan – Prepared by EntryPoint Networks Page | 6 Page | 6
Broadband Master Plan
Sep
tem
ber
202
0
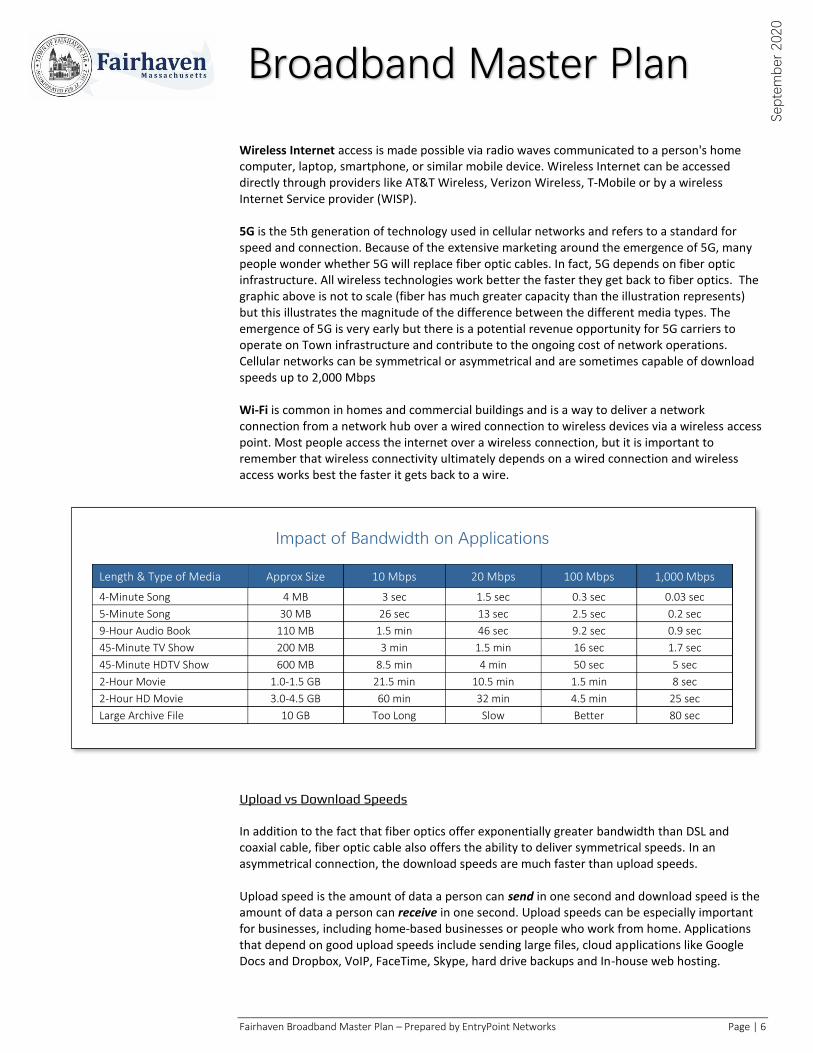
Wireless Internet access is made possible via radio waves communicated to a person's home computer, laptop, smartphone, or similar mobile device. Wireless Internet can be accessed directly through providers like AT&T Wireless, Verizon Wireless, T-Mobile or by a wireless Internet Service provider (WISP). 5G is the 5th generation of technology used in cellular networks and refers to a standard for speed and connection. Because of the extensive marketing around the emergence of 5G, many people wonder whether 5G will replace fiber optic cables. In fact, 5G depends on fiber optic infrastructure. All wireless technologies work better the faster they get back to fiber optics. The graphic above is not to scale (fiber has much greater capacity than the illustration represents) but this illustrates the magnitude of the difference between the different media types. The emergence of 5G is very early but there is a potential revenue opportunity for 5G carriers to operate on Town infrastructure and contribute to the ongoing cost of network operations. Cellular networks can be symmetrical or asymmetrical and are sometimes capable of download speeds up to 2,000 Mbps Wi-Fi is common in homes and commercial buildings and is a way to deliver a network connection from a network hub over a wired connection to wireless devices via a wireless access point. Most people access the internet over a wireless connection, but it is important to remember that wireless connectivity ultimately depends on a wired connection and wireless access works best the faster it gets back to a wire. Upload vs Download Speeds In addition to the fact that fiber optics offer exponentially greater bandwidth than DSL and coaxial cable, fiber optic cable also offers the ability to deliver symmetrical speeds. In an asymmetrical connection, the download speeds are much faster than upload speeds. Upload speed is the amount of data a person can send in one second and download speed is the amount of data a person can receive in one second. Upload speeds can be especially important for businesses, including home-based businesses or people who work from home. Applications that depend on good upload speeds include sending large files, cloud applications like Google Docs and Dropbox, VoIP, FaceTime, Skype, hard drive backups and In-house web hosting.
Length & Type of Media Approx Size 10 Mbps 20 Mbps 100 Mbps 1,000 Mbps
4-Minute Song 4 MB 3 sec 1.5 sec 0.3 sec 0.03 sec
5-Minute Song 30 MB 26 sec 13 sec 2.5 sec 0.2 sec
9-Hour Audio Book 110 MB 1.5 min 46 sec 9.2 sec 0.9 sec
45-Minute TV Show 200 MB 3 min 1.5 min 16 sec 1.7 sec
45-Minute HDTV Show 600 MB 8.5 min 4 min 50 sec 5 sec
2-Hour Movie 1.0-1.5 GB 21.5 min 10.5 min 1.5 min 8 sec
2-Hour HD Movie 3.0-4.5 GB 60 min 32 min 4.5 min 25 sec
Large Archive File 10 GB Too Long Slow Better 80 sec
Impact of Bandwidth on Applications
Fairhaven Broadband Master Plan – Prepared by EntryPoint Networks Page | 7 Page | 7
Broadband Master Plan
Sep
tem
ber
202
0
Transmission Distance As described above, an additional benefit of fiber optic infrastructure is that a communication signal sent over fiber does not start to degrade for 45 miles while a signal sent over coaxial cable starts to degrade after 340 feet.
Assessment of Existing Broadband Infrastructure A 2017 Deloitte Consulting analysis summarizes the current needs and realities for legacy broadband infrastructure in the United States this way: “The United States requires between $130 and $150 billion over the next 5–7 years to adequately support broadband competition, rural coverage and wireless densification. Despite the demand and potential economic benefits of fiber deployment, the United States lacks the fiber density in access networks to make the bandwidth advancements necessary to improve the pace of innovation and economic growth. Some wireline carriers are reluctant or unable to invest in fiber for the consumer segment despite the potential benefits. Expected wireline capital expenditures range between 14–18 percent of revenue. Wireline operating expenditures can be 80 percent of revenue. Fiber deployment in access networks is only justified today if a short payback period can be guaranteed, a new footprint is being built, repairs from rebuilding after a storm or other event justifies replacement, or in subsidized geographies where Universal Service funds can be used. The largest US wireline carriers spend, on average, five to six times more on operating expenses than capital expenditures. Excessive operating expenditures caused, in part, by legacy network technology restrict carriers’ ability to leverage digital technology advancements. Worse, as legacy networks continue to descale, the percentage of fixed costs overwhelms the cost structure leading to even greater margin pressure.” Citation: https://www2.deloitte.com/content/dam/Deloitte/us/Documents/technology-media-telecommunications/us-tmt-5GReady-the-need-for-deep-fiber-pov.pdf
The Deloitte report is not specific to infrastructure in Fairhaven, Massachusetts, but the conclusions from the Deloitte report are generally applicable. Telco and Cable operators in U.S. cities often have fiber to an aggregation point and then legacy infrastructure from the aggregation point to the premise. The primary finding of the Deloitte report is that legacy infrastructure needs to be replaced with Fiber Optic cable in the near-term to meet bandwidth demands. There is no indication that incumbents intend to replace legacy infrastructure with Fiber Optic infrastructure in the near term and even if they did, this upgrade would solve the base infrastructure problem but it would not solve for the lack of competition or premium pricing for Gig speeds. Legacy copper and coaxial infrastructure will need to be replaced with state-of-the-art infrastructure to meet the ever-growing demands for greater bandwidth and faster speeds. An important question is whether unique value can be derived by having the Town and its residents own and control this infrastructure or whether private companies should continue to own and operate all communications infrastructure. Ideal infrastructure includes more than just the fiber optic cables running throughout the Town. Important infrastructure considerations include the electronics at both ends of the fiber as well
“The United States requires between $130 and $150 billion over the next 5–7 years to adequately support broadband competition, rural coverage and wireless densification.”
“The primary finding
of the Deloitte report
is that legacy
infrastructure needs
to be replaced with
Fiber Optic cable in
the near-term to
meet bandwidth
demands.”
Fairhaven Broadband Master Plan – Prepared by EntryPoint Networks Page | 8 Page | 8
Broadband Master Plan
Sep
tem
ber
202
0
as systems that manage and control the network. As the Town deploys its infrastructure, the following are important considerations guiding its decision-making framework:
• Capacity & Speed: The demand for bandwidth and speed will continue to grow.
• Emerging Services and Applications: 5G, connected vehicles, edge computing, and virtual reality are all examples of emerging applications that have infrastructure dependencies. An important consideration is how flexible the business model and technology systems are to enable whatever may come.
• Local Control: An advantage of a network that is locally controlled is that the network can be much more responsive to local needs and may enable innovation and adaptation for emerging opportunities.
• Local Resilience: Many communities are not locally resilient against attacks on internet infrastructure. It is possible to design networks in a way that provides residents and businesses with a network that is locally resilient if, for some reason, middle mile connections are severed.
• Privacy & Security: Subscribers are becoming increasingly sensitive to security, privacy, and confidentiality controls.
• Risk Analysis: Consideration of the risks for all potential network stakeholders is an essential part of the planning process.
Market Analysis In Fairhaven, most residents and businesses subscribe to wireline internet services from the cable operator (Xfinity Comcast) and telephone incumbent (Verizon).
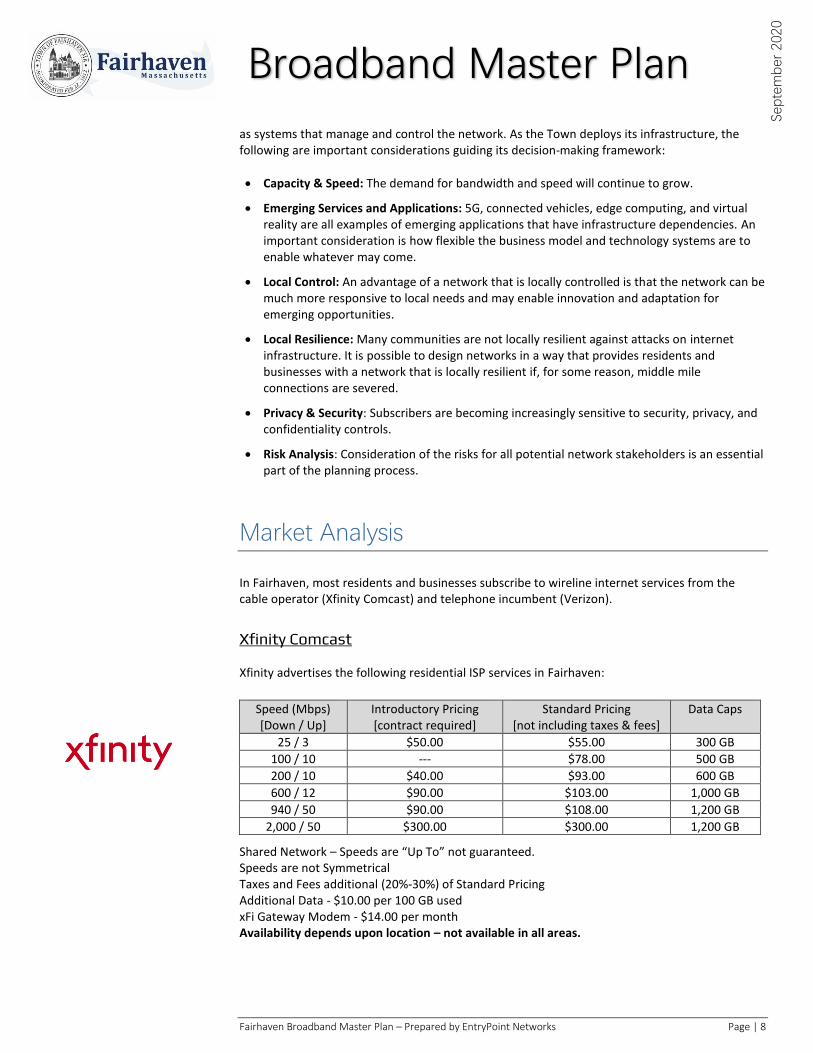
Xfinity Comcast Xfinity advertises the following residential ISP services in Fairhaven:
Speed (Mbps) [Down / Up]
Introductory Pricing [contract required]
Standard Pricing [not including taxes & fees]
Data Caps
25 / 3 $50.00 $55.00 300 GB
100 / 10 --- $78.00 500 GB
200 / 10 $40.00 $93.00 600 GB
600 / 12 $90.00 $103.00 1,000 GB
940 / 50 $90.00 $108.00 1,200 GB
2,000 / 50 $300.00 $300.00 1,200 GB
Shared Network – Speeds are “Up To” not guaranteed. Speeds are not Symmetrical Taxes and Fees additional (20%-30%) of Standard Pricing Additional Data - $10.00 per 100 GB used xFi Gateway Modem - $14.00 per month Availability depends upon location – not available in all areas.
Fairhaven Broadband Master Plan – Prepared by EntryPoint Networks Page | 9 Page | 9
Broadband Master Plan
Sep
tem
ber
202
0
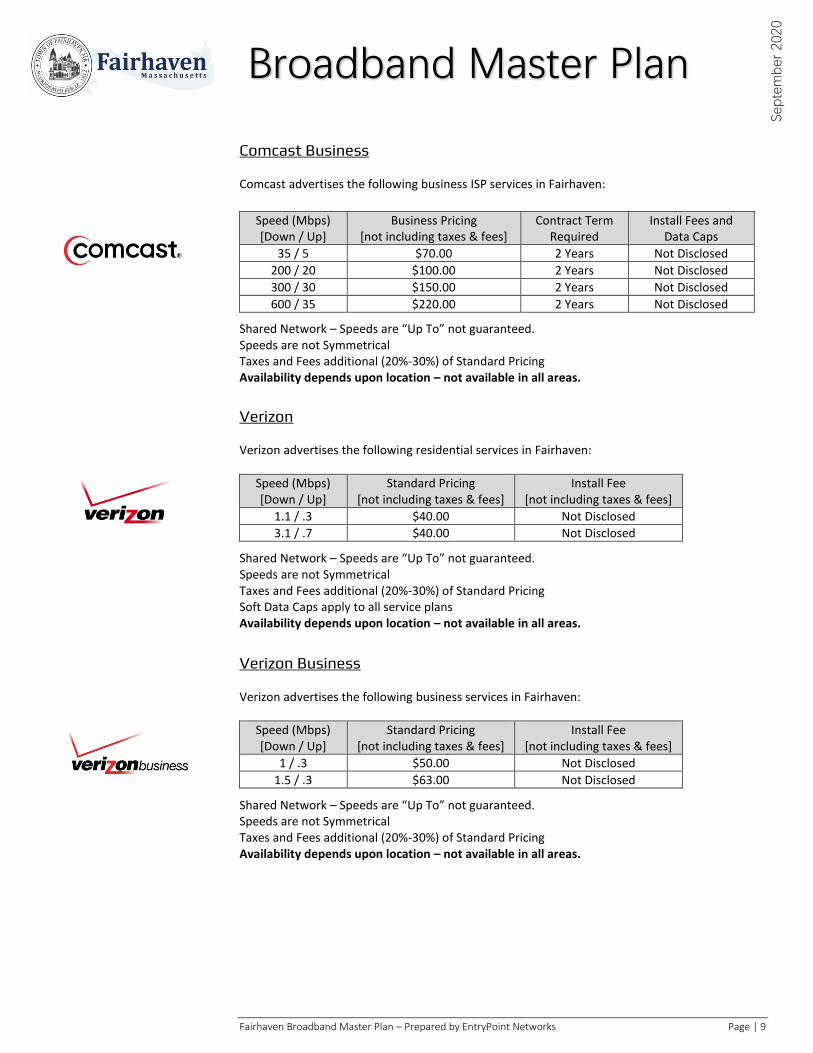
Comcast Business Comcast advertises the following business ISP services in Fairhaven:
Speed (Mbps) [Down / Up]
Business Pricing [not including taxes & fees]
Contract Term Required
Install Fees and Data Caps
35 / 5 $70.00 2 Years Not Disclosed
200 / 20 $100.00 2 Years Not Disclosed
300 / 30 $150.00 2 Years Not Disclosed
600 / 35 $220.00 2 Years Not Disclosed
Shared Network – Speeds are “Up To” not guaranteed. Speeds are not Symmetrical Taxes and Fees additional (20%-30%) of Standard Pricing Availability depends upon location – not available in all areas.
Verizon Verizon advertises the following residential services in Fairhaven:
Speed (Mbps) [Down / Up]
Standard Pricing [not including taxes & fees]
Install Fee [not including taxes & fees]
1.1 / .3 $40.00 Not Disclosed
3.1 / .7 $40.00 Not Disclosed
Shared Network – Speeds are “Up To” not guaranteed. Speeds are not Symmetrical Taxes and Fees additional (20%-30%) of Standard Pricing Soft Data Caps apply to all service plans Availability depends upon location – not available in all areas.
Verizon Business Verizon advertises the following business services in Fairhaven:
Speed (Mbps) [Down / Up]
Standard Pricing [not including taxes & fees]
Install Fee [not including taxes & fees]
1 / .3 $50.00 Not Disclosed
1.5 / .3 $63.00 Not Disclosed
Shared Network – Speeds are “Up To” not guaranteed. Speeds are not Symmetrical Taxes and Fees additional (20%-30%) of Standard Pricing Availability depends upon location – not available in all areas.
Fairhaven Broadband Master Plan – Prepared by EntryPoint Networks Page | 10 Page | 10
Broadband Master Plan
Sep
tem
ber
202
0
Community Engagement Plan The sample Community Engagement Plan that follows is built on an assumption that Fairhaven will go forward with a Town sponsored project. If the Town elects to support an alternative approach (Cooperative or public private partnership) the Community Engagement approach will change.
Goals & Objectives The objective of a Fairhaven Community Engagement Plan is to achieve a minimum 40% take-rate for homes and businesses within Fairhaven Town limits. Additionally, a scale of 2,500 subscribers is an important target for the project to be operationally sustainable. In the financial section later in this report, the financial models are built to a target of a 60% take-rate. The modeling can easily be adjusted to match actual take-rates.
Evaluation & Education Document the current state of broadband and determine the level of interest among residential users and business owners.
Community Survey A survey for residents and business owners is in place to determine the level of interest in a municipal fiber network. It is important to drive response to the survey. Education and promotion programs should be influenced by survey engagement and response.
Publish Educational Information Create a website specific to the municipal fiber program. Outline the core message of broadband as a utility that will support an environment of choice and subscriber control. Use customized videos to educate online visitors on the following:
a. Functionality of the community fiber network b. Options for services c. Frequently Asked Questions (FAQ’s) d. Inquiry Form where community members can submit questions to the municipality
Mapping Community Interest Distribute an “I am interested” sign-up form with associated heat map where residential and business property owners can register as someone interested in municipal fiber. Evaluation & Education Budget = $3,000 - $10,000
Marketing & Promotion Fairhaven issues a series of Press Releases and sends out inserts in monthly utility bills promoting the municipal fiber program, driving traffic to fiber website with the goal of educating community members and generating interest and encouraging community participation in the survey. Use all available social media platforms (Facebook, Twitter, etc.) to promote the fiber network.
Fairhaven Broadband Master Plan – Prepared by EntryPoint Networks Page | 11 Page | 11
Broadband Master Plan
Sep
tem
ber
202
0
Neighborhood Entrance and Yard Signs As construction (fiber build) begins in a neighborhood, Fairhaven will post signs at neighborhood entrances announcing the construction and letting residents know they can still sign-up to get connected while crews are in the neighborhood. As homes are connected in the neighborhood, yard signs are placed in the yards of subscribers indicating that the home now enjoys a fiber broadband connection. Marketing & Promotion Budget = $10,000 - $15,000 Grassroots Engagement
Open House Events Fairhaven holds a series of Open Houses where residents and business owners can hear an educational presentation about the fiber project, ask questions about the fiber project, become educated about the Fairhaven fiber plan, business model, etc. Open Houses are promoted using utility bill inserts, press releases, public service announcements, local news reports, town websites, social media platforms, etc. Open House events are intended to educate residents, promote the network, and identify Fiber Champions in the various neighborhoods (fiber zones). Fiber Champions are individuals that are committed to promoting the network within their neighborhood. Fiber Champions are also incentivized to be the first neighborhood to get connected (initial fiber zones are connected in order of take-rates – highest to lowest).
Fiber Champions Fiber Champions assist sales efforts within their designated neighborhood (fiber zone). They organize and lead Cottage Meetings where neighbors come together to discuss the Fairhaven fiber program. Fairhaven leaders and employees provide support to the Fiber Champions in their efforts. Fiber Champions drive conversations and contractual commitments of neighbors via the Door-to-Door Sales and Education campaign. Grassroots Engagement Budget = $2,000 - $5,000
Door-to-Door Campaign Network sales agents (typically an independent group representing the network) contact residents and business operators within the planned network footprint to answer questions about the network and ascertain the potential subscribers’ intentions regarding their participation in the network. [Yes (Opt-in) or No (Opt-out)]. This direct person-to-person contact gives everyone in the community an opportunity to ask questions, clarify their understanding and express their level of interest in participating. To maximize the effectiveness of this process, prior to canvassing a neighborhood, door hangers are distributed to every home and business informing property owners that a representative will be stopping by to explain the value proposition, answer questions and get their Opt-in / Opt-out decision.
Fairhaven Broadband Master Plan – Prepared by EntryPoint Networks Page | 12 Page | 12
Broadband Master Plan
Sep
tem
ber
202
0
It is important that Fairhaven support this effort through public notifications, press releases, mass emails, websites, social media sites, mobile applications, and other community outreach venues available to Fairhaven. This may include outside professional marketing and/or PR firms. Door-to-Door Sales Effort Budget = $100 per Premise that Subscribes
[Sign-up Fee or Wrapped into the Infrastructure Installation Costs]
Total Fairhaven Community Engagement Plan Budget = $15,000 to $30,000 + Door to Door Sales Commissions. Please Note – The work outlined in the various Steps of this Community Engagement Plan, in whole or part, can be managed by internal Fairhaven personnel or can be outsourced to a professional marketing and promotions organization.
Fairhaven Broadband Master Plan – Prepared by EntryPoint Networks Page | 13 Page | 13
Broadband Master Plan
Sep
tem
ber
202
0
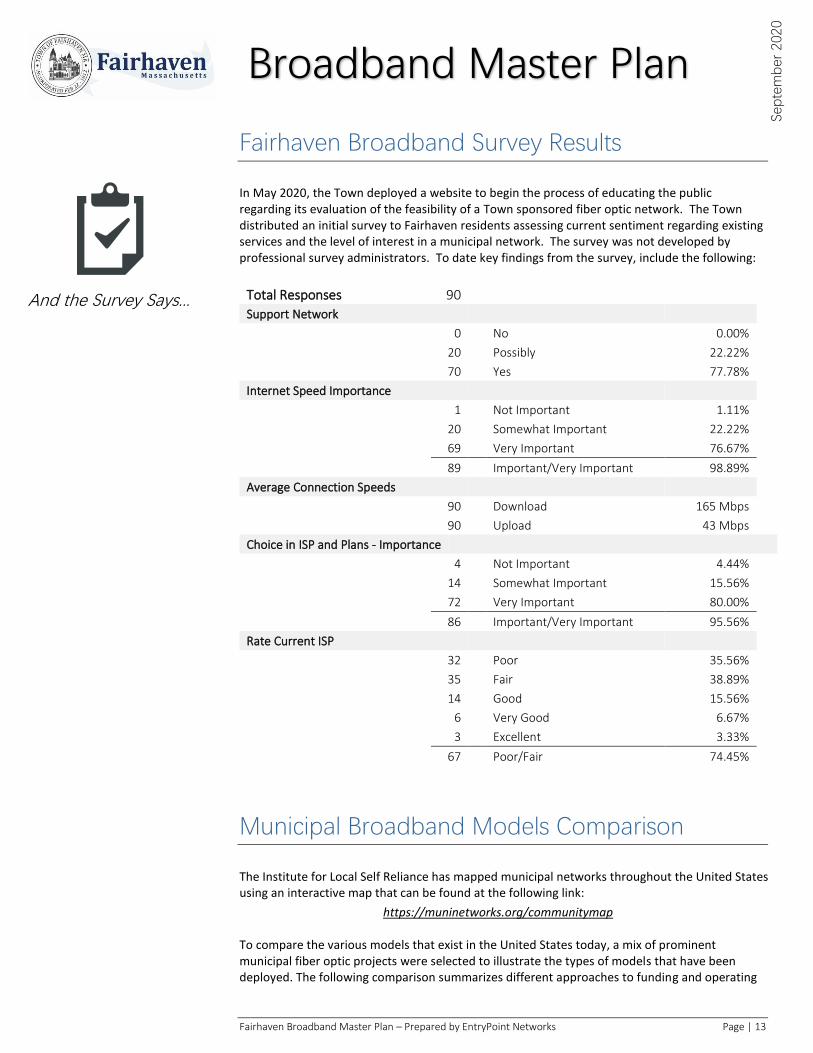
Fairhaven Broadband Survey Results In May 2020, the Town deployed a website to begin the process of educating the public regarding its evaluation of the feasibility of a Town sponsored fiber optic network. The Town distributed an initial survey to Fairhaven residents assessing current sentiment regarding existing services and the level of interest in a municipal network. The survey was not developed by professional survey administrators. To date key findings from the survey, include the following:
Total Responses 90
Support Network 0 No 0.00%
20 Possibly 22.22% 70 Yes 77.78%
Internet Speed Importance 1 Not Important 1.11%
20 Somewhat Important 22.22% 69 Very Important 76.67% 89 Important/Very Important 98.89%
Average Connection Speeds 90 Download 165 Mbps 90 Upload 43 Mbps
Choice in ISP and Plans - Importance 4 Not Important 4.44%
14 Somewhat Important 15.56% 72 Very Important 80.00% 86 Important/Very Important 95.56%
Rate Current ISP 32 Poor 35.56%
35 Fair 38.89% 14 Good 15.56%
6 Very Good 6.67%
3 Excellent 3.33%
67 Poor/Fair 74.45%
Municipal Broadband Models Comparison The Institute for Local Self Reliance has mapped municipal networks throughout the United States using an interactive map that can be found at the following link:
https://muninetworks.org/communitymap To compare the various models that exist in the United States today, a mix of prominent municipal fiber optic projects were selected to illustrate the types of models that have been deployed. The following comparison summarizes different approaches to funding and operating
And the Survey Says...
Fairhaven Broadband Master Plan – Prepared by EntryPoint Networks Page | 14 Page | 14
Broadband Master Plan
Sep
tem
ber
202
0
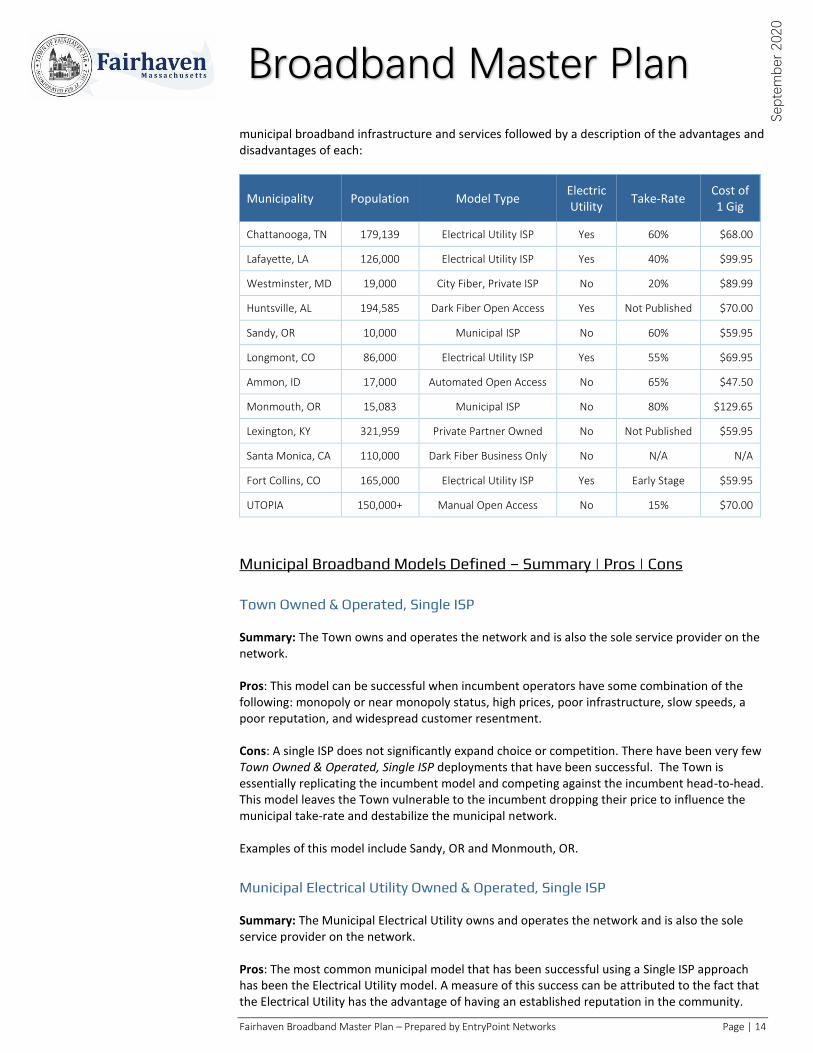
municipal broadband infrastructure and services followed by a description of the advantages and disadvantages of each:
Municipality Population Model Type Electric Utility
Take-Rate Cost of 1 Gig
Chattanooga, TN 179,139 Electrical Utility ISP Yes 60% $68.00
Lafayette, LA 126,000 Electrical Utility ISP Yes 40% $99.95
Westminster, MD 19,000 City Fiber, Private ISP No 20% $89.99
Huntsville, AL 194,585 Dark Fiber Open Access Yes Not Published $70.00
Sandy, OR 10,000 Municipal ISP No 60% $59.95
Longmont, CO 86,000 Electrical Utility ISP Yes 55% $69.95
Ammon, ID 17,000 Automated Open Access No 65% $47.50
Monmouth, OR 15,083 Municipal ISP No 80% $129.65
Lexington, KY 321,959 Private Partner Owned No Not Published $59.95
Santa Monica, CA 110,000 Dark Fiber Business Only No N/A N/A
Fort Collins, CO 165,000 Electrical Utility ISP Yes Early Stage $59.95
UTOPIA 150,000+ Manual Open Access No 15% $70.00
Municipal Broadband Models Defined – Summary | Pros | Cons Town Owned & Operated, Single ISP Summary: The Town owns and operates the network and is also the sole service provider on the network. Pros: This model can be successful when incumbent operators have some combination of the following: monopoly or near monopoly status, high prices, poor infrastructure, slow speeds, a poor reputation, and widespread customer resentment. Cons: A single ISP does not significantly expand choice or competition. There have been very few Town Owned & Operated, Single ISP deployments that have been successful. The Town is essentially replicating the incumbent model and competing against the incumbent head-to-head. This model leaves the Town vulnerable to the incumbent dropping their price to influence the municipal take-rate and destabilize the municipal network. Examples of this model include Sandy, OR and Monmouth, OR.
Municipal Electrical Utility Owned & Operated, Single ISP Summary: The Municipal Electrical Utility owns and operates the network and is also the sole service provider on the network. Pros: The most common municipal model that has been successful using a Single ISP approach has been the Electrical Utility model. A measure of this success can be attributed to the fact that the Electrical Utility has the advantage of having an established reputation in the community.
Fairhaven Broadband Master Plan – Prepared by EntryPoint Networks Page | 15 Page | 15
Broadband Master Plan
Sep
tem
ber
202
0
Also, electrical Utilities often have financial, customer service, and engineering expertise that may be beneficial to the network and the skill set for Outside Plant personnel for a municipal network is similar in kind to the existing range of skills in an Electrical Utility. The likelihood of success increases in instances where the incumbent operator has monopoly or near monopoly status, higher than average prices, poor infrastructure, slow speeds, a poor reputation and/or widespread customer resentment. Cons: A single ISP does not significantly expand choice. Expertise in network operations will need to be enhanced or developed. This model is essentially replicating the incumbent model and involves competing against the incumbent head-to-head. This model leaves the City / Electrical Utility vulnerable to the incumbent dropping their price to impact the take-rate and destabilize the network. Examples of this model include Chattanooga, TN and Longmont, CO. Fort Collins, CO. is in the early stages of deployment and is replicating this model.
Dark Fiber, Open Access Summary: Dark Fiber Open Access is a model where the town builds infrastructure to the curb and the subscriber then selects an ISP as its provider and the ISP finishes the connection to the home with its own infrastructure and electronics. Pros: Open Access increases choice for consumers. Operating a dark fiber network is less complicated than operating a lit network. The Dark Fiber model enables Public ownership of infrastructure. Cons: The Dark Fiber model gives up control over last mile infrastructure, i.e., the drop from the curb to the premise. The Dark Fiber model therefore limits the usability of each strand of fiber. With an isolated dark fiber connection, it is impossible to connect to other services that may not be available through the ISP that controls the drop to the customer premise. The Dark Fiber Model may not scale easily due to difficulty in anticipating the required fiber count to meet the demand. This can create significant complications for the network operator. An example of this model is Huntsville, AL.
Manual Open Access
Summary: Manual Open Access is a model where the network is lit end to end. This means that the network operator places and controls the electronics at both ends of the network. In this model, switching service providers can be requested from a web portal and may appear to be automated but the network provisioning is not automated.
Pros: A manual Open Access network increases choice for consumers.
Cons: Operating a Manual Open Access network is more complex than operating a Single ISP network because of the requirement for human management of network tasks. Any increase in the number of service providers operating on the network adds to network complexity.
An example of this model is the UTOPIA Network. UTOPIA is the largest manual open access network in the United States with just over 20,000 premises connected. UTOPIA struggled under heavy debt obligations for 15 years but is now operating on a sustainable trajectory. In addition to UTOPIA, there are several Manual Open Access networks throughout Europe.
Fairhaven Broadband Master Plan – Prepared by EntryPoint Networks Page | 16 Page | 16
Broadband Master Plan
Sep
tem
ber
202
0
Automated Open Access
Summary: Automated Open Access is a model where the network operator places electronics at both ends of the network and subscribers can dynamically select service providers in real-time. Software Defined Networking is used to automate various network management tasks.
Pros: Multiple service providers can deliver services simultaneously and independently across a single wire. When a subscriber selects a new service provider, the provisioning is done using automation and therefore happens on-demand. The automated provisioning creates a marketplace for services which includes ISP’s and private networks for other services. The ability to switch service providers on demand increases choice and competition. This network model also includes the ability to provide local network resilience via local communications if connections over the middle mile are down.
Cons: The model was first implemented in late 2016. Ammon, ID is the only city that has a full implementation operating today.
Examples of this model include Ammon, Idaho and early stage deployments in McCall, Idaho, Mountain Home, Idaho, and Elkhart County in Indiana.
Disclosure: EntryPoint Networks owns and operates a SaaS model Automated Open Access solution and is the technology solution provider in these networks.
Private Sector Owner & Operator, Single ISP Summary: A private builder designs, builds and operates a network. The private entity is also the sole ISP on the network – replicating the incumbent model. Pros: A private builder and operator assumes all the risk and does the work of overseeing design, project management, construction, customer acquisition and operations. This model increases the choices available to consumers with minimal obligation or burden for the town. Cons: The new operator is replicating the incumbent model. There is no local control over infrastructure and ISP choices increase by just one new provider. There is no guarantee that the operator will address the digital divide. The network can be sold to another operator. There are many examples of over-builders but Lexington, Kentucky is a recent example.
Private Sector Owner & Operator, Open Access Summary: A private builder designs, builds and operates a network. The private entity uses an Open Access model rather than the incumbent model for service delivery. Pros: A private builder and operator assumes all the risk and does the work of overseeing design, project management, construction, customer acquisition and operations. This model provides an increase in the choices available to consumers at almost no cost to the town. Risk exposure to the town is very low. The private builder/operator builds and stabilizes the network and may give the town the option to acquire the network after an agreed upon number of years for a premium price above the actual cost to develop. Cons: There is no local control over infrastructure. There is no guarantee that the operator will address digital divide issues. A private owner will be free to sell the network to a new operator that may or may not be aligned with community objectives for the network. An example of this model is Fullerton, CA (SiFi).
Fairhaven Broadband Master Plan – Prepared by EntryPoint Networks Page | 17 Page | 17
Broadband Master Plan
Sep
tem
ber
202
0
Cooperative Owned & Operated, Open Access ISP Summary: A fiber-optic infrastructure cooperative owns and operates the network using an Open Access model. Pros: The subscribers to the network are the owners of the infrastructure. This creates local control over infrastructure. The speed to market can be much faster than municipal ownership because the model is established up front. The model gives subscribers choice and competition among service providers which will likely lead to lower pricing in comparison to incumbent operators. Probability of success increases when incumbent operators have some combination of the following: monopoly or near monopoly status, high prices, poor infrastructure, slow speeds, a poor reputation, and widespread customer resentment. Cons: It is more difficult to obtain financing because the cooperative has no assets at the beginning of the project. If financing can be obtained, the cost of money will be more expensive than a town sponsored project.
Funding Considerations As the Town evaluates which model is optimal for Fairhaven, the following funding issues should also be considered: Tax Non-Participants – If Fairhaven decides to pursue a municipally controlled network, an important funding question is whether the Town should pursue a General Obligation Bond to deploy broadband infrastructure ubiquitously to every premise in the Town? Today, most Cities/Towns do not have the political will or inclination to build broadband infrastructure through a funding mechanism that taxes all residents, essentially mandating participation, regardless of whether the resident chooses to participate as a consumer of network services. Voluntary Participation – The alternative to taxing all residents is to deploy a business model that allocates network costs to voluntary participants. Allowing subscribers to voluntarily opt-in to network participation honors individual preferences for residents and businesses, eliminates Political Risk and can increase public support for the network. Allowing subscribers to voluntarily opt-in or opt-out of network participation is less efficient and more expensive than a model that mandates universal participation. Further, voluntary participation may exacerbate the digital divide. If the Board of Selectmen and other Town leaders agree with the strategic priority for Fairhaven’s Broadband Study Committee to not compel participation, the Town should pursue a model that allows for voluntary participation.
Network Design Switched Ethernet Network The Switched Ethernet architecture provides a dedicated connection for each customer rather than a shared connection and the customer experience is significantly better than in a shared architecture during periods of network congestion. This is due to the fact that the throughput of switch-based architecture is superior to a bus-based architecture during times of network congestion.
Fairhaven Broadband Master Plan – Prepared by EntryPoint Networks Page | 18 Page | 18
Broadband Master Plan
Sep
tem
ber
202
0
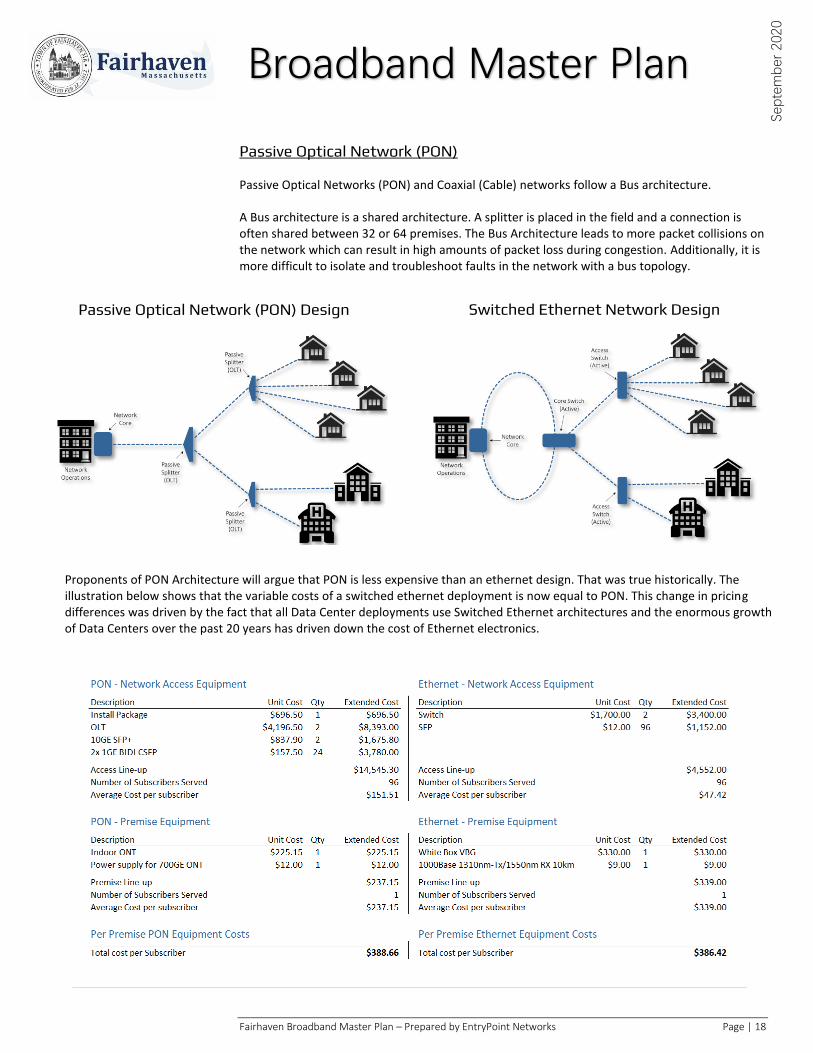
Passive Optical Network (PON) Passive Optical Networks (PON) and Coaxial (Cable) networks follow a Bus architecture. A Bus architecture is a shared architecture. A splitter is placed in the field and a connection is often shared between 32 or 64 premises. The Bus Architecture leads to more packet collisions on the network which can result in high amounts of packet loss during congestion. Additionally, it is more difficult to isolate and troubleshoot faults in the network with a bus topology.
Passive Optical Network (PON) Design
Switched Ethernet Network Design
Proponents of PON Architecture will argue that PON is less expensive than an ethernet design. That was true historically. The illustration below shows that the variable costs of a switched ethernet deployment is now equal to PON. This change in pricing differences was driven by the fact that all Data Center deployments use Switched Ethernet architectures and the enormous growth of Data Centers over the past 20 years has driven down the cost of Ethernet electronics.
Fairhaven Broadband Master Plan – Prepared by EntryPoint Networks Page | 19 Page | 19
Broadband Master Plan
Sep
tem
ber
202
0
Project Partners Middle Mile “Middle-mile” is an industry term that describes the network infrastructure that connects local networks to service providers at an Internet Exchange Point. The “last mile” is the local part of a communication network which connects a service provider to a customer. Current Middle Mile options include Comcast (Current provider), Open Cape (10 Gig) and IDS (10 Gig). Approximately 2,500 customers can be served by a 10 Gbps circuit. If the Town pursues a Town owned network, it will need to adjust Middle Mile capacity according to take rate and utilization. Peak usage is an important data point for monitoring and is used to inform capacity planning. The cost of the middle mile connection should be allocated on a per subscriber basis.
Internet Service Providers (ISP) Partners An Internet Service Provider gives subscribers access to the internet. The Town will need to determine what model it will follow or support before it engages one or more Internet Service providers. If the Town selects and Open Access Model, there are a number of ISP’s that have expressed a verbal interest in being service providers to Fairhaven subscribers. The participation of these ISP’s could be formalized through an MOU process.
Cost Analysis & Phasing High Level Network Design
A high-level network design was done for a residential pilot neighborhood to build a cost model for that project. The Biarri Networks Fiber Optic Network Design Tool was used to create the design and calculate materials costs for these designs. The main cost categories for deploying and operating broadband networks are separated to optimize the costs in each of the following categories:
Infrastructure Capital Costs (Financed over 20 years)
Network Maintenance & Operations
Services
Infrastructure Capital Costs
The cost modeling that follows assumes that the infrastructure that was deployed to connect Town Assets in 2018 has sufficient fiber count so that it can be leveraged as a Fiber to the Premise backbone.
Monthly Infrastructure Cost
The first illustration of Infrastructure Capital Costs per premise assumes a 60% take-rate and a project that is 100% underground. The data in the line items in this model come from a combination of the Biarri Network Design tool, actual bids for materials, and network buildout experience.
Fairhaven Broadband Master Plan – Prepared by EntryPoint Networks Page | 20 Page | 20
Broadband Master Plan
Sep
tem
ber
202
0
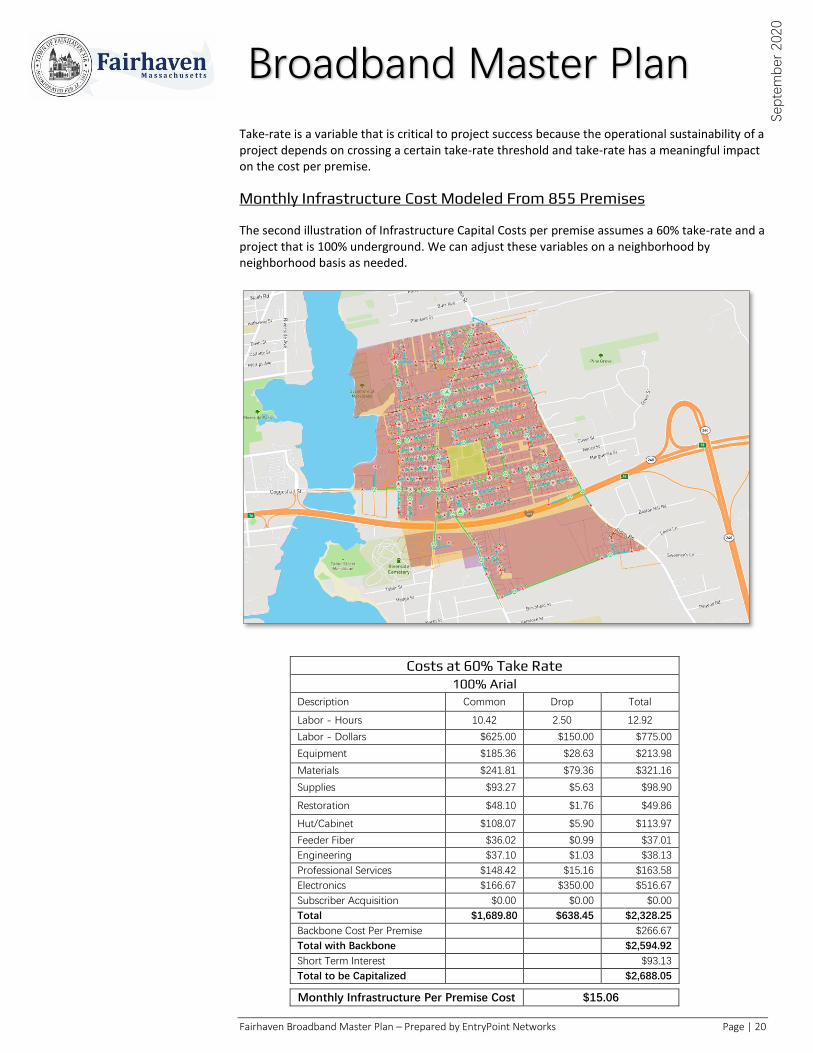
Take-rate is a variable that is critical to project success because the operational sustainability of a project depends on crossing a certain take-rate threshold and take-rate has a meaningful impact on the cost per premise.
Monthly Infrastructure Cost Modeled From 855 Premises
The second illustration of Infrastructure Capital Costs per premise assumes a 60% take-rate and a project that is 100% underground. We can adjust these variables on a neighborhood by neighborhood basis as needed.
Costs at 60% Take Rate 100% Arial
Description Common Drop Total
Labor - Hours 10.42 2.50 12.92
Labor - Dollars $625.00 $150.00 $775.00
Equipment $185.36 $28.63 $213.98
Materials $241.81 $79.36 $321.16
Supplies $93.27 $5.63 $98.90
Restoration $48.10 $1.76 $49.86
Hut/Cabinet $108.07 $5.90 $113.97
Feeder Fiber $36.02 $0.99 $37.01
Engineering $37.10 $1.03 $38.13
Professional Services $148.42 $15.16 $163.58
Electronics $166.67 $350.00 $516.67
Subscriber Acquisition $0.00 $0.00 $0.00
Total $1,689.80 $638.45 $2,328.25
Backbone Cost Per Premise $266.67
Total with Backbone $2,594.92
Short Term Interest $93.13
Total to be Capitalized $2,688.05
Monthly Infrastructure Per Premise Cost $15.06
Fairhaven Broadband Master Plan – Prepared by EntryPoint Networks Page | 21 Page | 21
Broadband Master Plan
Sep
tem
ber
202
0
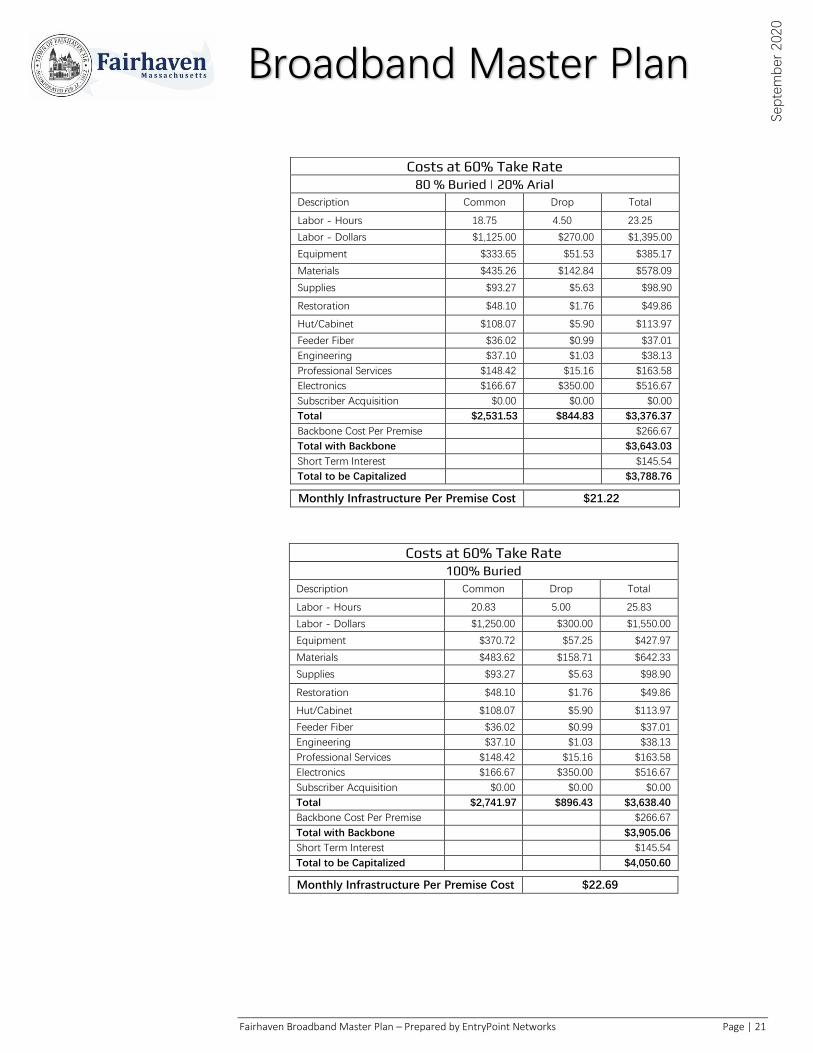
Monthly Infrastructure Per Premise Cost $22.69
Costs at 60% Take Rate 100% Buried
Description Common Drop Total
Labor - Hours 20.83 5.00 25.83
Labor - Dollars $1,250.00 $300.00 $1,550.00
Equipment $370.72 $57.25 $427.97
Materials $483.62 $158.71 $642.33
Supplies $93.27 $5.63 $98.90
Restoration $48.10 $1.76 $49.86
Hut/Cabinet $108.07 $5.90 $113.97
Feeder Fiber $36.02 $0.99 $37.01
Engineering $37.10 $1.03 $38.13
Professional Services $148.42 $15.16 $163.58
Electronics $166.67 $350.00 $516.67
Subscriber Acquisition $0.00 $0.00 $0.00
Total $2,741.97 $896.43 $3,638.40
Backbone Cost Per Premise $266.67
Total with Backbone $3,905.06
Short Term Interest $145.54
Total to be Capitalized $4,050.60
Costs at 60% Take Rate 80 % Buried | 20% Arial
Description Common Drop Total
Labor - Hours 18.75 4.50 23.25
Labor - Dollars $1,125.00 $270.00 $1,395.00
Equipment $333.65 $51.53 $385.17
Materials $435.26 $142.84 $578.09
Supplies $93.27 $5.63 $98.90
Restoration $48.10 $1.76 $49.86
Hut/Cabinet $108.07 $5.90 $113.97
Feeder Fiber $36.02 $0.99 $37.01
Engineering $37.10 $1.03 $38.13
Professional Services $148.42 $15.16 $163.58
Electronics $166.67 $350.00 $516.67
Subscriber Acquisition $0.00 $0.00 $0.00
Total $2,531.53 $844.83 $3,376.37
Backbone Cost Per Premise $266.67
Total with Backbone $3,643.03
Short Term Interest $145.54
Total to be Capitalized $3,788.76
Monthly Infrastructure Per Premise Cost $21.22
Fairhaven Broadband Master Plan – Prepared by EntryPoint Networks Page | 22 Page | 22
Broadband Master Plan
Sep
tem
ber
202
0
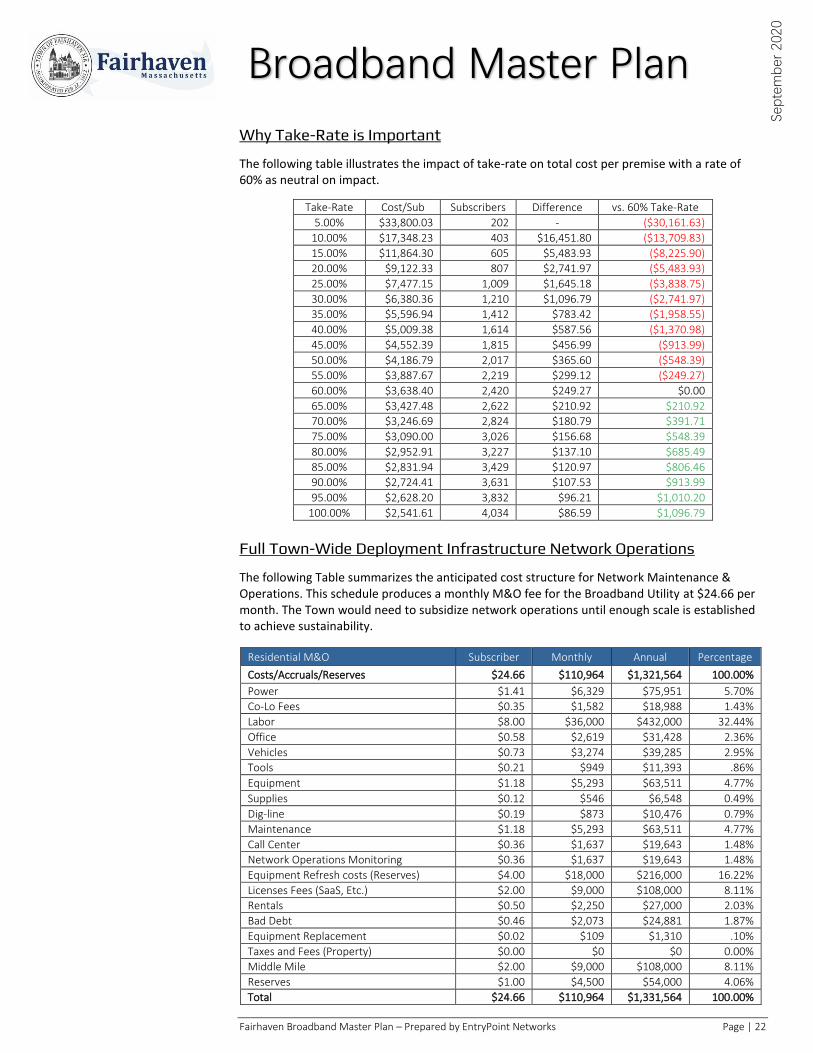
Why Take-Rate is Important
The following table illustrates the impact of take-rate on total cost per premise with a rate of 60% as neutral on impact.
Take-Rate Cost/Sub Subscribers Difference vs. 60% Take-Rate
5.00% $33,800.03 202 - ($30,161.63)
10.00% $17,348.23 403 $16,451.80 ($13,709.83)
15.00% $11,864.30 605 $5,483.93 ($8,225.90)
20.00% $9,122.33 807 $2,741.97 ($5,483.93)
25.00% $7,477.15 1,009 $1,645.18 ($3,838.75)
30.00% $6,380.36 1,210 $1,096.79 ($2,741.97)
35.00% $5,596.94 1,412 $783.42 ($1,958.55)
40.00% $5,009.38 1,614 $587.56 ($1,370.98)
45.00% $4,552.39 1,815 $456.99 ($913.99)
50.00% $4,186.79 2,017 $365.60 ($548.39)
55.00% $3,887.67 2,219 $299.12 ($249.27)
60.00% $3,638.40 2,420 $249.27 $0.00
65.00% $3,427.48 2,622 $210.92 $210.92
70.00% $3,246.69 2,824 $180.79 $391.71
75.00% $3,090.00 3,026 $156.68 $548.39
80.00% $2,952.91 3,227 $137.10 $685.49
85.00% $2,831.94 3,429 $120.97 $806.46
90.00% $2,724.41 3,631 $107.53 $913.99
95.00% $2,628.20 3,832 $96.21 $1,010.20
100.00% $2,541.61 4,034 $86.59 $1,096.79
Full Town-Wide Deployment Infrastructure Network Operations
The following Table summarizes the anticipated cost structure for Network Maintenance & Operations. This schedule produces a monthly M&O fee for the Broadband Utility at $24.66 per month. The Town would need to subsidize network operations until enough scale is established to achieve sustainability.
Residential M&O Subscriber Monthly Annual Percentage
Costs/Accruals/Reserves $24.66 $110,964 $1,321,564 100.00%
Power $1.41 $6,329 $75,951 5.70%
Co-Lo Fees $0.35 $1,582 $18,988 1.43%
Labor $8.00 $36,000 $432,000 32.44%
Office $0.58 $2,619 $31,428 2.36%
Vehicles $0.73 $3,274 $39,285 2.95%
Tools $0.21 $949 $11,393 .86%
Equipment $1.18 $5,293 $63,511 4.77%
Supplies $0.12 $546 $6,548 0.49%
Dig-line $0.19 $873 $10,476 0.79%
Maintenance $1.18 $5,293 $63,511 4.77%
Call Center $0.36 $1,637 $19,643 1.48%
Network Operations Monitoring $0.36 $1,637 $19,643 1.48%
Equipment Refresh costs (Reserves) $4.00 $18,000 $216,000 16.22%
Licenses Fees (SaaS, Etc.) $2.00 $9,000 $108,000 8.11%
Rentals $0.50 $2,250 $27,000 2.03%
Bad Debt $0.46 $2,073 $24,881 1.87%
Equipment Replacement $0.02 $109 $1,310 .10%
Taxes and Fees (Property) $0.00 $0 $0 0.00%
Middle Mile $2.00 $9,000 $108,000 8.11%
Reserves $1.00 $4,500 $54,000 4.06%
Total $24.66 $110,964 $1,331,564 100.00%
Fairhaven Broadband Master Plan – Prepared by EntryPoint Networks Page | 23 Page | 23
Broadband Master Plan
Sep
tem
ber
202
0
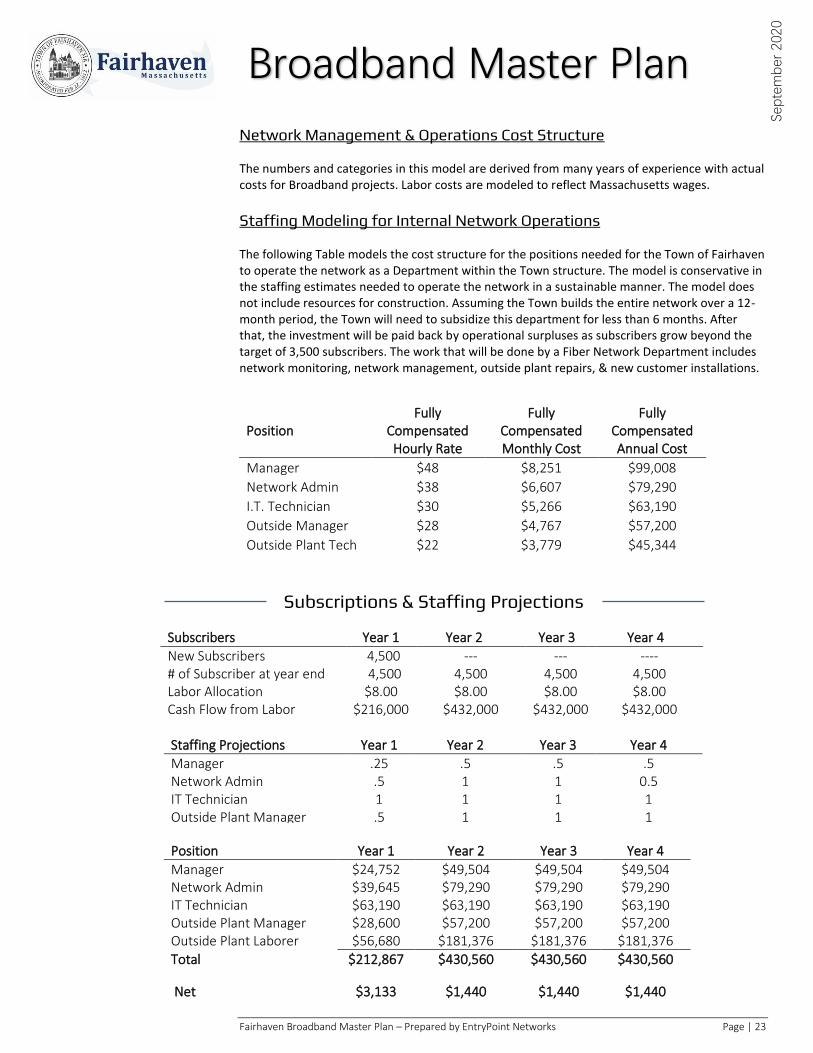
Network Management & Operations Cost Structure The numbers and categories in this model are derived from many years of experience with actual costs for Broadband projects. Labor costs are modeled to reflect Massachusetts wages.
Staffing Modeling for Internal Network Operations The following Table models the cost structure for the positions needed for the Town of Fairhaven to operate the network as a Department within the Town structure. The model is conservative in the staffing estimates needed to operate the network in a sustainable manner. The model does not include resources for construction. Assuming the Town builds the entire network over a 12-month period, the Town will need to subsidize this department for less than 6 months. After that, the investment will be paid back by operational surpluses as subscribers grow beyond the target of 3,500 subscribers. The work that will be done by a Fiber Network Department includes network monitoring, network management, outside plant repairs, & new customer installations.
Position Fully
Compensated Hourly Rate
Fully Compensated Monthly Cost
Fully Compensated Annual Cost
Manager $48 $8,251 $99,008
Network Admin $38 $6,607 $79,290
I.T. Technician $30 $5,266 $63,190
Outside Manager $28 $4,767 $57,200
Outside Plant Tech $22 $3,779 $45,344
Subscriptions & Staffing Projections
Subscribers Year 1 Year 2 Year 3 Year 4
New Subscribers 4,500 --- --- ---- # of Subscriber at year end 4,500 4,500 4,500 4,500 Labor Allocation $8.00 $8.00 $8.00 $8.00 Cash Flow from Labor $216,000 $432,000 $432,000 $432,000
Staffing Projections Year 1 Year 2 Year 3 Year 4
Manager .25 .5 .5 .5 Network Admin .5 1 1 0.5 IT Technician 1 1 1 1 Outside Plant Manager .5 1 1 1 Outside Plant Laborer 1.25 4 4 4
Position Year 1 Year 2 Year 3 Year 4
Manager $24,752 $49,504 $49,504 $49,504 Network Admin $39,645 $79,290 $79,290 $79,290 IT Technician $63,190 $63,190 $63,190 $63,190 Outside Plant Manager $28,600 $57,200 $57,200 $57,200 Outside Plant Laborer $56,680 $181,376 $181,376 $181,376
Total $212,867 $430,560 $430,560 $430,560
Net $3,133 $1,440 $1,440 $1,440
Fairhaven Broadband Master Plan – Prepared by EntryPoint Networks Page | 24 Page | 24
Broadband Master Plan
Sep
tem
ber
202
0
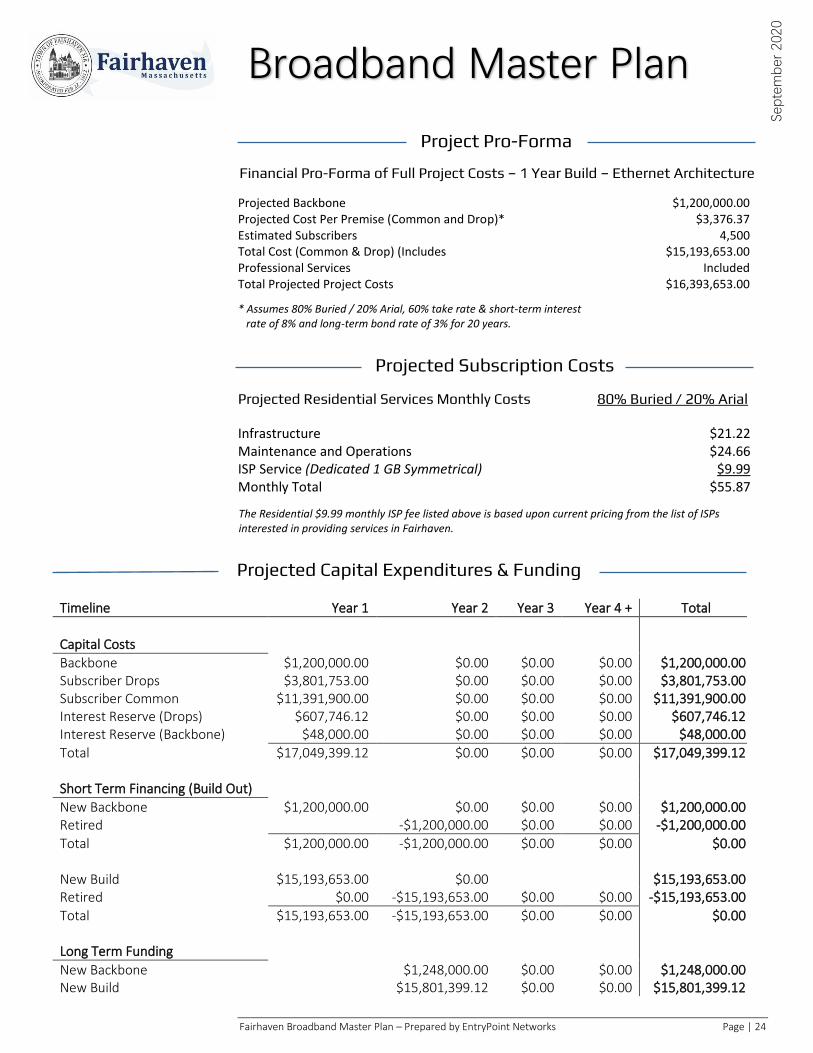
Financial Pro-Forma of Full Project Costs – 1 Year Build – Ethernet Architecture
Projected Residential Services Monthly Costs 80% Buried / 20% Arial
Infrastructure $21.22 Maintenance and Operations $24.66 ISP Service (Dedicated 1 GB Symmetrical) $9.99 Monthly Total $55.87
Projected Backbone $1,200,000.00 Projected Cost Per Premise (Common and Drop)* $3,376.37 Estimated Subscribers 4,500 Total Cost (Common & Drop) (Includes $15,193,653.00 Professional Services Included Total Projected Project Costs $16,393,653.00 * Assumes 80% Buried / 20% Arial, 60% take rate & short-term interest rate of 8% and long-term bond rate of 3% for 20 years.
The Residential $9.99 monthly ISP fee listed above is based upon current pricing from the list of ISPs interested in providing services in Fairhaven.
Projected Capital Expenditures & Funding
Projected Subscription Costs
Project Pro-Forma
Timeline Year 1 Year 2 Year 3 Year 4 + Total
Capital Costs
Backbone $1,200,000.00 $0.00 $0.00 $0.00 $1,200,000.00 Subscriber Drops $3,801,753.00 $0.00 $0.00 $0.00 $3,801,753.00 Subscriber Common $11,391,900.00 $0.00 $0.00 $0.00 $11,391,900.00 Interest Reserve (Drops) $607,746.12 $0.00 $0.00 $0.00 $607,746.12 Interest Reserve (Backbone) $48,000.00 $0.00 $0.00 $0.00 $48,000.00
Total $17,049,399.12 $0.00 $0.00 $0.00 $17,049,399.12
Short Term Financing (Build Out)
New Backbone $1,200,000.00 $0.00 $0.00 $0.00 $1,200,000.00 Retired -$1,200,000.00 $0.00 $0.00 -$1,200,000.00
Total $1,200,000.00 -$1,200,000.00 $0.00 $0.00 $0.00
New Build $15,193,653.00 $0.00 $15,193,653.00 Retired $0.00 -$15,193,653.00 $0.00 $0.00 -$15,193,653.00
Total $15,193,653.00 -$15,193,653.00 $0.00 $0.00 $0.00
Long Term Funding
New Backbone $1,248,000.00 $0.00 $0.00 $1,248,000.00 New Build $15,801,399.12 $0.00 $0.00 $15,801,399.12
Fairhaven Broadband Master Plan – Prepared by EntryPoint Networks Page | 25 Page | 25
Broadband Master Plan
Sep
tem
ber
202
0
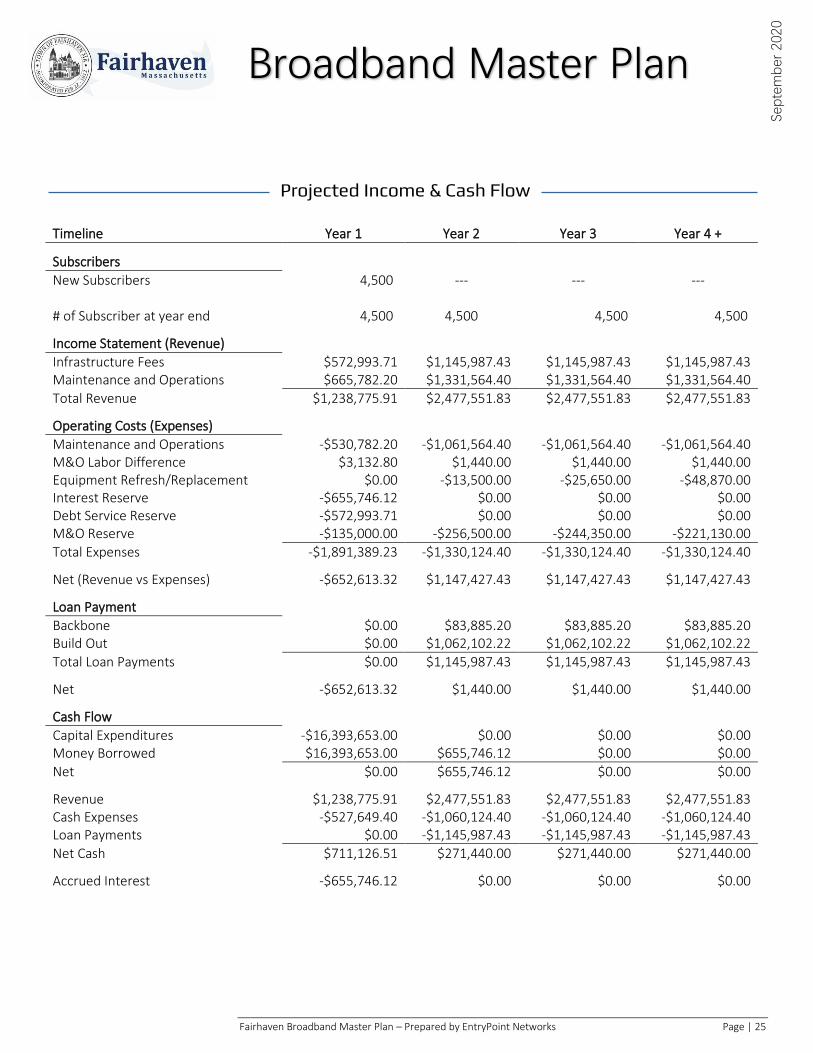
Projected Income & Cash Flow
Timeline Year 1 Year 2 Year 3 Year 4 +
Subscribers New Subscribers 4,500 --- --- ---
# of Subscriber at year end 4,500
4,500 4,500 4,500
Income Statement (Revenue) Infrastructure Fees $572,993.71 $1,145,987.43 $1,145,987.43 $1,145,987.43 Maintenance and Operations $665,782.20 $1,331,564.40 $1,331,564.40 $1,331,564.40
Total Revenue $1,238,775.91 $2,477,551.83 $2,477,551.83 $2,477,551.83
Operating Costs (Expenses) Maintenance and Operations -$530,782.20 -$1,061,564.40 -$1,061,564.40 -$1,061,564.40 M&O Labor Difference $3,132.80 $1,440.00 $1,440.00 $1,440.00 Equipment Refresh/Replacement $0.00 -$13,500.00 -$25,650.00 -$48,870.00 Interest Reserve -$655,746.12 $0.00 $0.00 $0.00 Debt Service Reserve -$572,993.71 $0.00 $0.00 $0.00 M&O Reserve -$135,000.00 -$256,500.00 -$244,350.00 -$221,130.00
Total Expenses -$1,891,389.23 -$1,330,124.40 -$1,330,124.40 -$1,330,124.40
Net (Revenue vs Expenses) -$652,613.32 $1,147,427.43 $1,147,427.43 $1,147,427.43
Loan Payment Backbone $0.00 $83,885.20 $83,885.20 $83,885.20 Build Out $0.00 $1,062,102.22 $1,062,102.22 $1,062,102.22
Total Loan Payments $0.00 $1,145,987.43 $1,145,987.43 $1,145,987.43
Net -$652,613.32 $1,440.00 $1,440.00 $1,440.00
Cash Flow Capital Expenditures -$16,393,653.00 $0.00 $0.00 $0.00 Money Borrowed $16,393,653.00 $655,746.12 $0.00 $0.00
Net $0.00 $655,746.12 $0.00 $0.00
Revenue $1,238,775.91 $2,477,551.83 $2,477,551.83 $2,477,551.83 Cash Expenses -$527,649.40 -$1,060,124.40 -$1,060,124.40 -$1,060,124.40 Loan Payments $0.00 -$1,145,987.43 -$1,145,987.43 -$1,145,987.43
Net Cash $711,126.51 $271,440.00 $271,440.00 $271,440.00
Accrued Interest -$655,746.12 $0.00 $0.00 $0.00
Unrestricted Cash -$652,613.32 $670,686.12 $27,090.00 $50,310.00
Reserves Interest Reserve $655,746.12 $0.00 $0.00 $0.00 Debt Service $572,993.71 $0.00 $0.00 $0.00 Maintenance and Operations $135,000.00 $256,500.00 $244,350.00 $221,130.00
Total Reserve $1,363,739.83 $256,500.00 $244,350.00 $221,130.00
Total Cash $711,126.51 $927,186.12 $271,440.00 $271,440.00
Fairhaven Broadband Master Plan – Prepared by EntryPoint Networks Page | 26 Page | 26
Broadband Master Plan
Sep
tem
ber
202
0
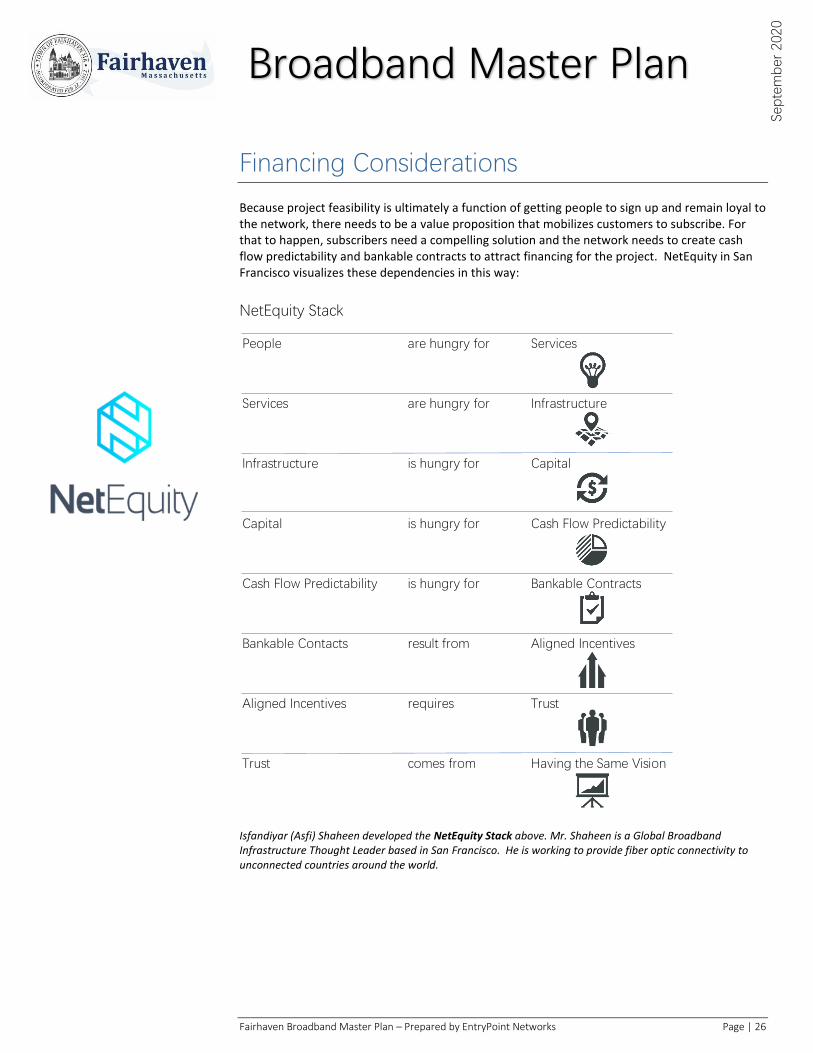
Financing Considerations Because project feasibility is ultimately a function of getting people to sign up and remain loyal to the network, there needs to be a value proposition that mobilizes customers to subscribe. For that to happen, subscribers need a compelling solution and the network needs to create cash flow predictability and bankable contracts to attract financing for the project. NetEquity in San Francisco visualizes these dependencies in this way:
NetEquity Stack
Isfandiyar (Asfi) Shaheen developed the NetEquity Stack above. Mr. Shaheen is a Global Broadband Infrastructure Thought Leader based in San Francisco. He is working to provide fiber optic connectivity to unconnected countries around the world.
People are hungry for Services
Services are hungry for Infrastructure
Infrastructure is hungry for Capital
Capital is hungry for Cash Flow Predictability
Cash Flow Predictability is hungry for Bankable Contracts
Bankable Contacts result from Aligned Incentives
Aligned Incentives requires Trust
Trust comes from Having the Same Vision
Fairhaven Broadband Master Plan – Prepared by EntryPoint Networks Page | 27 Page | 27
Broadband Master Plan
Sep
tem
ber
202
0
Risk Analysis The following is an analysis of the main risk factors facing the Town of Fairhaven as it pursues its
fiber-to-the-premise deployment. Nine Risk Factors are analyzed:
1. Subscriber Churn Risk 2. Take-Rate Risk 3. Project Execution Risk 4. Equipment and Technology Risk 5. Community Engagement Risk 6. Cost Modeling Risk 7. Timeline Risk 8. Regulatory Risk 9. Middle Mile Risk
Subscriber Churn Subscriber Churn is the risk that customers sign up and then do not remain subscribers to the network. Likelihood: Today customers are primarily driven by cost, speed, and customer service. Churn is possible and is a consequence of the customers pursuing an option to get better value from an alternative solution. The likelihood of churn is high if a new market solution simply replicates the incumbent model. The likelihood of churn goes down under a Business Model where 1) the customer is financially responsible for the drop to their property and 2) where the value proposition is strong enough to make the customer voluntarily committed to the network. Impact: The impact of churn on the network is potentially catastrophic if it reaches a level where the capital and operational cost of the abandoned infrastructure cannot reasonably be shared by remaining subscribers. Mitigation: Churn can be mitigated by implementing a business model that makes customers voluntarily committed to the network and by assigning financial responsibility to customers for their lateral connection.
Take-Rate Risk Take-rate risk is the risk that the Town builds out the network and ends up with a take-rate that is lower than expected. Likelihood: Take-rate risk is possible and is a function of the value proposition of the network and how well that value proposition gets communicated and managed before construction starts. High take-rates lead to lower network costs for subscribers. This creates a virtuous cycle where lower costs lead to higher take rates. The reverse is also true. Impact: The worst-case scenario is one where lower take rates lead to higher costs and churn which create a death spiral that negatively compounds until the network is not sustainable. Mitigation: Manage demand aggregation before construction begins and give consumers a value proposition that makes them voluntarily committed to the network infrastructure.
9 Risk Factors >
Likelihood Impact Mitigation
Fairhaven Broadband Master Plan – Prepared by EntryPoint Networks Page | 28 Page | 28
Broadband Master Plan
Sep
tem
ber
202
0
Project Execution Risk Project Execution includes strategy, planning, project management and fulfillment of the project plan and operational execution. Likelihood: Project execution failure is possible and is a function of the effectiveness of project planning, management, controls, and execution. Impact: The severity of impact is in proportion to the effectiveness of project management and execution. A worst-case scenario is one where project execution affects the value proposition, which in turn affects take-rate and churn. Mitigation: Hire or partner with skilled project managers and key strategic partners. Create alignment among key team members on the project plan and operational plan. Develop project controls that are monitored and reported to senior leadership monthly.
Equipment & Technology Risk Equipment & Technology Risk includes both software and hardware solutions and is the risk that equipment failure rates are higher than expected, major software bugs are unresolved, operational reliability is lower than expected, and/or that the technology lifecycle leads to faster obsolescence than is expected. Likelihood: Solutions with short deployment histories, unreliable references, unclear quality control and test procedures, weak professional teams, and poorly architected scalability abstractions present increased equipment and technology risk. Impact: The impact of this risk category is moderate because it is possible to vet both software and hardware systems to assess this risk. The base technology of the network will be fiber optic cable and that has sufficient history to present a minor risk to the project. Remaining risks include electronics and software systems. Mitigation: Implement thorough due diligence processes with trained professionals to scrutinize references, architecture, software abstractions, quality control systems and the professional histories of vendors being considered.
Community Engagement Community Engagement is the marketing, education and communication processes and strategies used to inform residents and businesses about the value proposition offered by the network. Likelihood: Community Engagement risk is possible but nonetheless a risk that can be managed and monitored. Poor planning, management and execution increases the level of risk. Community engagement can be handled by internal Town staff, but risk increases if staff member resources are inadequate for a project of this size. There is an abundant supply of marketing professionals available to assist with community engagement processes. Impact: Community engagement is a key driver of project success due to the relationship between community engagement and take-rate. Mitigation: Leverage the skills of competent marketing professionals and provide sufficient resources to make it easy for every resident to learn the basic value proposition for the network
Fairhaven Broadband Master Plan – Prepared by EntryPoint Networks Page | 29 Page | 29
Broadband Master Plan
Sep
tem
ber
202
0
in comparison to alternatives through a variety of marketing, education and communication strategies.
Cost Modeling Risk Cost Modeling Risk is the risk that cost modeling significantly underestimates actual design, construction, and/or operational costs. Likelihood: There is enough industry data to reasonably validate cost estimates. Impact: Cost overruns can have a moderate to disastrous impact on network sustainability. Mitigation: Validate financial assumptions against industry assumptions, market conditions, and account for local economic variables. The clearest way to mitigate this risk is to conduct an RFP process for network engineering and construction.
Timeline Risk EntryPoint consulted with Comm-Tract, the construction firm that built the fiber network connecting Town assets. They indicated that they believe a Town-wide network can be constructed in less than 10 months. The benefits of building the network in an accelerated pace (less than 1 year) include the following:
1) Each phase requires legal, financing and accounting transaction costs. Building the network with fewer phases will lower the overall transaction costs for the project.
2) Building at a faster pace will result in an accelerated period to breakeven.
3) Interest Rates are at an unprecedented low currently and building over an extended period may expose later project years to some interest rate risk.
Likelihood: Costs are certain to be higher for an extended buildout period. However, there may be execution risks for accelerating the buildout, depending on the experience and capacity of the construction partner, and these trade-offs need to be weighed by Town leaders. Impact: Costs will be incrementally higher for an extended build-out schedule and M&O will have a longer ramp to sustainability. Mitigation: The Town can control the buildout schedule following a cost / benefit analysis of the options. An important consideration is alignment with construction partners. If the Town is going to outsource construction, it should consult with potential construction partners about the alternative construction schedules to make sure that the Town’s strategy is amenable to key construction partners.
Regulatory Risk Regulatory Risk is the risk that State or Federal regulations become an impediment or barrier to the Town successfully building or operating a municipal network. Legal counsel has provided a memo to the Town addressing legal authority under Massachusetts State Law. Likelihood: Historically, incumbent operators have taken legal action to stop a municipality from building a competing network. Impact: If a claim were to be brought against Fairhaven, the likely process is that it could take an extensive amount of time and some cost to contest the claim.
Fairhaven Broadband Master Plan – Prepared by EntryPoint Networks Page | 30 Page | 30
Broadband Master Plan
Sep
tem
ber
202
0
Mitigation: According to outside counsel Massachusetts State Law provides explicit authority for the Town to own and operate a fiber network under multiple legal avenues.
Middle Mile Risks Middle Mile risks include the following:
1) Lack of redundant options on divergent paths, 2) Pricing risk, and 3) The risk of being stranded or isolated without a viable path to an internet exchange
point. Likelihood: The closest internet exchange points are in Boston and Providence. Fairhaven does have divergent middle mile path options to Boston via middle-mile providers already identified. The risk of getting isolated or cut off from internet access is possible but has a low likelihood of occurring. Impact: The most likely risk is pricing risk due to the fact that Middle Mile costs in Massachusetts are incrementally higher than other markets in the Country. But this is not a significant barrier to moving forward. The impact of this risk might represent a monthly cost increase to subscribers of $1.00 - $2.00. Mitigation: The way the Town can mitigate and possibly eliminate Middle Mile Risk is by working with multiple Middle Mile carriers establishing connections into Boston and Providence.