Embed Size (px)
Citation preview

INTERIM RESULTS
PRESENTATIONFOR THE SIX-MONTH PERIOD ENDED 30 JUNE 2017

2
DISCLAIMER
Certain statements in this document may
constitute ’forward looking statements’.
Such forward looking statements reflect
the company’s beliefs and expectations
and involve known and unknown risks,
uncertainties and other important factors
that could cause the actual results,
performance or achievements of Sun
International Limited and its subsidiaries
to be materially different from the future
results, performance or achievements
expressed or implied by such forward
looking statements. Sun International
Limited undertakes no obligation to
update publicly or release any revisions to
these forward looking statements to
reflect events or circumstances after the
date of this document, or to reflect the
occurrence of anticipated events. Past
performance of Sun International Limited
cannot be relied on as a guide to future
performance. Forward-looking
statements speak only as at the date of this
document. You are cautioned not to place
any undue reliance on such forward looking
statements. No statement in this document
is intended to be a profit forecast.
This document is being supplied to you for
informational purposes only. This document
is not a prospectus or an offer or invitation
or inducement to subscribe for or purchase
any securities, and nothing contained herein
shall form the basis of any contract or
commitment whatsoever. This document
does not constitute a recommendation
regarding the securities of Sun International
Limited.
No representation or warranty, express
or implied, is given by Sun International
Limited, its subsidiaries or any of their
respective directors, officers,
employees and affiliates or any other
person as to the
fairness, accuracy or completeness of the
information (including data obtained from
external sources) or opinions contained in
this document, nor have they independently
verified such information, and any reliance
you place thereon will be at your sole risk.
Without prejudice to the foregoing, no
liability whatsoever for any loss howsoever
arising, directly or indirectly, from any use of
information contained in this document, or
otherwise arising in connection therewith is
accepted by any such person in relation to
such information. None of the data in this
document has been reviewed or reported
on by the group’s auditors and no guarantee
or warranty as to the data’s accuracy,
expressed or implied, is given.
3
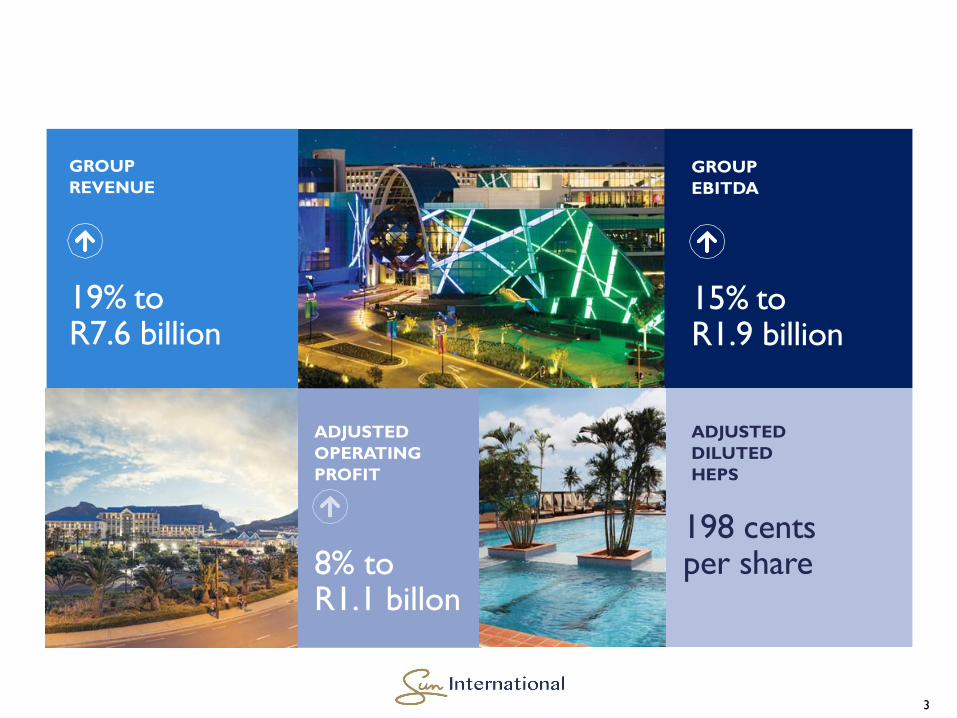
GROUP
REVENUE
19% toR7.6 billion
GROUP
EBITDA
15% toR1.9 billion
ADJUSTED
DILUTED
HEPS
198 cents per share
ADJUSTED
OPERATING
PROFIT
8% to R1.1 billon

OPERATIONAL REVIEW
4
South Africa
Difficult trading conditions due to
the macro-economic and political
environment
Latam
In Chile , with the exception of
Iquique and Monticello, trading has
improved
Consumers’ disposable income
impacted. Less to spend on
entertainment and gaming
Iquique affected by strike action in
the mining industry
As a consequence, we have
experienced disappointing growth
in gaming revenue. Hospitality has
shown pleasing growth in revenue
Monticello continues to be
impacted due to the relocation of
the toll road
Significant investments over the
past few years, resulting in an
increase in gearing levels
Panama and Colombia continue to
struggle
Despite these challenges, the group remains cash generative with its
Sun City, Sibaya and Table Bay operations showing good growth

STRATEGIC FOCUS

STRATEGIC FOCUS
6
Improve existing
operations
and guest
experience
• “Back to Basics”
- Focus on discipline and standard operating procedures
- Driving operational efficiencies throughout the organisation
- Integration of key systems
• Set standards and agree guest proposition
• Improve service levels
• Focus on repairs and maintenance as opposed to asset replacement
• Drive margins across the group
• Improve food and beverage margins

STRATEGIC FOCUS | CONTINUED
7
Protect and
leverage existing
asset portfolio
• South Africa
- Opening of the Time Square arena in November
2017 and the hotel in March 2018
- Grow Time Square share of Gauteng market
- Continue driving the conferencing, leisure and
Vacation Club business at Sun City subsequent
to the significant refurbishment
- Renew Table Bay lease – Expires in 2023
- Renew Wild Coast licence – Expires 31 October
2019
- Closure of Fish River on 30 November 2017
- Improve performance of Carousel post
Time Square
- Address impact of EBTs on Boardwalk
• Nigeria
- Exit Nigerian operations
• Latam
- Acquired 50% of EDS equity interest in Sun
Dreams – implementation subject to outstanding
regulatory approvals
- Leveraging the recent investments made at
Monticello, including a new smoking deck and a
4 000 seat arena
- Bid process for Municipal licence commenced -
Outcome anticipated in Q1 2018
Sun Dreams intends submitting bids for a
number of licences
Legal objections to process have been
initiated
- Address losses from Panama and Colombia
Exploring options to sell 65th and 66th floor
of Trump Towers and focus on 3rd floor
casino
In discussions with landlord regarding lease.
Close to reaching break even prior to lease
cost

STRATEGIC FOCUS | CONTINUED
8
Grow our
business into
new areas and
products
• Capitalise on land development opportunities at:
- Boardwalk - Retail redevelopment and expansion. Contribute land and existing retail for equity
- Carnival City - Large mixed use land development opportunity. Contribute land for equity
- Sibaya - Residential opportunity on unused land. Contribute land for equity
- Other properties under consideration
• Replace Sun Bet software to take advantage of opportunities in the online space
• Acquisition of Thunderbird Resorts in Peru
- Comprises of 4 gambling operations generating EBITDA of US$4.2 million
- Purchase consideration is approximately US$27 million
- Includes premises valued in excess of US$11 million
STRATEGIC FOCUS | CONTINUED
9
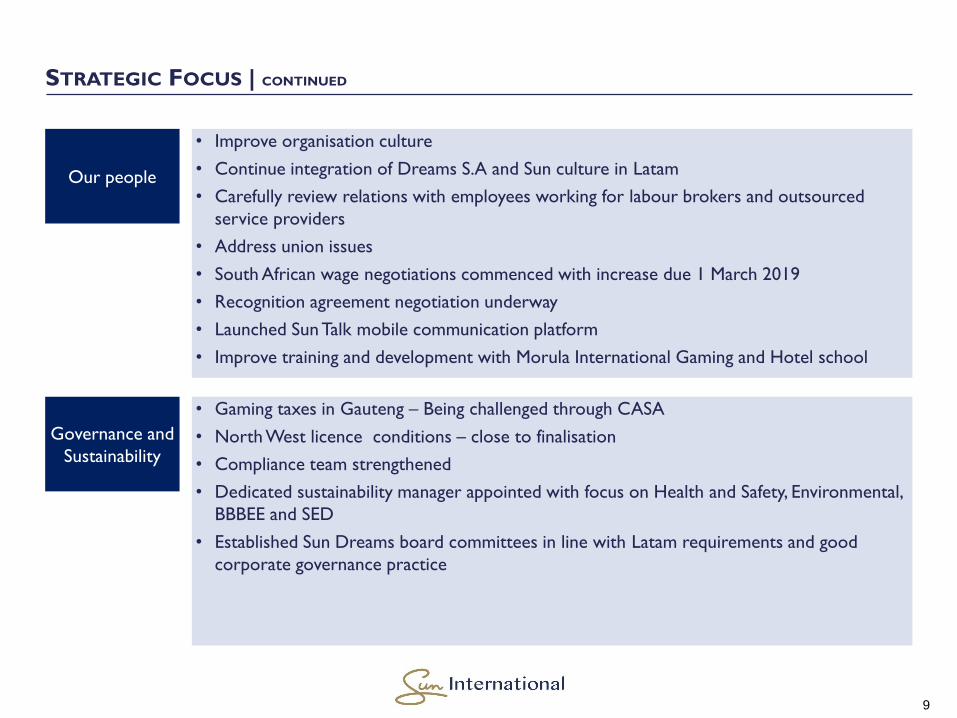
Our people
• Improve organisation culture
• Continue integration of Dreams S.A and Sun culture in Latam
• Carefully review relations with employees working for labour brokers and outsourced
service providers
• Address union issues
• South African wage negotiations commenced with increase due 1 March 2019
• Recognition agreement negotiation underway
• Launched Sun Talk mobile communication platform
• Improve training and development with Morula International Gaming and Hotel school
Governance and
Sustainability
• Gaming taxes in Gauteng – Being challenged through CASA
• North West licence conditions – close to finalisation
• Compliance team strengthened
• Dedicated sustainability manager appointed with focus on Health and Safety, Environmental,
BBBEE and SED
• Established Sun Dreams board committees in line with Latam requirements and good
corporate governance practice

UPDATE

UPDATE ONTIME SQUARE
11
Gauteng
gambling market
• Casino commenced operations on 1 April 2017
• Gauteng gambling market not growing
• Time Square captured 13.4% share of Gauteng's market, which is below expectation
Operations
• 2 000 slots and 60 tables
• 8 500 seater arena (opening November 2017)
• 238 key hotel ( opening Q1 2018)
Financial
performance
• Revenue : R276 million
• EBITDA : R72 million
Capital
investment
• R3.5 billion invested to date
• Outstanding for 2017: R615 million
• Outstanding for 2018 : R102 million
Key initiatives
• Opening of the arena and hotel
• Continue to focus on marketing
• Address issues around limited liquor licence hours and food and beverage margins
Outlook• Recent trading has reflected growth in activity and visitation and with the opening of the
arena and hotel, growth in revenue is anticipated

TIME SQUARE ARENA LINE-UP

FINANCIAL REVIEW

FINANCIAL OVERVIEW
R million
Unaudited
30 June
2017 %
Pro forma
30 June
2016
Revenue 7 560 19 6 349
EBITDA 1 894 15 1 647
Adjusted operating profit 1 147 8 1 064
Foreign exchange loss - 100 (17)
Net interest (483) (26) (382)
Profit before tax 664 (0) 665
Tax (232) (3) (225)
Profit after tax 432 (2) 440
Minorities (228) (40) (163)
Attributable profit 204 (26) 277
Discontinued operations and associates 2 (87) 15
Adjusted headline earnings 206 (29) 292
14
• Group revenue increased by
19% to R7.6 billion
• Growth attributable to the
inclusion of:
- Sun Slots from 1 April 2016
- Sun Dreams from 1 June 2016
- Time Square’s results since its
opening on 1 April 2017
• Revenue of South African
operations declined by 1%
on a comparable basis
• Group EBITDA increased by
15% from R1.6 billion to
R1.9 billion
• EBITDA generated by the
South African operations
declined by 9%, on a
comparable basis

ADJUSTMENT TO HEADLINE EARNINGS
15
• Impairment of R8 million attributed to goodwill in Grand Sports
• Time Square pre-opening expenses of R40 million
• IFRS 2 share based payment expense incurred with regards to the BEE preference share
transaction relating to Time Square of R8 million
• Interest of R22 million incurred up to the opening of the casino which related to the payment
made to Peermont
• Retrenchment costs of R15 million relating to the closure of the Morula operations
• The straight lining of The Maslow and Table Bay lease expense of R9 million
• Sale of the Botswana, Lesotho and Namibian assets recorded a profit of R27 million
• Amortisation of R73 million of the Dreams S.A. intangible assets raised as part of a purchase
price adjustment (PPA)
• The revaluation of the put options relating to the R162 million accounted for in profit and loss

SEGMENTAL REVIEW

SEGMENTAL REVIEW
South Africa Latam Nigeria Group
30 June
2017
30 June
2016
30 June
2017
30 June
2016
30 June
2017
30 June
2016
30 June
2017
30 June
2016R million
Revenue 5 152 5 108 2 339 2 620 69 99 7 560 7 827
EBITDA 1 304 1 360 591 701 (1) (3) 1 894 2 058
Adjusted operating profit 804 905 368 442 (13) (25) 1 159 1 322
PPA adjustment - - (10) (11) (2) (3) (12) (14)
Operating profit after PPA 804 905 358 431 (15) (28) 1 147 1 308
17
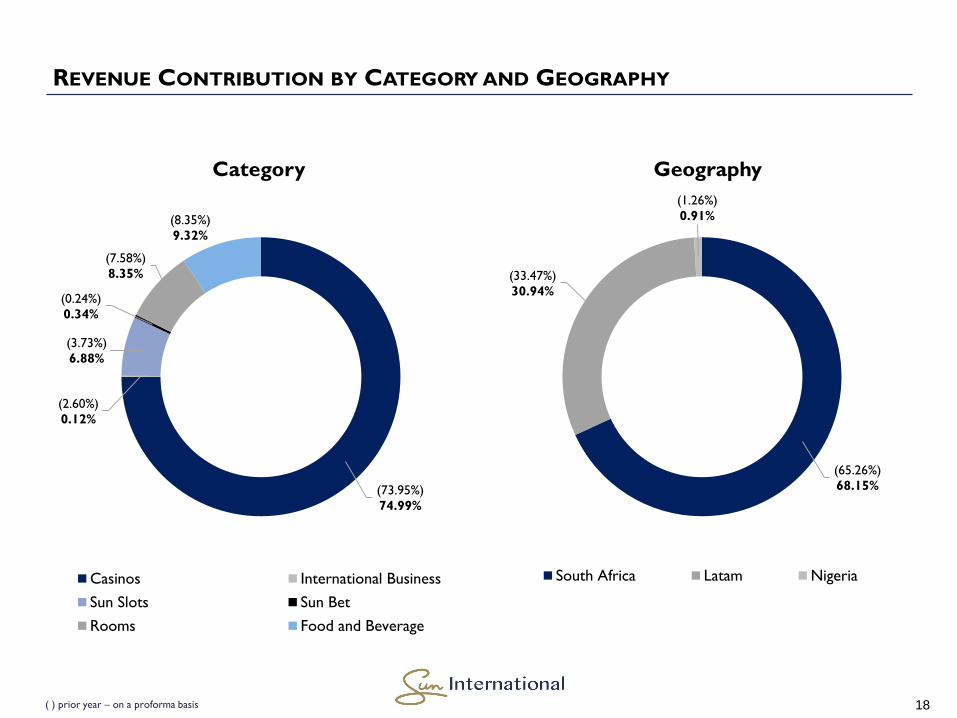
REVENUE CONTRIBUTION BY CATEGORY AND GEOGRAPHY
( ) prior year – on a proforma basis 18
(73.95%)
74.99%
(2.60%)
0.12%
(3.73%)
6.88%
(0.24%)
0.34%
(7.58%)
8.35%
(8.35%)
9.32%
Category
Casinos International Business
Sun Slots Sun Bet
Rooms Food and Beverage
(65.26%)
68.15%
(33.47%)
30.94%
(1.26%)
0.91%
Geography
South Africa Latam Nigeria

SOUTH AFRICA SEGMENTAL REVIEW
Revenue EBITDA Operating profit
30 June 2017 30 June 2016 30 June 2017 30 June 2016 30 June 2017 30 June 2016R million
GrandWest 1 031 1 049 391 426 316 363
Sun City 859 808 139 111 26 15
Sun City* (51) (72) (44) (61) (44) (61)
Sibaya 612 576 207 192 175 157
Carnival City 471 546 117 173 74 133
Boardwalk 276 296 34 61 (6) 18
Wild Coast Sun 231 229 38 46 13 18
Meropa 147 158 49 58 38 47
Windmill 123 141 36 48 25 38
Flamingo 84 88 22 27 15 21
Golden Valley 84 82 15 17 7 7
Carousal 130 157 19 29 5 14
Table Bay 175 167 45 38 37 30
The Maslow 71 69 (14) (11) (23) (23)
Naledi 10 12 (4) (2) (5) (2)
Fish River 12 11 (12) (11) (13) (12)
4 265 4 317 1 038 1 141 640 763
International Business 9 165 (15) 21 (15) 21
Sun Slots 504 237 114 55 70 35
Time Square 276 - 72 - 27 -
Morula 38 105 (4) 14 (5) 21
SunBet 25 15 1 (3) - (4)
Management companies 293 298 98 81 87 69
Intercompany management fees (258) (259) - - - -
5 152 4 878 1 304 1 309 804 905
* Vacation Club accounting adjustment
19

LATAM SEGMENTAL REVIEW
Revenue EBITDA Operating profit
30 June 2017 30 June 2016 30 Jun 2017 30 June 2016 30 June 2017 30 June 2016R million
Monticello 876 908 243 282 179 216
Dreams S.A. SCJ licences 785 750 303 290 286 273
Dreams S.A. municipal licences 417 417 158 156 135 136
Central office - - (77) (93) (132) (135)
Chile total 2 078 2 075 627 635 468 490
Panama (Ocean Sun) 119 124 (37) (6) (79) (47)
Colombia (Sun Nao) 15 23 (22) (19) (35) (30)
Peru 127 123 23 25 4 6
Total 2 339 2 345 591 636 358 419
Constant currency adjustment - 101 - 28 - 18
Dreams S.A. pre-acquisition adjustment - (1 071) - (323) - (250)
Consolidated 2 339 1 375 591 341 358 187
20

CAPITAL INVESTMENT

CAPEX
Capital expenditure incurred during the period
30 June 2017
Forecast
31 December
2017R million
ExpansionaryTime Square 1 083 615Meropa 38 44Sun City 10 27Latam 111 27
1 242 713RefurbishmentSun City 3 59GrandWest 9 20Carnival City 7 4Sibaya - 9Latam 22 31Other refurbishments 2 1
43 124Other ongoing asset replacement 232 200Total capital expenditure 1 517 1 037
22
Forecast project capital expenditure
Spend to dateForecast to 31 December
R million 2017 2018Time Square 3 508 615 102Sun City 397 86 -• Entertainment Centre 360 10 -• Other projects 37 26 -• Vacation Club Phase 2 - 50 -Monticello arena, smoking deck and bar 131 46 -Meropa Hotel 50 44 -Total 4 086 791 102

BORROWINGS AND CASH FLOW

BORROWINGS
Total debt Minorities
Attributable to
Sun
InternationalR million
South Africa
Operating subsidiaries* 3 127 913 2 214
Time Square 4 175 1 044 3 131
Management and corporate 4 085 - 4 085
11 387 1 957 9 430
Nigeria
Shareholder loans 786 398 388
Sun International inter-company debt
(276) (140) (136)
510 258 252
Latam
Sun Dreams 2 315 1 052 1 263
Sun Chile 843 - 843
3 158 1 052 2 106
30 June 2017 15 055 3 267 11 788
31 December 2016 14 517 3 134 11 383
30 June 2016 14 062 3 171 10 891
24
• Borrowings as at 30
June 2017 were R15.1
billion
- With R11.4 billion
attributable to the South
African balance sheet
• The increase in debt
mainly relates to
capital investment in
Time Square
• Balance sheet remains
resilient as operations
continue to generate
strong cash flow
* Excluding Time Square

COVENANTS
* 2.6x prior to netting of cash
25
Covenants South Africa Latam
Covenant Actual Covenant Actual
Debt to EBITDA 4.0x 3.9x 4.75x 1.4x *
Interest cover 2.5x 3.4x
Capital
allocation
• The group generates strong cash flow and is carefully managing capital allocation and
managing cash flow
Relaxation of
covenants
• Following negotiations with the group’s lenders during the review period, the debt covenant
levels were adjusted for June 2017 and December 2017 and the group continues to trade
within these levels
De-risking the
balance sheet• The group is considering several options in order to de-risk the balance sheet

SOUTH AFRICAN CASH FLOW
26
1.373
39
317
439
246410
1.161
132 (619) 136
776
11 278 288
Generated by
operations
Working capital
Tax paid
Interest paid
Capex Free cash
Project capex
Other investing activities
Cashflow prior to funding
and dividends
Dividendsto
minority shareholders
Borrowings Otherfinancingactivities
Beginning of period
Cash at end of period
R million

LATAM CASH FLOW
27
584
81
95
75
133
200
77 123
112
7314 13
774
713
Generated by
operations
Working capital
Tax paid
Interest paid
Capex Free cash
Project capex
Effect ofexchange
rates
Beginning of period
Cash at end of period
R million
Cashflow prior to funding
and dividends
Dividends Borrowings Otherfinancingactivities
SUPPLEMENTARY INFORMATION

GROUP STRUCTURE
Economic interest % Slots Tables Rooms
South AfricaGauteng Carnival City 91 1 568 47 105
Maslow 100 - - 281Time Square 75 2 000 60 -
Western Cape GrandWest 61 2 563 64 39Table Bay 61 - - 329Worcester 61 220 6 98Sunbet 100 - - -
Kwa-Zulu-Natal Sibaya 63 1 214 48 154Limpopo Meropa 68 417 17 80North West Sun City 100 645 51 1 310
Carousel 100 700 25 94Northern Cape Flamingo 71 300 10 -Eastern Cape Boardwalk 82 918 27 140
Fish River 82 - - 83Wild Coast Sun 70 518 19 396
Free State Windmill 70 403 18 -Naledi Sun 100 160 - 30
Management activities Sun International Management 100 - - -
29
Latam
Chile 55 4 830 227 533
Panama 55 607 52 -
Colombia 55 220 15 -
Peru 55 1 054 31 -
Other Africa
Nigeria 49 106 10 146
Swaziland 51 158 13 351
Economic interest % LPMs Sites
South AfricaSun Slots 70 3 695 757

ANALYSIS OF MINORITY SHAREHOLDERS
30
Profit after tax % Shareholding Minority portion including SIEST
R million 30 June 2017 30 June 2016 30 June 2017 30 June 2016 30 June 2017 30 June 2016
South Africa 249 475 142 172
SunWest 218 244 64.90% 64.90% 84 82
Sibaya 115 100 66.15% 66.15% 43 36
Carnival City 33 76 94.65% 94.65% 3 7
Boardwalk (37) (21) 85.07% 85.07% (7) (4)
Wild Coast Sun (3) 1 70.00% 70.00% (1) -
Meropa 24 30 71.05% 71.05% 8 10
Windmill 15 24 73.50% 73.50% 5 7
Flamingo 8 12 74.92% 74.92% 2 4
Golden Valley 5 4 64.90% 64.90% 2 1
Time Square (56) - 75.00% 0.00% (16) -
South African operations with minorities/SIEST 322 470 123 143
Excluding SIEST - - 3.50% 3.50% (12) (16)
Sun Slots 44 46 70.00% 50.10% 13 23
Management and corporate
Manco - NCR - - 100.00% 100.00% - -
Manco - AfrisunKZN 9 8 47.44% 47.44% 4 4
Manco - Meropa 2 2 50.00% 50.00% 1 1
Manco - Windmill - 1 50.00% 50.00% - -
Dinokana (4) (4) 93.19% 93.20% - -
Royale - (1) 73.29% 73.29% - -
SIEST - - 3.50% 3.50% 13 17
Center and wholly owned subsidiaries (124) (47) 100.00% 100.00% - -
Management companies with minorities (117) (41) 18 22
Latam 217 14 55.00% 98.86% 104 16
Nigeria (34) (49) 49.33% 49.33% (18) (25)
432 440 228 163
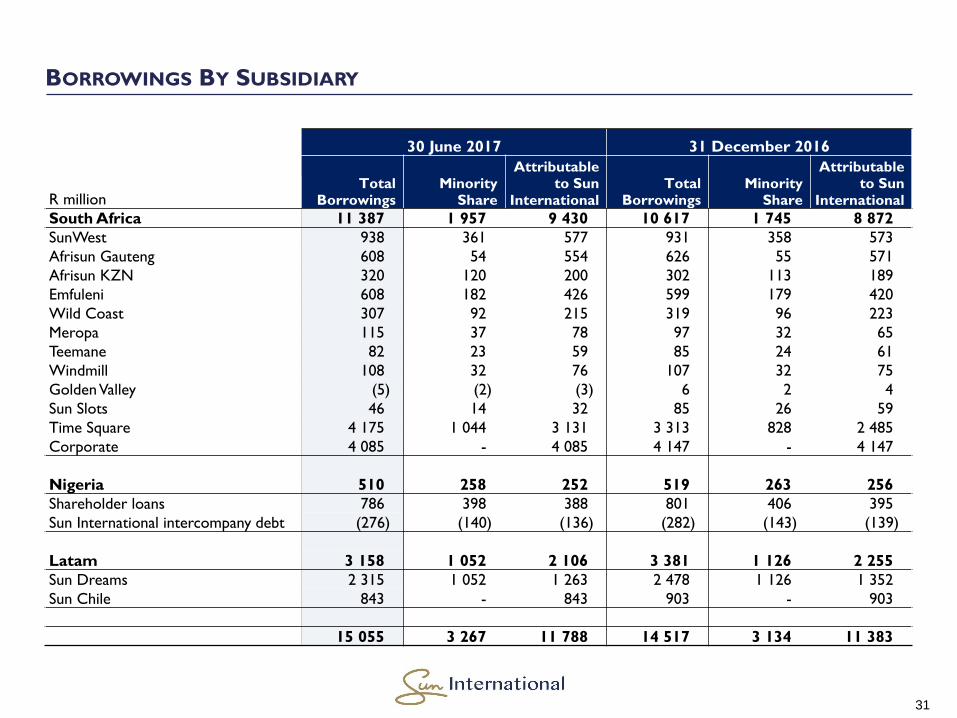
BORROWINGS BY SUBSIDIARY
30 June 2017 31 December 2016
Total Borrowings
MinorityShare
Attributable to Sun
InternationalTotal
Borrowings Minority
Share
Attributable to Sun
InternationalR million
South Africa 11 387 1 957 9 430 10 617 1 745 8 872
SunWest 938 361 577 931 358 573
Afrisun Gauteng 608 54 554 626 55 571
Afrisun KZN 320 120 200 302 113 189
Emfuleni 608 182 426 599 179 420
Wild Coast 307 92 215 319 96 223
Meropa 115 37 78 97 32 65
Teemane 82 23 59 85 24 61
Windmill 108 32 76 107 32 75
Golden Valley (5) (2) (3) 6 2 4
Sun Slots 46 14 32 85 26 59
Time Square 4 175 1 044 3 131 3 313 828 2 485
Corporate 4 085 - 4 085 4 147 - 4 147
Nigeria 510 258 252 519 263 256
Shareholder loans 786 398 388 801 406 395
Sun International intercompany debt (276) (140) (136) (282) (143) (139)
Latam 3 158 1 052 2 106 3 381 1 126 2 255
Sun Dreams 2 315 1 052 1 263 2 478 1 126 1 352
Sun Chile 843 - 843 903 - 903
15 055 3 267 11 788 14 517 3 134 11 383
31