Embed Size (px)
Citation preview

1
Interim financial report 30/06/18 under IFRS
27/09/18 – 18:00
Obligation regarding periodical information as a consequence of the European transparency regulations. Statement
regarding the information given in this interim financial report over 6 months ending 30/06/18.
Headlines
During the first semester of 2018 Campine achieved a revenue of 113.8 Mio € (2017: 116.5 Mio €).
Profit after taxes amounted to 4.67 Mio €, (2017: 4.98 Mio €). The slight reduction in Sales (-2.3%) and
profit (-6.2%) are solely related to the volatile and lower lead prices in 2018.
“The metal markets have been more volatile in 2018 due to threats of trade wars” explains CEO De
Vos and adds that “Despite similar average metal prices in the first half of 2017, the LME lead price in
2018 showed a downward trend. In combination with increased used-battery purchase prices, this has
a short term negative impact on margins.”
Campine confirms that since August battery prices are lowering and availability improves. In
combination with the new lead furnace filter and related increased output capacity, Campine is looking
forward to a positive second semester with good filled orderbooks for all businesses.
Re-aligned Business Units
Campine has aligned its business organisation into 2 segments in conformance with its markets
served.
This orientation also fits with our internal management structure says De Vos: “The Plastics and
Antimony Business Units are serving the same customers, often even for the same applications, so it
is logical to bring them in one Segment called Specialty Chemicals.
In May 2018 the company announced its new business plan, in which it confirmed also to increasingly
recycle other metals besides Lead. “What started as an attempt to recover antimony from our drosses
and other industrial waste streams, resulted in the recovery, concentration or extraction of different
other metals. The metallurgical process to do this and the suppliers and customers involved, are more
linked to our lead recycling operations, so these businesses fit very well under the Segment header of
Metals Recycling” adds De Vos.
Specialty Chemicals hosts all businesses
which serve end-markets with chemical
products and derivates. The manufacturing of
antimony trioxide used as flame-retardant,
polymerization catalyst and pigment reagent
(formerly reported under the Antimony unit)
and the production of different types of polymer
and plastic masterbatches (formerly reported
under BU Plastics) are hosted in this Segment,
which now comprises the BU Antimony and BU
Plastics.
Metals Recycling hosts the businesses in
which metals are being recovered from
industrial and post-consumer waste streams.
The main activity is the manufacturing of lead
alloys (formerly reported in the BU Lead). To
this business is now added the growing activity
of the recycling of other metals such as
antimony and tin (formerly integrated in the
Antimony BU). This Segment now comprises
the BU Lead and BU Metals Recovery.
The financial reporting is adapted according to this modification.
2
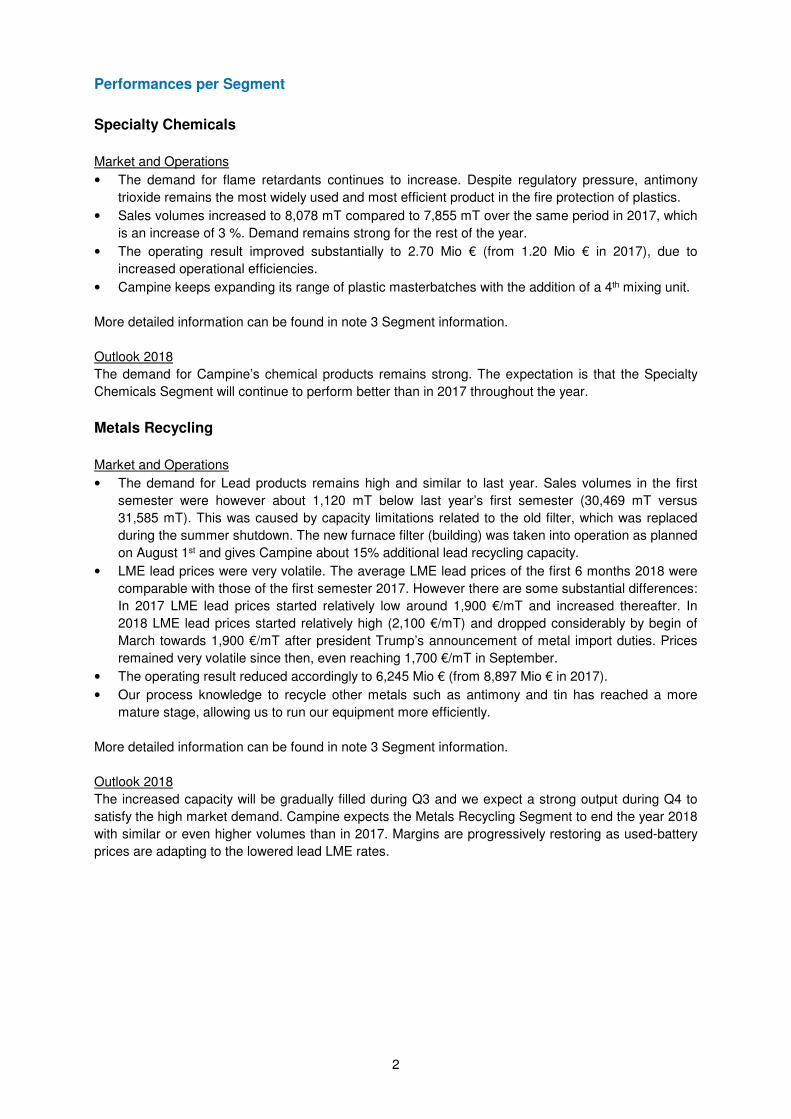
Performances per Segment
Specialty Chemicals
Market and Operations
• The demand for flame retardants continues to increase. Despite regulatory pressure, antimony
trioxide remains the most widely used and most efficient product in the fire protection of plastics.
• Sales volumes increased to 8,078 mT compared to 7,855 mT over the same period in 2017, which
is an increase of 3 %. Demand remains strong for the rest of the year.
• The operating result improved substantially to 2.70 Mio € (from 1.20 Mio € in 2017), due to
increased operational efficiencies.
• Campine keeps expanding its range of plastic masterbatches with the addition of a 4th mixing unit.
More detailed information can be found in note 3 Segment information.
Outlook 2018
The demand for Campine’s chemical products remains strong. The expectation is that the Specialty
Chemicals Segment will continue to perform better than in 2017 throughout the year.
Metals Recycling
Market and Operations
• The demand for Lead products remains high and similar to last year. Sales volumes in the first
semester were however about 1,120 mT below last year’s first semester (30,469 mT versus
31,585 mT). This was caused by capacity limitations related to the old filter, which was replaced
during the summer shutdown. The new furnace filter (building) was taken into operation as planned
on August 1st and gives Campine about 15% additional lead recycling capacity.
• LME lead prices were very volatile. The average LME lead prices of the first 6 months 2018 were
comparable with those of the first semester 2017. However there are some substantial differences:
In 2017 LME lead prices started relatively low around 1,900 €/mT and increased thereafter. In
2018 LME lead prices started relatively high (2,100 €/mT) and dropped considerably by begin of
March towards 1,900 €/mT after president Trump’s announcement of metal import duties. Prices
remained very volatile since then, even reaching 1,700 €/mT in September.
• The operating result reduced accordingly to 6,245 Mio € (from 8,897 Mio € in 2017).
• Our process knowledge to recycle other metals such as antimony and tin has reached a more
mature stage, allowing us to run our equipment more efficiently.
More detailed information can be found in note 3 Segment information.
Outlook 2018
The increased capacity will be gradually filled during Q3 and we expect a strong output during Q4 to
satisfy the high market demand. Campine expects the Metals Recycling Segment to end the year 2018
with similar or even higher volumes than in 2017. Margins are progressively restoring as used-battery
prices are adapting to the lowered lead LME rates.

3
Condensed consolidated income statement
'000 € Notes 30/06/18 30/06/17
Revenue 3 113,806 116,538
Other operating income 4 1,286 1,758
Raw materials and consumables used -93,195 -95,573
Employee benefits expense -7,083 -6,599
Depreciation and amortisation expense -1,260 -1,259
Changes in restoration provision - -350
Other operating expenses 4 -6,442 -5,768
Operating result 7,112 8,747
Investment revenues - -
Hedging results: 11 -124 -690
- Closed hedges 150 -14
- Change in open position -274 -676
Finance costs -256 -350
Result before tax 6,732 7,707
Income tax expense 5 -2,060 -2,727
Result for the period 4,672 4,980
Attributable to:
Equity holders of the parent 4,672 4,980
Non-controlling interest - -
4,672 4,980
RESULT PER SHARE (in €) 3.11 3.32
Basic 3.11 3.32
Diluted 3.11 3.32
Condensed consolidated overview of the total result for the period
'000 € Notes 30/06/18 30/06/17
Result for the period 4,672 4,980
Other comprehensive income:
Comprehensive income to be reclassified to the profit or loss
statement in the future - -
Comprehensive income not to be reclassified to the profit or loss
statement in the future (actuarial results of retirement benefit
obligations) - -
Total result for the period 4,672 4,980
Attributable to:
Equity holders of the parent 4,672 4,980
Non-controlling interes - -

4
Condensed consolidated balance sheet
'000 € Notes 30/06/18 31/12/17
ASSETS
Non-current assets
Property, plant and equipment 7 8,485 7,386
Intangible assets 8 182 259
Deferred tax assets 117 153
Cash restricted in its use 275 275
9,059 8,073
Current assets
Inventories 9 31,221 28,226
Trade and other receivables 10 / 14 30,512 35,513
Derivatives 11 / 14 - 213
Deferred tax assets - -
Cash and cash equivalents 14 650 148
62,383 64,100
TOTAL ASSETS 71,442 72,173
EQUITY AND LIABILITIES
Capital and reserves
Share capital 4,000 4,000
Translation reserves - -
Retained earnings 24,359 20,582
- Legal reserves 965 965
- Other reserves and retained results 23,394 19,617
Equity attributable to equity holders of the parent 28,359 24,582
Total equity 28,359 24,582
Non-current liabilities
Retirement benefit obligation 1,271 1,299
Deferred tax liabilities 67 18
Bank loans 12 - -
Obligations under finance leases - -
Provisions 15 1,090 1,090
2,428 2,407
Current liabilities
Retirement benefit obligation 97 83
Trade and other payables 13 22,965 20,538
Derivatives 11 132 71
Current tax liabilities 5,350 5,523
Bank overdrafts and loans 12 2,186 5,503
Advances on factoring 12 9,925 13,466
Provisions - -
40,655 45,184
Total liabilities 43,083 47,591
TOTAL EQUITY AND LIABILITIES 71,442 72,173

5
Condensed consolidated cash-flow statement
'000 € Notes 30/06/18 30/06/17
OPERATING ACTIVITIES
Result for the period 4,672 4,980
Adjustments for:
Other gains and losses (investment grants) - -
Investment revenues - -
Other gains and losses (hedging results) 11 124 690
Finance costs 256 350
(Deferred) tax expenses of the total result 5 2,060 2,727
Depreciation of property, plant and equipment 1,260 1,259
Gain on disposal of property, plant and equipment - -
Change in provisions (incl. retirement benefit) -14 313
Change in inventory value reduction -266 119
Change in trade receivables value reduction 38 -
Others - -1
Operating cash-flows before movements in working capital 8,130 10,437
Change in inventories -2,729 3,205
Change in receivables 4,963 -6,562
Change in trade and other payables 2,427 -1,323
Cash generated from operations 12,791 5,757
Hedging results 150 -14
Interest paid -256 -350
Income taxes paid -2,148 -
Net cash (used in) / from operating activities 10,537 5,393
INVESTING ACTIVITIES
Interest received - -
Proceeds on disposal of property, plant and equipment - -
Purchases of property, plant and equipment 7 -2,282 -1,379
Purchases of intangible assets 8 - -
Net cash (used in) / from investing activities -2,282 -1,379
FINANCING ACTIVITIES
Dividends and tantièmes paid 6 -895 -
Repayments of borrowings 12 - -
Repayments of obligations under finance leases - -
New bank loans raised - -
Change in cash restricted in its use - -
Change in bank overdrafts 12 -3,317 -151
Change in advances on factoring 12 -3,541 -3,853
Net cash (used in) / from financing activities -7,753 -4,004
Net change in cash and cash equivalents 502 10
Cash and cash equivalents at the beginning of the year 148 244
Effect of foreign exchange rate changes - -
Cash and cash equivalents at the end of the period 650 254
Cash and cash equivalents 650 254

6
Condensed consolidated statement of changes in equity
'000 € Share capital
Retained
earnings
Attributable to equity
holders of the parent Total
Balance on 31 December 2016 4,000 15,187 19,187 19,187
Total result of the period - 4,980 4,980 4,980
Dividends and tantièmes (see note 6) - - - -
Balance on 30 June 2017 4,000 20,167 24,167 24,167
Total result of the period - 1,915 1,915 1,915
Dividends and tantièmes (see note 6) - -1,500 -1,500 -1,500
Balance on 31 December 2017 4,000 20,582 24,582 24,582
Total result of the period - 4,672 4,672 4,672
Dividends and tantièmes (see note 6) - -895 -895 -895
Balance on 30 June 2018 4,000 24,359 28,359 28,359
Notes to the condensed consolidated financial statements
1. Basis of preparation
The condensed financial statements have been prepared in accordance with International Accounting
Standard (IAS) 34 Interim Financial Reporting as adopted by the EU.
2. Significant accounting policies
The condensed interim financial report applies the same valuation rules and presentation and calculation methods as those applied for the annual accounts of the Group for the financial year ending on 31/12/17, with the exception of the application of new international accounting standards that have become applicable as from 1 January 2018
• IFRS 9: Financial Instruments. This standard did not have a material impact on the figures for the
current financial year.
• IFRS 15: Revenue from contracts with customers. This standard did not have a material impact on the
figures for the current financial year.
Additionally, disclosures on the breakdown of the revenues were included under disclosure 3. For further information on the changes resulting from IFRS 9 and IFRS 15, we refer to disclosure 5.2 in the 2017 annual report and the updated valuation rules regarding financial instruments and revenue recognition in the appendix. Campine did not apply both new standards retroactively. Consequently, the comparative figures for 2017 were therefore not restated. There is no impact on equity per 1/1/2018. As from 1 January 2019, the new lease standard (IFRS 16) will also become applicable. Given the fact that Campine has only a limited number of operational lease agreements in which it engaged itself as a lessee, no material impact is expected from the application of this standard. The management of Campine is currently assessing the exact impact of the application of this new standard. Besides the items above, there have not become any new standards or interpretations applicable as from 1 January 2018 or will become applicable for which management expects a material impact on the figures.

7
3. Segment information
Geographical information
'000 € 30/06/18 % 30/06/17 %
Belgium 4,500 4% 4,281 4%
Germany 35,958 32% 45,113 39%
Switzerland 23,682 21% 18,507 16%
Italy 12,993 11% 13,720 12%
Romania 5,033 4% 4,678 4%
France 6,825 6% 5,461 5%
The Netherlands 4,275 4% 3,987 3%
United Kingdom 1,886 2% 1,749 2%
Other European countries 7,601 7% 4,223 4%
North America 8,185 7% 9,585 8%
Asia 2,019 2% 2,587 2%
Others 849 1% 2,647 2%
113,806 100% 116,538 100%
There were two customers in the BU Lead who represent more than 10% of the Group’s turnover (15.91% and 11.36%).
99% of the turnover of Metals Recycling Segment was realised in Europe (30/06/17: 99%) whereas 73% of the turnover of Specialty Chemicals was achieved in Europe (30/06/17: 67%).
Business segments
Campine has re-organised its business in line with the markets served (see page 1). The segment information has been adjusted conformingly. To ensure comparability with last year, the
figures over 2017 are presented in the same way.
Specialty Chemicals30/06/18 30/06/17 30/06/18 30/06/17 30/06/18 30/06/17
Turnover in € '000 34,015 31,662 7% 13,573 13,989 -3% 47,588 45,651 4%
BU Antimony BU Plastics Total
The turnover of Specialty Chemicals represents a volume of 8,078 mT (30/6/17: 7,855 mT).
Metals Recycling30/06/18 30/06/17 30/06/18 30/06/17 30/06/18 30/06/17
Turnover in € '000 5,334 4,164 28% 68,240 72,232 -6% 73,574 76,396 -4%
BU Metals Recovery BU Lead Total
The turnover of Metals Recycling represents a volume of 32,896 mT (30/6/17: 33,316 mT).

8
Specialty
Chemicals
Metals
Recycling
Eliminations
/Unallocated Total
'000 € 30/06/18 30/06/18 30/06/18 30/06/18
REVENUE
External sales 47,588 66,218 - 113,806
Cross-business unit sales in the same segment - 7,356 -7,356 0
Total revenue 47,588 73,574 -7,356 113,806
RESULT
Segment operating result 2,696 6,245 8,941
Unallocated expenses -1,829 -1,829
Operating result 7,112
Investment revenues -
Hedging results -124 -124
Other gains and losses -
Finance costs -256 -256
Result before tax 6,732
Income tax expense -2,060 -2,060
Result for the period 4,672
Specialty
Chemicals
Metals
Recycling Unallocated Total
'000 € 30/06/18 30/06/18 30/06/18 30/06/18
OTHER INFORMATION
Capital additions 372 1,861 49 2,282
Depreciation and amortisation 354 698 208 1,260
1,022
BALANCE SHEET
Assets
Fixed assets 2,372 4,824 1,471 8,667
Deferred tax 117 117
Cash restricted in its use 275 275
Stocks 13,252 16,614 1,355 31,221
Trade and other receivables 15,172 13,496 1,844 30,512
Derivatives 0
Cash and cash equivalent 650 650
Total assets 30,796 35,209 5,437 71,442
The unallocated expenses concern mainly remuneration for general services, insurances, IT, costs for
safety, health and environment, maintenance and depreciation of general intangible assets.

9
Specialty
Chemicals
Metals
Recycling
Eliminations /
Unallocated Total
'000 € 30/06/17 30/06/17 30/06/17 30/06/17
REVENUE
External sales 45,651 70,887 - 116,538
Cross-business unit sales in the same segment - 5,509 -5,509 0
Total revenue 45,651 76,396 -5,509 116,538
RESULT
Segment operating result 1,202 8,897 - 10,099
Unallocated expenses -1,352 -1,352
Operating result 8,747
Investment revenues -
Hedging results -690 -690
Other gains and losses -
Finance costs -350 -350
Result before tax 7,707
Income tax expense -2,727 -2,727
Result for the period 4,980
Specialty
Chemicals
Metals
Recycling Unallocated Total
'000 € 30/06/17 30/06/17 30/06/17 30/06/17
OTHER INFORMATION
Capital additions 475 566 337 1,378
Depreciation and amortisation 351 704 204 1,259
119
BALANCE SHEET
Assets
Fixed assets 1,906 3,684 1,633 7,223
Deferred tax 199 199
Cash restricted in its use 275 275
Stocks 13,029 12,427 1,525 26,981
Trade and other receivables 17,036 17,363 810 35,209
Derivatives 31 31
Cash and cash equivalent 254 254
Total assets 31,971 33,780 4,421 70,172
The unallocated expenses concern mainly remuneration for general services, insurances, IT, costs for
safety, health and environment, maintenance and depreciation of general intangible assets.
10
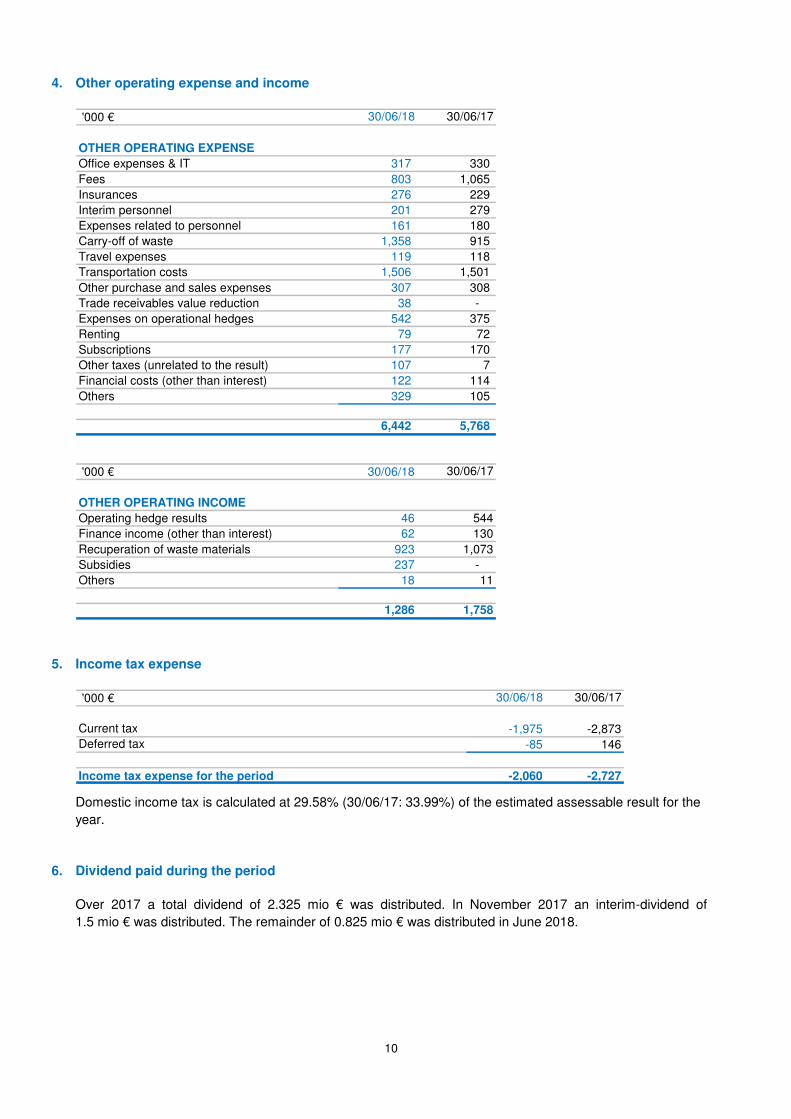
4. Other operating expense and income
'000 € 30/06/18 30/06/17
OTHER OPERATING EXPENSE
Office expenses & IT 317 330
Fees 803 1,065
Insurances 276 229
Interim personnel 201 279
Expenses related to personnel 161 180
Carry-off of waste 1,358 915
Travel expenses 119 118
Transportation costs 1,506 1,501
Other purchase and sales expenses 307 308
Trade receivables value reduction 38 -
Expenses on operational hedges 542 375
Renting 79 72
Subscriptions 177 170
Other taxes (unrelated to the result) 107 7
Financial costs (other than interest) 122 114
Others 329 105
6,442 5,768
'000 € 30/06/18 30/06/17
OTHER OPERATING INCOME
Operating hedge results 46 544
Finance income (other than interest) 62 130
Recuperation of waste materials 923 1,073
Subsidies 237 -
Others 18 11
1,286 1,758
5. Income tax expense
'000 € 30/06/18 30/06/17
Current tax -1,975 -2,873
Deferred tax -85 146
Income tax expense for the period -2,060 -2,727
Domestic income tax is calculated at 29.58% (30/06/17: 33.99%) of the estimated assessable result for the
year.
6. Dividend paid during the period
Over 2017 a total dividend of 2.325 mio € was distributed. In November 2017 an interim-dividend of
1.5 mio € was distributed. The remainder of 0.825 mio € was distributed in June 2018.

11
7. Statement of changes in property, plant and equipment
'000 €
Land &
buildings
Properties
under
construction
Fixtures &
equipment Total
COST OR VALUATION
On 31 December 2017 13,639 119 60,028 73,786
Additions - 1,868 414 2,282
Transfers - - - -
Disposals - - - -
On 30 June 2018 13,639 1,987 60,442 76,068
ACCUMULATED DEPRECIATION AND IMPAIRMENT
On 31 December 2017 12,480 - 53,920 66,400
Depreciation charge for the year 86 - 1,097 1,183
Eliminated on disposals - - - -
On 30 June 2018 12,566 - 55,017 67,583
CARRYING AMOUNT
On 31 December 2017 1,159 119 6,108 7,386
On 30 June 2018 1,073 1,987 5,425 8,485
8. Statement of changes in intangible assets
'000 €
Licences, patents &
trademarks
COST
On 31 December 2017 1,722
Additions -
On 30 June 2018 1,722
ACCUMULATED DEPRECIATION AND AMORTISATION
On 31 December 2017 1,463
Charge for the year 77
On 30 June 2018 1,540
CARRYING AMOUNT
On 31 December 2017 259
On 30 June 2018 182

12
9. Inventories
'000 € 30/06/18 31/12/17
Raw materials 10,268 8,539
Work-in-progress 6,870 6,702
Finished goods 14,083 12,985
31,221 28,226
The inventory per 30/06/18 includes a value
reduction of 259 K€ (31/12/17: 487 K€) to value
inventory at the lower of cost and net realisable
value.
10. Trade and other receivables
'000 € 30/06/18 31/12/17
Amounts receivable from the sale of goods 28,920 34,484
Other receivables 1,592 1,029
30,512 35,513
An allowance has been recorded for estimated irrecoverable amounts from the sale of goods of 1,011 K€
(31/12/17: 973 K€). This allowance has been determined on a case-by-case basis. The Board of Directors
confirms that the carrying amount of trade and other receivables approximates their fair value as those
balances are short-term.
The total amount from sales of goods of 28,920 K€ includes 23,959 K€ subject to commercial factoring by a
credit institute. Based on these receivables, the credit institute deposits advances on the account of
Campine (9,925 K€ per 30/06/18, see note 12. Bank borrowings) and afterwards collects the receivables
itself. The credit risk stays at Campine and is covered by a credit insurance.
11. Derivatives
The table below summarises the net change in fair value – realised and unrealised – of the positions on the
LME lead futures where it sells forward lead and tin via future contracts of -124 K€ included in the income
statement during the half year ended 30/06/18 (30/06/17: -690 K€).
'000 €
Fair value of
current instruments
Underlying open
positions (tons)
Change in fair value
in income statement
On 30 June 2017 -119 4,565 -690
On 31 December 2017 142 1,935 -1,057
On 30 June 2018 -132 1,900 -124
The classification of the fair value of the hedge instruments is level 1 (unadjusted quoted prices in an active
market for identical assets or liabilities) in the “fair value hierarchy” of IFRS 13.

13
12. Bank borrowings (finance lease obligations not included)
'000 € 30/06/18 31/12/17
Bank loans - -
Bank overdrafts 2,186 5,503
Advances on factoring 9,925 13,466
12,111 18,969
REPAYABLE BORROWINGS
Bank overdrafts 2,186 5,503
Advances on factoring 9,925 13,466
12,111 18,969
AVERAGE INTREST RATES PAID
Bank overdrafts 3.01% 2.72%
Advances on factoring 1.62% 1.98%
Bank loans - -
Bank loans are arranged at fixed interest rates. Other borrowings (bank overdrafts and advances on
factoring for an amount of 12,111 K€ (31/12/17: 18,969 K€)) are arranged at floating rates, thus exposing
the Group to an interest rate risk.
On 30/06/18, the Group had available 17,939 K€ (31/12/17: 15,304 K€) of undrawn committed borrowing
facilities.
The credit agreements with our bankers contain a number of covenants, based on equity, solvability and
stock rotation. On 30/06/18 the Group complied adequately with all covenants:
• the equity (corrected for other assets and deferred taxes) amounted to 28,127 K€ as to a required
minimum of 20,000 K€.
• the solvency ratio (39.4 %) complied to the imposed ratio of 30 %.
• Campine complied to the stock rotation ratio.
13. Trade and other payables
'000 € 30/06/18 31/12/17
Trade creditors and accruals 19,898 17,726
Other payables and accruals 3,067 2,812
22,965 20,538
Trade creditors and accruals principally comprises amounts outstanding for trade purchases and ongoing
costs. The Board of Directors considers that the carrying amount of trade payables approximates their fair
value as those balances are short-term. There are no trade payables older than 90 days (with exception of
disputes), hence an age analysis is irrelevant.

14
14. Financial instruments
The major financial instruments of the Group are financial and trade receivables and payables, investments, cash and cash equivalents as well as derivatives.
Overview of the financial instruments as on 30/06/18:
'000 € Category
Book
value
Fair
value Level
I. Fixed assets
II. Current Assets
Trade and other receivables A 30,512 30,512 2
Cash and cash equivalents B 650 650 2
Derivatives C - - 1
Total financial instruments on the assets
side of the balance sheet 31,162 31,162
I. Non-current liabilities
Interest-bearing liabilities A - - 2
Other non-current liabilities A - - 2
Other financial liabilities C - - 2
II. Current liabilities
Interest-bearing liabilities A 12,111 12,111 2
Current trade and other debts A 22,965 22,965 2
Derivatives C 132 132 1
Total financial instruments on the
liabilities side of the balance sheet 35,208 35,208
Overview of the financial instruments as on 31/12/17:
'000 € Category
Book
value
Fair
value Level
I. Fixed assets
II. Current Assets
Trade and other receivables A 35,513 35,513 2
Cash and cash equivalents B 148 148 2
Derivatives C 213 213 1
Total financial instruments on the assets
side of the balance sheet 35,874 35,874
I. Non-current liabilities
Interest-bearing liabilities A - - 2
Other non-current liabilities A - - 2
Other financial liabilities C - - 2
II. Current liabilities
Interest-bearing liabilities A 18,969 18,969 2
Current trade and other debts A 20,538 20,538 2
Derivatives C 71 71 1
Total financial instruments on the
liabilities side of the balance sheet 39,578 39,578
15
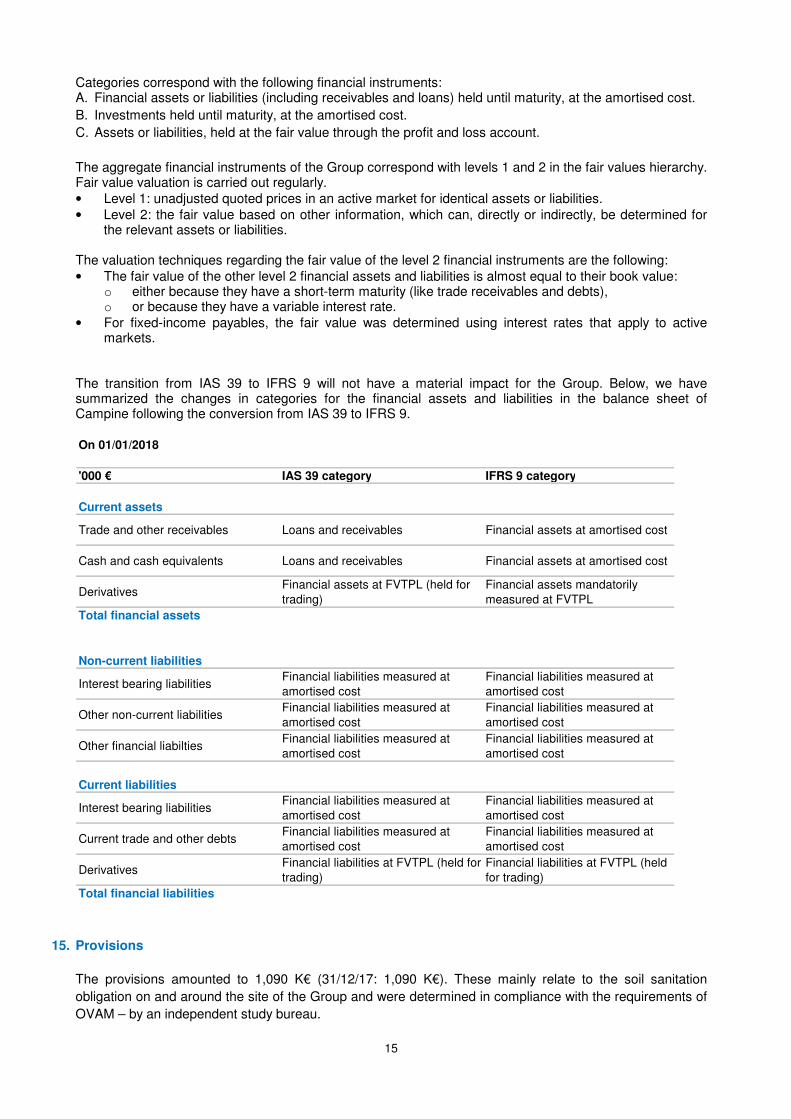
Categories correspond with the following financial instruments: A. Financial assets or liabilities (including receivables and loans) held until maturity, at the amortised cost.
B. Investments held until maturity, at the amortised cost.
C. Assets or liabilities, held at the fair value through the profit and loss account.
The aggregate financial instruments of the Group correspond with levels 1 and 2 in the fair values hierarchy. Fair value valuation is carried out regularly.
• Level 1: unadjusted quoted prices in an active market for identical assets or liabilities.
• Level 2: the fair value based on other information, which can, directly or indirectly, be determined for the relevant assets or liabilities.
The valuation techniques regarding the fair value of the level 2 financial instruments are the following:
• The fair value of the other level 2 financial assets and liabilities is almost equal to their book value: o either because they have a short-term maturity (like trade receivables and debts), o or because they have a variable interest rate.
• For fixed-income payables, the fair value was determined using interest rates that apply to active markets.
The transition from IAS 39 to IFRS 9 will not have a material impact for the Group. Below, we have summarized the changes in categories for the financial assets and liabilities in the balance sheet of Campine following the conversion from IAS 39 to IFRS 9.
On 01/01/2018
'000 € IAS 39 category IFRS 9 category
Current assets
Trade and other receivables Loans and receivables Financial assets at amortised cost
Cash and cash equivalents Loans and receivables Financial assets at amortised cost
DerivativesFinancial assets at FVTPL (held for
trading)
Financial assets mandatorily
measured at FVTPL
Total financial assets
Non-current liabilities
Interest bearing liabilitiesFinancial liabilities measured at
amortised cost
Financial liabilities measured at
amortised cost
Other non-current liabilitiesFinancial liabilities measured at
amortised cost
Financial liabilities measured at
amortised cost
Other financial liabiltiesFinancial liabilities measured at
amortised cost
Financial liabilities measured at
amortised cost
Current liabilities
Interest bearing liabilitiesFinancial liabilities measured at
amortised cost
Financial liabilities measured at
amortised cost
Current trade and other debtsFinancial liabilities measured at
amortised cost
Financial liabilities measured at
amortised cost
DerivativesFinancial liabilities at FVTPL (held for
trading)
Financial liabilities at FVTPL (held
for trading)
Total financial liabilities
15. Provisions
The provisions amounted to 1,090 K€ (31/12/17: 1,090 K€). These mainly relate to the soil sanitation
obligation on and around the site of the Group and were determined in compliance with the requirements of
OVAM – by an independent study bureau.

16
16. Related party transactions
All related party transactions are conducted on a business base and in accordance with all legal requirements and the Corporate Governance Charter.
Trading transactions
During the period, group entities entered into the following trading transactions with related parties that are
not members of the Group:
• Purchase of lead waste to Hempel Legierungsmetalle GmbH for 516 K€. (30/06/17: 1,112 K€).
Other transactions
Camhold performed certain administrative/management services for the Campine Group, for which a
management fee of 9 K€ (30/06/17: 9 K€) was charged and paid, being an appropriate allocation of costs
incurred by relevant administrative departments.
The companies below passed through personnel and IT expenses to the Campine Group:
• F.W. Hempel Metallurgical: 155 K€ (30/06/17: 163 K€).
• F.W. Hempel & Co Erze und Metalle: 64 K€ (30/06/17: 88 K€).
The Campine Group passed through personnel and IT expenses to:
• F.W. Hempel & Co Erze und Metalle: 8 K€ (30/06/17: 0 K€).
17. Risks and uncertainties
Campine, together with all other companies, is confronted with a number of uncertainties as a consequence of worldwide developments. The management aims to tackle these in a constructive way. Major risks and uncertainties inherent to the sector
Campine pays particular attention to the company risks related and inherent to the sector:
• Fluctuations of the prices of raw materials and metal. Prices fluctuate as a result of a changing supply
and/or demand of raw materials and end products, but also because of pure speculation.
• Fluctuations in availability and cost of the energy.
• Changes in regulations (Flemish, Belgian, European and global) in the field of environment and
safety/health including legislation related to sale (REACH) and storage (SEVESO) of chemical products.
• Market risks include: interest risk, foreign exchange rate, price risk and credit risk.
18. Important events after balance sheet date
On 21 November 2018 the hearing before the General Court (the Group’s appeal against the fine issued by the EC in 2017) will take place. Between 30/06/18 and the date these interim financial statements were authorised for issue, no important events occurred.
19. Declaration true and fair view
The Board of Directors declares that to their knowledge
• The interim consolidated financial report for the period of 6 months, ending on 30/06/18, gives a true
and fair view of the financial position, the financial results and cash flow of Campine nv, including its
consolidated subsidiary (“the Group”).
• The interim financial report for the 6 months, ending on 30/06/18, gives a true and fair view of the legal
and regulatory required information and corresponds with the condensed interim consolidated financial
statements.

17
20. Approval of interim financial statements
The interim financial statements were approved and authorised for issue by the Board of Directors of
25/09/18.
This information is also available in Dutch. Only the Dutch version is the official version. The English version is a translation of the original Dutch version.
For further information you can contact Karin Leysen (tel. no +32 14 60 15 49) (email: [email protected]).

18
Annex: New bases for financial reporting
IFRS 9 Financial instruments (as revised in 2014)
(Effective for annual periods beginning on or after 1 January 2018)
In July 2014, the IASB finalized the reform of financial instruments accounting and issued IFRS 9 (as revised in 2014), which contains the requirements for a) the classification and measurement of financial assets and financial liabilities, b) impairment methodology, and c) general hedge accounting. IFRS 9 (as revised in 2014) will supersede IAS 39 Financial Instruments: Recognition and Measurement upon its effective date.
The Group elected not to restate the comparative amounts of 2017 for the impact of IFRS 9.
Classification and measurement of financial assets
Financial assets and financial liabilities are recognised when a group entity becomes a party to the contractual provisions of the instrument.
Financial assets and financial liabilities are initially measured at fair value. Transaction costs that are directly attributable to the acquisition or issue of financial assets and financial liabilities (other than financial assets and financial liabilities at fair value through profit or loss) are added to or deducted from the fair value of the financial assets or financial liabilities, as appropriate, on initial recognition. Transaction costs directly attributable to the acquisition of financial assets or financial liabilities at fair value through profit or loss are recognised immediately in profit or loss.
The date of initial application (i. e. the date on which the Group has assessed its existing financial assets and financial liabilities in terms of the requirements of IFRS 9) is 1 January 2018. Accordingly, the Group applies the requirements of IFRS 9 to instruments that have not been derecognised as at 1 January 2018 and does not apply the requirements of IFRS 9 to instruments that have already been derecognised as at 1 January 2018.
The management of the Group reviewed and assessed the Group’s existing financial assets and liabilities as at 1 January 2018 based on the facts and circumstances that existed at that date and concluded that at initial application of IFRS 9 the financial assets classified in the category “Loans and receivables” such as trade receivables, cash and cash equivalents, under IAS 39 are classified and measured at amortised cost under IFRS 9.
Debt instruments that meet the following conditions are subsequently measured at amortised cost:
• The financial asset is held within a business model whose objective is to hold financial assets in order to collect contractual cash flows; and
• The contractual terms of the financial asset give rise on specified dates to cash flows that are solely payments of principle and interest on the principal amount outstanding.
The effective interest method is a method of calculating the amortised cost of a debt instrument and of allocating interest income over the relevant period.
The amortised cost of a financial asset is the amount at which the financial asset is measured at initial recognition minus the principal repayments, plus the cumulative amortization using the effective interest method of any difference between that initial amount and the maturity amount, adjusted for any loss allowance. On the other hand, the gross carrying amount of a financial asset is the amortised cost of a financial asset before adjusting for any loss allowance.
Classification and measurement of financial liabilities of the Group has not been modified by the requirements of IFRS 9.
All financial liabilities of the Group are subsequently measured at amortised cost using the effective interest rate method.
Impairment of financial assets
In relation to the impairment of financial assets, IFRS 9 requires an expected credit loss model as opposed to an incurred credit loss model under IAS 39. The expected credit loss model requires the Group to account for expected credit losses and changes in those expected credit losses at each reporting date to reflect changes in credit risk since initial recognition of the financial assets.
19
Specifically, IFRS 9 requires the Group to recognize a loss allowance for expected credit losses on trade receivables and cash and cash equivalents.
The amount of expected credit losses is updated at each reporting date to reflect changes in credit risk since initial recognition of the respective financial instrument.
IFRS 9 provides a simplified approach for measuring the loss allowance at an amount equal to lifetime expected credit losses for trade receivables without a significant financing component (short-term trade receivables). The expected credit losses on these financial assets are estimated using a provision matrix based on the Group’s historical credit loss experience adjusted for factors that are specific to the debtors, general economic conditions and an assessment of both the current as well as the forecast direction of conditions at the reporting date, including time value of money where appropriate.
All bank balances are assessed for expected credit losses at each reporting date as well.
Definition of default
The Group considers the following as constituting an event of default for internal credit risk management purposes as historical experience indicates that receivables that meet either of the following criteria are generally not recoverable:
• When there is a breach of financial covenants by the counterparty; or
• Information developed internally or obtained from external sources indicates that the debtor is unlikely to pay its creditors, including the Group, in full (without taking into account any collateral held by the Group).
Irrespective of the above analysis, the Group considers that default has occurred when a financial asset is more than 90 days past due unless the Group has reasonable and supportable information to demonstrate that a more lagging default criterion is more appropriate.
Credit-impaired financial assets
A financial asset is credit-impaired when one or more events that have a detrimental impact on the estimated future cash flows of that financial asset have occurred. Evidence that a financial asset is credit-impaired includes observable data about the following events:
• Significant financial difficulty of the issuer or the borrower;
• A breach of contract, such as a default or past due event;
• The lender(s) of the borrower, for economic or contractual reasons relating to the borrower’s financial difficulty, having granted to the borrower a concessions(s) that the lender(s) would not otherwise consider;
• It is becoming probable that the borrower will enter bankruptcy or other financial reorganisation; or
• The disappearance or an active market for that financial asset because of financial difficulties.
Write-off policy
The Group writes off a financial asset when there is information indicating that the counterparty is in severe financial difficulty and there is no realistic prospect of recovery, e.g. when the counterparty has been placed under liquidation or has entered into bankruptcy proceedings, or in the case of trade receivables, when the amounts are over two years past due, whichever occurs sooner. Financial assets written off may still be subject to enforcement activities under the Group’s recovery procedures, taking into account legal advice where appropriate. Any recoveries made are recognised in profit or loss.
Derivative financial instruments
The Group enters into a variety of derivative financial instruments to manage its exposure to commodity price risk.
Derivatives are initially recognised at fair value at the date the derivative contracts are entered into and are subsequently remeasured to their fair value at the end of each reporting period. The resulting gain or loss is recognized in profit or loss immediately unless the derivative is designated and effective as a hedging instrument, in which event the timing of the recognition in profit or loss depends on the nature of the hedge relationship.

20
IFRS 15 – Revenue from Contracts with Customers
IFRS 15 establishes a five-step model to account for revenue arising from contracts with customers:
• Identify the contract
• Identify the performance obligations
• Determine the transaction price
• Allocate the transaction price to the performance obligations in the contract
• Recognize revenue when or as the Group satisfies a performance obligation Under IFRS 15, revenue is recognized at an amount that reflects the consideration to which an entity expects to be entitled in exchange for transferring goods or services to a customer. Nature of sales transactions: The Group is active in the metal business and thus contracts with customers generally concern the sale of these metal products, which qualify as separate performance obligations. Ancillary services, such as transport, are not material. As a result, revenue recognition generally occurs at a point in time, when control of the products is transferred to the customer, generally on delivery of the goods and considering the underlying incoterm. The Group is not involved in transactions and/or contracts including volume rebates, trade discounts, (ancillary) services, customer assistance services or bundled sales contracts of a material nature. Campine works with direct sales people for most of its sales in Europe and with distributors and agents in the rest of the world.

21
Report on the review of the consolidated interim financial information for the six-month period
ended 30 June 2018 (the original text of this report is in Dutch)
Report on the review of the consolidated interim financial information of Campine NV for the six-month period ended 30 June 2018 In the context of our appointment as the company’s statutory auditor, we report to you on the consolidated interim financial information. This consolidated interim financial information comprises the condensed consolidated balance sheet as at 30 June 2018, the condensed consolidated income statement, the condensed consolidated overview of the total result for the period, the condensed consolidated statement of changes in equity and the condensed consolidated cash-flow statement for the period of six months then ended, as well as selective notes 1 to 20.
Report on the consolidated interim financial information
We have reviewed the consolidated interim financial information of Campine NV (“the company”) and its subsidiaries (jointly “the group”), prepared in accordance with International Accounting Standard (IAS) 34, “Interim Financial Reporting” as adopted by the European Union. The condensed consolidated balance sheet shows total assets of 71,442 (000) EUR and the condensed consolidated income statement shows a consolidated profit (group share) for the period then ended of 4,672 (000) EUR. The board of directors of the company is responsible for the preparation and fair presentation of the consolidated interim financial information in accordance with IAS 34, “Interim Financial Reporting” as adopted by the European Union. Our responsibility is to express a conclusion on this consolidated interim financial information based on our review.
Scope of review
We conducted our review of the consolidated interim financial information in accordance with International Standard on Review Engagements (ISRE) 2410, “Review of interim financial information performed by the independent auditor of the entity”. A review of interim financial information consists of making inquiries, primarily of persons responsible for financial and accounting matters, and applying analytical and other review procedures. A review is substantially less in scope than an audit performed in accordance with the International Standards on Auditing (ISA) and consequently does not enable us to obtain assurance that we would become aware of all significant matters that might be identified in an audit. Accordingly, we do not express an audit opinion on the consolidated interim financial information.
Conclusion
Based on our review, nothing has come to our attention that causes us to believe that the consolidated interim financial information of Campine NV has not been prepared, in all material respects, in accordance with IAS 34, “Interim Financial Reporting” as adopted by the European Union. Antwerp, 26 September 2018 The statutory auditor DELOITTE Bedrijfsrevisoren / Réviseurs d’Entreprises BV o.v.v.e. CVBA / SC s.f.d. SCRL Represented by Luc Van Coppenolle