Embed Size (px)
Citation preview
Interim Financial Report January-September 2013
TDC Group November 1, 2013
Disclaimer
2
This presentation may include statements about TDC’s expectations, beliefs, plans, objectives, assumptions or future events or performance that are not historical facts and may be forward-looking. These statements are often, but not always, formulated using words or phrases such as "are likely to result", "are expected to", "will continue", "believe", "is anticipated", "estimated", "intends", "expects", "plans", "seeks", "projection" and "outlook" or similar expressions or negatives thereof. These statements involve known and unknown risks, estimates, assumptions and uncertainties that could cause actual results, performance or achievements or industry results to differ materially from those expressed or implied by such forward-looking statements
Any forward-looking statements are qualified in their entirety by reference to the factors discussed throughout thisreport. The key factors that may have a direct bearing on TDC’s results include: the competitive environment and the industry in which TDC operates; contractual obligations in TDC’s financing arrangements; developments in competition within the domestic and international communications industry; information technology and operational risks including TDC’s responses to change and new technologies; introduction of and demand for new services and products; developments in the demand, product mix and prices in the mobile and multimedia services market; research regarding the impact of mobile phones on health; changes in applicable legislation, including but not limited to tax and telecommunications legislation and anti-terror measures; decisions by the Danish Business Authority; the possibility of being awarded licences; increases in interest rates; status of important intellectual property rights; exchange-rate fluctuations; global and local economic conditions; investments in and divestments of domestic and foreign companies; and supplier relationships

Q3 Highlights
3
Fin
ancia
l O
pera
tional
• Revenue down by 4.4% in Q3, which is an improvement on the H1 2013 development, with continued
negative effects from regulation (accounting for approx. 50% of reported revenue decline)
• Gross profit down by 3.3% in Q3 vs. -4.3% in H1 2013, positively influenced by our best mobility services
performance for a couple of years
• Opex savings of 5.8% resulted in EBITDA declining by only 1.4% in Q3; highest EBITDA margin ever (43.3%)
• EFCF YoY growth of 14.3%
• 2013 revenue guidance revised from DKK 25.0-25.5bn to DKK 24.5-25.0bn following a lower than expected
revenue from low-margin areas (Nordic and handset sales)
• Unchanged 2013 EBITDA, capex and DPS guidance, as higher than expected opex savings compensated for
minor gross profit shortfall
• Small increases in business and residential mobile ARPUs vs. Q2 2013, positively affected by increased
roaming
• Strong intake in mobile subscribers in TDC brand, but residential mobile net adds down by 8k due to
continued drain on low ARPU subscribers and one-off migration churn following M1/Fullrate integration
• Continued strong TV net adds in the TDC brand (+5k vs. Q2) fuelled by HomeTrio Mobil intake
• Loss of organised customers affected the YouSee brand Q3 net adds on TV (-4k) and broadband
• Best Q3 number of fault-handling hours in more than four years driven by few faults
• Increased recommend score (66) and customer satisfaction score (76)

Financial Highlights
4
DKKm
2012 2013 Growth % 2012 2013 Growth %
Revenue 6,348 6,069 (4.4) 19,568 18,456 (5.7)
Gross Profit 4,599 4,448 (3.3) 13,946 13,390 (4.0)
% margin 72.4 73.3 - 71.3 72.6 -
Opex (1,933) (1,820) 5.8 (6,199) (5,788) 6.6
% margin (30.5) (30.0) - (31.7) (31.4) -
EBITDA 2,666 2,628 (1.4) 7,747 7,602 (1.9)
% margin 42.0 43.3 - 39.6 41.2 -
Capex (798) (764) 4.3 (2,581) (2,516) 2.5
EFCF 1,186 1,356 14.3 2,234 2,637 18.0
Group FTE EoP 9,246 8,937 (3.3)
Domestic FTE EoP 8,020 7,692 (4.1)
Q3 YTD

Contract facts
• 6 years contract signed with Huawei,
replacing Ericsson, with an expected total
contract value of approximately DKK 4bn
• Huawei will supply build out services, mobile
RAN equipment for 2G, 3G and 4G as well as
operating and maintenance services
• Swap of current Ericsson equipment expected
to be finalised over the next 1½ years
New mobile network partnership
5
3G (42 Mbps) % of population 4G % of population
Expected outcome
• Protect TDC’s leading network position
• More “value for money”: Substantial
improvement of capacity and 3G & 4G coverage
• 4G coverage obligations met ahead of time
• New quality regime moves focus from network
quality to customer experience
3G (21 Mbps) % of population
99
54
40
2015E 2013E 2012
70
4439
2015E 2013E 2012
85
7270
2015E 2013E 2012

Launch of a variety of new products and services to target households and maintain TV & BB position
6
Mobile Family plans Broadband ”Mix it yourself”
• New ”pick & choose” YouSee broadband portfolio to counter utilities’ symmetric fiber
• Freely chose distribution between download & upload speeds online
Fullrate TV re-launch TV ”Mix it yourself”
• Significant change in intake split - doubling family subscription share since launch
• Growth in net adds since launch of new mobile voice portfolio week 28
• No frills, low cost IPTV (Launch Sep. 27)
• 600 new TV customers per week since launch
• 42% are entirely new Fullrate customers
• 75% of customers from competitors
• 86% on up sale product
• Launch February 2014
• First mover to liberate packages and ensure freedom of choice among 100+ channels
• Freely choose 10 or 34 channels on top of basic package
Stronger household offerings… … and freedom of choice

Customer satisfaction KPI’s
7
1 Q1 2009 = Index 100. A lower index equals a more positive customer experience
2 Compared to TDC Factsheet, Q3 2011 is normalised by subtracting 26.500 hours due to the heavy rainfall in July 2011 (Copenhagen cloudburst)
4956
6874
98
Q3 13 Q3 12 Q3 11 Q3 10 Q3 09
• Continued YoY improvement in number of unacceptable customer experiences
• Fewer cable and volume faults drive continued Q3 YoY reductions in number of fault handling hours (16.6%)
• Customer satisfaction back to record high score of 76 after a minor decrease in Q2 2013
Q3 13
156
Q3 12
187
Q3 11
206
Q3 10
222
Q3 09
234
1
71
Q3 09
66
Q3 13
76
Q3 12
74
Q3 11
72
Q3 10
2
Unacceptable customer experiences Index
Faults correction time Index Customer satisfaction Index

Mobility Services
8
120117115117121
163161166168181
Q3 13 Q2 13 Q1 13 Q4 12 Q3 12
-8-7
-26
-37
-27
1212
18
88
Q3 13 Q4 12 Q3 12 Q2 13 Q1 13
Residential Business
• Significant regulatory impact (-9%) on reported revenue, but significant improvement in YoY decreases in organic revenue and gross profit vs. H1 2013 and 2012 levels
• Small increase in business and residential ARPU (+DKK 2-3 vs. Q2 2013) affected by increased roaming due to seasonality
• Improved intake in the TDC brand, but net adds down by 8k due to drain on low ARPU subscribers and migration churn in M1/Fullrate
1 Compared to TDC Factsheet, Q3 data have been adjusted to reflect a movement of 8k “Fullrate Erhverv” RGUs from Consumer to Business
ARPU (subscriptions) DKK/month
RGU net adds (subscriptions) ‘000

Landline Telephony
9
RGU net adds ‘000
ARPU DKK/month
135136132138139
348367
335366
345
Q3 13 Q2 13 Q1 13 Q4 12 Q3 12
Residential Business
-33-35
-24-25-22
-10-11-10-11
-7
Q3 13 Q2 13 Q1 13 Q4 12 Q3 12
• Low traffic revenue during summer months negatively affected Business ARPU (down DKK 19 vs. Q2)
• Residential net adds continues to be negatively affected by successful HomeTrio Mobil
• Business’ strategy of selling integrated solutions showed solid progress, as “TDC One” more than doubled RGUs vs. Q2
1 Compared to TDC Factsheet, Q3 data have been adjusted to reflect a movement of 7k “Fullrate Erhverv” RGUs from Consumer to Business

Broadband
10
181181181181180
283295298303301
Q3 13 Q2 13 Q1 13 Q4 12 Q3 12
Business Residential
0
88
4
12
-4
-6
-3
-1
-3
Q2 13 Q1 13 Q3 13 Q4 12 Q3 12
• Substantial Business ARPU decline (DKK 12 vs. Q2) due to continued migrations to a new generation of low-ARPU products
• Slowdown in YouSee’s RGU growth with a level development vs. Q2 2013. High intake rates were maintained, but churn was affected by loss of some organised customers
1 Compared to TDC Factsheet, Q3 data have been adjusted to reflect a movement of 15k “Fullrate Erhverv” RGUs from Consumer to Business
ARPU DKK/month
RGU net adds ‘000
TV
11
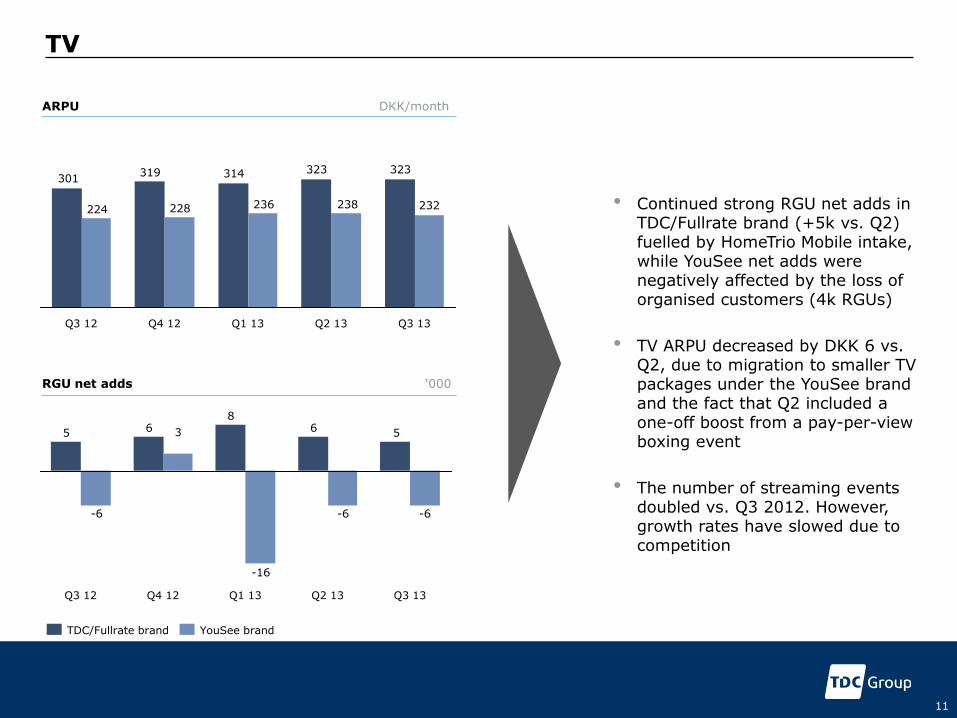
323323314319301
232238236228224
Q3 13 Q2 13 Q1 13 Q4 12 Q3 12
YouSee brand TDC/Fullrate brand
568
65
-6-6
-16
-6
Q3 13 Q2 13 Q1 13 Q4 12
3
Q3 12
• Continued strong RGU net adds in TDC/Fullrate brand (+5k vs. Q2) fuelled by HomeTrio Mobile intake, while YouSee net adds were negatively affected by the loss of organised customers (4k RGUs)
• TV ARPU decreased by DKK 6 vs. Q2, due to migration to smaller TV packages under the YouSee brand and the fact that Q2 included a one-off boost from a pay-per-view boxing event
• The number of streaming events doubled vs. Q3 2012. However, growth rates have slowed due to competition
ARPU DKK/month
RGU net adds ‘000
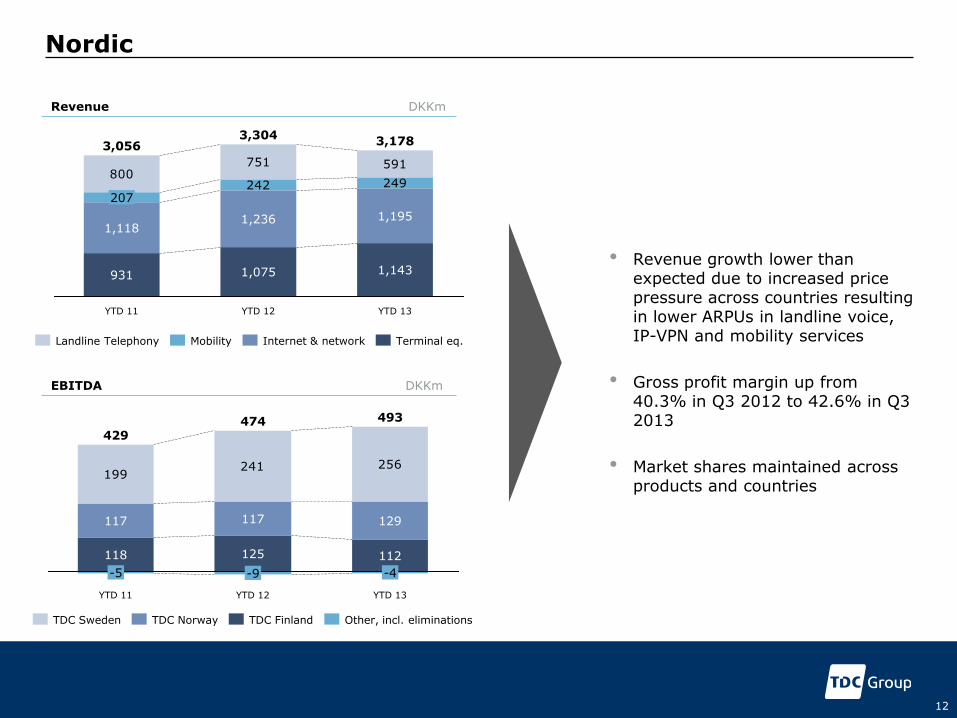
Nordic
Revenue DKKm
EBITDA DKKm
• Revenue growth lower than expected due to increased price pressure across countries resulting in lower ARPUs in landline voice, IP-VPN and mobility services
• Gross profit margin up from 40.3% in Q3 2012 to 42.6% in Q3 2013
• Market shares maintained across products and countries
242 249800
751 591
3,304
1,075
1,236
YTD 11
3,056
931
1,118
207
YTD 13
3,178
1,143
1,195
YTD 12
Terminal eq. Internet & network Mobility Landline Telephony
199241 256
YTD 13
493
-4
112
474
YTD 11
125
-5
429
YTD 12
117 129 117
118
-9
Other, incl. eliminations TDC Finland TDC Norway TDC Sweden
12

13
Group financials
Q3 2013

Revenue Bridge
14
2
Organic growth -2.0%
YTD growth
Q3 YTD
Organic growth -3.4%
1
Domestic mobility services
2013
-4.4%
6,069
Nordic 45
Domestic terminal equipment, etc. 37
Domestic TV 53
28
Domestic internet & network 35
Domestic landline 103
Regulatory 139
Acq/Div & Sale of assets 10
Forex 29
2012 6,348
-5.7%
18,456
180
111
181
150
70
322
527
32
35
19,568
1 Regulatory includes mobile termination rates regulation (voice and SMS), international roaming regulation and various fixed line regulation (ULL, leased line, BSA, VULA and fixed line interconnect) 2 Terminal equipment, etc. includes mobile and landline phones and equipment sales in Consumer and Business (incl. NetDesign), including sale of smart
phones without subsidies. In addition to terminal equipment, the category also contains eliminations and income from systems integration, installation work, operator service, service fees, and rental of masts
DKKm
(11.5%)
(3.1%)
(1.7%)
6.2%
(5.6%)
(5.4%)
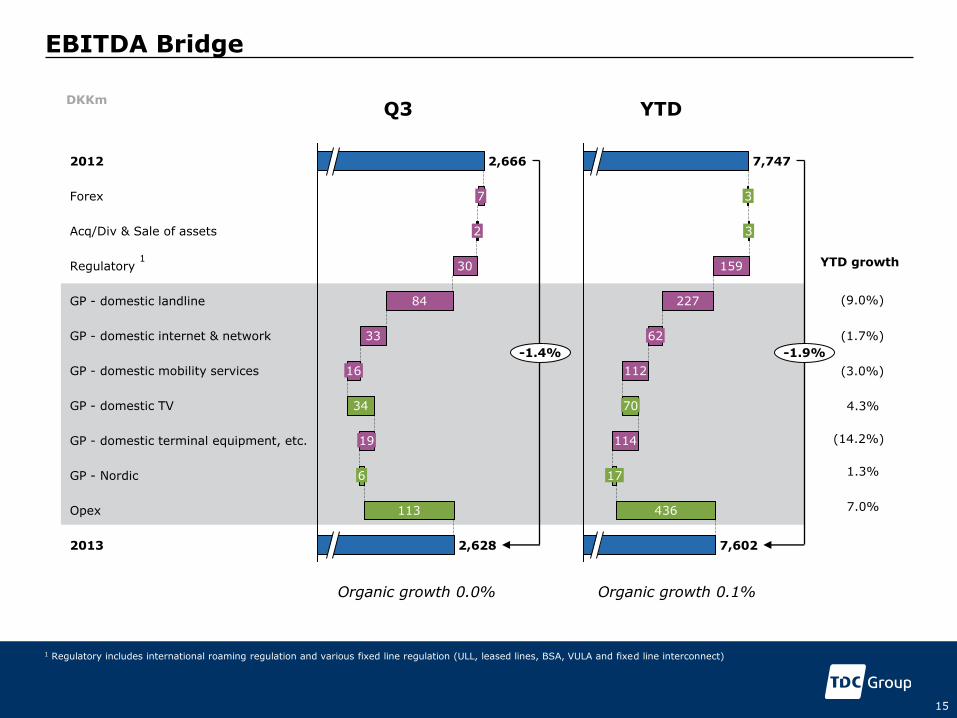
EBITDA Bridge
15
GP - domestic internet & network 33
GP - domestic landline 84
Regulatory 30
Acq/Div & Sale of assets 2
Forex 7
2012 2,666
GP - domestic TV 34
GP - domestic mobility services 16
-1.4%
2013 2,628
Opex 113
GP - Nordic 6
GP - domestic terminal equipment, etc. 19
Organic growth 0.0%
1 YTD growth
Organic growth 0.1%
-1.9%
7,602
436
17
114
70
112
62
227
159
3
3
7,747
DKKm
1 Regulatory includes international roaming regulation and various fixed line regulation (ULL, leased lines, BSA, VULA and fixed line interconnect)
(9.0%)
(3.0%)
(1.7%)
4.3%
(14.2%)
1.3%
7.0%
Q3 YTD

Domestic YoY organic gross profit
16
Landline DKKm
Mobility services DKKm
-16
-31
-65
-83
-74
Q3 13 Q2 13 Q1 13 Q4 12 Q3 12
TV DKKm
33
26
11
43
23
Q2 13 Q1 13 Q4 12 Q3 12 Q3 13 Q3 13
-117
-33
-84
Q2 13
-58
-18
-40
Q1 13
-114
-11
-103
Q4 12
-96
-43
-53
Q3 12
-107
-36
-71
I&N Landline telephony
• Positive development in mobility services driven by improved ARPU trends in both Business and Consumer
• Landline gross profit back on normal level after strong Q2
• Continued positive impact from TV gross profit

Opex & Capex
17
• Organic opex savings of 5.8% driven by considerable savings in external expenses of 10.3% as a result of optimised marketing spend, reduced consultancy costs and decreased contractors costs due to fewer faults
• FTEs and temps down 4.7% YoY
• Q3 2013 capex down 4.3% vs. Q3 2012. YTD capex spend on mobile network approx. 20% lower than expected due to Huawei negotiations
• Increased spending on remote DSLAMs to ensure higher broadband speed
• Continued large investment in customer installations, but at a slightly lower level than in 2012
2,581
2012
3,492
2013E
3,700
YTD 2013
2,516
YTD 2012 2011
3,421
Organic YoY opex savings DKKm
Capex DKKm
127
48
79
Q1 13
196
128
68
Q4 12
81
5
76
Q3 12
159
36
123
113
78
35
Q2 13 Q3 13
External expenses Wages & personnel related cost
7.6% 3.9% 9.1% 5.9% 5.8%
YoY change

Income Statement (extract form)
18
1 Incl. profit from joint ventures and associates as well as interest on pension assets
1
TDC Group DKKm
2012 2013 % 2012 2013 %
Revenue 6,348 6,069 (4.4) 19,568 18,456 (5.7)
Gross profit 4,599 4,448 (3.3) 13,946 13,390 (4.0)
Opex (1,933) (1,820) 5.8 (6,199) (5,788) 6.6
EBITDA 2,666 2,628 (1.4) 7,747 7,602 (1.9)
Depreciation, amortisation and impairment losses (1,235) (1,269) (2.8) (3,694) (3,707) (0.4)
Net financials (309) (215) 30.4 (708) (583) 17.7
Profit before tax 1,122 1,144 2.0 3,345 3,312 (1.0)
Income taxes (43) (267) NM (692) (401) 42.1
Profit for the period excl. special items 1,079 877 (18.7) 2,653 2,911 9.7
Profit for the period 1,134 600 (47.1) 3,120 2,333 (25.2)
Q3 YTD

Equity Free Cash Flow
19
+18.0%
2,637
Other 60
Special items 119
Capex 89
Income tax paid 21
Net interest paid 2
Change in NWC 257
EBITDA 145
YTD 2012 2,234
YTD 2013
1
Q3 growth
• Substantial YTD NWC improvement in receivables due to both changes in invoicing cycle and smartphone financing (transferred to external partner throughout 2012)
• Cash outflow from capex was DKKm 89m lower than in 2012
• Cash outflow from special items improved due to lower payment for redundancy programmes and vacant tenancies
DKKm
1 Including adjustment for non-cash items, pension contributions, payments related to provisions, realized currency translation adjustments and finance lease repayments
(38)
27
(105)
(3)
144
91
78

Guidance
20
• Revenue below our expectations mainly due to the low margin areas handset sales and Nordic
• Higher than expected opex savings compensate the minor gross profit shortfall; hence EBITDA guidance remain unchanged
• Huawei negotiations have delayed the expected step up in our mobile investments on 4G vs. 2012 levels; catch up expected in Q4
• EFCF growth supporting the guided DPS
Revised FY 2013 guidance on revenue; other guidance parameters remain unchanged
Revenue
EBITDA
Capex
DPS
DKK 25.0-25.5bn
DKK 10.0-10.2bn
DKK 3.7bn
DKK 3.70
2013 Guidance
DKK 24.5-25.0bn
Revised 2013 Guidance

Regulation
21
Price regulation Rates
• Regulatory adjustments on voice and SMS MTR continue in 2014 and 2015 but at a much lower level • New statements regarding level retail voice prices within the EU (‘Roam like at Home’). Such regulatory changes will impact TDC’s revenue related to roaming in the EU, but is not included in the data shown on the left side
2009 2010 2011 2012 2013 2014E 2015E
Voice MTR (DKK) 0.54 0.44 0.33 0.23 0.08 0.07 0.06
SMS MTR (DKK) 0.20 0.16 0.12 0.08 0.06 0.04
Data roaming (EUR) ~2.15 0.70 0.45 0.20
1 Non-regulated rates
1
1
Revenue loss DKKm Gross profit loss DKKm
2014E
200-300
2013E
~650
2012
485
2014E
100-125
2013E
~175
2012
123

22
Q&A

Appendix

New KPIs in TDC Factsheet
24
Share of ARPU from variable traffic %
TV KPIs %
Access lines KPIs %
40
50
55
30
35
0
45
75
70
65
60
Q2 12 Q1 12 Q4 11 Q3 11 Q2 11 Q1 11 Q3 12 Q3 13 Q2 13 Q4 12 Q1 13
Business mobile
Business landline
Residential mobile
Residential landline
21.5%
Q3 12 Q3 13
24.8% 23.5%
19.6%
Q3 11
19.1% 18.9%
Full service enabled RGUs Share of RGUs with entry level TV package only
31.4%
Q3 12
36.1%
27.0%
Q3 11
34.6%
19.0%
Q3 13
38.4%
YouSee brand dual play TDC brand triple play
487 394 329
PSTN-only base, in thousands
• Decreasing share of ARPUs from variable traffic; especially mobility services ARPUs are less dependent on volatile traffic
• Share of RGUs with entry level TV package only has increased since 2011 as downward migration in YouSee brand offset positive up sale in TDC brand
• Full service enabled RGUs increased and approx. 25% of Consumers TV RGUs now have a TV box
• Continued success in sales of bundled packages including both TV and BB. PSTN-only RGU base diminishes at a steady rate

Quarterly Revenue and EBITDA trends
25
1 Adjusted for regulation (mobile termination rates (voice and SMS), international roaming, PSTN resale), acquisitions/divestments, sales of assets, and FOREX
2 Adjusted for regulation (international roaming, PSTN resale), acquisitions/divestments, sales of assets, and FOREX
Reported YoY quarterly Revenue growth %
Reported YoY quarterly EBITDA growth %
Q3 13 Q2 13
(6.5)
Q1 13
(6.1)
Q4 12
(2.0)
Q3 12
(1.9)
(4.4)
Q3 13 Q2 13
(1.4)
Q1 13
(2.8)
Q4 12
(3.3)
Q3 12
(1.6) (1.4)
(1.1)
Q3 12
(0.7)
Q3 13 Q2 13
(4.4)
Q1 13
(3.8)
Q4 12
(2.0)
Q3 13 Q2 13
1.4
Q1 13
(1.1)
Q4 12
(3.0)
Q3 12
(0.2)
0.0
Organic2 YoY quarterly EBITDA growth %
Organic¹ YoY quarterly Revenue growth %

Estimated TDC Group Market Shares 1
26
1 Market shares for total market include residential and business. Market shares for landline voice, broadband and TV are based on number of lines and mobile voice is based on the number of SIM cards. Source: TDC Market Intelligence
2 Mobile subscriptions (excl. prepaid cards)
Landline Telephony %
Mobility Services %
70%
Q4 12
70%
Q3 12
71%
Q3 13
69%
Q2 13
69%
Q1 13 Q3 13
60%
Q2 13
60%
Q1 13
60%
Q4 12
61%
Q3 12
61%
Q3 13
43%
Q2 13
43%
Q1 13
43%
Q4 12
44%
Q3 12
44%
Q3 13
52%
Q2 13
52%
Q1 13
52%
Q4 12
52%
Q3 12
52%
Broadband %
TV % 2