Embed Size (px)
Citation preview
Interim Flood Preparedness Plan
Revised August 2005
Interim Flood Preparedness Plan
Lake Dunlap, Lake McQueeney, Lake Placid and Meadow Lake (Nolte)
Prepared by the Guadalupe-Blanco River Authority in cooperation with Preserve Lake Dunlap Association, Friends of Lake
McQueeney, Citizens United for Lake Placid, Meadow Lake Homeowners, the City of Seguin, Guadalupe County, Comal
County, and KWED Radio Station
November 1, 2000 Updated November 2004
Revised August 2005
It is recommended that this plan be reviewed annually, in February.
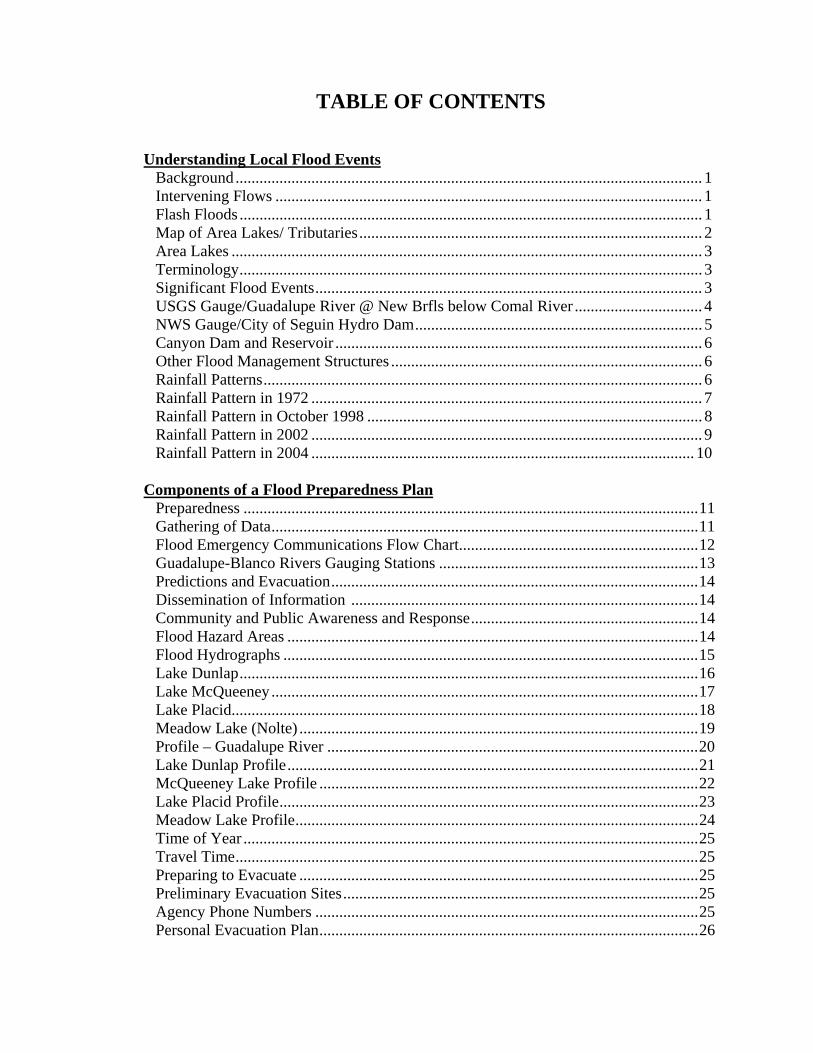
TABLE OF CONTENTS Understanding Local Flood Events
Background..................................................................................................................... 1 Intervening Flows ........................................................................................................... 1 Flash Floods .................................................................................................................... 1 Map of Area Lakes/ Tributaries...................................................................................... 2 Area Lakes ...................................................................................................................... 3 Terminology.................................................................................................................... 3 Significant Flood Events................................................................................................. 3 USGS Gauge/Guadalupe River @ New Brfls below Comal River ................................ 4 NWS Gauge/City of Seguin Hydro Dam........................................................................ 5 Canyon Dam and Reservoir ............................................................................................ 6 Other Flood Management Structures .............................................................................. 6 Rainfall Patterns.............................................................................................................. 6
Rainfall Pattern in 1972 .................................................................................................. 7 Rainfall Pattern in October 1998 .................................................................................... 8 Rainfall Pattern in 2002 .................................................................................................. 9 Rainfall Pattern in 2004 ................................................................................................ 10 Components of a Flood Preparedness Plan Preparedness ..................................................................................................................11 Gathering of Data...........................................................................................................11
Flood Emergency Communications Flow Chart............................................................12 Guadalupe-Blanco Rivers Gauging Stations .................................................................13 Predictions and Evacuation............................................................................................14 Dissemination of Information .......................................................................................14
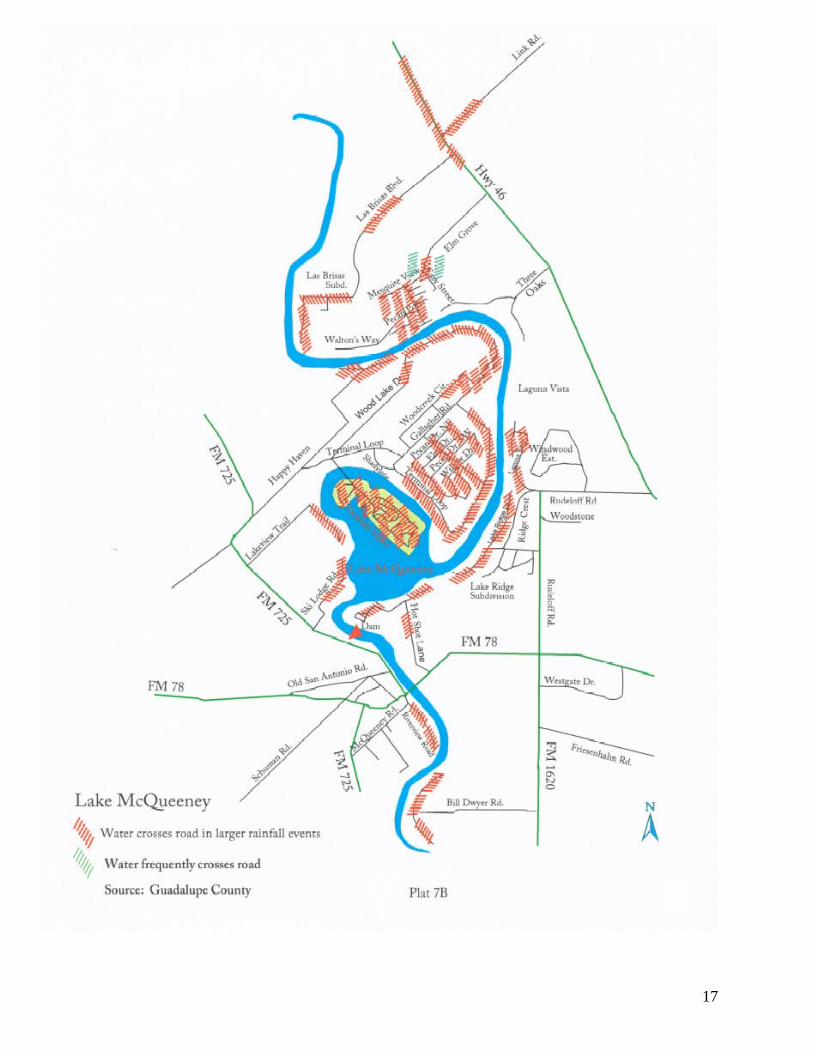
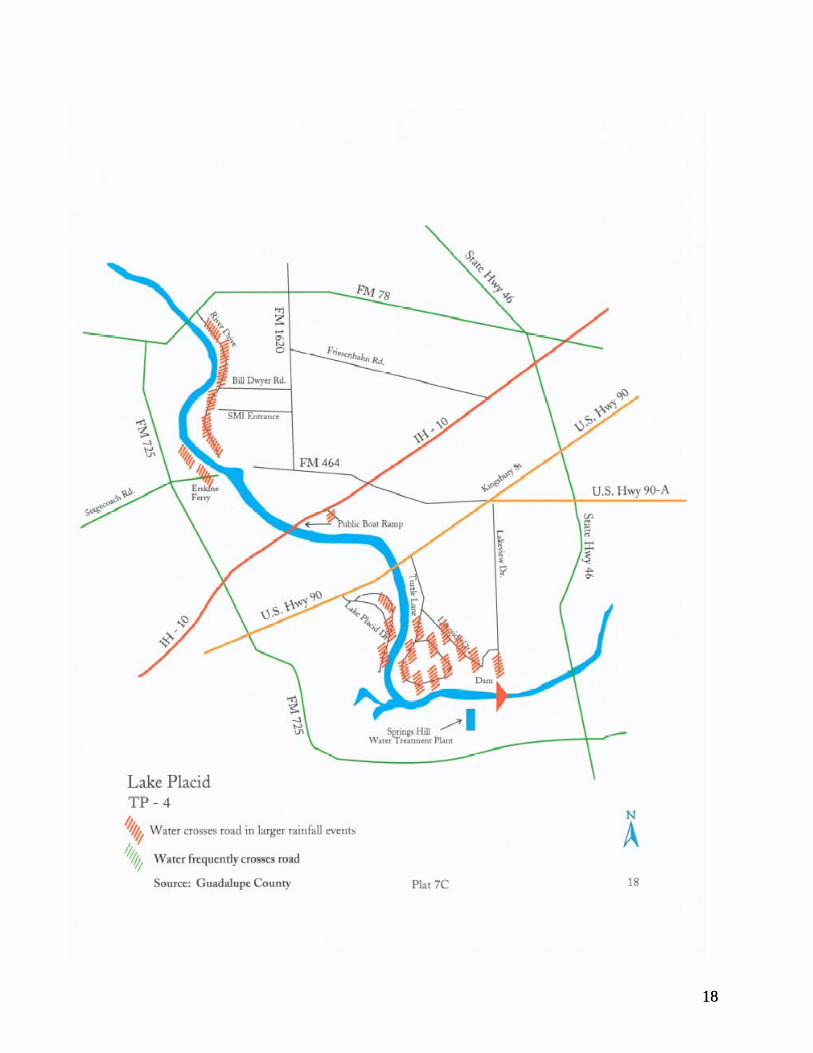
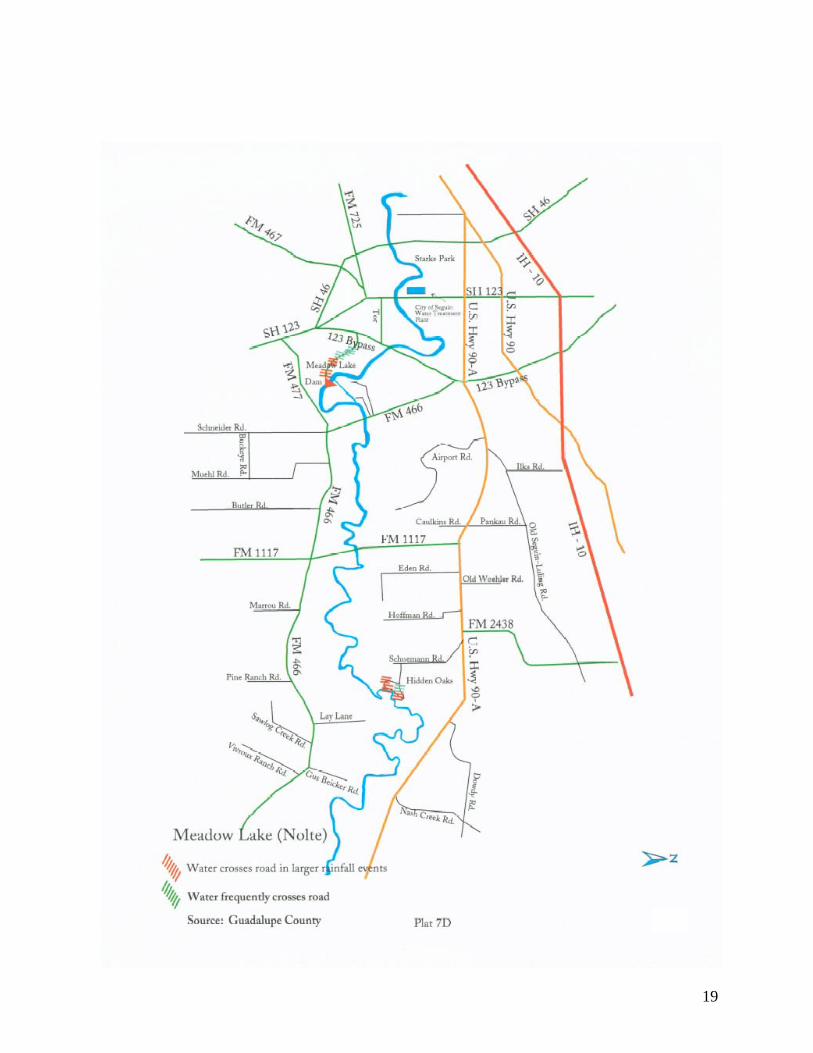
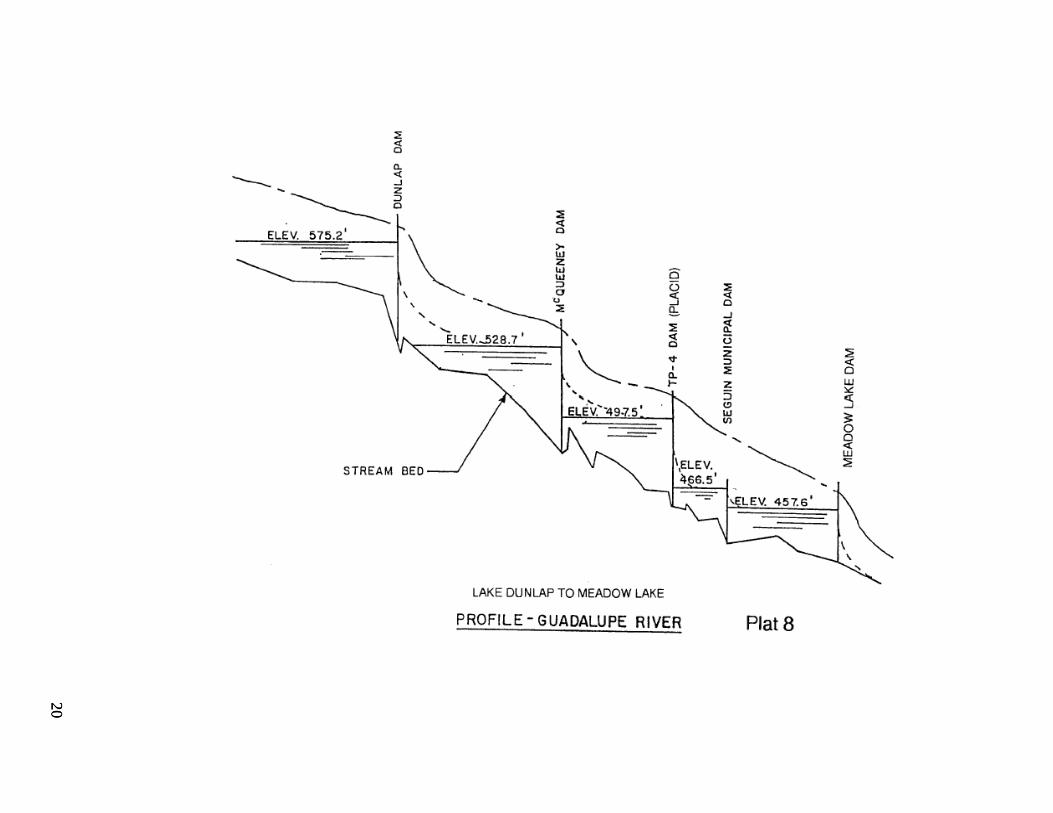
Community and Public Awareness and Response.........................................................14 Flood Hazard Areas .......................................................................................................14 Flood Hydrographs ........................................................................................................15 Lake Dunlap...................................................................................................................16 Lake McQueeney ...........................................................................................................17 Lake Placid.....................................................................................................................18 Meadow Lake (Nolte) ....................................................................................................19 Profile – Guadalupe River .............................................................................................20 Lake Dunlap Profile.......................................................................................................21 McQueeney Lake Profile ...............................................................................................22 Lake Placid Profile.........................................................................................................23 Meadow Lake Profile.....................................................................................................24 Time of Year ..................................................................................................................25 Travel Time....................................................................................................................25 Preparing to Evacuate ....................................................................................................25 Preliminary Evacuation Sites.........................................................................................25 Agency Phone Numbers ................................................................................................25 Personal Evacuation Plan...............................................................................................26
The Interim Flood Tracking Map Plats and Exhibits
Hill County Hydrograph Map of Area Lakes----Plat 1 Historic Floods---Plats 2 and 2A Rainfall Patterns---Plats 3, 4, 4A and 4B Flow of Information---Plat 5 U.S.G.S. Gauges---Plat 6 Flood Hazard Areas
Plats 7A, 7B, 7C, 7D Lake Profiles
Plats 8, 8A, 8B, 8C, 8D
Understanding Local Flood Events Background This plan is being prepared as an interim measure while additional education and research can be completed toward an improved plan for flood warning, awareness, and preparedness. The areas included in this plan include the reach of the Guadalupe River from the City of New Braunfels to just downstream of the City of Seguin. This area includes a number of small lakes created in the early 1930’s for hydroelectric generation.
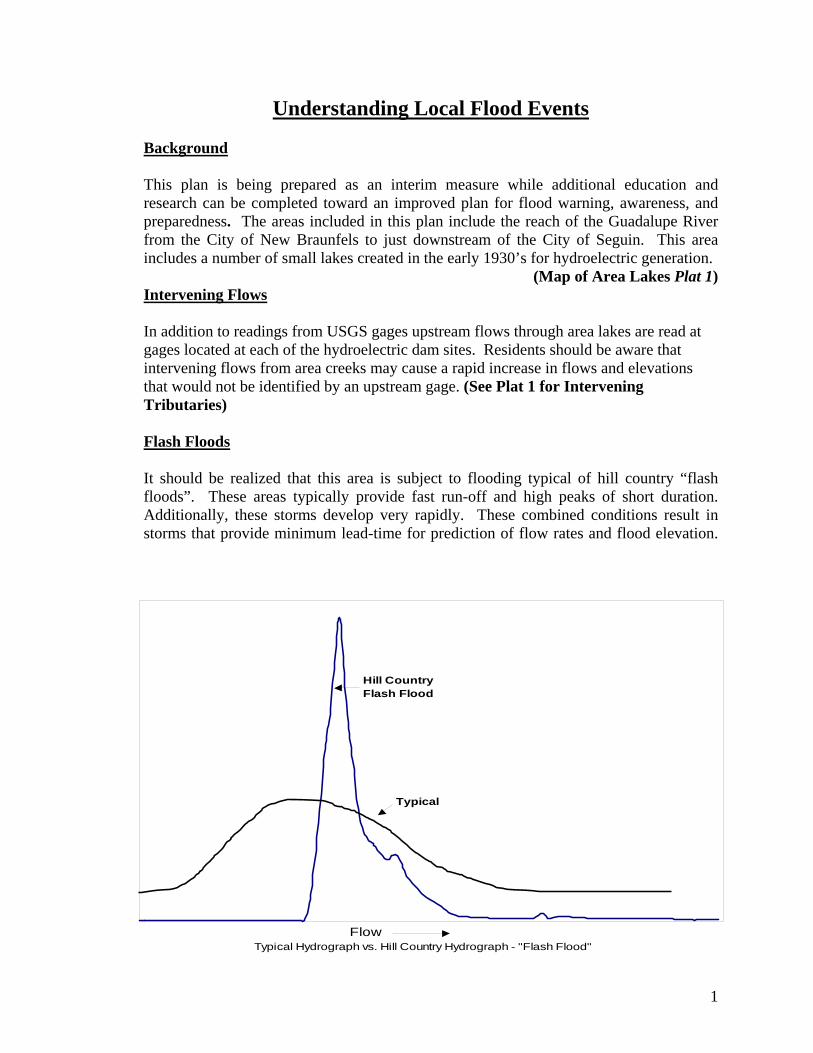
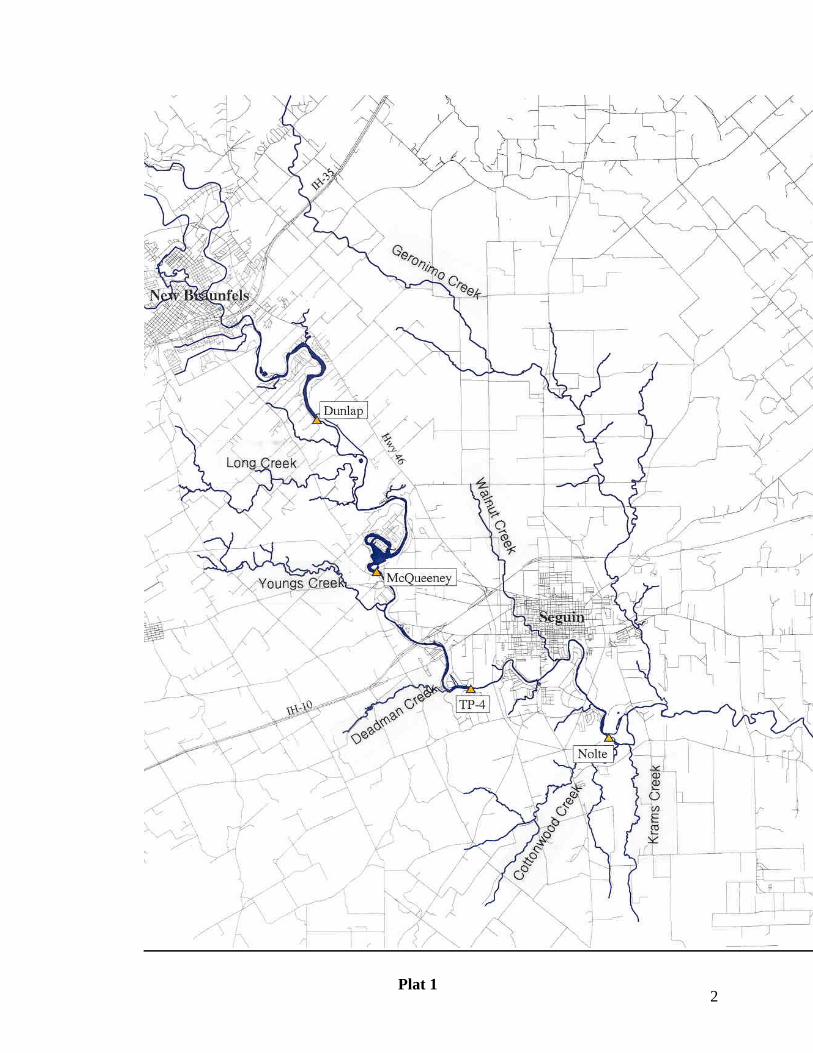
(Map of Area Lakes Plat 1) Intervening Flows In addition to readings from USGS gages upstream flows through area lakes are read at gages located at each of the hydroelectric dam sites. Residents should be aware that intervening flows from area creeks may cause a rapid increase in flows and elevations that would not be identified by an upstream gage. (See Plat 1 for Intervening Tributaries) Flash Floods It should be realized that this area is subject to flooding typical of hill country “flash floods”. These areas typically provide fast run-off and high peaks of short duration. Additionally, these storms develop very rapidly. These combined conditions result in storms that provide minimum lead-time for prediction of flow rates and flood elevation.
Typical
Hill CountryFlash Flood
Typical Hydrograph vs. Hill Country Hydrograph - "Flash Flood"Flow
1
Plat 1 2
Area Lakes It should also be recognized that the hydroelectric lakes, which were constructed in the 1920’s and 1930’s, do not contain flood protection benefits. These lakes impound a relatively small volume of water in comparison to large flood events. Due to the relatively “flat” topography (very little change in elevation) this area is not suited for large, deep flood control reservoirs. Instead, management of the flood plain by local government entities in cooperation with the Federal Emergency Management Administration and the Federal Flood Plain Act is the primary method for protection of life and property. Terminology CFS (cubic foot per second) is a term used to describe a rate of flow and is considered a
velocity. Since most of this area involves the impoundment of waters in the small lakes, the rate of flow is hard for the observer to distinguish in normal conditions. The local hydroelectric lakes can pass approximately 1,000 to 1,300 cfs though the generators with little noticeable difference in the velocity of the lake.
Foot in Rise should not be used to define flood flows unless referring to a specific
location with a known base elevation (datum). Many flood-monitoring gauges are read in cfs, and in feet above an established datum.
The County EMC is the Emergency Management Coordinator for the county, appointed
by the respective County Commissioners Court as the point of contact and “manager” during any disaster, including a flood. A city may also appoint a city co-ordinator.
The National Weather Service (NWS) is the federal agency with primary responsibility to
issue weather advisories and alerts. The United States Geological Survey (USGS) is the federal agency that provides stream
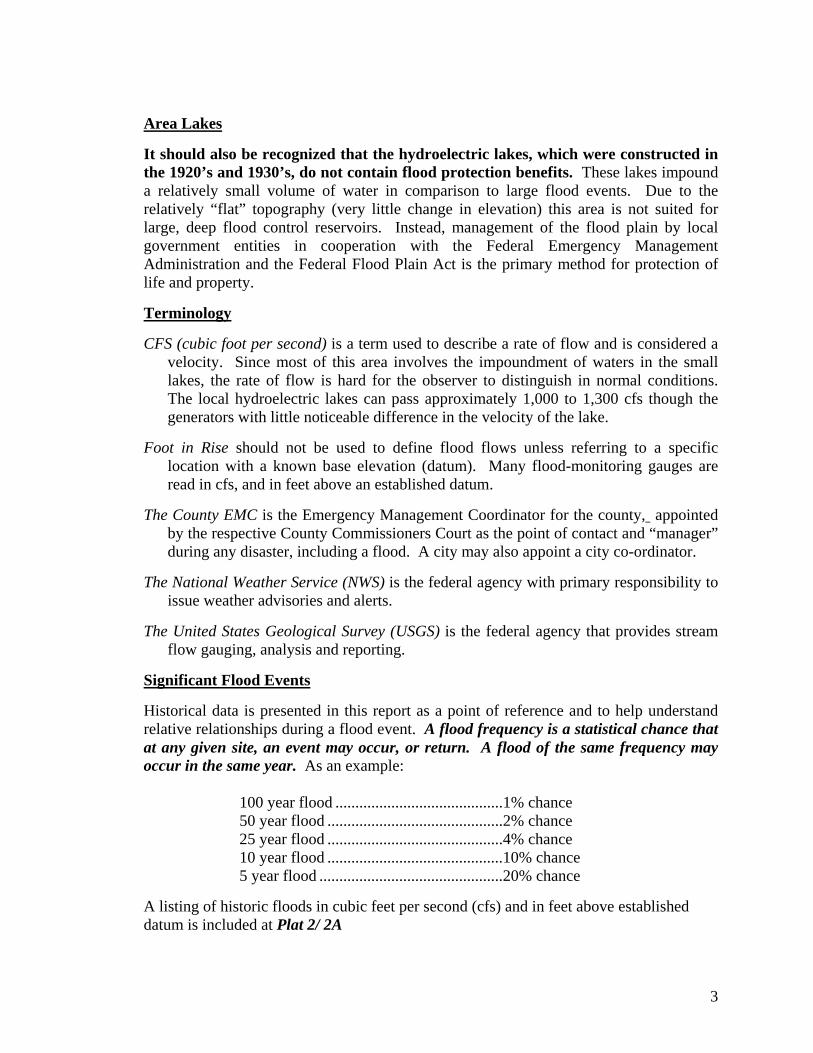
flow gauging, analysis and reporting. Significant Flood Events Historical data is presented in this report as a point of reference and to help understand relative relationships during a flood event. A flood frequency is a statistical chance that at any given site, an event may occur, or return. A flood of the same frequency may occur in the same year. As an example: 100 year flood ..........................................1% chance 50 year flood ............................................2% chance 25 year flood ............................................4% chance 10 year flood ............................................10% chance 5 year flood ..............................................20% chance A listing of historic floods in cubic feet per second (cfs) and in feet above established datum is included at Plat 2/ 2A
3
Reference Levels Flood HistoryRailroad trestle & foot bridge - 45.00' 45
441,260 cfs2nd floor of Pepperell Mills power house - 42.00' 360,945 cfs
Top of channel (right side) - 40.00' 40 280,630 cfs39.50' Dec 13, 1913
200,315 cfs 38.54' Oct 17, 199836.55' May 11, 1972
120,000 cfs35 35.00' Jun 15, 1935
95,000 cfs33.50' Jul 3, 1932
Widespread residential flooding 77,500 cfs 32.00' Sept 10, 1952 from New Braunfels to Seguin - 30.00' 30 64,000 cfs
29.66' Jul 6, 200253,700 cfs 28.60' Sep 10, 1921
27.20' Sep 17, 191545,000 cfs 25.70' Aug 23, 1919
2539,300 cfs
22.40' Apr 22, 1929Flood Stage; Homes along Dunlap 33,600 cfs 22.00' Oct 21, 1959 & McQueeney Lakes 22.24' Nov 22, 2004 Flooded - 20.00' 20 28,600 cfs
23,500 cfs17' some road closures 17.23' Jun 9, 2004 (26,000 cfs @ Dunlap dam)
18,600 cfs15 15.11' May 5, 1993
10,900 cfs 14.08' Mar 4, 1992 Flood Stage - 13.00' 13.3' Oct 2, 2004
5,060 cfsExtreme Danger 11.94' May 15, 1994Warning (Flooding) 10 830 cfs 10.06' Nov 1, 1995 CautionNormal Range
Datum = 572.55'
5 USGS Gauge
Plat 2
Gauge Reference Levels & Historical Floods
Guadalupe River @ New Braunfelsbelow Comal River
4
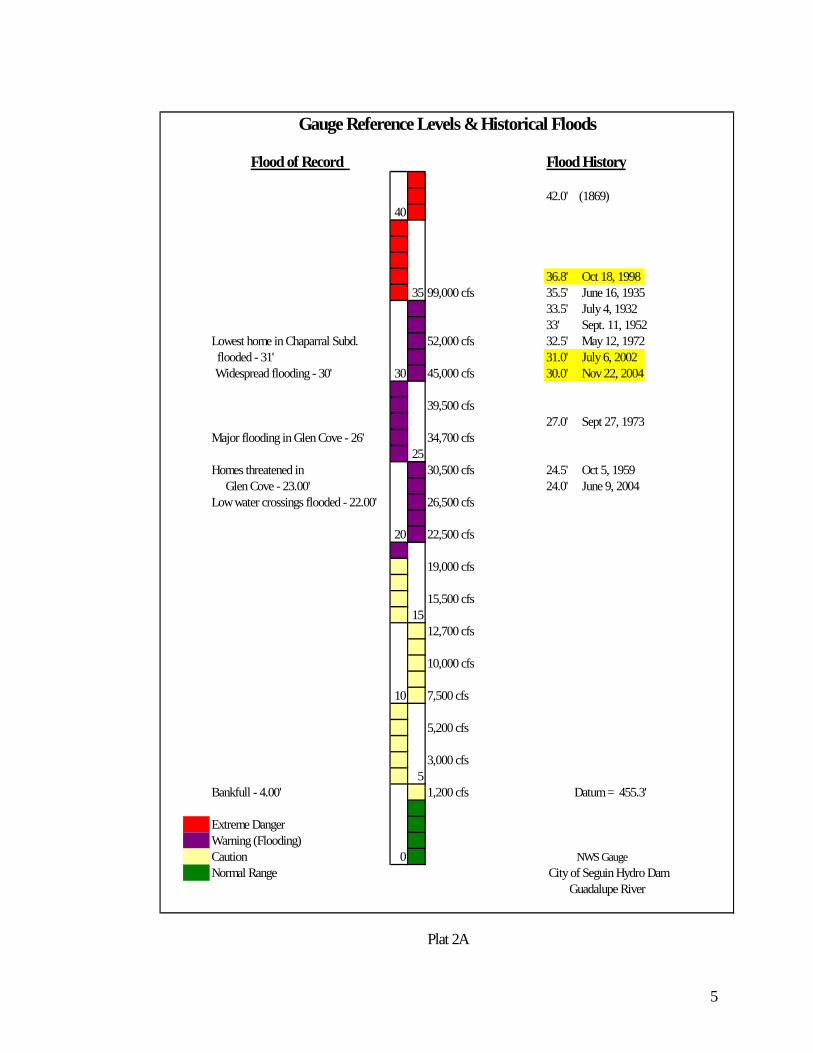
Flood of Record Flood History
42.0' (1869)40
36.8' Oct 18, 199835 99,000 cfs 35.5' June 16, 1935
33.5' July 4, 193233' Sept. 11, 1952
Lowest home in Chaparral Subd. 52,000 cfs 32.5' May 12, 1972 flooded - 31' 31.0' July 6, 2002Widespread flooding - 30' 30 45,000 cfs 30.0' Nov 22, 2004
39,500 cfs27.0' Sept 27, 1973
Major flooding in Glen Cove - 26' 34,700 cfs25
Homes threatened in 30,500 cfs 24.5' Oct 5, 1959 Glen Cove - 23.00' 24.0' June 9, 2004Low water crossings flooded - 22.00' 26,500 cfs
20 22,500 cfs
19,000 cfs
15,500 cfs15
12,700 cfs
10,000 cfs
10 7,500 cfs
5,200 cfs
3,000 cfs5
Bankfull - 4.00' 1,200 cfs Datum = 455.3'
Extreme DangerWarning (Flooding)Caution 0 NWS GaugeNormal Range
Plat 2A
Gauge Reference Levels & Historical Floods
City of Seguin Hydro DamGuadalupe River
5
Canyon Dam and Reservoir Canyon Reservoir, located on the Guadalupe River, upstream in Comal County is the only flood control reservoir in the Guadalupe River Basin. It is operated by the U. S. Army Corps of Engineers for flood control purposes, with the Guadalupe-Blanco River Authority operating the water supply portion of the reservoir for water supply purposes under permits issued by the Texas Natural Resource Conservation Commission.
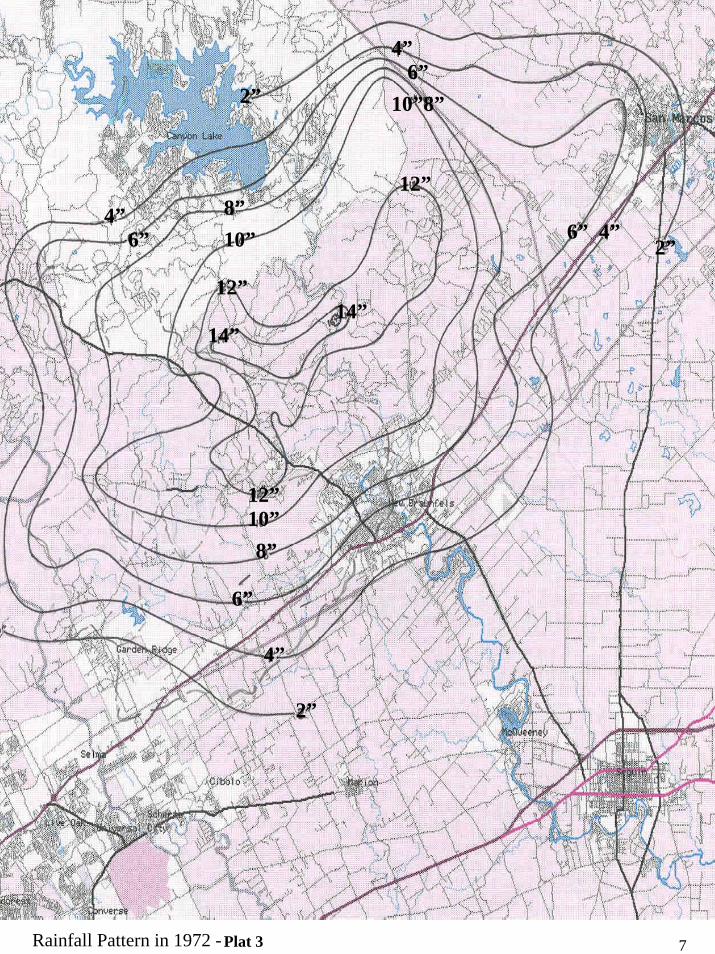
Other Flood Management Structures Several smaller flood retarding structures have also been constructed upstream on tributaries of the Guadalupe River, and several more are under consideration. These small structures may reduce the peak flows of some floods, however, they store only small volumes of water that is passed downstream or recharged slowly into the Edwards Aquifer. While these structures provide substantial flood protection benefits, major rainfall events have occurred below these structures in 1972 and 1998. High rainfall and flood conditions also occurred in 1973 and 1991. Additionally, increased development has resulted in increased run-off from roof tops, parking lots, and other conversions of pastureland to hard-surface uses. Rainfall Patterns Rainfall patterns of flood events of 1972, 1998, 2002 and 2004 are illustrated on Plats 3, 4, 4A and 4B.
6
2”
4”
6”
8”10”12”
14”14”
12”
12”
10”
10”8”
8”6”
4”
6”4”
2”
6” 4”2”
Rainfall Pattern in 1972 - 7Plat 3
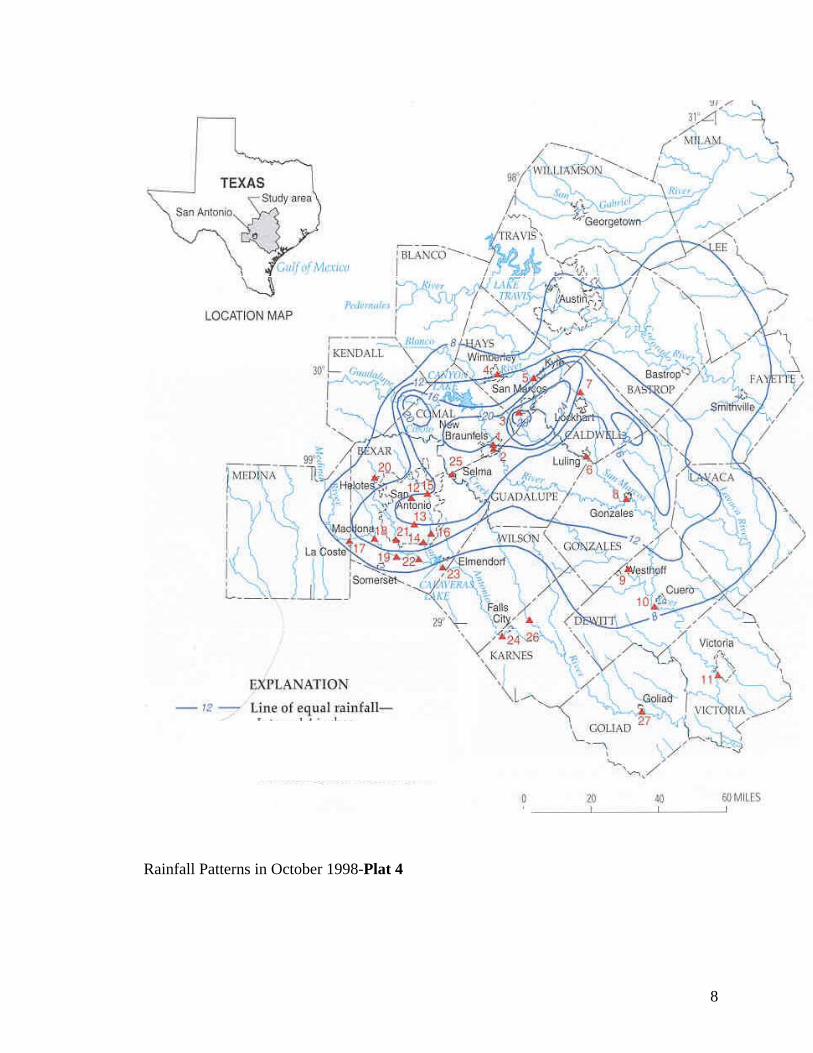
Rainfall Patterns in October 1998-Plat 4
8
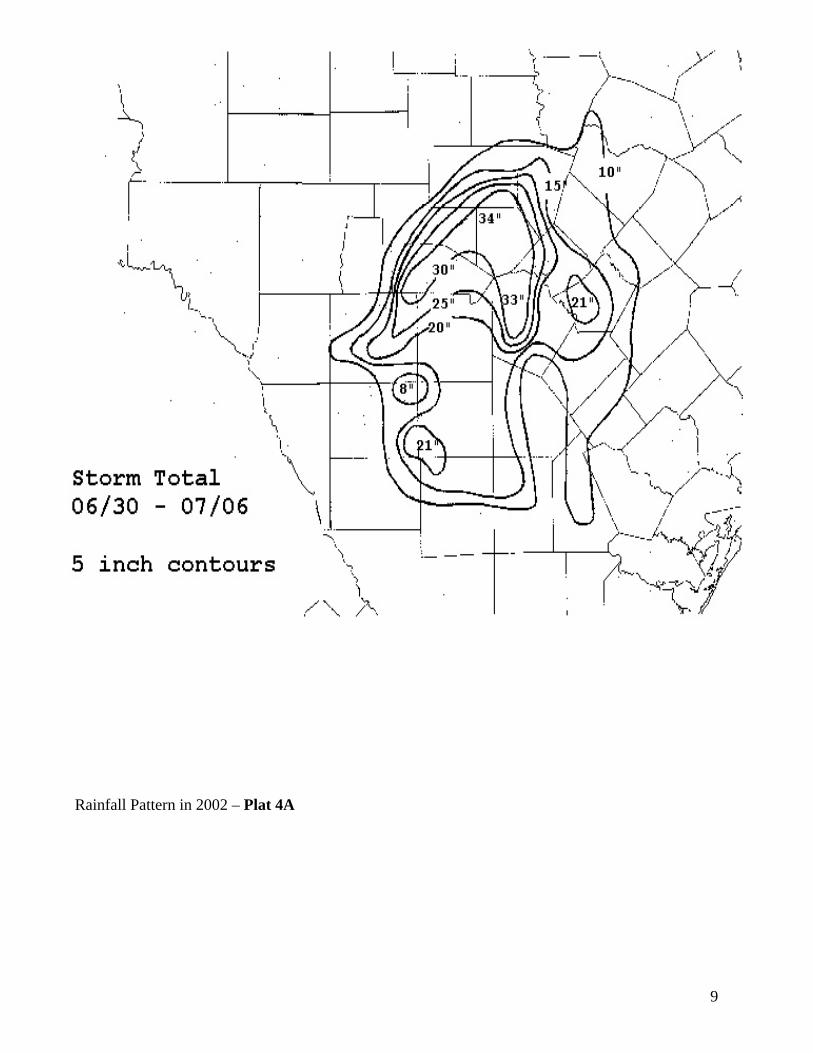
Rainfall Pattern in 2002 – Plat 4A
9
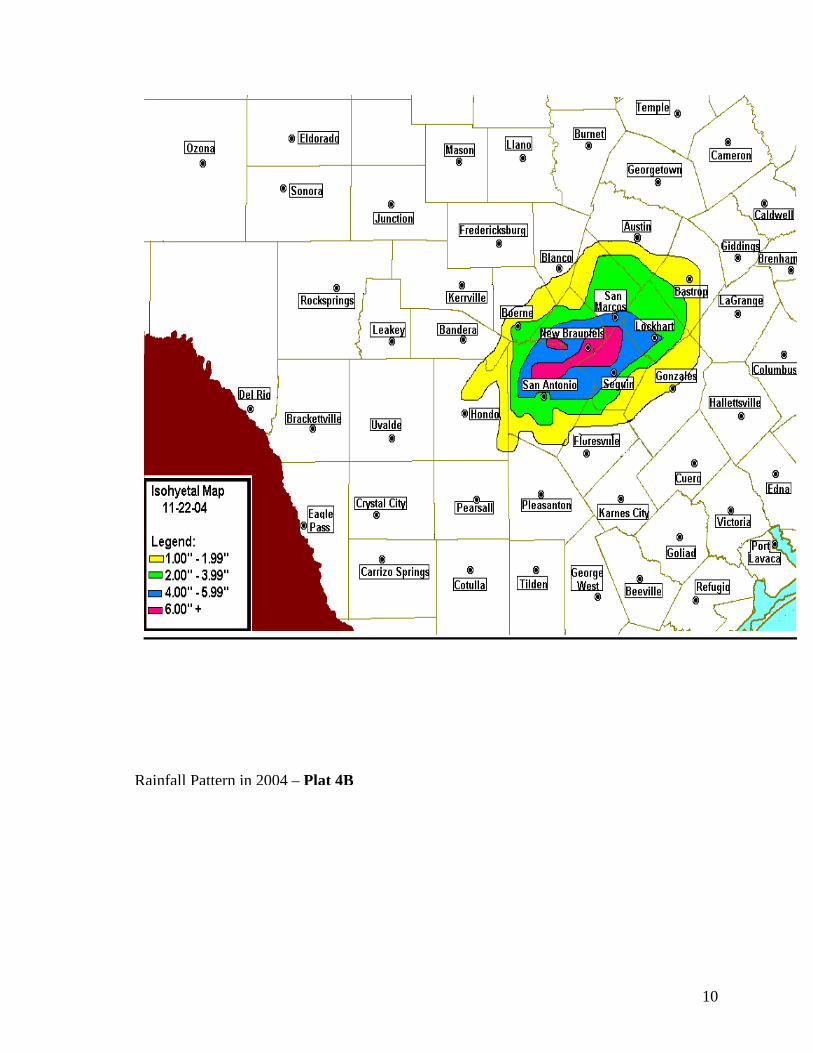
Rainfall Pattern in 2004 – Plat 4B
10
Components of a Flood Preparedness Plan
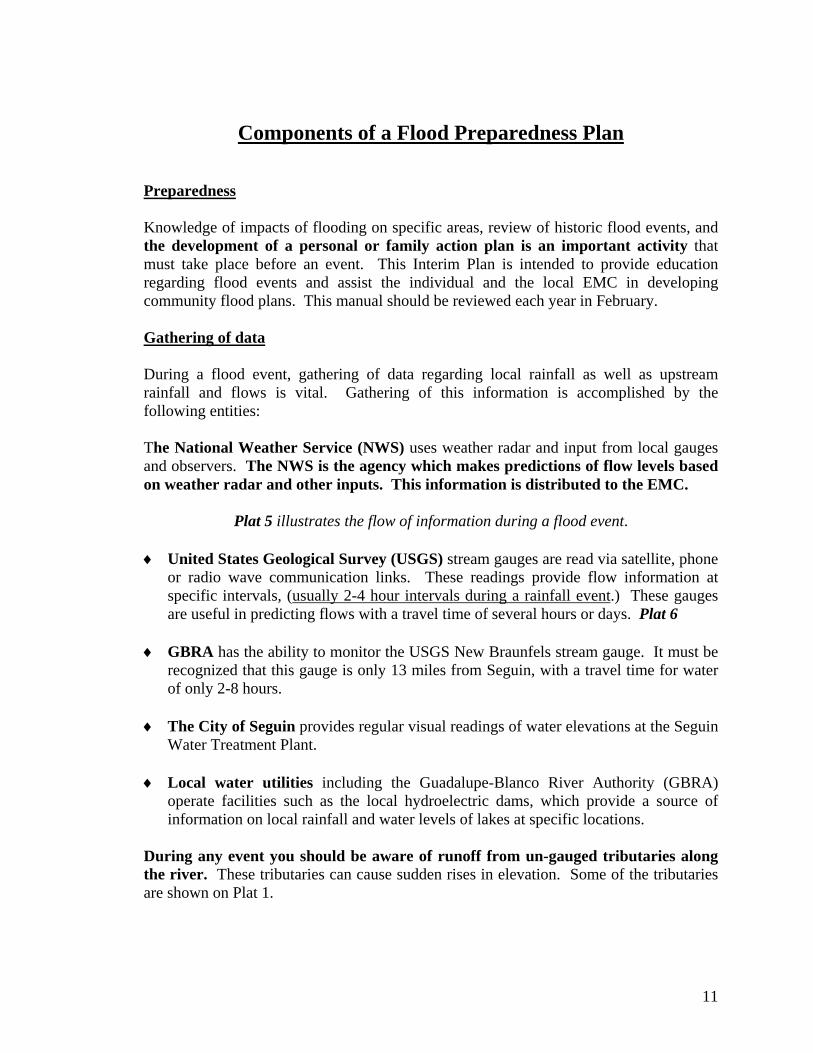
Preparedness Knowledge of impacts of flooding on specific areas, review of historic flood events, and the development of a personal or family action plan is an important activity that must take place before an event. This Interim Plan is intended to provide education regarding flood events and assist the individual and the local EMC in developing community flood plans. This manual should be reviewed each year in February. Gathering of data During a flood event, gathering of data regarding local rainfall as well as upstream rainfall and flows is vital. Gathering of this information is accomplished by the following entities: The National Weather Service (NWS) uses weather radar and input from local gauges and observers. The NWS is the agency which makes predictions of flow levels based on weather radar and other inputs. This information is distributed to the EMC.
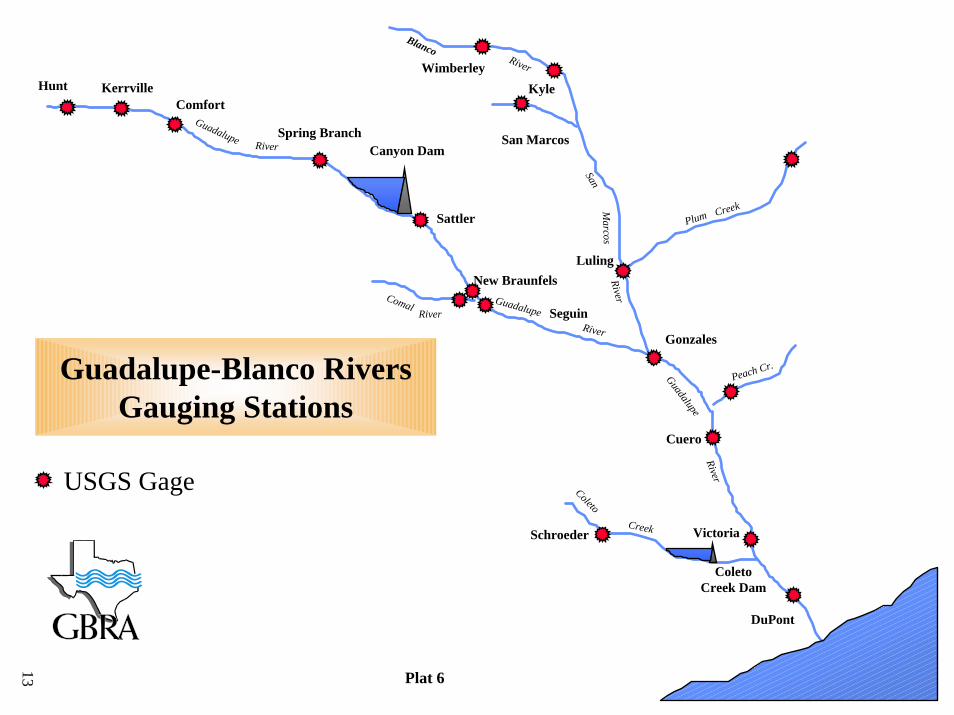
Plat 5 illustrates the flow of information during a flood event. ♦ United States Geological Survey (USGS) stream gauges are read via satellite, phone
or radio wave communication links. These readings provide flow information at specific intervals, (usually 2-4 hour intervals during a rainfall event.) These gauges are useful in predicting flows with a travel time of several hours or days. Plat 6
♦ GBRA has the ability to monitor the USGS New Braunfels stream gauge. It must be
recognized that this gauge is only 13 miles from Seguin, with a travel time for water of only 2-8 hours.
♦ The City of Seguin provides regular visual readings of water elevations at the Seguin
Water Treatment Plant. ♦ Local water utilities including the Guadalupe-Blanco River Authority (GBRA)
operate facilities such as the local hydroelectric dams, which provide a source of information on local rainfall and water levels of lakes at specific locations.
During any event you should be aware of runoff from un-gauged tributaries along the river. These tributaries can cause sudden rises in elevation. Some of the tributaries are shown on Plat 1.
11
Flood Emergency Communications Flow Chart
GBRAAM 1580
KWED
Emergency AlertNOAA
EMCNational Weather Service Field Office General Public
City/County Officials
Police/Sheriff’s Department
National Weather Service River Forecast Center (Fort Worth Office)
U.S. Army Corps of Engineers
United StatesGeological Survey
Rainfall Observers
Plat 512
HuntComfort
Spring BranchCanyon Dam
New Braunfels
Gonzales
Luling
WimberleyKyle
Cuero
Schroeder
ColetoCreek Dam
Victoria
DuPont
Kerrville
Sattler
Seguin
San Marcos
ComalRiver
Guadalupe River
BlancoRiver
SanM
arcosRiverGuadalupe
River
Plum Creek
River
Guadalupe
Coleto
Creek
18 hrs
6 hrs.
6 hrs.
24
24 hrs.
2 days
2rs
6 hrs
2 days
2dys
1 day
Guadalupe-Blanco RiversGauging Stations
USGS Gage
24 hrs.
6hrs.
Peach Cr.
Plat 6
13
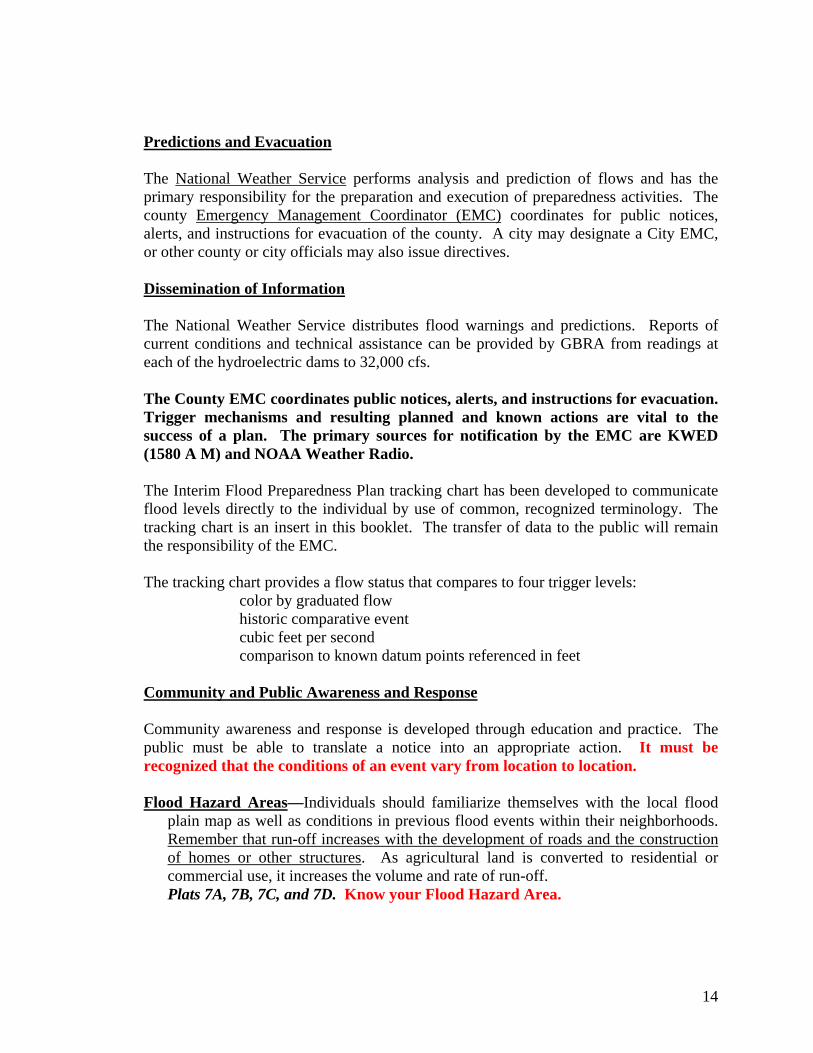
Predictions and Evacuation The National Weather Service perfprimary responsibility for the preparcounty Emergency Management Calerts, and instructions for evacuatioor other county or city officials may Dissemination of Information The National Weather Service distrcurrent conditions and technical asseach of the hydroelectric dams to 32, The County EMC coordinates pubTrigger mechanisms and resultinsuccess of a plan. The primary s(1580 A M) and NOAA Weather R The Interim Flood Preparedness Plaflood levels directly to the individuatracking chart is an insert in this bothe responsibility of the EMC. The tracking chart provides a flow st color by graduated flo historic comparative e cubic feet per second comparison to known Community and Public Awareness Community awareness and responsepublic must be able to translate arecognized that the conditions of a Flood Hazard Areas—Individuals
plain map as well as conditions Remember that run-off increasesof homes or other structures. commercial use, it increases the vPlats 7A, 7B, 7C, and 7D. Know
orms analysis and prediction of flows and has the ation and execution of preparedness activities. The oordinator (EMC) coordinates for public notices, n of the county. A city may designate a City EMC, also issue directives.
ibutes flood warnings and predictions. Reports of istance can be provided by GBRA from readings at 000 cfs.
lic notices, alerts, and instructions for evacuation. g planned and known actions are vital to the ources for notification by the EMC are KWED adio.
n tracking chart has been developed to communicate l by use of common, recognized terminology. The
oklet. The transfer of data to the public will remain
atus that compares to four trigger levels: w vent
datum points referenced in feet
and Response
is developed through education and practice. The notice into an appropriate action. It must be
n event vary from location to location.
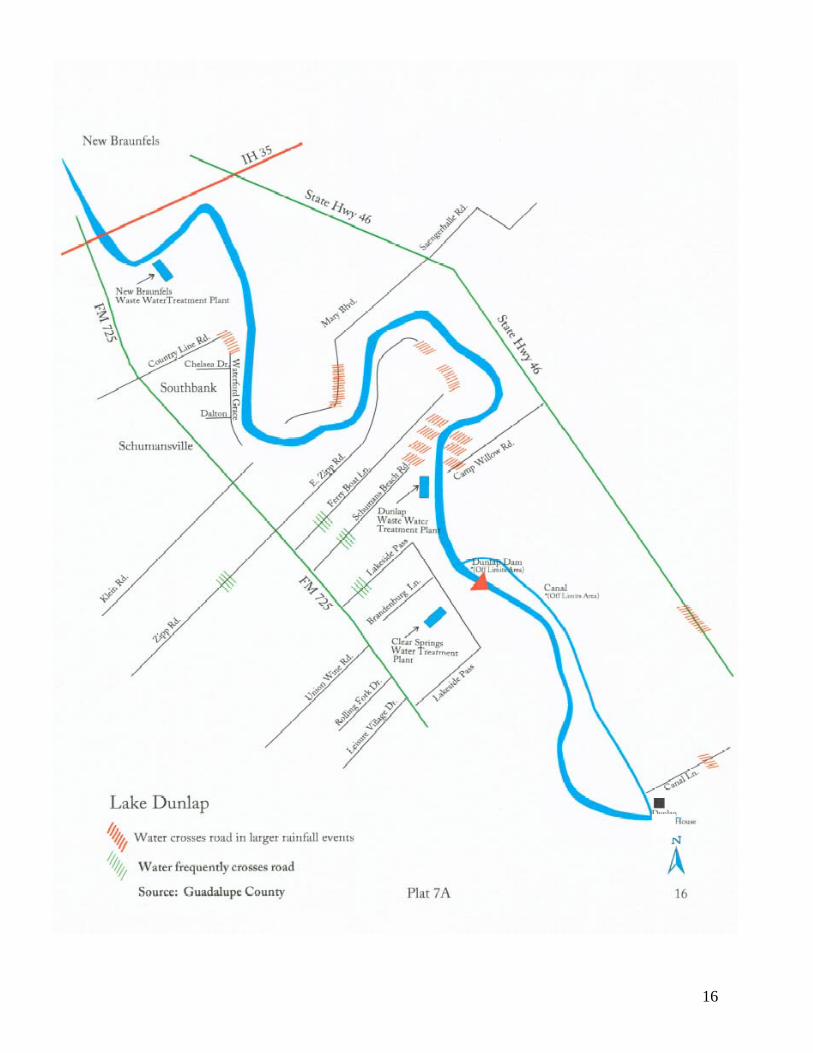
should familiarize themselves with the local flood in previous flood events within their neighborhoods. with the development of roads and the construction As agricultural land is converted to residential or olume and rate of run-off. your Flood Hazard Area.
14
Flood Hydrograph on Each Lake---It is important that you familiarize yourself with the area of the river or lake you live on. As water flows “downhill” in a flood event, it may be higher in elevation at the upper end of a lake than at the dam location. Flow characteristics for various frequency floods have been developed for each area lake. Arbitrary “zones” have been designed by dividing each lake into approximate 1/3’s by length. You should review these Flood Profiles. If you are given an elevation reading at a point downstream, it is important to know what it means at your specific location. Lake Profile - Plats 8, 8A, 8B, 8C, 8D
15
16
17
18 18
19
20 20
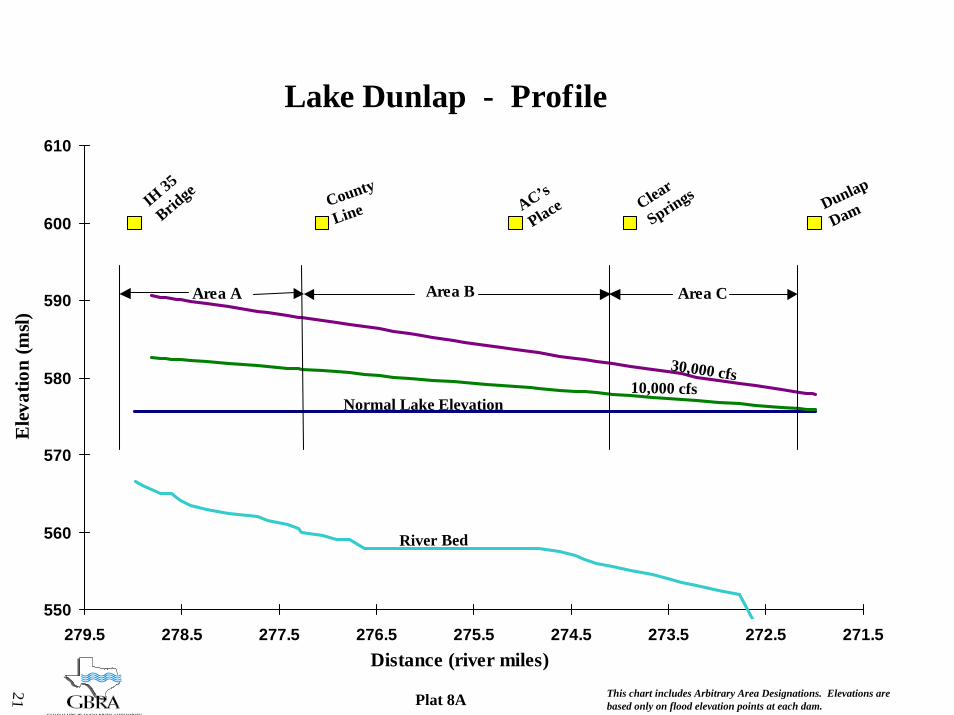
Lake Dunlap - Profile
550
560
570
580
590
600
610
271.5272.5273.5274.5275.5276.5277.5278.5279.5Distance (river miles)
Ele
vatio
n (m
sl)
Area CArea BArea A
River Bed
Normal Lake Elevation10,000 cfs
30,000 cfs
IH 35
Bridge County
Line AC’s
Place Clear
Springs Dunlap
Dam
This chart includes Arbitrary Area Designations. Elevations arebased only on flood elevation points at each dam.Plat 8A
21
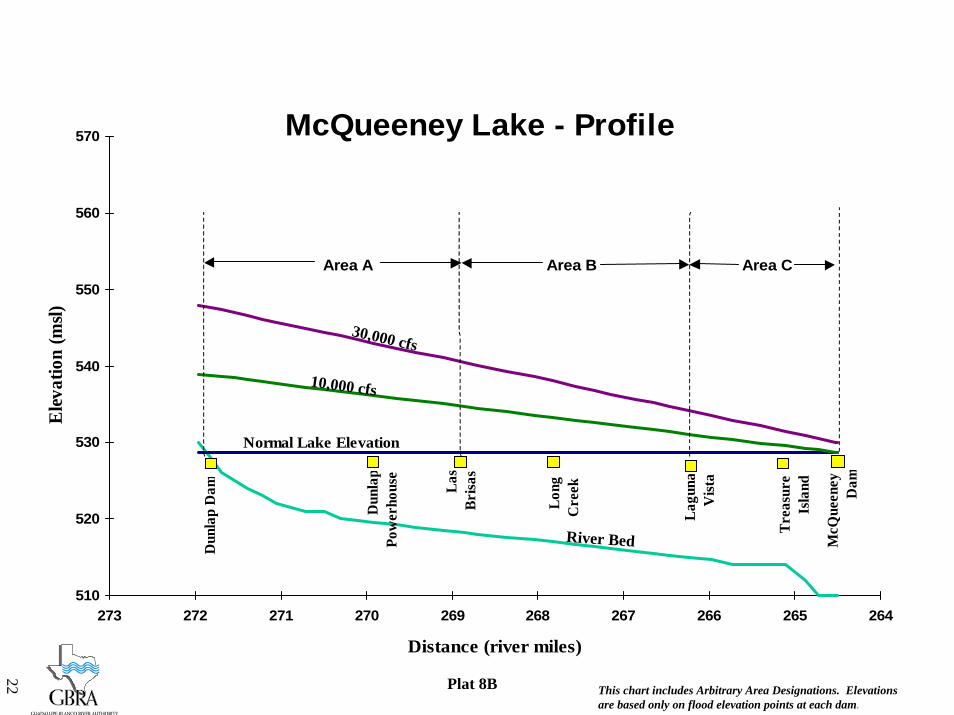
McQueeney Lake - Profile
510
520
530
540
550
560
570
264265266267268269270271272273
Distance (river miles)
Ele
vatio
n (m
sl)
Area A Area C
Dun
lap
Dam
Dun
lap
Pow
erho
use
Las
Brisa
s
Long
Cre
ek
Lagu
n aV
ista
Trea
sure
Isla
nd
McQ
ueen
ey
Da m
Area B
Normal Lake Elevation
10,000 cfs
River Bed
30,000 cfs
This chart includes Arbitrary Area Designations. Elevations are based only on flood elevation points at each dam.
Plat 8B
22
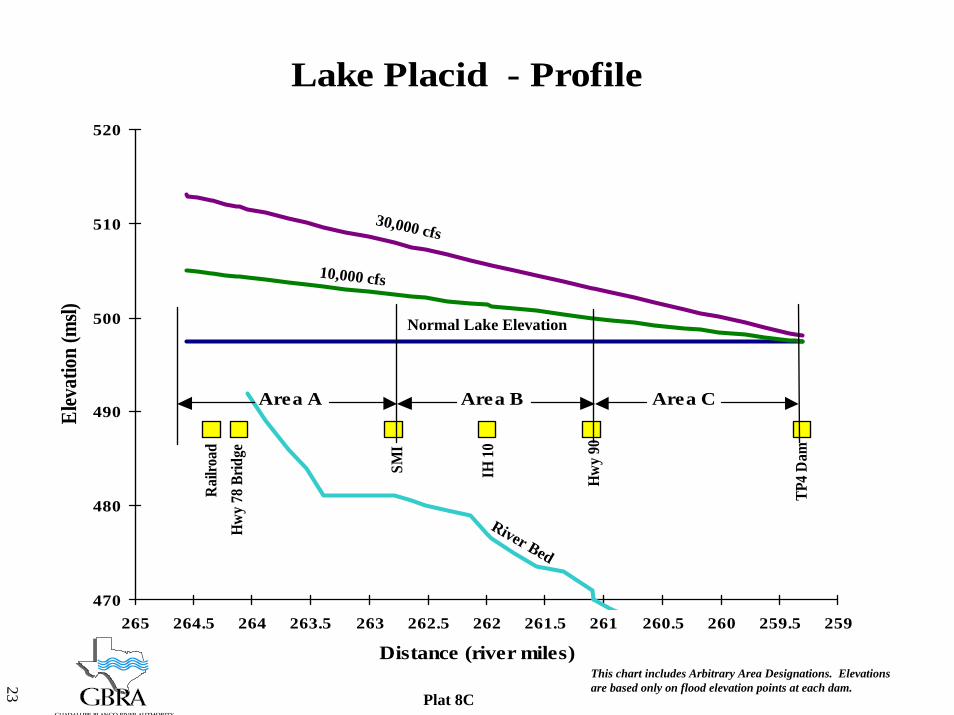
Lake Placid - Profile
Rai
lroad
Hw
y 78
Brid
ge
SMI
IH 1
0
Hw
y 90
TP4
Dam
470
480
490
500
510
520
259259.5260260.5261261.5262262.5263263.5264264.5265
Distance (river miles)
Elev
atio
n (m
sl)
Area A Area B Area C
River Bed
Normal Lake Elevation
10,000 cfs
30,000 cfs
This chart includes Arbitrary Area Designations. Elevations are based only on flood elevation points at each dam.
Plat 8C
23
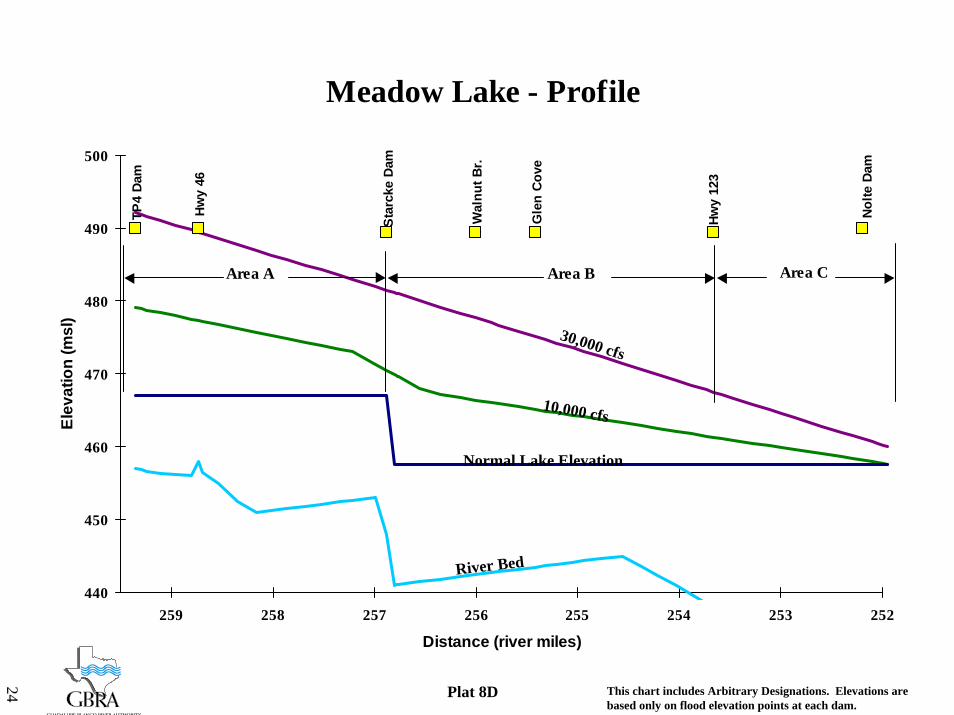
Meadow Lake - Profile
Gle
n C
ove
Hw
y 46
Nol
te D
am
Hwy
123
Wal
nut B
r.
Star
cke
Dam
TP4
Dam
440
450
460
470
480
490
500
252253254255256257258259
Distance (river miles)
Elev
atio
n (m
sl)
Area A Area B Area C
River Bed
Normal Lake Elevation
10,000 cfs
30,000 cfs
This chart includes Arbitrary Designations. Elevations are based only on flood elevation points at each dam.
Plat 8D
24
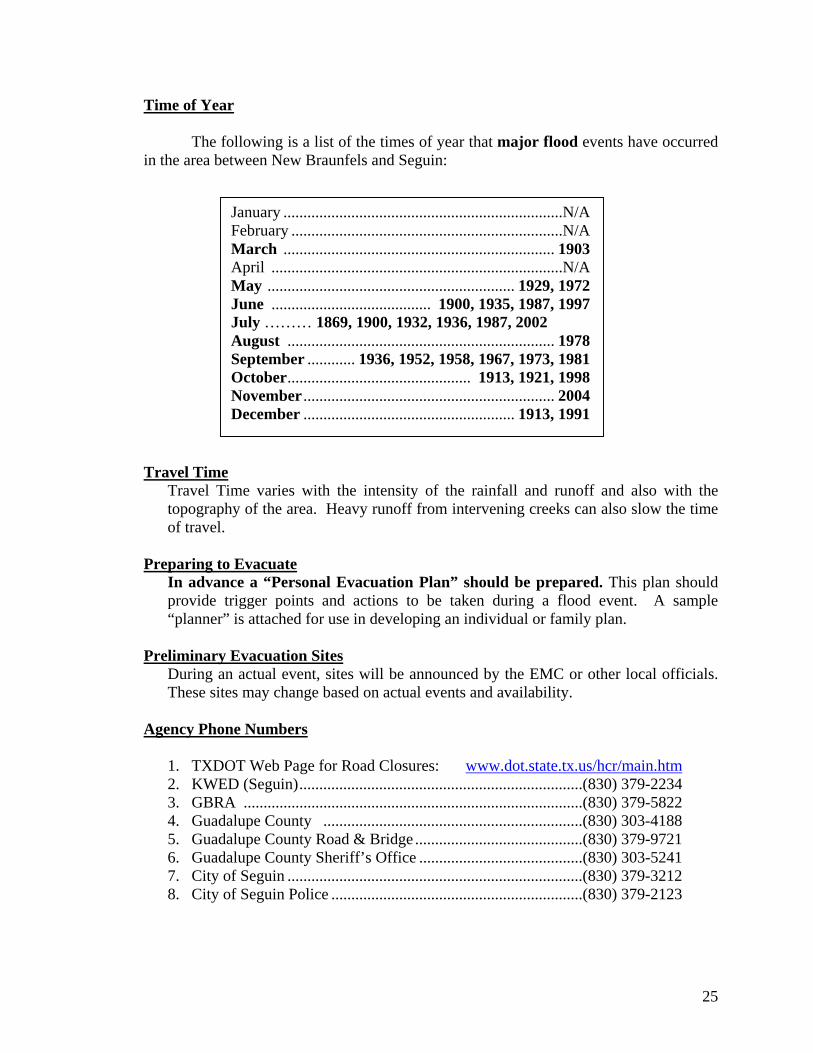
Time of Year
The following is a list of the times of year that major flood events have occurred in the area between New Braunfels and Seguin:
January ......................................................................N/A February ....................................................................N/A March .................................................................... 1903 April .........................................................................N/A May .............................................................. 1929, 1972 June ........................................ 1900, 1935, 1987, 1997 July ……… 1869, 1900, 1932, 1936, 1987, 2002 August ................................................................... 1978 September ............ 1936, 1952, 1958, 1967, 1973, 1981 October.............................................. 1913, 1921, 1998 November ............................................................... 2004 December ..................................................... 1913, 1991
Travel Time
Travel Time varies with the intensity of the rainfall and runoff and also with the topography of the area. Heavy runoff from intervening creeks can also slow the time of travel.
Preparing to Evacuate
In advance a “Personal Evacuation Plan” should be prepared. This plan should provide trigger points and actions to be taken during a flood event. A sample “planner” is attached for use in developing an individual or family plan.
Preliminary Evacuation Sites
During an actual event, sites will be announced by the EMC or other local officials. These sites may change based on actual events and availability.
Agency Phone Numbers
1. TXDOT Web Page for Road Closures: www.dot.state.tx.us/hcr/main.htm 2. KWED (Seguin).......................................................................(830) 379-2234 3. GBRA .....................................................................................(830) 379-5822 4. Guadalupe County .................................................................(830) 303-4188 5. Guadalupe County Road & Bridge ..........................................(830) 379-9721 6. Guadalupe County Sheriff’s Office .........................................(830) 303-5241 7. City of Seguin ..........................................................................(830) 379-3212 8. City of Seguin Police ...............................................................(830) 379-2123
25
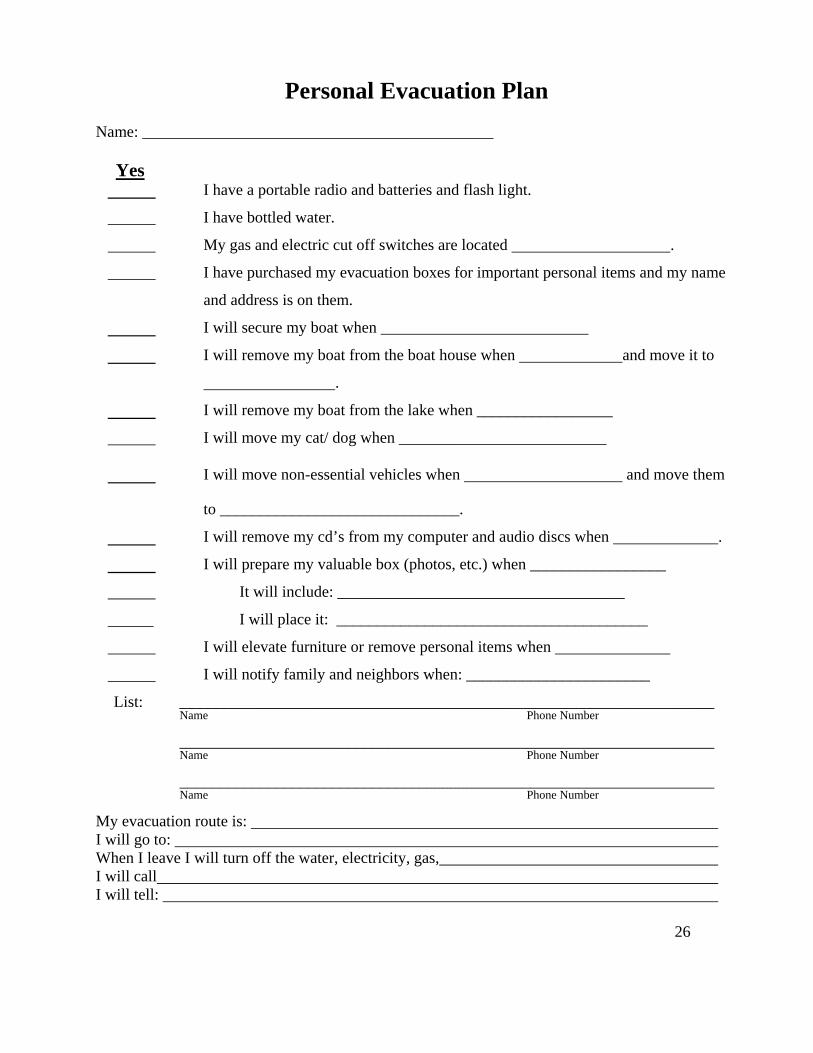
Personal Evacuation Plan Name: ____________________________________________ Yes I have a portable radio and batteries and flash light.
I have bottled water.
My gas and electric cut off switches are located .
I have purchased my evacuation boxes for important personal items and my name
and address is on them.
I will secure my boat when __________________________
I will remove my boat from the boat house when and move it to
.
I will remove my boat from the lake when _________________
I will move my cat/ dog when __________________________
I will move non-essential vehicles when and move them
to ______________________________.
I will remove my cd’s from my computer and audio discs when .
I will prepare my valuable box (photos, etc.) when _________________
It will include: ____________________________________
I will place it: _______________________________________
I will elevate furniture or remove personal items when
I will notify family and neighbors when: _______________________
List: ___________________________________________________________________ Name Phone Number
___________________________________________________________________ Name Phone Number
___________________________________________________________________ Name Phone Number
My evacuation route is: I will go to: When I leave I will turn off the water, electricity, gas, I will call I will tell:
26