Embed Size (px)
Citation preview
Interim Management Statement
January – March 2018
Q1 2018
2
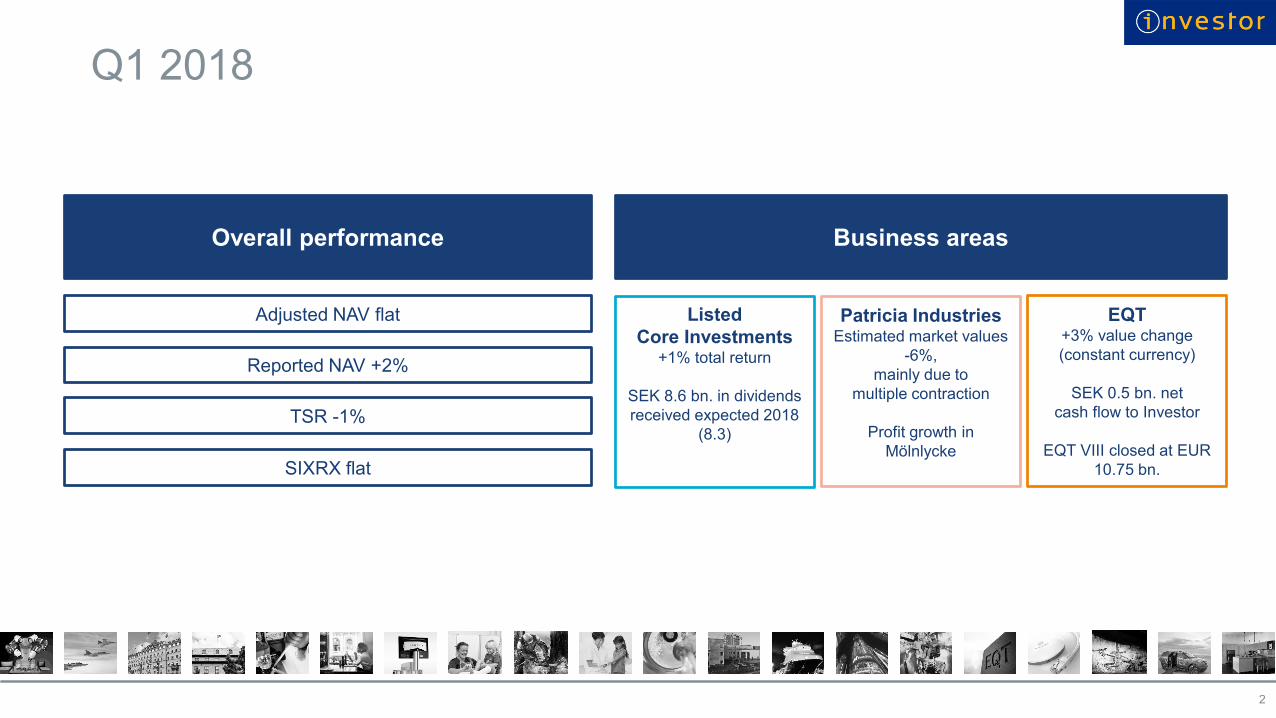
Overall performance
Adjusted NAV flat
Business areas
Listed
Core Investments+1% total return
SEK 8.6 bn. in dividends
received expected 2018
(8.3)
EQT+3% value change
(constant currency)
SEK 0.5 bn. net
cash flow to Investor
EQT VIII closed at EUR
10.75 bn.
Patricia IndustriesEstimated market values
-6%,
mainly due to
multiple contraction
Profit growth in
Mölnlycke
Reported NAV +2%
TSR -1%
SIXRX flat
Q1 2018
3
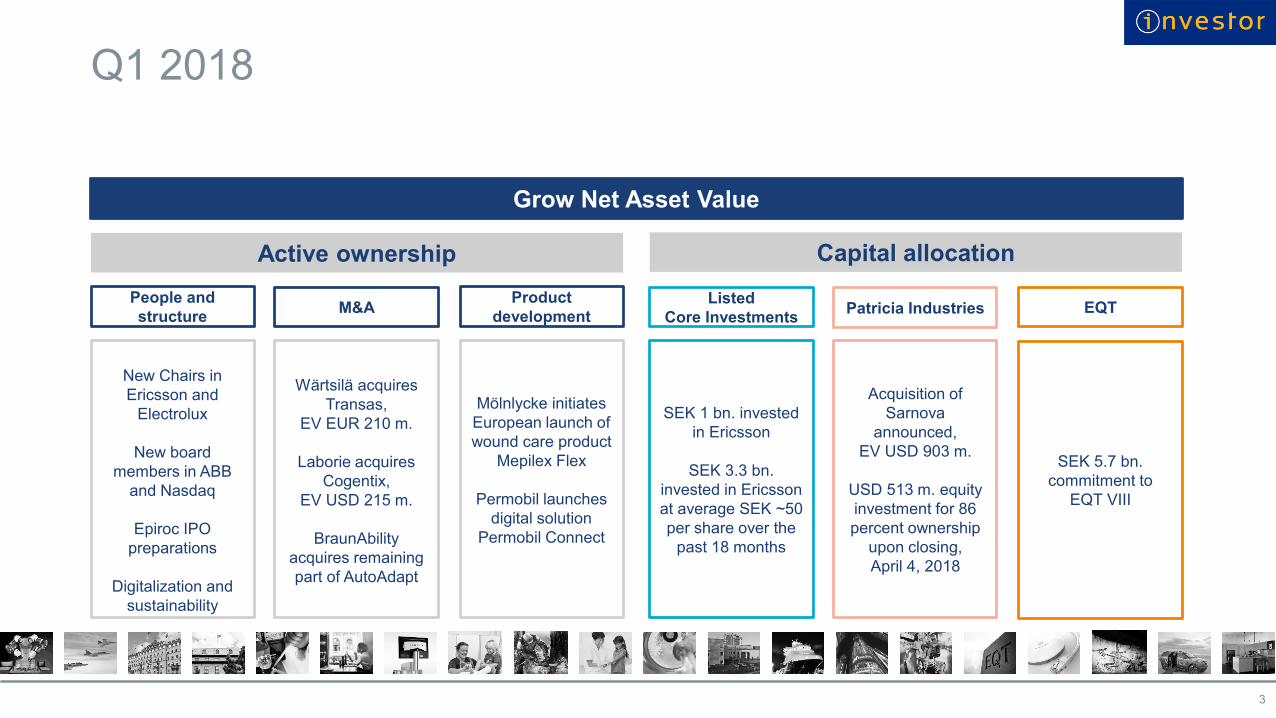
Grow Net Asset Value
New Chairs in
Ericsson and
Electrolux
New board
members in ABB
and Nasdaq
Epiroc IPO
preparations
Digitalization and
sustainability
Active ownership
People and
structureM&A
Product
development
Wärtsilä acquires
Transas,
EV EUR 210 m.
Laborie acquires
Cogentix,
EV USD 215 m.
BraunAbility
acquires remaining
part of AutoAdapt
Mölnlycke initiates
European launch of
wound care product
Mepilex Flex
Permobil launches
digital solution
Permobil Connect
Capital allocation
SEK 1 bn. invested
in Ericsson
SEK 3.3 bn.
invested in Ericsson
at average SEK ~50
per share over the
past 18 months
Listed
Core InvestmentsPatricia Industries EQT
Acquisition of
Sarnova
announced,
EV USD 903 m.
USD 513 m. equity
investment for 86
percent ownership
upon closing,
April 4, 2018
SEK 5.7 bn.
commitment to
EQT VIII
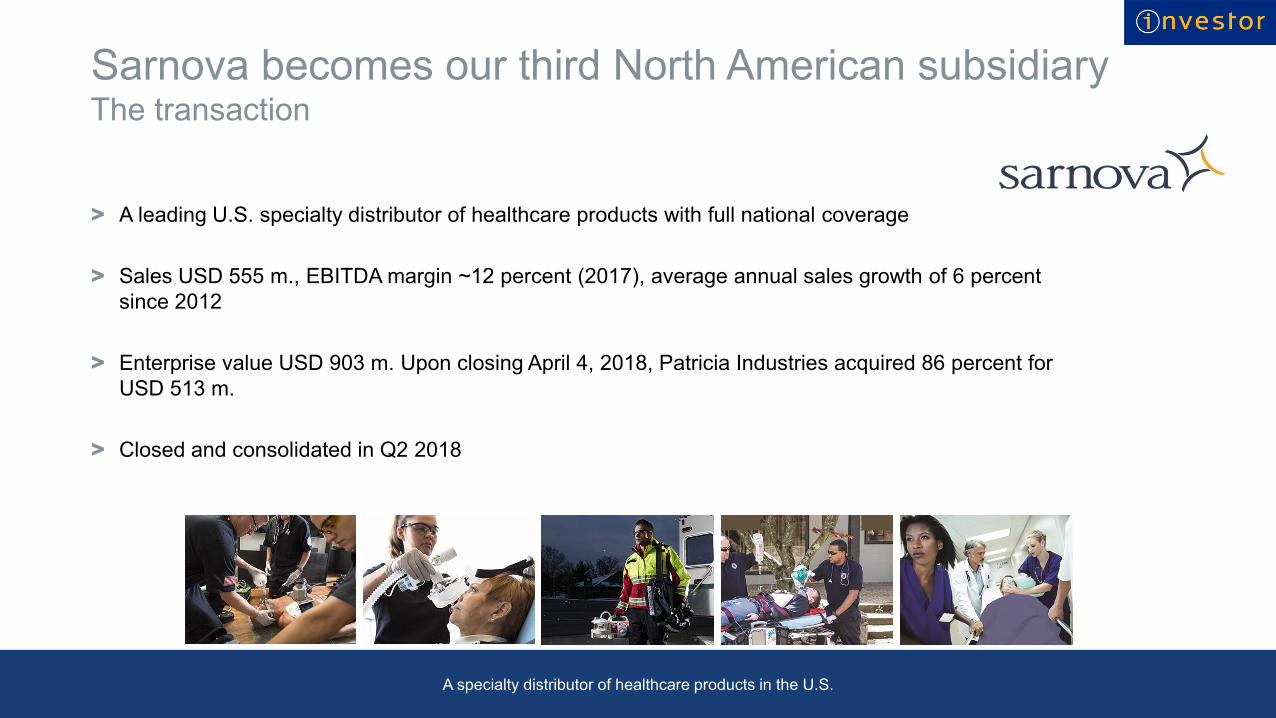
Sarnova becomes our third North American subsidiary
> A leading U.S. specialty distributor of healthcare products with full national coverage
> Sales USD 555 m., EBITDA margin ~12 percent (2017), average annual sales growth of 6 percent
since 2012
> Enterprise value USD 903 m. Upon closing April 4, 2018, Patricia Industries acquired 86 percent for
USD 513 m.
> Closed and consolidated in Q2 2018
4
The transaction
A specialty distributor of healthcare products in the U.S.
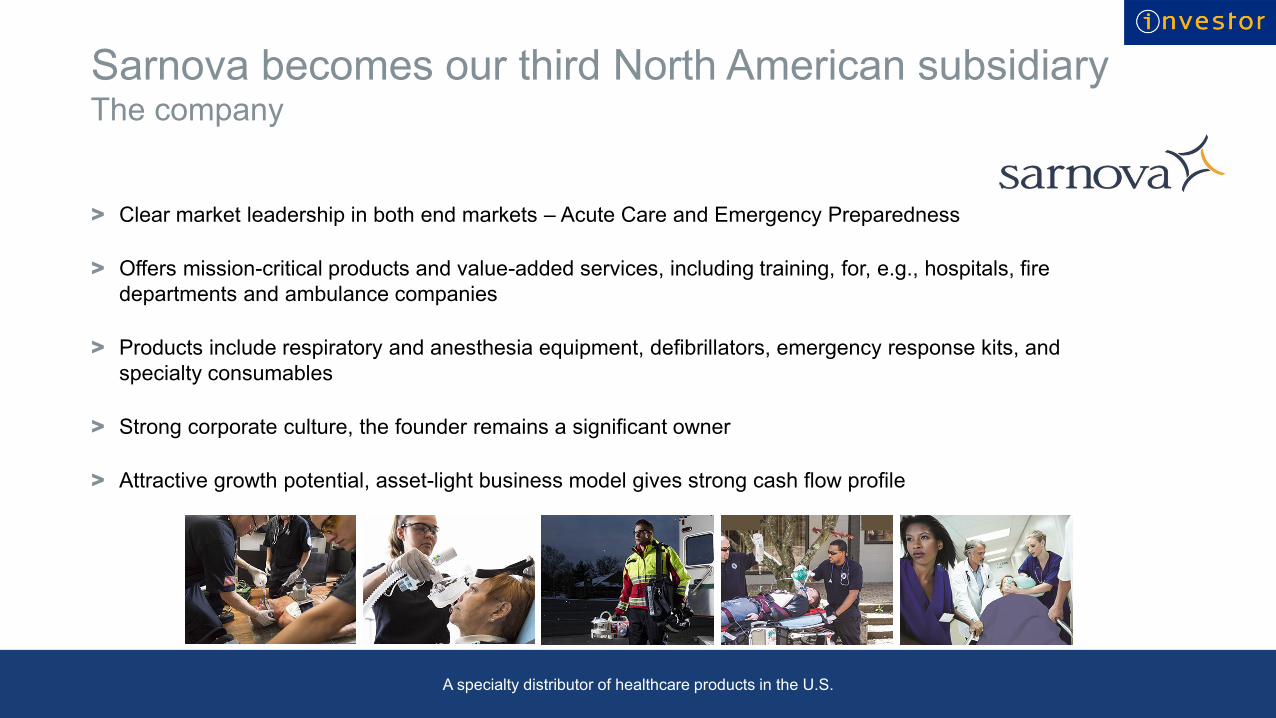
Sarnova becomes our third North American subsidiary
> Clear market leadership in both end markets – Acute Care and Emergency Preparedness
> Offers mission-critical products and value-added services, including training, for, e.g., hospitals, fire
departments and ambulance companies
> Products include respiratory and anesthesia equipment, defibrillators, emergency response kits, and
specialty consumables
> Strong corporate culture, the founder remains a significant owner
> Attractive growth potential, asset-light business model gives strong cash flow profile
5
The company
A specialty distributor of healthcare products in the U.S.
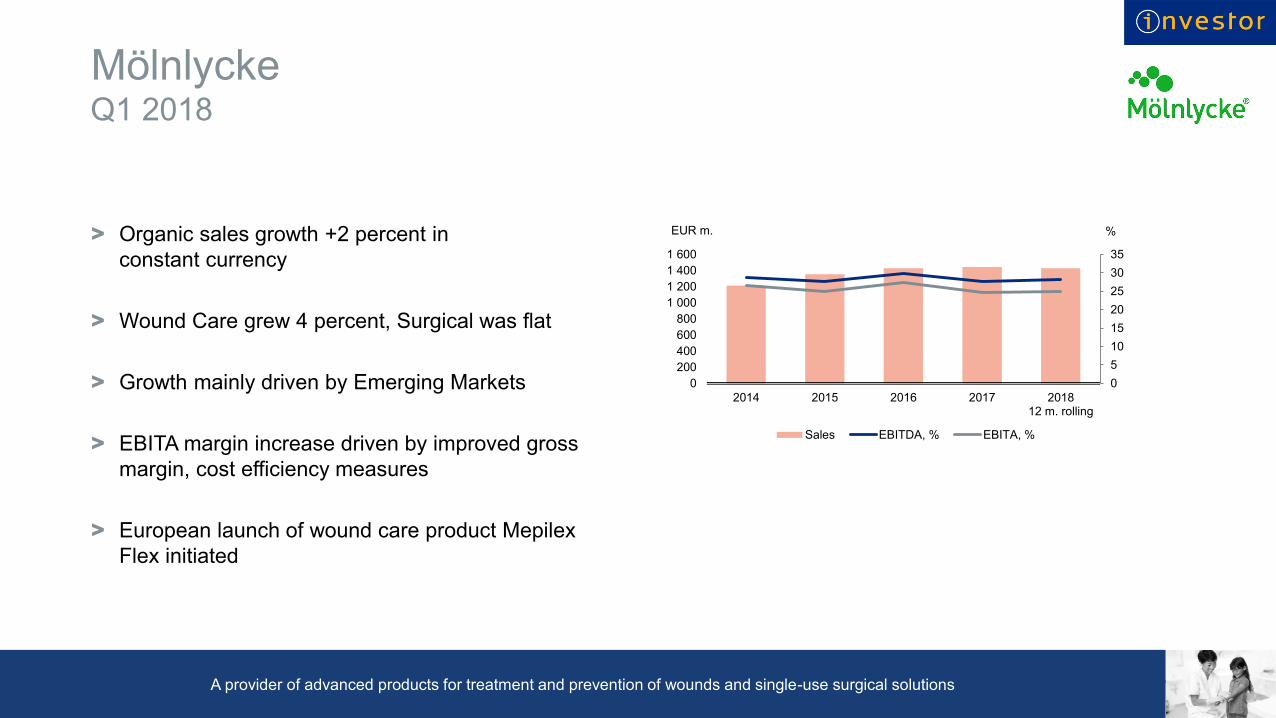
Mölnlycke
> Organic sales growth +2 percent in
constant currency
> Wound Care grew 4 percent, Surgical was flat
> Growth mainly driven by Emerging Markets
> EBITA margin increase driven by improved gross
margin, cost efficiency measures
> European launch of wound care product Mepilex
Flex initiated
6
Q1 2018
A provider of advanced products for treatment and prevention of wounds and single-use surgical solutions
0
5
10
15
20
25
30
35
0
200
400
600
800
1 000
1 200
1 400
1 600
2014 2015 2016 2017 201812 m. rolling
%EUR m.
Sales EBITDA, % EBITA, %
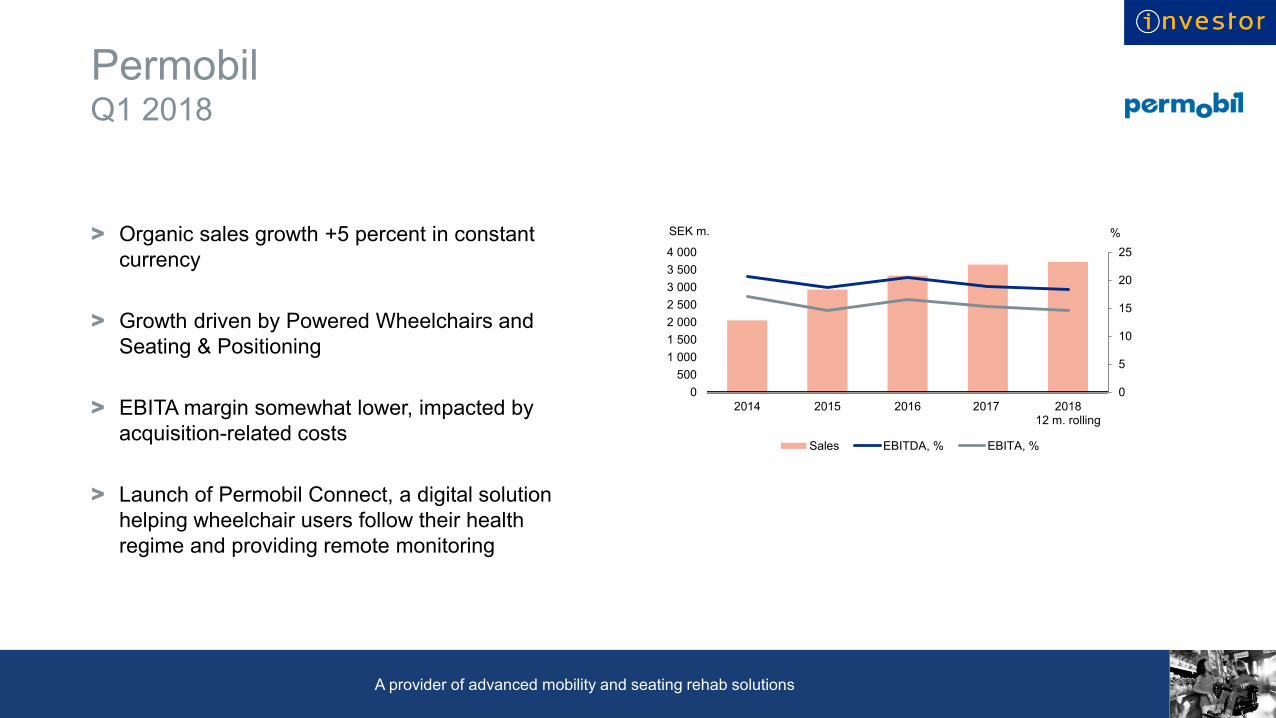
Permobil
> Organic sales growth +5 percent in constant
currency
> Growth driven by Powered Wheelchairs and
Seating & Positioning
> EBITA margin somewhat lower, impacted by
acquisition-related costs
> Launch of Permobil Connect, a digital solution
helping wheelchair users follow their health
regime and providing remote monitoring
7
Q1 2018
A provider of advanced mobility and seating rehab solutions
0
5
10
15
20
25
0
500
1 000
1 500
2 000
2 500
3 000
3 500
4 000
2014 2015 2016 2017 201812 m. rolling
%SEK m.
Sales EBITDA, % EBITA, %
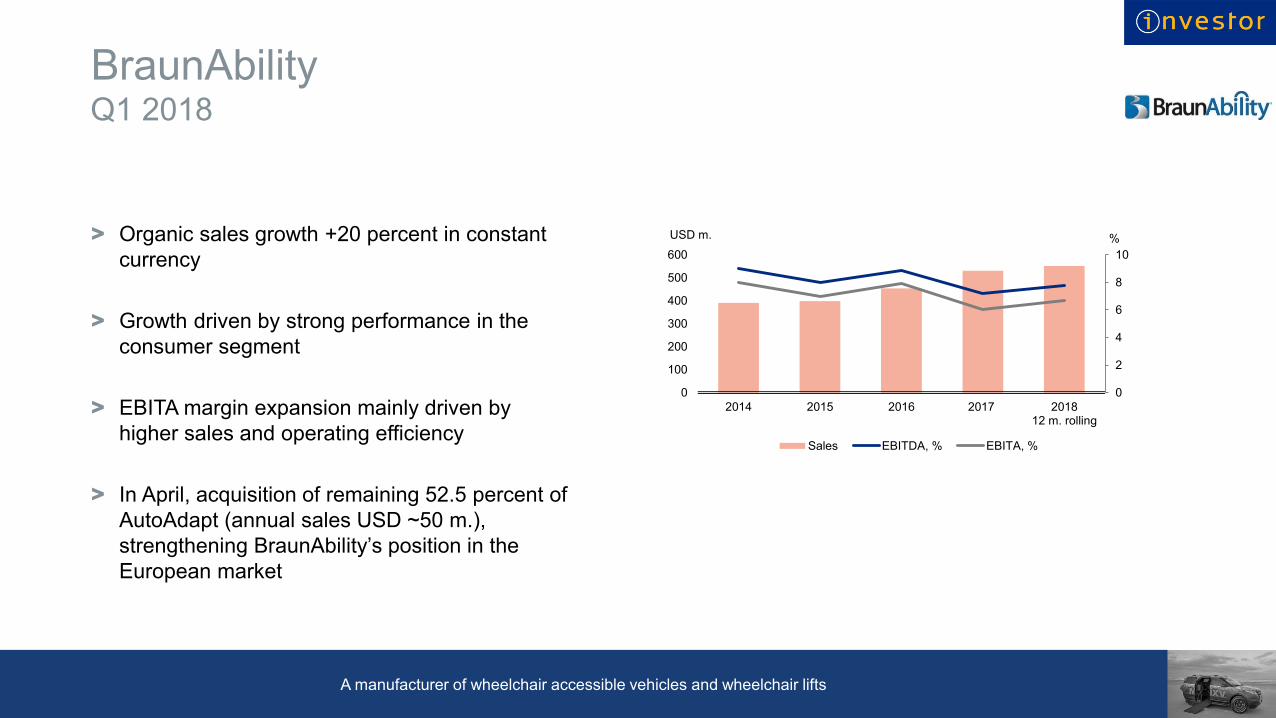
BraunAbility
> Organic sales growth +20 percent in constant
currency
> Growth driven by strong performance in the
consumer segment
> EBITA margin expansion mainly driven by
higher sales and operating efficiency
> In April, acquisition of remaining 52.5 percent of
AutoAdapt (annual sales USD ~50 m.),
strengthening BraunAbility’s position in the
European market
8
Q1 2018
A manufacturer of wheelchair accessible vehicles and wheelchair lifts
0
2
4
6
8
10
0
100
200
300
400
500
600
2014 2015 2016 2017 201812 m. rolling
%USD m.
Sales EBITDA, % EBITA, %
Aleris
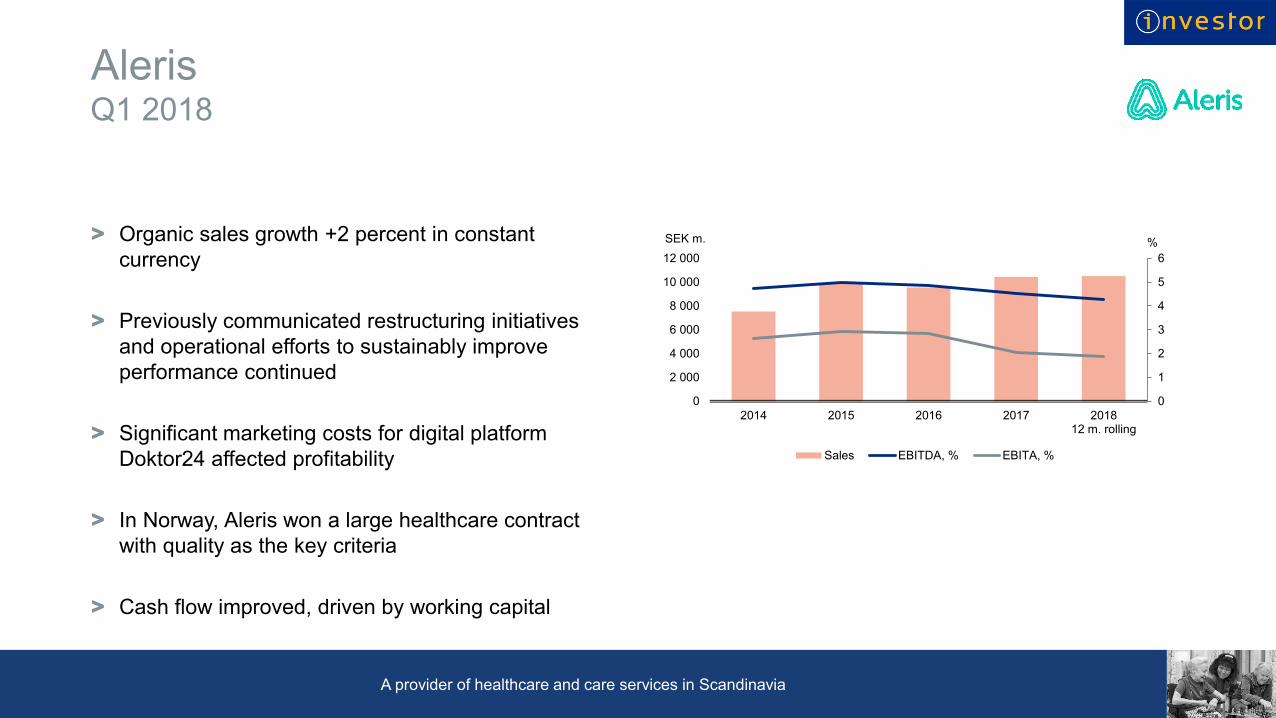
> Organic sales growth +2 percent in constant
currency
> Previously communicated restructuring initiatives
and operational efforts to sustainably improve
performance continued
> Significant marketing costs for digital platform
Doktor24 affected profitability
> In Norway, Aleris won a large healthcare contract
with quality as the key criteria
> Cash flow improved, driven by working capital
9
Q1 2018
A provider of healthcare and care services in Scandinavia
0
1
2
3
4
5
6
0
2 000
4 000
6 000
8 000
10 000
12 000
2014 2015 2016 2017 201812 m. rolling
%SEK m.
Sales EBITDA, % EBITA, %
Laborie
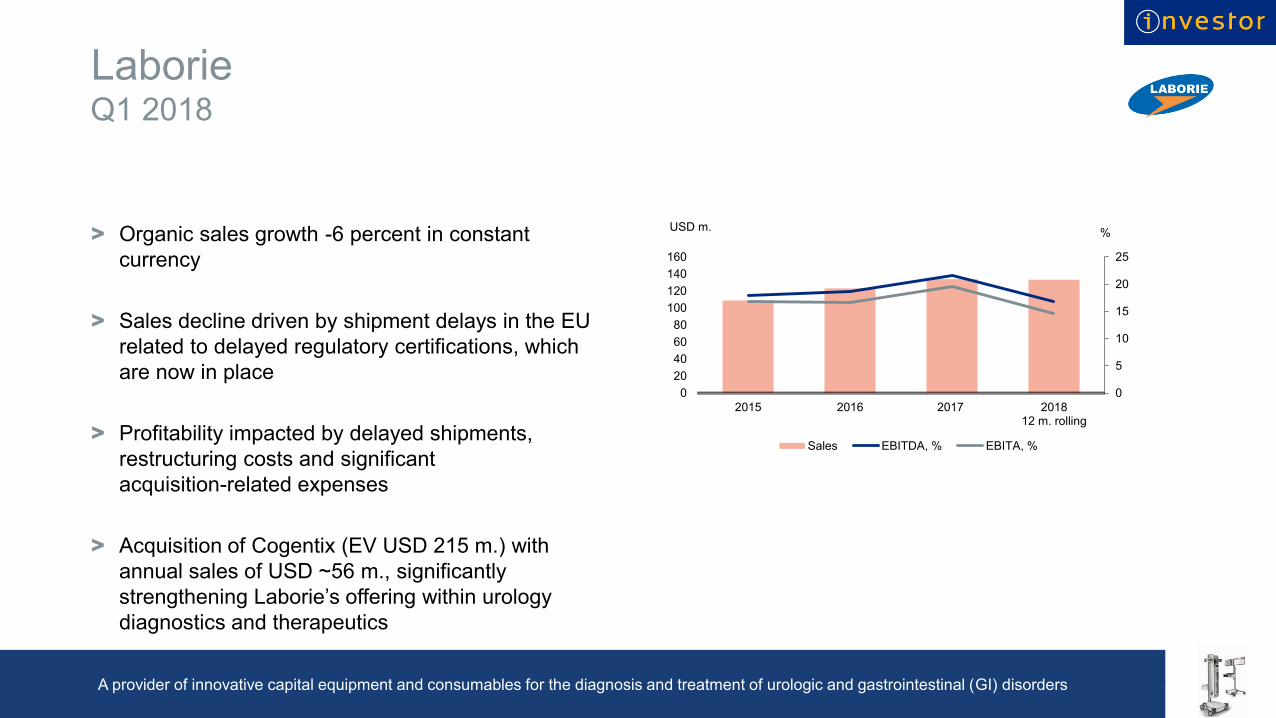
> Organic sales growth -6 percent in constant
currency
> Sales decline driven by shipment delays in the EU
related to delayed regulatory certifications, which
are now in place
> Profitability impacted by delayed shipments,
restructuring costs and significant
acquisition-related expenses
> Acquisition of Cogentix (EV USD 215 m.) with
annual sales of USD ~56 m., significantly
strengthening Laborie’s offering within urology
diagnostics and therapeutics
10
Q1 2018
A provider of innovative capital equipment and consumables for the diagnosis and treatment of urologic and gastrointestinal (GI) disorders
0
5
10
15
20
25
0
20
40
60
80
100
120
140
160
2015 2016 2017 201812 m. rolling
%USD m.
Sales EBITDA, % EBITA, %
3 Scandinavia
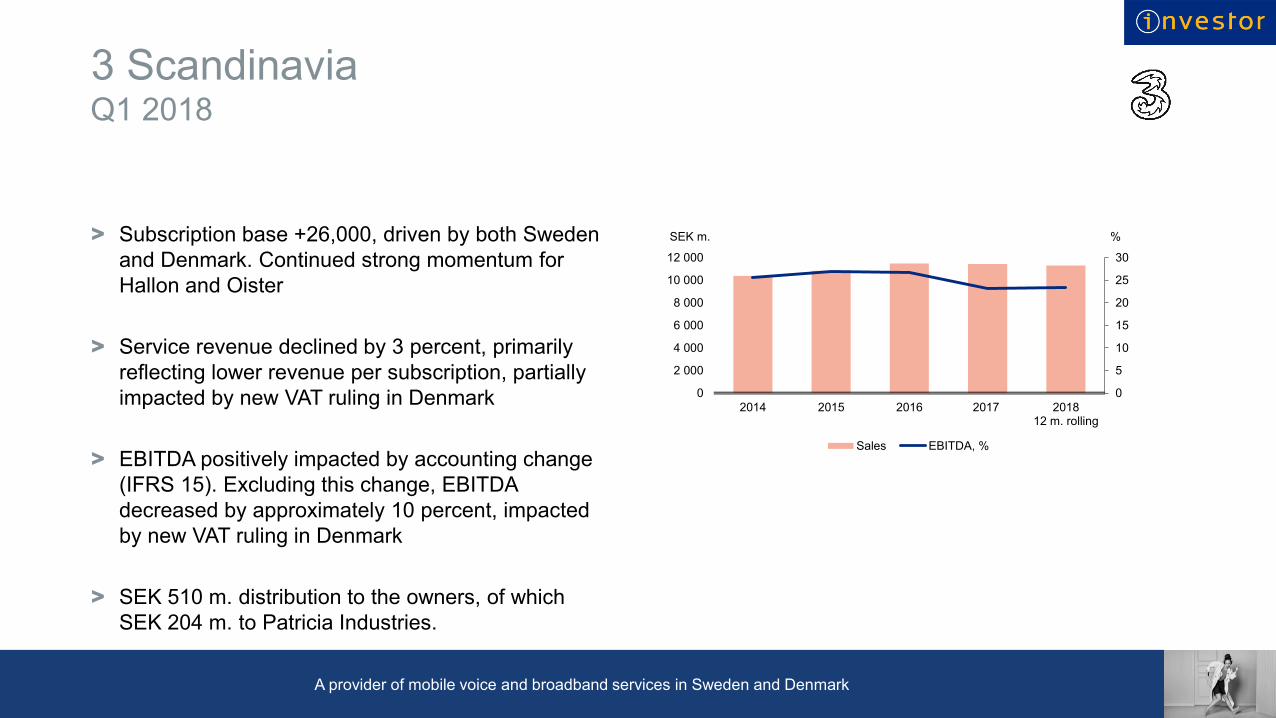
> Subscription base +26,000, driven by both Sweden
and Denmark. Continued strong momentum for
Hallon and Oister
> Service revenue declined by 3 percent, primarily
reflecting lower revenue per subscription, partially
impacted by new VAT ruling in Denmark
> EBITDA positively impacted by accounting change
(IFRS 15). Excluding this change, EBITDA
decreased by approximately 10 percent, impacted
by new VAT ruling in Denmark
> SEK 510 m. distribution to the owners, of which
SEK 204 m. to Patricia Industries.
11
Q1 2018
A provider of mobile voice and broadband services in Sweden and Denmark
0
5
10
15
20
25
30
0
2 000
4 000
6 000
8 000
10 000
12 000
2014 2015 2016 2017 201812 m. rolling
%SEK m.
Sales EBITDA, %
EQT
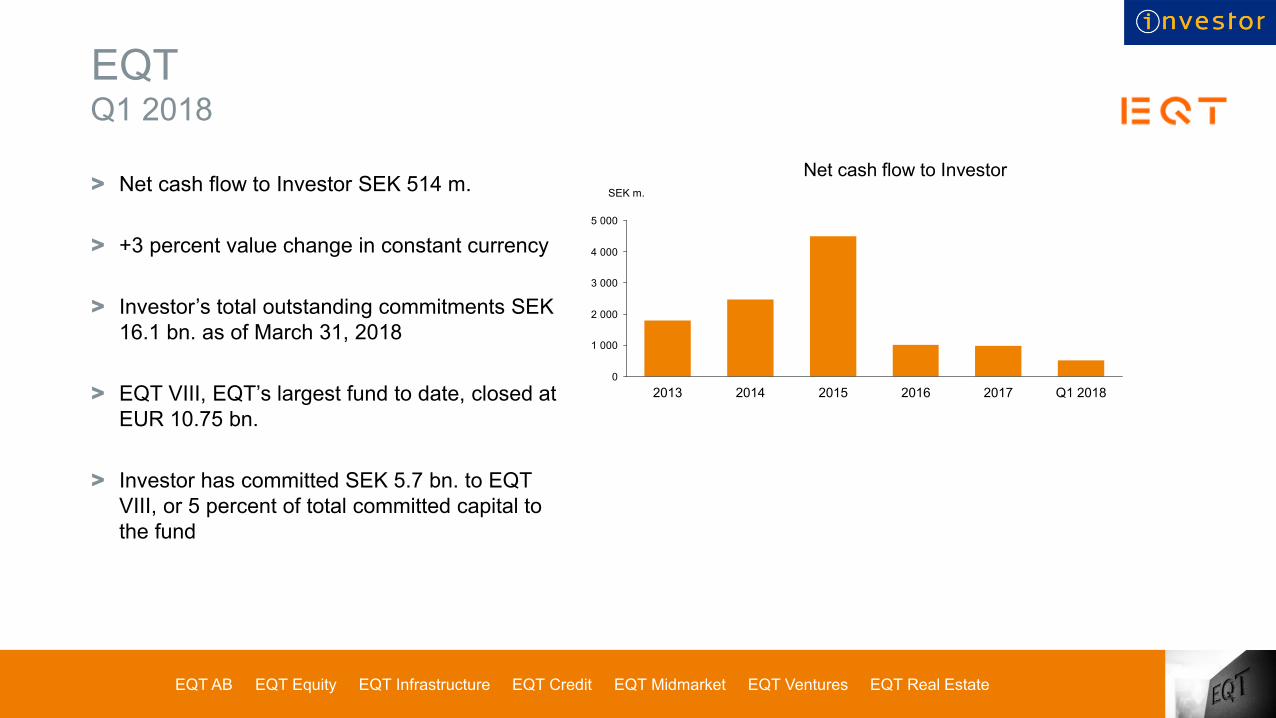
> Net cash flow to Investor SEK 514 m.
> +3 percent value change in constant currency
> Investor’s total outstanding commitments SEK
16.1 bn. as of March 31, 2018
> EQT VIII, EQT’s largest fund to date, closed at
EUR 10.75 bn.
> Investor has committed SEK 5.7 bn. to EQT
VIII, or 5 percent of total committed capital to
the fund
12
Q1 2018
0
1 000
2 000
3 000
4 000
5 000
2014
SEK m.
2017201620152013 Q1 2018
Net cash flow to Investor
EQT AB EQT Equity EQT Infrastructure EQT Credit EQT Midmarket EQT Ventures EQT Real Estate
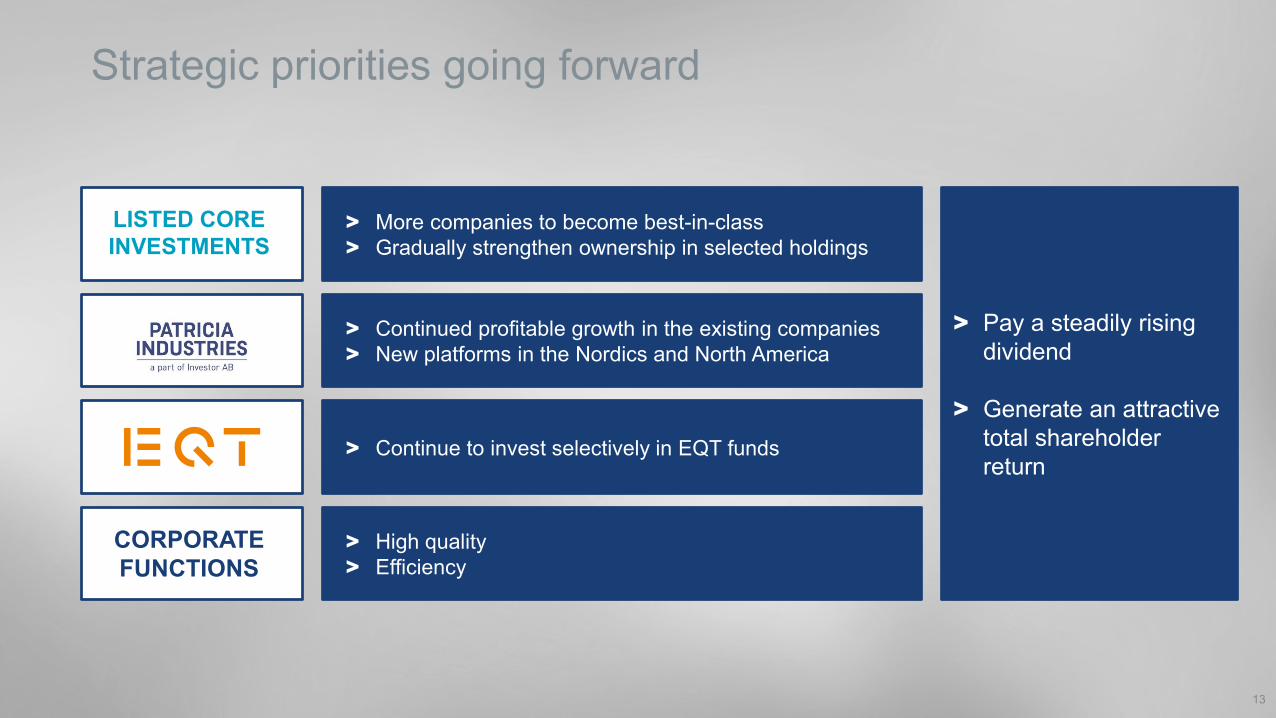
Strategic priorities going forward
13
> More companies to become best-in-class
> Gradually strengthen ownership in selected holdings
> Continue to invest selectively in EQT funds
> Continued profitable growth in the existing companies
> New platforms in the Nordics and North America
> High quality
> Efficiency
> Pay a steadily rising
dividend
> Generate an attractive
total shareholder
return
LISTED CORE
INVESTMENTS
CORPORATE
FUNCTIONS
14
Q1 Report 2018Financials, Helena Saxon, CFO
April 20, 2018
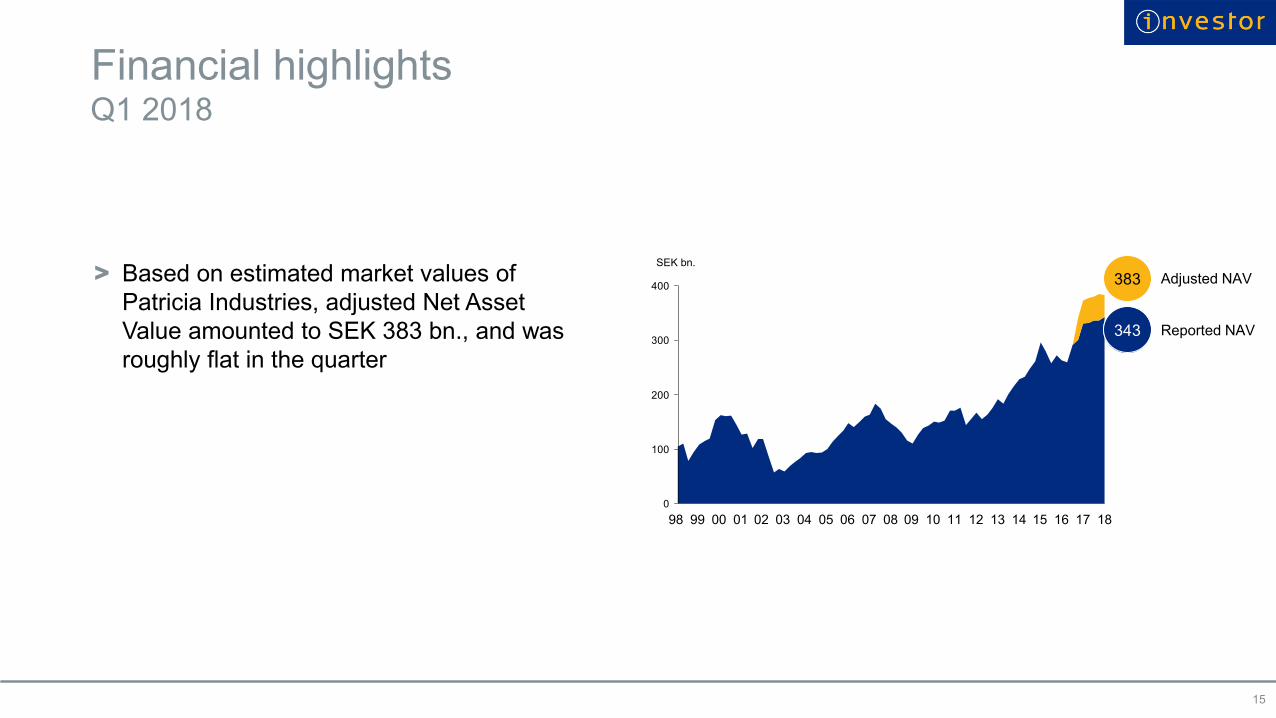
Financial highlights
> Based on estimated market values of
Patricia Industries, adjusted Net Asset
Value amounted to SEK 383 bn., and was
roughly flat in the quarter
15
Q1 2018
0
100
200
300
400
SEK bn.
0301 1598 1009 130805 1202 1104 07 1499 0600 1716 18
343343
383383
Reported NAV
Adjusted NAV
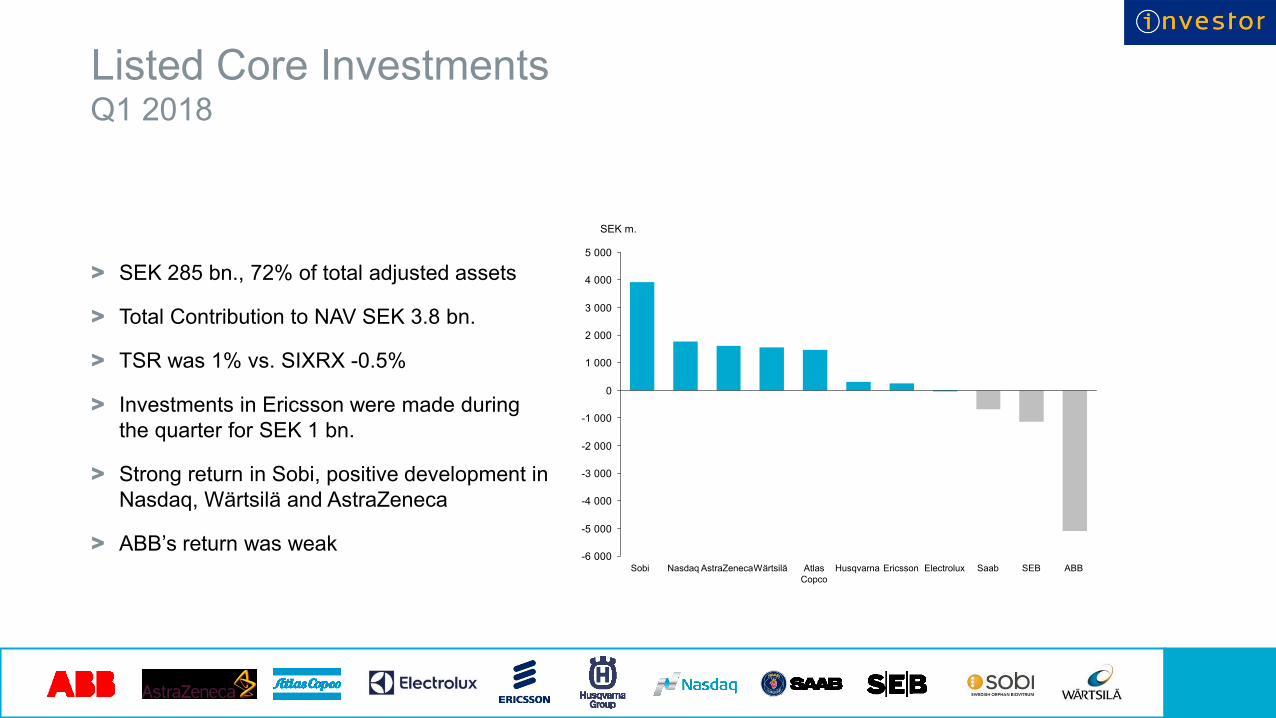
Listed Core Investments
16
Q1 2018
-6 000
-5 000
-4 000
-3 000
-2 000
-1 000
0
1 000
2 000
3 000
4 000
5 000
HusqvarnaAtlas
Copco
ElectroluxWärtsiläSobi Nasdaq ABBAstraZeneca SEB
SEK m.
SaabEricsson
> SEK 285 bn., 72% of total adjusted assets
> Total Contribution to NAV SEK 3.8 bn.
> TSR was 1% vs. SIXRX -0.5%
> Investments in Ericsson were made during
the quarter for SEK 1 bn.
> Strong return in Sobi, positive development in
Nasdaq, Wärtsilä and AstraZeneca
> ABB’s return was weak
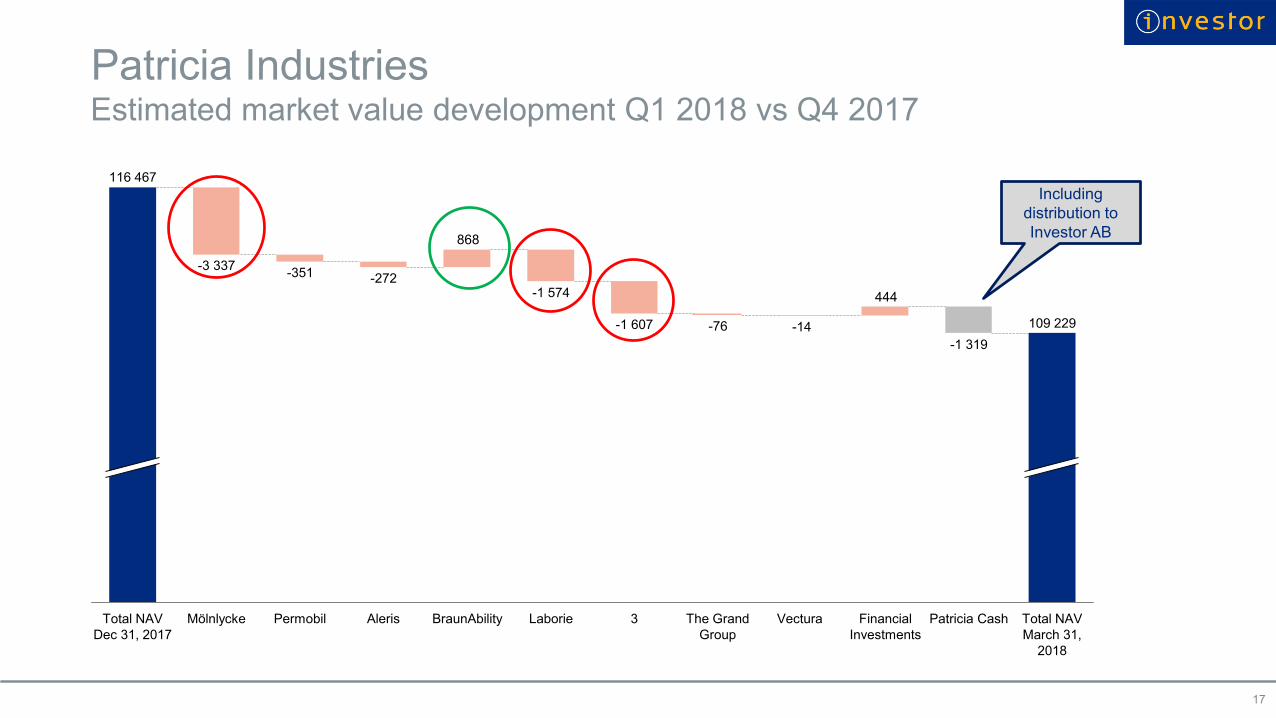
Patricia Industries
17
Estimated market value development Q1 2018 vs Q4 2017
444
868
Total NAV
March 31,
2018
Financial
Investments
Aleris
-3 337
-76
Total NAV
Dec 31, 2017
-14 109 229
BraunAbility Laborie Vectura
-1 319
Patricia Cash
-272
Permobil
-1 607
The Grand
Group
-351
3
-1 574
Mölnlycke
116 467
Including
distribution to
Investor AB
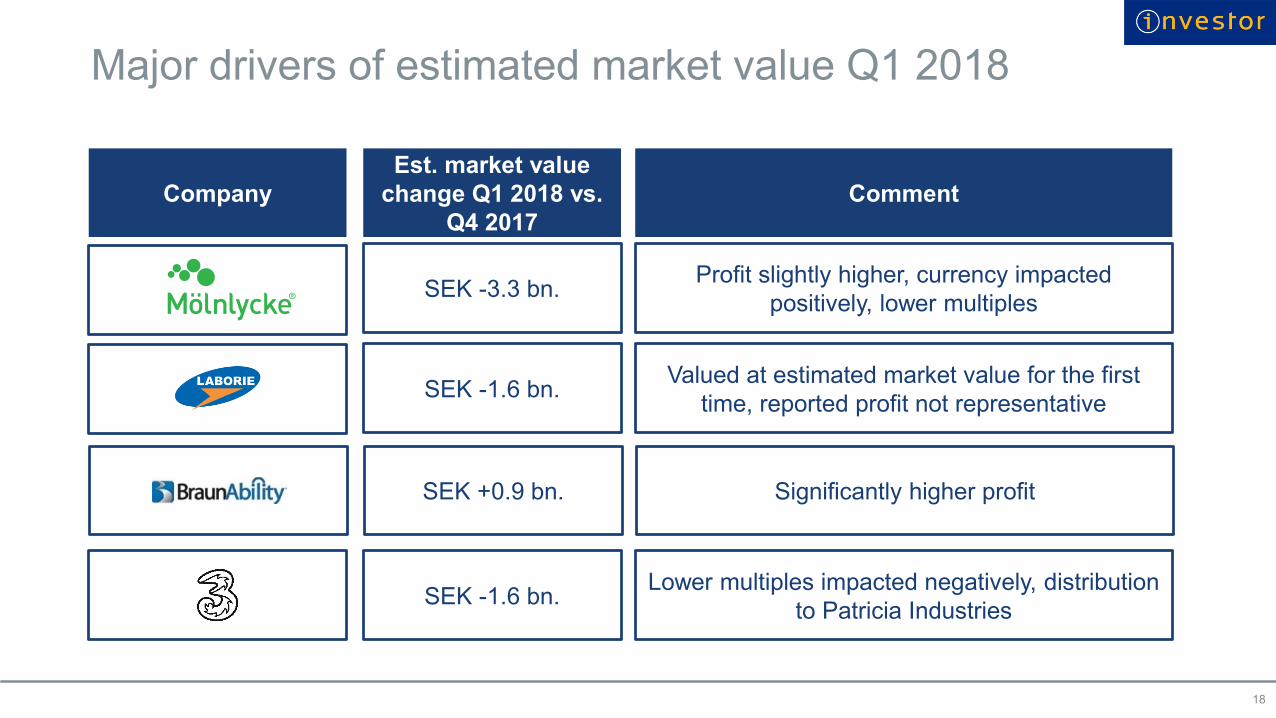
Major drivers of estimated market value Q1 2018
18
SEK -3.3 bn.Profit slightly higher, currency impacted
positively, lower multiples
Company
Est. market value
change Q1 2018 vs.
Q4 2017
Comment
SEK -1.6 bn.Lower multiples impacted negatively, distribution
to Patricia Industries
SEK -1.6 bn.Valued at estimated market value for the first
time, reported profit not representative
SEK +0.9 bn. Significantly higher profit
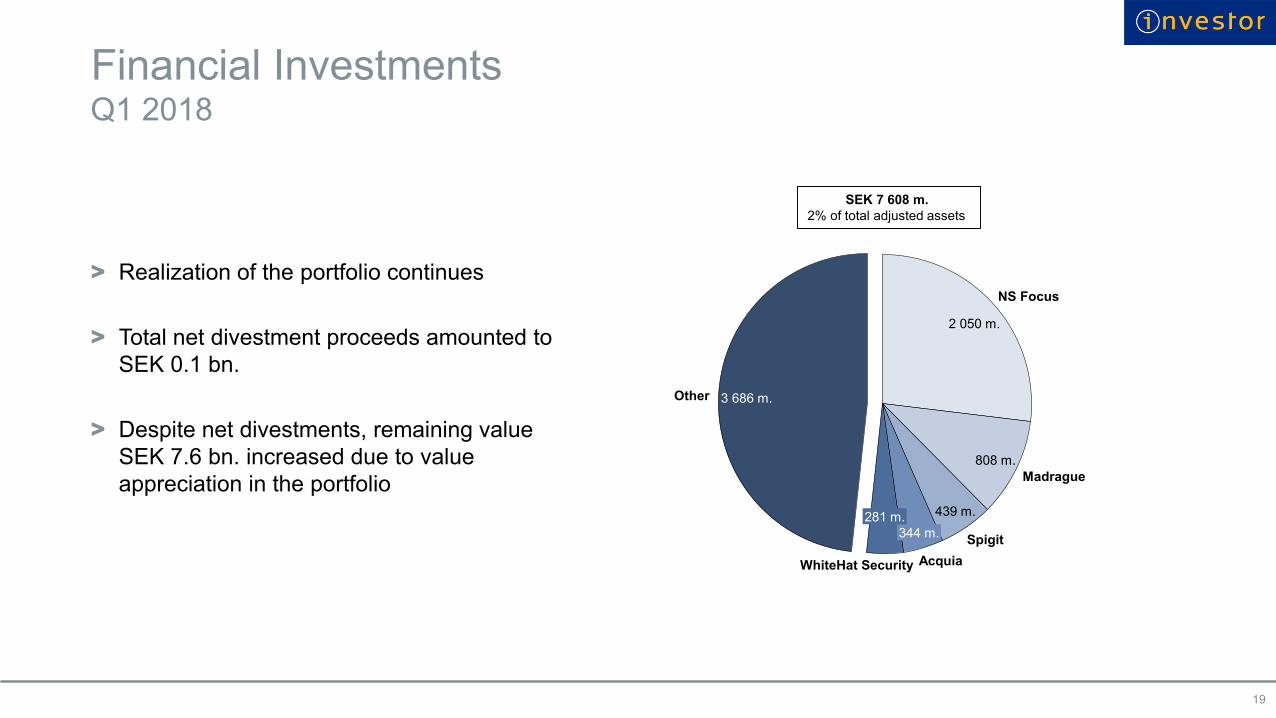
Financial Investments
> Realization of the portfolio continues
> Total net divestment proceeds amounted to
SEK 0.1 bn.
> Despite net divestments, remaining value
SEK 7.6 bn. increased due to value
appreciation in the portfolio
19
Q1 2018
3 686 m.
WhiteHat Security
Other
808 m.
Acquia
344 m.
439 m.
Spigit
2 050 m.
NS Focus
281 m.
Madrague
SEK 7 608 m.
2% of total adjusted assets
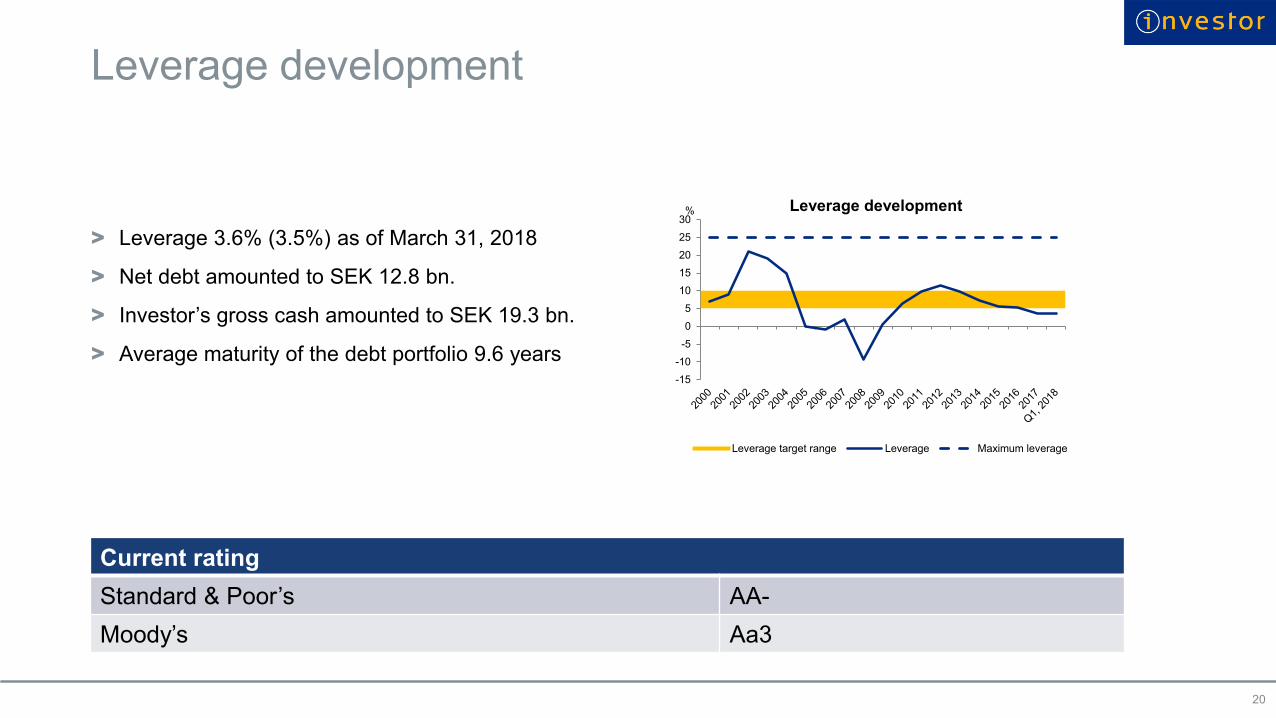
-15
-10
-5
0
5
10
15
20
25
30% Leverage development
Leverage target range Leverage Maximum leverage
Leverage development
> Leverage 3.6% (3.5%) as of March 31, 2018
> Net debt amounted to SEK 12.8 bn.
> Investor’s gross cash amounted to SEK 19.3 bn.
> Average maturity of the debt portfolio 9.6 years
20
Current rating
Standard & Poor’s AA-
Moody’s Aa3
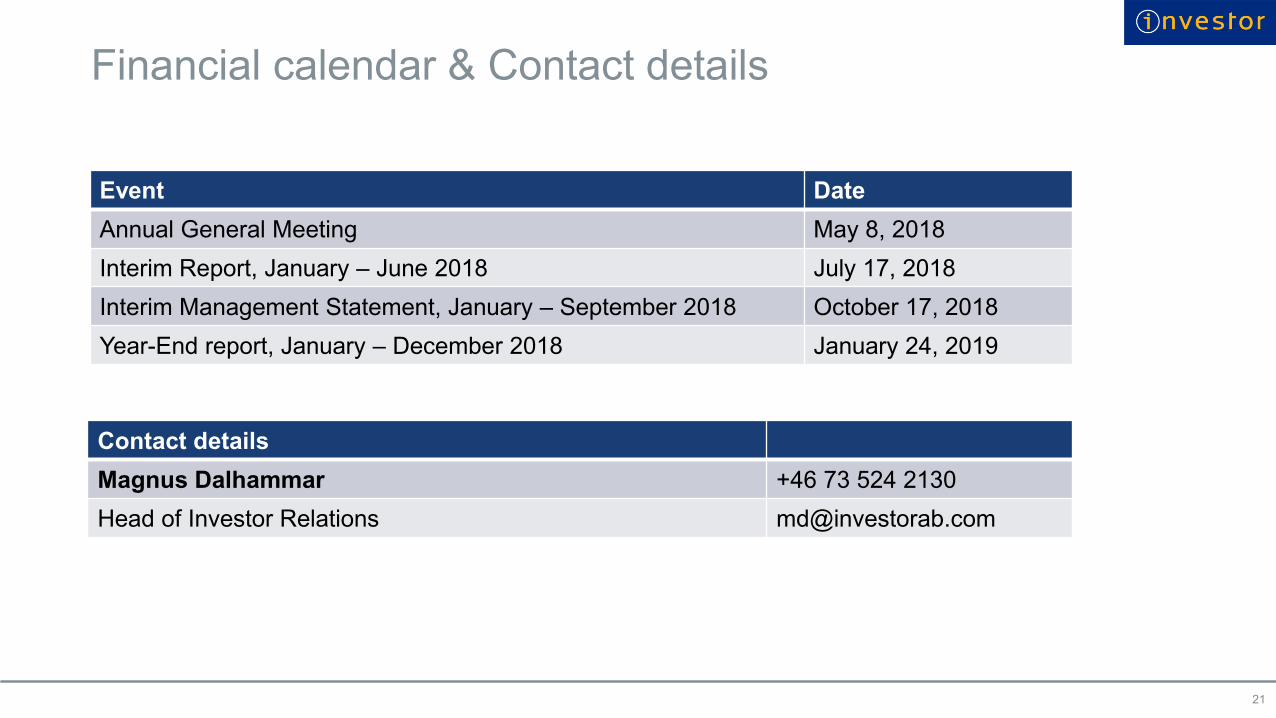
Financial calendar & Contact details
Event Date
Annual General Meeting May 8, 2018
Interim Report, January – June 2018 July 17, 2018
Interim Management Statement, January – September 2018 October 17, 2018
Year-End report, January – December 2018 January 24, 2019
21
Contact details
Magnus Dalhammar +46 73 524 2130
Head of Investor Relations [email protected]