Embed Size (px)
Citation preview

INTERIM REPORT 1 APRIL - 30 SEPTEMBER 2020
SECOND QUARTER (1 JULY - 30 SEPTEMBER 2020)Net sales decreased by 7 percent and amounted to SEK 2,723 million (2,917). Covid-19 is estimated to haveaffected net sales negatively by approximately 8 percent.Operating profit before amortisation of intangible non-current assets (EBITA) decreased by 19 percent andamounted to SEK 306 million (380) corresponding to an EBITA margin of 11.2 percent (13.0). Operating profit decreased by 26 percent and amounted to SEK 242 million (329) corresponding toan operating margin of 8.9 percent (11.2).Profit after tax decreased by 24 percent and amounted to SEK 181 million (240) and earnings per share beforedilution amounted to SEK 0.65 (0.85). The number of shares in the company has been increased by splitting each existing share, regardless ofseries, into four shares (what is referred to as 4:1 share split).
PERIOD (1 APRIL - 30 SEPTEMBER 2020)Net sales decreased by 6 percent and amounted to SEK 5,528 million (5,851). Covid-19 is estimated to haveaffected net sales negatively by approximately 7 percent.Operating profit before amortisation of intangible non-current assets (EBITA) decreased by 15 percent andamounted to SEK 612 million (721) corresponding to an EBITA margin of 11.1 percent (12.3). Operating profit decreased by 22 percent and amounted to SEK 485 million (621) corresponding toan operating margin of 8.8 percent (10.6).Profit after tax decreased by 22 percent and amounted to SEK 365 million (466) and earnings per share beforedilution amounted to SEK 1.30 (1.70). For the latest twelve month period earnings per share beforedilution amounted to SEK 2.80 (2.90).Return on working capital (P/WC) amounted to 51 percent (56).Return on equity amounted to 26 percent (33) and the equity ratio amounted to 32 percent (32).Cash flow from operating activities amounted to SEK 567 million (519). For the latest twelve monthperiod, cash flow per share from operating activities amounted to SEK 4.35 (3.10).Since the start of the financial year nine acquisitions have been completed, of which two after the end of theperiod, with total annual sales of about SEK 775 million.
GROUP SUMMARY 3 months 6 months Rolling 12 months
SEKm30 Sep
202030 Sep
2019∆
30 Sep2020
30 Sep2019
∆ 30 Sep
202031 Mar
2020Net sales 2,723 2,917 -7% 5,528 5,851 -6% 11,412 11,735EBITA 306 380 -19% 612 721 -15% 1,255 1,364EBITA-margin % 11.2 13.0 11.1 12.3 11.0 11.6Profit after financial items 227 307 -26% 460 593 -22% 972 1,105Profit for the period 181 240 -24% 365 466 -22% 772 873Earnings per share before dilution, SEK 0.65 0.85 -24% 1.30 1.70 -24% 2.80 3.20Earnings per share after dilution, SEK 0.65 0.85 -24% 1.30 1.70 -24% 2.80 3.20Cash flow from operating activities pershare, SEK
- - - - 4.35 4.15
Return on equity, % 26 33 26 33 26 32Equity ratio, % 32 32 32 32 32 36 All calculations of key figures for SEK per share has been restated to take the share split (4:1) completed in September 2020 intoaccount. Comparisons in parentheses refer to the corresponding period of the previous year, unless stated otherwise.
ADDTECH AB (PUBL.) INTERIM REPORT 1 APRIL - 30 SEPTEMBER 2020 1
CEO´S COMMENTSSECOND QUARTER – FOCUSING ON EFFICIENCY AND FINISHING STRONGLY
The second quarter outcome was somewhat better than we had feared, mainly attributable to the month ofSeptember being very strong. Sales fell by 7 percent, of which the organic decline was 10 percent compared withthe corresponding period last year. Although Covid-19 affected several to us important market segments during thequarter, a significant part of the organic effect is related to the sale of solutions for scrubber installations. Saleswithin this area have decreased gradually since the fourth quarter of the previous financial year and have furtherstrongly negatively been impacted by the Covid-19 pandemic. Our focused efforts to adjust our operating costs tolower business volumes in our companies within the affected market segments resulted in about 200 employeesunfortunately being laid off during the first six months. These measures, combined with the effects of short-termcost reductions and favourable contributions from acquisitions, resulted in an EBITA margin of 11.2 percent, whichwas good given the tough comparison with a very strong quarter last year. Our liquidity remains favourable and thecash flow is stable.
The business situation varied between different geographical markets, customer segments and product niches.Sales of production components for the mechanical industry and special vehicles were weak and, although weexperienced a recovery in demand at the end of the quarter, we are seeing caution among customers, resulting inweaker visibility than usual. The increased demand in medical technology that we experienced at the beginning ofthe pandemic abated over the quarter. The market situation was strong in the forest industry, wind power andinfrastructure products for national and regional grids, and sales in the electronics and defence segments werestable.
In terms of our geographical presence, our recovery was strongest in the second quarter in Denmark and in otherEuropean countries outside the Nordic region, although the latter progressed from very low levels. The businesssituation developed stably in Sweden, while the trend in Finland and Norway was strongly negative, attributablelargely to the decrease in scrubber business. The underlying sentiment is that the market situation in Finland wasstable and in Norway it remained stagnant.
ACQUISITIONS
Acquisitions of successful and market-leading companies are an important element in our growth strategy and ourambition is to implement well-considered acquisitions, even during periods of greater difficulty. During the quarter,we completed four acquisitions and we completed two more in early October. Since the beginning of the financialyear, we have acquired nine companies, whose combined annual sales are approximately SEK 775 million. Wecontinue to have several projects in progress, at various phases and in different geographical markets.
OUTLOOK - CONTINUED ADAPTATION TO THE NEW NORMAL
The stabilising trend in demand that we experienced in September has continued into October but the pandemic’simpact on demand trends will remain uncertain. Over the upcoming period, we also expect low activity levels topersist in the market for scrubber installations. We are monitoring developments closely and are continuing toimplement our cost-adjustment programme while focusing on safeguarding our long-term profitable growth.
Our increased focus on sustainability, which we initiated during the precedingfinancial year, is continuing unabated. Our experiences from the cyber attack havebeen of great help in the transition towards increased digitalisation, which hasbeen accelerated by the pandemic.
Overall, I have great confidence in our growth strategies, scalable business modeland strong, entrepreneurial corporate culture. I would again like to take thisopportunity to thank all Addtech employees for your amazing commitment andefforts.
Niklas StenbergPresident and CEO
ADDTECH AB (PUBL.) INTERIM REPORT 1 APRIL - 30 SEPTEMBER 2020 2
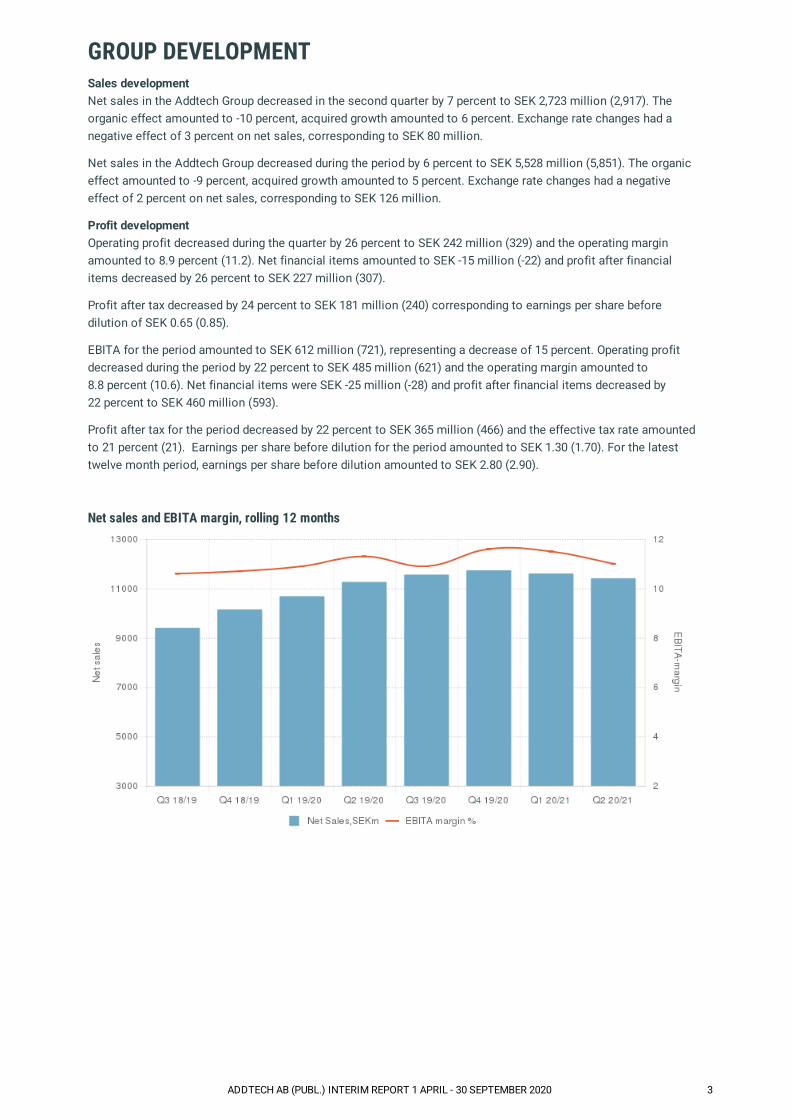
GROUP DEVELOPMENTSales developmentNet sales in the Addtech Group decreased in the second quarter by 7 percent to SEK 2,723 million (2,917). Theorganic effect amounted to -10 percent, acquired growth amounted to 6 percent. Exchange rate changes had anegative effect of 3 percent on net sales, corresponding to SEK 80 million.
Net sales in the Addtech Group decreased during the period by 6 percent to SEK 5,528 million (5,851). The organiceffect amounted to -9 percent, acquired growth amounted to 5 percent. Exchange rate changes had a negativeeffect of 2 percent on net sales, corresponding to SEK 126 million.
Profit developmentOperating profit decreased during the quarter by 26 percent to SEK 242 million (329) and the operating marginamounted to 8.9 percent (11.2). Net financial items amounted to SEK -15 million (-22) and profit after financialitems decreased by 26 percent to SEK 227 million (307).
Profit after tax decreased by 24 percent to SEK 181 million (240) corresponding to earnings per share beforedilution of SEK 0.65 (0.85).
EBITA for the period amounted to SEK 612 million (721), representing a decrease of 15 percent. Operating profitdecreased during the period by 22 percent to SEK 485 million (621) and the operating margin amounted to8.8 percent (10.6). Net financial items were SEK -25 million (-28) and profit after financial items decreased by22 percent to SEK 460 million (593).
Profit after tax for the period decreased by 22 percent to SEK 365 million (466) and the effective tax rate amountedto 21 percent (21). Earnings per share before dilution for the period amounted to SEK 1.30 (1.70). For the latesttwelve month period, earnings per share before dilution amounted to SEK 2.80 (2.90).
Net sales and EBITA margin, rolling 12 months
ADDTECH AB (PUBL.) INTERIM REPORT 1 APRIL - 30 SEPTEMBER 2020 3

DEVELOPMENT IN THE BUSINESS AREASAUTOMATIONNet sales in Automation increased in the second quarter by 2 percent to SEK 562 million (552) and EBITA increasedby 7 percent to SEK 60 million (57). Net sales during the period increased marginally to SEK 1,145 million (1,143)and EBITA decreased by 6 percent to SEK 110 million (117).
MarketOverall, the Automation business area was affected marginally negatively by COVID-19. The business situation wasfavourable in medical technology, the defence industry, as well as in data and telecom. The level of activityremained low among the companies exposed to the Nordic engineering industry, particularly larger OEM customersthat have put new investments on hold, although some recovery was noted in September. The business situationamong the companies operating in the markets outside the Nordic region remained affected by shutdowns andrestrictions.
COMPONENTSNet sales in Components decreased in the second quarter by 5 percent to SEK 487 million (511) and EBITAdecreased by 15 percent to SEK 50 million (58). Net sales during the period decreased by 3 percent toSEK 983 million (1,015) and EBITA decreased by 11 percent to SEK 100 million (112).
MarketOn the whole, the Components business area was affected moderately negatively by COVID-19. The businesssituation in Denmark was stable, while operations in Norway were negatively affected by both currency effects andlow oil prices, with a resulting low rate of investment in the oil and gas market segment. The market situation inFinland and Sweden was negative, impacted primarily by the automotive and engineering industries, although therewas some recovery late in the quarter.
ENERGYNet sales in Energy increased in the second quarter by 7 percent to SEK 633 million (593) and EBITA increased by5 percent to SEK 79 million (75). Net sales during the period increased by 9 percent to SEK 1,316 million (1,212) andEBITA increased by 12 percent to SEK 160 million (142).
MarketThe business situation in the Energy business area remained highly favourable in the second quarter, affected onlymarginally negatively by COVID-19. Sales of infrastructure products for upgrading and building out national andregional grids and for wind power, maintained at high levels and the market situation remained stable throughoutthe quarter. The units that are active in sales of niche products for electrical power distribution and for building andinstallation continued to experience declining demand due to the pandemic.
INDUSTRIAL PROCESSNet sales in Industrial Process decreased in the second quarter by 21 percent to SEK 680 million (865) and EBITAdecreased by 42 percent to SEK 77 million (134). Net sales during the period decreased by 19 percent toSEK 1,349 million (1,672) and EBITA decreased by 37 percent to SEK 150 million (237).
MarketThe Industrial Process business area was affected very negatively by the effects of COVID-19. The demand forsolutions for scrubber installations remained low due to low oil prices and the prevailing pandemic, and this salesdecreased by approximately 75 percent compared with the corresponding period last year. The market situation forthe companies in special vehicles and the engineering industry continued to be perceived as weak in the secondquarter, although there was some recovery late in the quarter. Demand was high for projects in the forest industry.
POWER SOLUTIONSNet sales in Power Solutions decreased in the second quarter by 9 percent to SEK 365 million (402) and EBITAdecreased by 25 percent to SEK 46 million (62). Net sales during the period decreased by 9 percent toSEK 746 million (819) and EBITA decreased by 24 percent to SEK 96 million (127).
MarketThe Power Solutions business area was affected very negatively by the effects of COVID-19. The declining marketfor special vehicles continued to be what affected the business area the most as a whole, with sales decreasing byapproximately 30 percent due to the prevailing situation although a clear recovery was noted in September. Themarket situation was stable for customized battery solutions and for the companies operating in power supply. Thebusiness situation in wind power and in data and telecom remained favourable over the quarter.
ADDTECH AB (PUBL.) INTERIM REPORT 1 APRIL - 30 SEPTEMBER 2020 4

OTHER FINANCIAL INFORMATIONProfitability, financial position and cash flowThe return on equity at the end of the period was 26 percent (33), and return on capital employed was 17 percent(22). Return on working capital P/WC (EBITA in relation to working capital) amounted to 51 percent (56).
At the end of the period the equity ratio amounted to 32 percent (32). Equity per share, excluding non-controlling interest, totalled SEK 10.40 (9.60). The Group's net debt at the end of the period amounted toSEK 3,148 million (2,543), excluding pension liabilities of SEK 359 million (374). The net debt/equity ratio, calculatedon the basis of net debt excluding provisions for pensions amounted to 1.0 (1.0).
Cash and cash equivalents consisting of cash and bank equivalents and approved but non-utilised creditfacilities amounted to SEK 1,676 million (773) at 30 September 2020.
Cash flow from operating activities amounted to SEK 567 million (519) during the period. Companyacquisitions and disposals including settlement of contingent consideration regarding acquisitions implemented inprevious years amounted to SEK 888 million (295). Investments in non-current assets totalled SEK 33 million (61)and disposal of non-current assets amounted to SEK 4 million (3). Repurchase of treasury shares amounted toSEK 0 million (42). Repurchase of call options amounted to SEK 22 million (23) and issued call options amountedto SEK 17 million (23). During the second quarter, dividend of SEK 1.00 (1.25) per share was paid, totallingSEK 269 million (336).
EmployeesAt the end of the period, the number of employees was 3,090 compared to 2,981 at the beginning of the financialyear. During the period, completed acquisitions resulted in a increase of the number of employees by 187. Theaverage number of employees in the latest 12-month period was 2,990.
Ownership structureAt the end of the period the share capital amounted to SEK 51.1 million.
Class of shares Number of shares Number of votes Percentage of capital Percentage of votesClass A shares, 10 votes per share 12,885,744 128,857,440 4.7% 33.1%Class B shares, 1 vote per share 259,908,240 259,908,240 95.3% 66.9%Total number of shares before repurchases 272,793,984 388,765,680 100.0% 100.0%Repurchased class B shares -3,771,672 1.4% 1.0%Total number of shares after repurchases 269,022,312
At the annual general meeting on August 28, 2020, it was resolved on splitting each share into four shares (what isreferred to as 4:1 share split). After the split the total number of shares amounts to 272,793,984 of which 12,885,744Class A shares and 259,908,240 Class B shares. The new shares were registered on the shareholder's accounts onSeptember 17, 2020.
In accordance with a resolution of the August 2020 AGM, 25 members of management were offered the opportunityto acquire 250,000 call options on repurchased Class B shares. The programme was fully subscribed. Addtech hasfour outstanding call option programmes for a total of 3,842,400 shares. Call options issued on repurchased sharesentail a dilution effect of about 0.2 percent during the latest 12-month period. During the quarter, no treasury shareswere repurchased. Addtech's own shareholding is estimated to meet the needs of the outstanding calloption programmes.
Outstandingprogramme
Number ofoptions
Correspondingnumber of
sharesProportion of
total shares
Exerciseprice per
option
Exerciseprice per
share Expiration period2020/2024 250,000 1,000,000 0.4% 538.10 134.53 4 Sep 2023 -5 Jun 20242019/2023 300,000 1,200,000 0.4% 321.80 80.45 5 Sep 2022 - 2 Jun 20232018/2022 300,000 1,200,000 0.4% 232.90 58.23 6 Sep 2021 - 3 Jun 20222017/2021 110,600 442,400 0.2% 178.50 44.62 14 Sep 2020 - 4 Jun 2021Total 960,600 3,842,400
ADDTECH AB (PUBL.) INTERIM REPORT 1 APRIL - 30 SEPTEMBER 2020 5
Acquisitions and disposalsDuring the period, 1 April to 30 June 2020 the following acquisitions were completed; Elkome Group Oy, Finland,was acquired to become part of the Automation business area. Peter Andersson AB, Sweden, was acquired tobecome part of the Energy business area. Valutec Group AB, Sweden, was acquired to become part of the IndustrialProcess business area.
During the second quarter, four acquisitions took place.
On 1 September Fluidcontrol Oy, Finland, was acquired to become part of the Components business area.Fluidcontrol develops, delivers and installs solutions of actuators and valves for applications primarily towardsmachine builders and the process industry. The company has a sales of about EUR 4 million and 20 employees.
On 1 September Kaptas Oy, Finland, was acquired to become part of the Automation business area. Kaptasdevelops and delivers automation systems primarily to customers in pharmaceutical industry, metal,plastic, electronics and food industry. The company has a sales of about EUR 4 million and 27 employees.
On 1 September Elsystem i Perstorp AB, Sweden, acquired to become part of the Automation business area.Elsystem delivers automation solutions primarily for industrial production, automated warehouses, processindustry and heating plants. The company has a sales of about SEK 40 million and 18 employees.
On 7 September Martin Bruusgaard AS, Norway, acquired to become part of the Industrial Process business area.Bruusgaard delivers a unique turnkey portable gas detection solution, providing its customers in the marine industryincreased safety and reduced cost and transportation through standardised instruments, routines, training andprocurement.The company has a sales of about NOK 110 million and 30 employees.
The purchase price allocation calculations for the acquisitions completed during the period1 April – 30 September 2019 have now been finalised. No significant adjustments have been made to thecalculations. Acquisitions completed as of the 2019/2020 financial year are distributed among the Group’sbusiness areas as follows:
Acquisitions (disposals) ClosingNet sales, SEKm*
Number ofemployees* Business Area
Omni Ray AG, Switzerland April, 2019 330 65 AutomationThurne Teknik AB, Sweden April, 2019 100 19 Industrial ProcessAB N.O. Rönne, Sweden April, 2019 8 4 Industrial ProcessBest Seating Systems Walter Tausch GmbH,Austria May, 2019 23 5 Power SolutionsThiim A/S, Denmark June, 2019 70 15 AutomationProfelec Oy, Finland July, 2019 6 2 EnergyBKC Products Ltd., Great Britain August, 2019 12 5 Industrial ProcessPromector Oy, Finland August, 2019 24 20 AutomationWireco-NB Oy, Finland February, 2020 23 6 EnergyCaligo Industria Oy, Finland February, 2020 70 9 Industrial ProcessDMC Digital Motor Control GmbH, Germany March, 2020 30 10 Power SolutionsQ-tronic B.V, Netherlands March, 2020 45 10 Power SolutionsElkome Group Oy, Finland April, 2020 85 38 AutomationPeter Andersson AB, Sweden April, 2020 30 9 EnergyValutec Group AB, Sweden April, 2020 350 45 Industrial ProcessFluidcontrol Oy, Finland September, 2020 41 20 ComponentsKaptas Oy, Finland September, 2020 41 27 AutomationElsystem i Perstorp AB, Sweden September, 2020 40 18 AutomationMartin Bruusgaard AS, Norway September, 2020 108 30 Industrial ProcessSatco Komponent AB, Sweden October, 2020 18 2 ComponentsSkyltar & Märken Gruppen AB, Sweden October, 2020 60 23 Energy
* Refers to assessed condition at the time of acquisition and disposal, respectively, on a full-year basis.
If all acquisitions which have taken effect during the period had been completed on 1 April 2020, their impact wouldhave been an estimated SEK 320 million on Group net sales, about SEK 20 million on operating profit and aboutSEK 10 million on profit after tax for the period.
ADDTECH AB (PUBL.) INTERIM REPORT 1 APRIL - 30 SEPTEMBER 2020 6
Addtech normally employs an acquisition structure comprising basic purchase consideration and contingentconsideration. The outcome of contingent purchase considerations is determined by the future earnings reached bythe companies and is subject to a fixed maximum level. Of considerations not yet paid for acquisitions during theperiod, the discounted value amounts to SEK 127 million. The contingent purchase considerations fall due forpayment within three years and the outcome is subject to a maximum of SEK 202 million.
Transaction costs for acquisitions that resulted in an ownership transfer during the period, amounted toSEK 5 million (3) and are reported under Selling expenses.
Revaluation of contingent consideration had a positive net effect of SEK 7 million (16) during the period. Theimpact on profits are reported under Other operating income and Other operating expenses, respectively.
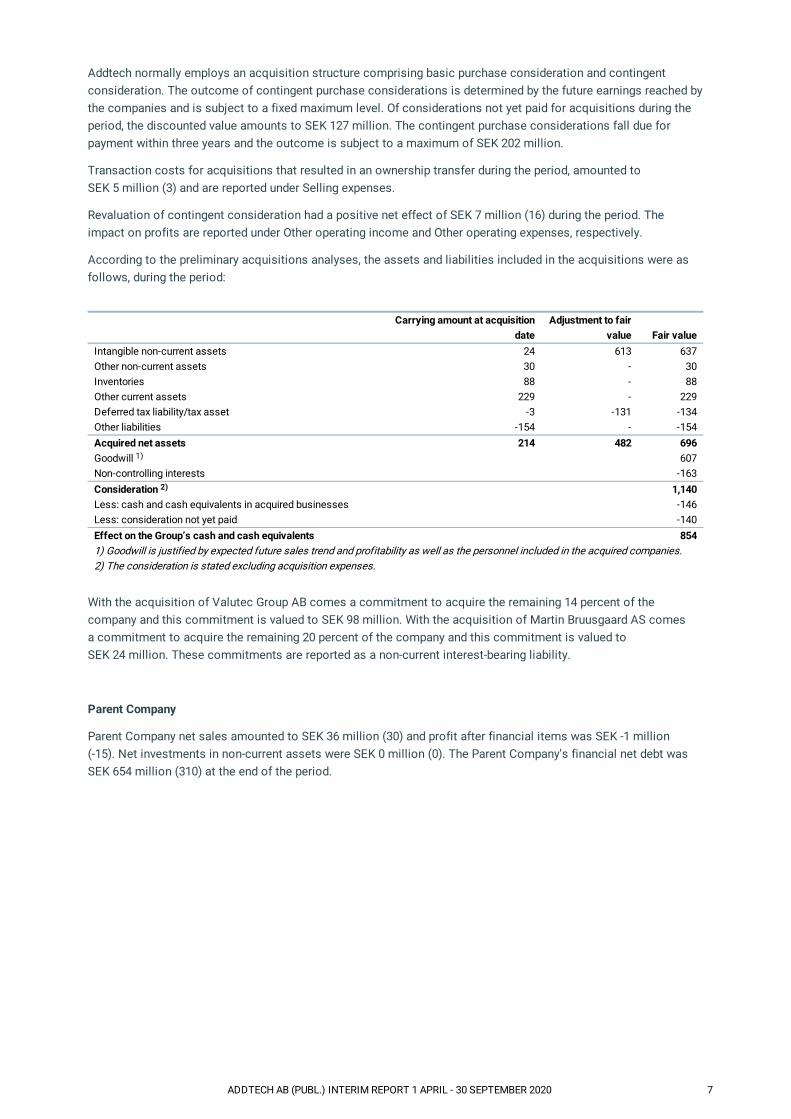
According to the preliminary acquisitions analyses, the assets and liabilities included in the acquisitions were asfollows, during the period:
Carrying amount at acquisition
dateAdjustment to fair
value Fair valueIntangible non-current assets 24 613 637Other non-current assets 30 - 30Inventories 88 - 88Other current assets 229 - 229Deferred tax liability/tax asset -3 -131 -134Other liabilities -154 - -154Acquired net assets 214 482 696Goodwill 607Non-controlling interests -163Consideration 1,140Less: cash and cash equivalents in acquired businesses -146Less: consideration not yet paid -140Effect on the Group’s cash and cash equivalents 8541) Goodwill is justified by expected future sales trend and profitability as well as the personnel included in the acquired companies.2) The consideration is stated excluding acquisition expenses.
With the acquisition of Valutec Group AB comes a commitment to acquire the remaining 14 percent of thecompany and this commitment is valued to SEK 98 million. With the acquisition of Martin Bruusgaard AS comesa commitment to acquire the remaining 20 percent of the company and this commitment is valued toSEK 24 million. These commitments are reported as a non-current interest-bearing liability.
Parent Company
Parent Company net sales amounted to SEK 36 million (30) and profit after financial items was SEK -1 million(-15). Net investments in non-current assets were SEK 0 million (0). The Parent Company's financial net debt wasSEK 654 million (310) at the end of the period.
1)
2)
ADDTECH AB (PUBL.) INTERIM REPORT 1 APRIL - 30 SEPTEMBER 2020 7
OTHER DISCLOSURESAccounting policiesThe interim report has been prepared in accordance with IFRS as adopted by the EU, with IAS 34 Interim FinancialReporting being applied. Apart from in the financial statements and their accompanying notes, disclosures inaccordance with IAS 34.16A also appear in other parts of the interim report. The interim report for the ParentCompany has been prepared in accordance with the Annual Accounts Act and the Securities Market Act, which is inaccordance with the provisions of RFR 2 Accounting for Legal Entities.
In the interim report, the same accounting principles and bases of calculation have been applied as in the mostrecent annual report, with the exception of the amended accounting principles described below.
New and amended standards for the 2020/2021 financial yearOther new or amended IFRS are not expected to have any significant effects on the Addtech Group.
Governmental support measuresThose governmental support measures that have been received or will be received as an effect of the Covid-19pandemic will be recognized in the income statement when it is reasonably certain that the conditions for receivingthe support have been met or will be met.
Alternative performance measuresThe Company presents certain financial measures in the interim report that are not defined according to IFRS. TheCompany believes that these measures provide valuable supplemental information to investors and the Company'smanagement as they allow for evaluation of trends and the Company's performance. Since all companies do notcalculate financial measures in the same way, they are not always comparable to measures used by othercompanies. These financial measures should therefore not be considered to be a replacement for measurementsas defined under IFRS. For definitions and reconciliation tables of the performance measures that Addtech uses,please see page 17-20.
Risks and factors of uncertaintyAddtech's profit and financial position, as well as its strategic position, are affected by a number of internal factorsunder Addtech's control and by a number of external factors over which Addtech has limited influence. The mostimportant risk factors for Addtech are the state of the economy, combined with structural change and thecompetitive situation.
The Covid-19 pandemic that erupted during the beginning of 2020 affects the entire world market and will alsoaffect Addtech. Addtech continues to follow the recommendations of the relevant authorities and takes relevanthealth precautions to protect staff and reduce the spread of infection in society. There are challenges in the supplychain and uncertainties exist about our customers’ ability to keep their businesses running at full capacity. Weprepare and take measures on an ongoing basis to be able to act quickly and meet a decrease in sales. Allcompanies in the Group have prepared action plans and cost-cutting programs ready to be executed to protectearnings, liquidity and cash flow.
Addtech has four operating subsidiaries within the UK as well as a few other subsidiaries doing business with theUK. The effects of Brexit are to this date unknown, but all affected subsidiaries are closely monitoring thedevelopments. Addtech Group’s total exposure to possible negative effects from Brexit are not consideredmaterial. Beside this, risks and uncertainty factors are the same as in previous periods, please see section Risksand uncertainties (page 41-43) in the annual report for 2019/2020 for further details.
The Parent Company is indirectly affected by the above risks and uncertainty factors due to its role in theorganisation.
Effects of the covid-19 pandemicAfter the outbreak of the Covid-19 pandemic the Swedish government has decided on a number of governmentsupport measures. The same has also been decided in other countries where the Addtech group operates. Addtechhas analyzed the conditions for these support measures and has applied where the criterias are judged to be met.
At the end of the second quarter, approximately 200 of the Group’s total approximately 3,000 employees have beennotified of redundancy and a further 260 employees are affected by short-term lay-offs. For the group in total EBITAis affected positively by approximately SEK 35 million from governmental support measures.
Sales in the second quarter of 2020/2021 are estimated to have been negatively affected by approximately8 percent compared to sales in the previous year due to the current pandemic. No significant write-downs havebeen done due to the current pandemic.
ADDTECH AB (PUBL.) INTERIM REPORT 1 APRIL - 30 SEPTEMBER 2020 8
Transactions with related partiesNo transactions between Addtech and related parties that have significantly affected the Group's position andearnings have taken place during the period.
Seasonal effectsAddtech's sales of high-tech products and solutions in the manufacturing industry and infrastructure are not subjectto major seasonal variations. The number of production days and customers' demand and willingness to invest canvary over the quarters.
Events after the end of the periodOn 1 October Satco Komponent AB, Sweden, was acquired to become part of the Components business area.Satco Komponent sells high-tech electronic components such as electro mechanical, RF and cooling components.Satco Komponent has two employees and annual sales of around SEK 18 million.
On 2 October, Skyltar & Märken Gruppen AB, Sweden, was acquired to become part of the Energy business area.Skyltar & Märken is a market leader in its niche providing innovative and customized signs and traffic safetysolutions for the Swedish market. Skyltar & Märken has a broad knowledge and experience in the entire value chainfrom design and construction, to production and assembly of signs and displays as well as extensive, niche trafficsafety projects. The Group has 23 employees and annual sales of around SEK 60 million.
AffirmationThe Board of Directors and the President deem that the interim report on the first six months gives a true and fairpicture of the Company's and the Group's operations, position and earnings, and describes the significant risks anduncertainty factors to which the Company and the Group are exposed.
Stockholm October 23, 2020
Johan SjöChairman of the Board
Eva ElmstedtDirector
Kenth ErikssonDirector
Henrik HedeliusDirector
Ulf MattssonDirector
Malin NordesjöDirector
Niklas StenbergDirector and President
This report has not been subject to review by the company's auditor.
FURTHER INFORMATION
PublicationThis information is information that Addtech AB (publ) is obliged to make public pursuant to the EU Market AbuseRegulation and the Securities Markets Act. The information was submitted for publication, through the agency ofthe contact persons set out below, at 8.15 a.m CET on 23 October 2020.
Future information2021-02-04 Interim report 1 April - 31 December 20202021-05-18 Year-end report 1 April 2020 - 31 March 20212021-07-16 Interim report 1 April – 30 June 2021
For further information, please contact:Niklas Stenberg, President and CEO, +46 8 470 49 00 Malin Enarson, CFO, +46 705 979 473
ADDTECH AB (PUBL.) INTERIM REPORT 1 APRIL - 30 SEPTEMBER 2020 9
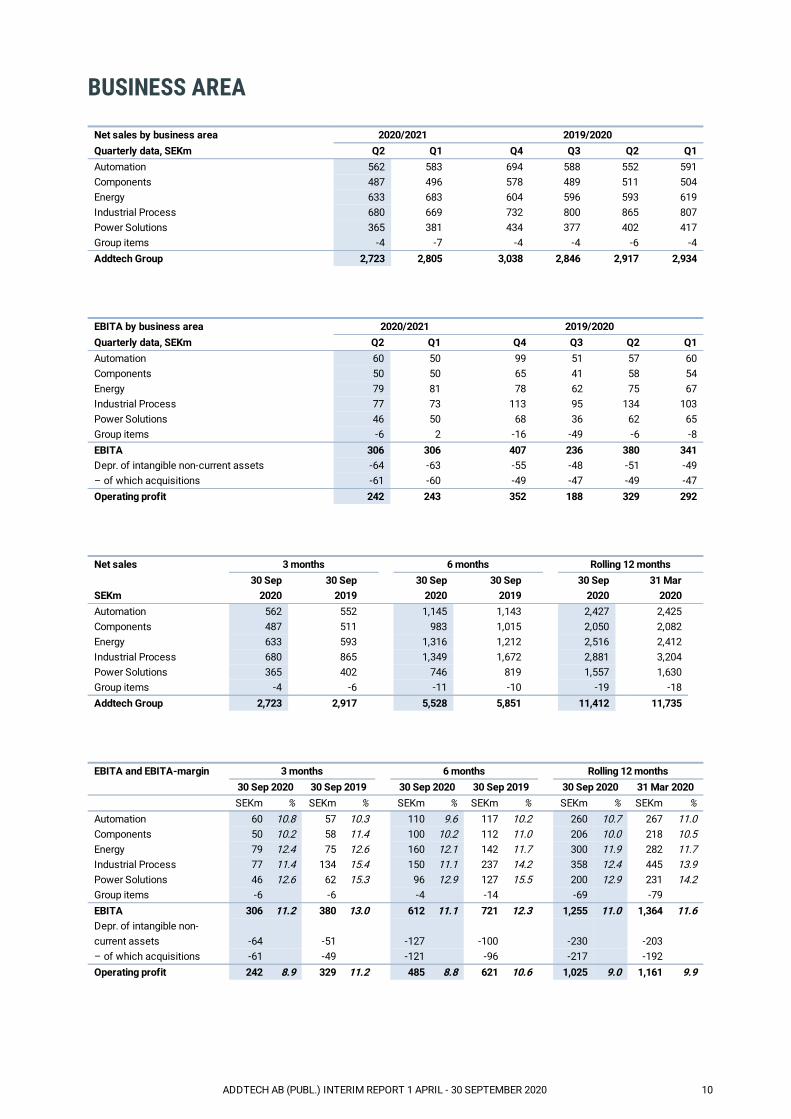
BUSINESS AREA Net sales by business area 2020/2021 2019/2020Quarterly data, SEKm Q2 Q1 Q4 Q3 Q2 Q1Automation 562 583 694 588 552 591Components 487 496 578 489 511 504Energy 633 683 604 596 593 619Industrial Process 680 669 732 800 865 807Power Solutions 365 381 434 377 402 417Group items -4 -7 -4 -4 -6 -4Addtech Group 2,723 2,805 3,038 2,846 2,917 2,934
EBITA by business area 2020/2021 2019/2020Quarterly data, SEKm Q2 Q1 Q4 Q3 Q2 Q1Automation 60 50 99 51 57 60Components 50 50 65 41 58 54Energy 79 81 78 62 75 67Industrial Process 77 73 113 95 134 103Power Solutions 46 50 68 36 62 65Group items -6 2 -16 -49 -6 -8EBITA 306 306 407 236 380 341Depr. of intangible non-current assets -64 -63 -55 -48 -51 -49– of which acquisitions -61 -60 -49 -47 -49 -47Operating profit 242 243 352 188 329 292
Net sales 3 months 6 months Rolling 12 months
SEKm30 Sep
2020 30 Sep
2019 30 Sep
2020 30 Sep
2019 30 Sep
2020 31 Mar
2020 Automation 562 552 1,145 1,143 2,427 2,425 Components 487 511 983 1,015 2,050 2,082 Energy 633 593 1,316 1,212 2,516 2,412 Industrial Process 680 865 1,349 1,672 2,881 3,204 Power Solutions 365 402 746 819 1,557 1,630 Group items -4 -6 -11 -10 -19 -18 Addtech Group 2,723 2,917 5,528 5,851 11,412 11,735
EBITA and EBITA-margin 3 months 6 months Rolling 12 months 30 Sep 2020 30 Sep 2019 30 Sep 2020 30 Sep 2019 30 Sep 2020 31 Mar 2020 SEKm % SEKm % SEKm % SEKm % SEKm % SEKm %Automation 60 10.8 57 10.3 110 9.6 117 10.2 260 10.7 267 11.0Components 50 10.2 58 11.4 100 10.2 112 11.0 206 10.0 218 10.5Energy 79 12.4 75 12.6 160 12.1 142 11.7 300 11.9 282 11.7Industrial Process 77 11.4 134 15.4 150 11.1 237 14.2 358 12.4 445 13.9Power Solutions 46 12.6 62 15.3 96 12.9 127 15.5 200 12.9 231 14.2Group items -6 -6 -4 -14 -69 -79 EBITA 306 11.2 380 13.0 612 11.1 721 12.3 1,255 11.0 1,364 11.6Depr. of intangible non-current assets -64 -51 -127 -100 -230 -203
– of which acquisitions -61 -49 -121 -96 -217 -192 Operating profit 242 8.9 329 11.2 485 8.8 621 10.6 1,025 9.0 1,161 9.9
ADDTECH AB (PUBL.) INTERIM REPORT 1 APRIL - 30 SEPTEMBER 2020 10

DISAGGREGATION OF REVENUE Net sales by the subsidiariesgeographical location
3 months 30 Sep 2020
SEKm Automation Components EnergyIndustrialProcess
PowerSolutions
Group itemsAddtech
GroupSweden 148 181 228 223 218 -2 996Denmark 147 136 138 102 22 -1 544Finland 94 110 48 147 38 -1 436Norway 55 50 133 119 20 - 377Europe 111 4 74 55 49 0 293Other countries 7 6 12 34 18 0 77Total 562 487 633 680 365 -4 2,723
Net sales by the subsidiariesgeographical location
6 months 30 Sep 2020
SEKm Automation Components EnergyIndustrialProcess
PowerSolutions
Group itemsAddtech
GroupSweden 306 382 465 455 456 -6 2,058Denmark 288 266 285 221 45 -4 1,101Finland 187 216 111 287 67 -1 867Norway 118 98 302 219 46 0 783Europe 232 9 130 99 99 0 569Other countries 14 12 23 68 33 0 150Total 1,145 983 1,316 1,349 746 -11 5,528
Net sales by the subsidiariesgeographical location
3 months 30 Sep 2019
SEKm Automation Components EnergyIndustrialProcess
PowerSolutions
Group itemsAddtech
GroupSweden 148 194 205 196 242 -2 983Denmark 142 133 139 146 25 -2 583Finland 64 126 46 186 30 -1 451Norway 61 56 133 199 25 -1 473Europe 135 2 70 67 55 0 329Other countries 2 0 0 71 25 0 98Total 552 511 593 865 402 -6 2,917
Net sales by the subsidiariesgeographical location
6 months 30 Sep 2019
SEKm Automation Components EnergyIndustrialProcess
PowerSolutions
Group itemsAddtech
GroupSweden 320 410 398 407 507 -3 2,039Denmark 269 272 284 313 48 -5 1,181Finland 164 222 94 332 58 -1 869Norway 118 107 293 364 52 -1 933Europe 268 4 142 129 104 - 647Other countries 4 0 1 127 50 0 182Total 1,143 1,015 1,212 1,672 819 -10 5,851
ADDTECH AB (PUBL.) INTERIM REPORT 1 APRIL - 30 SEPTEMBER 2020 11
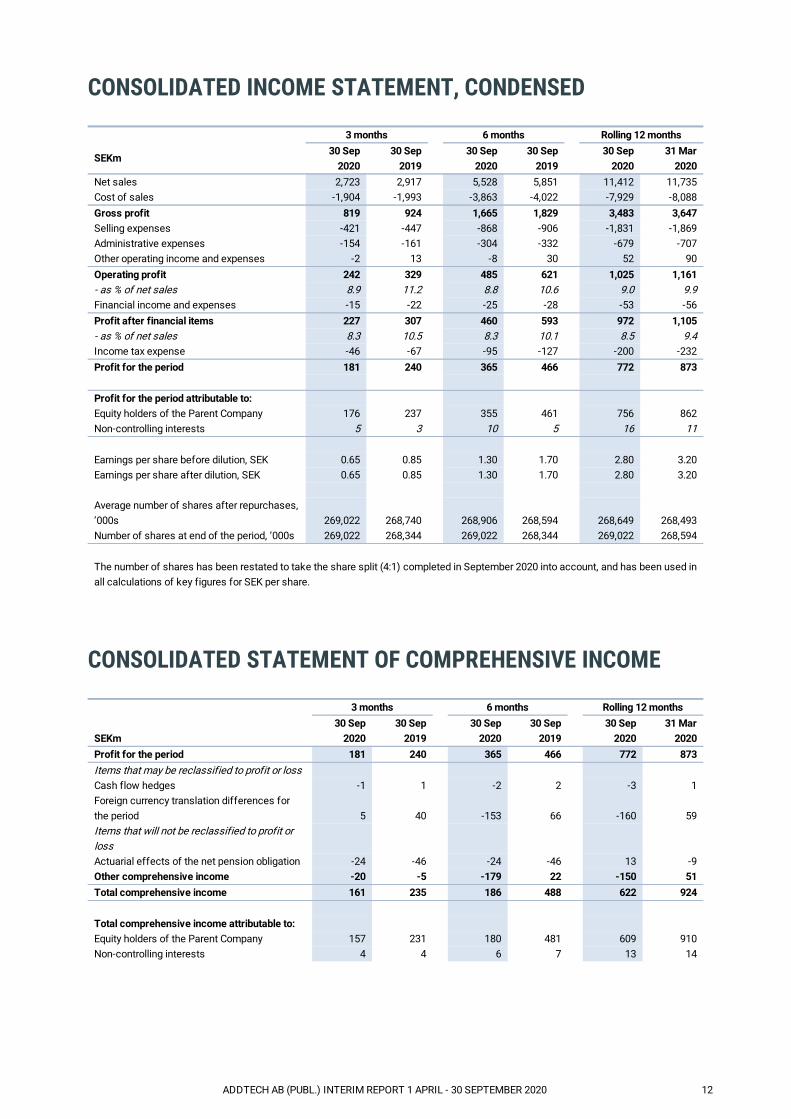
CONSOLIDATED INCOME STATEMENT, CONDENSED 3 months 6 months Rolling 12 months
SEKm30 Sep
202030 Sep
2019
30 Sep2020
30 Sep2019
30 Sep
202031 Mar
2020Net sales 2,723 2,917 5,528 5,851 11,412 11,735Cost of sales -1,904 -1,993 -3,863 -4,022 -7,929 -8,088Gross profit 819 924 1,665 1,829 3,483 3,647Selling expenses -421 -447 -868 -906 -1,831 -1,869Administrative expenses -154 -161 -304 -332 -679 -707Other operating income and expenses -2 13 -8 30 52 90Operating profit 242 329 485 621 1,025 1,161- as % of net sales 8.9 11.2 8.8 10.6 9.0 9.9Financial income and expenses -15 -22 -25 -28 -53 -56Profit after financial items 227 307 460 593 972 1,105- as % of net sales 8.3 10.5 8.3 10.1 8.5 9.4Income tax expense -46 -67 -95 -127 -200 -232Profit for the period 181 240 365 466 772 873 Profit for the period attributable to: Equity holders of the Parent Company 176 237 355 461 756 862Non-controlling interests 5 3 10 5 16 11 Earnings per share before dilution, SEK 0.65 0.85 1.30 1.70 2.80 3.20Earnings per share after dilution, SEK 0.65 0.85 1.30 1.70 2.80 3.20 Average number of shares after repurchases,’000s 269,022 268,740 268,906 268,594 268,649 268,493Number of shares at end of the period, ’000s 269,022 268,344 269,022 268,344 269,022 268,594 The number of shares has been restated to take the share split (4:1) completed in September 2020 into account, and has been used inall calculations of key figures for SEK per share.
CONSOLIDATED STATEMENT OF COMPREHENSIVE INCOME 3 months 6 months Rolling 12 months
SEKm30 Sep
202030 Sep
2019
30 Sep2020
30 Sep2019
30 Sep2020
31 Mar2020
Profit for the period 181 240 365 466 772 873Items that may be reclassified to profit or loss Cash flow hedges -1 1 -2 2 -3 1Foreign currency translation differences forthe period 5 40 -153 66 -160 59Items that will not be reclassified to profit orloss Actuarial effects of the net pension obligation -24 -46 -24 -46 13 -9Other comprehensive income -20 -5 -179 22 -150 51Total comprehensive income 161 235 186 488 622 924 Total comprehensive income attributable to: Equity holders of the Parent Company 157 231 180 481 609 910Non-controlling interests 4 4 6 7 13 14
ADDTECH AB (PUBL.) INTERIM REPORT 1 APRIL - 30 SEPTEMBER 2020 12

CONSOLIDATED BALANCE SHEET, CONDENSED SEKm 30 Sep 2020 30 Sep 2019 31 Mar 2020Goodwill 2,553 1,917 1,997Other intangible non-current assets 1,725 1,246 1,243Property, plant and equipment 883 873 936Financial non-current assets 66 62 64Total non-current assets 5,227 4,098 4,240Inventories 1,810 1,632 1,642Current receivables 2,053 2,150 2,261Cash and cash equivalents 467 258 363Total current assets 4,330 4,040 4,266Total assets 9,557 8,138 8,506Total equity 3,028 2,627 3,076Interest-bearing provisions 359 374 332Non-interest-bearing provisions 375 340 284Non-current interest-bearing liabilities 2,326 1,411 2,154Non-current non-interest-bearing liabilities 2 6 2Total non-current liabilities 3,062 2,131 2,772Non-interest-bearing provisions 64 47 46Current interest-bearing liabilities 1,289 1,390 462Current non-interest-bearing liabilities 2,114 1,943 2,150Total current liabilities 3,467 3,380 2,658Total equity and liabilities 9,557 8,138 8,506
CONSOLIDATED STATEMENT OF CHANGES IN EQUITY,CONDENSED
SEKm 30 Sep 2020 30 Sep 2019 31 Mar 2020Opening balance 3,076 2,520 2,520Exercised, issued and repurchased options -5 0 16Repurchase of treasury shares - -42 -42Dividend, ordinary -269 -336 -336Dividend, non-controlling interests -1 -7 -10Change non-controlling interests 163 4 4Option debt, acquisition -122 - -Total comprehensive income 186 488 924Closing balance 3,028 2,627 3,076
ADDTECH AB (PUBL.) INTERIM REPORT 1 APRIL - 30 SEPTEMBER 2020 13
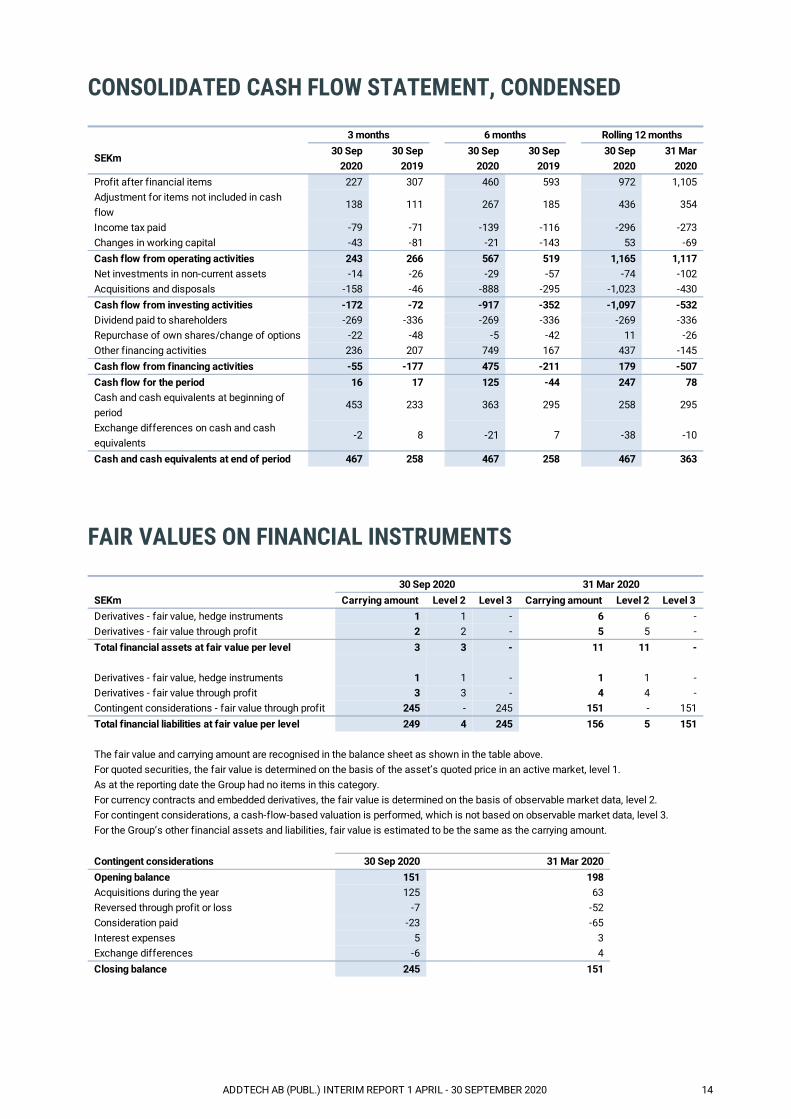
CONSOLIDATED CASH FLOW STATEMENT, CONDENSED 3 months 6 months Rolling 12 months
SEKm30 Sep
202030 Sep
2019
30 Sep2020
30 Sep2019
30 Sep
202031 Mar
2020Profit after financial items 227 307 460 593 972 1,105Adjustment for items not included in cashflow
138 111 267 185 436 354
Income tax paid -79 -71 -139 -116 -296 -273Changes in working capital -43 -81 -21 -143 53 -69Cash flow from operating activities 243 266 567 519 1,165 1,117Net investments in non-current assets -14 -26 -29 -57 -74 -102Acquisitions and disposals -158 -46 -888 -295 -1,023 -430Cash flow from investing activities -172 -72 -917 -352 -1,097 -532Dividend paid to shareholders -269 -336 -269 -336 -269 -336Repurchase of own shares/change of options -22 -48 -5 -42 11 -26Other financing activities 236 207 749 167 437 -145Cash flow from financing activities -55 -177 475 -211 179 -507Cash flow for the period 16 17 125 -44 247 78Cash and cash equivalents at beginning ofperiod
453 233 363 295 258 295
Exchange differences on cash and cashequivalents
-2 8 -21 7 -38 -10
Cash and cash equivalents at end of period 467 258 467 258 467 363
FAIR VALUES ON FINANCIAL INSTRUMENTS 30 Sep 2020 31 Mar 2020SEKm Carrying amount Level 2 Level 3 Carrying amount Level 2 Level 3Derivatives - fair value, hedge instruments 1 1 - 6 6 -Derivatives - fair value through profit 2 2 - 5 5 -Total financial assets at fair value per level 3 3 - 11 11 - Derivatives - fair value, hedge instruments 1 1 - 1 1 -Derivatives - fair value through profit 3 3 - 4 4 -Contingent considerations - fair value through profit 245 - 245 151 - 151Total financial liabilities at fair value per level 249 4 245 156 5 151 The fair value and carrying amount are recognised in the balance sheet as shown in the table above. For quoted securities, the fair value is determined on the basis of the asset’s quoted price in an active market, level 1. As at the reporting date the Group had no items in this category. For currency contracts and embedded derivatives, the fair value is determined on the basis of observable market data, level 2. For contingent considerations, a cash-flow-based valuation is performed, which is not based on observable market data, level 3. For the Group’s other financial assets and liabilities, fair value is estimated to be the same as the carrying amount. Contingent considerations 30 Sep 2020 31 Mar 2020 Opening balance 151 198 Acquisitions during the year 125 63 Reversed through profit or loss -7 -52 Consideration paid -23 -65 Interest expenses 5 3 Exchange differences -6 4 Closing balance 245 151
ADDTECH AB (PUBL.) INTERIM REPORT 1 APRIL - 30 SEPTEMBER 2020 14
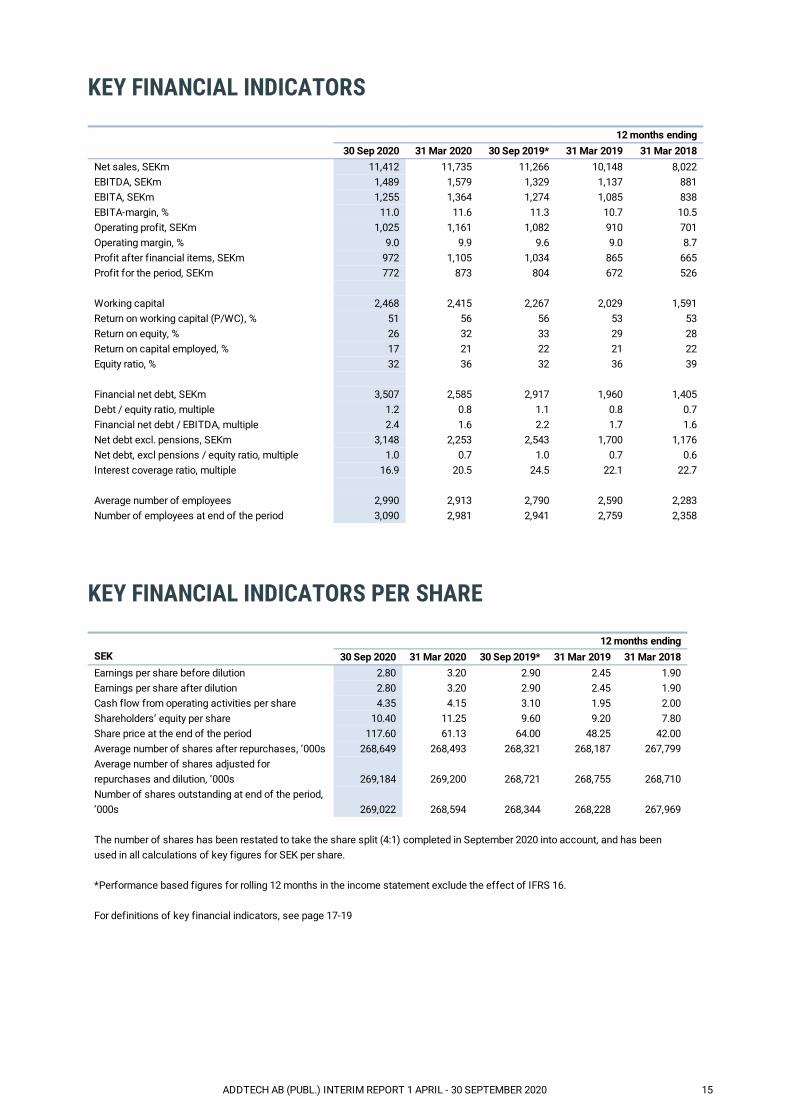
KEY FINANCIAL INDICATORS 12 months ending 30 Sep 2020 31 Mar 2020 30 Sep 2019* 31 Mar 2019 31 Mar 2018Net sales, SEKm 11,412 11,735 11,266 10,148 8,022EBITDA, SEKm 1,489 1,579 1,329 1,137 881EBITA, SEKm 1,255 1,364 1,274 1,085 838EBITA-margin, % 11.0 11.6 11.3 10.7 10.5Operating profit, SEKm 1,025 1,161 1,082 910 701Operating margin, % 9.0 9.9 9.6 9.0 8.7Profit after financial items, SEKm 972 1,105 1,034 865 665Profit for the period, SEKm 772 873 804 672 526 Working capital 2,468 2,415 2,267 2,029 1,591Return on working capital (P/WC), % 51 56 56 53 53Return on equity, % 26 32 33 29 28Return on capital employed, % 17 21 22 21 22Equity ratio, % 32 36 32 36 39 Financial net debt, SEKm 3,507 2,585 2,917 1,960 1,405Debt / equity ratio, multiple 1.2 0.8 1.1 0.8 0.7Financial net debt / EBITDA, multiple 2.4 1.6 2.2 1.7 1.6Net debt excl. pensions, SEKm 3,148 2,253 2,543 1,700 1,176Net debt, excl pensions / equity ratio, multiple 1.0 0.7 1.0 0.7 0.6Interest coverage ratio, multiple 16.9 20.5 24.5 22.1 22.7 Average number of employees 2,990 2,913 2,790 2,590 2,283Number of employees at end of the period 3,090 2,981 2,941 2,759 2,358
KEY FINANCIAL INDICATORS PER SHARE 12 months endingSEK 30 Sep 2020 31 Mar 2020 30 Sep 2019* 31 Mar 2019 31 Mar 2018Earnings per share before dilution 2.80 3.20 2.90 2.45 1.90Earnings per share after dilution 2.80 3.20 2.90 2.45 1.90Cash flow from operating activities per share 4.35 4.15 3.10 1.95 2.00Shareholders’ equity per share 10.40 11.25 9.60 9.20 7.80Share price at the end of the period 117.60 61.13 64.00 48.25 42.00Average number of shares after repurchases, ’000s 268,649 268,493 268,321 268,187 267,799Average number of shares adjusted forrepurchases and dilution, ’000s 269,184 269,200 268,721 268,755 268,710Number of shares outstanding at end of the period,’000s 269,022 268,594 268,344 268,228 267,969 The number of shares has been restated to take the share split (4:1) completed in September 2020 into account, and has beenused in all calculations of key figures for SEK per share. *Performance based figures for rolling 12 months in the income statement exclude the effect of IFRS 16. For definitions of key financial indicators, see page 17-19
ADDTECH AB (PUBL.) INTERIM REPORT 1 APRIL - 30 SEPTEMBER 2020 15

PARENT COMPANY INCOME STATEMENT 3 months 6 months Rolling 12 months
SEKm30 Sep
202030 Sep
2019
30 Sep2020
30 Sep2019
30 Sep
202031 Mar
2020Net sales 18 15 36 30 77 71Administrative expenses -18 -21 -34 -45 -97 -108Operating profit/loss 0 -6 2 -15 -20 -37Interest income and expenses and similaritems -5 -6 -3 0 -7 -4Profit after financial items -5 -12 -1 -15 -27 -41Appropriations - - - - 310 310Profit before taxes -5 -12 -1 -15 283 269Income tax expense 1 3 0 3 -63 -60Profit for the period -4 -9 -1 -12 220 209 Total comprehensive income -4 -9 -1 -12 220 209
PARENT COMPANY BALANCE SHEET SEKm 30 Sep 2020 30 Sep 2019 31 Mar 2020Intangible non-current assets 1 - 1Property, plant and equipment 0 1 0Non-current financial assets 3,677 2,643 2,808Total non-current assets 3,678 2,644 2,809Current receivables 441 690 563Cash and bank balances - - -Total current assets 441 690 563Total assets 4,119 3,334 3,372Equity 230 269 506Untaxed reserves 131 447 131Provisions 14 14 15Non-current liabilities 1,919 996 1,727Current liabilities 1,825 1,608 993Total equity and liabilities 4,119 3,334 3,372
ADDTECH AB (PUBL.) INTERIM REPORT 1 APRIL - 30 SEPTEMBER 2020 16
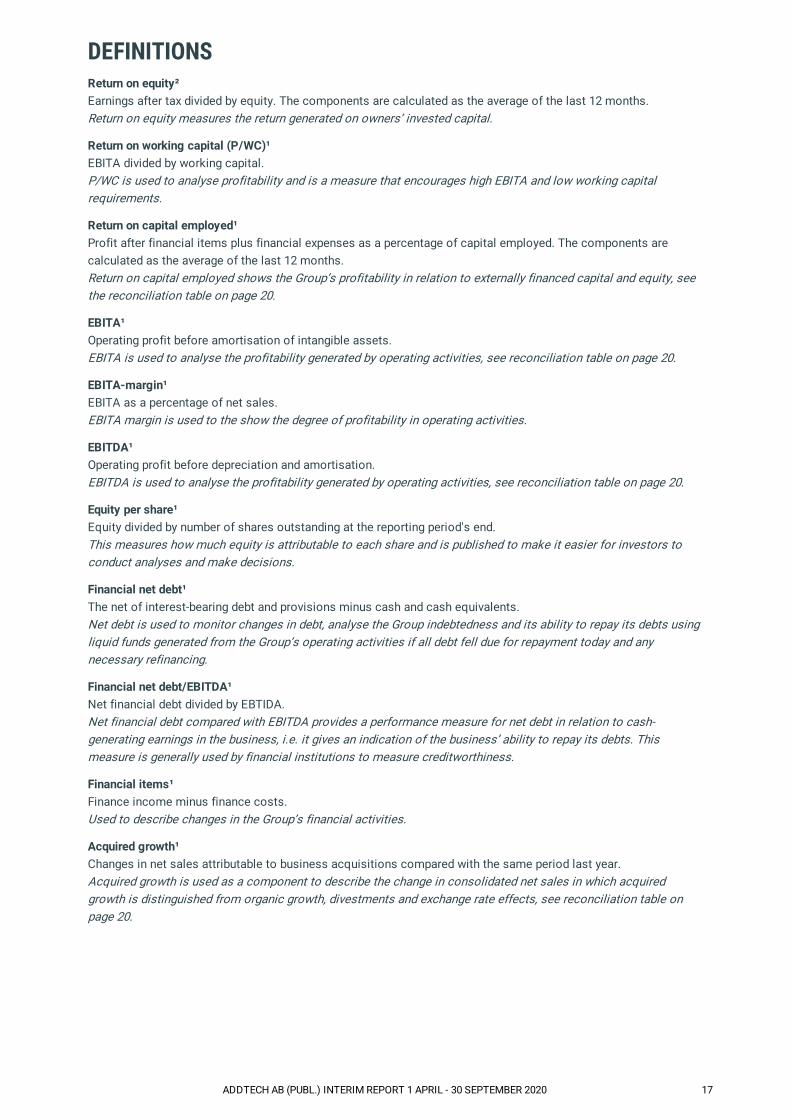
DEFINITIONSReturn on equity²Earnings after tax divided by equity. The components are calculated as the average of the last 12 months.Return on equity measures the return generated on owners’ invested capital.
Return on working capital (P/WC)¹EBITA divided by working capital.P/WC is used to analyse profitability and is a measure that encourages high EBITA and low working capitalrequirements.
Return on capital employed¹Profit after financial items plus financial expenses as a percentage of capital employed. The components arecalculated as the average of the last 12 months.Return on capital employed shows the Group’s profitability in relation to externally financed capital and equity, seethe reconciliation table on page 20.
EBITA¹Operating profit before amortisation of intangible assets.EBITA is used to analyse the profitability generated by operating activities, see reconciliation table on page 20.
EBITA-margin¹EBITA as a percentage of net sales.EBITA margin is used to the show the degree of profitability in operating activities.
EBITDA¹Operating profit before depreciation and amortisation.EBITDA is used to analyse the profitability generated by operating activities, see reconciliation table on page 20.
Equity per share¹Equity divided by number of shares outstanding at the reporting period's end.This measures how much equity is attributable to each share and is published to make it easier for investors toconduct analyses and make decisions.
Financial net debt¹The net of interest-bearing debt and provisions minus cash and cash equivalents.Net debt is used to monitor changes in debt, analyse the Group indebtedness and its ability to repay its debts usingliquid funds generated from the Group’s operating activities if all debt fell due for repayment today and anynecessary refinancing.
Financial net debt/EBITDA¹Net financial debt divided by EBTIDA.Net financial debt compared with EBITDA provides a performance measure for net debt in relation to cash-generating earnings in the business, i.e. it gives an indication of the business’ ability to repay its debts. Thismeasure is generally used by financial institutions to measure creditworthiness.
Financial items¹Finance income minus finance costs.Used to describe changes in the Group’s financial activities.
Acquired growth¹Changes in net sales attributable to business acquisitions compared with the same period last year.Acquired growth is used as a component to describe the change in consolidated net sales in which acquiredgrowth is distinguished from organic growth, divestments and exchange rate effects, see reconciliation table onpage 20.
ADDTECH AB (PUBL.) INTERIM REPORT 1 APRIL - 30 SEPTEMBER 2020 17

Cash flow from operating activities per share¹Cash flow from operating activities, divided by the average number of outstanding shares after repurchase.This measure is used so investors can easily analyse the size of the surplus generated per share from operatingactivities.
Net investments in non-current assets¹Investments in non-current assets minus sales of non-current assets.This measure is used to analyse the Group’s investments in renewing and developing property, plant andequipment.
Net debt excluding pensions¹The net of interest-bearing debt and provisions excluding pensions minus cash and cash equivalents.A measure used to analyse financial risk, see reconciliation table on page 20.
Net debt excluding pensions/ equity ratio¹ ²Net debt excluding pensions divided by shareholders' equity.A measure used to analyse financial risk, see reconciliation table on page 20.
Organic growth¹Changes in net sales excluding currency effects, acquisitions and divestments compared with the same period lastyear.Organic growth is used to analyse underlying sales growth driven a change in volumes, product range and price forsimilar products between different periods, see reconciliation table on page 20.
Profit after financial items¹Profit/loss for the period before tax.Used to analyse the business’ profitability including financial activities.
Earnings per share (EPS)Shareholders’ share of profit for the period after tax, divided by the weighted average number of shares during theperiod.
Earnings per share (EPS), dilutedShareholders’ share of profit for the period after tax, divided by the weighted average number of shares during theperiod, adjusted for the additional number of shares in the event of outstanding options being used.
Interest coverage ratio¹Earnings after net financial items plus interest expense and bank charges divided by interest expense and bankcharges.This performance indicator measures the Group’s capacity through its business operations and finance income togenerate a sufficiently large surplus to cover its finance costs, see reconciliation table on page 20.
Working capital¹Working capital (WC) is measured through an annual average defined as inventories plus accounts receivable lessaccounts payable.Working capital is used to analyse how much working capital is tied up in the business, see reconciliation table onpage 20.
Operating margin¹Operating profit as a percentage of net sales.This measure is used to specify the percentage of sales that is left to cover interest and tax, and to provide a profit,after the company’s costs have been paid.
Operating profit¹Operating income minus operating expenses.Used to describe the Group’s earnings before interest and tax.
ADDTECH AB (PUBL.) INTERIM REPORT 1 APRIL - 30 SEPTEMBER 2020 18

Debt/equity ratio¹ ²Financial net liabilities divided by equity.A measure used to analyse financial risk.
Equity ratio¹ ²Equity as a percentage of total assets.The equity/assets ratio is used to analyse financial risk and show the percentage of assets that are funded withequity.
Capital employed¹Total assets minus non-interest-bearing liabilities and provisions.Capital employed shows the size of the company’s assets that have been lent to the company’s owners or thathave been lent out by lenders, see reconciliation table on page 20.
Outstanding sharesTotal number of shares less treasury shares repurchased by the Company.
¹The performance measure is an alternative performance measure according to ESMA’s guidelines.²Minority interest is included in equity when the performance measures are calculated.
ADDTECH AB (PUBL.) INTERIM REPORT 1 APRIL - 30 SEPTEMBER 2020 19
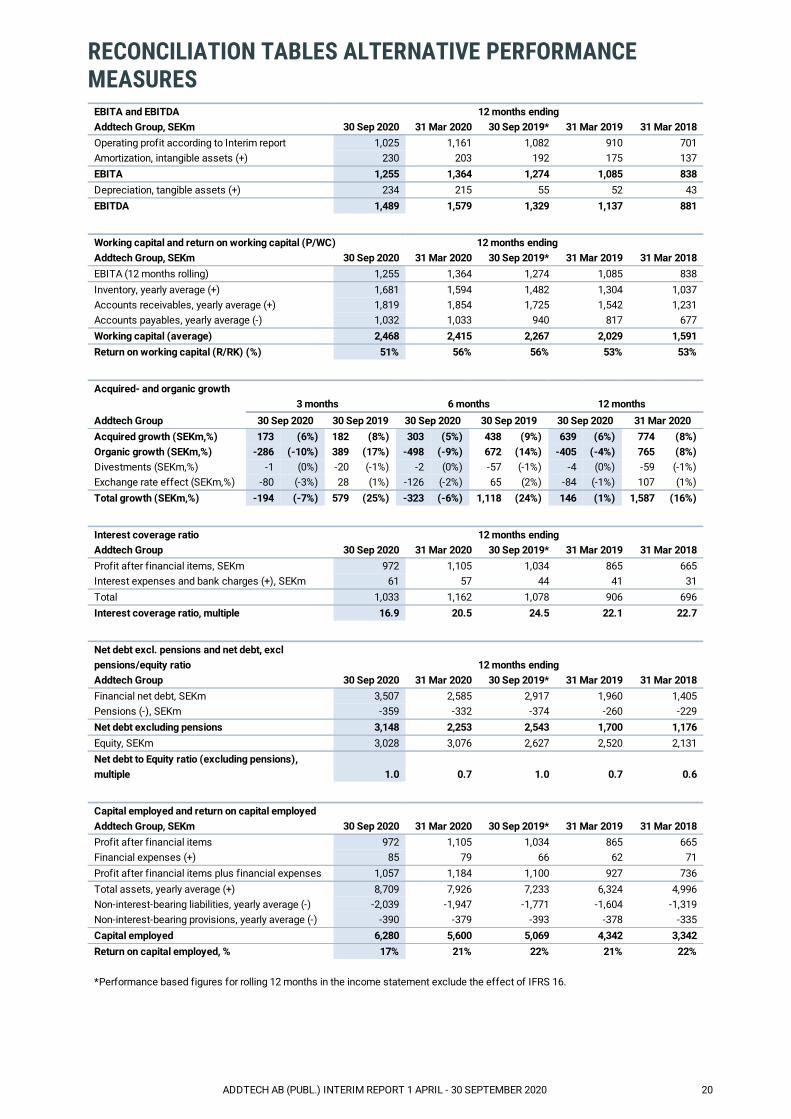
RECONCILIATION TABLES ALTERNATIVE PERFORMANCEMEASURES
EBITA and EBITDA 12 months endingAddtech Group, SEKm 30 Sep 2020 31 Mar 2020 30 Sep 2019* 31 Mar 2019 31 Mar 2018Operating profit according to Interim report 1,025 1,161 1,082 910 701Amortization, intangible assets (+) 230 203 192 175 137EBITA 1,255 1,364 1,274 1,085 838Depreciation, tangible assets (+) 234 215 55 52 43EBITDA 1,489 1,579 1,329 1,137 881
Working capital and return on working capital (P/WC) 12 months ending Addtech Group, SEKm 30 Sep 2020 31 Mar 2020 30 Sep 2019* 31 Mar 2019 31 Mar 2018EBITA (12 months rolling) 1,255 1,364 1,274 1,085 838Inventory, yearly average (+) 1,681 1,594 1,482 1,304 1,037Accounts receivables, yearly average (+) 1,819 1,854 1,725 1,542 1,231Accounts payables, yearly average (-) 1,032 1,033 940 817 677Working capital (average) 2,468 2,415 2,267 2,029 1,591Return on working capital (R/RK) (%) 51% 56% 56% 53% 53%
Acquired- and organic growth 3 months 6 months 12 months Addtech Group 30 Sep 2020 30 Sep 2019 30 Sep 2020 30 Sep 2019 30 Sep 2020 31 Mar 2020Acquired growth (SEKm,%) 173 (6%) 182 (8%) 303 (5%) 438 (9%) 639 (6%) 774 (8%)Organic growth (SEKm,%) -286 (-10%) 389 (17%) -498 (-9%) 672 (14%) -405 (-4%) 765 (8%)Divestments (SEKm,%) -1 (0%) -20 (-1%) -2 (0%) -57 (-1%) -4 (0%) -59 (-1%)Exchange rate effect (SEKm,%) -80 (-3%) 28 (1%) -126 (-2%) 65 (2%) -84 (-1%) 107 (1%)Total growth (SEKm,%) -194 (-7%) 579 (25%) -323 (-6%) 1,118 (24%) 146 (1%) 1,587 (16%)
Interest coverage ratio 12 months endingAddtech Group 30 Sep 2020 31 Mar 2020 30 Sep 2019* 31 Mar 2019 31 Mar 2018Profit after financial items, SEKm 972 1,105 1,034 865 665Interest expenses and bank charges (+), SEKm 61 57 44 41 31Total 1,033 1,162 1,078 906 696Interest coverage ratio, multiple 16.9 20.5 24.5 22.1 22.7
Net debt excl. pensions and net debt, exclpensions/equity ratio 12 months endingAddtech Group 30 Sep 2020 31 Mar 2020 30 Sep 2019* 31 Mar 2019 31 Mar 2018Financial net debt, SEKm 3,507 2,585 2,917 1,960 1,405Pensions (-), SEKm -359 -332 -374 -260 -229Net debt excluding pensions 3,148 2,253 2,543 1,700 1,176Equity, SEKm 3,028 3,076 2,627 2,520 2,131Net debt to Equity ratio (excluding pensions),multiple 1.0 0.7 1.0 0.7 0.6
Capital employed and return on capital employed Addtech Group, SEKm 30 Sep 2020 31 Mar 2020 30 Sep 2019* 31 Mar 2019 31 Mar 2018Profit after financial items 972 1,105 1,034 865 665Financial expenses (+) 85 79 66 62 71Profit after financial items plus financial expenses 1,057 1,184 1,100 927 736Total assets, yearly average (+) 8,709 7,926 7,233 6,324 4,996Non-interest-bearing liabilities, yearly average (-) -2,039 -1,947 -1,771 -1,604 -1,319Non-interest-bearing provisions, yearly average (-) -390 -379 -393 -378 -335Capital employed 6,280 5,600 5,069 4,342 3,342Return on capital employed, % 17% 21% 22% 21% 22% *Performance based figures for rolling 12 months in the income statement exclude the effect of IFRS 16.
ADDTECH AB (PUBL.) INTERIM REPORT 1 APRIL - 30 SEPTEMBER 2020 20
This is AddtechAddtech is a Swedish, listed technology trading group that combines the flexibility and speed of a small companywith the resources of a large company. We acquire, own and develop independent subsidiaries that sell varioushigh-tech products and solutions to customers, primarily within industry and infrastructure. With in-depth expertisein a number of different niches, our subsidiaries generate added technical, financial and sustainable value forcustomers and suppliers alike, thus helping increase the efficiency and competitiveness of all involved. Wecurrently own some 130 companies in 20 countries, and have a long history of sustainable, profitable growth.
Our vision
We are to be a leader in value-adding technology trading, perceived as the most skilled and long-term partner of ourcustomers, suppliers and employees.
Business concept in brief
Addtech offers high-tech products and solutions for companies in the manufacturing and infrastructure sectors.Addtech contributes added technical and financial value by being a skilled and professional partner for customersand manufacturers.
We build shareholder value through:
ADDTECH AB (PUBL.) Org.nr: 556302-9726, Box 5112, 102 43 Stockholm, Visiting address: Birger Jarlsgatan 43 Tel: +46 8 470 49 00, [email protected]
our 130 subsidiaries and their capacity to generate earnings growth○
corporate governance that ensures the companies achieve even better results and development○
acquisitions that bring in new employees, customers and suppliers○
ADDTECH AB (PUBL.) INTERIM REPORT 1 APRIL - 30 SEPTEMBER 2020 21