Embed Size (px)
Citation preview

BANG & OLUFSEN A/SCompany announcement no. 17.12 – 11 January 2018
INTERIM REPORT 1ST HALF-YEAR 2017/18
1 JUNE 2017 –30 NOVEMBER 2017
Bang & Olufsen a/s
Peter Bangs Vej 15
DK-7600 Struer
Tel. +45 9684 1122
www.bang-olufsen.com
Comreg: 41257911

BANG & OLUFSEN A/S INTERIM REPORT 2ND QUARTER 2017/18 · 2
Q2 HIGHLIGHTS“In the second quarter, we delivered double-digit growth and
improved our profitability, and we remain on track for the full year. The result was driven by strong sales in B&O PLAY, cost control and
positive developments across all markets. All in all, I am pleased with the progress that we have made in the first 6 months. It
underlines that we have a strong product portfolio and that our continued focus on creating a scalable business model is paying off”,
says CEO Henrik Clausen.
Underlying business has been adjusted for non-recurring and aperiodic items
Key financial highlights Q2
Q2 Q2 YTD YTD (DKK million) 2017/18 2016/17 Change % 2017/18 2016/17 Change %
Revenue 999 867 15 1,591 1,383 15Bang & Olufsen 516 496 4 841 783 8B&O PLAY 483 371 30 750 600 25 Gross margin, % 41.2 41.2 0.0 40.7 38.3 2.3Bang & Olufsen, % 45.5 45.5 0.0 43.4 41.0 2.4B&O PLAY, % 36.5 35.6 0.8 37.6 34.8 2.8 Capacity costs 346 330 4.9 647 591 9.5Capacity Costs, underlying business 341 330 3.5 642 591 8.7EBITDAC 148 70 106 3 EBITDAC, underlying business 135 70 93 3 EBIT 83 37 18 (52) EBIT, underlying business 70 37 5 (52) Free cash flow 44 131 (114) 99
All numbers are compared to same period last year:
Second quarter 2017/18
• The Group realised a revenue growth of 15 per
cent. The revenue of the B&O PLAY business unit
increased by 30 per cent, and the revenue of the
Bang & Olufsen business unit increased by 4 per
cent. The growth was driven by a combination of
strong sales of both existing and new products with
good development across all markets.
HIGHLIGHTS · KEY FIGURES · MANAGEMENT REPORT · STATEMENT · FINANCIAL REVIEW · ADDITIONAL INFORMATIONHighlights

BANG & OLUFSEN A/S INTERIM REPORT 2ND QUARTER 2017/18 · 3
• As expected, the gross margin for the Group was on
par with last year (41.2 per cent), but with a higher
share of the revenue coming from the B&O PLAY
business unit.
• Capacity costs in the underlying business increased
by 3.5 per cent, mainly due to higher depreciations.
Excluding the effect from the higher depreciations,
capacity costs were slightly below last year.
• EBITDAC in the underlying business was DKK 135
million against DKK 70 million last year. The com-
pany’s ability to increase revenue without increasing
capacity costs was key to the improved profitability.
• Free cash flow was positive DKK 44 million against
DKK 131 million last year. Last year, free cash flow in-
cluded the escrow payment from HARMAN of DKK
93 million, and excluding this impact free cash flow
improved by DKK 6 million.
First half year 2017/18
• The Group’s total revenue for the first half of 2017/18
was DKK 1,591 million, corresponding to an increase
of 15 per cent, which was driven by 25 per cent
growth in the B&O PLAY business unit and 8 per
cent growth in the Bang & Olufsen business unit
compared to last year. EBITDAC in the underlying
business for the first half of 2017/18 was DKK 93 mil-
lion, which was an improvement of DKK 90 million
compared to last year, while EBIT in the underlying
business was DKK 5 million compared to negative
DKK 52 million last year. Free cash flow in the first
half of 2017/18 was negative DKK 114 million against
DKK 99 million last year. The development was
mainly due to an increase in net working capital of
DKK 144 million compared to 31 May 2017.
Outlook
• The Group expects to continue the growth momen-
tum and increase revenue by around 10 per cent
compared to 2016/17, and to increase the underly-
ing EBITDAC margin to 8-10 per cent in 2017/18. The
Group’s free cash flow is expected to be positive in
2017/18. The EBIT margin for the underlying business
is expected to be around 3 per cent (previously 1-3
per cent) for 2017/18.
Any enquiries about this announcement can be
addressed to:
Investor contact, Claus Højmark Jensen,
tel.: +45 2325 1067
Press contact, Jens Bjørnkjær Gamborg,
tel.: +45 2496 9371
A webcast will be hosted on 11 January 2018 at 10:00
CET. Access to the webcast is obtained through our
website www.bang-olufsen.com.
HIGHLIGHTS · KEY FIGURES · MANAGEMENT REPORT · STATEMENT · FINANCIAL REVIEW · ADDITIONAL INFORMATION
BANG & OLUFSEN A/S INTERIM REPORT 2ND QUARTER 2017/18 · 4
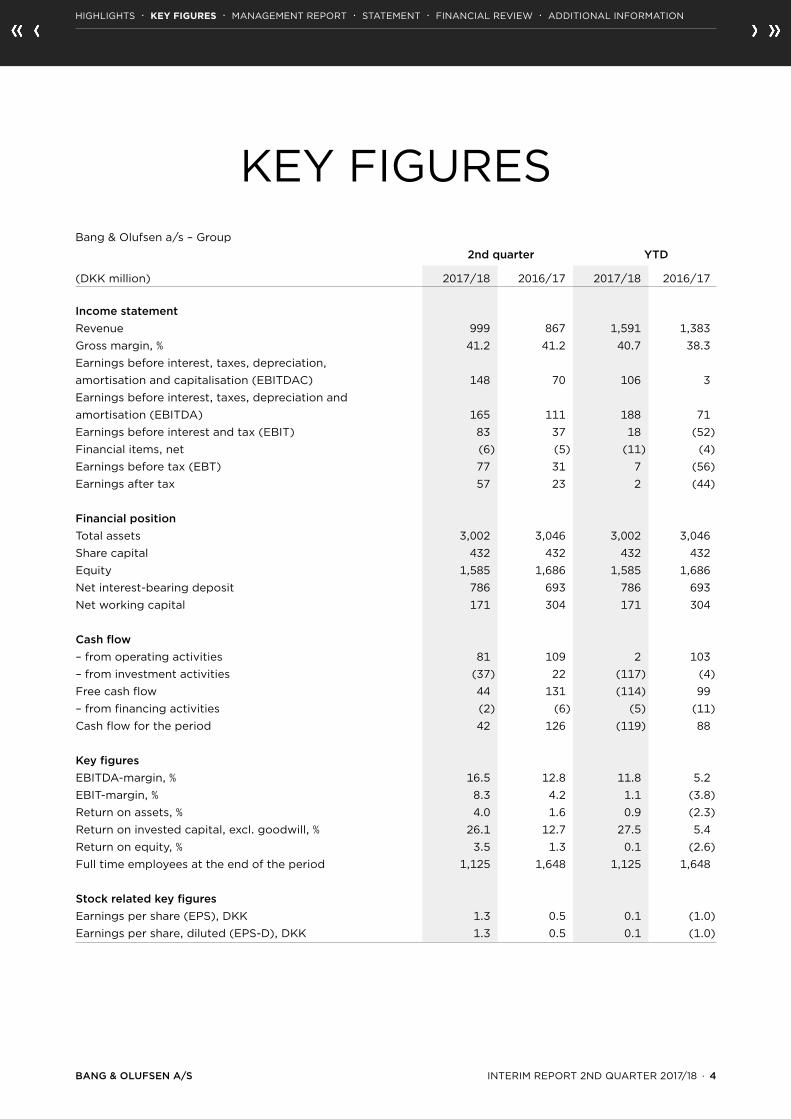
Bang & Olufsen a/s – Group 2nd quarter YTD
(DKK million) 2017/18 2016/17 2017/18 2016/17
Income statementRevenue 999 867 1,591 1,383 Gross margin, % 41.2 41.2 40.7 38.3 Earnings before interest, taxes, depreciation, amortisation and capitalisation (EBITDAC) 148 70 106 3 Earnings before interest, taxes, depreciation and amortisation (EBITDA) 165 111 188 71 Earnings before interest and tax (EBIT) 83 37 18 (52)Financial items, net (6) (5) (11) (4)Earnings before tax (EBT) 77 31 7 (56)Earnings after tax 57 23 2 (44) Financial position Total assets 3,002 3,046 3,002 3,046 Share capital 432 432 432 432 Equity 1,585 1,686 1,585 1,686 Net interest-bearing deposit 786 693 786 693 Net working capital 171 304 171 304 Cash flow – from operating activities 81 109 2 103 – from investment activities (37) 22 (117) (4)Free cash flow 44 131 (114) 99 – from financing activities (2) (6) (5) (11)Cash flow for the period 42 126 (119) 88 Key figures EBITDA-margin, % 16.5 12.8 11.8 5.2 EBIT-margin, % 8.3 4.2 1.1 (3.8)Return on assets, % 4.0 1.6 0.9 (2.3)Return on invested capital, excl. goodwill, % 26.1 12.7 27.5 5.4 Return on equity, % 3.5 1.3 0.1 (2.6)Full time employees at the end of the period 1,125 1,648 1,125 1,648 Stock related key figures Earnings per share (EPS), DKK 1.3 0.5 0.1 (1.0)Earnings per share, diluted (EPS-D), DKK 1.3 0.5 0.1 (1.0)
KEY FIGURES
HIGHLIGHTS · KEY FIGURES · MANAGEMENT REPORT · STATEMENT · FINANCIAL REVIEW · ADDITIONAL INFORMATIONKey figures

BANG & OLUFSEN A/S INTERIM REPORT 2ND QUARTER 2017/18 · 5
Revenue development by business unit
The Group’s revenue increased from DKK 867 million
last year to DKK 999 million, corresponding to a growth
of 15 per cent (17 per cent in local currency). Overall,
revenue in the quarter was characterised by solid de-
mand across all channels prior to the high season. Year-
MANAGEMENT REPORTThe B&O PLAY and Bang & Olufsen business units grew by 30 per cent and 4 per cent respectively. The Group managed to increase revenue without increasing capacity costs in the second quarter,
which drove the improved profitability.
to-date Group revenue increased by 15 per cent (17 per
cent in local currency).
The Bang & Olufsen business unit realised a revenue of
DKK 516 million, compared to DKK 496 million last year,
which was an increase of 4 per cent (7 per cent in lo-
Revenue by business unit (growth in local currency in parenthesis)
Bang & Olufsen
Q2 16/17
B&O PLAY Total
Q2 17/18
0
200
400
600
800
1000
1200
0
200
400
600
800
1,000
1,200
-2%
+44%
+30%(+32%)
+14%
+4%(+7%)
+15%(+17%)
Graf-data er her indtakt - ret i denne og kopier,ungroup og flyt 1. hold søjler 2 mm til højre,2. hold 5 mm og 3. hold 8 mm til højre.
DKKm
Revenue by region (growth in local currency in parenthesis)
0
200
400
600
800
1,000
1,200
Q2 16/17
Q2 17/18
DKKm
+7%(+7%)
+31%(+38%)
+20%(+27%)
+32%(+32%)
+15%(+17%)
Europe1) North America2)
Greater China3)
Rest of World
Total
1) Europe covers Austria, Belgium, Denmark, France, Germany, Italy, Netherlands, Norway, Spain, Sweden, Switzerland and United Kingdom.
2) North America covers USA, Canada and Mexico.3) Greater China covers China, Hong Kong and Taiwan.
HIGHLIGHTS · KEY FIGURES · MANAGEMENT REPORT · STATEMENT · FINANCIAL REVIEW · ADDITIONAL INFORMATION
DELEVOPMENT IN 2ND QUARTER · PRODUCT PORTFOLIO AND COLLABORATIONS · OUTLOOK FOR 2017/18
Management ReportDevelopment in

BANG & OLUFSEN A/S INTERIM REPORT 2ND QUARTER 2017/18 · 6
cal currency). The increase was driven by strong sales
within TV, connected audio and speakers. There was a
slight increase in income from brand partnering, which
remains on track for the year.
The revenue in the B&O PLAY business unit grew 30
per cent (32 per cent in local currency) compared to
last year and equivalent to DKK 483 million. The main
growth contributors were existing products such as
Beoplay A1, H5 and A9 complemented by Beoplay E8
wireless earphones, launched in the previous quarter.
Revenue through the B1 and shop-in-shop channel
grew to DKK 141 million from DKK 117 million last year,
corresponding to a growth of 21 per cent. Revenue
through third-party retail and e-commerce increased
by 35 per cent.
Revenue development by channel and region
As part of the company’s focus on strengthening the
customer experience, 31 low-performing B1 stores and
shop-in-shops were closed or changed to shop-in-
shops in the second quarter, while 21 new B1 stores and
shop-in-shops were opened or upgraded. The number
of B1 stores and shop-in-shops was 588 at the end of
the second quarter compared to 598 at the end of the
previous quarter.
Improving the quality and depth of third-party stores
continues to be a main priority. The number of third-
party retail stores increased to 6,823 stores from 6,607
stores last year, and was almost on par with the number
of third-party retail stores at the end of the previous
quarter.
Revenue in Europe was DKK 538 million against DKK
505 million last year, corresponding to an increase of
7 per cent (7 per cent growth in local currency). The
growth was primarily driven by B&O PLAY and higher
sales of connected audio, including BeoSound Shape in
the Bang & Olufsen business unit.
Revenue in North America was DKK 145 million against
DKK 111 million last year, corresponding to an increase
of 31 per cent (38 per cent in local currency). The rev-
enue growth was driven by growth in B&O PLAY sales,
especially in the third-party retail stores.
The growth momentum in the Greater China region
continued in the second quarter driven by strong B&O
PLAY sales. Revenue in the region was DKK 149 million
against DKK 125 million last year, corresponding to an
increase of 20 per cent (27 per cent in local currency).
Distribution development (number of stores)
B1 Shop-in-shop Third-party retail
30/11/2017 31/08/2017 30/11/2017 31/08/2017 30/11/2017 31/08/2017
Europe 286 291 125 128 3,302 3,330
North America 17 18 1 2 1,074 1,102
Greater China 33 35 20 21 1,108 1,150
Rest of World 81 89 25 14 1,339 1,251
Total 417 433 171 165 6,823 6,833
HIGHLIGHTS · KEY FIGURES · MANAGEMENT REPORT · STATEMENT · FINANCIAL REVIEW · ADDITIONAL INFORMATION
DELEVOPMENT IN 2ND QUARTER · PRODUCT PORTFOLIO AND COLLABORATIONS · OUTLOOK FOR 2017/18

BANG & OLUFSEN A/S INTERIM REPORT 2ND QUARTER 2017/18 · 7
Revenue in the region Rest of World was DKK 167 mil-
lion against DKK 127 million last year, corresponding to
an increase of 32 per cent (32 per cent in local curren-
cy). The development in the region was characterised
by growth in both business units with especially con-
nected audio and TVs in the Bang & Olufsen business
unit performing well.
Gross margin
The Group gross margin was at 41.2 per cent on par
with last year.
The gross margin in the Bang & Olufsen business unit
was on par with last year (45.5 per cent). There was an
overall improvement in product profitability but also a
decrease in revenue from fewer company-owned and
company-operated stores.
The gross margin for the B&O PLAY business unit was
36.5 per cent against 35.6 per cent last year. The im-
provement in gross margin was driven by key product
margins improvement compared to last year, which was
partially offset by a negative product mix impact com-
pared to last year.
Capacity costs
(All capacity costs are underlying business)
The capacity costs were DKK 341 million compared to
DKK 330 million last year – an increase of 3.5 per cent.
The increase was due to higher depreciation on devel-
opment projects, which increased from DKK 57 million
to DKK 69 million. Adjusted for this impact, capacity
costs decreased by DKK 2 million.
Distribution and marketing costs were DKK 196 million,
which was slightly lower than last year (DKK 206 mil-
lion). In line with previous quarters, investments were
focused more towards marketing and distribution in the
B&O PLAY business unit, with lower spend in the Bang
& Olufsen business unit. The Bang & Olufsen spend was
also impacted by fewer company-owned and company-
operated stores
Administration costs totalled DKK 27 million compared
to DKK 24 million last year.
Development costs were DKK 118 million against DKK
100 million last year. Incurred development costs were
DKK 66 million (of which DKK 17 million were capital-
ised) against DKK 84 million last year (of which DKK 41
million were capitalised). Capitalisations are expected
to be approximately 30 per cent of incurred develop-
ment costs throughout 2017/18.
Total amortisation charges on development projects
were DKK 69 million against DKK 57 million last year.
The net effect on earnings before interest and tax of
capitalisations and amortisations was negative DKK 52
million compared to a negative effect of DKK 16 million
last year.
Earnings
Earnings before interest, tax, depreciation, amortisation
and capitalisation (EBITDAC) in the underlying business
were DKK 135 million against DKK 70 million last year.
The ability to increase the revenue without creating a
corresponding increase in capacity cost levels contrib-
uted to the improved profitability.
Capitalised development costs and carrying amount (DKK million)
Q2 – 2017/18
Capitalised, net 17
Carrying amount, net 278
Q2 – 2016/17
Capitalised, net 41
Carrying amount, net 359
HIGHLIGHTS · KEY FIGURES · MANAGEMENT REPORT · STATEMENT · FINANCIAL REVIEW · ADDITIONAL INFORMATION
DELEVOPMENT IN 2ND QUARTER · PRODUCT PORTFOLIO AND COLLABORATIONS · OUTLOOK FOR 2017/18

BANG & OLUFSEN A/S INTERIM REPORT 2ND QUARTER 2017/18 · 8
In line with our expectations, EBITDAC in the underly-
ing business for the first half of 2017/18 was DKK 93
million against DKK 3 million last year.
The company’s net financial items were negative DKK
6 million compared to negative DKK 5 million last year.
The costs were related to interest expenses and ex-
change rate adjustments.
For the first half of 2017/18, EBIT for the underlying
business was DKK 5 million compared to negative DKK
52 million last year. This is a satisfying result and in line
with expectations.
Earnings before tax were DKK 77 million against DKK
32 million last year, and for the first half of the year,
earnings before tax were DKK 7 million against nega-
tive DKK 56 million last year.
Development in balance sheet items and cash flow
The Group’s net working capital was DKK 171 million.
This was an increase of DKK 41 million compared to
the end of previous quarter. The increase was due to
increased activity in the quarter with higher trade re-
ceivables partially offset by higher trade payables. Net
working capital of DKK 304 million last year included
the Czech production facility which was divested in
May 2017. Excluding this impact, the net working capital
was on par with last year.
Free cash flow was positive DKK 44 million compared
to DKK 131 million last year. Last year, free cash flow in-
cluded the escrow payment from HARMAN of DKK 93
million, and excluding this impact, free cash flow was
DKK 38 million last year. The improved earnings and
lower investment levels were key to the positive free
cash flow in the quarter.
Year-to-date free cash flow was negative DKK 114 mil-
lion compared to positive DKK 99 million in the first
half of 2016/17. The development was mainly due to an
increase in net working capital of DKK 144 million com-
pared to 31 May 2017.
The net interest-bearing deposit was DKK 786 million
compared to DKK 693 million last year.
The Group’s equity decreased to DKK 1,585 million from
DKK 1,686 million last year. The Group equity ratio was
53 per cent compared to 55 per cent last year.
Subsequent events
No material events have occurred after 30 November
2017.
HIGHLIGHTS · KEY FIGURES · MANAGEMENT REPORT · STATEMENT · FINANCIAL REVIEW · ADDITIONAL INFORMATION
DELEVOPMENT IN 2ND QUARTER · PRODUCT PORTFOLIO AND COLLABORATIONS · OUTLOOK FOR 2017/18

BANG & OLUFSEN A/S INTERIM REPORT 2ND QUARTER 2017/18 · 9
Q2 2017/18: Product portfolio and collaborations
The second quarter was characterised by a continued solid performance of existing products such as Beoplay H5,
A1 and A9, supported by recently launched products, led by strong sales of BeoLab 50 and BeoVision Eclipse in
the Bang & Olufsen business unit and Beoplay E8 in the B&O PLAY business unit.
The quarter also saw the launch of a new wireless home speaker, Beoplay M3, which builds on the company’s core
capabilities of acoustics, design and craftsmanship and further strengthens the Group’s position within the strate-
gically important market for connected audio products. In addition, the company launched a new colour-coordi-
nated collection called Harmonies by Bang & Olufsen.
The company continues to develop the brand partnering activities. Two new brand collaborations were announced
in the second quarter, generating good media coverage and thereby increasing brand awareness.
Harmonies by Bang & Olufsen
Bang & Olufsen launched a new colour-coordinated
collection called Harmonies by Bang & Olufsen. The
collection includes connected audio products in a
limited, lush green tone. The colour is named ‘Infantry
Green’ and is inspired by nature. The Harmonies Collec-
tion is featuring the multiroom enabled products that
can perform and interact in perfect harmony as one.
The collection includes the connected audio products
Beoplay A9, Beoplay M5, BeoSound 1, BeoSound 2 and
BeoSound 35.
Beoplay A9 David Lynch
B&O PLAY announced a
collaboration with cult-classic
director, screenwriter, actor,
and musician David Lynch.
Together B&O PLAY and
David Lynch have created a
limited edition A9 speaker with a custom lithographic
speaker cover featuring Lynch’s famed “Paris Suite”
works. The collaboration generated significant media
coverage in especially the US.
Beoplay M3 Multiroom speaker
B&O PLAY expanded its family of
wireless home speakers with the
launch of the compact Beoplay
M3. The user can choose between
instant music listening with
Bluetooth, streaming music
directly from a smart device to
the speaker, or the speaker can be
connected to Wi-Fi for a multiroom
setup which can be controlled from the
Bang & Olufsen app. Beoplay M3 comes with
Chromecast Built-in and supports Beolink Multiroom,
Apple AirPlay and QPlay 2.0. Beoplay M3 will also
support Apple’s AirPlay 2 in 2018 letting the user send
audio to multiple AirPlay compatible speakers at once.
B&O PLAY collection for Saint Laurent
B&O PLAY designed a collection for an exclusive Saint
Laurent launch in Paris. The collection consists of three
products in a very limited edition made
in collaboration with the French luxury
fashion house. The three products
are Beoplay P2 Black, Beoplay H9
Black and Beoplay A9 Black, all cus-
tomised with Saint Laurent logo and
minor changes in material and finish.
HIGHLIGHTS · KEY FIGURES · MANAGEMENT REPORT · STATEMENT · FINANCIAL REVIEW · ADDITIONAL INFORMATION
DELEVOPMENT IN 2ND QUARTER · PRODUCT PORTFOLIO AND COLLABORATIONS · OUTLOOK FOR 2017/18
Product launches

BANG & OLUFSEN A/S INTERIM REPORT 2ND QUARTER 2017/18 · 10
Revenue
Revenue growth for the Group is expected to be
around 10 per cent compared to 2016/17.
The B&O PLAY business unit is expected to continue to
be the main growth driver with growth of more than 20
per cent compared to 2016/17.
The Bang & Olufsen business unit, including revenue
related to brand partnering, is expected to remain flat.
Revenue related to brand partnering is expected to be
in the range of DKK 160-200 million.
Earnings
Earnings before interest, tax, depreciation, amortisation
and capitalisation (EBITDAC) for the underlying busi-
ness is expected to be 8-10 per cent of revenue.
As previously communicated, 2017/18 will continue to
be impacted by the changed operating model in the
Bang & Olufsen business unit. This will entail a contin-
ued high level of depreciations and amortisations, while
the level of capitalisations will decline. However, the
level of amortisations is expected to decline faster than
previously anticipated. This is expected to result in an
EBIT margin for the underlying business of around 3
per cent (previously 1-3 percent) for 2017/18.
Free cash flow
The Group’s free cash flow is expected to be positive in
2017/18.
The outlook excludes impacts from non-recurring and
aperiodic items that may occur during the financial
year.
OUTLOOK FOR 2017/18In 2017/18, the Group expects to maintain the growth momentum,
improve profitability, and to continue the transformation towards a more agile and asset-light operating model.
Safe Harbour statementThe report contains statements relating to the expectations for future developments, including future revenues and operating results, as well as expected business-related events. Such statements are uncertain and carry an element of risk since many factors, of which some are beyond Bang & Olufsen’s control, can mean that actual developments will deviate significantly from the expectations expressed in the report. Without being exhaustive, such factors include among others general economic and commercial factors, including market and competitive matters, supplier issues and financial issues in the form of foreign exchange, interest rates, credit and liquidity risk.
HIGHLIGHTS · KEY FIGURES · MANAGEMENT REPORT · STATEMENT · FINANCIAL REVIEW · ADDITIONAL INFORMATION
DELEVOPMENT IN 2ND QUARTER · PRODUCT PORTFOLIO AND COLLABORATIONS · OUTLOOK FOR 2017/18
Outlook

BANG & OLUFSEN A/S INTERIM REPORT 2ND QUARTER 2017/18 · 11
Struer, 11 January 2018
Executive Management Board:
Henrik Clausen Anders Aakær Jensen Stefan Persson John MollangerPresident & CEO Executive Vice Executive Vice Executive Vice President & CFO President of HOME President & CEO of B&O PLAY
Board of Directors:
Ole Andersen Juha Christensen Albert Bensoussan Brian Bjørn HansenChairman Deputy Chairman
Geoff Martin Ivan Tong Kai Lap Jesper Jarlbæk Mads Nipper
Majken Schultz Søren Balling
Today, we have considered and approved the interim
report for the period 1 June 2017 – 30 November 2017
for Bang & Olufsen a/s.
The interim report is presented in accordance with IAS
34, Interim Financial Reporting, as endorsed by the EU
and additional requirements in the Danish Financial
Statements Act.
It is our opinion that the interim report provides a true
and fair view of the Group’s assets, liabilities and finan-
cial position as at 30 November 2017 and the results of
the Group’s operations and cash flows for the period
1 June 2017 – 30 November 2017.
It is also our opinion that the management report gives
a true and fair view of developments in the Group’s
activities and financial situation, the earnings for the
period and the Group’s financial position in general as
well as a description of the most significant risks and
uncertainties to which the Group is exposed.
MANAGEMENT’S STATEMENT
HIGHLIGHTS · KEY FIGURES · MANAGEMENT REPORT · STATEMENT · FINANCIAL REVIEW · ADDITIONAL INFORMATIONManagements statement

BANG & OLUFSEN A/S INTERIM REPORT 2ND QUARTER 2017/18 · 12
CONSOLIDATED INCOME STATEMENT
2nd quarter YTD Year
(DKK million) Notes 2017/18 2016/17 2017/18 2016/17 2016/17
Revenue 999.0 867.1 1,591.0 1,382.6 2,954.0 Production costs (587.9) (509.5) (943.9) (852.5) (1,827.9)Gross profit 411.1 357.6 647.1 530.0 1,126.1
Development costs 3 (118.4) (99.7) (232.1) (175.0) (408.9)Distribution and marketing costs (200.9) (206.1) (363.2) (369.1) (778.2)Administration costs (26.7) (24.0) (51.6) (46.7) (107.7)Other operating income 17.6 8.8 17.6 8.8 39.7 Other operating expenses (0.1) - (0.1) - - Operating profit (EBIT) 82.7 36.7 17.7 (52.0) (129.0)
Financial income 0.5 0.7 1.2 2.2 2.4 Financial expenses (6.4) (6.0) (12.1) (6.2) (39.4)Financial items, net (5.8) (5.3) (10.9) (3.9) (37.0)
Earnings before tax (EBT) 76.8 31.5 6.7 (55.9) (166.0)
Income tax (20.0) (8.8) (4.6) 12.0 49.4 Earnings for the year 56.8 22.7 2.2 (43.9) (116.5)
Earnings per shareEarnings per share (EPS), DKK 1.3 0.5 0.1 (1.0) (2.7)Diluted earnings per share (ESP-D), DKK 1.3 0.5 0.1 (1.0) (2.7)
HIGHLIGHTS · KEY FIGURES · MANAGEMENT REPORT · STATEMENT · FINANCIAL REVIEW · ADDITIONAL INFORMATION
INCOME STATEMENT · STATEMENT OF COMPREHENSIVE INCOME · BALANCE SHEETS · CASH FLOW STATEMENT STATEMENT OF CHANGES IN EQUITY · NOTES · APPENDIX
Income StatementFinancial review

BANG & OLUFSEN A/S INTERIM REPORT 2ND QUARTER 2017/18 · 13
CONSOLIDATED STATEMENT OF COMPREHENSIVE INCOME
2nd quarter YTD Year
(DKK million) 2017/18 2016/17 2017/18 2016/17 2016/17
Earnings for the year 56.8 22.7 2.2 (43.9) (116.5)
Items that will be reclassified subsequently to the income statement:Exchange rate adjustment of investment in foreign subsidiaries 2.1 7.4 (3.5) 3.9 (2.3)Change in fair value of derivative financial instruments used as cash flow hedges 18.0 1.6 11.6 1.0 (28.9)Transfer to the income statement of fair value adjustments of derivative financial instruments used as cash flow hedges, realised cash flows: Transfer to revenue 3.9 1.4 6.7 2.4 2.9 Transfer to production costs (15.5) 1.7 (20.8) 1.7 6.3 Income tax on items that will be reclassified to the income statement: (1.4) (1.0) 0.6 (1.1) 4.4
Items that will not be reclassified subsequently to the income statement:Actuarial gains/(losses) on defined benefit plans - - - - 0.7 Income tax on items that will not be reclassified to the income statement: - - - - (0.2)Other comprehensive income for the year, net of tax 7.1 11.2 (5.4) 7.9 (17.1)
Total comprehensive income for the year 63.9 33.8 (3.2) (36.0) (133.6)
HIGHLIGHTS · KEY FIGURES · MANAGEMENT REPORT · STATEMENT · FINANCIAL REVIEW · ADDITIONAL INFORMATION
INCOME STATEMENT · STATEMENT OF COMPREHENSIVE INCOME · BALANCE SHEETS · CASH FLOW STATEMENT STATEMENT OF CHANGES IN EQUITY · NOTES · APPENDIX
Comprehensive Income

BANG & OLUFSEN A/S INTERIM REPORT 2ND QUARTER 2017/18 · 14
CONSOLIDATED BALANCE SHEET
(DKK million) Notes 30/11/17 30/11/16 31/5/17
Goodwill 43.4 67.4 47.0 Acquired rights 3.4 6.6 4.2 Completed development projects 253.1 269.9 196.9 Development projects in progress 24.6 88.8 137.9 Intangible assets 324.5 432.6 386.0
Land and buildings 71.1 98.4 75.2 Plant and machinery 62.6 59.6 48.6 Other equipment 5.2 14.9 5.2 Leasehold improvements 2.8 19.8 4.6 Tangible assets in course of construction and prepayments for tangible assets 43.8 13.0 45.0 Tangible assets 185.4 205.6 178.6
Investment property 15.6 16.2 16.0
Other financial receivables 52.3 31.1 41.2 Financial assets 52.3 31.1 41.2
Deferred tax assets 295.2 227.7 279.2
Total non-current assets 873.1 913.3 901.0
Inventories 450.7 560.2 347.3
Trade receivables 609.9 571.8 410.3 Other financial receivables - - 11.3 Corporation tax receivable 15.2 45.5 13.0 Other receivables 52.4 52.5 71.7 Prepayments 41.2 23.1 13.7 Total receivables 718.6 692.8 520.0
Cash 960.1 876.3 1,079.2
Assets held for sale - 2.9 -
Total current assets 2,129.4 2,132.2 1,946.5
Total assets 3,002.5 3,045.5 2,847.4
HIGHLIGHTS · KEY FIGURES · MANAGEMENT REPORT · STATEMENT · FINANCIAL REVIEW · ADDITIONAL INFORMATION
INCOME STATEMENT · STATEMENT OF COMPREHENSIVE INCOME · BALANCE SHEETS · CASH FLOW STATEMENT STATEMENT OF CHANGES IN EQUITY · NOTES · APPENDIX
Balance sheet

BANG & OLUFSEN A/S INTERIM REPORT 2ND QUARTER 2017/18 · 15
CONSOLIDATED BALANCE SHEET
(DKK million) Notes 30/11/17 30/11/16 31/5/17
Share capital 432.0 432.0 432.0 Translation reserve 15.2 25.0 18.7 Reserve for cash flow hedges (14.9) 6.5 (12.8)Retained earnings 1,153.1 1,222.7 1,148.2 Total equity 1,585.4 1,686.1 1,586.2
Pensions 14.6 14.9 14.5 Deferred tax 10.1 10.8 10.7 Provisions 38.1 45.3 28.0 Mortgage loans 165.5 175.2 170.2 Other non-current liabilities 13.9 1.8 1.6 Deferred income 105.7 129.7 123.7 Total non-current liabilities 347.9 377.7 348.7
Mortgage loans 9.1 8.5 9.1 Provisions 52.1 24.8 79.4 Trade payables 568.4 571.0 463.2 Corporation tax payable 24.5 45.1 8.2 Other liabilities 387.6 301.5 327.7 Deferred income 27.5 30.7 25.0 Other current liabilities 1,069.2 981.7 912.5
Total liabilities 1,417.1 1,359.4 1,261.2
Total equity and liabilities 3,002.5 3,045.5 2,847.4
HIGHLIGHTS · KEY FIGURES · MANAGEMENT REPORT · STATEMENT · FINANCIAL REVIEW · ADDITIONAL INFORMATION
INCOME STATEMENT · STATEMENT OF COMPREHENSIVE INCOME · BALANCE SHEETS · CASH FLOW STATEMENT STATEMENT OF CHANGES IN EQUITY · NOTES · APPENDIX

BANG & OLUFSEN A/S INTERIM REPORT 2ND QUARTER 2017/18 · 16
CONSOLIDATED CASH FLOW STATEMENT
2nd quarter YTD Year
(DKK million) Notes 2017/18 2016/17 2017/18 2016/17 2016/17
Earnings for the year - continuing operations 56.8 22.8 2.2 (43.9) (116.5)Amortisation, depreciation and impairment losses 81.9 74.5 170.1 123.2 327.9 Adjustments for non-cash items 4 (8.2) 34.1 (12.4) 11.9 (48.4)Change in receivables (216.1) (232.1) (207.7) (151.0) (5.9)Change in inventories (37.0) (34.2) (103.3) (62.2) 59.6 Change in trade payables etc 212.4 247.0 167.7 227.6 154.4 Cash flow from operations 89.9 111.9 16.6 105.5 371.1
Interest received and paid, net (3.8) (1.0) (7.1) 0.4 (9.3)Income tax paid (5.4) (1.7) (7.0) (3.1) (9.5)Cash flow from operating activities 80.7 109.3 2.4 102.8 352.3
Purchase of intangible non-current assets (17.1) (42.8) (82.9) (69.4) (177.5)Purchase of tangible non-current assets (20.1) (26.5) (34.1) (29.6) (64.3)Sales of tangible non-current assets - - - 2.6 2.6 Proceeds from sale of businesses - - - - 122.9 Change in financial receivables 0.6 91.5 0.1 92.6 71.3 Cash flow from investing activities (36.6) 22.2 (116.9) (3.7) (45.0)
Free cash flow 44.1 131.5 (114.4) 99.1 307.2
Repayment of long-term loans (2.4) (2.2) (4.7) (6.0) (10.4)Settlement of share options - (3.7) - (5.3) (6.1)Cash flow from financing activities (2.4) (5.9) (4.7) (11.3) (16.5)
Change in cash and cash equivalents 41.7 125.7 (119.1) 87.8 290.7
Cash and cash equivalents, opening balance 918.4 750.6 1,079.2 788.5 788.5 Cash and cash equivalents, closing balance 960.1 876.3 960.1 876.3 1,079.2
Cash and cash equivalents:Cash 960.1 876.3 960.1 876.3 1,079.2 Cash and cash equivalents, closing balance 960.1 876.3 960.1 876.3 1,079.2
HIGHLIGHTS · KEY FIGURES · MANAGEMENT REPORT · STATEMENT · FINANCIAL REVIEW · ADDITIONAL INFORMATION
INCOME STATEMENT · STATEMENT OF COMPREHENSIVE INCOME · BALANCE SHEETS · CASH FLOW STATEMENT STATEMENT OF CHANGES IN EQUITY · NOTES · APPENDIX
Cash flow

BANG & OLUFSEN A/S INTERIM REPORT 2ND QUARTER 2017/18 · 17
CONSOLIDATED STATEMENT OF CHANGES IN EQUITY
(DKK million) Notes 30/11/17 30/11/16 31/5/17
Equity, opening balance 1,586.2 1,724.9 1,724.9
Earnings for the period 2.2 (43.9) (116.5)Other comprehensive income, net of tax (5.4) 7.9 (17.1)Comprehensive income for the period (3.2) (36.0) (133.6)
Grant of share options 2.5 2.5 1.1 Settlement of share options - (5.3) (6.1)Equity, closing balance 1,585.4 1,686.1 1,586.2
HIGHLIGHTS · KEY FIGURES · MANAGEMENT REPORT · STATEMENT · FINANCIAL REVIEW · ADDITIONAL INFORMATION
INCOME STATEMENT · STATEMENT OF COMPREHENSIVE INCOME · BALANCE SHEETS · CASH FLOW STATEMENT STATEMENT OF CHANGES IN EQUITY · NOTES · APPENDIX
Changes in equity

BANG & OLUFSEN A/S INTERIM REPORT 2ND QUARTER 2017/18 · 18
NOTES
1 ACCOUNTING PRINCIPLES
The interim report for Bang & Olufsen a/s is prepared as a condensed set of financial statements in accordance with IAS 34 ‘Interim Financial Reporting’, as endorsed by the European Union and further additional Danish disclosure requirements for interim reports for listed companies. The interim report has not been audited or reviewed by the company’s external auditors. An interim report for the parent company has not been prepared. The interim report is stated in Danish krone (DKK) which is the functional currency of the parent company.
The Annual Report 2016/17 contains a full description of applied accounting principles.
2 SIGNIFICANT ESTIMATES AND ASSESSMENTS BY MANAGEMENT
The preparation of interim reports requires that management makes estimates and assessments which affect the application of accounting principles and recognised assets, liabilities, income and expenses. Actual results may vary from these estimates.
The material estimates that management makes when applying the accounting principles of the Group, and the material uncertainty connected with these estimates and assessments are unchanged in the preparation of the interim report compared to the preparation of the Annual Report.
3 DEVELOPMENT COSTS AND EBITDAC2nd quarter YTD Year
(DKK million) 2017/18 2016/17 2017/18 2016/17 2016/17
Incurred development costs before capitalisation 66.3 83.9 175.0 150.9 360.9 Hereof capitalised (16.6) (41.3) (81.5) (68.0) (173.7)Incurred development costs after capitalisation 49.7 42.5 93.5 82.9 187.2 Capitalisation (%) 25.0% 49.3% 46.6% 45.1% 48.1%Total charges and impairment losses on development projects 68.6 57.1 138.6 92.1 221.6 Development costs recognised in the consolidated income statement 118.4 99.7 232.1 175.0 408.9
2nd quarter YTD Year
(DKK million) 2017/18 2016/17 2017/18 2016/17 2016/17
EBITDA 164.5 111.2 187.8 71.2 198.9 Capitalised development costs (16.6) (41.3) (81.5) (68.0) (173.7)EBITDAC 147.9 69.9 106.3 3.2 25.2
HIGHLIGHTS · KEY FIGURES · MANAGEMENT REPORT · STATEMENT · FINANCIAL REVIEW · ADDITIONAL INFORMATION
INCOME STATEMENT · STATEMENT OF COMPREHENSIVE INCOME · BALANCE SHEETS · CASH FLOW STATEMENT STATEMENT OF CHANGES IN EQUITY · NOTES · APPENDIX
Notes

BANG & OLUFSEN A/S INTERIM REPORT 2ND QUARTER 2017/18 · 19
NOTES
4 ADJUSTMENTS FOR NON-CASH ITEMS IN THE CASH FLOW STATEMENT
2nd quarter YTD Year
(DKK million) 2017/18 2016/17 2017/18 2016/17 2016/17
Change in other liabilities (42.0) 0.2 (22.8) (4.2) 26.4 Financial items, net 5.8 5.2 10.9 3.9 37.0 Gain/loss on sale of non-current assets - - - (2.5) (2.5)Gain/loss on sale of business - - - - (30.9)Tax on earnings for the year 20.0 8.8 4.6 (12.0) (49.4)Other adjustments 8.0 19.8 (5.1) 26.6 (28.9)Total adjustments (8.2) 34.1 (12.4) 11.9 (48.4)
5 SEGMENT INFORMATION2nd quarter
(DKK million) 2017/18 2016/17Reported change %
Local currency change %
Revenue by segment and business area
Bang & Olufsen 516.1 495.9 4 7B&O PLAY 483.0 371.2 30 32Total 999.0 867.1 15 17
Gross margin by business area, %
Bang & Olufsen 45.5% 45.5%B&O PLAY 36.5% 35.6%Gross margin %, Group 41.2% 41.2%
Revenue by region
Europe 538.2 505.1 7 7 North America 144.9 110.5 31 38 Greater China 149.3 124.9 20 27 Rest of World 166.6 126.5 32 32 Total 999.0 867.1 15 17
Revenue by channel
B1 and shop-in-shop distribution 657.4 613.1 7 3rd party distribution and e-commerce 341.7 254.0 35 Total 999.0 867.1 15
HIGHLIGHTS · KEY FIGURES · MANAGEMENT REPORT · STATEMENT · FINANCIAL REVIEW · ADDITIONAL INFORMATION
INCOME STATEMENT · STATEMENT OF COMPREHENSIVE INCOME · BALANCE SHEETS · CASH FLOW STATEMENT STATEMENT OF CHANGES IN EQUITY · NOTES · APPENDIX

BANG & OLUFSEN A/S INTERIM REPORT 2ND QUARTER 2017/18 · 20
NOTES
5 SEGMENT INFORMATION - CONTINUEDYTD
(DKK million) 2017/18 2016/17Reported change %
Local currency change %
Revenue by segment and business area
Bang & Olufsen 841.4 782.7 8 10B&O PLAY 749.6 599.9 25 27Total 1,591.0 1,382.6 15 17
Gross margin by business area, %
Bang & Olufsen 43.4% 41.0%B&O PLAY 37.6% 34.8%Gross margin %, Group 40.7% 38.3%
Revenue by region
Europe 862.6 815.6 6 7 North America 200.3 162.8 23 29 Greater China 251.7 202.5 24 32 Rest of World 276.4 201.6 37 37 Total 1,591.0 1,382.6 15 17
Revenue by channel
B1 and shop-in-shop distribution 1,065.7 981.9 93rd party distribution and e-commerce 525.3 400.6 31Total 1,591.0 1,382.6 15
HIGHLIGHTS · KEY FIGURES · MANAGEMENT REPORT · STATEMENT · FINANCIAL REVIEW · ADDITIONAL INFORMATION
INCOME STATEMENT · STATEMENT OF COMPREHENSIVE INCOME · BALANCE SHEETS · CASH FLOW STATEMENT STATEMENT OF CHANGES IN EQUITY · NOTES · APPENDIX

BANG & OLUFSEN A/S INTERIM REPORT 2ND QUARTER 2017/18 · 21
APPENDIX 1
Earnings by quarter 2017/18:2017/18
(DKK million) Q1 Q2 Q3 Q4
Revenue 591.9 999.0Production costs (356.0) (587.9)Gross profit 235.9 411.1
Development costs (113.7) (118.4)Distribution and marketing costs (162.3) (200.9)Administration costs (24.9) (26.7)Other operating income - 17.6Other operating expenses - (0.1)Earnings before interest and tax (EBIT) (65.0) 82.7
Financial income 0.7 0.5Financial expenses (5.8) (6.4)Financial items, net (5.1) (5.8)
Earnings before tax (EBT) (70.1) (76.8)
Income tax 15.4 (20.0)Earnings for the year (54.7) 56.8
Accumulated earnings by quarter 2017/18:2017/18
(DKK million) 3M 6M 9M 12M
Revenue 591.9 1,591.0Production costs (356.0) (943.9)Gross profit 235.9 647.1
Development costs (113.7) (232.1)Distribution and marketing costs (162.3) (363.2)Administration costs (24.9) (51.6)Other operating income - 17.6Other operating expenses - (0.1)Earnings before interest and tax (EBIT) (65.0) 17.7
Financial income 0.7 1.2Financial expenses (5.8) (12.1)Financial items, net (5.1) (10.9)
Earnings before tax (EBT) (70.1) 6.7
Income tax 15.4 (4.6)Earnings for the year (54.7) 2.2
HIGHLIGHTS · KEY FIGURES · MANAGEMENT REPORT · STATEMENT · FINANCIAL REVIEW · ADDITIONAL INFORMATION
INCOME STATEMENT · STATEMENT OF COMPREHENSIVE INCOME · BALANCE SHEETS · CASH FLOW STATEMENT STATEMENT OF CHANGES IN EQUITY · NOTES · APPENDIX
Appendix

BANG & OLUFSEN A/S INTERIM REPORT 2ND QUARTER 2017/18 · 22
APPENDIX 1
Earnings by quarter 2016/17:2016/17
(DKK million) Q1 Q2 Q3 Q4
Revenue 515.5 867.1 786.1 785.3Production costs (343.1) (509.5) (450.9) (524.4)Gross profit 172.4 357.6 332.2 260.9
Development costs (75.3) (99.7) (104.1) (129.7)Distribution and marketing costs (163.0) (206.1) (186.1) (223.1)Administration costs (22.7) (24.0) (26.7) (34.3)Other operating income, net - 8.8 - 30.9Earnings before interest and tax (EBIT) (88.7) 36.7 18.3 (95.3)
Financial income 1.6 0.7 0.8 -Financial expenses (0.2) (6.0) (10.6) (23.2)Financial items, net 1.3 (5.3) (9.8) (23.2)
Earnings before tax (EBT) (87.3) 31.5 8.4 (118.5)
Income tax 20.8 (8.8) (5.3) 42.8Earnings for the year (66.5) 22.7 3.1 (75.8)
Accumulated earnings by quarter 2016/17:2016/17
(DKK million) 3M 6M 9M 12M
Revenue 515.5 1,382.6 2,168.7 2,954.0Production costs (343.1) (852.5) (1,303.5) (1,827.9)Gross profit 172.4 530.0 865.2 1,126.1
Development costs (75.3) (175.0) (279.1) (408.9)Distribution and marketing costs (163.0) (369.1) (555.2) (778.2)Administration costs (22.7) (46.7) (73.4) (107.7)Other operating income, net - 8.8 8.8 39.7Earnings before interest and tax (EBIT) (88.7) (52.0) (33.7) (129.0)
Financial income 1.6 2.2 3.0 2.4Financial expenses (0.2) (6.2) (16.8) (39.4)Financial items, net 1.3 (3.9) (13.8) (37.0)
Earnings before tax (EBT) (87.3) (55.9) (47.4) (166.0)
Income tax 20.8 12.0 6.7 49.4Earnings for the year (66.5) (43.9) (40.8) (116.5)
HIGHLIGHTS · KEY FIGURES · MANAGEMENT REPORT · STATEMENT · FINANCIAL REVIEW · ADDITIONAL INFORMATION
INCOME STATEMENT · STATEMENT OF COMPREHENSIVE INCOME · BALANCE SHEETS · CASH FLOW STATEMENT STATEMENT OF CHANGES IN EQUITY · NOTES · APPENDIX

BANG & OLUFSEN A/S INTERIM REPORT 2ND QUARTER 2017/18 · 23
ADDITIONAL INFORMATION
For further information, please contact:
CEO, Henrik Clausen, tel.: +45 9684 5000
CFO, Anders Aakær Jensen, tel.: +45 9684 5000
Investors, Claus Højmark Jensen, tel.: +45 2325 1067
Press contact, Jens Gamborg, tel.: +45 2496 9371
Financial calendar
Financial statements
6 April 2018 Interim report (3rd quarter 2017/18)
12 July 2018 Annual report 2017/18
4 October 2018 Interim report (1st quarter 2018/19)
Safe Harbour statement
The report contains statements relating to expectations for future developments, including future revenue and
earnings, as well as expected business-related events. Such statements are uncertain and carry an element of risk
since many factors, of which some are beyond Bang & Olufsen’s control, can mean that actual developments will
deviate significantly from the expectations expressed in the report. Without being exhaustive, such factors include
among others, general economic and commercial factors, including market and competitive matters, supplier
issues and financial issues in the form of foreign exchange, interest rates, credit, and liquidity risks.
About Bang & Olufsen
Bang & Olufsen develops iconic, innovative audio and video products for consumers and for more than 90 years
the brand has been globally-renowned for its design, acoustics and craftsmanship. Bang & Olufsen was founded in
Struer, Denmark, in 1925 by Peter Bang and Svend Olufsen, two innovative, young engineers devoted to developing
functional and beautiful high-quality audio products. This remains the foundation for the company and over the
last 90 years, Bang & Olufsen has developed its expertise through practice and cooperation with external partners.
The long-standing craftsmanship tradition and the strong commitment to innovation and development have made
the brand globally renowned for its core capabilities within acoustics, design and craftsmanship. Today, Bang &
Olufsen’s product portfolio epitomises seamless media experiences in the home and on the move, for the family
and for the individual.
For additional information: please visit www.bang-olufsen.com.
HIGHLIGHTS · KEY FIGURES · MANAGEMENT REPORT · STATEMENT · FINANCIAL REVIEW · ADDITIONAL INFORMATIONAdditional Information