Embed Size (px)
Citation preview

Interim report as of March 31, 2005

The Vossloh Group at a glance
2
1 Excluding financial assets2 Like-for-like data: The contributions by the Services business unit have been deducted from the prior-year
comparatives.
The income statement data refers to the 3 months ended March 31, balance sheet data being stated as of March 31.
Where required, ratios have been annualized.
Group
Q1/2005 Q1/2004
Income statement data
Net sales2 € mill. 185.4 197.2
thereof Rail Infrastructure € mill. 126.6 112.7
Motive Power € mill. 52.2 71.8
Information Technologies € mill. 6.7 12.6
EBIT2 € mill. 11.1 16.7
Net interest expense2 € mill. (4.7) (3.0)
EBT2 € mill. 6.4 13.7
Group earnings (total) € mill. 3.5 8.5
Earnings per share (EpS) € 0.24 0.58
EBIT margin2 % 6.0 8.5
Pretax return on equity (ROE)2 % 7.7 17.9
Return on capital employed (ROCE)2 % 6.3 10.9
Balance sheet data
Fixed assets € mill. 390.0 375.3
capital expenditures1 € mill. 6.2 5.8
amortization/depreciation1,2 € mill. 5.0 5.7
Working capital € mill. 320.7 236.4
Working capital ratio % 43.2 29.8
Capital employed € mill. 710.7 611.7
Total equity € mill. 333.3 306.9
thereof minority interests € mill. 5.9 5.9
Net financial debt € mill. 202.1 163.6
Net leverage % 60.6 53.3
Total assets € mill. 1,021.0 883.4
Equity ratio % 32.6 34.8
Cash flow statement data
Cash flow from operating activities € mill. (14.6) 20.3
Cash flow from investing activities € mill. (8.9) (1.3)
Cash flow from financing activities € mill. (2.6) (19.7)
Change in cash & cash equivalents € mill. (26.1) (0.7)
Workforce
3-month (Q1) average headcount2 4,435 4,285
thereof Rail Infrastructure 3,006 2,829
Motive Power 1,112 1,154
Information Technologies 287 270
Vossloh AG 30 32
Payroll-to-added value ratio2 % 82.5 75.1
Personnel expenses2 € mill. 58.4 53.6
Share data
Stock price at March 31 € 39.34 43.58
Market capitalization at March 31 € mill. 575.9 636.4

Contents
3Interim report as of March 31, 2005
The Vossloh Group structure 4
To our stockholders 5
Vossloh stock 6
Analysis of the consolidated financial statements 7Rail Infrastructure division 10Motive Power division 11Information Technologies division 12Capital expenditures 13Research & development 13Employees 14Prospects 15
Interim financial statements of the Vossloh Group as of March 31, 2005 16
Income statement 18Cash flow statement 19Balance sheet 20Statement of changes in equity 22Explanatory notes 23
Vossloh AG's boards 28Financial diary 28

4
Rail Infrastructure Motive Power Information Technologies
Vossloh
Fastening Systems
Vossloh
Locomotives
Vossloh
Information Technologies
Vossloh
Switch Systems
Vossloh
Electrical Systems
Vossloh
Infrastructure Services
The Vossloh Group structure
Rail Infrastructure
Motive Power
Information Technologies
Rail fasteners from Vossloh are used in over 65 countries for their inherent safety and efficiency. And,when it comes to sophisticated track switches, the Group is again a foremost international supplier.In the construction of new trackage and the maintenance of existing, Vossloh likewise commands aleading position.
Ultramodern Vossloh diesel locomotives have for years now been leading the way throughout Europe.Cost efficiency, flexibility and attractive financing arrangements—these are some of the ingredientskeeping this market leader on the success track. The lineup of products and services is extended withkey technologies used on trams, streetcars, and trolleybuses.
Engineering systems sourced from Vossloh ensure cost-effective and customer-friendly operations man-agement for transport operators. Vossloh is also a leading supplier of passenger information systemsused in trains, railway stations, and at airport terminals. Signaling components and electronic interlocksare other specialty markets with vast growth potential.

5Interim report as of March 31, 2005
Dear Stockholders:
Q1/2005 sales and earnings by the Vossloh Group were in line with budget and as expected 6.0and 58.8 percent, respectively, below the comparable Q1/2004 figures. Although the takeoverfrom Alstom of the Valencia-based diesel locomotive plant was not closed before April 1, 2005,group sales in 2005 are nonetheless expected to rise 15 percent to €1,060 million and groupearnings are budgeted to reach around €47 million. The lower earnings versus 2004 reflect thetougher situation in a number of submarkets, Germany in particular, as well as the surging steelprices (only partly downloadable onto customers), and the further postponement of invitations tobid for diesel locomotives.
The market-induced problems are most pronounced at Kiel where we are having to cope withlocomotive production halving from the present volume. To succeed in responding more flexibly tosharper fluctuations in demand and generate profits even with much lower output, we have beenand still are compelled to shed most of the loaned labor plus some of the regular workforce aspart of the restructuring moves planned for this location.
Following protracted negotiations with the Works Council and the local trade union, a basicagreement was reached on March 11, 2005, regarding the measures planned for restructuringVossloh Locomotives GmbH. Altogether 180 jobs will be lost in Kiel. Thanks to the workforce's far-reaching contribution toward slashing personnel expenses, among other things, by a temporarywaiver of collectively negotiated pay increases and Christmas bonus, and an unpaid increase inweekly working hours, it proved possible to retain the location and sow the seeds for successfulrestructuring work which will largely be completed by the end of the present fiscal year.
With diesel-hydraulic locomotive production in Kiel and diesel-electric at the Valencia plantrecently acquired from Alstom, we can now supply the entire diesel locomotive market. Valencia'scapacities are already fully booked for the years ahead. We are convinced that we will expand ouralready strong position in the market for diesel locomotives and graduate to easily the mostsuccessful, most flexible, and most productive manufacturer in the entire locomotive market.
Following a once again highly successful fiscal 2004, we now expect a year in which we will haveto shoulder a heavy cost burden due to the aforementioned challenges but by next year we willalready be able to present you the positive effects. Then, in 2007, the rewards will become evenmore manifest.
Vossloh is well geared to write further chapters in its growth story. We are undismayed by thecurrent rail industry collapse. After all, nothing has changed regarding the fundamental convictionthat this is a growth sector both within Europe and worldwide. Additionally, Vossloh is benefitingfrom its international base. For the first time, group sales in France outpaced those in Germany.Spain, too, is evolving into another domestic market while Central & Eastern Europe is of growingimportance—all indications that Vossloh is meanwhile a European group.
To our stockholders
Burkhard Schuchmann
Vossloh AGCEO

Vossloh stock
6
12/31/2004
42
41
40
39
38
37
36
35
03/31/200501/31/2005 02/28/2005
Vossloh stock price trend from January 1 to March 31, 2005
The MDAX as the stock index which includes Germany's midsize companies and which listsVossloh, started the year 2005 at 5,385 points, advancing 8.0 percent to its Q1 high of 5,815 onFebruary 21, 2005. By March 31, it had slipped slightly to 5,693, a gain of 5.7 percent from theyear's opening level.
Vossloh stock in the first quarter of 2005 outpaced the MDAX. On January 3, 2005, the price was€36.40, the Q1 low. On March 11, 2005, basic consensus was reached with the Works Council andthe local union regarding the restructuring plans at Vossloh Locomotives GmbH, which propelledthe stock price to its Q1 high of €41.87 on March 17, 2005. Profit-taking then caused the stock todip to €39.34 (Xetra) at March 31, 2005, or 8.2 percent over the year-end 2004 of €36.35.
Vossloh AG's Executive and Supervisory Boards will propose to the annual stockholders' meetingto vote in favor of the distribution of an unchanged cash dividend of €1.30 per share. As in 2004,some 33 percent of net earnings will thus be distributed. With this proposal both Boards areconfirming a dividend policy based on the principle of continuity.
Since March 29, 2005, Arnhold and S. Bleichroeder Advisers LLC, New York, has held 5.01 percentof Vossloh AG's voting stock, or 733,939 shares.
The number of traded Vossloh shares in Q1 was around 2.1 million, equivalent to an average daily volume of around 34,000 of which the electronic system Xetra accounted for approximately85 percent.
Following the presentation of the 2004 annual accounts at the Analysts' Conference on March 18, 2005, analysts updated their assessments of the price potential of Vossloh stock; tenrecommended "buy" and three "hold." Their fair values ranged between €35 and €55, the meanbeing €44.50. The latest analyst views and any further information on Vossloh stock are down-loadable at www.vossloh.com
Vossloh stock price in €
MDAX (rebased)

Analysis of the consolidated financial statements
7Interim report as of March 31, 2005
In the first three months (Q1) of 2005, the Vossloh Group generated net sales of €185.4 million,6.0 percent or €11.8 million down from the year-earlier €197.2 million. While, at €126.6 million,Rail Infrastructure clearly outnumbered the prior-year Q1 sales of €112.7 million, the MotivePower and Information Technologies divisions failed to reattain the year-earlier levels, their Q1sales declining by €19.6 million and €5.9 million, respectively. Fewer-than-expected invitations tobid for diesel locomotives could not be compensated for through sales by the Valencia locomotiveplant due to its delayed acquisition and pruned the Locomotives business unit's sales by €19million. Owing to the postponed accounting for milestones of long-term contracts, Q1 sales byInformation Technologies did not reach the year-earlier magnitude either.
The shrinkage of rail industry business, soaring steel prices and fewer invitations to bid for diesellocomotives prompted Vossloh AG's Executive Board in late 2004 to initiate a groupwide efficiency-boosting and cost-cutting program. The market-induced problems cast the thickest clouds onVossloh Locomotives in Kiel where, from today's vantage point, the high sales of previous periodswill prove beyond reach in 2005 and 2006. The ensuing restructuring of this location will in thecurrent year require the Kiel headcount to be considerably downsized. Adequate accruals providefor these retrenchments in the Q1 accounts.
Q1/2004Q1/2005
185.4
11.1
197.2
16.7
Sales and EBIT of the Vossloh Group
Vossloh Group
Q1/2005 Q1/2004
Net sales € mill. 185.4 197.2
EBITDA € mill. 16.1 22.4
EBIT € mill. 11.1 16.7
EBIT margin % 6.0 8.5
EBT € mill. 6.4 13.7
Group earnings € mill. 3.5 8.5
Sales (€ million)
EBIT (€ million)
1 The prior-year comparatives have been adjusted for the Services business unit's contributions.

Analysis of the consolidated financial statements
8
The—expected—effect of these one-time burdens, combined with shrinking business and surgingsteel prices in a year-on-year comparison, was that the Motive Power division's Q1/2004 EBITcould not be duplicated in 2005. The Group's Q1 EBIT therefore fell to €11.1 million in 2005,significantly down from the year-earlier €16.7 million. The EBIT margin decreased from 8.5 per-cent a year ago to now 6.0 percent. Q1 group earnings came to €3.5 million in 2005 (down from€8.5 million).
In a year-on-year comparison, Q1 regional sales segmentation changed appreciably. For the firsttime, the quarterly sales in France, at €50.3 million in Q1/2005, exceeded those in Germany(€33.8 million), the proportion of German sales plunging from 32.4 percent in Q1/2004 to 18.2 in Q1/2005. However, this trend shows that Vossloh's strong international base helps to largelycompensate a shortfall of sales in certain markets (currently, in Germany) through additionalbusiness volumes elsewhere.
As of March 31, 2005, total assets amounted to €1,021.0 million, thus virtually unchanged versusyear-end 2004 (€1,021.3 million).
In the first three months of 2005, working capital, and thus also capital employed, swelled again,from €303.2 million as of December 31, 2004, by 5.8 percent to now €320.7 million, mainly due to the high level of work in process within the Switch Systems business unit and to the resultinghigher inventories.
Net financial debt grew from €171.1 million as of December 31, 2004, to €202.1 million at the end of Q1/2005. This €31 million rise was not only attributable to the funding requirements forthe higher working capital but also and foremost to the cash outflow for capital expenditures (at €6.2 million) and the settlement of tax liabilities.
Sales by regionQ1/2005 Q1/20041
Germany € mill. 33.8 63.8France € mill. 50.3 38.4Other Euroland € mill. 43.3 39.1Other Europe € mill. 39.9 34.7Total Europe € mill. 167.3 176.0North America € mill. 1.7 5.0Latin America € mill. 1.3 1.0Total Americas € mill. 3.0 5.1Asia € mill. 12.6 8.8Other regions € mill. 2.5 7.3Total € mill. 185.4 197.2
1 The prior-year comparatives have been adjusted for the Services business unit's contributions.

Analysis of the consolidated financial statements
9Interim report as of March 31, 2005
The increase in net financial debt from year-end 2004 stepped up the Group's net leverage (i.e., theratio of net financial debt to equity), from 51.7 percent three months ago to now 60.6 percent.
At €792.8 million, the Vossloh Group's order backlog as of March 31, 2005, was considerablybelow the year-earlier €947.3 million but above the year-end 2004 backlog of €761.6 million. Q1orders on hand at Kiel-based Vossloh Locomotives GmbH plummeted by €140+ million in 2004 to€138.9 million in 2005, basically as fewer invitations to bid for diesel locomotives were received.
The Q1/2005 data does not yet account for the Valencia diesel locomotives plant acquired fromAlstom (in future Vossloh España) since the acquisition was formally closed at April 1, 2005.Therefore, Vossloh España will be fully reflected in the accounts as from Q2/2005.
1 annualized
Vossloh Group
03/31/2005 12/31/2004 03/31/2004
Total assets € mill. 1,021.0 1,021.3 883.4
Total equity € mill. 333.3 331.1 306.9
Equity ratio % 32.6 32.4 34.8
Working capital € mill. 320.7 303.2 236.4
Working capital ratio1 % 43.2 33.0 29.8
Fixed assets € mill. 390.0 387.0 375.3
Capital employed € mill. 710.7 690.2 611.7
ROCE1 % 6.3 15.3 10.9
ROE1 % 7.7 27.1 17.9
Net financial debt € mill. 202.1 171.1 163.6
Net leverage % 60.6 51.7 53.3

Rail Infrastructure division
10
At €126.6 million, Q1 sales by the Rail Infrastructure division were 12 percent over last year's. All of the division's business units shared in this gain.
Q1 sales by Fastening Systems rose from €31.4 million a year ago to €37.1 million in 2005. Thebudgeted decline in domestic business was more than offset by rising exports to the regularmarkets of Central Europe plus additional projects in Turkey and Chile. Q1 order intake by this unit amounted to €34.2 million (down from €36.8 million) and included additions to a contract for supplying rail fasteners for the metro at the Indian capital of New Delhi. Order backlog atMarch 31, 2005, totaled €21.1 million (down from €24.7 million).
Switch Systems generated sales of €55.3 million (up from €49.0 million) and included switches fortram projects in France, for high-speed rail lines in Britain and Italy, and shipments to Israel andIran. Q1 order intake amounted to €58.9 million (down from €59.5 million). Major items comprisedcontracts from the Moroccan and Algerian state railways. Order backlog at March 31, 2005, cameto €170.6 million, well over the year-earlier €125.5 million.
Q1 sales at Infrastructure Services climbed from €33.8 million a year ago to €40.1 million in 2005.Order intake at €72.6 million was easily over the year-earlier €43.9 million. Accounting for a largechunk of new orders were rail and overhead line construction for tram projects in Nice andMarseilles. At March 31, 2005, order backlog added up to €213.6 million (up from €175.2 million).
The increase in working capital compared with a year earlier is linked to the inventory rise at SwitchSystems necessitated by the healthy order situation. Despite a slight advance in EBIT by €0.7 millionto €17.9 million, there was a minor decline in ROCE on account of the extra capital employed.
Rail Infrastructure
Q1/2005 Q1/2004
Net sales € mill. 126.6 112.7
EBITDA € mill. 21.1 20.2
EBIT € mill. 17.9 17.2
EBIT margin % 14.1 15.3
1 annualized
Rail Infrastructure
03/31/2005 12/31/2004 03/31/2004
Working capital € mill. 175.6 164.6 135.8
Working capital ratio1 % 34.7 32.0 30.1
Fixed assets € mill. 295.0 294.9 285.9
Capital employed € mill. 470.6 459.5 421.7
ROCE1 % 15.2 19.7 16.4
Motive Power division
11Interim report as of March 31, 2005
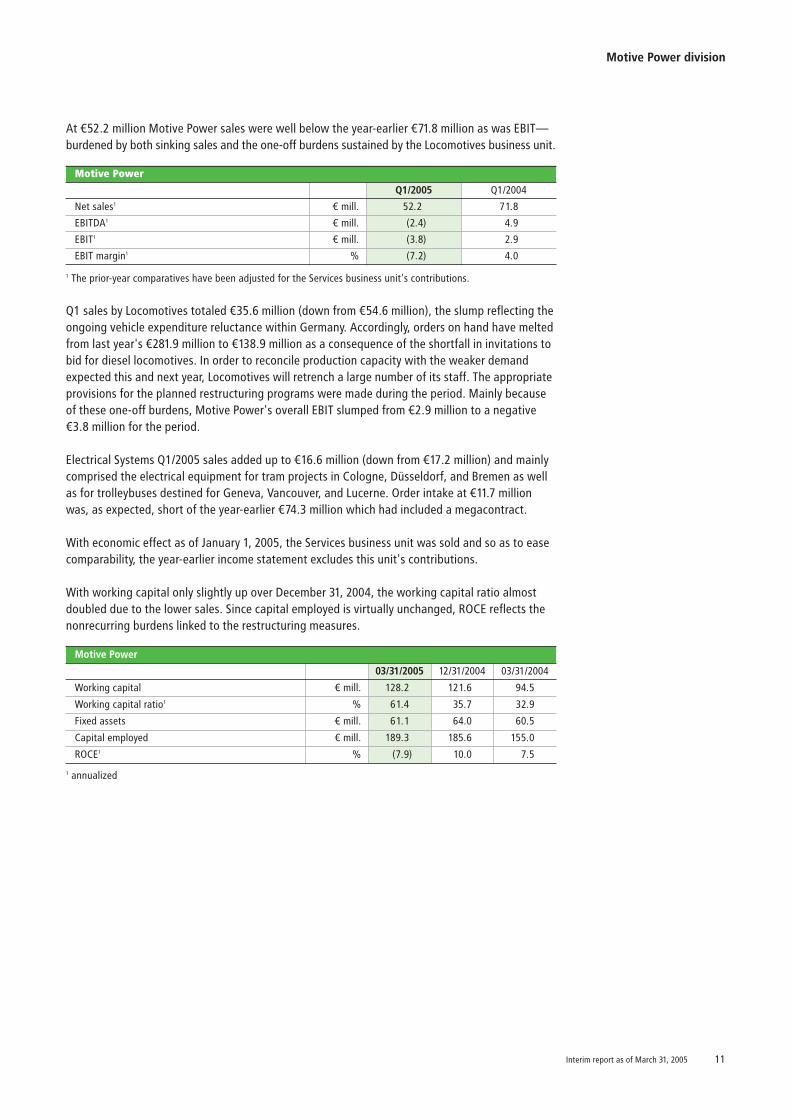
Q1 sales by Locomotives totaled €35.6 million (down from €54.6 million), the slump reflecting theongoing vehicle expenditure reluctance within Germany. Accordingly, orders on hand have meltedfrom last year's €281.9 million to €138.9 million as a consequence of the shortfall in invitations tobid for diesel locomotives. In order to reconcile production capacity with the weaker demandexpected this and next year, Locomotives will retrench a large number of its staff. The appropriateprovisions for the planned restructuring programs were made during the period. Mainly becauseof these one-off burdens, Motive Power's overall EBIT slumped from €2.9 million to a negative€3.8 million for the period.
Electrical Systems Q1/2005 sales added up to €16.6 million (down from €17.2 million) and mainlycomprised the electrical equipment for tram projects in Cologne, Düsseldorf, and Bremen as wellas for trolleybuses destined for Geneva, Vancouver, and Lucerne. Order intake at €11.7 millionwas, as expected, short of the year-earlier €74.3 million which had included a megacontract.
With economic effect as of January 1, 2005, the Services business unit was sold and so as to easecomparability, the year-earlier income statement excludes this unit's contributions.
With working capital only slightly up over December 31, 2004, the working capital ratio almostdoubled due to the lower sales. Since capital employed is virtually unchanged, ROCE reflects thenonrecurring burdens linked to the restructuring measures.
At €52.2 million Motive Power sales were well below the year-earlier €71.8 million as was EBIT—burdened by both sinking sales and the one-off burdens sustained by the Locomotives business unit.
1 annualized
Motive Power
Q1/2005 Q1/2004
Net sales1 € mill. 52.2 71.8
EBITDA1 € mill. (2.4) 4.9
EBIT1 € mill. (3.8) 2.9
EBIT margin1 % (7.2) 4.0
Motive Power
03/31/2005 12/31/2004 03/31/2004
Working capital € mill. 128.2 121.6 94.5
Working capital ratio1 % 61.4 35.7 32.9
Fixed assets € mill. 61.1 64.0 60.5
Capital employed € mill. 189.3 185.6 155.0
ROCE1 % (7.9) 10.0 7.5
1 The prior-year comparatives have been adjusted for the Services business unit's contributions.

Information Technologies division
12
At €6.7 million, sales by the Information Technologies division plunged more than 45 percentcompared with Q1/2004 mainly due to various orders whose acceptance on completion and henceinvoicing were postponed from Q1 to Q2/2005.
As a consequence and for invoice timing reasons, EBIT at a negative €0.7 million was short of theyear-earlier €0.1 million.
Versus December 31, 2004, working capital shrank by €2.8 million, due to the decrease in tradereceivables and increase in customer prepayments. Concurrently, inventories piled up due to thealready mentioned acceptance delays.
At €8.6 million, Q1 order intake was well above the €6.9 million in Q1/2004.
Information Technologies
Q1/2005 Q1/2004
Net sales € mill. 6.7 12.6
EBITDA € mill. (0.4) 0.4
EBIT € mill. (0.7) 0.1
EBIT margin % (9.9) 0.5
1 annualized
Information Technologies
03/31/2005 12/31/2004 03/31/2004
Working capital € mill. 13.8 16.6 7.0
Working capital ratio1 % 51.9 25.7 13.9
Fixed assets € mill. 16.0 15.9 13.0
Capital employed € mill. 29.8 32.5 20.0
ROCE1 % (8.9) 23.4 1.4

Capital expenditures
13Interim report as of March 31, 2005
Research & development
Q1/2005 capital expenditures by the Vossloh Group added up to €6.2 million (up from €5.8 million).
Q1/2005 R&D expenditures totaled €1.8 million (down from €2.2 million). In addition and according to IAS 38, Locomotives recognized development costs of €1.3 million for the periodJanuary through March (down from €1.8 million). Not taken into account are the project-relateddevelopment costs included in the cost of sales.
R&D efforts in Q1/2005 focused on further developing and trying out product innovations. FasteningSystems refined and installed into test tracks newly developed rail fasteners while Switch Systemspushed ahead with the development of new switch systems for high-speed lines.
Motive Power continued developing new drive systems for electrically powered buses, innovativecontrol technology, and new types of vehicle data management systems.
Information Technologies applied its R&D activities to again improving passenger informationsystems that use electronic ink.
Spending at Rail Infrastructure centered on Infrastructure Services (€2.2 million) and SwitchSystems (€1.0 million)—mainly on replacing existing equipment.
Motive Power expenditures subdivided into €1.6 million on Locomotives (almost exclusivelycapitalized development costs) and €0.7 million on Electrical Systems.
Additions to tangible assets
Q1/2005 Q1/2004
Rail Infrastructure € mill. 3.4 3.0
Motive Power € mill. 2.3 2.5
Information Technologies € mill. 0.3 0.3
Vossloh AG € mill. 0.2 0.0
Total € mill. 6.2 5.8
Workforce
14
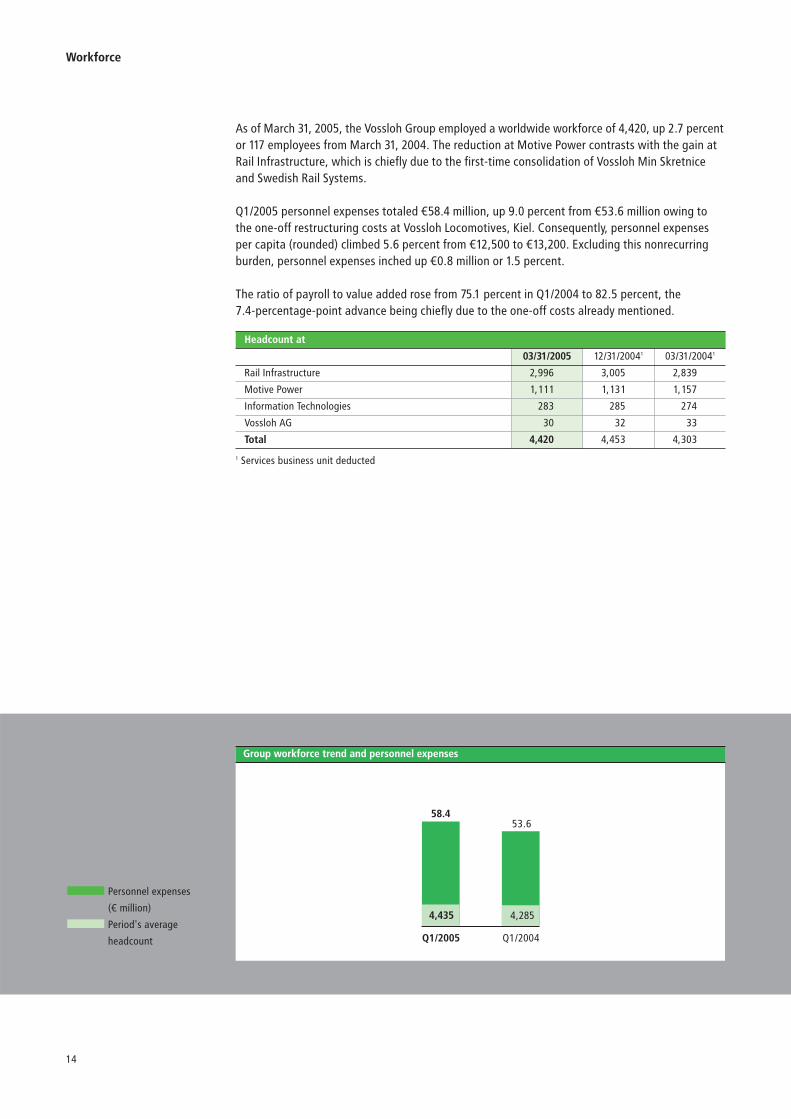
As of March 31, 2005, the Vossloh Group employed a worldwide workforce of 4,420, up 2.7 percentor 117 employees from March 31, 2004. The reduction at Motive Power contrasts with the gain atRail Infrastructure, which is chiefly due to the first-time consolidation of Vossloh Min Skretniceand Swedish Rail Systems.
Q1/2005 personnel expenses totaled €58.4 million, up 9.0 percent from €53.6 million owing tothe one-off restructuring costs at Vossloh Locomotives, Kiel. Consequently, personnel expensesper capita (rounded) climbed 5.6 percent from €12,500 to €13,200. Excluding this nonrecurringburden, personnel expenses inched up €0.8 million or 1.5 percent.
The ratio of payroll to value added rose from 75.1 percent in Q1/2004 to 82.5 percent, the 7.4-percentage-point advance being chiefly due to the one-off costs already mentioned.
Q1/2004Q1/2005
58.453.6
4,435 4,285
Group workforce trend and personnel expenses
1 Services business unit deducted
Headcount at
03/31/2005 12/31/20041 03/31/20041
Rail Infrastructure 2,996 3,005 2,839
Motive Power 1,111 1,131 1,157
Information Technologies 283 285 274
Vossloh AG 30 32 33
Total 4,420 4,453 4,303
Personnel expenses
(€ million)
Period's average
headcount

Prospects
15Interim report as of March 31, 2005
The takeover of the Valencia-based diesel locomotive plant was not closed as planned as ofJanuary 1, 2005, but later as of April 1, 2005. Notwithstanding this, group sales in 2005 arebudgeted to rise 15 percent to around €1,060 million. For all of 2005, Vossloh still expects an EBIT of €93.4 million (down from €105.8 million in 2004). Group earnings are predicted to reach €47.4 million, with earnings per eligible share then amounting to €3.25.

16
Interim financial statements as of March 31, 2005
Income statementCash flow statementBalance sheetStatement of changes in equityExplanatory notes

17Interim report as of March 31, 2005

Interim financial statements of the Vossloh Group as of March 31, 2005
18
Consolidated income statementfor the three months (Q1) ended March 31, 2005
€ million Q1/2005 Q1/2004
Net sales 185.4 197.2
Cost of sales (148.7) (157.7)
General administrative and selling expenses (25.6) (24.5)
R&D expenses (1.8) (2.1)
Other operating income/expenses, net 0.9 3.5
Operating result 10.2 16.4
Income from investments carried at equity 0.3 0.3
Other financial results 0.6 0.0
Earnings before interest and taxes (EBIT) 11.1 16.7
Net interest expense (4.7) (3.0)
Earnings before taxes (EBT) 6.4 13.7
Income taxes (2.2) (4.6)
Net income from continuing operations 4.2 9.1
Minority interests (0.1) (0.3)
Net loss of discontinued operations (0.6) (0.3)
Group earnings 3.5 8.5
Earnings per share (EpS)
Undiluted EpS (€) 0.24 0.58
Fully diluted EpS (€) 0.24 0.58

19Interim report as of March 31, 2005
Consolidated statement of cash flowsfor the three months (Q1) ended March 31, 2005
€ million Q1/2005 Q1/2004
Cash outflow for/(inflow from) operating activities
Group earnings 3.5 8.5
Adjustments to reconcile group earnings with cash outflow/inflow from operating activities
Minority interests in net income 0.1 0.3
Amortization/depreciation/write-down 5.0 5.8
Change in deferred taxes (0.9) 1.2
Book gains/losses (netted) from the disposal of fixed assets 0.0 (2.2)
Other noncash income/expenses (net) 0.7 0.0
Change in deferred income (0.3) 0.7
Change in receivables 1.8 18.4
Change in inventories (24.6) (18.5)
Change in prepaid expenses & deferred charges (0.9) (6.9)
Change in liabilities and accruals 1.0 13.0
Total adjustments (18.1) 11.8
Net cash (used in)/provided by operating activities (14.6) 20.3
Cash outflow from investing activities
Cash inflow from the disposal of intangible and tangible assets 0.0 5.0
Cash inflow from the disposal of financial assets 0.0 0.1
Cash outflow for intangible and tangible assets (6.2) (5.8)
Cash outflow for financial assets (2.3) (0.1)
Cash outflow for short-term securities (0.4) (0.5)
Net cash used in investing activities (8.9) (1.3)
Cash outflow for financing activities
Net borrowings through note-based finance (3.9) (1.1)
Net finance from short-term credits 0.0 (15.3)
Net finance from medium- and long-term loans 0.0 (3.3)
Change in treasury stock 1.3 0.0
Net cash used in financing activities (2.6) (19.7)
Net outflow of cash & cash equivalents (26.1) (0.7)
Cash & cash equivalents at beginning of period 140.0 24.1
Cash & cash equivalents at end of period 113.9 23.4

Consolidated balance sheet
20
Assets
€ million 03/31/2005 12/31/2004 03/31/2004
Total noncurrent assets 420.7 413.3 398.7
Intangible assets 276.9 276.0 273.1
Tangible assets 92.7 97.4 84.9
Investment properties 7.5 6.9 7.0
Financial assets 12.9 6.7 10.3
shares in unconsolidated subsidiaries 3.6 3.6 1.0
investments carried at equity 1.7 1.4 1.2
other investments and long-term securities 1.6 1.6 5.6
long-term loans 6.0 0.1 2.5
Total fixed assets 390.0 387.0 375.3
Sundry noncurrent assets 6.8 5.5 7.1
Deferred tax assets 23.9 20.8 16.3
Total current assets 600.3 608.0 484.7
Inventories 190.4 169.0 176.7
Trade receivables 245.4 250.9 232.5
Due from unconsolidated subsidiaries and investees 4.1 3.8 3.9
Sundry current assets 45.4 43.6 45.9
Short-term securities 1.1 0.7 2.3
Cash & cash equivalents 113.9 140.0 23.4
1,021.0 1,021.3 883.4

Consolidated balance sheet
21Interim report as of March 31, 2005
Equity & liabilities
€ million 03/31/2005 12/31/2004 03/31/2004
Group equity 333.3 331.1 306.9
Capital stock 37.4 37.4 37.4
Additional paid-in capital 38.0 37.8 37.8
Treasury stock 0.0 (1.1) (1.1)
Reserves retained from earnings 203.2 203.2 167.7
Undistributed group profit 57.3 0.1 55.5
Group earnings 3.5 57.2 8.5
Accumulated other comprehensive income (OCI) (12.0) (9.3) (4.8)
Minority interests 5.9 5.8 5.9
Noncurrent liabilities and accruals 315.7 309.9 211.1
Noncurrent financial debts 200.6 191.4 134.9
Other noncurrent liabilities 39.1 44.4 6.3
Pension accruals 20.4 20.2 18.7
Other noncurrent accruals 38.0 36.6 40.3
Deferred tax liabilities 17.6 17.3 10.9
Current liabilities and accruals 372.0 380.3 365.4
Current financial debts 116.5 120.4 54.3
Trade payables 90.1 101.3 154.3
Due to unconsolidated subsidiaries and investees 5.3 4.3 3.9
Sundry current liabilities 97.7 96.1 95.9
Current accruals 62.4 58.2 57.0
1,021.0 1,021.3 883.4

Statement of changes in equity
22
€ millionCapitalstock
Additionalpaid-in capital
Treasurystock
Reservesretained
from earnings
Undistrib-uted group
profitGroup
earningsAccumulated
OCIMinorityinterests Total
Balance at 12/31/2003 37.4 37.8 (1.1) 167.6 0.0 55.5 (5.2) 5.6 297.6
Stockholder-unrelatedchanges in equity
Carryover to new account 55.5 (55.5) 0.0
Changes through initial consolidation 0.1 0.1
Net income for Q1/2004 8.5 0.3
Accumulated OCI
currency translation differences 0.4 0.0
statement at fair value of financial instruments
Comprehensive income 8.5 0.4 8.9
Minority interests 0.3 0.3
Balance at 3/31/2004 37.4 37.8 (1.1) 167.7 55.5 8.5 (4.8) 5.9 306.9
Stockholder-unrelatedchanges in equity
Transfer to reserves retainedfrom earnings 36.4 (36.4) 0.0
All other changes (0.6) 0.0 (0.6)
Changes through initial consolidation (0.3) (0.2) (0.5)
Net income for Q2–Q4/2003 48.7 0.3
Accumulated OCI
currency translation differences 1.3 0.5
statement at fair value of financial instruments (5.8)
Comprehensive income 48.7 (4.5) 44.2
Minority interests 0.8 0.8
Stockholder-relatedchanges in equity
Dividend payment (19.0) (0.9) (19.9)
Capital increases from SOPs 0.0 0.0 0.0
Other capital increases 0.2 0.2
Balance at 12/31/2004 37.4 37.8 (1.1) 203.2 0.1 57.2 (9.3) 5.8 331.1
Stockholder-unrelatedchanges in equity
Carryover to new account 57.2 (57.2) 0.0
Sale of treasury stock 0.2 1.1 1.3
Net income for Q1/2005 3.5 0.1
Accumulated OCI
currency translation differences 0.2 0.0
statement at fair value of financial instruments (2.9)
Comprehensive income 3.5 (2.7) 0.8
Minority interests 0.1 0.1
Balance at 3/31/2005 37.4 38.0 0.0 203.2 57.3 3.5 (12.0) 5.9 333.3

Explanatory notes
23Interim report as of March 31, 2005
The consolidated interim financial statements as of March 31, 2005, were prepared in accordancewith the International Financial Reporting Standards (IFRS) applicable at the quarterly closingdate. These financial statements meet all requirements of German Accounting Standard (GAS)No. 6 issued by the German Accounting Standards Committee (GASC).
Since December 31, 2004, the consolidation group shrank by one subsidiary. Consequently, 43 subsidiaries were fully consolidated as of March 31, 2005. One investee is carried at equitywhile another 28 companies and joint ventures are included pro rata. Due to their minor significanceto the Group's net assets, financial position and results of operations, 24 subsidiaries were notincluded in the consolidated financial statements although Vossloh AG directly or indirectly heldthe majority of voting rights at March 31, 2005.
The consolidation, accounting and valuation principles conform with those used for the consoli-dated financial statements as of December 31, 2004.
Income taxes were for German companies calculated by applying a rate of 40 percent (unchangedfrom 2004) while for foreign subsidiaries, the applicable local tax rates were used.
The representation of Services, a business unit meantime disposed of and shown as discontinuedoperation, was changed in comparison to the financial statements 2004 as IFRS 5 had to be newlyapplied as from January 1, 2005. Accordingly, all income and expenses allocable to Services werereclassified into the income statement line Net loss of discontinued operations.
Preparing the quarterly financial statements requires management to make certain assumptionsand estimates. Actual values may differ from those estimates and hence from the amounts disclosed in the interim financial statements.
Analysis of EpS:
(1) Introduction
(2) Consolidation group
(3) Accounting principles
(4) Earnings per share
Q1/2005 Q1/2004
Weighted average number of sharesDilutive shares from stock options under the ESOP and LTIP
14,622,514
36,607
14,603,687
25,373
Fully diluted weighted average number of shares 14,659,121 14,629,060
Group earnings € mill. 3.5 8.5
Undiluted (basic) EpS € 0.24 0.58
Fully diluted EpS € 0.24 0.58

Explanatory notes
24
With economic effect as of January 1, 2005, Kiel-based EuroTrac GmbH Verkehrstechnik was soldand transferred to a nongroup investor. EuroTrac's activities had been subsumed within theMotive Power division in a separate business unit, Services.
In accordance with IFRS 5, all income and expenses allocable to Services are shown in a separateincome statement line, Net loss of discontinued operations, which breaks down as follows:
This statement shows the changes in the Vossloh Group's cash and cash equivalents, theseincluding checks, cash on hand, as well as cash in banks. Prepared in accordance with IAS 7, thecash flow statement breaks down the change in cash and cash equivalents into the cash flowsfrom operating, investing and financing activities. The cash flow from operating activities isdetermined according to the indirect method.
The cash flows disclosed in the cash flow statement include the following in connection withdiscontinued operations:
Breakdown of the net loss of discontinued operations
Q1/2005 Q1/2004
Income € mill. 0.0 1.0
Current expenses € mill. (0.9) (1.5)
Loss on disposal € mill. (0.1) 0.0
Pretax loss € mill. (1.0) (0.5)
Tax expense € mill. 0.4 0.2
Net loss € mill. (0.6) (0.3)
(6) Cash flow statement
Q1/2005 Q1/2004
Cash outflow from operating activities € mill. (3.2) (0.1)
Cash outflow from investing activities € mill. (2.2) 0.0
Cash outflow from financing activities € mill. 0.0 0.0
Total cash outflow € mill. (5.4) (0.1)
(5) Discontinued operations

Explanatory notes
25Interim report as of March 31, 2005
(7) Segment information
(8) Contingent liabilities
For reporting purposes, the Vossloh Group's primary segments are defined by its identifiable threeoperating divisions, plus the holding company.
Rail Infrastructure covers the Group's rail infrastructure products and services and comprises theSwitch Systems, Fastening Systems and Infrastructure Services business units.
Motive Power is a division that encompasses the Locomotives (manufacture of diesel locomotives)and Electrical Systems (electric equipment for trams, streetcars and trolleybuses) business units.
Information Technologies subsumes the development and marketing of operations management,passenger information and planning systems as well as signals engineering.
The accounting methods of all segments are identical. Financial segment information is presentedbefore consolidation.
In comparison to December 31, 2004, the Group's contingent liabilities—chiefly under guar-anties/suretyships and from the collateralization of third-party debts—shrank by €0.7 million to€4.4 million.

Explanatory notes
26
1 Excl. write-down of financial assets 2 Before P&L transfer3 The prior-year comparatives have been adjusted for the Services business unit's contributions.
Segment information
RailInfrastructure
Motive Power
InformationTechnologies
Intermediateholding
company/consolidation
Rail Technology
H.O./consolidation Group
Net sales
Q1/2005 € mill. 126.6 52.2 6.7 (0.1) 185.4 0.0 185.4
Q1/20043 € mill. 112.7 71.8 12.6 0.0 197.1 0.1 197.2
Amortization/depreciation/write-down1
Q1/2005 € mill. 3.2 1.4 0.3 0.0 4.9 0.1 5.0
Q1/20043 € mill. 3.0 2.0 0.3 0.1 5.4 0.3 5.7
Net interest result
Q1/2005 € mill. (1.8) (1.4) (0.2) (2.6) (6.0) 1.3 (4.7)
Q1/20043 € mill. (1.9) (1.2) (0.1) (2.9) (6.1) 3.1 (3.0)
EBIT
Q1/2005 € mill. 17.9 (3.8) (0.7) (0.4) 13.0 (1.9) 11.1
Q1/20043 € mill. 17.2 2.9 0.1 (0.6) 19.6 (2.9) 16.7
EBT
Q1/2005 € mill. 16.1 (5.2) (0.9) (3.0) 7.0 (0.6) 6.4
Q1/20043 € mill. 15.3 1.7 0.0 (3.5) 13.5 0.2 13.7
Net earnings/(deficit)2
Q1/2005 € mill. 9.9 (3.1) (0.4) (2.5) 3.9 (0.4) 3.5
Q1/2004 € mill. 9.2 1.1 0.0 (1.9) 8.4 0.1 8.5
Capital expenditures (tangibles)
Q1/2005 € mill. 3.4 2.3 0.3 0.0 6.0 0.2 6.2
Q1/2004 € mill. 3.0 2.5 0.3 0.0 5.8 0.0 5.8
Capital employed
3/31/2005 € mill. 470.6 189.3 29.8 252.9 942.6 (231.9) 710.7
12/31/2004 € mill. 459.5 185.6 32.5 244.4 922.0 (231.8) 690.2
Total assets
3/31/2005 € mill. 591.3 333.7 38.7 254.3 1,218.0 (197.0) 1,021.0
12/31/2004 € mill. 601.0 270.8 39.0 252.5 1,163.3 (142.0) 1,021.3
Quarterly average headcount
Q1/2005 3.006 1.112 287 0 4.405 30 4.435
Q1/20043 2.829 1.154 270 0 4.253 32 4.285

27Interim report as of March 31, 2005

1
Vossloh AG's boards
Executive Board Burkhard Schuchmann, ChairmanMilagros Caiña-LindemannWerner Andree
Supervisory Board Dipl.-Vwt. Dr. rer. pol. Karl Josef Neukirchen, former CEO ofmg technologies ag, Bad Homburg,Chairman
Dipl.-Kfm. Dr. Jürgen Blume,sworn public auditor and tax accoun-tant,Bad Bentheim, Vice-Chairman
Wolfgang Klein, galvanizer, Werdohl
Wilfried Köpke, engineering designer,Kiel
Peter Langenbach, lawyer, Wuppertal
Dr. Anselm Raddatz, lawyer,Düsseldorf
Financial diary 2005
Annual stockholders' meeting May 25, 2005
Dividend payment May 26, 2005
Publication of interim reports
as of June 30 July 26, 2005
as of September 30 October 25, 2005
Press conference December 9, 2005
Meeting with DVFA analysts December 9, 2005
Financial diary 2006
Publication of financial information 2005 March 2006
Press conference March 2006
Meeting with DVFA analysts March 2006
Annual stockholders' meeting May 24, 2006
Investor Relations
Contact Christiane Konrad
Email [email protected]
Phone (+49-2392) 52-249
Fax (+49-2392) 52-264
Vossloh stock details
ISIN DE0007667107
Traded at: Xetra, Düsseldorf, Frankfurt, Berlin,
Bremen, Hamburg, Hannover
Stuttgart, Munich
Index: MDAX
No. of shares (3/31/2005): 14,640,223
Stock price (3/31/2005): €39.34
Q1/2005 high/low: €41.87/€36.40
Reuters code: VOSG.F
Bloomberg code: VOS GR
www.vossloh.com Vossloh AGVosslohstrasse 4 · 58791 Werdohl · GermanyP.O. Box 18 60 · 58778 Werdohl · Germany
Phone (+49-2392)52-0Fax (+49-2392)52-219